multivariate optimization of volatile compounds extraction...
TRANSCRIPT

American Journal of Analytical Chemistry, 2016, 7, 712-723 http://www.scirp.org/journal/ajac
ISSN Online: 2156-8278 ISSN Print: 2156-8251
DOI: 10.4236/ajac.2016.710064 October 25, 2016
Multivariate Optimization of Volatile Compounds Extraction in Chardonnay Wine by Headspace-Solid Phase Micro Extraction and Gas Chromatography Coupled with Tandem Mass Spectrometry
Sabrina de Bona Sartor1,2*, Marla Sganzerla1, José Teixeira Filho3, Helena Teixeira Godoy1*
1Food Analysis Laboratory, Department of Food Science, Faculty of Food Engineering, University of Campinas (UNICAMP), Campinas, Brazil 2Facvest University (UNIFACVEST), Lages, Brazil 3Hydrology Laboratory, Faculty of Agricultural Engeneering, University of Campinas (UNICAMP), Campinas, Brazil
Abstract A method for optimization of extraction of volatile compounds in Chardonnay wine was developed using headspace-solid phase microextraction (HS-SPME) and gas chromatography coupled with triple quadrupole tandem mass spectrometry (GC- MS/MS). Optimization of the HS-SPME conditions, temperature (T, ˚C) and extra- ction time (t, minutes), was carried out using a 22 factorial central composite rota- tional design (CCRD). Total area of chromatographic peaks of nineteen compounds was monitored in order to identify the best response and the data was collected on multiple reaction monitoring (MRM) mode. The mathematical model that describes the response surface for the CCRD was validated using the analysis of variance (ANO VA) with 95% of confidence level. This model showed a lack of fit based on mean square pure error ratios for each response, in which Fcalculated was 2.23 higher than Ftabulated. Even though the models cannot be rigorously used to make quantitative pre-dictions, the coefficients of the model, especially the linear ones, are useful for un-derstanding systematic behaviour of the response values as a function of the factor levels. Multivariate statistical design can be used in optimization of HS-SPME extrac-tion parameters with reduced number of experiments and can be useful in sampling method of volatile compounds of Chardonnay wines analysis by CG-MS/MS. The optimal condition achieved in this method was 30˚C and 45 minutes of extraction.
How to cite this paper: de Bona Sartor, S., Sganzerla, M., Filho, J.T. and Godoy, H.T. (2016) Multivariate Optimization of Vola-tile Compounds Extraction in Chardonnay Wine by Headspace-Solid Phase Micro Ex- traction and Gas Chromatography Coupled with Tandem Mass Spectrometry. Ameri- can Journal of Analytical Chemistry, 7, 712- 723. http://dx.doi.org/10.4236/ajac.2016.710064 Received: August 3, 2016 Accepted: October 21, 2016 Published: October 25, 2016 Copyright © 2016 by authors and Scientific Research Publishing Inc. This work is licensed under the Creative Commons Attribution International License (CC BY 4.0). http://creativecommons.org/licenses/by/4.0/
Open Access
S. de Bona Sartor et al.
713
Keywords Chardonnay, GC-MS/MS, HS-SPME, Multivariate Optimization, Volatile Compounds
1. Introduction
Volatile compounds directly contribute to wine aroma which is a fundamental charact- eristic of identity, quality and acceptance by the consumer market. These compounds form a matrix capable of stimulating a response by the sensory human olfactory system [1]. Several hundred volatiles compounds have been previously identified in wine, be-longing to different chemical classes such esters, alcohols, ketones, aldehydes, fatty ac-ids, terpenes, C13-norisoprenoids, methoxipyrazines and sulphur compounds [2]. Al-though several compounds have been reported to contribute to the aroma of wines, only 10% of them are considered to be important contributors to the final aroma. The composition and intensity of these compounds depend on several factors, such as the grape cultivar used, grape ripeness degree, climate conditions, soil, microorganisms used in fermentation process, winemaking techniques and aging [3]-[6].
Due to the complex chemical composition of wines, matrix where the aroma comp- ounds are present, a efficient method of extraction is needed to isolate the target ana-lytes as well as serving as a tool for pre-concentration increasing sensitivity of the ana-lytical system used. Several extraction methods for the analysis of volatile compounds in wines, techniques of distillation, solvent extraction and solid phase extraction (SPE) have been reported in the literature [7]. Currently, the most used extraction method for the analysis of volatile compounds in grapes and wines is the solid phase microextr- action (SPME) [8] [9].
Introduced by Arthur and Pawliszyn in early 1990’s [10], SPME is a sorptive sample preparation technique which involves exposure of extraction phase, dispersed on a solid support, under controlled conditions, in direct contact with the sample (IS-SPME) or with the headspace (HS-SPME). The process includes two basic steps: the first, initiating with a partition of the analytes between the sample and the fiber coating material and the second, desorption of analytes concentrated on fiber to an analytical instrument [11]. The main advantages of this technique are short preparation time, small volume of sample required, possibility of concentration of analytes in liquid, gaseous and solid samples, reduced manipulation by analyst and specially is a solvent free techinique [11] [12]. SPME has been used routinely coupled with gas chroma- tography (GC) and gas chromatography-mass spectrometry (GC-MS) being success- fully applied to extract a wide variety of compounds, specially for the extraction of volatile and semi-volatile organic compounds in complex matrices [11] [13].
Considering that SPME technique is an equilibrium technique with the maximum sensitivity obtained in an equilibrium point instead of an exhaustive one, during devel-

S. de Bona Sartor et al.
714
opment of a SPME method some parameters must be optimized. Usually, the param- eters monitored are the type of fiber coating, sampling mode (direct immersion or headspace), agitation, time, temperature, ionic strength, pH, volume of sample, type of vial used, volume of headspace, conditions of desorption [4] [9] [11] [13] [14]. In these cases, where many factors can influence the response of the method, the optimization of extraction procedures can be conducted using multivariate statistical analysis allowing simultaneous variation of all factors studied, being useful for locating the interactions between them and the changes do not detectable in traditional univariate analysis. These tools can provide reliable information about the best analysis conditions and existence of experimental errors. One of the most used tools in multivariate statistical analysis is central composite design (CCD) and response surface methodo- logy (RSM) [15] [16].
Traditionally, gas chromatography coupled to mass spectrometry (GC-MS) is the most used technique for the analysis of volatile compounds in wine [7]. In gas chrom- atography coupled to tandem mass spectrometry (GC-MS/MS) molecules of interest are fragmented twice, isolated as a fragment and generates a specific spectrum obtained from the selected ions.The use of GC-MS/MS provides a high degree of certainty in the identification of the analyte due to its greater selectivity and sensitivity as compared to the GC-MS. As a result, this technique has been widely used in the detection of compo- unds presents in low concentrations in complex matrices such as pesticide residues in different food [17], anabolic drugs in human urine [18], volatile organic compounds in water [19] and multi-mycotoxin method for food products [20].
The aim of this work is to optimize a extraction method of volatile compounds in Chardonnay wine using solid phase micro extraction in headspace mode (HS-SPME) and analysis by gas chromatography coupled to tandem mass spectrometry (GC-MS/ MS). Temperature and extraction time were optimized using multivariate statistical analysis with a 22 factorial central compound rotational design (CCRD) and response surface methodology for determining the optimum condition of extraction.
2. Material and Methods 2.1. Reagents and Standards
Analytical standards used were 1-hexanol, 3-methyl-1-butanol, 2-phenylethanol, isoamyl acetate, hexyl acetate, ethyl lactate, diethyl succinate, ethyl butanoate, ethyl hexanoate, ethyl octanoate, ethyl decanoate, hexanoic acid, octanoic acid, decanoic acid, nerol, linalool, α-terpineol, α-ionone and β-ionone, purchased from Sigma- Aldrich (Saint Louis, MO, USA), with purity ≥ 99%. A synthetic model wine was prepared with water previously purified in a Milli-Q® system (Millipore, Bedford, MA, USA), 12% (v/v) of ethanol HPLC grade (JT Baker, Xalostoc, México) and 2 g∙L−1 of tartaric acid (Merck, Darmstadt, Germany). The pH was adjusted to 3.2 using sodium hydroxide (NaOH) 1M. Sodium chloride (NaCl) was purchased from Vetec (Rio de Janeiro, Brasil).
S. de Bona Sartor et al.
715
2.2. Sample Preparation and SPME Procedures
Samples of Chardonnay wine were obtained in local market in Campinas, São Paulo, Brazil, and four bottles of a same production lot were used in experiments. Wines were produced in Andradas, Minas Gerais, Brasil (22˚04'04''S 46˚34'08''W) in 2011 vintage. For analysis, 10 mL aliquots of wine were pipetted into a 40 mL SPME vial, 3.0 g of so-dium chloride was added and complete with screw-top caps and PTFE/silicon septa (Supelco Inc., Bellefonte, PA, EUA). During the sampling time, sample was constantly stirred with a small magnetic stirring bar. SPME fiber (Supelco Inc., Bellefonte, PA, EUA) used in this study was 50/30 µm with divinylbenzene/carboxen/ polydimethylsi- loxane (DVB/CAR/PDMS) coating conditioned before use according to the manufac- turer’s instructions. DVB/CAR/PDMS fibers were chosen according to the range of po-larity and different functionalities of the mixture of molecules analyzed in this study: alcohols, esters, fatty acids, C13-norisoprenoids and monoterpenes. Fiber was exposed to the sample headspace after equilibrium time of 10 minutes. The factors optimized were time of fiber exposure and temperature of sample, due to their influence in equili-brium system. After extraction, fiber was introduced into gas chromatography injector for desorption of the analytes at a temperature of 270˚C, in splitless mode for 15 mi-nutes.
2.3. Gas Chromatography Coupled to Tandem Mass Spectrometry (GC-MS/MS)
The GC-MS analysis were performed on a Agilent 7890A gas chromatograph (Agilent Technologies, Palo Alto, CA, EUA) equipped with a Agilent 7000 Triple Quad mass detector (Agilent Technologies, Palo Alto, CA). Liner used was specific for SPME anal-ysis purchase from Sigma Aldrich (Saint Louis, MO, USA), with 0.75 mm of internal diameter. Chromatographic separation was achieved using a capillary column Supel-cowax® 10 (100% polyethyleneglycol) (Supelco Inc., Bellefonte, PA, EUA.) with follow-ing dimensions: 30 m × 0.25 mm × 0.25 µm. Carrier gas was high purity Helium at a constant flow of 1.0 mL∙min−1 in splitless injection mode. The injector temperature was 270˚C and oven temperature program initialize with 30˚C, was held for 2 minutes and then increasing 4˚C min−1 to 130˚C (2 minutes) followed to increase 8˚C min−1 to 250˚C (5 minutes) [21]. Solvent delay used was 2.5 minutes.
Mass spectras were obtained by using electron impact (EI) as ionization mode and −70 eV as electron energy. Temperatures of interface, source and quadrupoles (Q1, Q2 and Q3) were 250˚C, 260˚C and 150˚C, respectively. Nitrogenium and Helium were used in collision cell (Q2) at 2.25 mL∙min−1 and 1.5 mL∙min−1 flows, respectively. Ac-quisition was performed in multiple reaction monitoring (MRM) mode. Precursor ions were used as qualifiers and product ions were as identifiers (Table 1). Mass range ana-lyzed was from 30 to 400 m/z and 50 milliseconds of acquisition time. Resolution of MS1 and MS2 was set in wide mode. Collision energy (CID) was chosen to different analytes and are showed in Table 1. Dwell time was set in 1 milliseconds for all ana-lytes.

S. de Bona Sartor et al.
716
Table 1. GC-MS/MS parameters of compounds analyzed in HS-SPME optimization strategy.
Compound Precursor ion selected (m/z) Product ion selected (m/z) Energy Colision (V) Retention time (min)
Alcohols
1-hexanol 69 43 40 21.76
3-methyl-1-butanol 77 55 20 29.39
2-phenyl ethanol 91 65 40 34.61
Esters
Hexyl acetate 84 56 25 27.78
Isoamyl acetate 87 70 25 37.16
Ethyl lactate 75 45 25 16.03
Diethyl succinate 129 101 25 29.02
Ethyl butanoate 101 29 25 21.65
Ethyl hexanoate 115 27 25 21.71
Ethyl octanoate 143 73 35 27.78
Ethyl decanoate 155 101 35 30.93
Fatty acids
Decanoic acid 129 57 30 21.66
Hexanoic acid 99 55 30 14.68
Octanoic acid 115 85 30 37.14
C13-norisoprenoids
α-ionone 136 109 40 35.40
β-ionone 177 135 40 24.29
Monoterpenes
Linalool 121 80 35 28.78
α-terpineol 136 59 35 19.89
Nerol 139 84 35 27.14
Data were acquired and processes using Agilent Mass Hunter software (version
B.05.00, Agilent Technologies). The compounds identification was achieved by com- paring the retention time and mass spectra obtained from sample with standards com-pounds presented in a model synthetic wine injected at same conditions. Qualifier and identifier ions were considered positive when they showed similarity of at least 75% with the standards prepared and analyzed as well as comparing the MS fragmentation with the mass spectras present in the National Institute of Standards Mass Spectral Li-brary (NIST 2011).
2.4. Optimization Strategy
Optimization of the HS-SPME conditions was carried out using a 22 factorial central composite rotational design (CCRD) with four axial points (α = 1.4142) and tree central points [22]. Variables chosen were the temperature (T, ˚C) and extraction time (t, mi-

S. de Bona Sartor et al.
717
nutes) and other parameters (amount of NaCl, equilibrium time, velocity of stirring, sample volume) were arbitrarily established by the authors. The levels of each variable can be seen in Table 2. The values of the factors are adjusted to better control of expe-riments. Twelve experiments were carried out at random. The software Statistica® v.7 (Statsoft Inc., Tulsa, OK, EUA) was used for statistical analysis.
3. Results and Discussion 3.1. SPME Conditions for Extracting Volatile Compounds
Volatiles compounds monitored in this study were chosen because they represent the major chemical classes of aroma compounds in wines: alcohols, esters, fatty acids, mo-noterpenes and C13-norisoprenoids [24]. The fiber used, DVB/CAR/PDMS, was per-formed in accordance with the interest of this work: cover a wide range of polarity, vo-latility and functionality represented by selected volatile compounds. Several authors have reported that DVB/CAR/PDMS fiber as the most selective and efficient for the detection of volatile compounds in wines [16] [23] [24]. The amount of salt added is intended to increase the ionic strength and promote “salting out” of the volatile compounds from their matrix by increasing the partition coefficient and also, concen- tration of the analyte in the headspace before extraction [14] [24]. Theoretically, any inorganic salt may be used but most commonly used salts are sodium sulphate (Na2SO4) and sodium chloride (NaCl) due to their high solubility in aqueous medium (wine) [24]. The concentration used is, usually, 30% of the sample volume [16] [25]. Sample volume used must be established according to the experimental procedures considering the volume of the vial used, headspace volume, size and depth of fiber ex-posure to the sample headspace. Table 2. Experimental conditions and values of response (total area) obtained for the CCRD for the HS-SPME optimization.
Experiment Factors†
Response‡ T (˚C) Extraction temperature t (min) Extraction time
1 −1 33 -1 35 2.50E+07
2 1 48 -1 35 2.44E+07
3 −1 34 1 55 2.49E+07
4 1 48 1 55 2.43E+07
5 −1.41 30 0 45 2.54E+07
6 1.41 50 0 45 2.43E+07
7 0 40 1.41 59 2.50E+07
8 0 40 −1.41 30 2.49E+07
9§ 0 40 0 45 2.48E+07
10§ 0 40 0 45 2.49E+07
11§ 0 40 0 45 2.49E+07
12§ 0 40 0 45 2.49E+07
†: with α = 1.4142; ‡: expressed in arbitrary units; §: central point repetition.

S. de Bona Sartor et al.
718
3.2. Optimization of Extraction of Volatile Compounds
Figure 1 shows a Pareto diagram where the data obtained in experiments can be ob-served. Based on the analysis of the effects of the factors involved in the design, with 95% confidence level, it can be see that only the temperature factor (T, ˚C) was signifi-cant in the models evaluated.
Table 2 shows results obtained in the experiments conducted by DCCR where the response, total area of the chromatographic peaks of the nineteen compounds selected and monitored, is expressed in arbitrary units. Moreover, the table also presents the le-vels of the factors time (t, min) and temperature (T, ˚C) used in the execution of the experiments. Experiment number 5, with extraction temperature at 30˚C and 45 mi-nutes of extraction time (fiber exposure) showed greater chromatographic response with area values on 2.54E+07.
Analysis of variance (ANOVA) with 95% of confidence was used to determine which factors significantly affect the response of the HS-SPME procedure and validate the mathematical model that describes the response surface of DCCR. Table 3 shows the values obtained by ANOVA. Based on the regression results which shows the existence, or not, of lack of fit of the mathematical model predictions can be based on this model [15] [22].
The statistical significance of regression given by the quadratic means of the residues (MQR/MQr) or Fcalculated was 395.97. When comparing, at the level of 95%, the values of Fcalculated and Ftabulated (5%, 6%, 95%) which value is 4.39 can be observed that Fcalculated > Ftabulated about 90.2 times, indicating that the correlation between variables can be considered adequate to this model.
Figure 1. Pareto Chart of standardized effects of 22 factorial central composite rotational design (CCRD) for total chromatographic peak area of volatile compounds analyzed by HS-SPME and GC-MS/MS.

S. de Bona Sartor et al.
719
Table 3. Analysis of variance by the minimum squares method for temperature and time of extraction (factors) of volatile compounds in chardonnay wine by HS-SPME.
Sourcesofvariation Sum ofsquares (SS) Degreesoffreedom (df) Mean of the squares (MS) Fcal† Ftab
‡ Fcal/Ftab
Regression 8.27E+11 5 1.65E+11 395.97 4.39 90.2
Residues 1.63E+11 6 2.71E+10
Lack of fit 1.55E+11 3 5.17E+10 20.68 9.28 2.23
Pure error 7.50E+09 3 2.50E+09
Total 1.14E+12 11
R2 0.720
†: Fcalculated; ‡: Ftabulated..
Based on the obtained quadratic model was generated response surface to the expe-
riment (Figure 2). Quadratic model generated the equation R = 2.49E + 07 − 3.45E + 05 × T − 7.59E + 04 × T2 − 7.40E + 03 × t − 2.56E + 04 × t2, where T is the variable 1 (extraction temperature, ˚C), t were variable 2 (extraction time, min) and R is the re-sponse (total area of the chromatographic peaks).
3.3. Validating the Model Generated for Extraction Conditions
The process of extraction by HS-SPME involves the partition of the analytes in matrix, in headspace and fiber coating. In the equilibrium, amount of extracted sample is pro-portional to the partition coefficient and concentration of the analytes in the headspace. Extraction can be considered optimal when the concentration of the analytes reaches equilibrium distribution between the extraction phase (fiber coating) and headspace [8] [9] [12] [26].
In HS-SPME method for extraction of volatile compounds, temperature has great in-fluence on efficiency of the process. The kinetics of the extraction process is directly af-fected by temperature, as it acts in determining the vapor pressure of the analytes in the matrix [27]. Furthermore, temperature affects directly the partition coefficient of the analyte. The temperature increase, due to thermodynamic conditions, reduces the par-tition coefficient and hence decreases the amount of analyte extracted [25] [26] [27]. For analysis of volatile compounds in wine, using HS-SPME, temperatures have been reported in literature between 35˚C and 55˚C. However, these values can be vary de-pending on the type of wine analyzed, the matrix constituents and concentrations of the analyzed compounds [14] [16] [25].
Extraction time, or fiber exposure to the sample headspace, influences the equilibr- ium between the phases involved and thus the extraction efficiency. Compounds with a lower partition coefficient, the time required to reach equilibrium must be increased. Compounds with higher partition coefficient require less time to reach equilibrium [12] [25] [28].
The exposure of the fiber for shorter periods of time, or before reach the equilibrium, can make the concentration of the extracted compounds become underestimated. In
S. de Bona Sartor et al.
720
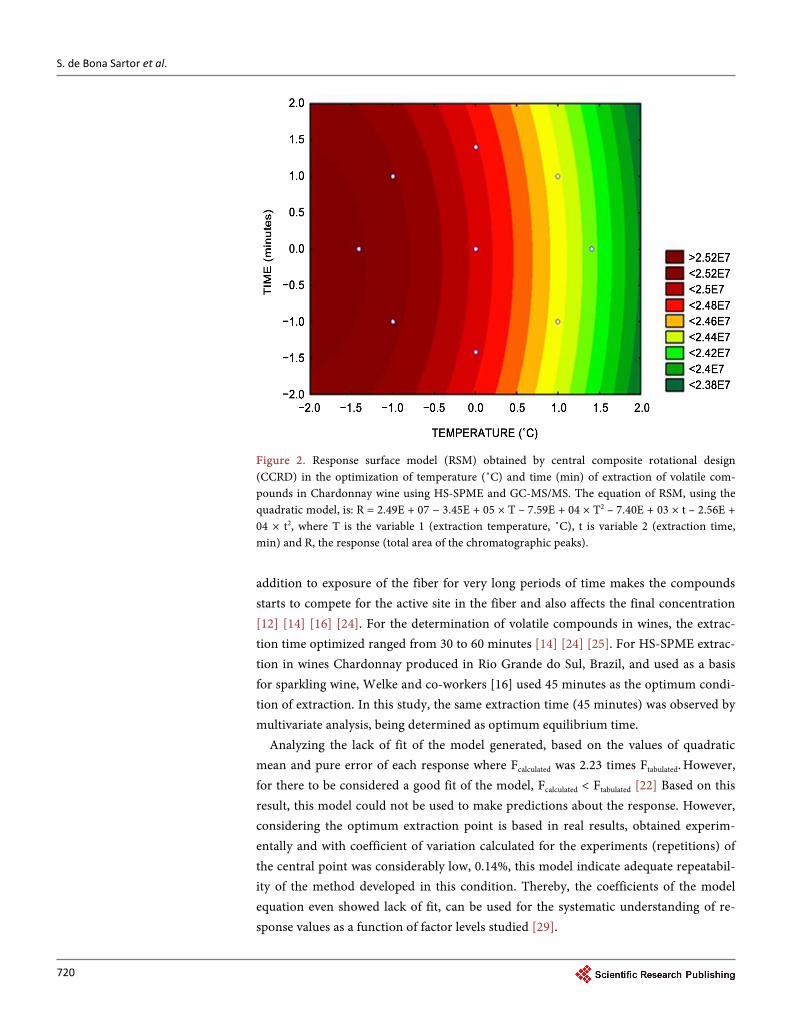
Figure 2. Response surface model (RSM) obtained by central composite rotational design (CCRD) in the optimization of temperature (˚C) and time (min) of extraction of volatile com-pounds in Chardonnay wine using HS-SPME and GC-MS/MS. The equation of RSM, using the quadratic model, is: R = 2.49E + 07 − 3.45E + 05 × T – 7.59E + 04 × T2 – 7.40E + 03 × t – 2.56E + 04 × t2, where T is the variable 1 (extraction temperature, ˚C), t is variable 2 (extraction time, min) and R, the response (total area of the chromatographic peaks).
addition to exposure of the fiber for very long periods of time makes the compounds starts to compete for the active site in the fiber and also affects the final concentration [12] [14] [16] [24]. For the determination of volatile compounds in wines, the extrac-tion time optimized ranged from 30 to 60 minutes [14] [24] [25]. For HS-SPME extrac-tion in wines Chardonnay produced in Rio Grande do Sul, Brazil, and used as a basis for sparkling wine, Welke and co-workers [16] used 45 minutes as the optimum condi-tion of extraction. In this study, the same extraction time (45 minutes) was observed by multivariate analysis, being determined as optimum equilibrium time.
Analyzing the lack of fit of the model generated, based on the values of quadratic mean and pure error of each response where Fcalculated was 2.23 times Ftabulated. However, for there to be considered a good fit of the model, Fcalculated < Ftabulated [22] Based on this result, this model could not be used to make predictions about the response. However, considering the optimum extraction point is based in real results, obtained experim- entally and with coefficient of variation calculated for the experiments (repetitions) of the central point was considerably low, 0.14%, this model indicate adequate repeatabil-ity of the method developed in this condition. Thereby, the coefficients of the model equation even showed lack of fit, can be used for the systematic understanding of re-sponse values as a function of factor levels studied [29].

S. de Bona Sartor et al.
721
3.4. Gas Chromatography Coupled to Tandem Mass Spectrometry (GC-MS/MS)
After the HS-SPME extraction process, volatile compound were separated and ident- ified using gas chromatography coupled to tandem mass spectrometry (GC-MS/MS). Confirmation of identity of each analyte was performed comparing the spectra obtai- ned by the injection of analytical standards and between the analytes present in the sample. Use of GC-MS/MS provides a high degree of selectivity, sensitivity and security in identification of compounds [30].
4. Conclusion
HS-SPME as extraction method of volatile compounds in wines have been widely used, nevertheless during development of the SPME method, parameters which affects the response must be optimized. In this study, multivariate statistical design was used in optimization of HS-SPME extraction parameters (time and temperature of extraction) with reduced number of experiments. Furthermore, the statistical design provide re-sults to achieve an optimum extraction point of volatile compounds in Chardonnay wine, with temperature in 30˚C and time of 45 minutes. The combined use of tech-niques of HS-SPME and GC-MS/MS was suitable for the analysis of volatile com-pounds in Chardonnay wine.
Acknowledgements
Authors would like to acknowledge the financial support of Fundação de Amparo à Pesquisa do Estado de São Paulo (FAPESP) (grant number: 2011/17094-2), Conselho Nacional de Desenvolvimento Científico e Tecnológico (CNPq) and Dr. Rodrigo Ra-mos Catharino (School of Medical Sciences, University of Campinas/UNICAMP) for providing the equipment to carry out chromatographic analysis.
References [1] Smyth, H. and Cozzolino, D. (2012) Instrumental Methods (Spectroscopy, Electronic Nose,
and Tongue) as Tools to Predict Taste and Aroma in Beverages: Advantages and Limita- tions. Chemical Reviews, 113, 1429-1440. http://dx.doi.org/10.1021/cr300076c
[2] Ebeler, S.E. and Thorngate, J.H. (2009) Wine Chemistry and Flavor: Looking into the Crys-tal Glass. Journal of Agricultural and Food Chemistry, 57, 8098-8108. http://dx.doi.org/10.1021/jf9000555
[3] Jiang, B., Xi, Z., Luo, M. and Zhang, Z. (2013) Comparison on Aroma Compounds in Ca-bernet Sauvignon and Merlot Wines from Four Wine Grape-Growing Regions in China. Food Research International, 51, 482-489. http://dx.doi.org/10.1016/j.foodres.2013.01.001
[4] Medina, K., Boido, E., Fariña, L., Gioia, O., Gomez, M.E., et al. (2013) Increased Flavour Diversity of Chardonnay Wines by Spontaneous Fermentation and Co-Fermentation with Hanseniaspora vineae. Food Chemistry, 141, 2513-2521. http://dx.doi.org/10.1016/j.foodchem.2013.04.056
[5] Añón, A., López, J.F., Hernando, D., Orriols, I., Revilla, E., et al. (2014) Effect of Five Eno-logical Practices and of the General Phenolic Composition on Fermentation-Related Aroma
S. de Bona Sartor et al.
722
Compounds in Mencia Young Red Wines. Food Chemistry, 148, 268-275. http://www.sciencedirect.com/science/article/pii/S0308814613014921
[6] Liberatore, M.T., Pati, S., Nobile, M.A.D. and Notte, E.L. (2010) Aroma Quality Impro- vement of Chardonnay White Wine by Fermentation and Ageing in Barrique on Lees. Food Research International, 43, 996-1002. http://dx.doi.org/10.1016/j.foodres.2010.01.007
[7] Polaskova, P., Herszage, J. and Ebeler, S.E. (2008) Wine Flavor: Chemistry in a Glass. Chemical Society Reviews, 37, 2478-2489. http://dx.doi.org/10.1039/b714455p
[8] San-Juan, F., Pet’ka, J., Cacho, J., Ferreira, V. and Escudero, A. (2010) Producing Head- space Extracts for the Gas Chromatography-Olfactometric Evaluation of Wine Aroma. Food Chemistry, 123, 188-195. http://dx.doi.org/10.1016/j.foodchem.2010.03.129
[9] Zhang, M., Pan, Q., Yan, G. and Duan, C. (2011) Using Headspace Solid Phase Micro- Extraction for Analysis of Aromatic Compounds during Alcoholic Fermentation of Red wine. Food Chemistry, 125, 743-749. http://dx.doi.org/10.1016/j.foodchem.2010.09.008
[10] Arthur, C.L. and Pawliszyn, J. (1990) Solid Phase Microextraction with Thermal Desorption Using Fused Silica Optical Fibers. Analytical Chemistry, 62, 2145-2148. http://dx.doi.org/10.1021/ac00218a019
[11] Risticevic, S., Niri, V., Vuckovic, D. and Pawliszyn, J. (2009) Recent Developments in Sol-id-Phase Microextraction. Analytical and Bioanalytical Chemistry, 393, 781-795. http://dx.doi.org/10.1007/s00216-008-2375-3
[12] Zhang, Z., Yang, M.J. and Pawliszyn, J. (1994) Solid-Phase Microextraction. A Solvent-Free Alternative for Sample Preparation. Analytical Chemistry, 66, 844A-853A. http://dx.doi.org/10.1021/ac00089a001
[13] Hayasaka, Y., Baldock, G.A. and Pollnitz, A.P. (2005) Contributions of Mass Spectrometry in the Australian Wine Research Institute to Advances in Knowledge of Grape and Wine Constituents. Australian Journal of Grape and Wine Research, 11, 188-204. http://dx.doi.org/10.1111/j.1755-0238.2005.tb00287.x
[14] Whiton, R.S. and Zoecklein, B.W. (2000) Optimization of Headspace Solid-Phase Microex-traction for Analysis of Wine Aroma Compounds. American Journal of Enology and Viti-culture, 51, 379-382.
[15] Bogusz Junior, S., de Marchi Tavares de Melo, A., Zini, C.A. and Godoy, H.T. (2011) Opti-mization of the Extraction Conditions of the Volatile Compounds from Chili Peppers by Headspace Solid Phase Micro-Extraction. Journal of Chromatography A, 1218, 3345-3350. http://dx.doi.org/10.1016/j.chroma.2010.12.060
[16] Welke, J.E., Zanus, M., Lazarotto, M., Schmitt, K.G. and Zini, C.A. (2012) Volatile Charac-terization by Multivariate Optimization of Headspace-Solid Phase Microextraction and Sensorial Evaluation of Chardonnay Base Wines. Journal of the Brazilian Chemical Society, 23, 678-687. http://dx.doi.org/10.1590/S0103-50532012000400013
[17] Sapozhnikova, Y. and Lehotay, S.J. (2013) Multi-Class, Multi-Residue Analysis of Pesti-cides, Polychlorinated Biphenyls, Polycyclic Aromatic Hydrocarbons, Polybrominated Di-phenyl Ethers and Novel Flame Retardants in Fish Using Fast, Low-Pressure Gas Chroma-tography-Tandem Mass Spectrometry. Analytica Chimica Acta, 758, 80-92. http://dx.doi.org/10.1016/j.aca.2012.10.034
[18] Delgadillo, M.A., Garrostas, L., Pozo, Ó.J., Ventura, R., Velasco, B., et al. (2012) Sensitive and Robust Method for Anabolic Agents in Human Urine by Gas Chromatography-Triple Quadrupole Mass Spectrometry. Journal of Chromatography B, 897, 85-89. http://dx.doi.org/10.1016/j.jchromb.2012.03.037
[19] Cervera, M.I., Beltran, J., Lopez, F.J. and Hernandez, F. (2011) Determination of Volatile

S. de Bona Sartor et al.
723
Organic Compounds in Water by Headspace Solid-Phase Microextraction Gas Chromato-graphy Coupled to Tandem Mass Spectrometry with Triple Quadrupole Analyzer. Analyti-ca Chimica Acta, 704, 87-97. http://dx.doi.org/10.1016/j.aca.2011.08.012
[20] Rodríguez-Carrasco, Y., Moltó, J.C., Berrada, H. and Mañes, J. (2014) A Survey of Tri-chothecenes, Zearalenone and Patulin in Milled Grain-Based Products Using GC-MS/MS. Food Chemistry, 146, 212-219. http://dx.doi.org/10.1016/j.foodchem.2013.09.053
[21] Weldegergis, B.T., de Villiers, A. and Crouch, A.M. (2011) Chemometric Investigation of the Volatile Content of Young South African Wines. Food Chemistry, 128, 1100-1109. http://dx.doi.org/10.1016/j.foodchem.2010.09.100
[22] Ferreira, S.L.C., Bruns, R.E., da Silva, E.G.P., dos Santos, W.N.L., Quintella, C.M., et al. (2007) Statistical Designs and Response Surface Techniques for the Optimization of Chro-matographic Systems. Journal of Chromatography A, 1158, 2-14. http://dx.doi.org/10.1016/j.chroma.2007.03.051
[23] Castro Mejı́as, R., Natera Marı́n, R., de Valme Garcı ́a Moreno, M. and Garcı ́a Barroso, C. (2003) Optimisation of Headspace Solid-Phase Microextraction for the Analysis of Volatile Phenols in Wine. Journal of Chromatography A, 995, 11-20. http://dx.doi.org/10.1016/S0021-9673(03)00541-7
[24] Howard, K.L., Mike, J.H. and Riesen, R. (2005) Validation of a Solid-Phase Microextraction Method for Headspace Analysis of Wine Aroma Components. American Journal of Enolo-gy and Viticulture, 56, 37-45.
[25] Câmara, J.S., Alves, M.A. and Marques, J.C. (2006) Development of Headspace Solid-Phase Microextraction-Gas Chromatography-Mass Spectrometry Methodology for Analysis of Terpenoids in Madeira Wines. Analytica Chimica Acta, 555, 191-200. http://dx.doi.org/10.1016/j.aca.2005.09.001
[26] Zhang, Z. and Pawliszyn, J. (1993) Headspace Solid-Phase Microextraction. Analytical Chemistry, 65, 1843-1852. http://dx.doi.org/10.1021/ac00062a008
[27] Pawliszyn, J. (2000) Theory of Solid-Phase Microextraction. Journal of Chromatographic Science, 38, 270-278. http://dx.doi.org/10.1093/chromsci/38.7.270
[28] Pawliszyn, J. (2009) Handbook of SPME. Chemical Industry Press, Beijing.
[29] Meinhart, A.D., Bizzotto, C.S., Ballus, C.A., Prado, M.A., Bruns, R.E., et al. (2010) Optimi-sation of a CE Method for Caffeine Analysis in Decaffeinated Coffee. Food Chemistry, 120, 1155-1161. http://dx.doi.org/10.1016/j.foodchem.2009.11.048
[30] Chiaradia, M.C., Collins, C.H. and Jardim, I.C.S.F. (2008) O estado da arte da cromatografia associada à espectrometria de massas acoplada à espectrometria de massas na análise de compostos tóxicos em alimentos. Química Nova, 31, 623-636. http://dx.doi.org/10.1590/S0100-40422008000300030
Submit or recommend next manuscript to SCIRP and we will provide best service for you:
Accepting pre-submission inquiries through Email, Facebook, LinkedIn, Twitter, etc. A wide selection of journals (inclusive of 9 subjects, more than 200 journals) Providing 24-hour high-quality service User-friendly online submission system Fair and swift peer-review system Efficient typesetting and proofreading procedure Display of the result of downloads and visits, as well as the number of cited articles Maximum dissemination of your research work
Submit your manuscript at: http://papersubmission.scirp.org/ Or contact [email protected]