epoch’s quarterly capital markets outlookepoch’s quarterly capital markets outlook edited...
TRANSCRIPT

1Epoch’s capital MarkEts outlook | April 7, 2016
Epoch Investment Partners, Inc.
Epoch’s Quarterly Capital Markets Outlook
EdItEd transcrIPt — aPrIl 7, 2016
Each quarter, Epoch Investment Partners’ co-CIOs Bill Priest and David Pearl discuss the macroeconomic themes that are affecting global capital markets. This quarter, one of our senior research analysts, Barney Rosen, MD, joined the discussion to provide insights on the health care sector. This document contains the summarized transcript of the presentation. A full replay of the webinar is available on our website, www.eipny.com.
slide 2
Bill Priest:
From 2012 through 2015 multiple expansion has been the driver of returns globally and, to a slightly lesser extent, domestically due to the effects of quantitative easing. Going forward, stocks will no longer have the benefit of the broad-based valuation expansion that propelled markets as central banks began to ramp up their QE programs.
slide 1
Market PerspectiveCumulative contribution to return 2012 through 2015
Source: Standard & Poor’s; MSCI; Epoch Investment Partners; December 2015
Equity Markets Have re-rated as a result Of QE1
S&P 500 next twelve months earnings multiples
Source: Standard & Poor’s; Yardeni Research; Epoch Investment Partners; March 2016
Please see our White Paper dated May 29, 2014: The Power Of Zero + The Power Of The Word
Please see our White Paper dated May 29, 2014: The Power Of Zero + The Power Of The Word
QE’s effect was enormous and affected most financial assets across the globe in a very favorable way. Here we see the effect of QE on earnings multiples, which are up approximately 40% from 2012.

2Epoch’s capital MarkEts outlook | April 7, 2016
slide 5
china is in the midst of rebalancing their economy and the sectors such as construction and industry that once contributed significantly to growth have slowed considerably as they move toward a more service-based economy.
Source: National Bureau of Statistics of China, Epoch Investment Partners; Third Quarter 2015
slide 3
slide 4
china has represented a substantial amount of global growth over the last several years but the country’s impending slowdown will have an impact on global growth prospects.
Source: IMF World Economic Outlook, Epoch Investment Partners; October 2015
Source: IMF World Economic Outlook; October 2015
The Big Problem: A Lack Of GrowthWorld real GDP growth estimates continue to be revised down
China’s Contribution To Growth Has Been SubstantialGlobal GDP growth 2009-2015 (est.) in USD
Sharp Slowing Of Chinese Growth In Manufacturing And ConstructionNominal Chinese growth by sector
A lack of global growth continues to be an overriding concern. The IMF’s overestimation of forecasted growth reflects the sputtering global recovery that is in need of a new engine due to China’s slowdown.

Source: OECD, Epoch Investment Partners, 2015
3Epoch’s capital MarkEts outlook | April 7, 2016
slide 8
The specter of deflation is hanging over the developed world and restraining policy makers. Of the 34 countries in the OECD, roughly 31 of those have inflation under 2%, 27 countries with inflation under 1% and 10 are actually negative.
slide 6
China’s rebalancing will play out over the next few decades and during the transition, industrial production and capex are likely to continue to decline. The expectation is that consumption will represent approximately 50% of GDP by 2020–2030.
Source: McKinsey & Company; March 2016slide 7
Source: The Conference Board. 2015. The Conference Board Total Economy Database™, May 2015, http://www.conference-board.org/data/economydatabase/
Real GDP is simply the sum of two economic variables, growth in the workforce and productivity. Given this backdrop, we believe that 2% growth is a lot more likely than the recent 4% average for mature economies due to the slowdown in demand.
china’s rebalancing Will run through 2025, and Will likely Keep IP And Capex Growth On A Secular DowntrendChanging composition of China’s GDP
2% is the New 4% for Mature EconomiesGDP components
1. Includes all 28 members of the European Union as well as Iceland, Norway and Switzerland, Australia, Canada, Hong Kong, Israel, New Zealand, Singapore, South Korea, Taiwan2. Includes China, India, Bangladesh, Cambodia, Indonesia, Malaysia, Myanmar, Pakistan, Philippines, Sri Lanka, Thailand, Vietnam, Argentina, Barbados, Bolivia, Brazil, Chile, Colombia, Costa Rica, Dominican Republic, Ecuador, Guatemala, Jamaica, Mexico, Peru, St. Lucia, Trinidad & Tobago, Uruguay, Venezuela, Algeria, Bahrain, Egypt, Iran, Iraq, Jordan, Kuwait, Morocco, Oman, Qatar, Saudi Arabia, Sudan, Syria, Tunisia, United Arab Emirates, Yemen, Angola, Burkina Faso, Cameroon, Cote d’Ivoire, DR Congo, Ethiopia, Ghana, Kenya, Madagascar, Malawi, Mali, Mozambique, Niger, Nigeria, Senegal, South Africa, Tanzania, Uganda, Zambia, Zimbabwe
Low Rates (Almost) EverywhereNumber of OECD countries with low inflation

Source: Federal Reserve Bank of St. Louis; 4Q 2015
technology is having a large impact on capital productivity. The substitution of capital for labor through technology is what we believe will allow margins to exceed expectations.
4Epoch’s capital MarkEts outlook | April 7, 2016
slide 11
slide 9
The list of economies with negative interest rate policies (NIRPs) continues to grow. Hungary, Japan, Europe, Sweden, Denmark and Switzerland all have negative rates. We will be producing a white paper on the NIRP phenomenon and its potential implications.
slide 10
Source: Bloomberg; Epoch Investment Partners; March 2016
The List Of Countries With NIRPs Continues To Grow
Technology: The New Macro Influencer
• The driver of a capital-light world
• The last, best hope for sustaining profit margins
structural decline In InvestmentGlobal capex sag

Technology is the new macro and will have a significant impact on returns. If you think of return on equity in the form of three variables, profit margins, scale (or asset utilization) and leverage, technology affects all three. Profit margins are helped by technology in the aforementioned capital-light world, as is scale, as you are able to produce more revenues with fewer assets. Finally, in a low-interest-rate world, you can actually take on more leverage if you’re confident of your final demand outlook. So technology works its way through and produces a positive effect on every component of return on equity.
David Pearl:The U.S. economy is still growing at a little over 2%, but corporate earnings have been impacted by the strength of the dollar. As a result, companies that derive the majority of their sales outside of the U.s. have seen revenues decline due to the currency effect, which has, in turn, affected earnings.
5Epoch’s capital MarkEts outlook | April 7, 2016
slide 14
slide 12
slide 13
Source: FactSet, Epoch Investment Partners; March 2016
Source: BCG http:www.slideshare.net/TheBostonConsultingGroup/robotics-in-manufacturing; Minack Advisors. March 2016
Global capex sagLabor-cost savings from adoption of advanced industrial robots (%, 2025)
technology: Impact On capital returnsReturn on equity components
strong Usd Has Been Painful For companies With Overseas sales2015 S&P 500 (ex-energy) earnings and revenue growth
technology substituting for labor has been a growing trend and we expect it to continue. But while the labor cost savings have been significant, there are some unintended consequences such as exacerbating income inequality and lowering aggregate demand.
Source: Baker Hughes, EIA, Epoch Investment Partners; March 2016
6Epoch’s capital MarkEts outlook | April 7, 2016
slide 17
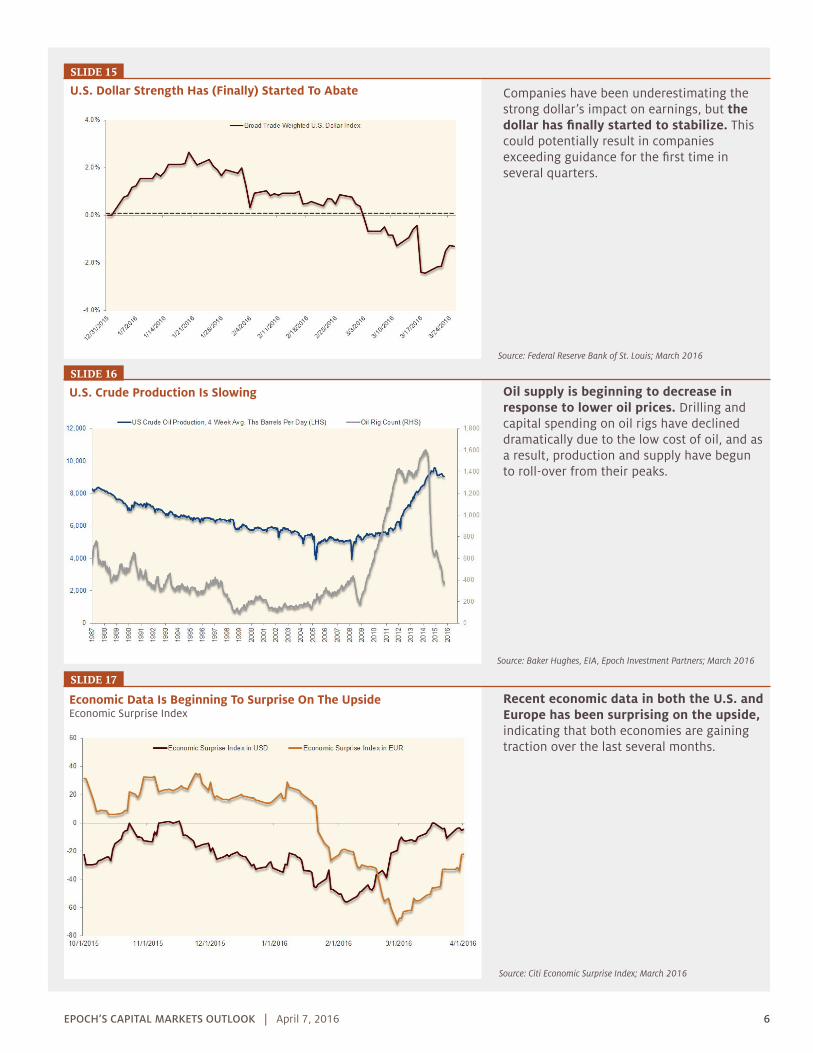
slide 15
slide 16
Source: Citi Economic Surprise Index; March 2016
Source: Federal Reserve Bank of St. Louis; March 2016
U.S. Dollar Strength Has (Finally) Started To Abate
U.S. Crude Production Is Slowing
Economic data Is Beginning to surprise On the UpsideEconomic Surprise Index
Companies have been underestimating the strong dollar’s impact on earnings, but the dollar has finally started to stabilize. This could potentially result in companies exceeding guidance for the first time in several quarters.
Oil supply is beginning to decrease in response to lower oil prices. Drilling and capital spending on oil rigs have declined dramatically due to the low cost of oil, and as a result, production and supply have begun to roll-over from their peaks.
recent economic data in both the U.s. and Europe has been surprising on the upside, indicating that both economies are gaining traction over the last several months.

Source: Institute for Supply Management, Federal Reserve Bank of Saint Louis, Epoch Investment Partners; March 2016
Manufacturing, which has long been either stagnant or in decline, has begun to pick up. This is important because it means manufacturing has become a relative contributor to our economy recently, instead of detracting from growth.
7Epoch’s capital MarkEts outlook | April 7, 2016
slide 20
slide 18
slide 19
Source: Bureau of Economic Analysis, Epoch Investment Partners; Fourth Quarter 2015
Source: Federal Reserve Economic Data, Epoch Investment Partners; February 2016
Manufacturing PMI Back Into Expansionary territoryInstitute for Supply Management Economic Activity Index
Disposable Income Growth Is Outpacing GDP Growth
Balance Shifting Slowly Back Towards LaborCorporate profits vs. labor compensation, percent of GDP
the plight of the american consumer has been improving. While wage growth has not been significant, disposable income growth has been outpacing GDP because of the increase in purchasing power due to inexpensive oil and the strength of the dollar.
The tide has turned in favor of workers at the expense of corporate profits as it becomes more difficult to continue to achieve productivity increases, particularly from cutting the cost of labor.

8Epoch’s capital MarkEts outlook | April 7, 2016
slide 23
slide 21
slide 22
The first quarter of 2016 was truly a tale of two halves with a 10+% peak-to-trough move. This was the result of macroeconomic factors more so than fundamentals and dramatically affected market leadership over the quarter.
Source: Federal Reserve Bank of St. Louis; March 2016
Source: Standard & Poor’s, Epoch Investment Partners; April 2016
Source: Goldman Sachs, FactSet, S&P, Epoch Investment Partners; Indexed to 100 in January 1, 2014; April 2016
cyclical and defensive Industry GroupsPerformance relative to S&P 500
1. Cyclicals include Automobiles & Components, Banks, Capital Goods, Diversified Financials, Energy, Insurance, Materials, Media, Semi-conductors & Semiconductor Equipment, Software & Services, Technology Hardware & Equipment, Transportation2. Defensives include: Commercial & Professional Services, Consumer Durables & Apparel, Consumer Services, Food & Staples Retailing, Food Beverage & Tobacco, Health Care Equipment & Services, Household & Personal Products, Pharmaceuticals Biotechnology & Life Sciences, Real Estate, Retailing, Telecommunication Services, Utilities
A Tale Of Two Halves: The MarketS&P 500 returns, first quarter 2016
A Tale Of Two Halves: S&P 500 S&P 500 sector returns
Since the third quarter of 2014, there has been a significant difference in the performance of cyclicals and defensive stocks. Defensive stocks have been the clear leaders, widening the gap between cyclicals during the periods of heightened uncertainty.
Here we see the quarter broken into two halves with the defensive sectors performing well in the first half of the quarter. The trend reversed in the second half of the quarter with economically sensitive sectors leading the way, but defensive still in positive territory. This highlights the importance of yield in both market environments.

9Epoch’s capital MarkEts outlook | April 7, 2016
slide 26
slide 24
slide 25
Source: Standard & Poor’s Data via Bloomberg, Benchmarked to May 29 2015, Epoch Investment Partners; April 2016
Source: Wolfe Research Portfolio Strategy, Standard & Poor’s, Compustat, Thomson Financial, FactSet; April 2016
Source: Standard & Poor’s, Epoch Investment Partners; April 2016
Health care Multiples compressMarket aggregate Price / Earnings NTMA
Returns: S&P Health Care Sector Index vs. S&P 500 IndexReturns over the last several months
S&P 500 Sectors: 2016 Consensus EPS Growth And Revisions
Expectations for health care earnings have been pretty strong and have in fact compressed during the first quarter.
Barney Rosen:The S&P Health Care Index has underperformed the S&P 500 Index significantly over the last several months, particularly following Hillary Clinton’s tweet on price gouging on September 21, 2015.
the underlying business fundamentals for health care companies remains solid based on expectations for future cash flow and earnings. Here we see the underlying growth rates on the left for earnings and then we see the earnings revisions on the right of the major sectors and health care screened quite well on both of these.

Bill Priest: We are entering a period where returns from financial securities are likely to be less than what we’ve enjoyed historically. Here we see the substantial difference in the yields between regional benchmark indices and 10-year sovereign bond yields.
We believe that successful investing is linked to prudent capital allocation. The key here is: can you earn something above your cost of capital? Those companies that can do that are involved in capital spending and acquisitions. On the other hand, if you can’t exceed your cost of capital, you should give the money back to investors in the form of cash dividends, buybacks and debt reductions, which we call shareholder yield.
10Epoch’s capital MarkEts outlook | April 7, 2016
slide 29
slide 27
slide 28
Where Will Free Cash Flows Go?
Buybacks and dividends to continue at a High levelS&P 500 annual buybacks and dividends
1. Projection based on current run rate; Dividends through 6/30/15; Buybacks through 6/30/15; Source: S&P; Epoch Investment Partners; 2Q 2015
Source: MSCI, Epoch Investment Partners; March 31, 2016
Asset Allocation: Equities Offer Better Income Than Sovereign BondsMSCI country and regional dividend yields vs. 10-year government bond yields
Buybacks and dividends will continue probably at a lower rate than what we’ve seen recently, but still at elevated levels historically. We expect buybacks and dividends to continue as a favored use of cash, in part because there’s less capital required to generate a dollar of sales in an increasingly capital-light world.

While M&A activity hit a record in 2015, it is conceivable that there could potentially be an aggregate decline in M&A activity because of fears of a unilateral action by the Treasury without any change in congressional law.
11Epoch’s capital MarkEts outlook | April 7, 2016
slide 30
slide 31
Source: Strategas Research Partners; December 2015
Global M&A Activity To ContinueMonthly global M&A deal value and number
summary
• Low growth reflecting demographics, productivity and slow down in China have made 2% the new normal for real GDP growth
• Technology is the new macro: enhancing productivity, sustaining profit margins and reconfiguring capital allocation choices
• Dividend payers and free cash flow generators should drive rela-tive equity returns
• The diminishing impact of monetary policy (QE) on valuation metrics will foster greater interest in active management
The information contained herein is distributed for informational purposes only and should not be considered investment advice or a recom-mendation of any particular security, strategy or investment product. Information contained herein has been obtained from sources believed to be reliable, but not guaranteed. The information contained herein is accurate as of the date submitted, but is subject to change. Any per-formance information referenced represents past performance and is not indicative of future returns. Any projections, targets, or estimates in this presentation are forward looking statements and are based on Epoch’s research, analysis, and assumptions made by Epoch. There can be no assurances that such projections, targets, or estimates will occur and the actual results may be materially different. Other events which were not taken into account in formulating such projections, targets, or estimates may occur and may significantly affect the returns or performance of any accounts and/or funds managed by Epoch. To the extent this document contains information about specific compa-nies or securities including whether they are profitable or not, they are being provided as a means of illustrating our investment thesis. Past references to specific companies or securities are not a complete list of securities selected for clients and not all securities selected for clients in the past year were profitable.