epa inhalation reference concentrations and application of
TRANSCRIPT
p. 1
United States Office of Research and EPA/600/8-90/066FEnvironmental Protection Development October 1994Agency Washington DC 20460
EPA Methods for Derivation ofInhalation ReferenceConcentrations andApplication of InhalationDosimetry

p. 2
EPA/600/8-90/066FOctober 1994
METHODS FOR DERIVATION O FINHALATION REFERENCE CONCENTRATIONS
AND APPLICATION OF INHALATION DOSIMETRY
Environmental Criteria and Assessment Offic eOffice of Health and Environmental Assessment
Office of Research and DevelopmentU .S . Environmental Protection Agency
Research Triangle Park, NC 2771 1
~* Printed on Recycled Paper

p. 3
DISCLAIMER
This document has been reviewed in accordance with U . S . Environmental Protection
Agency policy and approved for publication . Mention of trade names or commercial
products does not constitute endorsement or recommendation for use .
11

p. 4
TABLE OF CONTENTS
Page
LIST OF TABLES . . . . . . . . . . . . . . . . . . . . . . . . . . . . . . . . . . . viLIST OF FIGURES . . . . . . . . . . . . . . . . . . . . . . . . . . . . . . . . . . . viiiAUTHORS, CONTRIBUTORS, AND REVIEWERS . . . . . . . . . . . . . . . xiiiLIST OF ACRONYMS AND ABBREVIATIONS . . . . . . . . . . . . . . . . . xixGLOSSARY . . . . . . . . . . . . . . . . . . . . . . . . . . . . . . . . . . . . . . . xxvii
1 . INTRODUCTION AND OVERVIEW . . . . . . . . . . . . . . . . . . . . . 1-11 .1 INHALATION REFERENCE CONCENTRATION:
DEVELOPMENT, DEFINITION, AND DERIVATION . . . . . . 1-11 .2 GENERAL PRINCIPLES OF DOSE-RESPONS E
ASSESSMENT FOR NONCANCER TOXICITY . . . . . . . . . . 1-81 .3 GUIDELINES ON SPECIFIC ENDPOINTS . . . . . . . . . . . . . 1-141 .4 USE OF THE INHALATION REFERENCE
CONCENTRATION IN THE NATIONAL ACADEMYOF SCIENCES RISK ASSESSMENT AND RISKMANAGEMENT PARADIGM . . . . . . . . . . . . . . . . . . . . . 1-15
1 .5 OCCUPATIONAL EXPOSURE LIMITS VERSUSINHALATION REFERENCE CONCENTRATIONS . . . . . . . . 1-16
1 .6 PRIMARY NATIONAL AMBIENT AIR QUALITYSTANDARDS VERSUS INHALATION REFERENC ECONCENTRATIONS . . . . . . . . . . . . . . . . . . . . . . . . . . . 1-17
1.7 STATE-OF-THE-ART APPLICATIONS TO THEDEVELOPMENT OF THE INHALATION REFERENCECONCENTRATION METHODOLOGY . . . . . . . . . . . . . . . . 1-18
2 . QUALITATIVE EVALUATION OF THE DATA BASE . . . . . . . . . 2-12.1 GUIDELINES FOR SELECTIONS OF KEY STUDIES . . . . . . 2-2
2.1 .1 Human Data . . . . . . . . . . . . . . . . . . . . . . . . . . . . 2-22.1 .1 .1 Molecular Epidemiology and Biologic
Markers . . . . . . . . . . . . . . . . . . . . . . . . 2-32.1 .1 .2 Epidemiologic Data . . . . . . . . . . . . . . . . . 2-162.1 .1 .3 Nonepidemiologic Data . . . . . . . . . . . . . . 2-202.1 .1 .4 Intraspecies Variability and Identifying
Sensitive Subgroups . . . . . . . . . . . . . . . . . 2-222.1 .1 .5 Summary . . . . . . . . . . . . . . . . . . . . . . . 2-24
2.1 .2 Laboratory Animal Data . . . . . . . . . . . . . . . . . . . . 2-262 .1 .2.1 Study Design . . . . . . . . . . . . . . . . . . . . . 2-262 .1 .2 .2 Impact of Experimental Protocol . . . . . . . . . 2-272.1 .2 .3 Appropriateness of Laboratory Anima l
Species as a Model for Humans . . . . . . . . . 2-352.1 .2.4 Study Validity and Relevance to
Extrapolation . . . . . . . . . . . . . . . . . . . . . 2-432 .1 .3 Summarizing the Evidence . . . . . . . . . . . . . . . . . . . 2-44
iii

p. 5
TABLE OF CONTENTS (cont'd)Page
3 . CONCEPTUAL BASIS FOR INHALATION DOSE-RESPONSEASSESSMENT METHODOLOGY . . . . . . . . . . . . . . . . . . . . . . . 3-1
3.1 FACTORS CONTROLLING COMPARATIVEINHALED DOSE . . . . . . . . . . . . . . . . . . . . . . . . . . . . . 3-1
3.1 .1 Respiratory Anatomy and Physiology . . . . . . . . . . . . . 3-3
3.1 .1 .1 Respiratory Regions and Branching Patterns . . 3-3
3.1 .1 .2 Clearance Mechanisms . . . . . . . . . . . . . . . 3-18
3.1 .2 Physicochemical Characteristics of the Inhale dToxicant . . . . . . . . . . . . . . . . . . . . . . . . . . . . . . 3-29
3.1 .2 .1 Particles . . . . . . . . . . . . . . . . . . . . . . . . 3-30
3.1 .2 .2 Gases and Vapors . . . . . . . . . . . . . . . . . . 3-30
3.2 MODELING COMPARATIVE DOSIMETRY OFINHALED TOXICANTS . . . . . . . . . . . . . . . . . . . . . . . . . 3-34
3.2 .1 Particle Disposition Model Based onAvailable Data . . . . . . . . . . . . . . . . . . . . . . . . . . 3-35
3 .2 .2 Gas Categorization Scheme Directs DefaultGas Modeling . . . . . . . . . . . . . . . . . . . . . . . . . . . 3-36
3 .2 .3 Summary Considerations for Judging ModelStructures . . . . . . . . . . . . . . . . . . . . . . . . . . . . . 3-39
4 . QUANTITATIVE PROCEDURES . . . . . . . . . . . . . . . . . . . . . . . 4-1
4 .1 MINIMUM DATA BASE CRITERIA . . . . . . . . . . . . . . . . . 4-2
4 .1 .1 Evaluation of Comprehensiveness . . . . . . . . . . . . . . . 4-2
4.1 .2 Route-to-Route Extrapolation . . . . . . . . . . . . . . . . . . 4-5
4.1 .3 Not-Verifiable Status . . . . . . . . . . . . . . . . . . . . . . 4-12
4 .2 DESIGNATION OF EFFECT LEVELS . . . . . . . . . . . . . . . . 4-12
4 .3 CALCULATION OF HUMAN EQUIVALENTCONCENTRATIONS . . . . . . . . . . . . . . . . . . . . . . . . . . . 4-17
4.3.1 Conversion to Standard Units . . . . . . . . . . . . . . . . . 4-19
4.3.2 Temporal Relationships of Toxicity an dDuration Adjustment . . . . . . . . . . . . . . . . . . . . . . . 4-20
4.3.3 Use of Pharmacokinetic and Pharmacodynamic Data . . . 4-22
4.3.4 Default Dosimetric Adjustment and Physiologica lParameters . . . . . . . . . . . . . . . . . . . . . . . . . . . . . 4-25
4 .3 .5 Dosimetric Adjustments for Particle Exposures . . . . . . . 4-29
4 .3 .5 .1 Respiratory Effects . . . . . . . . . . . . . . . . . 4-37
4 .3 .5 .2 Remote (Extrarespiratory) Effects . . . . . . . . 4-38
4 .3 .5 .3 Additional Issues for Particle Dosimetry . . . . 4-39
4 .3 .6 Dosimetric Adjustments for Gas Exposures . . . . . . . . . 4-44
4 .3 .6.1 Respiratory Effects . . . . . . . . . . . . . . . . . 4-46
4 .3 .6.2 Remote (Extrarespiratory) Effects . . . . . . . . 4-57
4 .3 .6.3 Additional Assumptions and Default Values . . 4-63
4.3 .7 Derivation and Dosimetric Adjustment UsingHuman Studies . . . . . . . . . . . . . . . . . . . . . . . . . . 4-64
iv

p. 6
TABLE OF CONTENTS (cont'd)
Pa~e
4 .3 .7.1 Selecting the Threshold Estimate . . . . . . . . . 4-654 .3 .7.2 Defining the Exposure Level . . . . . . . . . . . 4-654.3 .7.3 Dosimetric Adjustment for Human Data . . . . 4-664.3 .7.4 Uncertainty Factors for Human Data . . . . . . 4-67
4.3 .8 Data Array Evaluation and Choice of Principa lStudy/Studies . . . . . . . . . . . . . . . . . . . . . . . . . . . 4-68
4.3.9 Operational Derivation of the Inhalation Referenc eConcentration . . . . . . . . . . . . . . . . . . . . . . . . . . . 4-704.3 .9.1 Application of Uncertainty Factors . . . . . . . . 4-734 .3 .9.2 Assignment of Confidence Levels . . . . . . . . 4-80
5. REFERENCES . . . . . . . . . . . . . . . . . . . . . . . . . . . . . . . . . . . 5-1
APPENDIX A-Alternative Approaches to the Estimation o fNo-Observed-Adverse-Effect Levels . . . . . . . . . . . . . . . . . . . . . . A-1
APPENDIX B-Criteria for Assessing the Quality of IndividualEpidemiological Studies . . . . . . . . . . . . . . . . . . . . . . . . . . . . . . B-1
APPENDIX C-Criteria for Causal Significance . . . . . . . . . . . . . . . . . . C-1
APPENDIX D-Adverse Human Respiratory Health Effects . . . . . . . . . . D-1
APPENDIX E-Guidance on Pulmonary Function Testing . . . . . . . . . . . . E-1
APPENDIX F-Criteria for Assessing the Quality of Individua lLaboratory Animal Toxicity Studies . . . . . . . . . . . . . . . . . . . . . . F-1
APPENDIX G-The Particle Deposition Dosimetry Model . . . . . . . . . . . G-1
APPENDIX H-Particle Sizing Conventions . . . . . . . . . . . . . . . . . . . . H-1
APPENDIX I-Derivation of an Approach To Determine Human Equivalen tConcentrations for Effects of Exposures to Gases inCategories 1 and 2 . . . . . . . . . . . . . . . . . . . . . . . . . . . . . . . . . I-1
APPENDIX J-Derivation of an Approach To Determine Human EquivalentConcentrations for Extrarespiratory Effects of Category 3 Ga sExposures Based on a Physiologically Based Pharmacokineti cModel Using Selected Parameter Values . . . . . . . . . . . . . . . . . . . . J-1
v
p. 7
LIST OF TABLES
Number Page
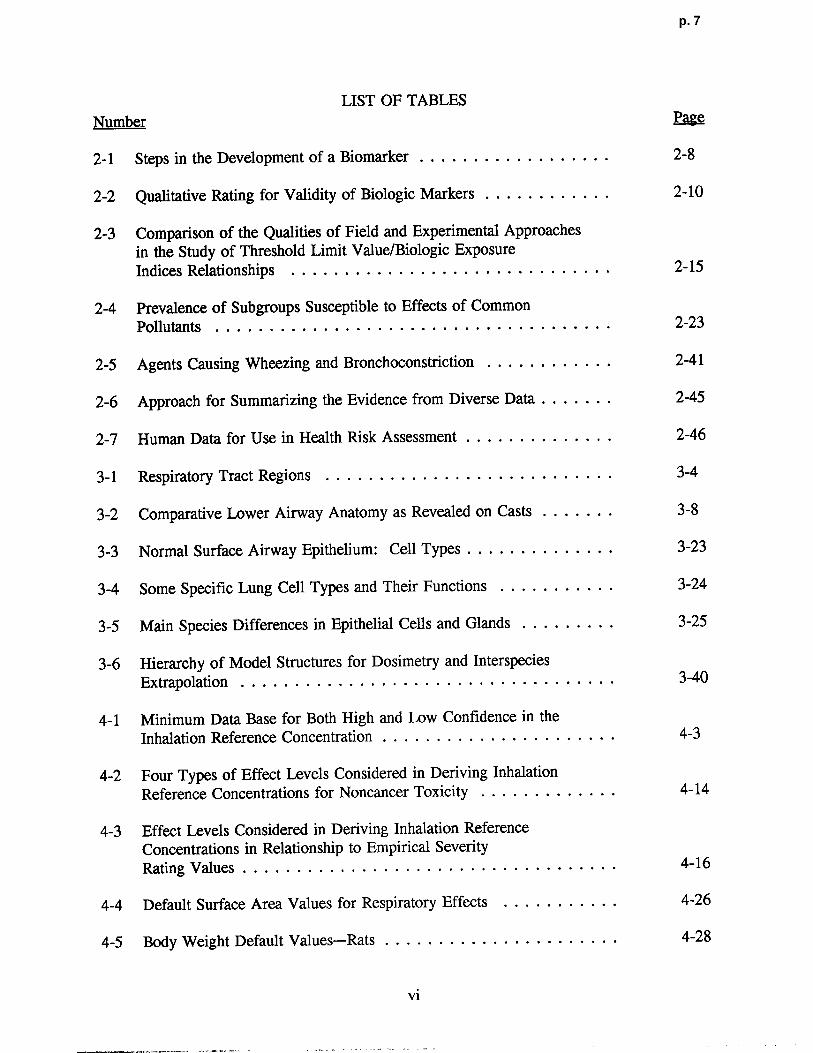
2-1 Steps in the Development of a Biomarker . . . . . . . . . . . . . . . . . . 2-8
2-2 Qualitative Rating for Validity of Biologic Markers . . . . . . . . . . . . 2-10
2-3 Comparison of the Qualities of Field and Experimental Approachesin the Study of Threshold Limit Value/Biologic Exposur eIndices Relationships . . . . . . . . . . . . . . . . . . . . . . . . . . . . . . 2-15
2-4 Prevalence of Subgroups Susceptible to Effects of CommonPollutants . . . . . . . . . . . . . . . . . . . . . . . . . . . . . . . . . . . . . 2-23
2-5 Agents Causing Wheezing and Bronchoconstriction . . . . . . . . . . . . 2-41
2-6 Approach for Summarizing the Evidence from Diverse Data . . . . . . . 2-45
2-7 Human Data for Use in Health Risk Assessment . . . . . . . . . . . . . . 2-46
3-1 Respiratory Tract Regions . . . . . . . . . . . . . . . . . . . . . . . . . . . 3-4
3-2 Comparative Lower Airway Anatomy as Revealed on Casts . . . . . . . 3-8
3-3 Normal Surface Airway Epithelium: Cell Types . . . . . . . . . . . . . . 3-23
3-4 Some Specific Lung Cell Types and Their Functions . . . . . . . . . . . 3-24
3-5 Main Species Differences in Epithelial Cells and Glands . . . . . . . . . 3-25
3-6 Hierarchy of Model Structures for Dosimetry and Interspecie sExtrapolation . . . . . . . . . . . . . . . . . . . . . . . . . . . . . . . . . . . 3-40
4-1 Minimum Data Base for Both High and Low Confidence in th eInhalation Reference Concentration . . . . . . . . . . . . . . . . . . . . . . 4-3
4-2 Four Types of Effect Levels Considered in Deriving Inhalation
Reference Concentrations for Noncancer Toxicity . . . . . . . . . . . . . 4-14
4-3 Effect Levels Considered in Deriving Inhalation ReferenceConcentrations in Relationship to Empirical Severity
Rating Values . . . . . . . . . . . . . . . . . . . . . . . . . . . . . . . . . . . 4-16
4-4 Default Surface Area Values for Respiratory Effects . . . . . . . . . . . 4-26
4-5 Body Weight Default Values-Rats . . . . . . . . . . . . . . . . . . . . . . 4-28
vi

p. 8
LIST OF TABLES (cont'd )Number Page
4-6 Intercept and Coefficient Values Used in Algorithm To CalculateDefault Minute Volumes Based on Body Weight . . . . . . . . . . . . . . 4-29
4-7 Comparison of the Highest Individual Species NOAEL MEC] andIts LOAEL[HEC] . . . . . . . . . . . . . . . . . . . . . . . . . . . . . . . . . 4-71
4-8 Guidelines for the Use of Uncertainty Factors in De riving InhalationReference Concentration . . . . . . . . . . . . . . . . . . . . . . . . . . . . 4-76
4-9 The Use of Uncertainty Factors in Deriving an InhalationReference Concentration . . . . . . . . . . . . . . . . . . . . . . . . . . . . 4-77
E-1 Definition of Various Pulmonary Func tion Test Volumes andCapaci ties . . . . . . . . . . . . . . . . . . . . . . . . . . . . . . . . . . . . . E-4
E-2 Change in Spirometric Indices Over Time . . . . . . . . . . . . . . . . . . E-17
F-1 General C linical Biochemistry Examinations . . . . . . . . . . . . . . . . F-5
F-2 Organs and Tissues Preserved for Histological Examination . . . . . . . F-6
G-1 Regional Frac tional Deposition . . . . . . . . . . . . . . . . . . . . . . . . G-4
G-2 Deposition Efficiency Equation Estimated Parameters . . . . . . . . . . . G-6
H-1 Particle Diameter Definitions . . . . . . . . . . . . . . . . . . . . . . . . . H-5
H-2 Lognormal Conversion Equa tions for Common Types of Diameters . . H-7
H-3 Percentage of Particles in the Reported Range Associated with theNumber of Standard Deviations Used To Calculate the GeometricStandard Deviation . . . . . . . . . . . . . . . . . . . . . . . . . . . . . . . . H-10
H-4 General Pa rticle Descriptions and Associated Sizes . . . . . . . . . . . . H-12
I-1 Definition of Parameter Symbols Used in Append ix I . . . . . . . . . . . 1-9
J-1 Definition of Symbols . . . . . . . . . . . . . . . . . . . . . . . . . . . . . . J-5
vii

p. 9
LIST OF FIGURES
Number PAge
1-1 National Research Council (1983) framework for risk assessmen t
and risk management . . . . . . . . . . . . . . . . . . . . . . . . . . . . . . 1-2
1-2 Schematic characterization of comprehensive exposure-dose-respons e
continuum and the evolution of protective to predictiv edose-response estimates . . . . . . . . . . . . . . . . . . . . . . . . . . . . . 1-11
2-1 Biological marker components in sequential progression between
exposure and disease . . . . . . . . . . . . . . . . . . . . . . . . . . . . . . . 2-4
2-2 Schematic representation of possible relationships to researc h
using biologic markers . . . . . . . . . . . . . . . . . . . . . . . . . . . . . 2-11
2-3 Schematic relationships between threshold limit values in air ,biologic exposure indices, and effects . . . . . . . . . . . . . . . . . . . . 2-13
3-1 Diagrammatic representation of three respiratory tract regions . . . . . . 3-5
3-2 Schematic representation of selected parameters influencingregional deposition of particles in the respiratory tract . . . . . . . . . . 3-9
3-3 Regional deposition in humans of monodisperse particles by indicate dparticle diameter for mouth breathing and nose breathing . . . . . . . . . 3-10
3-4 Schematic representation of selected parameters influencin gregional deposition of gases in the respiratory tract . . . . . . . . . . . . 3-11
3-5 Net dose of ozone versus sequential segments along anatomica lmodel lower respiratory tract paths for human, rat, guinea pig ,
and rabbit . . . . . . . . . . . . . . . . . . . . . . . . . . . . . . . . . . . . . 3-12
3-6 Diagram of the nasal passages for the F344 rat modified from
Morgan et at . (1984) . . . . . . . . . . . . . . . . . . . . . . . . . . . . . . 3-15
3-7 Diagram of the nasal passages for the Rhesus monkey modified from
Monticello et al . (1989) . . . . . . . . . . . . . . . . . . . . . . . . . . . . . 3-16
3-8 Inspiratory airflow patterns in upper respiratory tract of Fischer 344
rat and Rhesus monkey . . . . . . . . . . . . . . . . . . . . . . . . . . . . . 3-17
3-9 Gas categorization scheme based on water solubility and reactivit y
as major determinants of gas uptake . . . . . . . . . . . . . . . . . . . . . 3-37
viii

P. 10
LIST OF FIGURES (cont'd)
Number Page
4-1 Multiple route comparisons for mice and humans administere dchloroform at a dose of 100 milligrams per kilogram body weight . . . 4-7
4-2 Differential effects of inhaled and ingested cadmium with increasin ginhaled and ingested doses . . . . . . . . . . . . . . . . . . . . . . . . . . . 4-8
4-3 Decision tree for route-to-route extrapolation . . . . . . . . . . . . . . . . 4-10
4-4 Flowchart for calculation of human equivalent concentrations . . . . . . 4-18
4-5 Display Screen 1 of the computer program that calculate sregional deposited dose ratios . . . . . . . . . . . . . . . . . . . . . . . . . 4-33
4-6 Display Screen 2 of the program that calculates regionaldeposited dose ratios . . . . . . . . . . . . . . . . . . . . . . . . . . . . . . . 4-33
4-7 Display Screen 3 of the computer program that calculatesregional deposited dose ratios . . . . . . . . . . . . . . . . . . . . . . . . . 4-34
4-8 Display Screen 4 of the computer program that calculate sregional deposited dose ratios . . . . . . . . . . . . . . . . . . . . . . . . . 4-34
4-9 Time course of periodicity for Fischer 344 rat exposed 6 hours pe rday, 5 days per week to theoretical gas with partition coefficient sas shown . . . . . . . . . . . . . . . . . . . . . . . . . . . . . . . . . . . . . . 4-61
4-10 Relationship of blood : gas and fat : blood partition coefficients to theattainment of periodic blood concentrations in the Fischer 344 rat . . . 4-62
4-11 Example data array and inhalation reference concentrationderivation . . . . . . . . . . . . . . . . . . . . . . . . . . . . . . . . . . . . . 4-72
A-1 Graphical illustration of proposed low-dose risk estimation for theproportion of abnormal responses in developmental toxicity . . . . . . . A-7
A-2 Schematic of computing a posterior distribution from a likelihoo dfunction and a prior distribution . . . . . . . . . . . . . . . . . . . . . . . . A-12
A-3 Incidence of nasal turbinate lesions in B6C3F1 female mice expose dto n-hexane for 13 weeks . . . . . . . . . . . . . . . . . . . . . . . . . . . . A-13
A-4 Posterior distribution for the n-hexane concentration associated withthe specified health effect in Figure A-3 . . . . . . . . . . . . . . . . . A-13
ix

P . 11
LIST OF FIGURES (cont'd)Numb Page
A-5 Posterior distribution for the concentration of n-hexane associatedwi th the specified health effects from the combined evidence ofSanagi et al . (1980) and Dunnick et al . (1989) . . . . . . . . . . . . . . . A-14
A-6 Posterior distribu tions for the manganese concentration associatedwith specified health effects from each of three studies :Roels et al . (1987a), Iregren (1990), and Chandra et al . (1981) . . . . . A-15
A-7 Posterior distribution for the manganese concentration associatedwi th specified health effect using ei ther exposure or estimatedexposure distribution . . . . . . . . . . . . . . . . . . . . . . . . . . . . . . . A-16
A-8 Posterior distribu tion for the concentration of manganese associatedwith specified health effect from the combined evidence of Iregren(1990) and Roels et al . ( 1987a) with fixed exposure . . . . . . . . . . . . A-16
A-9 Posterior distribution for the concentration of manganese associatedwith specified heal th effect from the combined evidence of Iregren(1990) and Roels et al . (1987a,b) wi th exposure distribu tion . . . . . . . A-17
A-10 Categorical data from published results on me thyl isocyanante forexposures of less than 8 hours in duration and shown as NOAEL ,AEL, or lethality . . . . . . . . . . . . . . . . . . . . . . . . . . . . . . . . . A-20
A-11 Categorical data from published results as in Figure A-10, excludinglethality data . . . . . . . . . . . . . . . . . . . . . . . . . . . . . . . . . . . A-22
A-12 Categorical regression analysis for data on carboxyhemoglobinin humans . . . . . . . . . . . . . . . . . . . . . . . . . . . . . . . . . . . . . A-22
A-13 Catego rical regression analysis of tetrachloroethylene: acute effects . . A-23
E-1 Lung volumes and capaci ties . . . . . . . . . . . . . . . . . . . . . . . . . . E-3
E-2 Volume-time plot (spirogram) of the forced vital capacity maneuver . . E-6
G-1 Comparison of regional deposi tion efficiencies and fractions forthe mouse . . . . . . . . . . . . . . . . . . . . . . . . . . . . . . . . . . . . . G-10
G-2 Range of particles for lognormal distributions with same mass medianaerodynamic diameter but diffe ring geometric standard deviations . . . G-12
x

p. 12
LIST OF FIGURES (cont'd)
Number Page
G-3 Regional deposited dose ratios for rat :human as a function of massmedian aerodynamic diameter for monodisperse and polydispers eparticle size distributions . . . . . . . . . . . . . . . . . . . . . . . . . . . . G-14
H-1 An example of the log-normal distribution function of an aerosol . . . . H-4
H-2 Plot of same aerosol as in Figure H-1 on log-probability paper . . . . . H-6
H-3 Measurement ranges of aerosol monitoring instruments . . . . . . . . . . H-8
H-4 Various airborne materials and their size ranges . . . . . . . . . . . . . . H-11
I-1 Gas categorization scheme based on water solubility and reactivit yas major determinants of gas uptake . . . . . . . . . . . . . . . . . . . . . 1-5
1-2 Schematic of two-phase mass transport resistance model . . . . . . . . . 1-13
1-3 Schematic of modeling approach to estimate regional respirator ytract dose of gases . . . . . . . . . . . . . . . . . . . . . . . . . . . . . . . . 1-18
1-4 Bohr model of ventilation and uptake . . . . . . . . . . . . . . . . . . . . . 1-29
1-5 Schematic of physiologically based pharmacokinetic modelin gapproach to estimate respiratory tract dose of gases in Category 2 . . . 1-37
1-6 Schematic of surface-liquid/tissue phase concentration durin gexhalation . . . . . . . . . . . . . . . . . . . . . . . . . . . . . . . . . . . . . 1-40
1-7 Schematic of change in surface-liquid/tissue phase concentratio nwith distance and time . . . . . . . . . . . . . . . . . . . . . . . . . . . . . . 1-41
1-8 Schematic of change in mass during breathing cycle . . . . . . . . . . . . 1-42
J-1 Schematic of the physiologically based pharmacokinetic modelassumed to describe the uptake and distribution of inhaledcompounds . . . . . . . . . . . . . . . . . . . . . . . . . . . . . . . . . . . . J-4
J-2 Plot of NOAEL*[HEC] versus NOAEL* [ AJ for the rat for four possiblemethods of determining NOAEL [xECI estimates as defined i nthe text . . . . . . . . . . . . . . . . . . . . . . . . . . . . . . . . . . . . . . . J-15
J-3 Plot of NOAEL*[HECI versus NOAEL*r~ for the mouse for fourpossible methods of determining NOAEL [HECI estimates as definedin the text . . . . . . . . . . . . . . . . . . . . . . . . . . . . . . . . . . . . . J-16
xi

p. 13
AUTHORS, CONTRIBUTORS, AND REVIEWER S
This document was prepared under the direction of the Environmental Criteria and
Assessment Office (ECAO) in Research Triangle Park, NC, of the Office of Health and
Environmental Assessment (OHEA) within the U .S . Environmental Protection Agency's
(EPA's) Office of Research and Development (ORD) .
The principal authors are :
Annie M. Jarabek Margaret M6nacheEnvironmental Criteria and Assessment Office Center for Extrapolation ModelingOffice of Health and Environmental Assessment Duke University Medical CenterU.S. Environmental Protection Agency Durham, NC 2771 0Research Triangle Park, NC 27711
John Overton, Jr ., Ph.D .Linda Hanna, Ph.D. Health Effects Research LaboratorySciences International, Inc. Office of Health ResearchKing Street Station U.S . Environmental Protection Agency1800 Diagonal Road, Suite 500 Research Triangle Park, NC 27711Alexandria, VA 22314
The contributing authors to the current document, listed in alphabetical order, are :
Michael Dourson, Ph .D. Elaine C. Grose, Ph .D.tEnvironmental Criteria and Assessment Office 537 Venard Rd .Office of Health and Environmental Assessment Clark Summit, PA 18411U.S. Environmental Protection AgencyCincinnati, OH 45268 Mary Jane Selgrade, Ph .D.
Health Effects Research LaboratoryLinda Erdreich, Ph .D .* Office of Health ResearchEnvironmental Research Information, Inc. U.S . Environmental Protection AgencyNew York, NY 10018-3011 Research Triangle Park, NC 27711
Judith A. Graham, Ph .D .Environmental Criteria and Assessment OfficeOffice of Health and Environmental AssessmentU .S. Environmental Protection AgencyResearch Triangle Park, NC 2771 1
*Formerly with ECAO-Cincinnati .tFormerly with the Health Effects Research Laboratory-RTP .
xiii

p. 14
The authors are also grateful to several other individuals who contributed to the
development of earlier versions of the methodology . Their thoughtful discussions at that time
were useful in delineating important issues . These individuals, listed in alphabetical order,
are :
Karen Blackburn, Ph .D.* Bruce Peirano, Ph.D.Proctor and Gamble Environmental Criteria and AssessmentCincinnati, OH Office
Office of Health and EnvironmentalChristopher DeRosa, Ph .D.* AssessmentAgency for Toxic Substances and Disease U .S. Environmental Protection AgencyRegistry Cincinnati, OH 45268
Atlanta, GAWilliam Pepelko, Ph.D .
Mark Greenberg, M .S. Human Health Assessment GroupEnvironmental Criteria and Assessment Office Office of Health and EnvironmentalOffice of Health and Environmental Assessment Assessmen tU.S. Environmental Protection Agency U .S . Environmental Protection AgencyResearch Triangle Park, NC 27711 Washington, DC 2046 0
Richard Hertzberg, Ph .D. Greg Theiss, Ph.D .Environmental Criteria and Assessment Office Office of Program Planning and EvaluationOffice of Health and Environmental Assessment Office of Research and DevelopmentU.S. Environmental Protection Agency U .S . Environmental Protection AgencyCincinnati, OH 45268 Washington, DC 2045 0
*Formerly with ECAO-Cincinnati .
xiv

p. 15
Lastly, the authors thank Bette Zwayer and Carol Haynes (ECAO-Cincinnati) fo r
diligently and graciously preparing the original drafts of the manuscript and Judith Olsen for
excellent editorial support . The authors further thank Marianne Barrier, John Barton, Ivra
Bunn, Lynette Cradle, Patricia Felix, Jorja Followill, Miriam Gattis, Lorrie Godley, Sheila
Lassiter, and Wendy Lloyd of ManTech Environmental Technology, Inc . (Research Triangle
Park, NC), for preparing several drafts for reviews (experts workshop, EPA's Science
Advisory Board [SAB], and external peer) as well as the current, final document . The
authors also are grateful to Donald Joyner of the Chemical Industry Institute of Toxicology
for graphics support . Lastly, the authors express a special tribute to the late Director of
ECAO-Cincinnati, Dr . Jerry F. Stara-his vision initiated the effort .
xv
p. 16
The following individuals participated as peer reviewers at a publicly held expert revie w
at the EPA Environmental Research Center in Research Triangle Park, NC, on October 5 and
6, 1987, and provided valuable comments and written contributions on both the workshop
draft and a subsequently revised draft :
Charles Hobbs, D.V.M. Vera Fisgrova-Bergerova Thomas, Ph .D .Inhalation Toxicology Research Institute Department of Anesthesiolog yLovelace Biomedical and Environmental University of Miami School of Medicine
Research Institute, Inc. P.O. Box 016370P.O. Box 5890 Miami, FL 33101Albuquerque, NM 87185
Theodore Torkelson, Ph .D .Michael D. Lebowitz, Ph .D. Toxicology ConsultantUniversity of Arizona College of Medicine 315 Birch StreetRespiratory Sciences Center Roscommon, MI 486531501 North Campbell AvenueTucson, AZ 85724 Curtis Travis, Ph.D .
Center for Risk ManagementDaniel B . Menzel, Ph.D.* P.O. Box 2008Laboratory of Environmental Pharmacology Building 4500 Sand Toxicology Oak Ridge National Laboratory
P .O. Box 3813 Oak Ridge, TN 37831-6109Duke University Medical CenterDurham, NC 27710
Richard Schlesinger, Ph .D .Laboratory for Pulmonary Biology and
ToxicologyInstitute of Environmental MedicineNew York University Medical CenterLong Meadow RoadTuxedo, NY 10987
*Current address :Department of Community and Environmental
MedicineUniversity of California-Irvine
I rv ine, CA 92717 .
xvi

p. 17
On October 26, 1990, an external review draft (1990) of this document was reviewed
by EPA's Science Advisory Board (SAB) . The SAB reviewers were :
ACTING CHAIRMAN Richard Monson, Ph .D .Ronald Wyzga, Ph.D . Department of EpidemiologyElectric Power Research Institute Harvard School of Public Health3412 Hillview Avenue 677 Huntingdon Ave.P .O. Box 10412 Boston, MAPalo Alto, CA 94303
D . Warner North, Ph .D .MEMBERS AND CONSULTANTS Decision Focus Inc .Mel Andersen, Ph.D .* 650 Castro Street, Suite 300Chemical Industry Institute of Toxicology Mountain View, CA 94041P.O. Box 121376 Davis Drive Guenter Oberdorster, Ph.D.Research Triangle Park, NC 27709 Department of Environmental Medicine
University of Rochester School of MedicineDavid Gaylor, Ph .D . Rochester, NY 14642Biometry DivisionNational Center for Toxicological Research Martha Radike, Ph .D .Jefferson, AR 72079 Department of Environmental Health
University of Cincinnati Medical CenterMarshall Johnson, Ph .D. 3223 Eden AvenueDepartment of Anatomy and Developmental Cincinnati, OH 45267
BiologyJefferson Medical College Bernard Weiss, Ph .D.1020 Locust Street Department of Environmental MedicinePhiladelphia, PA 19107 University of Rochester School of Medicine
Rochester, NY 1464 2Fred Miller, Ph .D. tCenter for Extrapolation ModelingDuke University Medical CenterDurham, NC 27710
*Current address: tCurrent address:ICF Kaiser Department of Inhalation Toxicology and1 Copley Park, Suite 102 Biomathematical Modelin gMorrisville, NC 27650 Chemical Industry Institute of Toxicology
P.O. Box 121376 Davis Driv e
Research Triangle Park, NC 27709 .
xvii

p. 18
After the 1990 SAB review, the document was revised and an additional peer revie w
was conducted in August* and Septembert 1993 to evaluate the key revisions made in
response to SAB comments. The following experts participated :
Alan Dahl, Ph .D:*t John Morris, Ph.D.*tInhalation Toxicology Research Institute Department of Pharmacology and ToxicologyLovelace Biomedical and Environmental University of Connecticu t
Research Institute, Inc. Storrs, CT 06269-2092P.O. Box 5890Albuquerque, NM 87185-5890 Curtis C. Travis, Ph.D .*
Center for Risk ManagementVera Fiserova-Bergerova Thomas, Ph .D.* P.O. Box 2008 Building 4500SDepartment of Anesthesiology Oak Ridge National LaboratoryUniversity of Miami School of Medicine Oak Ridge, TN 37831-6109P .O. Box 016370Miami, FL 33101 James S . Ultman, Ph .D.*t
Department of Chemical Engineering
Clay B. Frederick, Ph.D.*~ Penn State UniversityToxicology Department 106 Fenske LaboratoryRohm and Haas Company University Park, PA 16802727 Norristown RoadSpring House, PA 19477 Ron K. Wolff, Ph .D .*
Lily Research LaboratoriesMichael D. Lebowitz, Ph .D.* P.O. Box 708University of Arizona College of Medicine Greenfield, IN 46140Respiratory Sciences Center1501 North Campbell AvenueTucson, AZ 85724
xviii

P. 19
LIST OF ACRONYMS AND ABBREVIATION S
a Airway perimeter
ADI Acceptable daily intake
BEIs Biologic exposure indices
bw Body weight
Co Initial concentration
Calv Pulmonary region gas concentration
Ca(x) Gas concentration as a function of x
Cb Blood concentration
Cb/g Gas concentration in equilibrium with blood concentratio n
Cb/r Concentration of gas in its chemically transformed (reacted) state
Cf Concentration in the fat compartment
Cg Gas phase concentration in airway lumen
Cgi Gas-phase concentration at the interface of the gas phase with the surfaceliquid/tissue phase
Ci Inhaled concentration
C1 Surface-liquid/tissue phase concentration
CLG Concentration in the lung compartmen t
Cl 1g Surface-liquid/tissue concentration in equilibrium with the gas phase
Ch Surface-liquid/tissue concentration at the interface of the gas phase and thesurface-liquid/tissue phase
CS Imposed concentration
CT/A Concentration of reacted and unreacted gas in arterial blood
CT/v Concentration of reacted and unreacted gas in venous blood
xix

p. 20
LIST OF ACRONYMS AND ABBREVIATIONS (cont'd)
Cz Concentration in the surface-liquid/tissue phase
CA Arterial (unoxygenated) blood concentration (mg/cm3)
CLfat Clearance from the fat compartment
CLLIV Clearance from the liver compartment
CLsys Clearance from the systemic compartment
CNS Central nervous system
CV Concentration in venous (oxygenated) blood entering gas-exchange (PU)region
CX(EXH)ET Concentration exiting from extrathoracic region on exhalation
CX(EXH)pu Concentration exiting from pulmonary region on exhalation
CX(EXH)TB Concentration exiting from tracheobronchial region on exhalation
CX(INH)ET Concentration exiting from extrathoracic region on inhalation
CX(INH)TB Concentration exiting from tracheobronchial region on inhalation
D Deposited fraction of mass
Dl Liquid diffusivity
dae Aerodynamic equivalent diameter
dar Aerodynamic resistance diameter
DAF Dosimetric adjustment factor
DNA Deoxyribonucleic aci d
dP Particle diameter
dx Differential of axial distance into airway
dy Differential of axial distance into capillary segmen t
dz Differential of distance into the surface-liquid/tissue phase
xx
p. 21
LIST OF ACRONYMS AND ABBREVIATIONS (cont'd )
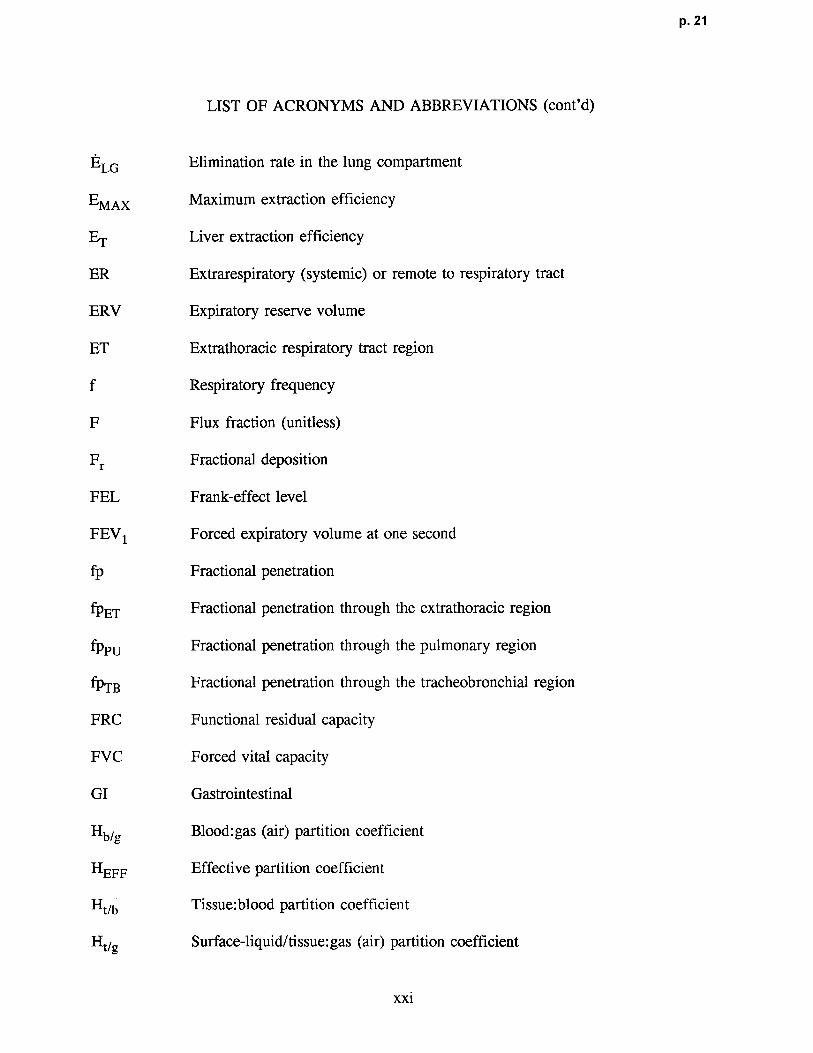
ELG Elimination rate in the lung compartment
EMAX Maximum extraction efficiency
ET Liver extraction efficiency
ER Extrarespiratory (systemic) or remote to respiratory tract
ERV Expiratory reserve volume
ET Extrathoracic respiratory tract region
f Respiratory frequency
F Flux fraction (unitless)
Fr Fractional deposition
FEL Frank-effect level
FEV 1 Forced expiratory volume at one second
fp Fractional penetration
fpET Fractional penetration through the extrathoracic region
fpPU Fractional penetration through the pulmonary region
fpTB Fractional penetration through the tracheobronchial region
FRC Functional residual capacity
FVC Forced vital capacity
GI Gastrointestinal
Hb/g Blood:gas (air) partition coefficient
HEFF Effective partition coefficient
Htn; Tissue:blood partition coefficien t
Ht/g Surface-liquid/tissue: gas (air) partition coefficient
xxi
p. 22
LIST OF ACRONYMS AND ABBREVIATIONS (cont'd)
Ha Hatta number
HEC Human equivalent concentration
IC Inspiratory capacity
iv Intravenous
kg Transport coefficient in the gas phase
Kg Overall mass transport coefficien t
KgET Overall mass transport coefficient of the extrathoracic region
KgPU Overall mass transport coefficient of the pulmonary region
KgTB Overall mass transport coefficient of the tracheobronchial region
kl Transport coefficient in the surface-liquid/tissue phase
kLG Elimination rate from lung compartment
km Alveolar membrane diffusion coefficient
kr Reaction rate constant in the blood or tissue
KM Michaelis constant
L Airway length
LEL Lowest-effect level
LOAEL Lowest-observed-adverse-effect level
LOEL Lowest-observed-effect level
Md Desorbed mass
MdET Desorbed mass from extrathoracic region to blood
MdpU Desorbed mass from pulmonary region to blood
MdTB Desorbed mass from tracheobronchial region to blood
xxii

p. 23
LIST OF ACRONYMS AND ABBREVIATIONS (cont'd )
MET Mass flux from extrathoric region to blood
1VIpU Mass flux from pulmonary region to blood
MTB Mass flux from tracheobronchial region to blood
MF Modifying factor
MMAD Mass median aerodynamic diameter
N Overall transport or flux
Ng Flux through the air phase
N1 Flux through the surface liquid-tissue phase
NOAEL No-observed-adverse-effect leve l
NOEL No-observed-effect level
OEL Occupational exposure level
PEL Permissible exposure level
PU Pulmonary respiratory tract region
0a1v Alveolar ventilation rate
Qb Blood flow rate
Or Cardiac output
RGDr Regional gas dose to respiratory tract region (r )
RDDr Regional deposited dose of particles to respiratory tract region (r)
RDDRr Regional deposited dose ratio of particles for respiratory tract region (r)
RGDRET Regional gas dose ratio for the extrathoracic regio n
RGDRpU Regional gas dose ratio for the pulmonary region
RGDRr Regional gas dose ratio for respiratory tract region (r)
xxiii
p. 24
LIST OF ACRONYMS AND ABBREVIATIONS (cont'd )
RGDRTB Regional gas dose ratio for the tracheobronchial region
RfC Chronic inhalation reference concentration
RNA Ribonucleic acid
RV Residual volume
Sp Blood perfusion surface area
SA Surface area of unspecified respiratory region
SAET Surface area of the extrathoracic region
SATB Surface area of the tracheobronchial region
SAPU Surface area of the pulmonary regio n
U9 Geometric standard deviation
t Time
tEXH Time (duration) of exhalation
TB Tracheobronchial respiratory tract region
TLC Total lung capacity
TLV Threshold limit value
TWA Time-weighted average
UF Uncertainty factor
URT Upper respiratory tract
V Volumetric flow rate
Vb Capillary blood volume
VE Minute volume (VT X f)
VLG Lung compartment volume
xxiv

p. 25
LIST OF ACRONYMS AND ABBREVIATIONS (cont'd)
VT Tidal volume
VMAX Maximum velocity of saturable (Michaelis-Menton) metabolism path
x Distance into the airway
Ay Thickness of the surface liquid-tissue layer
z Distance into the surface-liquid/tissue phase
Az Surface-liquid/tissue phase thickness
xxv
p. 26
GLOSSAR Y
Activity Median Diameter (AMD)Refers to the median of the distribution of radioactivity, toxicological, or biologicalactivity with respect to particle size.
Acute ExposureA one-time or short-term exposure with a duration of less than or equal to 24 h .
Aerodynamic DiameterTerm used to describe particles with common inertial properties to avoid the complicationsassociated with the effects of particle size, shape, and physical density .
Aerodynamic Equivalent Diameter (dad"Aerodynamic diameter" generally used . The diameter of a unit density sphere(p = 1 g/cm3) having the same settling velocity (due to gravity) as the particle of interestofPwhatever shape and density . Refer to Raabe (1976) and Appendix H for discussion .
Aerodynamic (Viscous) Resistance Diameter (dar)The "Lovelace" definition for aerodynamic diameter . Characteristic expression based onterms describing a particle in the Stokes' regime. Refer to Raabe (1976) for equation .
AerosolAll-inclusive term. A suspension of liquid or solid particles in air .
ATPSAmbient temperature and pressure, saturated (a condition under which a gas volume ismeasured) .
BTPSBody temperature and pressure, saturated (a condition under which a gas volume ismeasured) .
Critical Effec tThe first adverse effect, or its known precursor, that occurs as the dose rate increases .Designation is based on evaluation of overall data base .
Chronic ExposureMultiple exposures occurring over an extended period of time, or a significant fraction ofthe animal's or the individual's lifetime .
Dosimetric Adjustment Factor (DAF )A multiplicative factor used to adjust observed experimental or epidemiological data tohuman equivalent concentration for assumed ambient scenario . See regional gas dose ratio(RGDR) and regional deposited dose ratio (RDDR) .
xxvii

p. 27
Diffusion DiameterDiameter of a sphere having the same diffusion mobility as the particle in question .dp < 0.5 µm.
Expiratory Reserve Volume (ERV)The maximum volume exhaled from FRC (FRC - RV) .
f Respiratory frequency (breaths/min) .
FrFraction of inspired particles deposited in respiratory tract region (r) .
Functional Residual Capacity (FRC )The lung volume at the end of tidal expiration (TLC - IC).
Forced Expiratory Volume (FEV1) at One Secon dThe volume of air that can be forcibly exhaled during the first second of expirationfollowing a maximal inspiration .
Forced Vital Capacity (FVC)The maximal volume of air that can be exhaled as forcibly and rapidly as possible after amaximal inspiration .
GenerationRefers to the branching pattern of the airways . Each division into a major daughter (largerin diameter) and minor daughter airway is termed a generation . Numbering begins withthe trachea .
Inhalation Reference Concentration (RfC)An estimate (with uncertainty spanning perhaps an order of magnitude) of a continuousinhalation exposure to the human population (including sensitive subgroups) that is likelyto be without an appreciable risk of deleterious noncancer health effects during a lifetime .The inhalation reference concentration is for continuous inhalation exposures and i sappropriately expressed in units of mg/m3 .
Inspiratory Capacity (IC)The maximum inhaled from FRC (TLC - FRC) .
Henry's Law ConstantThe law can be expressed in several equivalent forms, a convenient form being :Cg = HC1 where Cg and C1 are the gas-(g) and liquid-(1) phase concentrations . Theconstant (H) is the ratio at equilibrium of the gas phase concentration to the liquid-phaseconcentration of the gas (i .e., moles per liter in air/moles per liter in solution) .
Lowest-Effect Level (LEL)Same as Lowest-Observed-Adverse-Effect Level .
xxviii

p. 28
Lowest-Observed-Adverse-Effect Level (LOAEL)The lowest exposure level at which there are statistically and biologically significantincreases in frequency or severity of adverse effects between the exposed population andits appropriate control group.
Mass Median Aerodynamic Diameter (MMAD)Mass median of the distribution of mass with respect to aerodynamic diameter . Graphs forthese distributions are constructed by plotting frequency against aerodynamic diameters .
Minute Volume (VE )The volume of air exhaled per minute body temperature and pressure, saturated (BTPS) .
Modifying Factor (MF)An uncertainty factor that is greater than zero and less than or equal to 10 ; its magnitudereflects professional judgment regarding scientific uncertainties of the data base or studydesign not explicitly treated by the uncertainty factors (e .g., the number of animals tested) .The default value for the MF is 1 .
No-Observed-Adverse-Effect Level (NOAEL )An exposure level at which there are no statistically and biologically significant increasesin the frequency or severity of adverse effects between the exposed population and itsappropriate control . Some effects may be produced at this level, but they are notconsidered as adverse, nor immediate precursors to specific adverse effects . In anexperiment with several NOAELs, the assessment focus is primarily on the highest one fora given critical effect, leading to the common usage of the term NOAEL as the highestexposure without adverse effect .
Portal-of-Entry Effec tA local effect produced at the tissue or organ of first contact between the biological systemand the toxicant .
Regional Deposited Dose (RDD)The deposited dose (mg/cm2 of respiratory tract region surface area per minute) ofparticles calculated for the respiratory tract region of interest (r) as related to the observedtoxicity (e .g., calculated for the tracheobronchial region for an adverse effect in theconducting airways) .
Regional Gas Dose (RGDr)The gas dose (mg/cm2 of respiratory tract surface area per minute) calculated for therespiratory tract region of interest (r) as related to the observed toxicity (e .g ., calculatedfor the tracheobronchial region for an adverse effect in the conducting airways) .
Regional Deposited Dose Ratio (RDDRr)The ratio of the deposited dose in a respiratory tract region (r) for the laboratory animalspecies of interest (RDDA) to that of humans (RDDH) . This ratio is used to adjust theobserved particulate exposure effect level for interspecies dosimetric differences .
xxix

p. 29
Regional Gas Dose Ratio (RGDRr)
The ratio of the deposited gas dose in a respiratory tract region (r) for the laboratory
animal species of interest to that of hum ans. This ratio is used to adjust the observed gasexposure level for interspecies dosimetric differences .
Reserve VolumeVolume of air remaining in the lungs after a maximal expiration .
Residual Volume (RV)The lung volume after maximal expira tion (TLC - VC) .
Respiratory BronchioleNoncartilagenous airway with lumen open along one side to alveoli ; when walls arecompletely alveolarized it is usually referred to as an alveolar duct. Essentially absent in
rats .
Stokes' LawThe total drag force or resistance of the medium due to fluid mo tion relative to the particle
is the sum of form and friction drag. When particle mo tion is described by this equation,it is said to be in the Stokes regime .
Subchronic ExposureMul tiple or con tinuous exposures occurring for approximately 10% of an experimentalspecies lifetime, usually over 3 mo .
Terminal BronchioleNoncartilagenous airway that conducts airstream to respiratory bronchiole .
ThresholdThe dose or exposure below which a significant adverse effect is not expected .Carcinogenicity is thought to be a nonthreshold endpoint, thus, no exposure can be
presumed to be without some risk of adverse effect . Noncancer toxic health effects arepresumed to have threshold endpoints, thus, some exposures are presumed to be withoutrisk of adverse effects .
Tidal Volume (VT)Volume of air inhaled/exhaled du ring normal breathing .
Total Lung Capacity (TLC)The lung volume at maximal inspiration.
xxx
p. 30
Uncertainty Factor (UF)One of several, generally 3- to 10-fold factors, used in operationally deriving theinhalation reference concentra tion (RfC) from experimental data. UFs are intended toaccount for (1) the variation in sensitivity among the members of the hum an population,(2) the uncertainty in extrapolating laboratory animal data to humans, (3) the uncertainty inextrapolating from data obtained in a study that is of less-than - lifetime exposure, (4) theuncertainty in using LOAEL data rather th an NOAEL data, and (5) the inabi lity of anysingle study to adequately address all possible adverse outcomes in human s . The RfCmethods use 3 for the UF for interspecies extrapolation due to the incorporation of defaultdosimetric adjustments .
Vital Capacity (VC)The maximum volume that can be exhaled in a single breath (TLC - RC) .
xxxi
p. 31
1 . INTRODUCTION AND OVERVIEW
This document describes the U .S . Environmental Protection Agency (EPA)
methodology for estimation of inhalation reference concentrations (RfCs) (earlier terminology
was "inhalation reference dose" or "RfDi") as benchmark estimates of the quantitative dose-
response assessment of chronic noncancer toxicity for individual inhaled chemicals .
Noncancer toxicity refers to adverse health effects other than cancer and gene mutations .
This overview chapter discusses general principles of dose-response assessment for noncancer
toxicity, the development of the RfC methodology, and its role within the context of the risk
assessment process . Subsequent chapters of the document discuss criteria and information to
be considered in selecting key studies for RfC derivation, provide an overview of the
respiratory system and its intra- and interspecies variables, and discuss areas of uncertainty
and data gaps in relation to the proposed methodology .
1.1 INHALATION REFERENCE CONCENTRATION:DEVELOPMENT, DEFINITION, AND DERIVATIO N
The EPA has a history of advocating the evaluation of scientific data and calculation of
Acceptable Daily Intake (ADI) values for noncarcinogens as benchmark values for deriving
regulatory levels to protect exposed populations from adverse effects . For example, the
Office of Pesticide Programs has long used the concept of ADI for tolerance estimates of
pesticides in foodstuffs, the Office of Health and Environmental Assessment (OHEA) has
used ADI values for characterizing levels of pollutants in ambient waters (Federal Register,
1980), and the National Research Council (1977, 1980) has recommended the ADI approach
to characterize levels of pollutants in drinking water with respect to human health .
In 1983, the National Academy of Sciences (NAS) published a report entitled "Risk
Assessment in the Federal Government : Managing the Process" (National Research Council,
1983). The NAS had been charged with evaluating the process of risk assessment as
performed at the federal level in order to determine the "mechanisms to ensure that
government regulation rests on the best available scientific knowledge and to preserve th e
1-1
p. 32
integrity of scientific data and judgements" so that controversial decisions regulating chronic
health hazards could be avoided . The NAS recommended that the scientific aspects of risk
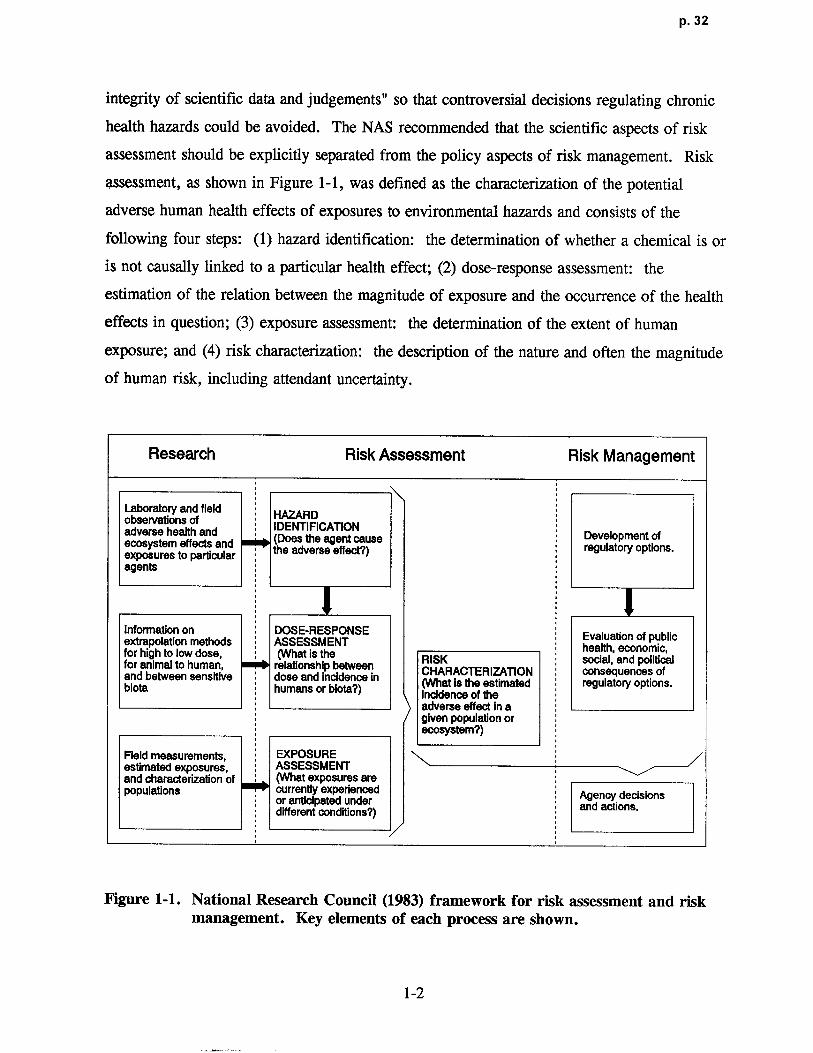
assessment should be explicitly separated from the policy aspects of risk management . Risk
assessment, as shown in Figure 1-1, was defined as the characterization of the potential
adverse human health effects of exposures to environmental hazards and consists of the
following four steps : (1) hazard identification: the determination of whether a chemical is or
is not causally linked to a particular health effect ; (2) dose-response assessment : the
estimation of the relation between the magnitude of exposure and the occurrence of the health
effects in question ; (3) exposure assessment: the determination of the extent of human
exposure; and (4) risk characterization : the description of the nature and often the magnitude
of human risk, including attendant uncertainty .
Research Risk Assessment Risk Management
Laboratory and field HAZARDobservations of IDENTIFICATIONadverse health and(Does the agent cause Development ofecosystem effects and the adverse effect?) regulatory options.
exposures to parti cularagents
Information on DOSE-RESPONSE Evaluation of publicextrapolation methods ASSESSMENT health, economic,for high to low dose, (What is the RISK social, and politicalfor animal to human, relationship between CHARACTERIZATION consequences ofand between sensitive dose and incidence inbiota humans or biota?) (What is the estimated regulato ry options.
Incidence of th eadverse effect in agiven population orecosystem?)
Field measurements, EXPOSUR Eestimated exposures, ASSESSMEN Tand characterizationof (What exposures arepopulations currentlyexperienced Agency decisionsor anticipated under and acti ons .different conditions?)
Figure 1-1 . National Research Council (1983) framework for risk assessment and riskmanagement. Key elements of each process are shown .
1-2

p. 33
Following the NAS report, the EPA developed a methodology for evaluating availabl e
data pertaining to xenobiotics for purposes of developing oral reference doses (RfDs) (Barnes
and Dourson, 1988). Although similar to ADIs in intent, RfDs were based upon a more
rigorously defined methodology that adhered to the principles proposed by the NAS and
included guidance on the consistent application of uncertainty factors for prescribed areas of
extrapolation required in the operational derivation . The RfD methodology represents a
quantitative approach to assess toxicity data in order to derive a dose-response estimate .
According to the NAS paradigm, the final step of the risk assessment process, risk
characterization, would involve the comparison of the RfD as a dose-response estimate with
an exposure estimate .
The RfC methodology to estimate benchmark values for noncancer toxicity of inhaled
chemicals significantly departed from the RfD approach . The same general principles were
used, but the RfC methodology was expanded to account for the dynamics of the respiratory
system as'the portal of entry . The major difference between the two approaches, therefore, is
that the RfC methodology includes dosimetric adjustments to account for the species-specific
relationships of exposure concentrations to deposited/delivered doses . The physicochemical
characteristics of the inhaled agent are considered as key determinants to its interaction with
the respiratory tract and ultimate disposition . Particles and gases are treated separately, and
the type of toxicity observed (respiratory tract or toxicity remote to the portal-of-entry)
influences the dosimetric adjustment applied .
An inhalation reference concentration (RfC) is defined as an estimate (with
uncertainty spanning perhaps an order of magnitude) of a continuous inhalation
exposure to the human population (including sensitive subgroups) that is likely to be
without appreciable risk of deleterious noncancer health effects during a lifetime.
The derivation of any dose-responsel estimate, such as the RfC, to predict the potential
for noncancer toxicity of a chemical requires evaluation of the data array, defined as the
toxicity profile of adverse effects observed at the different levels tested among the available
lAlthough the strict definitions of "dose", "response", and "effect" are recognized and discussed explicitly inSection 1 .2 ., the conventions of the NAS paradigm will be used in this document, with the RfC being synonymouswith a "dose-response" assessment. Therefore, in the broader sense, the term "dose" may encompassadministered dose (i .e ., exposure concentration), delivered dose, or target tissue dose . Likewise, "response" inthe general sense, is an indication of an adverse influence regardless of whether the data were measured asquantal, count, continuous, or ordered categorical .
1-3
p. 34
data . A challenging aspect of this evaluation is that across the available data, often different
effects are measured in the same tissue; different endpoints are investigated in some studies ;
different species are used in various studies ; and each investigation may or may not b e
performed at exposure concentrations that coincide with others . The effects measured may or
may not represent different and/or unequivocal degrees of severity or adversity within disease
continuums . The dose-response estimate must represent a synthesis of this entire array of
data. Therefore, the evaluation of this data array and choice of data on which to base the
operational derivation of a dose-response estimate are critical and require somewhat
sophisticated toxicological judgment .
In the simplest terms,2 the RfC derivation begins with the identification of a
no-observed-adverse-effect level (NOAEL) and a lowest-observed-adverse-effect level
(LOAEL), which are determined for the specified adverse effect from the exposure levels of a
given individual study on the various species tested . The NOAEL is the highest level tested
at which the specified adverse effect is not produced and is therefore, by definition, a
subthreshold level (Klaassen, 1986) . This NOAEL/LOAEL approach, is also a function of
the exposure levels used in the experimental design or is the function of designating a
specified health effect measure (e .g ., 10% incidence of a lesion) in the case of some
alternative modeling approaches, and thus, does not necessarily reflect the "true" biological
threshold .
The RfC methodology requires conversion by dosimetric adjustment of the NOAELs
and LOAELs observed in laboratory animal experiments or in human epidemiological or
occupational studies to human equivalent concentrations (HECs) for ambient exposure
conditions . These conditions are currently assumed to be 24 h/day for a lifetime of 70 years .
The dosimetric conversion to an HEC is necessary before the different adverse effects in the
data array can be evaluated and compared .
Definition of an HEC may be viewed as a naive presumption . However, because the
methodology acknowledges that accurate dose-response relationships depend on the degree to
which state-of-the-art research has achieved understanding and characterization of the
2As discussed in Appendix A, there are alternative approaches under development aimed at deriving estimates ofexposures that are analogous in intent to the establishment of a NOAEL . The NOAEL/LOAEL approach outlinedhere is not intended to discourage alternative or more sophisticated dose-response procedures when sufficient dataare available, but rather to present key issues involved in any approach for the assessment of noncancer toxicity .
1-4
p. 35
exposure-dose-response continuum and will therefore be revised accordingly, it must be
recognized that the definition of HEC is iterative and dynamic as well . That is, the HEC is a
concentration back-extrapolated from an appropriate surrogate internal dose to the extent that
this has been defined .
Although it is preferable to use human studies as the basis for the dose-response
derivation, adequate human data are not always available, often forcing reliance on laboratory
animal data . Presented with data from several animal studies, the risk assessor first seeks to
identify the animal model that is most relevant to humans, based on comparability of
biological effects using the most defensible biological rationale ; for instance, by using
comparative metabolic, pharmacokinetic, and pharmacodynamic data. In the absence of a
clearly most relevant species, however, the most sensitive species is used as a matter of
science policy at the EPA . For RfCs, the most sensitive species is designated as the species
that shows the critical adverse effect at an exposure level that, when dosimetrically adjusted,
results in the lowest HEC .
The critical toxic effect used in the dose-response assessment is generally characterized
by the lowest NOAEL[HEC] that is also representative of the threshold region (the region
where toxicity is apparent from the available data) for the data array . The objective is to
select a prominent toxic effect that is pertinent to the chemical's key mechanism of action .
This approach is based, in part, on the assumption that if the critical toxic effect is prevented,
then all toxic effects are prevented (see Section 1 .2, general principles of dose-response
assessment for noncancer toxicity) . The determination of the critical toxic effect from all
effects in the data array requires toxicologic judgment because a chemical may elicit more
than one toxic effect (endpoint) in tests of the same or different exposure duration, even in
one test species . Further, as discussed in Appendix A, the NOAEL and LOAEL obtained
from studies depend on the number of animals or subjects examined and on the spacing of the
exposure levels. The NOAEL [ HEC] from an individual study (or studies) that is also
representative of the threshold region for the overall data array is the key datum synthesized
from an evaluation of the dose-response data . Determination of this critical effect represents
the first scientific evaluation required by the RfC dose-response assessment .
The RfC is an estimate that is derived from the NOAEL[HECI for the critical effect by
consistent application of uncertainty factors (UFs) . The UFs are applied to account fo r
1-5

p. 36
recognized uncertainties in the extrapolations from the experimental data conditions to an
estimate appropriate to the assumed human scenario . Determination of which UFs to apply
and the magnitude of each represents the second scientific evaluation required by an RfC
dose-response assessment. The standard UFs applied are those for the following
extrapolations (as required) : (1) effects in average healthy humans to sensitive humans ,
(2) laboratory animal data to humans, (3) studies of subchronic to chronic duration ,
(4) a LOAEL [HECI to a NOAELIHECI, and (5) an incomplete to complete data base. The
UFs are generally an order of magnitude, although incorporation of dosimetry adjustments or
other mechanistic data has routinely resulted in the use of reduced UFs for RfCs . The typical
reduced UF is three or one-half log10 (i .e., 10-5). The composite UF applied to an -RfC will
vary in magnitude depending on the number of extrapolations required . An RfC will not be
derived when use of the data involve greater than four areas of extrapolation . The composite
UF when four factors are used is generally reduced from 10,000 to 3,000 in recognition of
the lack of independence of these factors . An additional modifying factor (MF) may also be
applied when scientific uncertainties in the study chosen for operational derivation are not
explicitly addressed by the standard UFs . For example, an MF might be applied to account
for a statistically minimal or inadequate sample size or for poor exposure characterization .
Thus, notationally, the RfC is defined as
RfC = NOAEL*[HECI / (UF X MF), (1-1)
where:
NOAEL*[HEC I = The NOAEL or analogous effect level obtained with an alternate
approach as described in Appendix A, dosimetrically adjusted to a
human equivalent concentration (HEC) ;
UF = Uncertainty factor(s) applied to account for the extrapolations required from the
characteristics of the experimental regimen ; and
MF = Modifying factor to account for scientific uncertainties in the study chosen as the
basis for the operational derivation .
1-6

p. 37
Confidence levels of high, medium, or low are assigned to the study used in the
operational derivation, to the overall data base, and to the RfC itself. Confidence ascribed to
the RfC estimate is a function of both the confidence in the quality of the study and
confidence in the completeness of the supporting data base together, with the data base
confidence taking precedence over that assigned to the study . High confidence in the RfC is
an indication that the data base included investigation of a comprehensive array of nonc ancer
toxicity endpoints established from studies of chronic duration in va rious mammalian species
and that the study (or studies) estab lished an unequivocal NOAEL. Therefore, a high
confidence RfC is not likely to change substantially as more data become available, wi th the
exception of additional mech anistic data or sophisticated tests that may change the perspective
of the evaluation . Low confidence in an RfC is usually applied to a derivation that is based
on several ex trapolations and indicates an estimate that may be especially vulnerable to
change if additional data become available . For some chemicals, the data base is so weak
that the derivation of a low confidence RfC is not possible (see Section 4.1 for minimum data
base criteria) . In such cases, the data base supporting an RfC for a chemical is designated as
"not-verifiable" . Upon the availability of new data, this not-verifiable status would be
reevaluated .
It must be emphasized that the RfC as a qu antitative dose-response estimate is not
numeric alone. As risk assessments have become a more prevalent basis for decision-making,
their scientific quality and clarity of presentation have gained unprecedented importance
(American Industrial Health Council, 1989) . Due to the complexity of many risk
assessments, desirable attributes include the explicit treatment of all relevant information and
the expression of uncertainty in each element (i .e., hazard identification, dose-response
assessment, exposure assessment, risk characterization) . Any dose-response assessment, such
as the RfC, has inherent uncertainty and imprecision because the process requires some
subjective scientific judgment, use of default assumptions, and data extrapolations .
A complete dose-response evaluation should include communication of the rationale for data
selection, the strengths and weaknesses of the data base, key assumptions, and resultant
uncertainties (Habicht, 1992 ; American Industrial Health Council, 1989, 1992 ;
U.S . Environmental Protection Agency, 1984a) . The rationale for the choice of the data
from which the RfC is de rived, a discussion of data gaps, and the result ant confidence in the
1-7

p. 38
RfC are all outlined in the summary of the RfC entered on the EPA's Integrated Ris k
Information System (IRIS) . A discussion and rationale for the UFs used in the RfC
derivation are also provided . This information is an important part of the RfC and must be
considered when evaluating the RfC as a dose-response estimate, in addition to assumptions
and resultant uncertainties inherent in an exposure assessment, when attempting to integrate
the assessments into a risk characterization .
In summary, the RfC methods presented herein were developed based on the NAS 1983
framework and are in keeping with the recent NAS report on science and judgement in risk
assessment (National Research Council, 1994) . Default options for derivation of NOAELs
and LOAELs and for dosimetric adjustments of particle or gas exposures are presented .
Principles for modifying and departing from these default options are also provided . The
methods represent the currently available science . Uncertainty factors are utilized that allow
for RfC derivation in the absence of some data, but the UF and confidence statements
explicitly call out prescribed areas of extrapolation in order to communicate data gaps . For
example, a UF is used to account for intraindividual variability, an area identified by the
NAS as one requiring additional data to more accurately characterize susceptibility of
subpopulations .
1 .2 GENERAL PRINCIPLES OF DOSE-RESPONSE ASSESSMENTFOR NONCANCER TOXICITY
Noncancer toxicity refers to adverse health effects or toxic endpoints, other than cancer
and gene mutations, that are due to the effects of environmental agents on the structure or
function of various organ systems . These effects include those on the tissue where the
chemical enters the body, such as the respiratory tract for inhaled agents, and also effects that
follow absorption and distribution of the toxicant to a site remote to its entry point . Most
chemicals that produce noncancer toxicity do not cause a similar degree of toxicity in all
organs, but usually demonstrate major toxicity to one or two organs . These are referred to as
the target organs of toxicity for that chemical .
Empirical observation generally reveals that as the dose of a toxicant is increased, the
toxic response also increases . "Response", in the context of the RfC methodology discussion
1-8

p. 39
may be the degree or severity of an effect in an individual or the fraction of a populatio n
responding . A distinction is sometimes made between response and effect as different
measurements . Effects are graded and measured ; whereas responses are quantal and counted
(O'Flaherty, 1981) . The distinction is necessary in order to determine an appropriate
mathematical or statistical model for analysis . For dichotomous responses, model estimates
describe probabilities of events in individuals. These probabilities can also be thought of as
the fraction of a population that will show the response . For continuous effects, models
estimate expected changes in individuals . These expected changes can be expressed as shifts
in population means . For practical and sound conceptual reasons, responses and effects can
be considered to be identical (Klaassen, 1986) . That is, in a qualitative sense when-trying to
ascertain if a toxic agent exerts an adverse influence, the distinction is unimportant . It is
recognized that the distinction must be carefully applied when employing mathematical
models to calculate estimates .
The importance of understanding the relationship between concentration (applied dose)
and response has been established in the theory and practice of toxicology and pharmacology .
Dose-response behavior is exemplified by the following types of data : (1) quantal responses
(dichotomous), in which the number of responding individuals in a population increases as a
function of dose (e .g ., number of animals with a specified effect at each exposur e
concentration) ; (2) count responses, in which the number of measured events increases as
dose is increased (e .g., number of lesion foci in tissue) ; (3) dose-graded responses (ordered
categorical), in which the severity of the toxic response within an individual or system
increases with dose (e .g ., pathology graded from mild to severe); and (4) continuous
responses, in which changes in a biological parameter (e.g., organ weight, nerve conduction
velocity) vary with dose .
Classic toxicology texts and the NAS framework for risk assessment refer to dose-
response assessment as the process of estimating an expected response at various exposure
levels (i .e., the response at various applied dose levels or exposure concentrations) . Because
tissue dose of the putative toxic moiety for a given response is not always proportional to the
applied dose of a compound, emphasis has recently been placed on the need to clearly
distinguish between exposure concentration and dose to critical target tissues . The term
"exposure-dose-response assessment" has been recommended as more accurate an d
1-9

p. 40
comprehensive (Andersen et al ., 1992) . This expression refers not only to the determination
of the quantitative relationship between exposure concentrations and target tissue dose, but
also to the relationship between tissue dose and the observed/expected responses in laboratory
animals and humans.
As shown in Figure 1-2, the process of determining the exposure-dose-response
continuum is achieved by linking the mechanisms or critical biological factors that regulate
the occurrence of a particular process and the nature of the interrelationships among these
factors (Andersen et al ., 1992) . Although the mechanisms of interaction at the molecular
level are very different from the mechanisms involved at the population level, in each case
they refer to biological determinants that control the responses at the- respective level of
organization. This figure illustrates that the exposure-dose-response continuum evolves from
protective to predictive as more information becomes available on mechanisms and toxic
events. Dose-response assessment estimates based on characterization at the first "black box"
level necessarily incorporate large uncertainty factors to ensure that the estimates are
protective in the presence of data gaps, which are often substantial . With each progressive
level, incorporation and integration of mechanistic determinants allow elucidation of the
exposure-dose-response continuum and thus, a more accurate characterization of the
pathogenesis process . Although utilization of these data reduces uncertainty in the
dose-response assessment (thus allowing it to be more predictive in nature), in reality, there
will always be some degree of uncertainty .
As this comprehensive continuum is characterized, mechanistic determinants of chemical
disposition, toxicant-target interactions, and tissue responses are integrated into an overall
model of pathogenesis . The three proposed stages in the continuum between exposure and
response are similar to the previously described division of "pharmacokinetics" versus
"pharmacodynamics" . Pharmacokinetics was defined to encompass processes relating
exposure to consequent tissue doses, whereas pharmacodynamics encompassed processes that
determined response to the tissue dose . This comparison to the two traditional areas of
investigation is offered only as a context for the new terminology because any divisions are
artificial and a reflection of the degree of understanding of events in the pathogenesis process .
1-10

p. 41
Chemical Rpose° ToxicologicalExposure ► ► ResponseConcentration
Protec tive QualitativeExposure ► ~ ► Respons e
Default
Exposure ► Tlssues
)0, ResponseMechanisms Doae
Disposition Models
Exposure ► ~1e ► T~t ► Response
~e Irnerealon
Mechanisms Mechanisms
Disposition Models Toxdcant-Tarpet Models
Exposure ► Tlasue ►k
► Respons
e MechanismsMechanisms Mechanisms
Predictive Disposition Toxdc~nt- Targ~els Tissue Response Models Quantitative
Figure 1-2 . Schematic characterization of comprehensive exposure-dose-responsecontinuum and the evolution of protective to predictive dose-responseestimates .
Adapted from Conolly (1990) and Andersen et al . (1992) .
Disposition includes deposition, absorption, distribution, metabolism, and elimination of
chemicals . Mathematical models of the mechanistic determinants of the disposition of a
parent compound and/or its metabolites, such as physiologically based pharmacokinetic
(PBPK) or dosimetry models, have been useful in describing the relationships between
exposure concentration and target tissue dose (Overton, 1984 ; Andersen et al ., 1987a) .
These disposition models can be linked to other models that address the mechanistic
determinants of the toxicant-target tissue interaction and tissue response, respectively . These
latter models refine the designation of response . The tissue dose is linked to determinants of
target-tissue interaction, (e .g., critical mechanistic events such as cytotoxicity and rebound
1-11
p. 42
cellular proliferation), which, in turn, may then be related via other mechanisms to the
ultimate production of lesions or functional changes that are typically defined as the disease
(pathogenesis) outcome. To the extent that these events are explanatory of the disease
outcome, they can be used to quantitate important nonproportionalities or as replacement
indices of the response function . It is important to emphasize that the integration of the
mechanistic determinants may not necessarily be achieved by linking respective models in a
series (i .e., the output of one model becomes input to the next) but may require simultaneous
solution (e .g., the mechanistic determinants of disposition are dynamically related "moment-
by-moment" to mechanisms of toxicant-target interaction) . Eventually, causality of the
critical mechanistic toxic effect can be correlated to the internal toxic moiety as the dose
surrogate, rather than relating the exposure concentration to the "black box" of the organism
within a population . It should also be recognized that the history of toxicology shows that
the discovery of a mechanism of toxicity is often accompanied by the identification of a new
or more refined uncertainty . In spite of such knowledge dynamics, expanding the envelope
of "knowns" clearly improves quantitative dose-response assessment, while creating more
challenges to continue to define unknowns.
Predictive dose-response estimates are desired in order to increase the accuracy of the
estimates and eliminate attendant uncertainties . An advantage to the iterative process of
characterizing the exposure-dose-response continuum is that the models used to describe the
pathogenesis process are dynamic and can be updated by additional data and/or changes in
understanding of the process . As will be seen in later chapters, dosimetry and PBPK models
not only are considered the optimal approach for extrapolation of dose across species, but
also have provided insight on important mechanistic determinants that have been utilized in
the default dosimetry adjustments applied to RfC derivation .
Since the dosimetric adjustments incorporate mechanistic determinants of disposition,
they can be applied, after consideration of underlying assumptions described herein, to
adjustment of other inhalation exposures (e .g., acute exposures) or toxicity (e.g., cancer) .
The framework evaluating alternative model structures would also be applicable .
Although RfCs are expressed as exposure concentrations so that units are comparable to
those of exposure assessment estimates, it must be emphasized that the RfC exposure
concentrations are back-extrapolated and based on target tissue dose and/or critica l
1-12
p. 43
mechanistic effects, to the extent possible . As more data become available and understanding
of the pathogenesis process changes, changes in the dose-response es timate are anticipated .
Generally, based on understanding homeosta tic and adaptive mechanisms, most dose-
response assessment procedures operationally approach noncancer health effects as though
there is an identifiable threshold (both for the individual and for the population) below which
effects are not observable. However, it is recognized that there are inherent difficul ties in the
identification of population thresholds (Gaylor, 1985) . For example, although each National
Ambient Air Quality Standard (NAAQS) is based on noncancer toxicity, not one is based on
a threshold . This is likely the result of the extensive nature of the data base and the
investigation of the effects in iden tified sensitive subpopulations that support each of the
NAAQS . That is, the operational iden tification of a threshold is a func tion of the available
data and current understanding of the exposure-dose-response con tinuum, which may be
revised as more information such as data from studies encompassing addi tional endpoints or
more sensitive indicators of toxicity, such as mech anistic determinants, are developed and
evaluated .
For an individual, the threshold concept presumes that a range of exposures from zero
to some finite value can be tolerated by the organism without adverse effects . As an
example, there could be a large number of cells that perform the same or similar func tion
whose population must be significantly depleted before an adverse effect is seen . This
threshold will vary from one individual to another, so that there will be a distribu tion of
thresholds in the population. Because sensitive subpopulations (i .e ., those individuals with
low thresholds) are frequently of conce rn in setting exposure standards, risk-assessment
efforts are aimed at estimating levels at which these sensitive individuals would not be
expected to respond .
The identification of a threshold currently distinguishes approaches for noncancer
toxicity assessment from those for carcinogenic endpoints, which dose-response assessment
procedures typically approach as resul ting from nonthreshold processes . However, it should
be noted that as the exposure-dose-response continuum described above is characterized better
for both certain carcinogens and noncarcinogens, knowledge of the mech an istic determinants
may blur this distinc tion between approaches for noncancer toxicity and carcinogenicity .
As mentioned above, consideration of dosimetry determin ants are applicable regardless of
1-13

p. 44
toxicity endpoint . The EPA guidelines for cancer assessment are undergoing revision, and an
issue under review is how to incorporate mechanistic data (Federal Register, 1988a) .
1.3 GUIDELINES ON SPECIFIC ENDPOINT S
As mentioned, one of the major challenges to performing dose-response assessment for
noncancer endpoints is that it requires the evaluation of effects measured in a number of
different tissues . Often different endpoints are investigated in different studies, in different
species, and at various concentrations . The effects measured may represent different degrees
of severity or adversity within disease continuums . Individual studies must be evaluated for
their usefulness for quantitative assessment, which will be discussed in Chapter 2 . The
available information then must be synthesized into an assessment of the dose-response for
noncancer toxicity based on the entire array of data . The overall data array analysis and
integration of data are a critical aspect of the RfC methodology and are discussed in
Chapter 4 (Section 4 .3 .7) .
In order to promote technical quality and consistency in risk assessment, guidelines have
been developed on how to evaluate toxicity data for cancer and a number of different
noncancer endpoints, how to evaluate mixtures (U.S. Environmental Protection Agency,
1987), and how to perform an exposure assessment (Federal Register, 1992a) . Guidelines
have also been promulgated for the evaluation of developmental toxicity (Federal Register,
1991) and proposed for the evaluation of female and male reproductive toxicity (Federal
Register, 1988b,c) . Guidelines under development for other noncancer endpoints include
those for neurotoxicity, immunotoxicity, and respiratory tract effects .
The historical and conceptual development of the guidelines and their role in the EPA
have been discussed elsewhere (U .S. Environmental Protection Agency, 1987 ; Jarabek and
Farland, 1990) . Within the context of the RfC methodology, these guidelines present key
considerations and approaches to the evaluation of data within an individual endpoint to arrive
at a dose-response estimate . Therefore, the RfC methodology will look to the guidelines on
individual endpoints for ways to consider the data, organize the data, and conduct a dose-
response assessment . The RfC methodology then provides guidance on how to approach th e
1-14

p. 45
synthesis of the resultant dose-response estimate with estimates for other noncancer endpoints
to arrive at an overall dose-response estimate for the data array .
1 .4 USE OF THE INHALATION REFERENCE CONCENTRATION INTHE NATIONAL ACADEMY OF SCIENCES RISK ASSESSMENTAND RISK MANAGEMENT PARADIGM
As discussed earlier, the 1983 NAS report on risk assessment in the federal government
recommended that the scientific aspects of risk assessment should be explicitly separated from
the policy aspects of risk management . The RfC approach described here represents one
component of the risk assessment process, the dose-response component, and as such must be
compared against an exposure estimate in order to characterize risk. The attendant
uncertainties and default assumptions of the RfC estimate should be evaluated in context with
those of the exposure estimate (e.g ., averaging time of the measured exposure, exposure
pattern, particle size) to ascertain whether the two are appropriate to integrate . The explicit
treatment of all such relevant information and resultant uncertainties is a requisite for any
final risk characterization . One of the uncertainties that needs to be considered when
comparing an RfC to an exposure estimate is the "order-of-magnitude" imprecision of the
RfC itself, as stated in the definition of the RfC . From a purely mathematical viewpoint, this
refers to a log 10 around the RfC (i .e., 3-fold above and below) . However, such uncertainty
is not purely mathematical, but rather is an expression of the difficulty in translating a data
base (which is often very limited) into a single number that is thought to represent a relatively
safe exposure . This discussion is not intended to be a complete presentation on the use of
RfCs. Rather, it expresses a few of the issues that require consideration and illustrates that
simplistic comparisons of one dose-response value to one exposure value may be inadequate
to precisely represent risk characterization .
The EPA recognizes that regional, state, and local health protection departments need
uniform and scientifically sound procedures for the calculation of benchmark inhalation dose-
response estimates . The proliferation of diverse risk assessment values for inhalation
exposure and the resulting confusion this has caused attests to the importance of a consistent
approach. It is the intention of the EPA that the RfC approach described will be useful to
many in performing dose-response assessments as one piece of the risk assessment process .
1-15

p. 46
1 .5 OCCUPATIONAL EXPOSURE LIMITS VERSUS INHALATIO NREFERENCE CONCENTRATION S
Occupational exposure limit (OEL) is a generic term used to denote a variety of
standards that usually reflect a documented body of toxicological, epidemiological, and
clinical information pertaining to hum an exposure to airborne contaminants. Due to their
derivation methods, attendant assumptions, and intended application, they represent risk
management values, and this distinction with the RfC as a dose-response estimate must be
emphasized .
Occupational exposure limits have often been chosen by organ izations for their risk
management programs because they are available for nearly 700 pollut an ts . The OELs
include the Occupational Safety and Health Administration Permissible Exposure Limits
(PELs) or full text standards, the National Institute of Occupational Safety and Health
Recommended Standards, and the Ame rican Conference of Governmental Industrial
Hygienists (ACGIH) threshold limit values (TLVs). The OELs differ among themselves in
regard to the philosophy of the sponso ring organization, legal m andate, objectives,
assumptions, and evaluation of scientific data . They share the common elements of the
evaluation of effects due to inhalation exposure and the goal of protection of human health .
The OELs are generally time-weighted average concentrations of airborne substances to
which a healthy worker can be exposed during defined work periods and under specific work
conditions throughout a working lifetime, without mate rial impairment of health .
An important underlying assumption of most OELs is a workplace setting in which indust rial
hygienists are able to control the environments . Therefore, the OEL can represent, in part , a
risk management decision that considers nonhealth issues such as the technological feasibility
of control measures and analytical detection limits . Some OELs, such as the ACGIH TLV,
also reflect the cost of controlling exposure levels . The appropriateness of some of these
assumptions and extenuating considerations to the application of deriving ambient air levels
for pollution control have been discussed elsewhere (Jarabek and Segal, 1994) .
A number of these same assumptions and considerations preclude the use of OELs
directly for the derivation of RfCs. The OELs often are not based on chronic effects and
may differ from RfCs in severity of effect . The OELs further assume intermittent exposure
periods of the workplace, whereas RfCs are set to protect against continuous exposure . The
1-16

p. 47
OELs may not incorporate the most current toxicological information because toxicologica l
review is not on a regular basis . Also, the unavailability of unpublished corporate
documentation precludes scientific scrutiny of the primary basis for a number of TLVs
(Castleman and Ziem, 1988). The evaluation of toxicity data by agencies deriving OELs may
differ from that of EPA with respect to weight-of-evidence classification, application of UFs,
and other issues . Finally, the use of OELs is established to protect the average healthy
worker (ages 18 to 65 years) against the adverse effects of inhaled pollutants to which they
are exposed only a fraction of a day (i .e., during a typical 8-h work shift) . Inhalation
reference concentrations, however, are relevant to those of any age and health status and are
aimed at protecting the most sensitive members of the population, assuming long-term
continuous exposures . Therefore, the EPA does not endorse the use of OELs in deriving
RfCs. The OEL data base should be evaluated along with all other data according to the
methodology for RfC derivation . The biological endpoint, quality and nature of the
underlying data sets, the exposure scenarios, and applicability to highly sensitive
subpopulations are among those factors that must be considered for relevance to
nonoccupational exposures .
An issue paper on OEL values, developed by the Inhalation Technical Panel of EPA's
Risk Assessment Forum, discusses the history, use, and limitations of OELs as surrogates for
ambient exposure RfC values (U.S . Environmental Protection Agency, 1990) .
1 .6 PRIMARY NATIONAL AMBIENT AIR QUALITY STANDARDSVERSUS INHALATION REFERENCE CONCENTRATION S
The Clean Air Act requires that NAAQS be set for any ubiquitous air pollutant that, if
present in the air, may reasonably be anticipated to endanger the public health or welfare and
whose presence in the air results from numerous or diverse mobile or stationary sources .
These so-designated pollutants are called criteria pollutants . Primary standards are designed
to protect public health, and secondary standards are designed to protect public welfare (Code
of Federal Regulations, 1991) . The primary NAAQS are solely health-based and designed to
protect the most sensitive group of individuals (but not necessarily the most sensitive
members of that group) against adverse health effects . Therefore, by definition, the primary
1-17

p. 48
NAAQS define allowable pollutant concentrations that can be present in the atmosphere
without causing adverse health effects and represent a complete health risk characterization
according to the NAS risk assessment and risk management paradigm .
This RfC methodology will not be applied to the criteria air pollutants (carbon
monoxide, lead, ozone, nitrogen dioxide, particulate matter, and sulfur dioxide) due to
legislative requirements in the Clean Air Act and major differences in the health data bases of
these pollutants . Development of NAAQS for the criteria pollutants is governed by
Sections 108 and 109 of the Clean Air Act . The health assessment is described more fully
elsewhere (Padgett and Richmond, 1983) and essentially is a scientific process that undergoes
extensive review by the public and the Clean Air Scientific Advisory Committee of EPA's
Science Advisory Board. The determination of adversity and identification of a NAAQS with
an adequate margin of safety is a decision reserved to the EPA Administrator by the Clean
Air Act . This is profoundly different from an RfC in which the determination of adversity
and uncertainty factors are part of the scientific assessment itself. Furthermore, the criteria
air pollutants have extensive health data bases that enable avoiding many of the simplifying
assumptions and default procedures of the RfC methodology . For additional details, refer to
the Code of Federal Regulations (1991a), criteria documents for these chemicals (U.S .
Environmental Protection Agency, 1982a,b,c ; 1984b,c ; 1986a,b,c,d ; 1991 ; 1992; 1993a,b),
and an overview article describing the NAAQS development process (Padgett and Richmond,
1983) .
1.7 STATE-OF-THE-ART APPLICATIONS TO THE DEVELOPMENTOF THE INHALATION REFERENCE CONCENTRATIONMETHODOLOGY
All elements of risk assessment (i .e., hazard identification, dose-response assessment,
exposure assessment, risk characterization) involve some degree of reliance upon assumptions
or extrapolations that substitute for unavailable quantitative information and, by that, impart
varying degrees of uncertainty. Risk assessments ultimately serve as the basis for personal or
governmental risk management decisions on safeguarding health and have consequential
economic impacts . As the state-of-the-art of health risk science progresses, the accuracy of
risk assessments will be improved, insofar as these advancements are incorporated into ris k
1-18
p. 49
assessment procedures . This makes it imperative that, as scientific advancements in relate d
disciplines such as biologically motivated extrapolation modeling are made, they are
appropriately incorporated into the elements of the risk assessment process . The RfC
methodology, as a set of procedures to estimate a dose-response assessment, has inherent
uncertainty and imprecision because the process requires some subjective scientific judgment,
use of default assumptions, and data extrapolations . Therefore, OHEA, Office of Research
and Development, has committed to a regular reevaluation of the scientific advancements in
the field and will continue to make recommendations for significant improvements in the
methodology. Modifications are anticipated on approximately a 2-year basis or as
appropriate . If research advancements having a striking impact on the methodology were to
occur earlier or slightly later, the timing of the process may be altered .
In summary, one objective of the RfC methodology is that it always be scientifically
based, and thus, the methodology should be considered dynamic . Pertinent issues and their
solutions will be incorporated as identified and reviewed for applicability on a continuing
basis . These actions will make the methodology sufficiently reliable to serve as one of the
key bases for decisions on protecting the public health .
1-19

p. 50
2 . QUALITATIVE EVALUATION OF THE DATA BASE
This chapter outlines considerations for the collection and qualitative evaluation of
diverse data into a cohesive toxicity profile that then can be evaluated by means of the
quantitative procedures for dose-response analysis provided in Chapter 4 . The conceptual
basis for the dosimetry adjustments applied to inhaled agents and other considerations specific
to this administration route are addressed in Chapter 3 .
The aim of the inhalation reference concentration (RfC) methodology is to establish a
relationship between a particular agent in the air and a specific health effect (or effects) .
To define such a relationship, evidence must be collected from diverse sources and
synthesized into an overall judgment of health hazard (Hackney and Linn, 1979) . One of the
major challenges to performing dose-response assessment for noncancer endpoints is that it
requires the evaluation of effects measured in a number of different tissues . Often different
endpoints are investigated in different studies, in different species, and at various
concentrations. The effects measured may represent different degrees of severity (adversity)
within disease continuums . Qualitative evaluation of the data base, also known as the hazard
identification component of risk assessment, involves integrating a diverse array of data into a
cohesive, biologically plausible toxicity "picture" or weight-of-the-evidence relationship to
establish that the agent causes an effect (or effects) and is of potential human hazard .
Questions addressed by this process include whether the agent associated with an effect is
responsible for the effect, if the effect is biologically significant, and what the potential
public health implications might be . Answering such questions requires ascertaining the
validity and meaning of the toxicity data, determining whether the experimental results as a
whole suggest or show causality between the agent and the effect, and evaluating whether or
not the causal relationship is applicable under other sets of circumstances (e .g., in
extrapolating from test animals to humans) . This entails consideration of all relevant human
and laboratory animal data of various study types, studies with differing results (e .g ., positive
and negative), pharmacokinetic disposition data (deposition, absorption, distribution,
metabolism, elimination) mechanistic information, and structure-activity relationships . This
process integrates information needed for the dose-response assessment, which is discussed i n
2-1

p. 51
Chapter 4 . Thus, qualitative evaluation of a diverse data base necessitates a systematic
approach for obtaining agreement on the validity, selection, and interpretation of studies to be
used in the quantitative methodological procedures of the dose-response assessment .
2 .1 GUIDELINES FOR SELECTIONS OF KEY STUDIES
Key studies are those that contribute most significantly to the weight of evidence as to
whether or not a particular chemical is potentially hazardous in humans (Barnes and Dourson,
1988) . These studies are of two types: (1) epidemiologic, clinical, or case reports on
humans and (2) experimental studies on animals . Each has unique considerations that will be
addressed separately here. However, whenever the data base permits, the most robust
qualitative evaluation typically involves an integrated interpretation of human and animal
data, taking advantage of the unique strengths of each . Once the key studies demonstrating
the critical toxic effect have been identified, the selection of effect level and the RfC
derivation arises from an objective scientific evaluation of the data array available on the
chemical as described in Chapter 4 .
2.1.1 Human Data
Utilization of human data avoids the necessity of extrapolating from laboratory animals
to humans, thereby decreasing uncertainty in the risk assessment . Human data have often
been useful in developing oral reference doses (RfDs) (Barnes and Dourson, 1988) . There
are significantly more human data on inhalation than on ingestion exposures, however, so that
criteria for evaluating studies and their results need to be stated explicitly, particularly if they
are to be used in a quantitative fashion . Since 1977, when the Clean Air Act identified goals
related to air quality and health, the task of clarifying how population studies can be used for
determining scientifically reasonable standards and how to define an adverse respiratory
health effect has been rigorously debated (Lebowitz, 1983 ; American Thoracic Society, 1985 ;
National Research Council, 1985) . Many of the results from these efforts can be applied as
guidance for the RfC methodology .
Three types of human studies are most often utilized to obtain data pertinent to
understanding the risk of chemicals to humans in order to protect public health :
2-2

p. 52
(1) epidemiologic studies, (2) clinical studies or controlled exposure experiments, and
(3) case reports. In addition, recent advances in molecular epidemiology and physiologically
based pharmacokinetic (PBPK) simulation modeling provide other types of data useful to
evaluating and synthesizing data from these three types of human studies along with
laboratory animal data . When using these studies for risk assessment, several factors are
important in evaluating their quality and in determining the level of certainty associated with
their use . The factors that are most relevant to developing chronic RfCs from human data
relate to biomarkers and epidemiologic studies, which are discussed more fully below .
Clinical studies are typically of acute or short durations and therefore, as such, are less useful
as the basis of an RfC, but can be useful in the development of dosimetric data relevant to
biomarkers .
2.1 .1 .1 Molecular Epidemiology and Biologic Markers
In the early 1980s, the concept of "molecular epidemiology" was developed to describe
an evolving approach to research that attempts to synthesize advanced laboratory methods
with analytical epidemiology (Perera and Weinstein, 1982) . Although originally defined for
cancer, molecular epidemiology can encompass any disease outcome and can provide
important insights and understanding of a wide variety of critical issues in current risk
assessment (Hattis, 1986). The approach is based on the combination of two biologic tenets :
(1) early biologic effects from a toxic exposure are far more prevalent in the population at
risk than the late events of direct (historical) interest such as disease, and may sometimes be
more specific to the exposure than the outcome itself ; and (2) given technological advances,
most xenobiotics can either be directly quantified in the body or indirectly measured by
identification of some predictable, dose-related biologic response (Cullen, 1989) . Thus, once
(prevalent, early) "markers" of effect and (accurate) "markers" of dose can be developed in
the laboratory, human epidemiology could, with appropriate research, proceed without its
prior methodologic constraints ; relative risks are high because the events studied are either
very common among the exposed (i .e., sensitive markers) or very rare among the unexposed
(i .e., specific markers); exposures can be precisely classified by direct measurement and the
lapsed time between first human exposure and an opportunity for study is foreshortened
because endpoints are, by definition, "early" (Cullen, 1989) .
2-3

p. 53
Biologic markers are not new . Markers such as blood lead, mercury levels in hair, an d
urinary metabolites or liver function assays after solvent exposure have long been used in
health research and practice to indicate exposures to or to predict effects of these compounds .
As defined by the National Research Council (NRC) Board on Environmental Studies and
Toxicology, a "biologic marker" is any cellular or molecular indicator of toxic exposure,
adverse health effects, or susceptibility (National Research Council, 1987) . The markers may
represent signals-generally biochemical, molecular, genetic, immunologic, or physiologic-
in a continuum of events between a causal exposure and resultant disease as shown i n
Figure 2-1 .
Exposure Effect
Exposure Internal Biologically Early Altered Clinical Prognosticlip. Dose pp. Effective pp. Biological pp. Structure /jo. Disease 0,. Significance
Dose Effect Function
♦ ♦ ♦ ♦ ♦ ♦ ♦
. . , .
. . ~ . '
~ , . ,
. , . ,
. , . ~~ . , . ~
, . ~ . '
. . ~ , . '
~ . ~ ~ .
. , . ,
. , . .
Susceptibility
Figure 2-1. Biological marker components in sequential progression between exposure
and disease.
Source: Schulte (1989) .
2-4

p. 54
The distinguishing aspect of this paradigm vis-a-vis the previous use of biological
markers is that current technological advances and developments in basic sciences allow for
detection of smaller signals at diverse points in the continuum . Thus, the historical analytic
epidemiology approach for estimating risks by relating exposure to clinical disease (morbidity
and mortality) may be supplemented by a fuller method, one that identifies intervening
relationships more precisely or with greater detail than in the past . As a result, health events
are less likely to be viewed as dichotomous phenomena (presence or absence of disease) but
rather as a series of changes in a continuum from homeostatic adaptation, through
dysfunction, to disease and death (Schulte, 1987, 1989 ; National Research Council, 1991b) .
Significant side benefits of this research modality include : (1) an improvement in the
accuracy of exposure variables ; (2) a contribution to the understanding of underlying
pathogenic mechanisms inherent in the study of events at the molecular, cellular, or tissue
levels; (3) the potential for more accurate and etiologic classifications of environmental
diseases; and (4) the possibility that recognition of early effects could prompt strategies for
secondary prevention or early disease modification (Hulka and Wilcosky, 1988) . Quantitative
consideration of the events in the exposure-dose-disease continuum has implications for dose-
response assessment and could provide insight on how to extrapolate from high to low
exposure levels, the reliability of extrapolation from laboratory species to humans, the
relevance of certain physiologic events to disease outcome, and an index of human
interindividual variation .
The progression from exposure to disease as, shown in Figure 2-1 has been characterized
by a number of authors and scientific committees on the use of biomarkers (Perera, 1987;
Schulte, 1989; National Research Council, 1987, 1991a,b) . It should be pointed out that
components in the progression shown in Figure 2-1 are not necessarily discrete or the only
events in the continuum. There may be a series of other components (steps or stages)
between or in parallel with these that have yet to be discovered (Schulte, 1989) . The
similarity of this paradigm to that presented in Figure 1-2, as proposed by laboratory
toxicologists, is striking and emphasizes the interdisciplinary and collaborative nature that will
be required of future research on disease etiology and of associating causality to events along
the continuum for use in dose-response assessment . Due to the anticipated impact that
biological markers will have on future epidemiologic research and the potential for use o f
2-5

p. 55
such data in health risk assessment, this section will discuss the evolving concepts an d
definitions of biological markers and provide a framework for their validation and use in
dose-response assessment . Methodologic issues and their effect on research design will be
discussed in subsequent sections on the use of epidemiologic and nonepidemiologic data .
It should be noted that many of these considerations are the same for any bioassay, as the
level of sensitivity of the measured effect moves from the macro (e.g., histopathology) to
molecular (e .g., receptor binding) level .
Concepts and Definitions
Because it is important that risk assessors understand the purpose of a given marker,
that is, the reason the marker is being considered and what aspect of the exposure-dose-
disease ("response") association it is supposed to indicate, markers are often classified into
three broad categories: markers of exposure, disease, or susceptibility . It must be
emphasized that this classification depends on the state of knowledge concerning the
mechanistic relationship between the marker and the conditions of exposure, disease, or
susceptibility that the markers represent . Thus, allocation of markers to one or more of three
categories is subjective and could change (National Research Council, 1991b) .
External exposure is defined as the sum amount of the xenobiotic material presented to
an organism, whereas internal dose is the amount actually absorbed into the organism .
An effect is defined as : (1) an actual health impairment or (by general consensus) recognized
disease, (2) an early precursor of a disease process that indicates a potential for impairment
of health, or (3) an event peripheral to any disease process but correlated with it and
therefore predictive of development of impaired health . An intrinsic genetic or other
characteristic or a preexisting disease that results in an increase in the internal dose, the
biologically effective dose, or the target tissue response can be markers of increased
susceptibility (National Research Council, 1987) .
As shown in Figure 2-1, along the progression from exposure in the environment to the
development of clinical disease, four generic component classes of biologic markers can be
delineated: (1) indices of the internal dose, (2) indices of the biologically effective dose ,
(3) early biologic effects, and (4) altered structure and function. Clinical disease can also be
represented by biologic markers for the current disease as well as by markers for prognostic
2-6

p. 56
significance . Internal dose is the amount of xenobiotic substance found in a biologic
medium; the biologically effective dose is the amount of xenobiotic material that interacts
with critical subcellular, cellular, and tissue targets or with an established surrogate target
tissue. A marker of early biologic effect represents an event that is correlated with, and
possibly predictive of, health impairment . Altered structure and function are precursor
biologic changes more closely related to the development of disease . Markers of clinical
disease and of prognostic significance show the presence and predict the future of developed
disease, respectively . . Markers of susceptibility are indicators of increased (or decreased) risk
for any component in the continuum. Even before exposure occurs, there may be biological
differences between humans that cause some individuals to be more susceptible to
environmentally induced disease (National Research Council, 1987,1991a,b) .
A marker may be: (1) an actual measure of an event, such as blood lead to indicate
exposure ; (2) a surrogate for an event, such as creatinine clearance for renal function ;
(3) a correlate of an event, such as DNA adducts to reflect organ-specific exposure ; or
(4) a risk predictor, such as human lymphocyte antigen (HLA) B27 for ankylosing spondylitis
(Schulte, 1989) . Therefore, biological markers are tools that can be used to provide greater
resolution of aspects of exposure-disease associations, that is, to clarify the relationship, if
any, between exposure to a xenobiotic compound and health impairment .
Framework for Validation and Use
Although the development and use of biologic markers is increasing at a rapid rate, the
validity and meaning of many of the markers need to be established before they can be used
as analogous to "exposure" or "disease" in classical epidemiologic research and prior to their
use in quantitative dose-response assessment . The key to relating variables in the exposure-
dose-disease continuum and to validation is agreement on what constitutes a "critical effect" .
A critical effect is the biologic marker deemed most representative of a particular component
in the continuum and ultimately most pathognomonic (Schulte, 1989) . There is a need to
have general agreement on which of these are critical (i .e., indicating some aspect of a
disease response) and which are merely adaptive . This usually requires a series of
independent studies, primarily toxicologic, and then clinical and epidemiologic, as delineated
in Table 2-1 . Knowledge of these steps can be useful in evaluating data that may characterize
2-7
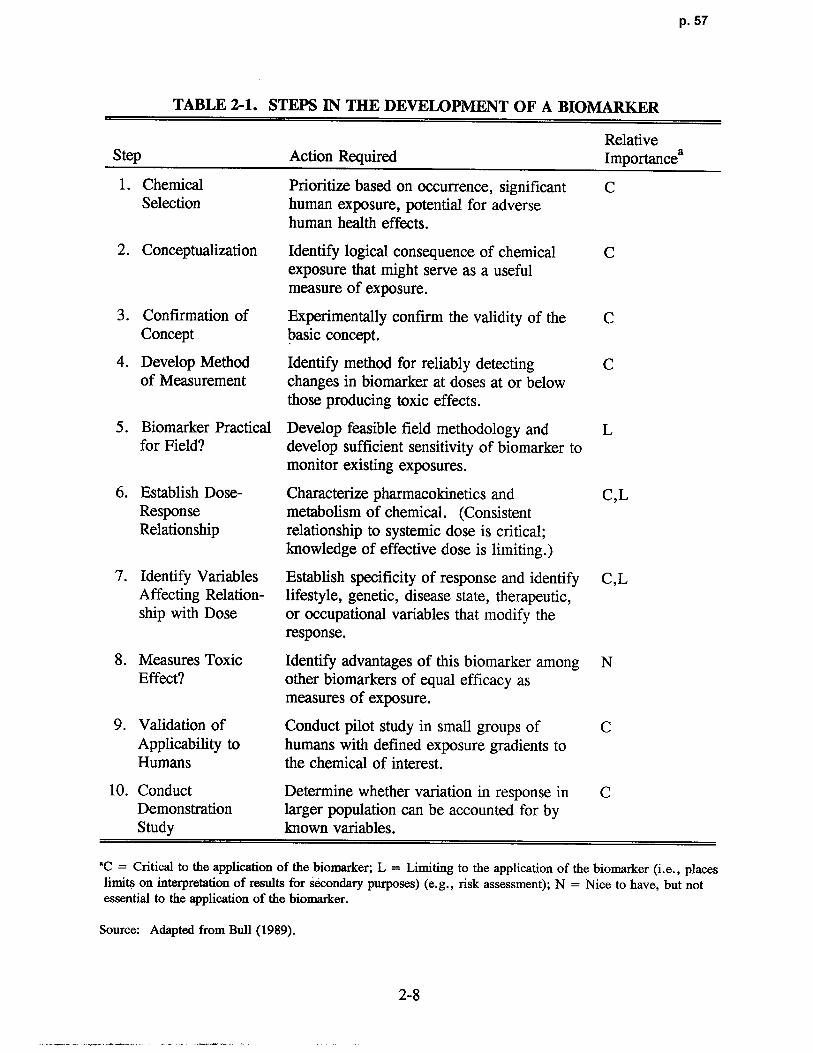
p. 57
TABLE 2-1. STEPS IN THE DEVELOPMENT OF A BIOMARKER
RelativeStep Action Required Importancea
1 . Chemical Prioritize based on occurrence, significant CSelection human exposure, potential for adverse
human health effects .
2. Conceptualization Identify logical consequence of chemical Cexposure that might serve as a usefu lmeasure of exposure .
3 . Confirmation of Experimentally confirm the validity of the CConcept basic concept .
4. Develop Method Identify method for reliably detecting Cof Measurement changes in biomarker at doses at or belo w
those producing toxic effects .
5 . Biomarker Practical Develop feasible field methodology and Lfor Field? develop sufficient sensitivity of biomarker to
monitor existing exposures .
6 . Establish Dose- Characterize pharmacokinetics and C,LResponse metabolism of chemical . (ConsistentRelationship relationship to systemic dose is critical ;
knowledge of effective dose is limiting .)
7. Identify Variables Establish specificity of response and identify C,LAffecting Relation- lifestyle, genetic, disease state, therapeutic ,ship with Dose or occupational variables that modify the
response .
8 . Measures Toxic Identify advantages of this biomarker among NEffect? other biomarkers of equal efficacy as
measures of exposure .
9. Validation of Conduct pilot study in small groups of CApplicability to humans with defined exposure gradients toHumans the chemical of interest .
10. Conduct Determine whether variation in response in CDemonstration larger population can be accounted for b yStudy known variables.
°C = Critical to the application of the biomarker; L = Limiting to the application of the biomarker (i .e., placeslimits on interpretation of results for secondary purposes) (e .g ., risk assessment) ; N = Nice to have, but notessential to the application of the biomarker .
Source: Adapted from Bull (1989) .
2-8

p. 58
biomarkers as surrogates for dose or disease to determine dose-response relationships .
As more causal component associations are identified, it becomes necessary to elucidate
quantitative relationships of the kinetics, natural history, and rates of transition along the
continuum. The hypothesis of the role that the marker has in the disease development shoul d
sustain throughout these refinements . Subsequently, it is necessary to relate critical effects to
dose estimates, to determine what factors affect dose, and to define a no-observed-adverse-
effect level (NOAEL) .
Reliability and Validation
Because biological markers are measurements, they have inherent signals (true effects)
and noise (random errors) . Measurement errors need to be acknowledged and controlled
since failure to do so may lead to a decreased sensitivity due to the lack of reliability in the
measurements, which may lead to systematic biases or correlations toward underestimation, a
need for increased sample size, and bias selection in case-control studies . It is recommended
that a pilot reliability study be performed as standard practice .
The validity of a biologic marker can be viewed in terms of "measurement validity" as
used in epidemiology (Schulte, 1989 ; National Research Council, 1991b) . Three aspects of
validity have been defined: (1) construct validity (i .e., the ability to correspond to theoretical
constructs under study [e.g ., if some event such as kidney function changes with age, then a
marker with construct validity should also change]), (2) content validity (i .e., the domain of
the phenomenon under study is incorporated [e .g., a DNA adduct for aromatic amines will
represent exposure from various routes and from occupational and lifestyle exposures]), and
(3) criterion validity (i .e., the extent to which the marker correlates with an external measure
of the phenomenon under study). There are two types of criterion validity : concurrent
validity and predictive validity . Concurrent validity is when the marker and the criterion
refer to the same point in time (e .g ., exhaled breath measures could be validated against
ambient air measures of occupational exposure to a chemical) . Predictive validity indicates
the ability of a marker to predict a criterion (e .g ., detection of a marker can be validated
against the appearance of an effect) .
It is necessary to have precise, accurate, sensitive, specific, and reliable assays for each
component estimate and an understanding of the factors that influence them (Schulte, 1987 ;
2-9

p. 59
Griffith et al ., 1988) . A validated relationship between the various components along the
exposure-dose-disease continuum (Figure 2-1) would include knowledge established at four
levels (Gann, 1986): (1) the association between a marker and a preceding exposure or
subsequent effect ; (2) the location, shape, and slope of the exposure marker, or of the
marker-effect relationship; (3) the threshold of "no observed adverse effect" ; and (4) the
positive predictive value of the marker for exposure or for disease . The validity may be
assessed in terms of sensitivity, specificity, disease frequency, and predictive value . The
relationship between these parameters and ways to calculate them are provided in detail
elsewhere (Schulte, 1989 ; Khoury et al ., 1985 ; Griffith et al ., 1988) . A qualitative rating
scale for the validity of biologic markers is provided in Table 2-2 .
TABLE 2-2. QUALITATIVE RATING FOR VALIDITY OF BIOLOGIC MARKERS
(1) "Totally experimental", with complete uncertainty about health or exposuresignificance of results .
(2) Experimental, but theoretical reasons exist to suggest that the marker will correlatewith exposure or disease .
(3) Correlates well with exposure or disease, but significance of the data is stilluncertain .
(4) Probably correlates well with exposure or disease, but truly conclusive data are notavailable .
(5) Extensively studied and has been validated as a useful tool for monitoring exposureor disease, but gives an unexpected positive response in 10% of people screened .
(6) Extensively studied and has been validated as a useful tool for monitoring exposureor disease, but gives an unexpected negative response in 10% of people screenedwho have a history of chronic abnormal exposure .
(7) Extensively studied and has been validated as a useful tool for monitoring exposureor disease, with no or very rare false positives and negatives .
(8) Validated and is completely predictive of exposure or disease .
Source: Schulte (1989) .
Conceptually, the goal of validation is to explore and establish links between markers
along the exposure-dose-disease continuum . The conventional approach to validation is to
2-10
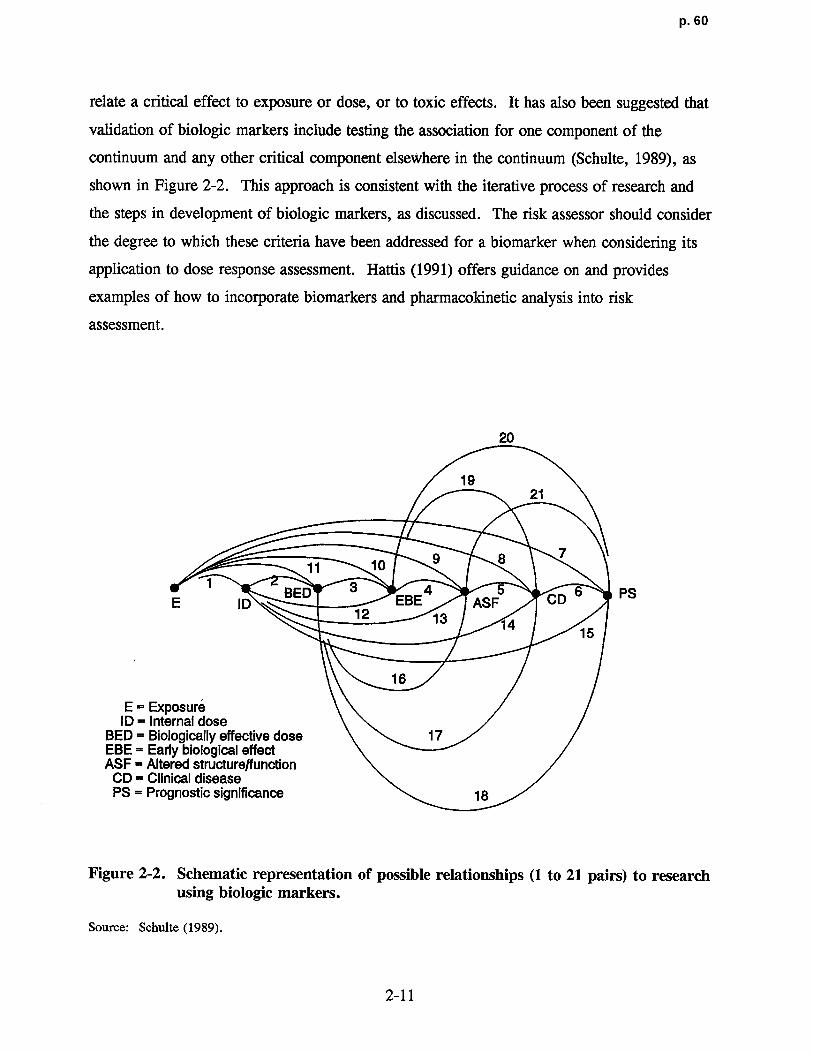
p. 60
relate a critical effect to exposure or dose, or to toxic effects . It has also been suggested that
validation of biologic markers include testing the association for one component of th e
continuum and any other critical component elsewhere in the continuum (Schulte, 1989), as
shown in Figure 2-2 . This approach is consistent with the iterative process of research and
the steps in development of biologic markers, as discussed . The risk assessor should consider
the degree to which these criteria have been addressed for a biomarker when considering its
application to dose response assessment . Hattis (1991) offers guidance on and provides
examples of how to incorporate biomarkers and pharmacokinetic analysis into risk
assessment .
20
1921
9 811 10
1 BED 3 4 5 CD 6 PSE ID EBE ASF
12 13 1415
1 6
E = ExposureID = Internal dos e
BED = Biologically effective dose 17EBE = Early biological effectASF - Altered structure/function
CD = Clinical diseasePS = Prognostic significance 18
Figure 2-2. Schematic representation of possible relationships (1 to 21 pairs) to researchusing biologic markers.
Source: Schulte (1989) .
2-11

p. 61
AnabWC Issues
The conventional techniques for assessing exposure-disease associations, for screening
for disease in populations, and for handling multiple variables can be practiced for any two or
more components in the continuum . The major assumption that permits this approach is that
there is an association between the component markers . Figure 2-2 shows the 21 possible
pairwise relationships that may be evaluated along the continuum between exposure and
disease . The ability to characterize these relationships is dependent on the degree of
mechanistic knowledge, whereas the importance of each of these will vary depending on the
priorities and objectives of the investigators and/or the application to dose-response
assessment .
Essentially, at issue is whether the marker is truly an intervening variable or a
confounding factor . Any marker that represents a step in the causal progression between
exposure and disease is not a confounding factor but, in fact, is an intervening variable .
When there is uncertainty about the mech anism, handling a potential confounding factor as
both confounding and not confounding in different analyses is justified . Seasoned judgment
of the best available information in the face of lack of mechanistic data will be required .
Relationships between components in the continuum c an be modeled by two approaches :
empirical and process modeling. The empirical approach can be used when there are no
explicit hypotheses about components . The approach is to use statistical techniques to find
the combination of descriptors that "best" explain the obse rved effects (e.g., gauging the
relative appropriateness of different dose surrogates determined principally by the nature of
the pathogenesis process) (Schulte, 1989). For use in dose-response assessment, it is also
necessary to determine the extent that a marker reflects recent or past exposures, peak as
opposed to integrated exposures, and cumulative rather than noncumulative biologic effects
(Checkoway and Rice, 1992) . The process modeling approach uses quantitative toxicologic
models to estimate concentrations in biological compartments and temporal patterns of
occurrence . It requires explicit hypotheses . Process modeling should be the goal as more is
learned about the continuum .
2-12

p. 62
Biologic F.xposure Indices
Perhaps the one area where use of biologic markers has achieved the most success as
applied to dose estimation is in setting biologic exposure indices (BEI) based on occupational
epidemiology and experimental studies . Figure 2-3 shows the relationship between air
monitoring and biologic monitoring as practiced for risk management of occupational
exposures . Air monitoring and its related threshold limit value (TLV), usually expressed as a
time-weighted average (TWA), is a measure of external dose, whereas biological monitoring
and the associated BEI relates to indirect monitoring of the internal dose (Droz, 1985) . Air
monitoring as often conducted, however, does not reflect unexpected exposure resulting from
peculiarities of certain jobs or from poor working practices (Fiserova-Bergerova, 1990), so
that surveillance of workers by monitoring BEIs is recommended (American Conference of
Governmental Industrial Hygienists, 1986) .
TLV BEI
External InternalDose Dose
,
EffectsFigure 2-3. Schematic relationships between threshold limit values in air (TLV),
biologic exposure indices (BEI), and effects .
Source: Droz (1985) .
2-13
p. 63
In order to develop and set a BEI, the relationship between internal dose (i.e., the BEI)
and health effects should be established . However, most of the available toxicologic data
relate exposure dose directly to health effects . In order to make use of these data, approaches
to development of the BEIs recommended by the ACGIH have considered that the BEIs are
bioequivalent to the TLV (Droz, 1985) . A similar type of reasoning can be used to establish
NOAELs or lowest-observed-adverse-effect levels (LOAELs) associated with occupational
epidemiology exposures . Exposure estimates such as a TWA (or other exposure measure
[e.g ., duration or cumulative exposure]) are a measure of the composition of the external
environment surrounding a worker. The BEI is a measure of an internal dose farther along
the exposure-dose-disease continuum, and as such can better reflect individual exposure
variability and response . Therefore, appropriate BEI levels can serve as dose surrogates,
associated with an observed effect in a population (e .g., lower confidence limit on mean
metabolite in blood) then extrapolated back to exposure estimates in order to calculate a
human equivalent concentration (HEC) .
The correlation between the degree of exposure and biological levels is influenced by
variability in the exposure concentration (temporal repetition, intraday concentration
variation, and interday concentration variation) and individual variability (workload, body
build, and metabolism) . The relationships between exposure levels and BEIs can be
established using three main approaches : (1) epidemiologic field studies on groups of
workers or populations exposed to the chemical in question ; (2) experimental or clinical
studies on volunteers exposed in controlled chambers ; and (3) PBPK simulation studies, using
different kinds of mathematical models to allow the simulation of various exposure situations
and individual characteristics (Droz, 1985 ; Fiserova-Bergerova, 1990). These three
approaches are complementary and each has its own advantages and disadvantages, as
qualitatively summarized in Table 2-3 . The ranking of these factors depend heavily on
experimental design and could be quite different for a particular chemical or set of studies .
The BEI documentation for individual chemicals should be consulted for considerations
pertaining to these modifying factors and their influence on interpretation of results
(American Conference of Governmental Industrial Hygienists, 1986) .
2-14

p. 64
TABLE 2-3. COMPARISON OF THE QUALITIES OF FIELD ANDEXPERIlVIENTAL APPROACHES IN THE STUDY OF THRESHOLDLIMIT VALUE/BIOLOGIC EXPOSURE INDICES RELATIONSHIPS
Approach
Factor Field Experimental
Exposure (dose) measurement + + + + +
Physical workload characterization + + + +
Timing of biological sampling + + + +
Effects of exposure repetition + + + + +
Environmental variability + + + +
Representativity of the subjects + + + +
+ + + = Good; + + = Medium; + = Poor.
Source: Droz (1985) .
Application of Physiologically Based Phamiacokinefic Model s
Physiologically based pharmacokinetic models are simulation models described by
simultaneous differential equations, the number of which is dictated by the number of
compartments needed to describe the physiological and metabolic processes involved . In the
context of characterizing the exposure-dose-disease continuum, simulation models can be
considered as complementary, providing critical insight on key processes related to the fate of
chemicals in the body and for depicting the contribution of various exposure and biological
factors to the variability of response . That is, these models can provide the following
information on which biological monitoring (e .g., BEIs) is designed and data are interpreted :
(1) concentration-effect relationships, (2) time-effect relationships, (3) matching exposure in
the workplace with integrated exposure, (4) depicting effects of external and internal factors
that alter the relationship between intensity of exposure and biological concentration and body
burden of the biologic marker, (5) extrapolation and prediction of biological concentrations
resulting from exposure to new compounds or new exposure conditions, and (6) verification
of data (Leung, 1992 ; Fiserova-Bergerova, 1990 ; Leung and Paustenbach, 1988 ; Droz,
1985) . Simulation models, because of their ability to match the extent of exposures
associated with the predetermined dose or biological markers of exposure, are a valuable tool
2-15

p. 65
in extrapolation of reference values for workers with unusual workshifts (Andersen et al .,
1987b ; Saltzman, 1988) .
2.1.1.2 Epidemiologic Data
There are essentially three areas of concern in assessing the quality of an epidemiologic
study. These involve the design and methodological approaches used for : (1) exposure
measures, (2) effect measures, and (3) the control of covariables and confounding variables
(Lebowitz, 1983) . The study population and study design must adequately address the health
effect in question in order to support a risk assessment (Lebowitz, 1983) . In order to
accomplish this goal, the exposure measures must be appropriate and of sufficient quality ; the
statistical analysis methods must be suitable to the study design and goals ; the health effect
measures must be reliable and valid ; and the covariables and confounding variables need to
be controlled or eliminated . Additional guidance on evaluation of the quality of individual
epidemiologic studies is provided in Appendix B. Criteria for causal significance are
provided in Appendix C .
Assessment of Exposure Measures
The problem of the accuracy and relevance of exposure measurements is not unique to
epidemiologic investigations, but it can be exacerbated due to the long-term nature of these
studies. For example, the nature of aerometric data may change over time because of
different air sampling techniques . Exposures also change over time because of different
industrial hygiene practices and because individuals change jobs and residences . Accurate
documentation of air toxicant levels, therefore, is critical in determining the usefulness of an
investigation as well as documentation that the analysis of the air toxicant is appropriate and
of sufficient sensitivity . It also is advisable to have the concentrations of other pollutants
reported and considered in the statistical analyses to help rule out confounding or interactive
effects . The number, location, and timing of monitors should be suitable to allow an
appropriate determination of exposure of the subjects to the pollutant being studied and to the
pollutants that could confound the results . When appropriate, the exposure measure or
estimate should take into account indoor/outdoor exposures and activity and subject location
data. Unfortunately, exposure measures often are the weakest component of an
2-16

p. 66
epidemiologic study . Minimally, the exposure measure or estimate needs to be representative
of the actual exposure .
Assessment of exposure measures should attempt to establish whether the following
wide range of aspects (National Research Council, 1991a) were addressed :
• Contaminant and potential biological response
• Specification and selection of the target population
• Spatial and temporal variability of concentration distribution patterns
• Frequency and intensity of exposure
• Selection of the sampling period in appropriate relationship to the time scale ofbiological effect (e .g., peak exposure versus TWA; short-term versus lifetime)
• Precision and accuracy requirements .
Exposure measures employed can either be direct (e .g ., personal monitoring and in some
cases biological markers) or indirect (e .g ., environmental monitoring such as area samples,
models that predict spatial and temporal concentration distributions of air contaminants in
microenvironments, questionnaires, and questionnaires or diaries) . Each type has distinct
advantages and disadvantages, and depending on the nature of the agent in question, may
address the above aspects to greater or lesser degrees .
Assessment of Effect Measures
Effect measures refer to the methods used to define disease indices . For epidemiologic
studies, these include incidence, standardized mortality ratios, and relative risk ratios .
Criteria for assessment require the proper selection and characterization of both th e
exposed and control groups . For example, criteria for inclusion in the control category of a
case-control study must ensure that this group has no exposure to the agent of concern . For
studies without internal control groups, reference populations are needed, particularly when
evaluating spirometric data (Ferris, 1978 ; American Thoracic Society, 1979 ; Crapo et al .,
1981 ; Knudson et al ., 1976) . Each population used to predict "normal" pulmonary function
tests has its own characteristics, which should be considered when used for comparisons .
2-17

p. 67
Other considerations include the adequacy of study duration and quality of the follow-up .
A disease with a long latency before clinical presentation requires a longer study duration
than one with an acute onset . Valid ascertainment (such as verification according to the
International Classification of Diseases IX) of the causes of morbidity and death also is
necessary .
Evaluation of epidemiologic studies may require interpretation of a variety of subjective
health effects data. Questionnaire responses may be biased by the way questions are worded,
the training of an interviewer, or the setting . However, a study based on a high-qualit y
questionnaire can provide useful results . For example, a committee of the American
Thoracic Society (ATS) charged with defining an adverse respiratory health effect, has come
to a consensus that "in general, increased prevalence of chronic respiratory symptoms as
determined from questionnaire surveys should be considered to be an adverse health effect"
(American Thoracic Society, 1985) . Questionnaires should be validated as part of the
investigation protocol, unless a standard questionnaire that has previously been validated is
used (Medical Research Council, 1960; Ferris, 1978; National Institute for Occupational
Safety and Health, 1986) .
It is very important to consider differences between statistical significance and medical
or biological significance . Both the variability of an outcome measure and the magnitude of
an exposure's effect determine the level of statistical significance . For example, data from a
large study population analyzed with sophisticated techniques may yield statisticall y
significant effects of small magnitude that cannot readily be interpreted biologically .
Conversely, apparently large changes of clinical importance may not be statistically
significant if the study population is too small . In addition, some studies present false
negative or no-effect results due to the lack of power . Judgments concerning medical or
biological significance should be based on the magnitude and class of a particular effect . For
example, cough or phlegm production can be considered less important than effects resulting
in hospital admissions, but daily productive cough can be more important than infrequent
cough. Underlying assumptions and nuances of the statistical procedures applied to the data
also need to be considered . This will probably best be accomplished on a case-by-case basis .
Because the RfC considers both portal-of-entry and remote (systemic) effects, it would
be helpful to define an "adverse respiratory health effect ." An ATS committee published
2-18

p. 68
guidelines that defined such an effect as medically significant physiologic or pathologi c
changes generally evidenced by one or more of the following (American Thoracic Society,
1985) :
• Interference with the normal activity of the affected person or persons
• Episodic respiratory illnes s
• Incapacitating illness
• Permanent respiratory injury or
• Progressive respiratory dysfunction
Appendix D provides detailed descriptions of adverse respiratory effects in humans .
Assessing the Control of CWbunding and Covariable s
Epidemiologic investigations attempt to relate an exposure to a given health effect, but
this includes accounting for the "background" health effect (pathologic condition) that exists
in individuals due to predisposing factors and preexisting health conditions, or from other
variables, such as occupational exposures .
Various host factors contribute as risk factors for disease and can influence the health
indices assessed. For example, asthmatics may be particularly susceptible to effects from
exposure to irritant gases . Epidemiologic evaluation of these factors often not only accounts
for such interactions but also can help to characterize susceptible or sensitive groups .
Covariables can be as important as the major aerometric variables themselves in affecting
human health . Other exposures, such as concomitant occupational exposures and smoking, in
particular, can affect the disease outcome . Meteorologic variables such as air velocity,
temperature, and humidity also are very important factors when considering respiratory health
effects . These covariables should be controlled by both the study design and analysis, as
appropriate .
The final step in the inferential process from an epidemiologic investigation is the
extension of the study results to persons, populations, or settings not specifically included in
the experimental design, that is, to demonstrate consistency of results within replicates i n
2-19

p. 69
different scenarios . The confidence with which this is done for positive results is usually
based implicitly on how successful the investigators have been in identifying and handling the
potential risk factors and covariables that produce or influence the pollution-effect association
they have observed. Uncertainties also arise because the general population includes some
people, such as children, who may be more susceptible than people in the epidemiologic
study. Factors such as the "healthy worker" effect and the bias of a predominantly male
worker sample must be considered when using occupational studies (National Research
Council, 1985) . Intraindividual variability concerns are addressed in Section 2.1 .1 .4 .
2.1.1.3 Nonepidemiologic Data
Human data also include clinical studies and case reports . The case reports may
provide support for the weight-of-the-evidence decision, but are often of limited utility in
establishing a quantitative relationship between environmental exposures and anticipated
effects (Barnes and Dourson, 1988) . Controlled human clinical studies, properly conducted,
can be of great value to dose-response assessment. Although such studies for ethical reasons
are typically for acute durations and therefore, by definition, do not meet the criteria for
development of a chronic RfC estimate, they can be valuable in improving understanding of
the nature of the effect in humans . Some of the discussion found in Section 2 .1 .2 .2, Impact
of Experimental Protocol (for laboratory animal studies), is also appropriate to consider .
Clinical Studies
Clinical studies may contain exposure-response information that can be used in
estimating effects . Most clinical studies combine the strong point of animal toxicology,
rigorous control of the experimental exposure and subject, with the strong point of
epidemiology, the unquestioned relevance to human health . In addition, clinical studies can
be independently confirmed somewhat more easily (requiring a reasonably short time and
resource commitment) than epidemiologic studies . There are limitations, however, that
include short exposure duration and "noninvasive" techniques that might not ascertain the full
array of effects . The test atmospheres are usually within the range expected to produce only
mild and temporary health effects . Certainly, clinical studies should be recognized and given
credence to the extent that they are scientifically rigorous, relevant to human health concerns ,
2-20

p. 70
and have been independently replicated . They may be particularly useful for acute or less-
than-lifetime dose-response assessment . The prediction of long-term effects from short-term
observations remains questionable, but confidence in clinical findings can be bolstered by
supporting evidence from epidemiology and laboratory animal toxicology, and vice versa .
Although clinical exposures and respiratory measurements (at least the noninvasive ones
for functional mechanics) are typically done on nonsedated humans, the breathing pattern
remains an important consideration . Experimental protocol often dictates the breathing
pattern (i .e., nonspontaneous breathing) where a subject patterns his or her breathing to a
metronome or is instructed to take a deep breath on every fifth inhalation . Because the
efficiency of time-dependent deposition mechanisms is greater during inspiration than
expiration, an ideal "academic" breathing pattern would keep the inspiration time/expiration
time ratio (tl/td constant (Heyder et al., 1975). Relevance of such an academic pattern to
risk assessment, however, remains equivocal and most investigations do not attempt to
maintain a constant ratio . Documentation of breathing patterns should be included in the
experimental protocol and considered in the extrapolation of dose .
The exposure mode is also important to consider . Because the nasal passages are more
efficient at removing particles (particularly for large particles) than the oral cavity, increased
lung deposition of larger particles could occur through mouth breathing . This would affect
both the amount and the size distribution of an inhaled aerosol in the lower respiratory tract .
Even the specific configuration of the mouthpieces used in inhalation exposures delivered
orally can affect the extent of deposition (Schlesinger, 1985) . Miller et al . (1988) showed
that regional respiratory tract deposition of insoluble particles in humans is a complex
function of breathing route, ventilatory level, and the particulate physicochemical and
aerodynamic properties . Some gases (especially highly water soluable and reactive ones) are
extensively removed in the nasal passages, making exposure mode important for gases as
well . Whether the subjects were free-breathing or whether they breathed through a
mouthpiece or used a facemask affects gas deposition as well and should be considered .
Case Reports
Individual case reports of adverse effects due to a specific agent also can provide some
help in evaluating the potential risk from exposure to a toxic air pollutant . These reports are
2-21
p. 71
especially valuable qualitatively for indicating that the quantitative effect observed in an imals
occurs in exposed humans. These reports must be examined carefully and used wit h
discretion because they represent a very small sample and are usually related to heavy
exposures (Goldstein, 1983) . Nevertheless, these observations should not be overlooked,
especially when a large number of case histories exist with the same endpoint .
2.1 .1 .4 Intraspecies Variability and Identifying Sensitive Subgroups
In order to control factors other than the chemical being tested, laboratory animals
(e.g., rodents) used in toxicity studies are often bred for homogeneity . In contrast, the
human population is heterogeneous . The broad genetic variation of the human population in
processes related to chemical disposition and tissue response causes individual differences in
sensitivity to toxic chemicals . A susceptible individual is one who will experience an adverse
health effect to a pollutant significantly earlier in the course of exposure or at lower doses
than the average individual, because of host factors that predispose the individual to the
harmful effects . Sensitive individuals may be those whose genetic makeup puts them at the
extreme end of a continuous distribution of a biological function, such as the amount of
enzyme production, or those who possess a unique genetic difference, such as an altered
enzyme, that makes them markedly different from the general population .
In addition to genetic factors, personal characteristics such as age, sex, health status,
nutrition or personal habits make some people more susceptible (Calabrese, 1978) . The
activity pattern of people is a major host factor influencing the dose-response by its effect on
delivered dose . Generally, exercise increases the delivered dose and alters the regional
deposition of the dose.
Environmental risk assessment also should consider host factors that both increase
susceptibility and that occur relatively frequently in the population . Erdreich and Sonich-
Mullin (1984) estimated the prevalence of population subgroups who are potentially
hypersusceptible to some common pollutants . Table 2-4 shows five subgroups of individuals
who, based on empirical observations or compromised physiological functions, are assumed
susceptible to the listed chemicals . Theoretically, elderly individuals could be more
susceptible to some chemicals and children to others . Unfortunately, very little is known
about this important area . Likewise, very little is known about gender differences .
2-22

p. 72
TABLE 2-4. PREVALENCE OF SUBGROUPS SUSCEPTIBLE TO EFFECT SOF COMMON POLLUTANTS
Susceptibility PopulationSubgroup Prevalence Chemicals*,' ReferenceEmbryo, fetus, Pregnant Carcinogens, Rice (1981), Kurzel andneonate women: solvents, CO, Cetrulo (1981), Saxena
21/1,000b mercury, lead, et al . (1981), U .S.PCBs, pesticides Environmental Protection
Agency (1986a, 1991)
Young children Ages 1-4 : Hepatotoxins, PCBs, Calabrese (1981), Friberg70/1,000b metals, NO2 et al. (1979), U .S.
Environmental ProtectionAgency (1993a)
Chronic obstructive Chronic bronchitis: 03, Cd, particulate Holland et al . (1979),pulmonary disease 13,494,000 (5 .4%)° matter, SO2, NO2 Redmond (1981), U.S .
Asthma: 12,375,000 Environmental Protection(4.9%)° Agency (1982b ; 1993a,b)Emphysema :1,915,000 (0 .8%)c
Circulatory Ischemic heart Chlorinated solvents, McCauley and Bullconditions disease: 8,155,000 fluorocarbons, CO (1980), Aviado (1978),
(3.2%)° U.S . EnvironmentalProtection Agency (1991)
Liver disease Liver abnormalities : Carbon tetrachloride, Calabrese (1978)20/1,000d PCBs, insecticides ,
carcinogens
"'Abbreviations :CO = Carbon monoxide; Cd = Cadmium ;PCBs = Polychlorinated biphenyls; SO2 = Sulfur dioxide;03 = Ozone; NO2 = Nitrogen dioxide.
`Representative samples of chemicals to which these individuals may be susceptible . Some evidence fromlaboratory animal studies only .
'Estimates of Erdreich and Sonich-Mullin (1984) from 1970 census statistics data .'Population base 251,448,000 ; estimate from U .S. Department of Health and Human Services (1992) .dEstimate of Erdreich and Sonich-Mullin (1984) from Health Interview Survey (National Center for HealthStatistics, 1975) .
Source: Adapted from Erdreich and Sonich-Mullin (1984) .
As a result of epidemiologic investigations, it is well recognized that a population of
adult workers experiences less morbidity and mortality than the general population (Fox and
Collier, 1976; Wen et al ., 1983 ; Monson, 1986) . However, sufficient qualitative and
2-23
p. 73
quantitative information on interindividual variability and susceptibility for specific chemicals
rarely exists .
If the RfC is based on data derived from subgroups of the general population, such as
workers who are generally a selected group of healthy adults, the calculation procedures must
include an appropriate uncertainty factor (UF) to account for the anticipated broader
variability in the general population . Worker populations are nonrepresentative in terms of
sex, age distribution, and general health status . Susceptible subpopulations may not be
represented because they may not seek or sustain employment, particularly in situations such
as those represented in workplace exposure studies . Occasionally, data are available on more
sensitive subgroups such as children or asthmatics . In these cases, dose-response assessments
can be made for the general population with greater confidence . In the absence of data on
the more susceptible individuals in the population or lack of identification of such individuals,
UFs are used to protect unidentified individuals at greater risk .
There are two steps necessary to obtain information addressing the problem of sensitive
individuals : (1) examine chemical-specific data for empirical evidence of sensitivity and
hypersusceptibility, and (2) ascertain whether the mechanism of toxicity for a given chemical
suggests that any population group would be more sensitive .
In addition to this chemical-specific evaluation, guidance should be developed
concerning the prevalence of sensitive subgroups and the range of sensitivities in the general
population exposed to inhaled toxicants. Some research has assessed the magnitude of
interindividual variability in pharmacokinetic parameters related to the delivery of the
biologically effective dose, in order to develop guidance for appropriate UFs . Differences
among normal healthy adults may be as much as 10-fold (Hattis et al ., 1987) . Therefore, the
potential that exists for broad differences when children, the elderly, the ill, and those
previously exposed are included .
2 .1 .1.5 Summary
Based on the foregoing discussion, guidelines for the qualitative assessment of human
data are as follows :
2-24

p. 74
Evaluation of the Epidemiologic Data Base
• Examine epidemiologic and clinical data for dose-response information in potential orpreviously identified sensitive groups (e.g., studies in asthmatics and children) .
• Examine laboratory an imal data for models that may help identify potential sensitiveindividuals .
• Evaluate epidemiologic studies to ascertain genetic and personal factors that increasethe risk of adverse response. Evaluate implications of these risk factors foridentifying sensitive groups .
• Examine data for reports of ranges of responses or response variables, and forinformation on individual responses . This is particularly important in evaluatinghuman data for assessing the range of variability in response because epidemiologicstudies may find a LOAEL with no NOAEL.
• Evaluate available biological monitoring data and clinical and experimental data forindications of characteristics of increased susceptibility . For example, irritants mayinduce responses earlier in individuals with asthma .
• Evaluate data on mechan isms of toxicity, pharmacokinetics, and critical target org an sto identify characteristics that may imply broad interindividual variability orsusceptible individuals . For example, the elderly may be more sensitive to certainchemicals in relation to age-related changes in oxidative metabolism potential .
Evaluation of Individual Studies
• Assess the makeup of the study population and control groups to identify the presenceor absence of sensitive individuals . Data on healthy workers, for example, are notrepresentative of the general population and will require reduction of NOAELS orLOAELs by UFs.
• Consider the activity pattern of the subjects . Whether the subjects received exposurewhile at rest or at level(s) of exercise that influenced the inhaled dose as well as thepattern of deposition .
• In longitudinal (cohort) studies, evaluate information in relation to the natural historyof the disease (e.g., the progression of lesions) . For example, normal changes overtime, such as increased forced expiratory volume at 1 s(FEV1) as children get older,and decline of FEV 1 with aging in older adults, should not be adversely affected .Cross-sectional studies may suggest such associations but will not suppo rt causality asstrongly as will cohort studies .
• For parameters that have known variability with age, such as FEV1, evaluate resultswithin age groups and ascertain whether appropriate reference populations were used .
2-25

p. 75
2.1 .2 Laboratory Animal Data
When the data base lacks adequate information on effects in humans, as is frequently
the case, the key studies are drawn from experiments conducted on nonhuman mammals .
Animals most often used include the rat, mouse, guinea pig, hamster, rabbit, monkey, and
dog. Such animal studies have often been conducted with controlled exposure conditions on
relatively homogenous populations, but nevertheless, present the risk assessor with concerns
about evaluating dose and exposure regimen . Unlike the human, inbred laboratory animals
have homogeneous constitutions . Genetic background differences and numerous inbred, have
homogeneous constitutions . Genetic background differences and numerous other interspecies
differences are confounding factors during key study selection .
Evaluation of the quality of individual animal toxicity studies requires consideration of
factors associated with the study's hypothesis, design, execution, analysis, and interpretation .
Guidelines for assessing individual animal studies are provided in Appendix F and are
adopted from a number of recommendations (National Research Council, 1984 ; Society of
Toxicology, 1982; James, 1985 ; Muller et al ., 1984; Lu, 1985a) . Refer to this appendix for
a more detailed description of those issues .
2.1.2.1 Study Design
An ideal study addresses a clearly defined hypothesis, follows a carefully prescribed
protocol, is conducted in adherence to good laboratory practice, and includes appropriate and
sufficient subsequent analysis to support its conclusions . The EPA Good Laboratory Practice
Standards (Code of Federal Regulations, 1991b,c) are designed to ensure the quality and
integrity of data used in hazard evaluation . These regulations contain detailed guidance on
provisions for personnel, facilities for animal care, animal supply, handling of test and
control substances, equipment, operation of testing facilities, characterization of test and
control chemicals, protocol and conduct of a laboratory study, report records, record storage,
and record retrieval . Studies that do not precisely follow these guidelines may still be judged
adequate if, in the context of overall results, the deviations are not important . The type of
deviation (from the guidelines) and its magnitude, as well as the potential for its interaction
among all the variables, must be assessed (National Research Council, 1984) . For example,
a study may still be judged adequate, despite an insufficient number of test animals specifie d
2-26

p. 76
by the appropriate reference protocol guidelines, if the results are so definitive that th e
addition of more test animals would almost certainly not have affected the conclusion .
A dose-response assessment that is based on a study with deficiencies may include a
modifying factor to account for the added uncertainty (see Section 4 .3.8 .2) .
The use of statistics in design and interpretation of studies is an area in animal toxicity
testing that is often neglected or applied inappropriately (Muller et al ., 1984) . Consideration
of statistical applications restricted to confirmatory analysis (i .e., outcome is dependent on the
mathematically randomized test condition and is independent of other observations) versus
exploratory analysis (i .e, many tests on a variable) should be emphasized .
2.1.2.2 Impact of Experimental Protoco l
The techniques and measurements used in inhalation toxicology investigations may
affect the exposure conditions or the interpretation of toxic effects, thereby altering the results
used for risk assessment. Areas that introduce uncertainty into interspecies extrapolations of
inhaled dose include measurement techniques, the definitions and underlying assumptions
used in the procedures, and the exposure technology . Careful consideration should be given
to each when estimating the effective inhaled dose . This discussion is also appropriate to
consider when evaluating clinical human studies .
Equipment Specifications
The equipment used will impart restrictions on any interpretation (i .e., limitations of
sensitivity for exposure analysis or to monitor an effect) of investigative results and therefore
should be considered when evaluating test results .
Generation and Characterization of Exposure s
Just as the working definitions and underlying assumptions alter the interpretation of
measurement techniques, the operative exposure level (e .g., for use in risk assessment,
prediction models, etc .) of a test agent is a function of how its particulate mass and
composition (mean particle diameter and distribution) and gas concentration are expressed .
Other specific characteristics (e .g., adequate test substance mixing in chamber,
hygroscopicity, charge density) should be accounted for as part of this description. The
2-27

p. 77
soundness and interpretation of the animal data are dependent on the methods employed to
generate and analyze the test atmosphere data because the methods influence deposition
calculations .
The two most common ways in which particle size is expressed are the count median
diameter (CMD) and mass median diameter (MMD). The toxicity of a material is most
consistently related to its mass distribution . Measurement of mass has the further advantage
of a minor quantitative error at the small end of the size spectrum . To assess risk, however,
the activity diameter may be a more appropriate expression of particle size as discussed in
Appendix H. Methods of particle measurement include settling, filtration, wet and dry
impingement, multiple impaction, electrical precipitation, thermal precipitation,
centrifugation, and observation of optical effects . Each of these has its own principle of
operation and limits of sensitivity that, in turn, affect the expression or characterization of the
test aerosol . Fiber exposures are further complicated by the need to describe the aspect
criteria and distributions . As discussed in the section on anatomy and physiology, certain
mechanisms contribute to the deposition fraction in each respiratory region . Failure to
account for characteristics such as hygroscopicity or charge density when generating an
aerosol could change its deposition in certain regions . This variability in the aerosol
characterization would be expressed as uncertainty in the dose-response assessment .
Gaseous contaminant atmospheres are usually somewhat easier to characterize .
Delivered concentrations must be consistent across exposure location and duration and may be
less than the generated concentration . If the gas is extremely reactive, loss due to reactions
with the walls of the transport system (e .g ., tubing) and chamber will occur. Losses due to
decomposition or alteration of the test substance during some generation procedures also may
be a factor . Gas flow rate (delivery) must be known, steady, and calibrated for the given gas
because it is density-dependent . Analysis of the air is limited by the detection device
specifications . If online analysis is not feasible, consideration should be given to the
frequency of samples taken . The period between samples for intermittent analysis should be
less than one-tenth of the total exposure time for any given day (McKenna, 1982) .
For all generation and characterization of pollutants, periodic calibration of all
measurement systems is a critical quality control/quality assurance step . This also needs to
be considered when evaluating the study, as discussed in Appendix F .
2-28

p. 78
Generation of the compound under study and subsequent exposure also will affect th e
derived inhaled dose . Exact determination of the dose achieved in inhalation studies is a
complex process . Proper generation, appropriate characterization, and accurate delivery of
the test atmosphere are integral to this determination . Varieties and limitations of the
available technology must be considered when evaluating the selection of methods and
interpreting experimental results . The reader is referred to review articles for details on
inhalation exposure systems (Cheng and Moss, 1988 ; Barrow, 1988; Moss and Cheng, 1988;
Gardner and Kennedy, 1993) .
Euposure Regimen
Extrapolation from one exposure regimen to another has uncertainties, most of which
are not quantified. For most chemicals, the quantitative relationship between the toxic effect
and concentration or duration of exposure is not studied . Some studies have indicated that
the relationship is dependent on many factors, including (1) the number of exposure hours per
day; (2) the exposure scenario, that is, continuous versus interrupted (e .g., 1 week of
exposure, 1 week of air, 1 week of exposure, etc .), versus intermittent (X hours per day ,
Y days per week) regimens ; (3) the time of endpoint assessment (e.g ., acute versus
subchronic versus chronic studies or studies with recovery time before observation) ; (4) the
endpoint(s) ; and (5) the mechanisms of toxicity . Examples of particles and gases follow that
illustrate some of the complexities involved in extrapolating across exposure scenarios .
The actual amount of particles or gas found in the respiratory tract at any time is
determined by the relative rates of deposition and clearance . The efficiencies of the
deposition mechanisms are different in each respiratory tract region . The defense
mechanisms and clearance rates for each of these regions also are different . Therefore, it is
expected that the kinetics of the toxic effect of an exposure will be influenced by the duration
of exposure . There is experimental evidence for such a differential dependence of effect on
exposure duration . For example, Albert et al . (1971) showed that low single doses or early
effects of repeated exposure to cigarette smoke were associated with acceleration of clearance
rates in the tracheobronchial trees of both donkeys and humans . Heavier doses and long-term
repeated exposures were associated with sporadic clearance, stasis intervals, and some
retrograde movement . Unfortunately, there has not been a systematic comparison and
2-29

p. 79
quantification of differential clearance rates across species . This will be necessary before the
effects of duration can be assessed in the same models or default values can be developed .
Ozone can be used as an illustration for gases because it has a large health effects data
base. Kenoyer et al . (1981) showed that rats exposed to 03 for 4 h showed delays in the
early clearance and an acceleration in the late clearance rate of tracer particles . These
investigators postulated that the delays in early clearance could be caused by effects that
decrease mucous transport (e .g., decreased ciliary beat rate or change in mucous properties),
whereas acceleration of the late clearance rate was most likely due to an increase in numbers
or activities of alveolar macrophages. Rats exposed intermittently (7 to 8 h/day to 03 for
approximately 1 week) had similar changes in lung antioxidant enzymes to animals exposed
continuously (24 h/day), even though the dose, expressed as the product of concentration (C)
and time (T) of exposure, was different (Mustafa and Lee, 1976) . Monkeys exposed to
03 for 18 mo continuously or for 18 mo bimonthly (equivalent to 9 mo of exposure) had
some similar alterations in lung morphology; additional alterations were observed in the
intermittent exposure group although they received a lower C X T (Tyler et al ., 1985) .
Using morphometric measurements of the proximal alveolar region of lungs of rats receivin g
prolonged low-level exposures of 03, Huang et al . (1988) have shown that the increase in the
relative volume of Type I epithelial cells was related to the C X T, whereas other
morphometric indices were more dependent on concentration than on time .
For nitrogen dioxide (NO2), the data base is equally complex on the exposure scenario
issue. Using the mouse infectivity model (an index of antibacterial lung defenses),
concentration was found to be more important than duration of exposure in causing the effect
(Gardner et al ., 1979) . When a typical urban pattern of NO2 was used (i .e., a baseline of
continuous exposure to a low level of NO2 on which were superimposed two 1-h peaks of
NO2 each weekday), the study indicated that on a C X T basis, this regimen was not more
toxic than a continuous exposure to the baseline level after a short period of exposure
(Graham et al ., 1987) . After a chronic exposure, the spikes to the baseline increased the
effects relative to the baseline exposure only (Miller et al ., 1987a) .
The topic of extrapolating across different exposure scenarios is beyond the scope of
this document. However, the few examples provided illustrate the complexity of the issue
with respect to concentration and duration . Other factors that also influence interspecie s
2-30

p. 80
extrapolation (e .g., temperature, humidity, particle size, and distribution are discussed) in
Chapter 3 . Risk assessors will have to consider the effects of exposure on a case-by-case
basis and utilize default assumptions until the needed research data are available .
Erposure Modes
The various exposure techniques can be divided according to the extent to which the test
species are exposed . The techniques range from whole-body exposure at the one extreme to
exposures limited only to the lower respiratory tract (Lippmann, 1980) . These techniques
include whole-body, head-only, nose-only, nasal, oral, and tracheal cannula exposures, and
tracheal instillations . Practical considerations such as economic feasibility, special
precautions for safe and efficient generation, amount of material, test compound stability,
exposure duration, and the measurements desired dictate the selection of an exposure
technique for a given study design . For example, whole-body exposure of laboratory animals
in cages is the most common method to conduct chronic inhalation exposures for more tha n
1 to 2 h/day, whereas nose-only exposures are most often used for short durations particle
exposures .
Wolff et al . (1982) studied the deposition and retention of 0 .1 µm radiolabeled gallium
oxide (67Ga2O3) aggregate aerosols in Fischer 344 rats following whole-body and nose-only
exposures of 3 days duration . In this investigation, lung deposition for whole-body exposures
was similar to that for nose-only exposures (--15 % of the inhaled particles) . Due to
preening, passage of material into the GI tract, however, was 1 .6-fold greater for whole-body
exposures than with nose-only exposures . This could be important in cases where there is
either a specific GI response (i .e., stomach lesions) or substantial GI absorption that may
result in a systemic effect .
Rotation of animals in whole-body chambers is recommended and should be included in
the experimental design (Griffis et al ., 1981) to minimize dosimetric differences that would
result if the aerosol was not uniformly distributed in the chamber . The effects of factors such
as heat and/or other stress upon animals in confinement tubes used for nose- or head-only
exposures need to be considered, particularly because these factors may be species-dependent .
For example, rats in confinement tubes for short exposures have been shown to have
respiratory values and body temperatures that remain constant, although Syrian golde n
2-31

p. 81
hamsters exhibit increasing ventilation and temperature (Raabe et al ., 1973). Adaptation to
exposure or measurements may be a function of behavior, such as ability to be trained
(Mauderly and Kritchevsky, 1979), but in general, animals in confinement tubes or animals
forced to breathe through mouthpieces will experience abnormal stress (Raabe et al ., 1973) .
Nose-only restraint was shown to induce indications of material toxicity but did not appear to
affect normal embryo/fetal morphologic development in mice exposed on gestational days
6 through 15 for 6 h per day (Tyl et al ., 1994). The potential for stress should be accounted
for in the experimental protocol . The tubes can be modified into plethysmographs to monitor
respiratory function changes indicative of stress, or cooled to a constant temperature to
prevent it . If such modifications are not made, the risk assessor must be aware of potential
influences on results .
Anesthesia
Anesthesia greatly influences the respiration characteristics of the test animal. This is a
consideration when evaluating pulmonary function parameters for adverse effects . Prolonged
anesthesia can compromise the respiratory system, altering normal function and response .
Anesthesia also can alter the metabolism of the study compound . Anesthesia has been
reported to interfere with autonomic control, produce atelectasis, decrease lung compliance,
block reflex responses, and introduce an undesirable risk to animals committed to long-term
toxicology studies (Dorato et al ., 1983) . These alterations in ventilation and breathing
mechanics produced by anesthesia could have severe effects on the results of respiratory
function measurements . This possibility provided the impetus for the development of
procedures for measuring respiration in unsedated laboratory animals (Amdur and Mead,
1958 ; Mauderly et al ., 1979) . Data now are available on respiratory characteristics in
sedated and unsedated animals ; consideration of anesthesia should be included in data analysis
to ensure appropriate comparisons .
Breathing Pattern
Consideration should be given to the possible alteration of the breathing pattern due to
the exposure concentration, which, in turn, would alter the delivered dose . Exposure of
certain agents, such as irritants, may lead to concentration-dependent changes in pulmonar y
2-32

p. 82
mechanics measurements (Costa and Tepper, 1988 ; Alarie, 1981) . Correct quantification of
inhaled dose therefore may require measurement of breathing patte rn (respiratory frequency
and VT) during the course of the exposure. Differences in delivered "dose" correlated with
the species-dependent differences in ventilation have been reported for formaldehyde toxicity
(Chang et al ., 1983) .
Measurement Techniques
Because measurements of ventilation and breathing mechanics often are used to evaluate
respiratory functional alterations or to estimate inhaled/retained dose, perform ance parameters
of such measurements are critical to their interpretation . The patterns of respiration
(breathing route, depth, and rate) affect the air flow characte ristics, which, in turn , influence
the relationship between competing particle deposition mech anisms and the relative
contribution of gas transport processes . The penetration depth of the exposure air is
determined by the tidal volume (VT), the airway caliber, and the ratio of functional residual
capacity to total lung capacity (FRC/TLC) . As the FRC/TLC increases, deposition would be
expected to increase (Schlesinger, 1985) . For example, rapid shallow breathing often is
associated with increased deposition of larger particles in the upper respirato ry tract, as
compared to slow, deep breathing . Therefore, performance parameters include both the
factors that influence the test species (including hum an) respiration characteristics and the
performance limitations of the techniques .
Pharn acologic Effects of Agents
The test agents may affect lung ventilation and function. Administration of a chemical
with narcotic properties will lower physical activity, whereas an irritant might increase
movement . The test agent could also alter clear ance mechanisms . All of these states would
affect deposition, uptake, and retention of the dose . In addition, the agent could disrupt the
immune system and render the animal more susceptible to disease during long-term testing,
thereby altering the study results .
There are several examples of irritating or potentially anesthetic chemicals that can
depress ventilation . Chang et al . (1983) reported a 40% decrease in minute volume in mice
exposed to 15 ppm formaldehyde. This inhibition was maintained du ring the entire course of
2-33

p. 83
the daily exposure period . Ventilation was decreased to as little as 1/15 of resting values
during exposure of mice to 10 ppm ozone (03), and to as little as 1/3 of resting values during
exposure of mice to acrylate esters (Bruce et al ., 1979) .
Particle overloading in the lungs of laboratory animals is a recognized outcome of
excessive particle exposures, especially during chronic inhalation studies . The phenomenon
has been associated both with protracted retention time of particles in the lung and with
changes that can confound toxicological interpretations (Morrow, 1992) . Concurrent and
persistent features of the progressive prolongation of pulmonary retention include histological
evidence of aggregated alveolar macrophages (AM) engorged with phagocytized dust
particles, chronic inflammatory response, increased uptake of particles in the intersitial
spaces, and an increased alveolar cell hyperplasia. Subsequent development of alveolitis,
granulomas, and fibrosis are related to the duration and severity of the overload condition .
Morrow (1988) has developed the hypothesis that excessive levels of dust (particles) in the
lungs lead to excessive engulfment of particles by AMs and after a certain degree of loading
occurred, the AMs become progressively immobilized and aggregated . The activated AM
can also release mediators that can affect the integrity of the epithelial barrier, inhibit
antiproteases, or cause influx of inflammatory cells . The relative or complete loss of AM
mobility increases the likelihood of direct particle-epithelial cell interactions and interstitial
localization of dust particles . The impact of this phenomenon is likely modulated by the
particle surface properties, the amount of dust phagocytized, the intrinsic cytotoxicity of the
particles and the persistence of the particle laden cells in the lung milieu .
It has been concluded that particle overloading seriously confounds toxicological
interpretations in the F344 rat (Morrow, 1992) and has important implication for most
species, including humans . At this juncture, differentiating overload effects from those
induced by the intrinsic toxicity of the inhaled material relies to a major extent on the
characterizing the toxic potency of the particles . If the possibility for a particle overload
phenomenon exists, caution is warranted in the use of first-order kinetics to describe
clearance kinetics . Models that incorporate realistic functional and cytological bases and
appropriate kinetic descriptions such as that of Yu and Yoon (1990) to describe diesel particle
clearance, are necessary to describe both reasonable and excessive particle dust burden
retention .
2-34
p. 84
Definitions/Underlying Assumptions
Additional variability and uncertainty in evaluating available inhalation studies occur
because investigators have used different definitions of various respiratory regions and have
employed different methods to estimate total or regional deposition . For example, total
deposition often is estimated by calculating the difference between the amount of compound
in the inhaled air and that in the exhaled air . By making assumptions about mixing and dead
space, estimates of regional deposition may be obtained using measurements of the compound
concentration in different volume fractions of the expired air. As another example, the
definition of upper respiratory tract in various studies has included any or all of the following
anatomic regions : nasopharynx, oropharynx, larynx, or upper trachea . In other studies,
deposition values based on chemical or radiologic assays of tissues after exposure assume no
particle translocation before or during dissection . Some investigators include measurement of
material in the gastrointestinal (GI) tract in their reported value for upper respiratory tract
deposition, while others ignore this translocation . The underlying assumptions and working
definitions for different experimental conditions can contribute a large degree of variability in
reported results . Conversion to some common basis will be necessary in order to calculate
and accurately compare inhaled doses .
2.1.2.3 Appropriateness of Laboratory Animal Species as a Model for Humans
For inhalation studies in particular, there is a dichotomy in terms of the types of
endpoints monitored in human versus laboratory animal studies . Human data concerning the
consequences of inhalation exposure generally consist of information on subjective symptoms
along with clinical data concerning pulmonary function. The relationship between the clinical
picture and lung pathology is poorly defined . However, standard animal toxicological
protocols generally incorporate respiratory tissue evaluation as part of the routine necropsy,
but do not evaluate pulmonary function . Of course, once the lung has been identified as a
target tissue, more detailed studies of it as a target organ may be conducted . When these
more detailed data are available, two additional questions are raised : (1) What is the
significance of alterations in test species' pulmonary performance in terms of potential human
effects? and (2) If tests showing differences in pulmonary biochemistry are available, what is
the utility of the biochemical changes as predictors of disease? Correlations betwee n
2-35

p. 85
functional decrements and immunologic, biochemical, and pathologic changes need to be
quantitated . Work in progress on animal models (see Section 3.1 .2.1), biological exposure
indices (Lowry, 1986), and in vitro alterations of lung biochemistry as predictive of lung
disease (Last, 1983) are contributing to this end .
Each inhalation study should be evaluated for possible indications that the respiratory
system is the critical target organ . Human studies that provide only cursory evaluation of
respiratory endpoints make careful evaluation of animal data essential . Human data should be
evaluated with special emphasis on the significance of respiratory system endpoints and
adequacy of their characterization. Extrapolation from oral to inhalation exposures may be
utilized only after careful consideration of factors presented in Section 4 .1 .2 .
For compounds that appear to produce their critical effect within the respiratory system
itself, decisions concerning adversity need to be made on a case-by-case basis . Appendix D
provides specific information concerning evaluation of the severity of respiratory tract
endpoints in humans, while Appendix E provides a summary of issues and references for
pulmonary function evaluation .
Emphysema provides an example of some of the complexities involved in this issue .
Appropriate animal model selection may be contingent upon pathological identification of
early changes consistent with the human syndrome ; for example, a clear choice of the most
appropriate laboratory animal species has not been established for emphysema (Snider et al .,
1986) . The most recent definition of emphysema by the National Heart Lung and Blood
Institute, Division of Lung Diseases Workgroup (Snider et al ., 1985), differentiates between
emphysema in human lungs and animal models of emphysema . When reports of emphysema
following exposures of animals are to be extrapolated to potential hazards for humans, the
definition of human emphysema, rather than that for laboratory animal models of
emphysema, must be used . Thus, the current definitions of emphysema in human lungs and
in laboratory animal models are critical to this review (U.S. Environmental Protection
Agency, 1993a) .
The report from the National Institutes of Health (Snider et al ., 1985) first defines
respiratory airspace enlargement . "Respiratory airspace enlargement is defined as an increase
in airspace size as compared with the airspace size of normal lungs . The term applies to all
varieties of airspace enlargement distal to the terminal bronchioles, whether occurring with o r
2-36
p. 86
without fibrosis or destruction ." Emphysema is one of several forms of airspace
enlargement . In human lungs, "Emphysema is defined as a condition of the lung
characterized by abnormal, permanent enlargement of airspaces distal to the terminal
bronchiole, accompanied by destruction of their walls, and without obvious fibrosis ."
Destruction is further defined : "Destruc tion in emphysema is further defined as
nonuniformity in the pattern of respirato ry airspace enlargement so that the orderly
appearance of the acinus and its components is disturbed and may be lost . " The report also
indicates that "Destruction . . .may be recognized by subgross examination of an inflation-fixed
lung slice . . . " Emphysema in laboratory animal models was defined differently . The stated
reason for this difference in the definitions of emphysema in hum ans and in laboratory an imal
models was "In order to foster the development of new knowledge, an imal models of
emphysema are defined as nonrestrictively as possible : An an imal model of emphysema is
defined as an abnormal state of the lungs in which there is enlargement of the airspaces distal
to the terminal bronchiole. Airspace enlargement should be determined qualitatively in
approp riate specimens and quantitatively by stereologic methods ." Thus, in laboratory an imal
models of emphysema, airspace wall destruction need not be present. "Appropriate
specimens presumably refers to lungs fixed in the inflated state and is similar to the 1962
American Thoracic Society Committee's requirement for tissue fixation . This document
states "It is still not clear whether the airspace enlargement of age is due to age alone or to
the combination of age and environmental histo ry , but the occurrence of these changes in
nearly all subjects suggests that the changes are normal" (Meneely et al ., 1962) . Control
an imals of the same age as the experimental an imals appear necessary to avoid potential
confusion due to age . This National Institutes of Health committee also noted that, to date,
animal models of emphysema fall into two general classes . "The first class centers on testing
the pathogenicity of agents suspected of being relev ant to the genesis of emphysema ; models
produced by NO2, cadmium, and tobacco smoke are examples of this type . The second class
of models is analytical, for testing specific hypotheses of the pathogenesis of emphysema . "
Thus, in reviewing reports of emphysema following experimental exposure to a
toxicant, important considerations include ( 1) whether the tissue was fixed in an inflated state ;
(2) whether airspaces distal to the terminal bronchiole were enlarged beyond normal and
whether that enlargement was determined quantitatively by stereologic methods (control
2-37

p. 87
animals of identical age as exposed animals should be used for sterologic studies to exclude
the possibility that airspace enlargement was due to age) ; and (3) whether or not airspace wall
destruction, as defined by the NHLBI workgroup (Snider et al ., 1985), was present . The
presence of airspace wall destruction, as defined by the NHLBI workgroup, is critical .
In published reports of emphysema following exposure to a toxicant evidence of airspace wall
destruction can only be obtained by careful review of the authors' description of the lesions
or by examining the micrographs the author selected for publication . Thus, although a
particular animal species may share a number of similarities with humans in respiratory tract
physiology, it may be dissimilar in crucial parameters and, therefore, be a less than adequate
source as a model .
Sensory Irritation
One endpoint that is specific to inhalation is sensory irritation . Sensory irritants are
defined as chemicals that stimulate trigeminal nerve endings in the cornea and nasal mucosa
and that evoke a stinging or burning sensation. This perception can be accompanied by
irritation of the throat and coughing from stimulation of laryngeal nerve endings . Sensory
irritants induce, among other effects, a postinspiratory apnea in experimental animals,
resulting in a decrease in breathing rate. A test for sensory irritation in laboratory animals
was developed, based on the premise that if sensory irritation can be prevented then systemic
effects will be prevented as well (Alarie, 1984) . The test is based on the decrease in
respiratory frequency occurring in numerous laboratory animals (cats, dogs, mice, rats,
rabbits, and guinea pigs) when exposed to chemical irritants . The decrease in respiratory rate
was found to be concentration-related. The RD50 is the concentration that induces a 50%
decrease in respiratory rate and it has been proposed as the basis of comparison for the
irritating potencies of chemicals (Kane et al ., 1979 ; Alarie, 1984) . The test has become a
standard method adopted by the American Society for Testing and Materials .
It should be emphasized that the mechanism of sensory irritation is a different
mechanism than that by which stimuli (physical, toxicologic, or pharmacologic) cause
obstruction in the lower respiratory tract regions (tracheobronchial and pulmonary) . In fact,
the epidemiology of bronchial or airway responsiveness and the mechanisms underlying the
physiologic phenomenon of airway hyperresponsiveness still are not completely understood.
2-38

p. 88
Multiple mechanisms have been suggested and one or another may predominate in any given
individual . Possible mechanisms include: alterations in airway geometry, disordere d
autonomic regulation of smooth muscle tone, structural alterations in airway smooth muscle,
increased accessibility of stimuli to the muscle, and the release of locally acting mediators of
inflammation . Atopy is a multifactorial trait, both genetically and environmentall y
determined, and is only one mechanism by which levels of airway responsiveness can be
increased .
The relationship of sensory irritation to airway irritation is unknown. It is known that
irritation and toxicity can interfere with trigeminal nerve stimulation . An evaluation of the
sensory irritation test for the assessment of occupational health risk found that quantitative
evaluation with respect to human data was not possible due to a number of factors, including
interlaboratory differences in ability to perform the test and intra- and interspecies
inconsistencies in response (Bos et al ., 1992), although correlation of RD50 values with TLV
values has been demonstrated (Schaper, 1993) . Histopathology has also been reported after
short-term exposure to the RD50 concentration for some irritants (Buckley et al ., 1984) . For
these reasons, the suitability of the sensory irritation test results is limited to serving as an
indication of the potential for respiratory tract irritation. Dose-response assessment of the
sensory irritation test is not recommended especially for quantitative evaluation of chronic
effects .
Asphyxiation
Another effect specific to the inhalation route is asphyxiation . This effect is thought to
be brought about by reversible, "physical" interactions of gas molecules with biomolecules
(e.g., "displacement" of oxygen by carbon dioxide) (Tichy, 1983). The vapor pressure of a
liquid or solid at ambient temperatures determines the maximum exposure concentration
(MEC) for its vapor. The MEC in parts per million may be calculated from the vapor
pressure (VP) at 25 °C according to
VP25 oC (mm Hg)MEC (ppm) =
x 106. (2-1)mm Hg760
2-39

p. 89
Knowing the VP of a liquid or solid is important for estimating its capacity to produc e
reversible effects . A compound with a VP of less than 0 .76 mm Hg at room temperature
will attain an air concentration of less than 1,000 ppm at the saturated vapor concentration .
This concentration is below the limits for which narcotic or anesthetic effects are generally
observed (Tichy, 1983). Therefore, if a material has a VP of less than 0.76 mm Hg, its
potential to produce such effects can reasonably be ruled out (Dahl, 1990) .
Allergic Sensitization
Although most pollutants would be expected to elicit a dose-response upon exposure,
some pollutants cause tolerance/adaptation and some act by allergic or asthmatic mechanisms .
Allergic sensitizers may be considered a subgroup of the agents that produce their critical
effect in the respiratory system. Sensitization is typically caused by high initial doses .
Subsequently, any challenge level of exposure (including low concentrations) may be
sufficient to induce the asthmatic syndrome in sensitized individuals . There is evidence that
IgE antibody levels and inflammatory pulmonary reactions play a role in such syndromes .
Toluene diisocyanate is a well-known example of a sensitizing agent that affects
immunological and pharmacological mechanisms and induces asthma .
The potential for chemicals to induce an airway immune response is related to their
ability to interact with human airway proteins resulting in haptenization or the formation of
new antigenic determinants . Hence, if the structure of the compound suggests that it is
reactive or if it is related to one of the chemicals known to elicit hypersensitivity in humans
(Table 2-5), it is suspect as a potential sensitizing agent . Classes of compounds that have
been most extensively studied for the effects are the anhydrides, isocyanates, and some of the
metal salts .
Several methodologies are now available that test chemicals for their sensitizing
potential . Three of the major approaches include : (1) the Karol method (Karol et al ., 1985 ;
Karol, 1994), (2) the Sarlo method (Sarlo et al ., 1992), and (3) the Dearman/Kimber method
(Dearman et al ., 1992) . None of the methods have been well validated for a range of
chemicals and all have drawbacks . The reader is referred to the summary of workshop
entitled "The Status of Test Methods for Assessing Potential of Chemicals to Induce
Respiratory Allergenic Reactions" (Selgrade et al ., 1994) and to Briatico-Vangosa et al .
2-40

P. 90
TABLE 2-5. AGENTS CAUSING WHEEZING AND BRONCHOCONSTRICTION
Large molecular weight compounds Cyanuric chloride
Animals proteins Platinum salts
Laboratory animals Dyes
Domestic animals Azo, anthraquinone, remazol black B dye
Birds Diisocyanates
Sea squirts Toluene diisocyanate
Prawns Diphenylmethane diisocyanate
Grain weevils Hexamethylene diisocyanate
Mites Antibiotics
Arthropods Metallic salts
Enzymes (animal) Nickel
Subtilisin Chromium
Trypsin, pancreatin Aluminum
Plant proteins Fluxes
Cereal grains Colophony
Legumes (coffee, soy, castor bean) Aminoethylethanolamine
Pollen Miscellaneous
Seeds (cotton, flax, linseed) Formaldehyde
Enzymes (plant) Piperazine
Papain, bromelain, pectinase, diastase Plicatic acid
Vegetable gums Pyrethrins
Karaya, tragacanth, acacia (arabic), Extract of hennaquillaja
Fungi
Mold
Inorganic and organic compounds of smal lmolecular weight
Abietic acid
Anhydrides
Phthalic, trimellitic, hexahydrophthalic,tetrachlorophthalic, himic
Adapted from : Moller et al . (1986) ; Selgrade et al . (1994) ; Briatico-Yangosa et al . (1994) .
2-41

P. 91
(1994) for additional information and guidance on hazard identification and assessment of
respiratory allergic reactions .
Summary
Identification of the most appropriate laboratory animal species is the end result of an
interpretative process that examines all facets of a data base from study design to data
relevance to the extrapolation methodology .
The most sensitive species is selected from evaluation of key studies . Although this
approach (i .e., NOAEL identification) may have the advantage of affording a greater degree
of protection, the species most sensitive to an agent may not be as toxicologically relevant as
other species for extrapolation to humans because of a variety of interspecies variables .
Selection of an appropriate animal model and key study depends on the depth of
understanding of the human disease syndrome, adverse effect, or indicator of toxicity selected
as the criterion for evaluation . For agents whose toxicological outcome is dependent on the
degree to which it is metabolized, the most appropriate animal species is contingent upon
proper evaluation of the numerous interspecies differences with respect to metabolism (see
also Section 3 .2) . The studies of Plopper et al . (1983) suggest that animal species differ
widely in metabolizing potential of the respiratory tract . Hamsters and rabbits have much
greater metabolizing potentials than do monkeys and rats . Interspecies differences in the
metabolic pathway, as shown for xylene (National Toxicology Program, 1986), may serve as
a basis for selecting one study for RfC derivation and rejecting another . Species-dependent
variables in mucous production and secretion are factors in selecting an appropriate animal
model (see also Chapter 3) for irritants .
The subject of appropriate animal models has been reviewed (Hakkinen and Witschi,
1985) and various mammalian species (rat, hamster, and rabbit) were identified as appropriate
species for extrapolation from several perspectives . Other reviews that discuss the current
limitations and need for the development of animal models as surrogates for humans include
those of Reid (1980), Slauson and Hahn (1980), and Calabrese (1983) .
2-42
p. 92
2 .1 .2.4 Study Validity and Relevance to Extrapolation
The validity of the study and its relevance to human extrapolation is another major area
to consider when assessing individual animal studies. It involves the evaluation of a number
of factors, including all elements of exposure definition (concentration, duration, frequency,
administration route, and physicochemical characterization of the chemical used), reliability
of and limits to the procedures used for both exposure and effects measurements, relevance of
the exposure level tested to the anticipated human exposure level, nature of the effect
(consistency with the area of toxicology assessed and the suspected mechanism of action), and
the similarities and differences between the test species and humans (e .g., in absorption and
metabolism) .
Animal studies are conducted using a variety of exposure scenarios in which the
concentration, frequency, and duration of exposure may vary considerably . Studies may use
different durations (acute, subchronic, and chronic) as well as schedules (single, intermittent,
and continuous) . All of these studies contribute to the hazard identification of the risk
assessment . Special consideration should be addressed to those studies of appropriate
duration for the reference level to be determined (i .e., chronic investigations for the RfC) .
These exposure concerns (concentration and duration) are compounded when the risk
assessor is presented with data from several animal studies . An attempt to identify the animal
model most relevant to humans should be made on the most defensible biological rationale
(e.g ., comparable metabolism and pharmacokinetic profiles) . In the absence of such a
model, the most sensitive species (i .e., the species showing a toxic effect at the lowest
administered dose) is adopted for use as a matter of science policy at the EPA (Barnes and
Dourson, 1988). This selection process is more difficult if the laboratory animal data are for
various exposure routes, especially if the routes are different from that in the human situation
of concern .
Because the data base may be deficient for the route of exposure of interest, it is the
EPA's view that the toxicity potential manifested by one route can be indicative of potential
toxicity via any other exposure route unless convincing contrary evidence exists (Barnes and
Dourson, 1988) . Quantitative extrapolation, however, requires consideration of the
differences in the dosimetry for the chemical resulting from the different exposure routes .
Detailed consideration is given to route-to-route extrapolation in Section 4 .1 .2.
2-43
p. 93
2.1 .3 Summarizing the Evidence
The culmination of the hazard identification phase of any risk assessment involves
integrating a diverse data collection into a cohesive, biologically plausible toxicity "picture" ;
that is, to develop the weight of evidence that the chemical poses a hazard to humans . The
salient points from each of the laboratory animal and human studies in the entire data base
should be summarized as should the analysis devoted to examining the variation or
consistency among factors (usually related to the mechanism of action), in order to establish
the likely outcome for exposure to this chemical . From this analysis, an appropriate animal
model or additional factors pertinent to human extrapolation may be identified .
The utility of a given study is often related to the nature and quality of the other
available data . For example, clinical pharmacokinetic studies may validate that the target
organ or disease in laboratory an imals is likely to be the same effect observed in the exposed
human population. However, if a cohort study describing the nature of the dose-response
relationship were available, the clinical description would rarely give additional information .
An apparent conflict may arise in the analysis when an association is observed in toxicologic
but not epidemiologic data, or vice versa . The analysis then should focus on reasons for the
apparent difference in order to resolve the discrepancy . For example, the epidemiologic data
may have contained other exposures not accounted for, or the laboratory animal species tested
may have been inappropriate for the mechanism of action . A framework for approaching
data summary is provided in Table 2-6 . Table 2-7 provides the specific uses of various types
of human data in such an approach . These guidelines have evolved from criteria used to
establish causal significance, such as those developed by the American Thoracic Society
(1985) to assess the causal significance of an air toxicant and a health effect . The criteria for
establishing causal significance can be found in Appendix C . In general, the following
factors enhance the weight of evidence on a chemical :
• Clear evidence of a dose-response relationship ;
• Similar effects across sex, strain, species, exposure routes, or in multipleexperiments ;
• Biologically plausible relationship between metabolism data, the postulatedmechanism of action, and the effect of concern ;
2-44
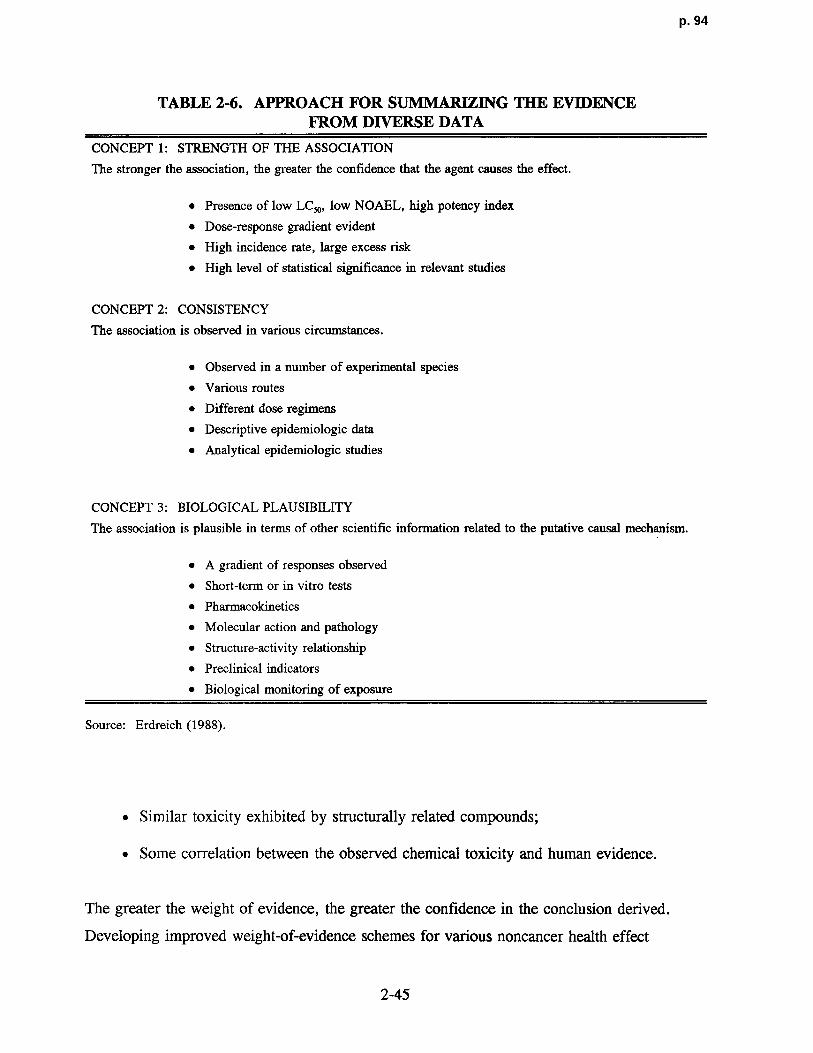
p. 94
TABLE 2-6. APPROACH FOR SUMMARIZING THE EV IDENCEFROM DIVERSE DATA
CONCEPT 1 : STRENGTH OF THE ASSOCIATION
The stronger the association, the greater the confidence that the agent causes the effect .
• Presence of low LC,, , low NOAEL, high potency index
• Dose-response gradient evident
• High incidence rate, large excess risk
• High level of statistical significance in relevant studies
CONCEPT 2: CONSISTENCY
The association is observed in various circumstances .
• Observed in a number of experimental species
• Various routes
• Different dose regimens
• Descriptive epidemiologic data
• Analytical epidemiologic studies
CONCEPT 3 : BIOLOGICAL PLAUSIBILITY
The association is plausible in terms of other scientific information related to the putative causal mechanism.
• A gradient of responses observe d
• Short-term or in vitro tests
• Pharmacokinetics
• Molecular action and pathology
• Structure-activity relationship
• Preclinical indicators
• Biological monito ring of exposure
Source: Erdreich (1988) .
• Similar toxicity exhibited by structurally related compounds ;
• Some correlation between the observed chemical toxicity and human evidence .
The greater the weight of evidence, the greater the confidence in the conclusion derived .
Developing improved weight-of-evidence schemes for various noncancer health effec t
2-45

p. 95
TABLE 2-7. HUMAN DATA FOR USE IN HEALTH RISK ASSESSMENT
Study (Alternative Terms) Comment on Potential Use
EPIDEMIOLOGIC DATA
Cohort (longitudinal, prospective, Rates as percent response useful in risk assessment. Measure ofincidence) excess risk can be obtained. If dose or exposure data are
available, dose-response curves can be constructed . Studies withordinal exposure data support strength of evidence and hazardidentification .
Case-control (retrospective, dose or No direct measure of disease rates . If exposure data are available,case-referent) a NOAEL may be identified .' Studies with ordinal or nominal
exposure data may support strength of evidence and hazardidentification .
Cross-sectional (prevalence)' Similar to case-control for short-term effects . Prevalence data lessreliable for effects from chronic exposures .
Geographic correlationb An inexpensive screening procedure . Crude indicator of potentialhazard . Rates are usually only indirectly related to exposure.Generates hypotheses for analytical studies .
Clinical trials Generally not applicable to environmental issues, becauseexposures are treatments or preventive measures . Interventiontrials in which an exposure is removed or changed (e .g .,medication, smoking, diet) are useful in strength of the evidencefor evaluating causality .
NONEPIDEMIOLOGIC DATA
Experimental studies The only human data with controlled exposure levels . Usuallyinterval level exposure data but low dose, limited exposure time .Use for hazard identification and dose-response assessment .
"Exposed-control" comparisons Rates may be biased because of self-selection or incomplete(noncohort ; see text for discussion) ascertainment of exposed population . Cannot be used to support
absence of hazard . Clinical descriptions useful for hazardidentification .
Case series° Can be used to demonstrate hazard if syndrome is unusual .Usually high level, short-term exposure . May yield data point foradverse-effect levels. Cannot be used to show absence of hazard .
Case reports Suggests nature of acute endpoints in humans . Cannot be used tosupport absence of hazard .
'Exposure history is difficult to reconstruct, particularly outside of the occupational setting .Nay be available pertinent to air pollution exposure .
'Several cases seen by or reported by a single investigator . Cases may be attributed to unique exposure
incident, but total exposed population is not defined .
Source: Adapted from Erdreich and Burnett (1985) .
2-46

p. 96
categories has been the focus of efforts by the Agency to improve health risk assessment
methodologies (Perlin and McCormack, 1988) .
Another difficulty encountered in this summarizing process is that certain studies may
produce apparently positive or nega tive results, yet may be flawed. The flaws may have
arisen from inappropriate design or execu tion in performance (e.g., lack of statistical power
or adjustment of dosage during the course of the study to avoid undesirable toxic effects) .
The treatment of flawed results is critical; although there is something to be lea rned from
every study, the extent that a study should be used is dependent on the nature of the flaw
(Society of Toxicology, 1982) . A flawed negative study could only provide a false sense of
security, whereas a flawed positive study may contribute to some limited understanding .
Although there is no substitute for good science, grey areas such as this are ul timately a
matter of scientific judgment. The risk assessor will have to decide what is and is not useful
within the framework outlined earlier .
Studies meeting the criteria detailed in Sections 2.1 .1 and 2.1 .2 (epidemiologic,
nonepidemiologic data), and experimental studies on laboratory animals that fit into this
weight-of-evidence framework are used in the qu anti tative dose-response assessment discussed
in Chapter 4 .
2-47

p. 97
3 . CONCEPTUAL BASIS FOR INHALATIO NDOSE-RESPONSE ASSESSMENT METHODOLOGY
As discussed in Chapter 1, comprehensive characterization of the exposure-dose-
response continuum is the fundamental objective of any dose-response assessment . Species
differences in anatomical and physiological characteristics, the wide range of physicochemical
properties associated with inhaled chemicals, the diversity of cell types that may be affected,
and a myriad of mechanistic and metabolic differences combine to make the characterization
particularly complex for the respiratory tract as the portal of entry . This chapter attempts to
discuss these factors within the exposure-dose-response context in order to present unifying
concepts. These concepts are used to construct a framework by which to evaluate the
different available dosimetry models ; appreciate why they are constructed differently ; and
determine how the default approaches presented in Chapter 4 are derived .
3.1 FACTORS CONTROLLING COMPARATIVE INHALED DOSE
The various species used in inhalation toxicology studies do not receive identical doses
in comparable respiratory tract regions when exposed to the same external particle or gas
concentration (Brain and Mensah, 1983) . The biologic endpoint or health effect, therefore,
may be more directly related to the quantitative pattern of mass deposited within the
respiratory tract than to the external exposure concentration . Regional deposition pattern
determines not only the initial lung tissue doses but also the specific pathways and rates by
which the inhaled agents are cleared and redistributed (Schlesinger, 1985) .
This section discusses the issues associated with the two major factors controlling the
deposition pattern : (1) respiratory anatomy and physiology (Section 3 .1 .1) and (2) the
physicochemical characteristics of the inhaled toxicant (Section 3 .1 .2) .
The factors that control inhaled dose are discussed relative to the significant mechanisms
by which particles and gases may initially be deposited or taken up in the respiratory tract .
Note that, in this document, disposition is defined as encompassing the processes of
deposition, absorption, distribution, metabolism, and elimination . Initial deposition is used i n
3-1

p. 98
reference to gases as well as particles because contact with the respiratory tract surfac e
precedes absorption . For particles, deposition mechanisms include inertial impaction,
sedimentation (gravitational), diffusion, interception, and electrostatic precipitation, whereas
mechanisms important for gases include convection, diffusion, chemical reaction (including
metabolism), dissolution, and perfusion . Detailed consideration of these mechanisms is
beyond the scope of this discussion . The reader is referred elsewhere for more extensive
discussions of particle deposition (U .S . Environmental Protection Agency, 1982b, 1986c ;
Hatch and Gross, 1964 ; Raabe, 1979; Hinds, 1982; Lippmann and Schlesinger, 1984) and
gas absorption (U .S. Environmental Protection Agency, 1986, 1993b; Fiserova-Bergerova,
1983 ; Overton, 1984 ; Overton-and Miller, 1988) .
It must be emphasized that dissection of the factors that control inhaled dose into
discrete topic discussions is deceptive and masks the dynamic nature of the intact respiratory
system . For example, although deposition in a particular respiratory region will be discussed
separately from the clearance mechanisms for that region, retention (the actual amount of
inhaled agent found in the lungs at any time) is determined by the relative rates of deposition
and clearance. Retention and the toxicologic properties of the inhaled agent are related to the
magnitude of the pharmacologic, physiologic, or pathologic response . Therefore, although
the deposition, clearance mechanisms, and physiochemical properties of the agent are
described in distinct sections, assessment of the overall toxicity requires integration of the
various factors .
As discussed in Chapter 1, comprehensive description of the exposure-dose-response
continuum requires integration of quantitative knowledge of appropriate mechanistic
determinants of chemical disposition, toxicant-target interactions, and tissue responses into an
overall model of pathogenesis . Improvements in this process will be accomplished in the area
of extrapolation modeling (Miller et al ., 1983a; Fiserova-Bergerova, 1983) . This involves
determining the dose delivered to the target organ of various species and the sensitivity of the
target organ to that dose . Once such dosimetry has been established and species sensitivity
accounted for, the effective pollutant concentration in laboratory animals can be quantitatively
related to concentration responses in humans . Extrapolation models should incorporate
parameters such as species-specific anatomical and ventilatory differences, metaboli c
3-2

P . 99
processes, and the physicochemical properties of the pollutant and should be physiologicall y
based upon the factors that govern transport and removal of the pollutant .
This chapter provides background information on the major determinants controlling
comparative inhaled dose that should be considered when evaluating the results of
toxicological and human studies for selection of the key studies for the determination of an
inhalation reference concentration (RfC) . This background information also provides the
theoretical considerations that are addressed (to varying degrees) by different dosimetry
models, such as those described in Appendices G, I, and J that serve as the basis for the
dosimetric adjustments used in Chapter 4 to extrapolate from experimental conditions to
human equivalent concentrations . A framework by which to evaluate the degree to which
different dosimetry models address these considerations is provided as a summary in
Section 3 .2.3 .
3.1 .1 Respiratory Anatomy and Physiology
The respiratory systems of humans and various experimental animals differ in anatomy
and physiology in many quantitative and qualitative ways . These variations affect air flow
patterns in the respiratory tract, and in turn, the deposition of an inhaled agent, as well as the
retention of that agent in the system . The variations in anatomy and physiology will be
discussed according to respiratory regions and branching patterns, clearance mechanisms, and
cell types. Clearance mechanisms as used here include processes such as the mucociliary
escalator, solubilization in various compartments, uptake, and metabolism .
3.1.1.1 Respiratory Regions and Branching Pattern s
The respiratory tract in both humans and experimental animals can be divided into three
regions on the basis of structure, size, and function : the extrathoracic region (ET) that
extends from just posterior to the external nares to just anterior to the trachea, the
tracheobronchial region (TB) defined as the trachea to the terminal bronchioles where
proximal mucociliary transport begins, and the pulmonary region (PU) including the terminal
bronchioles and alveolar sacs . The thoracic (TH) region is defined as the tracheobronchial
and pulmonary regions combined . The anatomic structures included in each of these
respiratory tract regions are listed in Table 3-1, and Figure 3-1 provides a diagrammatic
3-3
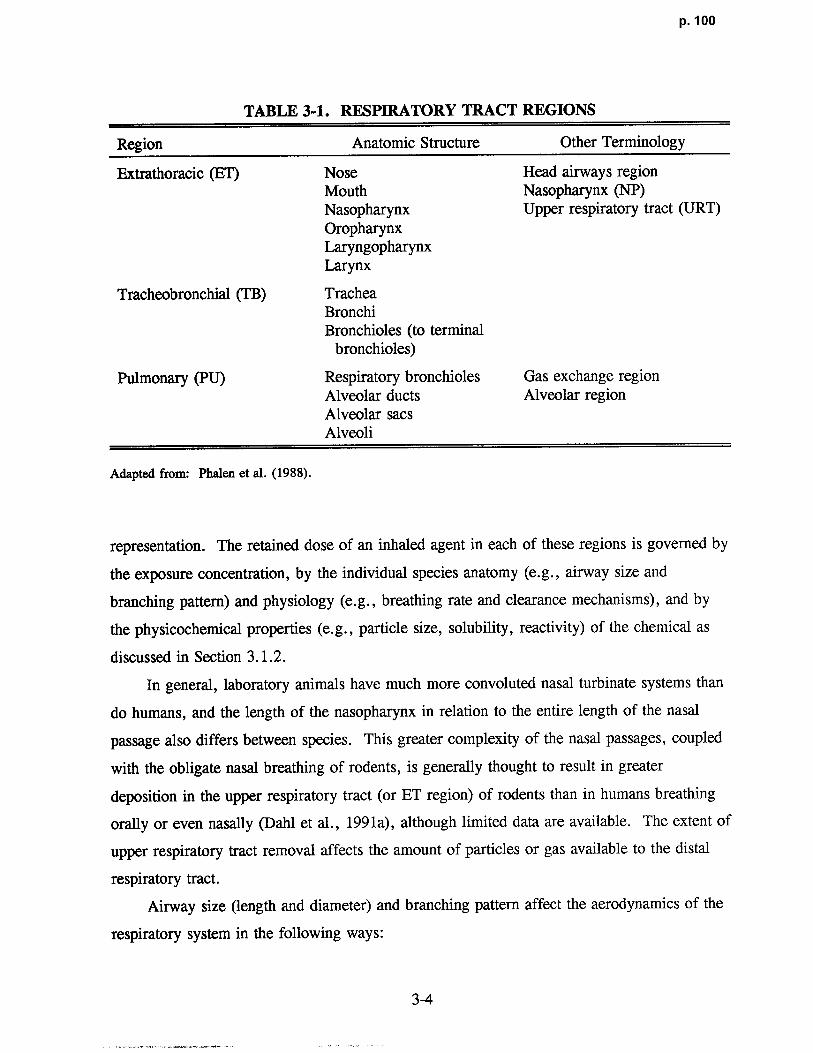
p. 100
TABLE 3-1. RESPIRATORY TRACT REGIONS
Region Anatomic Structure Other Terminology
Extrathoracic (ET) Nose Head airways regionMouth Nasopharynx (NP)Nasopharynx Upper respiratory tract (URT)OropharynxLaryngopharynxLarynx
Tracheobronchial (TB) TracheaBronchiBronchioles (to terminal
bronchioles)
Pulmonary (PU) Respiratory bronchioles Gas exchange regionAlveolar ducts Alveolar regionAlveolar sac sAlveoli
Adapted from : Phalen et al . (1988) .
representation . The retained dose of an inhaled agent in each of these regions is governed by
the exposure concentration, by the individual species anatomy (e .g ., airway size and
branching pattern) and physiology (e .g ., breathing rate and clearance mechanisms), and by
the physicochemical properties (e .g., particle size, solubility, reactivity) of the chemical as
discussed in Section 3 .1 .2 .
In general, laboratory animals have much more convoluted nasal turbinate systems than
do humans, and the length of the nasopharynx in relation to the entire length of the nasal
passage also differs between species . This greater complexity of the nasal passages, coupled
with the obligate nasal breathing of rodents, is generally thought to result in greater
deposition in the upper respiratory tract (or ET region) of rodents than in humans breathing
orally or even nasally (Dahl et al ., 1991a), although limited data are available. The extent of
upper respiratory tract removal affects the amount of particles or gas available to the distal
respiratory tract.
Airway size (length and diameter) and branching pattern affect the aerodynamics of the
respiratory system in the following ways :
3-4