eoc physics web samples goal 2 4620
TRANSCRIPT

North Carolina Testing Program EOC Physics Sample Items Goal 2
Page 1 Published December 2007. May reproduce for instructional and educational purposes only; not for personal or financial gain.
1. A student walks 160 m in 150 s. The student stops for 30 s and then walks 210 m farther in s 140 . What is the average speed of the entire walk?
A 0.53 m/s
B 0.80 m/s
C 1.2 m/s
D 1.3 m/s
2. This table gives the position of a car as a function of time.
Position (m)Time (s)
5
133
9
2
0 5
13
4 15
1
20 What is the average velocity during the interval 2 s to 3 s?
A 0 m/s
B 2 m/s
C 3 m/s
D 4 m/s
North Carolina Testing Program EOC Physics Sample Items Goal 2
Page 2 Published December 2007. May reproduce for instructional and educational purposes only; not for personal or financial gain.
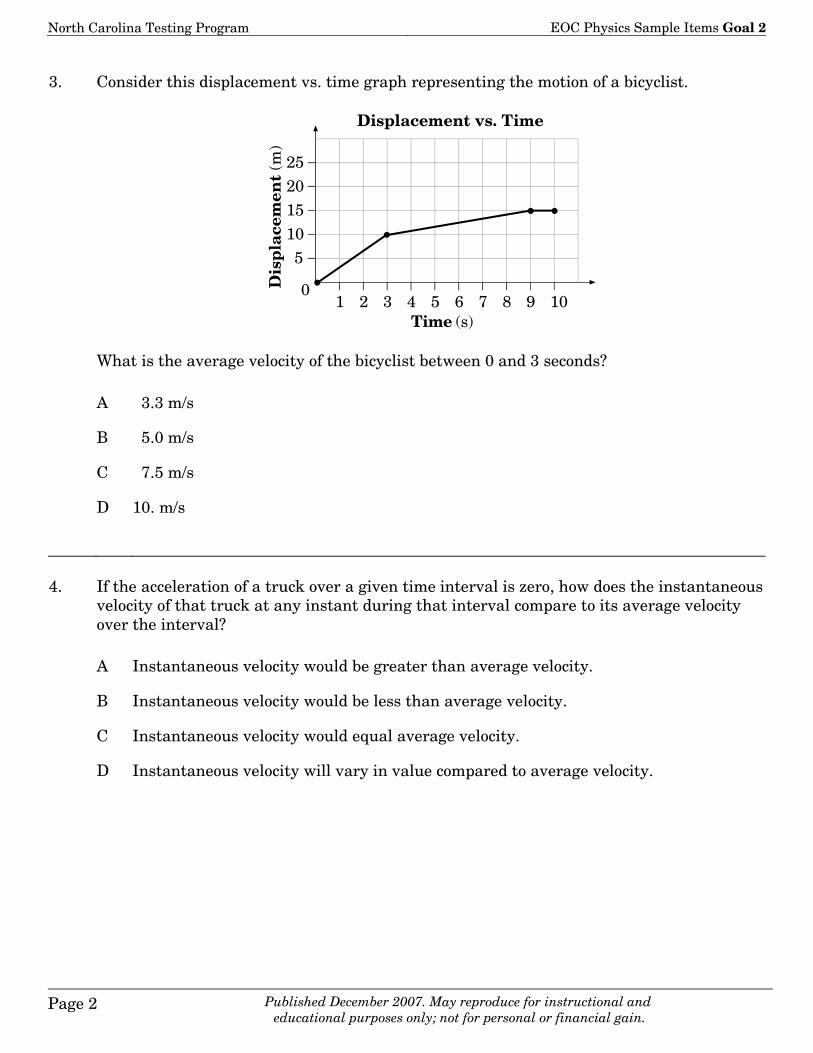
3. Consider this displacement vs. time graph representing the motion of a bicyclist.
Time (s)
01 2 3 4 5 6 7 8 9 10
5
10
15
20
25
Displacement vs. Time
What is the average velocity of the bicyclist between 0 and 3 seconds?
A 3.3 m/s
B 5.0 m/s
C 7.5 m/s
D 10. m/s
4. If the acceleration of a truck over a given time interval is zero, how does the instantaneous
velocity of that truck at any instant during that interval compare to its average velocity over the interval?
A Instantaneous velocity would be greater than average velocity.
B Instantaneous velocity would be less than average velocity.
C Instantaneous velocity would equal average velocity.
D Instantaneous velocity will vary in value compared to average velocity.

North Carolina Testing Program EOC Physics Sample Items Goal 2
Page 3 Published December 2007. May reproduce for instructional and educational purposes only; not for personal or financial gain.
5. A car travels from A to B at a constant 100 km/hr.
�
�
Which of the following changes?
A speed
B velocity
C frame of reference
D speed and velocity
6. A person walks 10 km due east, then
30 km at 60° N of E. What is the shortest route back to his starting point?
A 36 km at 46° S of W
B 36 km at 46° N of E
C 40 km at 46° S of W
D 40 km at 46° N of W
7. An airplane went from 120 m/s to 180 m/s in 4.0 seconds. What was its acceleration?
A 15 m/s/s
B 30. m/s/s
C 45 m/s/s
D 60. m/s/s

North Carolina Testing Program EOC Physics Sample Items Goal 2
Page 4 Published December 2007. May reproduce for instructional and educational purposes only; not for personal or financial gain.
8. Which position vs. time graph indicates an object undergoing uniformly accelerated motion?
A
Time
B
Time
C
Time
D
Time
9. A rocket lifts vertically off the launching pad and reaches a final velocity of 450 m/s in 15 seconds. What is its acceleration?
A 30. m/s/s
B 45 m/s/s
C 60. m/s/s
D 450 m/s/s
10. What does the area bound by this velocity curve and time axis represent?
Time vs. Velocity
Time
A acceleration
B displacement
C position
D velocity

North Carolina Testing Program EOC Physics Sample Items Goal 2
Page 5 Published December 2007. May reproduce for instructional and educational purposes only; not for personal or financial gain.
11. This is a velocity vs. time graph for a moving car.
Time (s)
Velocity vs. Time
What does the slope of the line on this graph represent?
A displacement
B average velocity
C acceleration
D momentum

North Carolina Testing Program EOC Physics Sample Items Goal 2
Page 6 Published December 2007. May reproduce for instructional and educational purposes only; not for personal or financial gain.
12. The graph represents the velocity of a car.
Velocity vs. Time
40.0
20.0
10.0
2.0 4.0Time (s)
30.0
1.0 3.0 5.0 7.06.00
What is the displacement of the car during the time interval shown?
A 0.18 m
B 5.7 m
C 140 m
D 280 m

North Carolina Testing Program EOC Physics Sample Items Goal 2
Page 7 Published December 2007. May reproduce for instructional and educational purposes only; not for personal or financial gain.
13. This displacement-time graph below represents the motion of a cart along a straight line.
Time (s)I
II
III IV
V
Displacement vs. Time for a Cart
During which interval was the cart accelerating?
A I—II
B II—III
C III—IV
D IV—V

North Carolina Testing Program EOC Physics Sample Items Goal 2
Page 8 Published December 2007. May reproduce for instructional and educational purposes only; not for personal or financial gain.
14. Based on this graph, which is constant?
Time
A displacement
B position
C time
D velocity
15. This graph shows the position of a car along a straight path as a function of time.
Time (s)
0
1
23
4
5
6
4 8 12 16 20 24
I
II III
IV V
Position vs. Time
What is the car’s velocity at 2.0 sec?
A 1.25 m/s
B 2.50 m/s
C 5.00 m/s

North Carolina Testing Program EOC Physics Sample Items Goal 2
Page 9 Published December 2007. May reproduce for instructional and educational purposes only; not for personal or financial gain.
16. This is a velocity vs. time graph of an object.
10
1
Time (s)
2
3
—1
—2
—3
2 3 4 5 6 7
Velocity vs. Time
What is the velocity of the object at t = 3s?
A —2 m/s
B 0 m/s
C 1 m/s
D 2 m/s

North Carolina Testing Program EOC Physics Sample Items Goal 2
Page 10 Published December 2007. May reproduce for instructional and educational purposes only; not for personal or financial gain.
17. What does the shaded area of the acceleration vs. time graph indicate?
Time (s)
A total displacement
B change in velocity
C instantaneous velocity
D average displacement
18. This is an acceleration vs. time graph of an object.
2
4
6
2 4 6 8Time (s)
00
If the object’s initial velocity is 0 m/s, what is the velocity of an object at t = 8.0 s?
A 0.50 m/s
B 2.0 m/s
C 12 m/s
D 32 m/s
End of Goal 2 Sample Items
In compliance with federal law, including the provisions of Title IX of the Education Amendments of 1972, the Department of Public Instruction does not discriminate on the basis of race, sex, religion, color, national or ethnic origin, age, disability, or military service in its policies, programs, activities, admissions or employment.

EOC Physics Goal 2 Sample Items Key Report
Page 1
Published December 2007. May reproduce for instructional and educational purposes only; not for personal or financial gain.
1 Objective: 2.01a Analyze velocity as a rate of change of position:
a. Average velocity. Thinking Skill: Applying Correct Answer: C 2 Objective: 2.01 Analyze velocity as a rate of change of position:
a. Average velocity. b. Instantaneous velocity.
Thinking Skill: Analyzing Correct Answer: A 3 Objective: 2.01 Analyze velocity as a rate of change of position:
a. Average velocity. b. Instantaneous velocity.
Thinking Skill: Analyzing Correct Answer: A 4 Objective: 2.01 Analyze velocity as a rate of change of position:
a. Average velocity. b. Instantaneous velocity.
Thinking Skill: Integrating Correct Answer: C 5 Objective: 2.02 Compare and contrast as scalar and vector quantities:
a. Speed and velocity. b. Distance and displacement. Thinking Skill: Generating Correct Answer: B 6 Objective: 2.02 Compare and contrast as scalar and vector quantities:
a. Speed and velocity. b. Distance and displacement. Thinking Skill: Knowledge Correct Answer: A 7 Objective: 2.03 Analyze acceleration as rate of change in velocity. (Include negative acceleration) Thinking Skill: Applying Correct Answer: A 8 Objective: 2.03 Analyze acceleration as rate of change in velocity. (Include negative acceleration) Thinking Skill: Analyzing Correct Answer: C

EOC Physics Goal 2 Sample Items Key Report
Page 2
Published December 2007. May reproduce for instructional and educational purposes only; not for personal or financial gain.
9 Objective: 2.03 Analyze acceleration as rate of change in velocity. (Include negative acceleration) Thinking Skill: Applying Correct Answer: A 10 Objective: 2.04 Using graphical and mathematical tools, design and conduct investigations of linear
motion and the relationships among: a.acceleration. b. velocity. c. Instantaneous velocity. d. Instantaneous velocity
Thinking Skill: Analyzing Correct Answer: B 11 Objective: 2.03 Analyze acceleration as rate of change in velocity. (Include negative acceleration) Thinking Skill: Knowledge Correct Answer: C 12 Objective: 2.04a Using graphical and mathematical tools, design and conduct investigations of linear
motion and the relationships among: a. acceleration.
Thinking Skill: Analyzing Correct Answer: C 13 Objective: 2.04 Using graphical and mathematical tools, design and conduct investigations of linear
motion and the relationships among: a.acceleration. b. velocity. c. Instantaneous velocity. d. Instantaneous velocity
Thinking Skill: Analyzing Correct Answer: A 14 Objective: 2.04 Using graphical and mathematical tools, design and conduct investigations of linear
motion and the relationships among: a.acceleration. b. velocity. c. Instantaneous velocity. d. Instantaneous velocity
Thinking Skill: Analyzing Correct Answer: D

EOC Physics Goal 2 Sample Items Key Report
Page 3
Published December 2007. May reproduce for instructional and educational purposes only; not for personal or financial gain.
15 Objective: 2.04 Using graphical and mathematical tools, design and conduct investigations of linear
motion and the relationships among: a.acceleration. b. velocity. c. Instantaneous velocity. d. Instantaneous velocity
Thinking Skill: Analyzing Correct Answer: A 16 Objective: 2.04 Using graphical and mathematical tools, design and conduct investigations of linear
motion and the relationships among: a.acceleration. b. velocity. c. Instantaneous velocity. d. Instantaneous velocity
Thinking Skill: Analyzing Correct Answer: D 17 Objective: 2.04 Using graphical and mathematical tools, design and conduct investigations of linear
motion and the relationships among: a.acceleration. b. velocity. c. Instantaneous velocity. d. Instantaneous velocity
Thinking Skill: Analyzing Correct Answer: B 18 Objective: 2.04 Using graphical and mathematical tools, design and conduct investigations of linear
motion and the relationships among: a.acceleration. b. velocity. c. Instantaneous velocity. d. Instantaneous velocity
Thinking Skill: Analyzing Correct Answer: D