envisat mipas monthly report december 20032003 - … · a mipas_december_monthly_re port_v1.0.doc f...
TRANSCRIPT

a
MIPAS_December_Monthly_Re
port_V1.0.doc
fD O C U M E N TD O C U M E N TD O C U M E N TD O C U M E N T
document title/ titre du document
ENVISAT MIPAS ENVISAT MIPAS ENVISAT MIPAS ENVISAT MIPAS MMMMONTHLY ONTHLY ONTHLY ONTHLY RRRREPORTEPORTEPORTEPORT: : : : DDDDECEMBER ECEMBER ECEMBER ECEMBER 2003200320032003
prepared by/préparé par MIPAS Quality Working Group reference/réference ENVI-SPPA-EOPG-TN-04-0001 issue/édition 1.0 revision/révision 0 date of issue/date d’édition 14 January 2004 status/état Final Document type/type de document Technical Note

ENVISAT MIPAS Monthly Report: December 2003 issue 1.0 revision 0 - 14141414 January 2004
ENVI-SPPA-EOPG-TN-04-0001 page ii of iv
s
A P P R O V A LA P P R O V A LA P P R O V A LA P P R O V A L
Title titre
ENVISAT MIPAS Monthly Report: December 2003 issue issue
1.0 revision revision
0
author auteur
MIPAS Quality Working Group date date
14 January 2004
approved by approuvé by
date date
C H A N G E L O GC H A N G E L O GC H A N G E L O GC H A N G E L O G
reason for change /raison du changement issue/issue revision/revision date/date
C H A N G E R E C O R DC H A N G E R E C O R DC H A N G E R E C O R DC H A N G E R E C O R D
Issue: 1.0 Revision: 0
reason for change/raison du changement page(s)/page(s) paragraph(s)/paragraph(s)

ENVISAT MIPAS Monthly Report: December 2003 issue 1.0 revision 0 - 14141414 January 2004
ENVI-SPPA-EOPG-TN-04-0001 page iii of iv
s
TTTT A B L E A B L E A B L E A B L E OOOO F F F F CCCC O N T E N T SO N T E N T SO N T E N T SO N T E N T S
1 INTRODUCTION ......................................................................................................................1 1.1 Scope..................................................................................................................................................1 1.2 Acronyms and Abbreviations.............................................................................................................2
2 THE MONTHLY REPORT ........................................................................................................3 2.1 Summary ..............................................................................................................................................3 2.2 Unavailability.......................................................................................................................................3
2.2.1 Instrument Unavailability .............................................................................................................3 2.2.2 Data Generation Gaps ...................................................................................................................4
2.2.2.1 MIP_NL__0P .........................................................................................................................4 2.2.2.2 MIP_LS__0P..........................................................................................................................5 2.2.2.3 MIP_RW__0P........................................................................................................................5 2.2.2.4 MIP_NL__1P .........................................................................................................................5
2.3 Instrument Configuration and Performance.........................................................................................5 2.3.1 MIPAS Operations ........................................................................................................................5 2.3.2 Thermal Performance....................................................................................................................7 2.3.3 Mechanical Performance...............................................................................................................9
2.3.3.1 Cooler Performance ...............................................................................................................9 2.3.3.2 Interferometer Performance .................................................................................................10 2.3.3.3 ASU/ESU Performance........................................................................................................12
2.3.4 Other Instrument Parameters ......................................................................................................12 2.4 Level 1 Product Quality Monitoring ..................................................................................................10
2.4.1 Processor Configuration..............................................................................................................12 2.4.1.1 Version .................................................................................................................................12 2.4.1.2 Auxiliary Data Files .............................................................................................................13
2.4.2 Spectral Performance ..................................................................................................................15 2.4.3 Radiometric Performance............................................................................................................17 2.4.4 Pointing Performance..................................................................................................................19 2.4.5 Other Results...............................................................................................................................20
2.5 Level 2 Product Quality Monitoring ..................................................................................................20 2.5.1 Processor Configuration..............................................................................................................20
2.5.1.1 Version .................................................................................................................................20 2.5.1.2 Auxiliary Data Files .............................................................................................................21
2.5.2 REC Analysis ..............................................................................................................................23 2.5.3 Occupation Matrix Statistics .......................................................................................................31 2.5.4 Altitude Retrieval Performance...................................................................................................33 2.5.5 Other Level 2 Performance Issues ..............................................................................................37
2.5.5.1 Improvement Done...............................................................................................................37 2.6 Validation Activities and Results.......................................................................................................42
2.6.1 Consistency Verification.............................................................................................................42

ENVISAT MIPAS Monthly Report: December 2003 issue 1.0 revision 0 - 14141414 January 2004
ENVI-SPPA-EOPG-TN-04-0001 page iv of iv
s 2.6.2 Statistics from Intercomparison with External Data ...................................................................47
2.6.2.1 Comparison with ECMWF data...........................................................................................47

ENVISAT MIPAS Monthly Report: December 2003 issue 1.0 revision 0 - 14 January 2004
ENVI-SPPA-EOPG-TN-04-0001 page 1 of 48
s
1 INTRODUCTION The MIPAS Monthly Report (MR) documents the current status and recent changes to the MIPAS instrument, its data processing chain, and its data products. The MR is composed of analysis results obtained by the Product Control Facility (PCF), combined with inputs received from the different groups working on MIPAS operation, calibration, product validation and data quality. The following groups participate in the MIPAS Quality Working Group (QWG):
• ESRIN-PCF • ESOC • ESTEC • ABB BOMEM • Oxford University • IFAC-CNR • EADS-Astrium GmbH • Leicester University • LPM • IMK • University of Bologna, • ISAC, • IAA • DLR • ECMWF
In addition, the group interfaces with the Atmospheric Chemistry Validation Team (ACVT).
1.1 Scope The main objective of the MR is to give, on a regular basis, the status of MIPAS instrument performance, data acquisition, results of anomaly investigations, calibration activities and validation campaigns. The MR is composed of the following six sections:
• Summary; • Unavailability; • Instrument Configuration and Performance; • Level 1 Product Quality Monitoring; • Level 2 Product Quality Monitoring; • Validation Activities and Results.

ENVISAT MIPAS Monthly Report: December 2003 issue 1.0 revision 0 - 14 January 2004
ENVI-SPPA-EOPG-TN-04-0001 page 2 of 48
s 1.2 Acronyms and Abbreviations ACVT Atmospheric Chemistry Validation Team AIRS Atmospheric Infrared Sounder ANX Ascending Node Crossing APID Application Process Identifier AR Anomaly Report ASP Analogue Signal Processor ASU Azimuth Scan Unit CBB PRT Calibration Blackbody Platinum Resistance Thermometer CCU Central Communication Unit CFS CCU Flight Software CTI Configuration Table Interface DLR Deutsches Zentrum für Luft und Raumfahrt ECMWF European Centre for Medium-Range Weather Forecasts ESL Expert Support Laboratory ESU Elevation Scan Unit FCA FPS (Focal Plane Subsystem) Cooler Assembly FPS Focal Plane Subsystem IAA Astrophysics Institute of Andalusia ICE Instrument Control Electronics IDE IDU Electronics IDSE Interferometer Differential Speed Error IDU Interferometer Drive Unit IF In-Flight IFAC-CNR Istituto di Fisica Applicata Nello Carrara – Consiglio Nazionale delle Ricerche IG Initial Guess ILS Instrument Line Shape IMK Institute für Meteorologie und Klimaforschung INT Interferometer IPF Instrument Processing Facility ISP Instrument Source Packet LOS Line of Sight MIO MIPAS Optical Module MIPAS Michelson Interferometer for Passive Atmospheric Sounding MR Monthly Report MW Micro-Window NESR Noise Equivalent Spectral Radiance NL Non Linear NOM Nominal OCM Orbit Control Manoeuvre ODS Optical Path Difference Measurement Sensor PAW Pre-Amplifier Warm PCD Product Confidence Data PCF Product Control Facility

ENVISAT MIPAS Monthly Report: December 2003 issue 1.0 revision 0 - 14 January 2004
ENVI-SPPA-EOPG-TN-04-0001 page 3 of 48
s QWG Quality Working Group REC Residual and Error Correlation RGC Radiometric Gain Calibration SEM Special Event Measurement VCS Vibration Cancellation System WCC Wear Control Cycle
2 THE MONTHLY REPORT
2.1 Summary • Two Interferometer anomalies occurred. • Special Observation Modes (S3, S4 and S5) have been executed. • A strong instrument temperature decrease has been observed after the unavailability at the
beginning of the month. • The tolerance threshold for the Cooler Compressor vibration level has been changed. • An offset in the vertical profiles between 6 and 9 December has been caused by a not
updated gain. • The software for platform pointing has been updated in order to reduce the pointing trends. • The following product anomalies have been correlated to processor problems that are being
corrected: discrepancy in cloud detection, anomalous processing time, oscillating spectra, bug in ILS retrieval.
2.2 UNAVAILABILITY
2.2.1 Instrument Unavailability The MIPAS has been unavailable during the following time interval because of a payload switch-off: Start time: 3 Dec 2003 07:18:43 (orbit 9193) Stop time: 6 Dec 2003 11:14:00 (orbit 9238) After an IDU Error the MIPAS auto-switched to heater/refuse mode. Unavailability interval: Start time: 9 Dec 2003 16:08:33 (orbit 9284) Stop time: 9 Dec 2003 19:30:00 (orbit 9286) The MIPAS auto-switched to heater/refuse mode due to an SPE error message. Unavailability interval: Start time: 18 Dec 2003 06:04:46 (orbit 9407) Stop time: 18 Dec 2003 11:35:00 (orbit 9410) MIPAS went to Standby in order to clear SBE error messages. Unavailability interval: Start time: 18 Dec 2003 14:44:28 (orbit 9412)
ENVISAT MIPAS Monthly Report: December 2003 issue 1.0 revision 0 - 14 January 2004
ENVI-SPPA-EOPG-TN-04-0001 page 4 of 48
s Stop time: 18 Dec 2003 18:09:00 (orbit 9414) MIPAS auto-switched to heater/refuse because of an IDU slide 1 & 2 velocity error >15%. Unavailability interval: Start time: 25 Dec 2003 02:20:48 (orbit 9505) Stop time: 25 Dec 2003 11:13:00 (orbit 9510)
2.2.2 Data Generation Gaps
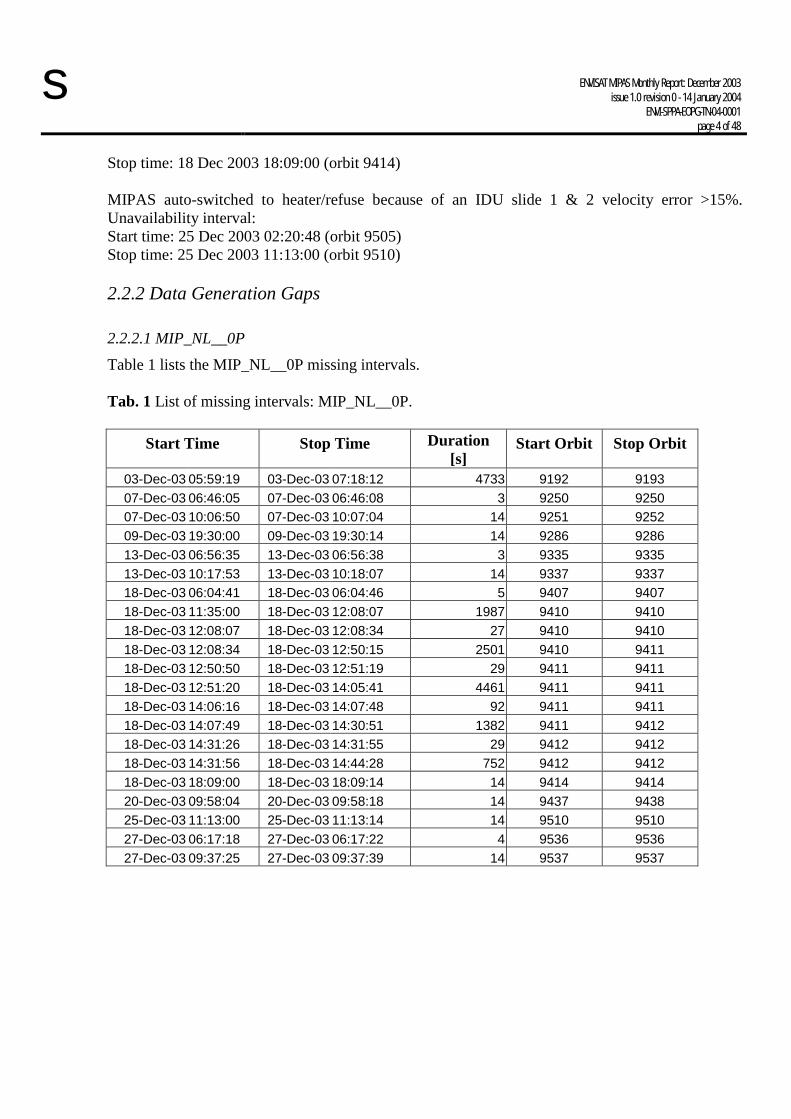
2.2.2.1 MIP_NL__0P Table 1 lists the MIP_NL__0P missing intervals. Tab. 1 List of missing intervals: MIP_NL__0P.
Start Time
Stop Time
Duration [s]
Start Orbit
Stop Orbit
03-Dec-03 05:59:19 03-Dec-03 07:18:12 4733 9192 9193 07-Dec-03 06:46:05 07-Dec-03 06:46:08 3 9250 9250 07-Dec-03 10:06:50 07-Dec-03 10:07:04 14 9251 9252 09-Dec-03 19:30:00 09-Dec-03 19:30:14 14 9286 9286 13-Dec-03 06:56:35 13-Dec-03 06:56:38 3 9335 9335 13-Dec-03 10:17:53 13-Dec-03 10:18:07 14 9337 9337 18-Dec-03 06:04:41 18-Dec-03 06:04:46 5 9407 9407 18-Dec-03 11:35:00 18-Dec-03 12:08:07 1987 9410 9410 18-Dec-03 12:08:07 18-Dec-03 12:08:34 27 9410 9410 18-Dec-03 12:08:34 18-Dec-03 12:50:15 2501 9410 9411 18-Dec-03 12:50:50 18-Dec-03 12:51:19 29 9411 9411 18-Dec-03 12:51:20 18-Dec-03 14:05:41 4461 9411 9411 18-Dec-03 14:06:16 18-Dec-03 14:07:48 92 9411 9411 18-Dec-03 14:07:49 18-Dec-03 14:30:51 1382 9411 9412 18-Dec-03 14:31:26 18-Dec-03 14:31:55 29 9412 9412 18-Dec-03 14:31:56 18-Dec-03 14:44:28 752 9412 9412 18-Dec-03 18:09:00 18-Dec-03 18:09:14 14 9414 9414 20-Dec-03 09:58:04 20-Dec-03 09:58:18 14 9437 9438 25-Dec-03 11:13:00 25-Dec-03 11:13:14 14 9510 9510 27-Dec-03 06:17:18 27-Dec-03 06:17:22 4 9536 9536 27-Dec-03 09:37:25 27-Dec-03 09:37:39 14 9537 9537

ENVISAT MIPAS Monthly Report: December 2003 issue 1.0 revision 0 - 14 January 2004
ENVI-SPPA-EOPG-TN-04-0001 page 5 of 48
s 2.2.2.2 MIP_LS__0P Table 2 lists the MIP_LS__0P missing intervals. Tab. 2 List of missing intervals: MIP_LS__0P.
Start Time
Stop Time
Duration [s]
Start Orbit
Stop Orbit
07-Dec-03 06:47:08 07-Dec-03 06:47:28 20 9250 9250 13-Dec-03 07:29:45 13-Dec-03 07:29:57 12 9336 9336 20-Dec-03 07:04:59 20-Dec-03 07:05:06 7 9436 9436 27-Dec-03 08:32:14 27-Dec-03 08:32:27 13 9537 9537
2.2.2.3 MIP_RW__0P No raw measurements done in December.
2.2.2.4 MIP_NL__1P Percentage of not available data: 1.4 %.
2.3 INSTRUMENT CONFIGURATION AND PERFORMANCE
2.3.1 MIPAS Operations Here a summary of the MIPAS operations planning for the December month is presented together with the analysis of the special measurements (special in-flight calibration and/or special observation modes) execution. Operations planning:
• Special Event Measurement (SEM) activity every orbit at the same ANX time (=527.1 sec); background SEM compensation time set to low resolution (=10.2 sec).
• Nominal (NOM) background mission; NOM scan starts every orbit at ANX =574.3 sec. • Line Of Sight (LOS) activity with a prime sequence in the first two orbits visible from
Kiruna station on Saturday and a backup sequence on the first two orbits visible from Kiruna station on Sunday.
• Periodic Radiometric Gain Calibration (RGC) performed every 14 orbits, starting at ANX =5500 sec in an orbit such that the next one has Kiruna coverage.
• Periodic Wear Control Cycle (WCC) performed every 5 orbits, starting at ANX =4000 sec. • Special Observation Modes S3, S4 and S5 have been planned; during those orbits the
background "orbital" SEM measurements will be interrupted and re-started just after. • A special single scan (test of scan at fixed Geolocation) has been planned over Lauder
(lidar station) in orbit #9411.

ENVISAT MIPAS Monthly Report: December 2003 issue 1.0 revision 0 - 14 January 2004
ENVI-SPPA-EOPG-TN-04-0001 page 6 of 48
s CTI needed for planning: The SEMs are needed to re-start the NOM measurements in each orbit always at the same latitude. Each SEM is composed by a single scan of two sweeps. In order to execute that special measurement it is needed to define a Configuration Table Interface (CTI) per orbit (CTI_SEM_MP) containing information about: orbit number, SEM start and stop ANX time, number of sweeps (presently 2), resolution (presently high) and DS flag before the SEM. Two further CTI are needed to define respectively the elevation increment and the azimuth increment for the SEM sweep: CTI_S22_MP and CTI_S23_MP.
S5 (Diurnal Changes) in orbit #9300: 3 scans over the terminator (SZA = 0 at 15 km altitude) in sideways direction. CTI_S23_MPVRGT20031114_150318_00000000_00000102_20031210_191028_20031210_191442.N1 CTI_S22_MPVRGT20031114_150318_00000000_00000102_20031210_191031_20031210_191442.N1 CTI_SEM_MPVRGT20031114_150318_00000000_00006608_20031210_191033_20031210_191201.N1 Group_13305 RGTv_6780-6782 CTI_SEM_MPVRGT20031114_150318_00000000_00006609_20031210_191202_20031210_191320.N1 CTI_SEM_MPVRGT20031114_150318_00000000_00006610_20031210_191321_20031210_191442.N1 CTI_S23_MPVRGT20031114_152003_00000000_00000103_20031210_195152_20031210_195606.N1 CTI_S22_MPVRGT20031114_152003_00000000_00000103_20031210_195155_20031210_195606.N1 CTI_SEM_MPVRGT20031114_152003_00000000_00006611_20031210_195157_20031210_195325.N1 Group_13306 RGTv_6783-6785 CTI_SEM_MPVRGT20031114_152003_00000000_00006612_20031210_195326_20031210_195444.N1 CTI_SEM_MPVRGT20031114_152003_00000000_00006613_20031210_195445_20031210_195606.N1 One orbital SEM per orbit in #9301-9317: CTI_S23_MPVRGT20031119_125733_00000000_00000107_20031210_202443_20031211_231451.N1 CTI_S22_MPVRGT20031119_125733_00000000_00000107_20031210_202446_20031211_231451.N1 CTI_SEM_MPVRGT20031119_125733_00000000_00006687_20031210_202447_20031210_202517.N Group_13374 RGTv_6786-6802 ... CTI_SEM_MPVRGT20031119_125734_00000000_00006703_20031211_231422_20031211_231451.N1 S3 (Impact of Aircraft Emissions) in orbits #9318-9320 (ascending) and #9322-9324 (descending): 10 scans per orbit over the Atlantic Ocean (~ 25 -> 55 N) in cross track direction. CTI_S23_MPVRGT20031113_172140_00000000_00000104_20031212_005057_20031212_113359.N1 CTI_S22_MPVRGT20031113_172140_00000000_00000104_20031212_005100_20031212_113359.N1 CTI_SEM_MPVRGT20031113_172140_00000000_00006614_20031212_005101_20031212_005626.N1 Group_13298 RGTv_6701-6712 ... CTI_SEM_MPVRGT20031113_172140_00000000_00006625_20031212_112832_20031212_113359.N1 S4 (Stratospheric Dynamics, Transport Processes) in orbit #9325: 3 parallel scans in rearward direction along the complete orbit. CTI_S23_MPVRGT20031113_190300_00000000_00000105_20031212_123030_20031212_140920.N1 CTI_S22_MPVRGT20031113_190300_00000000_00000105_20031212_123033_20031212_140920.N1 CTI_SEM_MPVRGT20031113_190300_00000000_00006626_20031212_123034_20031212_123214.N1 Group_13302 RGTv_6713-6772

ENVISAT MIPAS Monthly Report: December 2003 issue 1.0 revision 0 - 14 January 2004
ENVI-SPPA-EOPG-TN-04-0001 page 7 of 48
s ... CTI_SEM_MPVRGT20031113_190302_00000000_00006685_20031212_140749_20031212_140920.N1 One orbital SEM per orbit in #9326-9399: CTI_S23_MPVRGT20031119_152244_00000000_00000108_20031212_141941_20031217_164357.N1 CTI_S22_MPVRGT20031119_152244_00000000_00000108_20031212_141944_20031217_164357.N1 CTI_SEM_MPVRGT20031119_152244_00000000_00006704_20031212_141946_20031212_142015.N1 Group_13377 RGTv_6873-6942 ... CTI_SEM_MPVRGT20031119_152247_00000000_00006773_20031217_164328_20031217_164357.N1 Special SEM in orbit #9411: 1 scan over Lauder station (latitude: 45.05 S, longitude: 169.68 E) in cross track direction, adjusting the azimuth to the fixed Geolocation during the scan. CTI_S23_MPVRGT20031113_201825_00000000_00000106_20031218_140601_20031218_140737.N1 Group_13303 RGTv_6773 CTI_S22_MPVRGT20031113_201825_00000000_00000106_20031218_140604_20031218_140737.N1 CTI_SEM_MPVRGT20031113_201825_00000000_00006686_20031218_140606_20031218_140737.N1 One orbital SEM per orbit in #9400-9499: CTI_S23_MPVRGT20031124_160200_00000000_00000109_20031217_182400_20031224_162350.N1 Group_13445 RGTv_6943-7038 CTI_S22_MPVRGT20031124_160200_00000000_00000109_20031217_182403_20031224_162350.N1 CTI_SEM_MPVRGT20031124_160200_00000000_00006774_20031217_182404_20031217_182433.N1 ... CTI_SEM_MPVRGT20031124_160206_00000000_00006869_20031224_162321_20031224_162350.N1
Execution analysis: Table 3 summarizes the status of the special measurements done in December. Tab. 3 Status of the MIPAS special measurements done in December.
Special Measurement Date Orbit Execution S5 10 December 2003 9300 Successful S3 12 December 2003 9318-9320
9322-9324 Successful
S4 12 December 2003 9325 Successful Special SEM 18 December 2003 9411 Missing
2.3.2 Thermal Performance After the unavailability at the beginning of December the instrument temperature had an evident decrease shown by the monthly thermal trend (Fig. 1) and by the long-term thermal trend (Fig. 2).

ENVISAT MIPAS Monthly Report: December 2003 issue 1.0 revision 0 - 14 January 2004
ENVI-SPPA-EOPG-TN-04-0001 page 8 of 48
s
Fig. 1 Short-term trend of instrument temperature (each point represents the orbit mean value): December 2003.
Fig. 2 Long-term trend of instrument temperature (each point represents the orbit mean value): November 2002-December 2003.
ENVISAT MIPAS Monthly Report: December 2003 issue 1.0 revision 0 - 14 January 2004
ENVI-SPPA-EOPG-TN-04-0001 page 9 of 48
s 2.3.3 Mechanical Performance
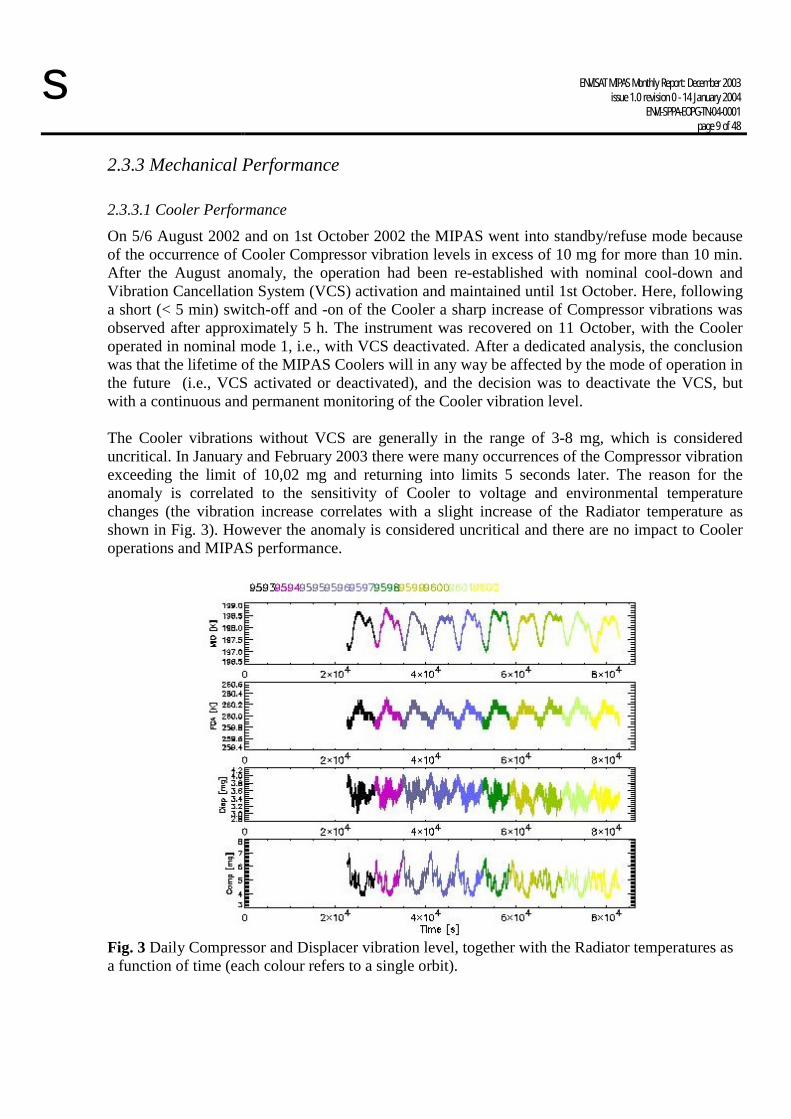
2.3.3.1 Cooler Performance On 5/6 August 2002 and on 1st October 2002 the MIPAS went into standby/refuse mode because of the occurrence of Cooler Compressor vibration levels in excess of 10 mg for more than 10 min. After the August anomaly, the operation had been re-established with nominal cool-down and Vibration Cancellation System (VCS) activation and maintained until 1st October. Here, following a short (< 5 min) switch-off and -on of the Cooler a sharp increase of Compressor vibrations was observed after approximately 5 h. The instrument was recovered on 11 October, with the Cooler operated in nominal mode 1, i.e., with VCS deactivated. After a dedicated analysis, the conclusion was that the lifetime of the MIPAS Coolers will in any way be affected by the mode of operation in the future (i.e., VCS activated or deactivated), and the decision was to deactivate the VCS, but with a continuous and permanent monitoring of the Cooler vibration level. The Cooler vibrations without VCS are generally in the range of 3-8 mg, which is considered uncritical. In January and February 2003 there were many occurrences of the Compressor vibration exceeding the limit of 10,02 mg and returning into limits 5 seconds later. The reason for the anomaly is correlated to the sensitivity of Cooler to voltage and environmental temperature changes (the vibration increase correlates with a slight increase of the Radiator temperature as shown in Fig. 3). However the anomaly is considered uncritical and there are no impact to Cooler operations and MIPAS performance.
Fig. 3 Daily Compressor and Displacer vibration level, together with the Radiator temperatures as a function of time (each colour refers to a single orbit).

ENVISAT MIPAS Monthly Report: December 2003 issue 1.0 revision 0 - 14 January 2004
ENVI-SPPA-EOPG-TN-04-0001 page 10 of 48
s The Compressor and Displacer vibration level, together with the Radiator temperatures, are monitored on a daily basis (an example is shown if Fig. 3). The monitoring foresees a warning message whenever the Compressor vibration level exceeds a threshold value (8 mg) well below the tolerance error that activates the MIPAS standby/refuse mode. During December, the threshold value has not been reached and the spike shape (see an example in Fig. 3) characterizing the threshold exceeding has not been observed. On 10 December 2003 the tolerance threshold that activates the MIPAS standby/refuse mode has been adjusted to adequate levels for the current Cooler operation mode (limit to 16 mg and instrument switch-off after 2.5 min).
2.3.3.2 Interferometer Performance Since January 2003 the Interferometer performance is affected by the following anomalies:
• INT velocity errors leading to a HEATER/Refuse Mode (i.e. an instrument outage) • INT differential speed errors leading to an error warning into the MIPAS history log
file.
The first anomaly was originally attributed to be a known effect of the Interferometer as a result of low temperatures in Jan/Feb 2003, but this hypothesis needed further considerations after additional velocity errors had been observed in Aug/Sept 2003. After further occurrences in December (see below), EADS-Astrium is establishing a more detailed picture of the error. The INT differential speed error (IDSE) is characterised by the following observations:
• The differential speed error was initially always a reporting of a -4% error; up to October 2003 no +4% error was reported.
• The number of -4% errors was significantly increasing over the year 2003. In order to avoid a history buffer overflow, the reporting of the error into the history area was suppressed and is only temporarily enabled again for 20 minutes to allow a (reduced) statistical evaluation.
• From October 2003 onwards also a +4% differential speed error was observed.
Currently, there are three hypotheses for the differential speed errors: • A mechanical degradation of the INT rails or ball bearings. • An Interferometer ODS misalignment or transmission reduction in the
Interferometer ODS path (however, no fringe count errors are reported in Level 1). • Degradation of IDE components (internal reference voltage), which are used to
determine the speed difference.
The error analysis is still ongoing since the observations at present do not allow to unambiguously identifying the error source. Currently, there is no reason to assume that severe (mechanical) problems have to be expected. However, the behaviour and especially the trend of this parameter shall be closely monitored.

ENVISAT MIPAS Monthly Report: December 2003 issue 1.0 revision 0 - 14 January 2004
ENVI-SPPA-EOPG-TN-04-0001 page 11 of 48
s An investigation was done to see if IDSE has an impact on the NESRT. An assessment of NESRT (imaginary part of calibrated spectrum with mean not removed) was done on orbit 7906 (prior to switch-off) and 7976 (after switch-off) and results were compared to the one of orbit 2081 done and presented during calibration workshop (September 2002). Note that the report NESRT function was modified to keep the mean of imaginary part as it was in September 2002. No significant difference of NESRT can be observed due to IDSE. At high altitudes, NESRT is the same. At others, the difference is mainly due to different input radiances. Interferometer velocity error:
Two events occurred during December: • 9 Dec 2003 16:08:33 During this failure there was an over-speed situation on slide 2 (about 20% of over-speed) at the slide position 29 mm during the nominal measurement sweep. This fault differs from the faults there were before in which there was always a velocity error during the speed reversal. • 25 Dec 2003 02:20:48
Interferometer differential speed error:
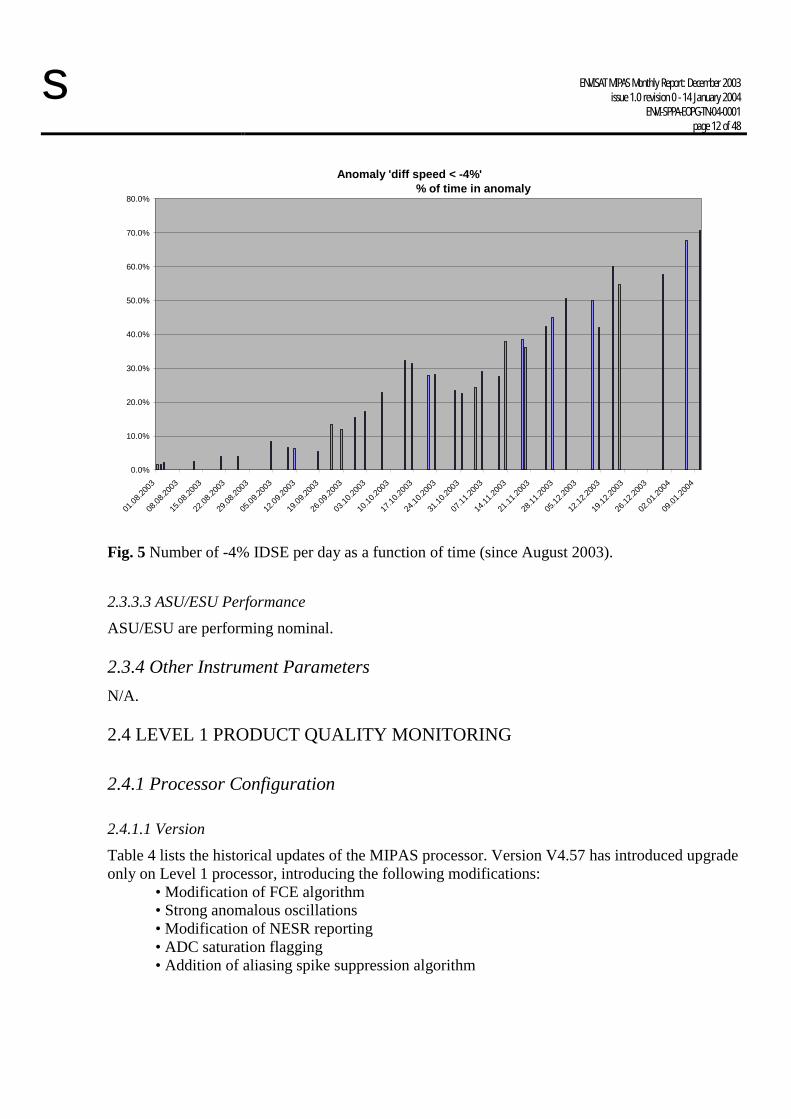
Figure 4 shows the number of +4% anomalies per day as a function of time starting from October 2003, Figure 5 shows the increase of the -4% error since August 2003
Anomaly 'diff speed > +4%' anomalies (average) / day
0
5
10
15
20
25
30
Monda
y, Octo
ber 0
6, 20
03
Monda
y, Octo
ber 1
3, 20
03
Monda
y, Octo
ber 2
0, 20
03
Monda
y, Octo
ber 2
7, 20
03
Monda
y, Nov
embe
r 03,
2003
Monda
y, Nov
embe
r 10,
2003
Monda
y, Nov
embe
r 17,
2003
Monda
y, Nov
embe
r 24,
2003
Monda
y, Dec
embe
r 01,
2003
Monda
y, Dec
embe
r 08,
2003
Monda
y, Dec
embe
r 15,
2003
Monda
y, Dec
embe
r 22,
2003
Monda
y, Dec
embe
r 29,
2003
Monda
y, Ja
nuary
05, 2
004
Fig. 4 Number of +4% IDSE per day as a function of time (starting from October 2003).
ENVISAT MIPAS Monthly Report: December 2003 issue 1.0 revision 0 - 14 January 2004
ENVI-SPPA-EOPG-TN-04-0001 page 12 of 48
s
Anomaly 'diff speed < -4%' % of time in anomaly
0.0%
10.0%
20.0%
30.0%
40.0%
50.0%
60.0%
70.0%
80.0%
01.08
.2003
08.08
.2003
15.08
.2003
22.08
.2003
29.08
.2003
05.09
.2003
12.09
.2003
19.09
.2003
26.09
.2003
03.10
.2003
10.10
.2003
17.10
.2003
24.10
.2003
31.10
.2003
07.11
.2003
14.11
.2003
21.11
.2003
28.11
.2003
05.12
.2003
12.12
.2003
19.12
.2003
26.12
.2003
02.01
.2004
09.01
.2004
Fig. 5 Number of -4% IDSE per day as a function of time (since August 2003).
2.3.3.3 ASU/ESU Performance ASU/ESU are performing nominal.
2.3.4 Other Instrument Parameters N/A.
2.4 LEVEL 1 PRODUCT QUALITY MONITORING
2.4.1 Processor Configuration
2.4.1.1 Version Table 4 lists the historical updates of the MIPAS processor. Version V4.57 has introduced upgrade only on Level 1 processor, introducing the following modifications:
• Modification of FCE algorithm • Strong anomalous oscillations • Modification of NESR reporting • ADC saturation flagging • Addition of aliasing spike suppression algorithm

ENVISAT MIPAS Monthly Report: December 2003 issue 1.0 revision 0 - 14 January 2004
ENVI-SPPA-EOPG-TN-04-0001 page 13 of 48
s Version V4.59 has introduced only upgrade on Level 2 processor. Tab. 4 Historical updates of MIPAS processor at near real time (NRT) processing sites (PDHS-K and PDHS-E) and off-line processing sites (LRAC for Level 1 and D-PAC for Level 2).
Centre Facility Software Date LRAC V4.59 20-08-2003 D-PAC V4.59 06-08-2003
PDHS-K V4.59 23-07-2003 PDHS-E V4.59 23-07-2003 PDHS-K V4.57 22-07-2003 LRAC V4.57 22-07-2003
PDHS-K V4.59 21-07-2003 LRAC V4.59 21-07-2003 LRAC V4.57 19-03-2003
PDHS-K V4.57 18-03-2003 D-PAC V4.57 05-03-2003 PDHS-E V4.57 04-03-2003
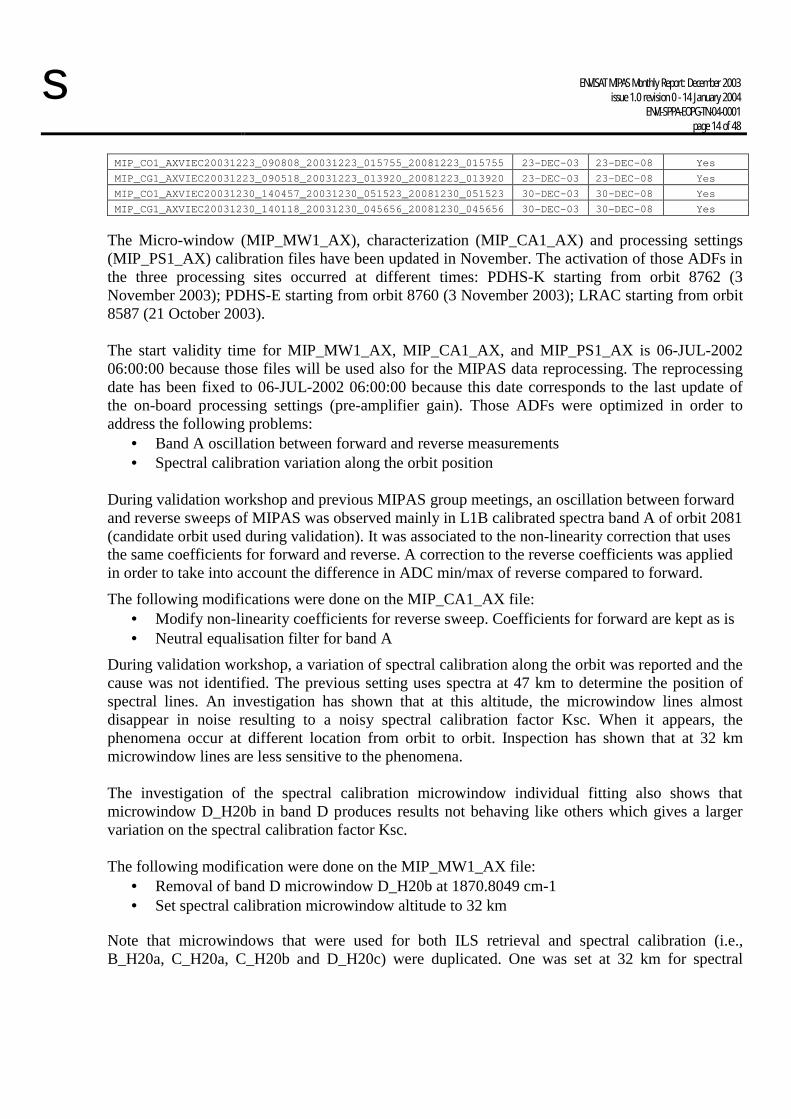
2.4.1.2 Auxiliary Data Files Table 5 lists the ADFs valid in December. The new ADFs this month have been: Gain (MIP_CG1_AX), Offset (MIP_CO1_AX) and Spectral (MIP_CS1_AX) calibration files, which are updated weekly in order to prevent degradation of data quality due to gradual accumulation of contamination.
Tab. 5 Level 1 ADFs valid in December.
Auxiliary Data File Start Validity
Stop Validity
Updated in December
MIP_CA1_AXVIEC20031021_143953_20020706_060000_20080706_060000 06-JUL-02 06-JUL-08 No
MIP_CL1_AXVIEC20021108_154256_20021113_120000_20071106_145139 13-NOV-02 06-NOV-07 No
MIP_CS1_AXVIEC20031118_151359_20031118_095142_20081118_095142 18-Nov-03 18-Nov-08 No
MIP_CS1_AXVIEC20031210_115131_20031206_170000_20081206_170000 06-DEC-03 06-DEC-08 Yes
MIP_CS1_AXVIEC20031223_090933_20031222_235246_20081222_235246 22-DEC-03 22-DEC-08 Yes
MIP_CS1_AXVIEC20031230_141351_20031230_031155_20081230_031155 30 DEC-03 30-DEC-08 Yes
MIP_MW1_AXVIEC20031021_144135_20020706_060000_20080706_060000 06-JUL-02 06-JUL-08 No
MIP_PS1_AXVIEC20031021_144418_20020706_060000_20080706_060000 06-JUL-02 06-JUL-08 No
MIP_CO1_AXVIEC20031124_150615_20031124_114121_20081124_114121 24-NOV-03 24-NOV-08 No
MIP_CG1_AXVIEC20031124_150111_20031124_111958_20081124_111958 24-NOV-03 24-NOV-08 No
MIP_CO1_AXVIEC20031201_150619_20031201_124302_20081201_124302 01-DEC-03 01-DEC-08 Yes
MIP_CG1_AXVIEC20031201_150158_20031201_122119_20081201_122119 01-DEC-03 01-DEC-08 Yes
MIP_CO1_AXVIEC20031209_134026_20031206_170000_20081206_170000 06-DEC-03 06-DEC-08 Yes
MIP_CG1_AXVIEC20031209_133926_20031206_170000_20081206_170000 06-DEC-03 06-DEC-08 Yes
MIP_CO1_AXVIEC20031215_135514_20031215_131636_20081215_131636 15-DEC-03 15-DEC-08 Yes
MIP_CG1_AXVIEC20031215_135413_20031215_131750_20081215_131750 15-DEC-03 15-DEC-08 Yes
ENVISAT MIPAS Monthly Report: December 2003 issue 1.0 revision 0 - 14 January 2004
ENVI-SPPA-EOPG-TN-04-0001 page 14 of 48
s MIP_CO1_AXVIEC20031223_090808_20031223_015755_20081223_015755 23-DEC-03 23-DEC-08 Yes
MIP_CG1_AXVIEC20031223_090518_20031223_013920_20081223_013920 23-DEC-03 23-DEC-08 Yes
MIP_CO1_AXVIEC20031230_140457_20031230_051523_20081230_051523 30-DEC-03 30-DEC-08 Yes
MIP_CG1_AXVIEC20031230_140118_20031230_045656_20081230_045656 30-DEC-03 30-DEC-08 Yes
The Micro-window (MIP_MW1_AX), characterization (MIP_CA1_AX) and processing settings (MIP_PS1_AX) calibration files have been updated in November. The activation of those ADFs in the three processing sites occurred at different times: PDHS-K starting from orbit 8762 (3 November 2003); PDHS-E starting from orbit 8760 (3 November 2003); LRAC starting from orbit 8587 (21 October 2003). The start validity time for MIP_MW1_AX, MIP_CA1_AX, and MIP_PS1_AX is 06-JUL-2002 06:00:00 because those files will be used also for the MIPAS data reprocessing. The reprocessing date has been fixed to 06-JUL-2002 06:00:00 because this date corresponds to the last update of the on-board processing settings (pre-amplifier gain). Those ADFs were optimized in order to address the following problems:
• Band A oscillation between forward and reverse measurements • Spectral calibration variation along the orbit position
During validation workshop and previous MIPAS group meetings, an oscillation between forward and reverse sweeps of MIPAS was observed mainly in L1B calibrated spectra band A of orbit 2081 (candidate orbit used during validation). It was associated to the non-linearity correction that uses the same coefficients for forward and reverse. A correction to the reverse coefficients was applied in order to take into account the difference in ADC min/max of reverse compared to forward.
The following modifications were done on the MIP_CA1_AX file: • Modify non-linearity coefficients for reverse sweep. Coefficients for forward are kept as is • Neutral equalisation filter for band A
During validation workshop, a variation of spectral calibration along the orbit was reported and the cause was not identified. The previous setting uses spectra at 47 km to determine the position of spectral lines. An investigation has shown that at this altitude, the microwindow lines almost disappear in noise resulting to a noisy spectral calibration factor Ksc. When it appears, the phenomena occur at different location from orbit to orbit. Inspection has shown that at 32 km microwindow lines are less sensitive to the phenomena. The investigation of the spectral calibration microwindow individual fitting also shows that microwindow D_H20b in band D produces results not behaving like others which gives a larger variation on the spectral calibration factor Ksc. The following modification were done on the MIP_MW1_AX file:
• Removal of band D microwindow D_H20b at 1870.8049 cm-1 • Set spectral calibration microwindow altitude to 32 km
Note that microwindows that were used for both ILS retrieval and spectral calibration (i.e., B_H20a, C_H20a, C_H20b and D_H20c) were duplicated. One was set at 32 km for spectral

ENVISAT MIPAS Monthly Report: December 2003 issue 1.0 revision 0 - 14 January 2004
ENVI-SPPA-EOPG-TN-04-0001 page 15 of 48
s calibration and the other one is still at 47 km for ILS retrieval. ILS retrieval optimisation will be done later. Finally, to reduce noise in fitting the number of co-additions for spectral calibration and ILS retrieval were increased. The following modifications were done on the MIP_PS1_AX file:
• Number of co-additions for spectral calibration was set to 4 • Number of co-additions for ILS retrieval was set to 10
For what concerns the MIP_CO1_AX, MIP_CG1_AX, MIP_CL1_AX, and MIP_CS1_AX the following strategy has been adopted:
• The MIP_CO1_AX and MIP_CG1_AX will be updated every week with previous generation of an updated MIP_CS1_AX
• The MIP_CS1_AX will be updated every week • The MIP_CL1_AX will be analysed every two weeks and updated if needed (every month
during the reprocessing time interval: from 06-JUL-2002 to now) For the MIPAS data reprocessing, the generation of the historical ADFs series is ongoing:
• Weekly generation of MIP_CG1_AX and MIP_CO1_AX with previous evaluation of MIP_CS1_AX
• Monthly generation of MIP_CL1_AX • Monthly generation of MIP_CS1_AX
2.4.2 Spectral Performance As described in previous section, the evaluation of the spectral calibration has been changed using a new MIP_MW1_AX. A verification of the spectral calibration upgrade in Level 1 processor was performed with ORM, that is able to retrieve, together with the target parameters, a band dependent and altitude independent residual spectral shift along the whole orbit. Orbit #2081 was used for this test. Figure 6 shows the deviation from unity of the frequency shift scaling parameter retrieved by ORM as a function of the scan ID before the new spectral calibration. The different curves represent the results obtained by the different retrievals for the different bands. These curves are grouped in different colours according to the number of spectral points used for the retrieval. Since a greater number of spectral points allows to obtain a greater accuracy in the results, the scattering of the retrieved values is reduced when a greater number of points is used (see blue curves). From Figure 6 it emerges a variability of the frequency shift scaling parameter with the scan ID. In particular, for some scans a deviation from unity of the frequency shift scaling parameter equal to 1·10-6 is obtained. Even if this result is still within the MIPAS requirements, the attained frequency calibration accuracy is worse than the one that can be theoretically obtained by MIPAS measurements, as indicated by the spread of the curves (about 3 parts in 107). The same test described above was repeated with a new Level 1 file for orbit #2081 where the new spectral calibration described above had been applied. The accuracy of the frequency calibration obtained after this upgrade is reported in Figure 7. We observe that the residual spectral shift is always within ± 5·10-7, from which it emerges that the new spectral calibration succeeds in reducing significantly the variability of frequency accuracy along the orbit. A degradation of the

ENVISAT MIPAS Monthly Report: December 2003 issue 1.0 revision 0 - 14 January 2004
ENVI-SPPA-EOPG-TN-04-0001 page 16 of 48
s performance is visible only in the first 3 scans of the orbit, characterised by large values of the frequency shift scaling parameter, but this is due to the use of a spectral calibration performed several months before. The new MIP_CS1_AX update strategy is expected to reduce this initial discontinuity.
Fig. 6 Accuracy of the old frequency calibrations as a function of scan ID for different spectral bands obtained by the different specie retrievals. The curves are grouped in different colours according to the number of spectral points used for the fit (red: few points, green: medium number of points, blue: large number of points).

ENVISAT MIPAS Monthly Report: December 2003 issue 1.0 revision 0 - 14 January 2004
ENVI-SPPA-EOPG-TN-04-0001 page 17 of 48
s
Fig. 7 Accuracy of the new frequency calibrations as a function of scan ID for different spectral bands obtained by the different specie retrievals. The curves are grouped in different colours according to the number of spectral points used for the fit (red: few points, green: medium number of points, blue: large number of points).
2.4.3 Radiometric Performance The radiometric gain is characterized by an increase as a function of time. Figure 8 shows the comparison of the gains disseminated in December with the gains disseminated the week before. Only for the first gain a decrease is observed, caused by the decontamination induced by the long instrument unavailability at the beginning of the month.

ENVISAT MIPAS Monthly Report: December 2003 issue 1.0 revision 0 - 14 January 2004
ENVI-SPPA-EOPG-TN-04-0001 page 18 of 48
s
Fig. 8 Comparison between the new radiometric gain (disseminated in December 2003) and the last disseminated one: Band A. The gain weekly increase is around 0.7 %. The ice contamination affecting the detectors may cause strong impact on the radiometric gain. For that reason every time there is a long MIPAS unavailability with the cooler not operating, it is needed to generate a new gain and off-set ADF because the decontamination causes a strong increase in the instrument response. It has been evaluated that RGC variations during 7-9 days doesn’t affect the quality of the MIPAS data, so the RGC is performed every week. The frequency may be changed in case of MIPAS unavailability because of the necessity to calculate a “decontaminated” gain. Four gain and offset ADFs have been disseminated on: 09-DEC-2003 (using orbit 9241, dated 06-DEC-2003) 15-DEC-2003 (using orbit 9343, dated 13-DEC-2003) 23-DEC-2003 (using orbit 9469, dated 22-DEC-2003) 30-DEC-2003 (using orbit 9571, dated 29-DEC-2003) As it can be seen, the first gain has been disseminated three days after the switch-on after the unavailability at the beginning of December. The data processed between 6 and 9 December are characterized by an evident offset due to the use of a not updated gain.

ENVISAT MIPAS Monthly Report: December 2003 issue 1.0 revision 0 - 14 January 2004
ENVI-SPPA-EOPG-TN-04-0001 page 19 of 48
s Presently, one Gain Calibration measurement per day is performed. This configuration allows the analysis of the ice contamination effect on radiometric performance. The measurement frequency will be reduced to two times per week at the beginning of January.
2.4.4 Pointing Performance The LOS calibration measurements are performed every week. This configuration allows the analysis of the pointing stability and guaranties the availability of the data in case of missing products. LOS calibration analysis is ongoing. Initial results have evidenced a marked annual cycle as shown in Fig. 9 covering the period September 2002 – December 2003. The figure shows the relative and the absolute (evaluated taking into account the commanded elevation angle for the LOS calibration) pointing error. The annual trend is not related to the MIPAS mispointing, but to a problem in the software for the evaluation of the ENVISAT satellite mispointing. An update in the platform pointing software has been implemented on 12 December 2003 in order to reduce the pointing deviation trends. The results of the pointing analysis after the update will be presented in the January Monthly Report.
-0.06
-0.04
-0.02
0
0.02
0.04
0.06
2000 4000 6000 8000 10000
Orbit Number
Poin
ting
Erro
r [de
g]
Relative ErrorAbsolute Error
Fig. 9 MIPAS pointing error as a function of the orbit number: September 2002- December 2003. Four LOS calibration measurements have been performed in December: 07-DEC-2003 (orbits 9250 and 9251) 13-DEC-2003 (orbits 9336 and 9337) 20-DEC-2003 (orbits 9436 and 9437) 27-DEC-2003 (orbits 9536 and 9537) Starting from 20 September 2003 no meaningful processed data have been obtained for the evaluation of the MIPAS mispointing. At the beginning a strong instrument mispointing has been proposed to explain the lack of information. For that reason measurements with different bias values have been done. On 8 November 2003 the bias value has been changed from –0.040 deg to

ENVISAT MIPAS Monthly Report: December 2003 issue 1.0 revision 0 - 14 January 2004
ENVI-SPPA-EOPG-TN-04-0001 page 20 of 48
s –0.025 deg, and on 10 November to 0.000 deg. Starting from 15 November the bias has been fixed to –0.025 deg. After an analysis done by BOMEM it was found that the lack of information was related to an increase in the noise level of channel D1. Changing the weight in the settings for the LOS processing, that is assigning 0 weight to channel D1 and weight 1 to channel D2, meaningful informations have been extracted from LOS measurements.
2.4.5 Other Results VERIFICATION OF FIRST LEVEL 1 PRODUCT PROCESSED WITH NEW ADF The first MIPAS Level 1 product processed with the most recently disseminated ADFs (V3.0) has been verified for the following problems:
• Band A oscillation between forward and reverse measurements; • Spectral calibration variation along the orbit position.
The results show that: • The ADFs correct the oscillation that was observed and due to the nonlinearity correction
coefficients; • The spectral correction factor variation peak to peak (except the initial step) is less than
0.000001. This is in the same order of what was achieved during the investigation of spectral calibration improvement.
• In the linear channels (C1, C2, D1, D2) small oscillations remain, and these will be addressed in the next update.
2.5 LEVEL 2 PRODUCT QUALITY MONITORING
2.5.1 Processor Configuration
2.5.1.1 Version As already explained in Section 2.4.1.1, Tab. 4 lists the historical updates of the MIPAS processor. The current version V4.59, operative since 23 July 2003, has introduced only Level 2 processing variations. The main improvements introduced via both the processor V4.59 and the installation of a new set of ADFs, have been: the cloud filtering (that is, every time a cloud is detected at a given altitude, the retrieval is performed only above that altitude); the removal of the gaps between the altitude validity ranges (allowing retrievals in the Antarctic region not feasible with the old MIP_MW2_AX); altitudes margins fixed to +/- 4 km. The other updates are listed below:
• MIPAS-SPR-MAINT-0011 Wrong DSD name in L2 product in case of not requested VMR • MIPAS-SPR-MAINT-0012 Filling of SPH field 22 of MIPAS Level 2 Products • MIPAS-SPR-MAINT-0013 Filling of the MIPAS MPH and MIPAS Level 2 SPH fields • MIPAS-SPR-MAINT-0014 Wrong writing of PCD String to the PCD Information ADS • MIPAS-SPR-MAINT-0015 Too strong test and skipping retrieval • MIPAS-SPR-MAINT-0016 Not initialised nucl1 and nucl2 in R 8.5.6.3-7A • ENVI-GSOP-EOAD-NC-03-0539 MIPAS L2 processing aborted

ENVISAT MIPAS Monthly Report: December 2003 issue 1.0 revision 0 - 14 January 2004
ENVI-SPPA-EOPG-TN-04-0001 page 21 of 48
s 2.5.1.2 Auxiliary Data Files Table 6 lists the ADFs valid in December and Tab. 7 summarize the historical (from January 2003) update of Level 2 ADFs. Tab. 6 Level 2 ADFs valid in December.
Auxiliary Data File Start Validity
Stop Validity
Updated in
December MIP_IG2_AXVIEC20030731_134035_20030901_000000_20080901_000000 01-SEP-03 01-SEP-08 No
MIP_MW2_AXVIEC20030722_134301_20030723_000000_20080722_000000 23-JUL-03 22-JUL-08 No
NRT MIP_MW2_AXVIEC20031021_145505_20020706_060000_20080706_060000 Off-line MIP_MW2_AXVIEC20031027_100858_20020706_060000_20080706_060000
06-JUL-03 06-JUL-03 No
MIP_OM2_AXVIEC20030722_134602_20030723_000000_20080722_000000 23-JUL-03 22-JUL-08 No
NRT
MIP_OM2_AXVIEC20031021_145630_20020706_060000_20080706_060000 Off-line MIP_OM2_AXVIEC20031027_101029_20020706_060000_20080706_060000
06-JUL-03 06-JUL-03 No
MIP_PS2_AXVIEC20030722_102142_20030723_000000_20080722_000000 23-JUL-03 22-JUL-08 No NRT MIP_PS2_AXVIEC20031021_145858_20020706_060000_20080706_060000 Off-line MIP_PS2_AXVIEC20031027_101319_20020706_060000_20080706_060000
06-JUL-03 06-JUL-03 No
MIP_PI2_AXVIEC20030722_134848_20030723_000000_20080722_000000 23-JUL-03 22-JUL-08 No NRT MIP_PI2_AXVIEC20031021_145745_20020706_060000_20080706_060000 Off-line MIP_PI2_AXVIEC20031027_101146_20020706_060000_20080706_060000
06-JUL-03 06-JUL-03 No
MIP_CS2_AXVIEC20030722_133331_20030723_000000_20080722_000000 23-JUL-03 22-JUL-08 No NRT MIP_CS2_AXVIEC20031021_145337_20020706_060000_20080706_060000 Off-line MIP_CS2_AXVIEC20031027_100559_20020706_060000_20080706_060000
06-JUL-03 06-JUL-03 No
MIP_SP2_AXVIEC20030722_093046_20030723_000000_20080722_000000 23-JUL-03 22-JUL-08 No
NRT MIP_SP2_AXVIEC20031021_150016_20020706_060000_20080706_060000 Off-line MIP_SP2_AXVIEC20031027_101441_20020706_060000_20080706_060000
06-JUL-03 06-JUL-03 No
Tab. 7 Historical update of Level 2 ADFs.
Auxiliary Data File Start Validity
Description
ADFs Kit V3.1: MIP_MW2_AXVIEC20030722_134301_20030723_000000_20080722_000000MIP_OM2_AXVIEC20030722_134602_20030723_000000_20080722_000000MIP_PS2_AXVIEC20030722_102142_20030723_000000_20080722_000000MIP_PI2_AXVIEC20030722_134848_20030723_000000_20080722_000000MIP_CS2_AXVIEC20030722_133331_20030723_000000_20080722_000000MIP_SP2_AXVIEC20030722_093046_20030723_000000_20080722_000000
23-JUL-03 Cloud detection enabled and improved validity mask range in Microwindows files. Improved Occupation Matrices (no gaps

ENVISAT MIPAS Monthly Report: December 2003 issue 1.0 revision 0 - 14 January 2004
ENVI-SPPA-EOPG-TN-04-0001 page 22 of 48
s between altitude validity ranges).
MIP_IG2_AXVIEC20030214_130918_20030301_000000_20080301_000000 01-MAR-03 Seasonal update of climatological initial guess: This auxiliary file turned out to be corrupt, and a corrected version has been disseminated on 10 March 2003.
MIP_IG2_AXVIEC20030307_142141_20030310_000000_20080301_000000 10-MAR-03 Seasonal update of climatological initial guess: This dissemination substitute the corrupt file disseminated previously.
MIP_IG2_AXVIEC20030522_104714_20030601_000000_20080601_000000 01-JUN-03 Seasonal update of climatological initial guess.
MIP_IG2_AXVIEC20030731_134035_20030901_000000_20080901_000000 01-SEP-03 Seasonal update of climatological initial guess.
ADFs Kit V3.6: NRT MIP_MW2_AXVIEC20031021_145505_20020706_060000_20080706_060000 MIP_OM2_AXVIEC20031021_145630_20020706_060000_20080706_060000 MIP_PS2_AXVIEC20031021_145858_20020706_060000_20080706_060000 MIP_PI2_AXVIEC20031021_145745_20020706_060000_20080706_060000 MIP_CS2_AXVIEC20031021_145337_20020706_060000_20080706_060000 MIP_SP2_AXVIEC20031021_150016_20020706_060000_20080706_060000 Off-line MIP_MW2_AXVIEC20031027_100858_20020706_060000_20080706_060000 MIP_OM2_AXVIEC20031027_101029_20020706_060000_20080706_060000 MIP_PS2_AXVIEC20031027_101319_20020706_060000_20080706_060000 MIP_PI2_AXVIEC20031027_101146_20020706_060000_20080706_060000 MIP_CS2_AXVIEC20031027_100559_20020706_060000_20080706_060000
MIP_SP2_AXVIEC20031027_101441_20020706_060000_20080706_060000
06-JUL-03 See description below.
Two sets of Level 2 ADFs (V3.6) have been disseminated in November, one for NRT processing (PDHS-K and PDHS-E) and the other one for off-line processing (D-PAC). The start validity time for those ADF files is 06-JUL-2002 06:00:00 for the same reasons explained for the new Level 1 ADFs. The two sets have the following common characteristics:
• Activation of cloud detection • Removal of the gaps between the altitude validity ranges (allowing retrievals in the
Antarctic region not feasible with the old MIP_MW2_AX) • Altitudes margins fixed to +/- 4 km • Short-term ILS bug fix
The following characteristics distinguish the two sets:

ENVISAT MIPAS Monthly Report: December 2003 issue 1.0 revision 0 - 14 January 2004
ENVI-SPPA-EOPG-TN-04-0001 page 23 of 48
s NRT
• Old convergence criteria • Nominal altitude range
Off-line • Improved convergence criteria • Altitude range extended to 6-68 km
The reason why two sets of ADFs have been generated is linked to the too long processing time related to the improved convergence criteria and to the extension of the altitude range. So, in order to respect the NRT constraint, it is needed to find a good compromise between data quality and processing time. The two sets have been activated at different time in the three processing sites: at PDHS-K starting from orbit 8762 (3 November 2003); at PDHS-E starting from orbit 8760 (3 November 2003); at D-PAC starting from orbit 8316 (3 October 2003).
2.5.2 REC Analysis Residual spectra are the difference between spectra measured by the instrument and spectra generated by the retrieval forward model at the final iteration. Ideally, these should contain only random measurement noise but in practice a number of features are present indicating systematic errors either in the forward model or the instrument characterisation. Residual and Error Correlation (REC) analysis is a statistical technique for analysing such data. The principle is to identify correlations between persistent features in the residual spectra and the signatures expected from different atmospheric species, other potential sources of forward model error and calibration errors represented by various derivatives of the spectrum with respect to wavenumber. This is now performed routinely as part of the monitoring of MIPAS data quality. The following analysis refers only to NRT products. Results:
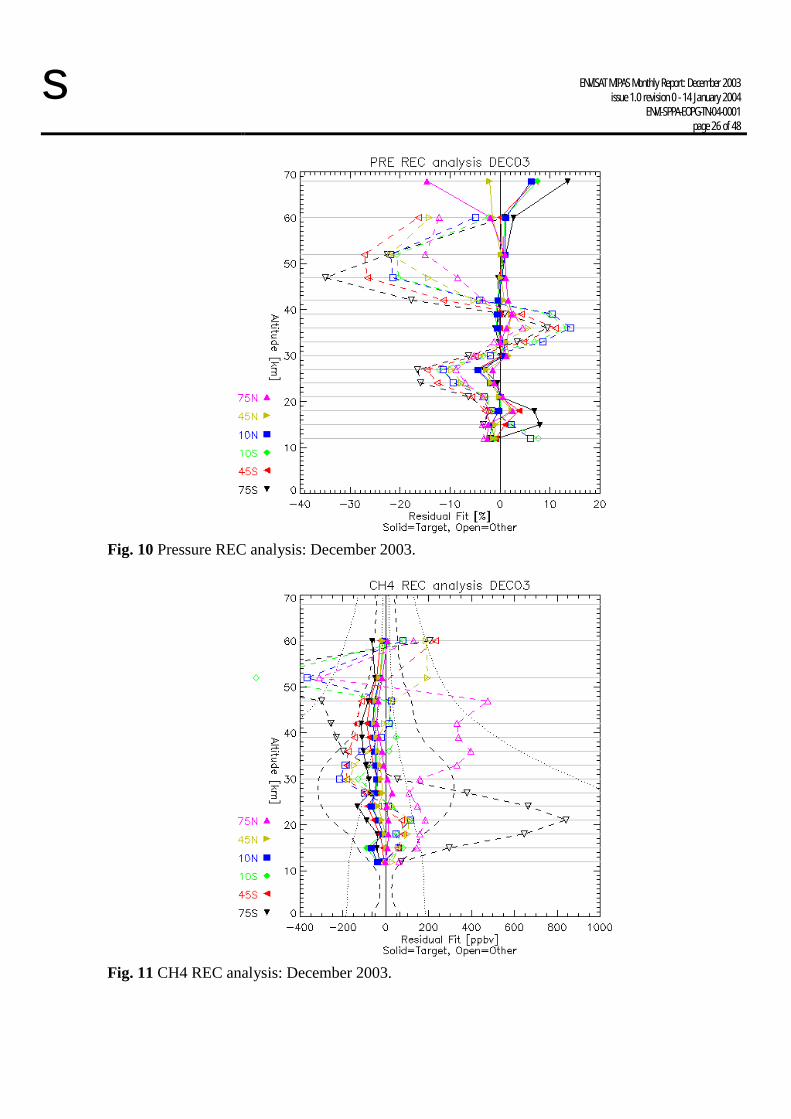
1. Pressure Pressure and Temperature microwindow residuals indicate biases within a few % except at 68 km. Other microwindow residuals indicate an underestimate of 10% at 36 km and an overestimate of 15% at 27 km and 20% at 52 km. No significant change from previous month.
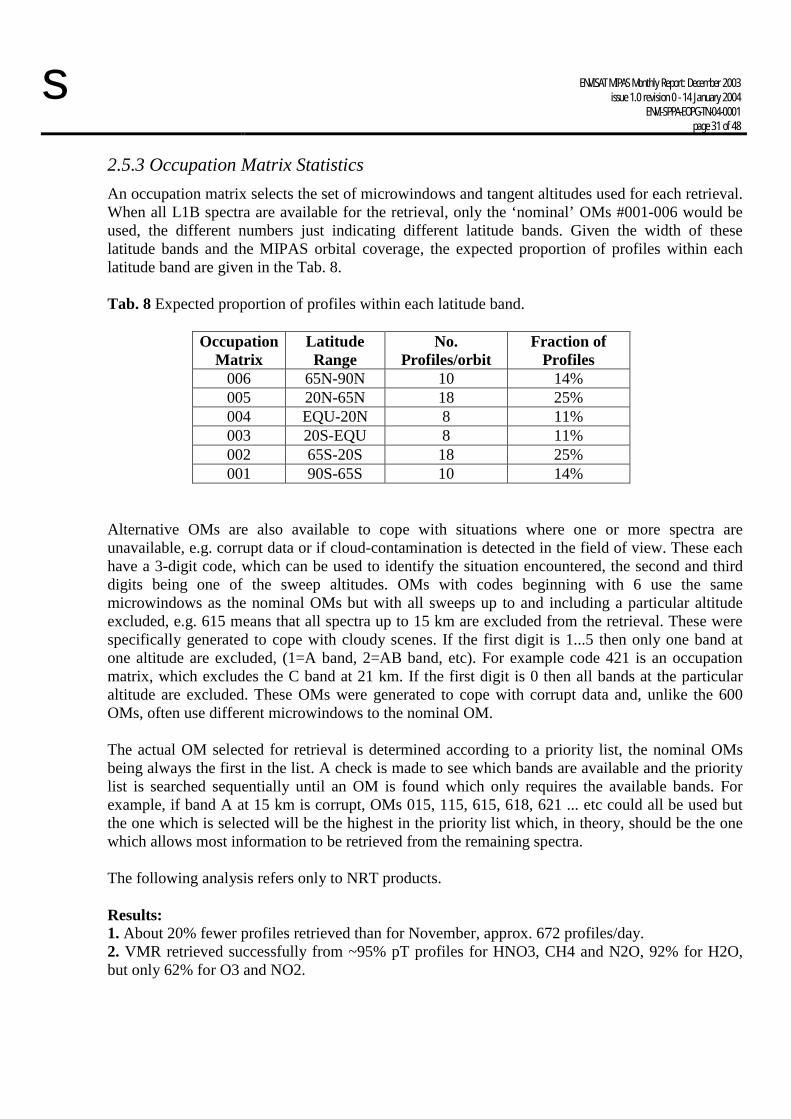
2. CH4 CH4 microwindow residuals indicate a small overestimate of up to 0.05 ppmv at all altitudes. Other microwindow residuals indicate an underestimate of 0.1 ppmv at 21 km, an overestimate of 0.2 ppmv at 30 km. Polar latitudes are much more variable. No significant change from previous month.
3. H2O H2O microwindow residuals indicate an underestimate of 0-2 ppmv from 15-60 km, although an overestimate of 2 ppmv for equatorial latitudes at 12 km. Other microwindow

ENVISAT MIPAS Monthly Report: December 2003 issue 1.0 revision 0 - 14 January 2004
ENVI-SPPA-EOPG-TN-04-0001 page 24 of 48
s residuals indicate a larger underestimate of 2-8 ppmv, larger in southern/summer hemisphere. No significant change from previous month.
4. HNO3 HNO3 microwindow residuals indicate a slight underestimate of a few %. Other microwindow residuals indicate a much larger overestimate reaching 5-10 ppbv at 33 km, much larger (20 ppbv) for the South Polar Region, also an underestimate of up to 5 ppbv for the equatorial region at 12-15 km. No significant change from previous month.
5. N2O N2O microwindow residuals indicate an underestimate of up to 25 ppbv at 30 km, smaller in the northern hemisphere. Other microwindow residuals indicate an underestimate of up to 10 ppbv at 27 km and overestimate of 30 ppbv at 47 km. No significant change from previous month.
6. NO2 NO2 microwindow residuals indicate an underestimate of up to 1ppbv below 30 km and a similar overestimate above 30 km. Other microwindow residuals indicate a large (>10 ppbv) underestimate above 47 km in the South Polar Region, and a similar overestimate in the North Polar Region. No significant change from previous month.
7. O3 O3 microwindow residuals indicate an overestimate reaching 0.2 ppmv for equatorial latitudes from 21-33 km, and an underestimate reaching 0.5 ppmv at 52 km. Other microwindow residuals indicate an underestimate of up to 1 ppmv at 27 km and an overestimate of 0.5 ppmv at 42 km, 1.5 ppmv for the North Polar Region. No significant change from previous month.
8. 0th Derivative Most microwindows show residual signatures of the original spectrum within 2% of the original magnitude, very approximately related to the 2% radiometric gain error budget. The main departure occurs for the NO2 micro-windows, which have residual signatures of 10-20%. The unusually high usage of the H2O "424" occupation matrix this month means that the H2O_0021 "reserve" B-band microwindow appears in the plot, however it has only a small 0th derivative residual signature. Apart from this, no significant changes compared with the previous month.
9. 1st Derivative Most microwindows show residual 1st derivative signatures corresponding to spectral shifts within the 0.001 cm-1 spectral calibration error budget. The main departures are a negative shift for high altitude, long wavelength pT microwindows and NO2 microwindows, and a positive shift for a single H2O microwindow at one altitude. There is a general trend for a positive shift from high altitude to low altitude for any one microwindow somewhat larger than the expected 0.0002 cm-1 that would be expected from the relative Doppler shift caused by a 60 km difference in tangent point altitude. Unusually, the H2O_0021 and H2O_0023 B-band microwindows appear in this month statistics but these have small signatures. Apart from this, no significant changes compared with the previous month.
10. 2nd Derivative The assumed error budget for uncertainty in the width of the apodised instrument lineshape is 2%. Several pT microwindows show positive 2nd derivative signatures at high altitude equivalent to an increase of up to 10%. For NO2 at high altitude there is a variation of +/-

ENVISAT MIPAS Monthly Report: December 2003 issue 1.0 revision 0 - 14 January 2004
ENVI-SPPA-EOPG-TN-04-0001 page 25 of 48
s 10% between microwindows. The spare PT__0035 (945cm-1) A-band microwindow as well as the two B-band H2O microwindows (H2O_0021 and H2O_0023) appear in this month statistics. The pT microwindow has a small signature but the B-band H2O microwindows have similar, generally positive, signatures comparable with the C-band H2O microwindows. Apart from this, no significant changes compared with the previous month.
Explanation of Plots: Target Species (Fig. 10-16): Spectral signatures of a large number of error sources are fitted simultaneously for each altitude and latitude band, but only those associated with pressure and the 6 retrieved species are plotted. Different colours/symbols indicate different latitude ranges. X-axis is an approximate conversion of residual signature to VMR or % pressure error based on a mid-latitude daytime profile. Black dashed line indicates +/- climatological 1sigma variability, dotted lines represent +/-10% and 100% of the profile value. Positive values indicate larger signature in atmospheric spectrum than forward model, indicating an underestimate of the `true' profile. Solid symbols represent the residuals fitted using only the target microwindows for each species (e.g., fitting H2O signature in H2O microwindows only) and open symbols represent the residuals fitted for all the other microwindows (e.g., fitting H2O signature in all the non-H2O microwindows). Spectral Derivatives (Fig. 17-19): 0th, 1st and 2nd derivative signatures are fitted to each microwindow/altitude independently. Colours indicate microwindow target species and symbols indicate altitude range. Microwindow labels are listed in order of increasing wavenumber along the top but the set of small arrows indicates actual position along the x-axis. The y-axis represents a scaling of the signature in terms of some instrumental error. Following this analogy, positive y values indicate an underestimate of either the gain (0th derivative), the wavenumber of atmospheric lines (1st derivative), or the AILS width (2nd derivative), in the sense of regarding the atmospheric spectra as `true' values compared to the forward model. Only points representing large numbers of residuals are plotted.
ENVISAT MIPAS Monthly Report: December 2003 issue 1.0 revision 0 - 14 January 2004
ENVI-SPPA-EOPG-TN-04-0001 page 26 of 48
s
Fig. 10 Pressure REC analysis: December 2003.
Fig. 11 CH4 REC analysis: December 2003.

ENVISAT MIPAS Monthly Report: December 2003 issue 1.0 revision 0 - 14 January 2004
ENVI-SPPA-EOPG-TN-04-0001 page 27 of 48
s
Fig. 12 H2O REC analysis: December 2003.
Fig. 13 HNO3 REC analysis: December 2003.

ENVISAT MIPAS Monthly Report: December 2003 issue 1.0 revision 0 - 14 January 2004
ENVI-SPPA-EOPG-TN-04-0001 page 28 of 48
s
Fig. 14 N2O REC analysis: December 2003.
Fig. 15 NO2 REC analysis: December 2003.

ENVISAT MIPAS Monthly Report: December 2003 issue 1.0 revision 0 - 14 January 2004
ENVI-SPPA-EOPG-TN-04-0001 page 29 of 48
s
Fig. 16 O3 REC analysis: December 2003.
Fig. 17 0th order derivative error: December 2003.

ENVISAT MIPAS Monthly Report: December 2003 issue 1.0 revision 0 - 14 January 2004
ENVI-SPPA-EOPG-TN-04-0001 page 30 of 48
s
Fig. 18 1st order derivative error: December 2003.
Fig. 19 2nd order derivative error: December 2003.
ENVISAT MIPAS Monthly Report: December 2003 issue 1.0 revision 0 - 14 January 2004
ENVI-SPPA-EOPG-TN-04-0001 page 31 of 48
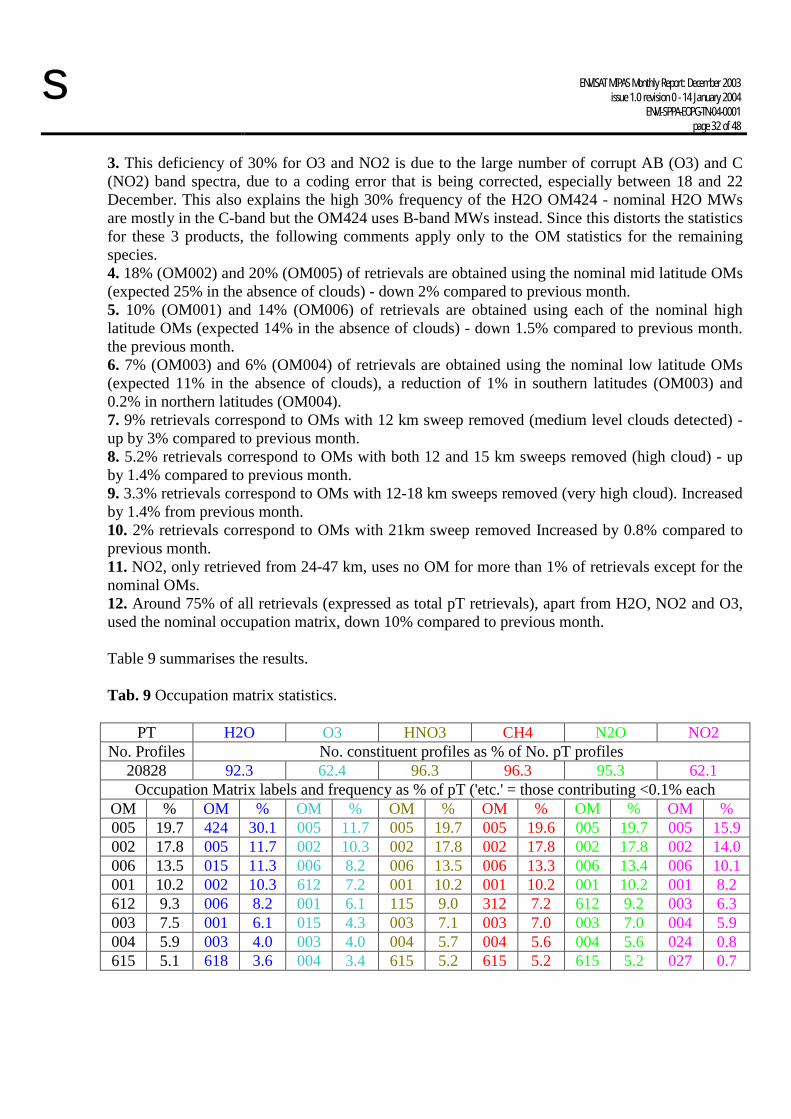
s 2.5.3 Occupation Matrix Statistics An occupation matrix selects the set of microwindows and tangent altitudes used for each retrieval. When all L1B spectra are available for the retrieval, only the ‘nominal’ OMs #001-006 would be used, the different numbers just indicating different latitude bands. Given the width of these latitude bands and the MIPAS orbital coverage, the expected proportion of profiles within each latitude band are given in the Tab. 8. Tab. 8 Expected proportion of profiles within each latitude band.
Occupation Matrix
Latitude Range
No. Profiles/orbit
Fraction of Profiles
006 65N-90N 10 14% 005 20N-65N 18 25% 004 EQU-20N 8 11% 003 20S-EQU 8 11% 002 65S-20S 18 25% 001 90S-65S 10 14%
Alternative OMs are also available to cope with situations where one or more spectra are unavailable, e.g. corrupt data or if cloud-contamination is detected in the field of view. These each have a 3-digit code, which can be used to identify the situation encountered, the second and third digits being one of the sweep altitudes. OMs with codes beginning with 6 use the same microwindows as the nominal OMs but with all sweeps up to and including a particular altitude excluded, e.g. 615 means that all spectra up to 15 km are excluded from the retrieval. These were specifically generated to cope with cloudy scenes. If the first digit is 1...5 then only one band at one altitude are excluded, (1=A band, 2=AB band, etc). For example code 421 is an occupation matrix, which excludes the C band at 21 km. If the first digit is 0 then all bands at the particular altitude are excluded. These OMs were generated to cope with corrupt data and, unlike the 600 OMs, often use different microwindows to the nominal OM. The actual OM selected for retrieval is determined according to a priority list, the nominal OMs being always the first in the list. A check is made to see which bands are available and the priority list is searched sequentially until an OM is found which only requires the available bands. For example, if band A at 15 km is corrupt, OMs 015, 115, 615, 618, 621 ... etc could all be used but the one which is selected will be the highest in the priority list which, in theory, should be the one which allows most information to be retrieved from the remaining spectra. The following analysis refers only to NRT products. Results: 1. About 20% fewer profiles retrieved than for November, approx. 672 profiles/day. 2. VMR retrieved successfully from ~95% pT profiles for HNO3, CH4 and N2O, 92% for H2O, but only 62% for O3 and NO2.
ENVISAT MIPAS Monthly Report: December 2003 issue 1.0 revision 0 - 14 January 2004
ENVI-SPPA-EOPG-TN-04-0001 page 32 of 48
s 3. This deficiency of 30% for O3 and NO2 is due to the large number of corrupt AB (O3) and C (NO2) band spectra, due to a coding error that is being corrected, especially between 18 and 22 December. This also explains the high 30% frequency of the H2O OM424 - nominal H2O MWs are mostly in the C-band but the OM424 uses B-band MWs instead. Since this distorts the statistics for these 3 products, the following comments apply only to the OM statistics for the remaining species. 4. 18% (OM002) and 20% (OM005) of retrievals are obtained using the nominal mid latitude OMs (expected 25% in the absence of clouds) - down 2% compared to previous month. 5. 10% (OM001) and 14% (OM006) of retrievals are obtained using each of the nominal high latitude OMs (expected 14% in the absence of clouds) - down 1.5% compared to previous month. the previous month. 6. 7% (OM003) and 6% (OM004) of retrievals are obtained using the nominal low latitude OMs (expected 11% in the absence of clouds), a reduction of 1% in southern latitudes (OM003) and 0.2% in northern latitudes (OM004). 7. 9% retrievals correspond to OMs with 12 km sweep removed (medium level clouds detected) - up by 3% compared to previous month. 8. 5.2% retrievals correspond to OMs with both 12 and 15 km sweeps removed (high cloud) - up by 1.4% compared to previous month. 9. 3.3% retrievals correspond to OMs with 12-18 km sweeps removed (very high cloud). Increased by 1.4% from previous month. 10. 2% retrievals correspond to OMs with 21km sweep removed Increased by 0.8% compared to previous month. 11. NO2, only retrieved from 24-47 km, uses no OM for more than 1% of retrievals except for the nominal OMs. 12. Around 75% of all retrievals (expressed as total pT retrievals), apart from H2O, NO2 and O3, used the nominal occupation matrix, down 10% compared to previous month. Table 9 summarises the results.
Tab. 9 Occupation matrix statistics.
PT H2O O3 HNO3 CH4 N2O NO2 No. Profiles No. constituent profiles as % of No. pT profiles
20828 92.3 62.4 96.3 96.3 95.3 62.1 Occupation Matrix labels and frequency as % of pT ('etc.' = those contributing <0.1% each
OM % OM % OM % OM % OM % OM % OM % 005 19.7 424 30.1 005 11.7 005 19.7 005 19.6 005 19.7 005 15.9 002 17.8 005 11.7 002 10.3 002 17.8 002 17.8 002 17.8 002 14.0 006 13.5 015 11.3 006 8.2 006 13.5 006 13.3 006 13.4 006 10.1 001 10.2 002 10.3 612 7.2 001 10.2 001 10.2 001 10.2 001 8.2 612 9.3 006 8.2 001 6.1 115 9.0 312 7.2 612 9.2 003 6.3 003 7.5 001 6.1 015 4.3 003 7.1 003 7.0 003 7.0 004 5.9 004 5.9 003 4.0 003 4.0 004 5.7 004 5.6 004 5.6 024 0.8 615 5.1 618 3.6 004 3.4 615 5.2 615 5.2 615 5.2 027 0.7
ENVISAT MIPAS Monthly Report: December 2003 issue 1.0 revision 0 - 14 January 2004
ENVI-SPPA-EOPG-TN-04-0001 page 33 of 48
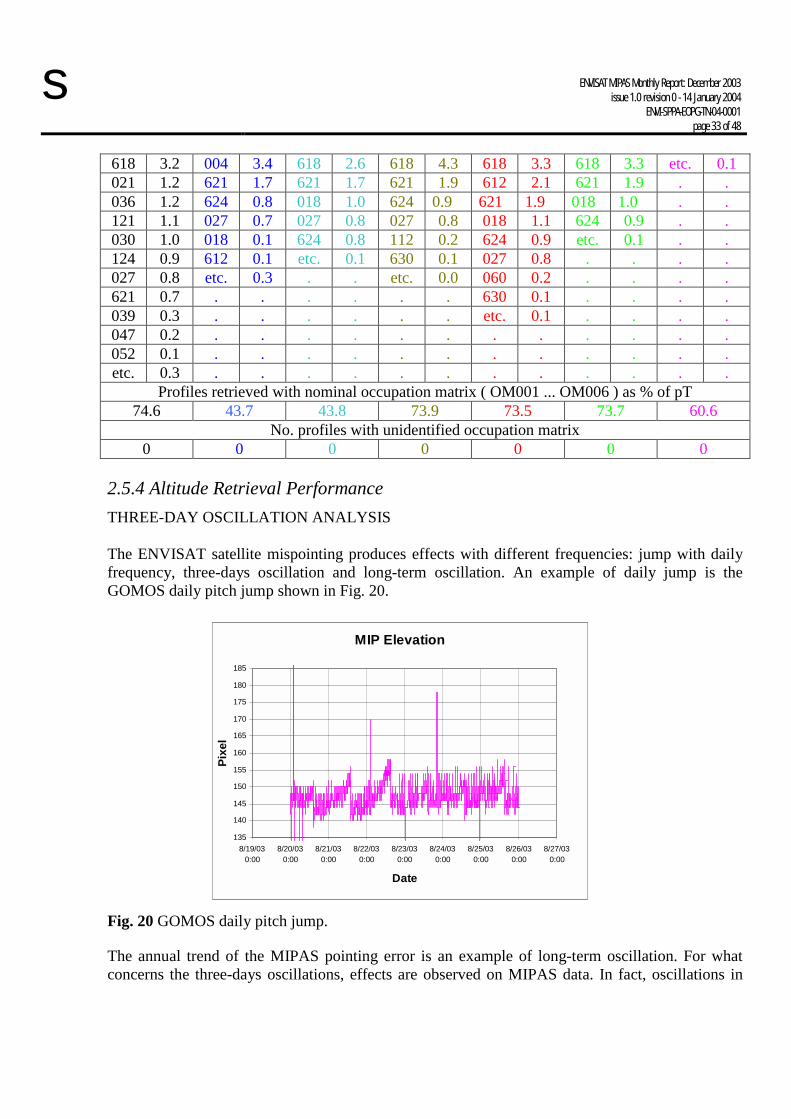
s 618 3.2 004 3.4 618 2.6 618 4.3 618 3.3 618 3.3 etc. 0.1 021 1.2 621 1.7 621 1.7 621 1.9 612 2.1 621 1.9 . . 036 1.2 624 0.8 018 1.0 624 0.9 621 1.9 018 1.0 . . 121 1.1 027 0.7 027 0.8 027 0.8 018 1.1 624 0.9 . . 030 1.0 018 0.1 624 0.8 112 0.2 624 0.9 etc. 0.1 . . 124 0.9 612 0.1 etc. 0.1 630 0.1 027 0.8 . . . . 027 0.8 etc. 0.3 . . etc. 0.0 060 0.2 . . . . 621 0.7 . . . . . . 630 0.1 . . . . 039 0.3 . . . . . . etc. 0.1 . . . . 047 0.2 . . . . . . . . . . . . 052 0.1 . . . . . . . . . . . . etc. 0.3 . . . . . . . . . . . .
Profiles retrieved with nominal occupation matrix ( OM001 ... OM006 ) as % of pT 74.6 43.7 43.8 73.9 73.5 73.7 60.6
No. profiles with unidentified occupation matrix 0 0 0 0 0 0 0
2.5.4 Altitude Retrieval Performance THREE-DAY OSCILLATION ANALYSIS The ENVISAT satellite mispointing produces effects with different frequencies: jump with daily frequency, three-days oscillation and long-term oscillation. An example of daily jump is the GOMOS daily pitch jump shown in Fig. 20. Fig. 20 GOMOS daily pitch jump. The annual trend of the MIPAS pointing error is an example of long-term oscillation. For what concerns the three-days oscillations, effects are observed on MIPAS data. In fact, oscillations in
MIP Elevation
135
140
145
150
155
160
165
170
175
180
185
8/19/030:00
8/20/030:00
8/21/030:00
8/22/030:00
8/23/030:00
8/24/030:00
8/25/030:00
8/26/030:00
8/27/030:00
Date
Pixe
l

ENVISAT MIPAS Monthly Report: December 2003 issue 1.0 revision 0 - 14 January 2004
ENVI-SPPA-EOPG-TN-04-0001 page 34 of 48
s tangent point pressure with a three-days period and amplitude of about 2% have been evidenced by an analysis done by the Oxford University (see an example in Fig. 21). The three-days oscillations are probably caused by the bi-daily update of the ENVISAT orbit model. Fig. 21 Standard deviation of the zonal mean tangent point pressure (at 30 km) as a function of time. The three-days oscillations will be analysed in the January Monthly Report in order to assess whether the update done on the pointing software has removed the intermediate-term oscillations. NOISY TEMPERATURE It has been observed that the retrieved temperature became noisier after about the first week in October (see an example in Fig. 22). Corrected altitude and pressure also appear to become noisier. The following sources of problems have been excluded:
• Mispointing: because the pointing noise is less than 4 mdeg. • Noisy D1 channel: there are no temperature MWs in D1 channel.
The analysis is still ongoing.

ENVISAT MIPAS Monthly Report: December 2003 issue 1.0 revision 0 - 14 January 2004
ENVI-SPPA-EOPG-TN-04-0001 page 35 of 48
s Fig. 22 Standard deviation of the zonal mean tangent point temperature (at 30 km) as a function of time. JUMP IN O3 AND H2O Some changes in MIPAS temperature, ozone and water vapour retrievals after 28 October 2003 have been noticed. They are most noticeable in ozone in the top levels (< 1 hPa) between 90-65N. There are also some changes at high levels in 65-90S, but large changes between 65N-65S haven’t been noticed. The anomaly could be related to the recent solar storm for the following reasons:
• The effect appears to be confined to high altitudes • The ions produced by solar protons induce ozone and water vapour reduction • It has been observed an increase of MIPAS ozone during the first week of November (once
finished the solar storm) CLOUD FILTERING By intercomparison with the processor and the prototype, a coding error has been detected in the operational processor resulting in incorrect cloud flagging in operational products. This error is currently being corrected. Table 10 shows an example where the discrepancy has been found between prototype and processor.

ENVISAT MIPAS Monthly Report: December 2003 issue 1.0 revision 0 - 14 January 2004
ENVI-SPPA-EOPG-TN-04-0001 page 36 of 48
s Tab. 10 Clouds detected (values equal to 1) by the prototype (violet) and by the processor (green).
Sweep Scan
0 1 2 3 4 5 6 7 8 9 10 11 12 13 14 15 16
0 0 0 0 0 0 0 0 0 0 0 0 0 0 1 0 0 1 0 0 0 0 0 0 0 0 0 0 0 0 0 0 0 0 0 0 0 0 0 0 0 0 0 0 0 0 0 0 0 1 0 0 3 0 0 0 0 0 0 0 0 0 0 0 0 0 0 0 0 0 0 0 0 0 0 0 0 0 0 0 0 0 0 0 0 0 0 5 0 0 0 0 0 0 0 0 0 0 0 0 0 0 1 0 0 0 0 0 0 0 0 0 0 0 0 0 0 0 0 0 0 0 7 0 0 0 0 0 0 0 0 0 0 0 0 0 0 1 0 0
ISP CORRUPTION During the generation of MIPAS Level 1 products processing failures have been observed. The products causing the problems (orbits 8693 and 8698, 29 October 2003) have been analysed by Astrium and the conclusion has been that the anomaly is to be explained by the high solar activity at the end of October. D1-CHANNEL NOISE Between September and November channel D1 noise went up by a factor 10 and channel D2 noise went down (remaining higher than the old D1 noise). This anomaly might potentially be linked to the LOS commanding error. The settings for the LOS measurements processing have been changed assigning 0 weight to channel D1 and weight equal to 1 to channel D2. The investigation is still ongoing. ANOMALOUS PROCESSING TIME An excessive processing time for Level 2 off-line processing characterizes some MIPAS products. This has been tracked down to 2 causes:
1. A discrepancy between processor and prototype processing time. 2. A bug in the processor that is not able to process scans composed by one only altitude
level. A recoding of the operational processor is underway to resolve problem 1, and a reconfiguration is in progress to resolve problem 2. OSCILLATING SPECTRA Starting from middle November, spectra characterized by strong oscillations have been observed. The anomaly is still under investigation.

ENVISAT MIPAS Monthly Report: December 2003 issue 1.0 revision 0 - 14 January 2004
ENVI-SPPA-EOPG-TN-04-0001 page 37 of 48
s ILS BUG A discrepancy has been observed between the ILS retrieval performed by the operational processor and the retrieval performed by the prototype. The anomaly is being resolved.
2.5.5 Other Level 2 Performance Issues
2.5.5.1 Improvement Done The improvements done for Level 2 processing have been described in Sections 2.5.1.1 and 2.5.1.2. This Section deeply describes the improvements that have been introduced with the installation of the new kit of ADFs (V3.6). OPTIMIZATION OF RETRIEVAL ALTITUDE RANGE
In version V3.1 of MIPAS Level 2 auxiliary data (those disseminated in July 2003) the Level 2 retrieval is limited to an altitude range (nominal retrieval range) in which good retrieval accuracy is possible. The extent of the altitude retrieval range has been optimized (V3.6 Off-line set) in order to reduce the error at the boundaries due to the wrong assumption of the profile outside the retrieval range. The results of these optimizations are new OMs (included in MIP_OM2_AX_V3.2 file) that are part of V3.2 of the MIPAS Level 2 auxiliary data.
A customized retrieval range with an extension down to 6 km was tested, for which an extra computing time up to 65% was observed. The retrieval altitude ranges for the different species are listed in Tab. 11 for the nominal case (V3.1) and the 6 km extension (V3.6 Off-line set). Tab. 11 Altitude retrieval range for the different retrievals in both nominal and extended ranges.
Nominal range (V3.1) 6 km extension (V3.6 Off-line set)
PT 12-68 km 6-68 km H2O 12-60 km 6-68 km O3 12-60 km 6-68 km
HNO3 12-42 km 9-42 km CH4 12-60 km 6-68 km N2O 12-47 km 6-60 km NO2 24-47 km 24-68 km
In order to assess the improvement obtained with this extension, the IFAC team has evaluated the error at the boundaries of the nominal range due to the assumed profile shape. To this purpose, the IFAC team has calculated the difference between the profiles retrieved in the two cases. Table 12 shows the rms of the differences in the profile between nominal case and 6 km extension, normalised with respect to the random errors. The cases in which the assumed profile error is greater than 3 times the random error have been highlighted.

ENVISAT MIPAS Monthly Report: December 2003 issue 1.0 revision 0 - 14 January 2004
ENVI-SPPA-EOPG-TN-04-0001 page 38 of 48
s Tab. 12 The rms of the differences normalised with respect to the random errors.
r. m. s. Species Altitudes [km] #2081 #6646
Temperature 12 1.5 2.3 Pressure 12 1.1 3.4
H2O 12 15.2 9.2 H2O 60 16.8 10.1 O3 12 1.4 3.4 O3 60 1.7 4.0
HNO3 12 1.8 4.1 CH4 12 1.2 5.2 CH4 60 2.4 2.0 N2O 12 16.1 3.0 N2O 47 1.2 1.4 NO2 47 8.6 34.9
The improvement in the quality of MIPAS Level 2 data induced by the extension of the retrieval range makes it worthwhile to extend the profiles. The extension of the retrieved profile moves the problem of the retrieved profile error to the new boundary element. However since it is in the nominal range that high accuracy data are possible, the problem is in this case less important.
OPTIMIZATION OF CONVERGENCE CRITERIA THRESHOLDS New thresholds for the convergence criteria have been determined in order to reduce the error in the retrieved profiles, due to the fact that the real convergence is not reached (this error will be referred in the text as ‘convergence error’). The orbits that were analyzed are # 2081 and # 6646. These new convergence thresholds are part of V3.6 (off-line set) of the MIPAS Level 2 auxiliary data. In order to assess the error obtained with the new thresholds and evaluate this error respect to the random error, the IFAC team has compared the profiles obtained with the new thresholds with the reference profiles (obtained after 10 iterations) by means of the quantity:
( )
_
_1
_1 _
1
_
12,
2,,∑ ∑
= =
−=
scann
j
sweepn
i ji
jiji
j
j
randomrefprofileprofile
sweepsnscannrandomconv
In general a greater number of iterations is needed in the optimized case with respect to the nominal case, in fact the computing time has increased respect to the nominal case (between 32 and 35%), but the convergence error is strongly reduced. The new convergence criteria make the convergence error small enough to be neglected in the total error budget. Occasionally, retrievals that do not reach convergence are in this case encountered (see Tab. 13).

ENVISAT MIPAS Monthly Report: December 2003 issue 1.0 revision 0 - 14 January 2004
ENVI-SPPA-EOPG-TN-04-0001 page 39 of 48
s Tab. 13 Comparison between nominal and optimized convergence criteria thresholds for orbits #2081 and # 6646.
# 2081 # 6646 Nominal case Optimised case Nominal case Optimised case
conv error/ random error
% scans that do not reach convergence
conv error /
random error
% scans that do not reach convergence
conv error /
random error
% scans that do not reach convergence
conv error /
random error
% scans that do not reach convergence
P 0.77 0.31 1.03 0.51 T 0.53
0 0.34
0 1.69
0 0.62
4.2
H2O 1.24 2.9 0.38 2.9 0.85 5.6 0.53 7.0 O3 0.97 0 0.43 4.4 0.92 2.8 0.43 4.2
HNO3 0.91 0 0.35 0 0.86 4.2 0.57 5.6 CH4 0.77 1.5 0.26 1.5 0.37 2.8 0.31 4.2 N2O 0.96 0 0.36 0 1.05 0 0.45 4.2 NO2 0.97 0 0.23 7.3 0.97 1.4 0.42 5.6
Increase in computing time with
respect to the nominal case
-
32%
-
35%
Tests have proved that in order to reduce the convergence error, a different weight had to be given to the two relevant convergence criteria: the maximum variation of the retrieved parameters at a given iteration with respect to the previous iteration and the criterion on linear variation of 2χ . The two criteria work with an OR logic. The criterion on the maximum variation of the retrieved parameters had to be made more active than the criterion on linear variation of 2χ . To this purpose, after several tests, the linear 2χ threshold was reduced by a factor 8 with respect to the original value, while the thresholds for the maximum profile variation were increased to more realistic values. The new, more realistic, thresholds for the maximum variation of the parameters were selected on the basis of the estimated minimum of the random error profile obtained for the nominal OMs. Table 14 shows, for each retrieval, the minimum random error and the adopted altitude independent thresholds.

ENVISAT MIPAS Monthly Report: December 2003 issue 1.0 revision 0 - 14 January 2004
ENVI-SPPA-EOPG-TN-04-0001 page 40 of 48
s Tab. 14 Thresholds for maximum variation of the parameters in the different retrievals (compared with the minimum of the estimated random error profile)
Minimum of the random error profile for the nominal OM
Thresholds for maximum variation of the parameters
Temperature 0.8 K 1.2 K Pressure 1.3 % 2%
H2O 4.9 % 8% O3 5.7 % 8%
HNO3 3.8 % 14% CH4 8.5 % 18% N2O 10.3 % 12% NO2 14.3 % 12%
The maximum number of Gauss iterations was also modified from 10 to 8, and the maximum number of Marquardt iterations was modified from 10 to 5. Considering that the average number of iterations per retrieval is between 2 and 3, the reduction of the total number of iterations tries to avoid wasting time in scans that anyhow will not converge. ILS RETRIEVAL Some Level 2 tests performed with ORM during the Commissioning Phase had detected an error in the AILS width (see ‘ORM Cal Val Analysis’, TN-IFAC-GS0301, April 2003) and this error was listed among the not yet solved issues. Recently an error in Level 2 pre-processor has been detected consisting in the swapping in the file MIP_PS2_AX of two variables used for the computation of the ILS. In order to reduce the effect of the error in the Level 2 pre-processor for the computation of the ILS a temporary short-term fix in the PS2 has been tested with the ORM code. The ORM tests for ILS width determination have been repeated with the modified PS2 file in order to see whether the temporary short-term fix in the PS2 file helps in reducing the observed error in the AILS width. The retrieved ILS broadening parameters averaged on the whole orbit for the different spectral bands are reported in Tab. 15. Tab. 15 ILS broadening parameters averaged on the whole orbit for the different spectral bands after the PS2 correction.
A AB B C 6.09 10-3 ± 2.2 10-3 -3.33 10-3± 2.9 10-3 -8.7 10-3± 3 10-3 2.25 10-2± 2.7 10-3
As term of comparison, Tab. 16 reports the ILS broadening parameters averaged on the whole orbit for the different spectral bands as observed in the tests for the Commissioning Phase (April 2003) and hence before the PS2 correction. In that case, the averaged broadening parameter was negative for all bands, suggesting that the real ILS was sharper than the one computed by the Level 2 pre-processor.

ENVISAT MIPAS Monthly Report: December 2003 issue 1.0 revision 0 - 14 January 2004
ENVI-SPPA-EOPG-TN-04-0001 page 41 of 48
s Tab. 16 ILS broadening parameters averaged on the whole orbit for the different spectral bands before the PS2 correction
A AB B C -2. 63 10-2± 2 10-3 -4.49 10-2 ± 3 10-3 -5.73 10-2± 3 10-3 -4.43 10-2± 2 10-2
The AILS width correction is reduced by about one order of magnitude for band A, AB and B, therefore the PS2 correction surely helps in reducing the error on the ILS. However, an error is still detected for band C with an opposite sign with respect to Commissioning Phase tests. The modified PS2 is part of V3.6 of MIPAS Level 2 auxiliary data. In order to quantify the effect of the ILS correction on retrieved tangent altitudes, the tangent pressures retrieved in orbit #2081 before and after the ILS correction have been compared. In Fig. 23 the map of ln(Pbefore/Pafter) is reported, where Pbefore and Pafter represent the tangent pressures retrieved before and after the ILS correction respectively.
Fig. 23 Differences between the logarithm of the tangent pressure retrieved before and after the ILS correction. It is evident that the ILS error introduced a small but measurable bias in the retrieved tangent pressures. Considering that the relation between the variation in altitude and the variation in ln P is given by: [ ] Pln.kmz ∆=∆ 37 , we deduce that the error in the ILS introduces a negative bias in the determination of the tangent altitude of the order of 50-100 metres.
Ln (Pbefore/Pafter)
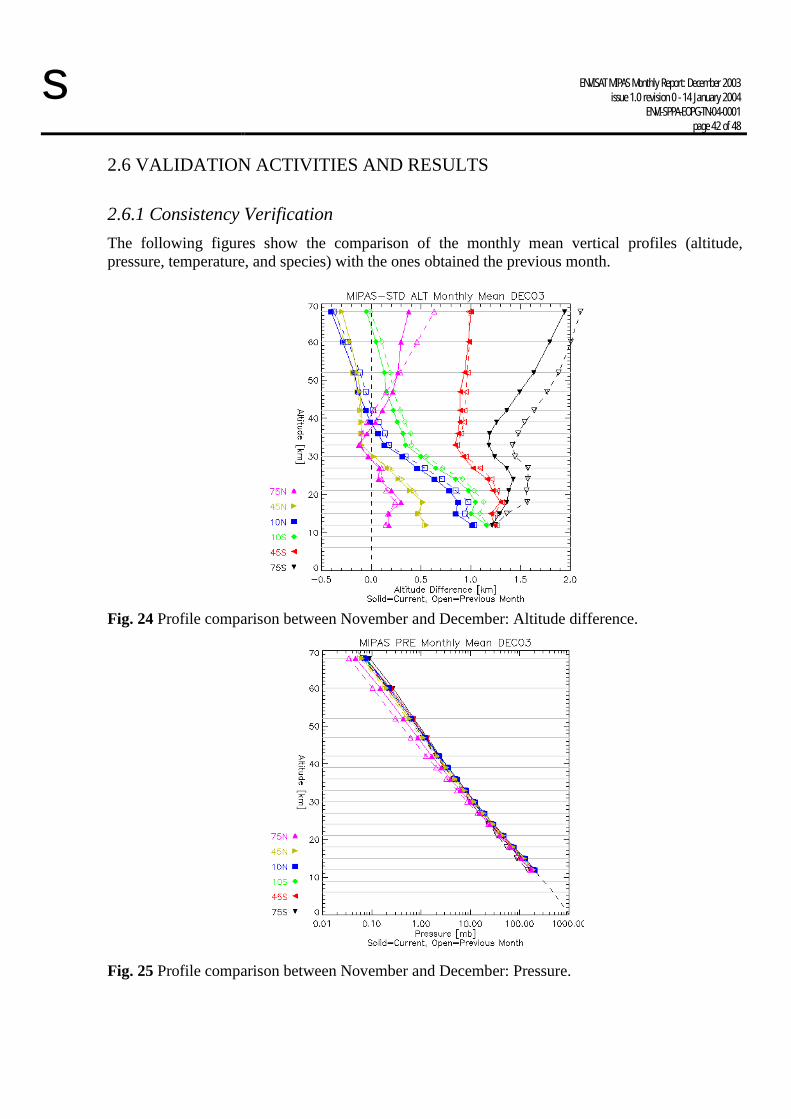
ENVISAT MIPAS Monthly Report: December 2003 issue 1.0 revision 0 - 14 January 2004
ENVI-SPPA-EOPG-TN-04-0001 page 42 of 48
s 2.6 VALIDATION ACTIVITIES AND RESULTS
2.6.1 Consistency Verification The following figures show the comparison of the monthly mean vertical profiles (altitude, pressure, temperature, and species) with the ones obtained the previous month.
Fig. 24 Profile comparison between November and December: Altitude difference.
Fig. 25 Profile comparison between November and December: Pressure.

ENVISAT MIPAS Monthly Report: December 2003 issue 1.0 revision 0 - 14 January 2004
ENVI-SPPA-EOPG-TN-04-0001 page 43 of 48
s
Fig. 26 Profile comparison between November and December: Temperature.
Fig. 27 Profile comparison between November and December: CH4.
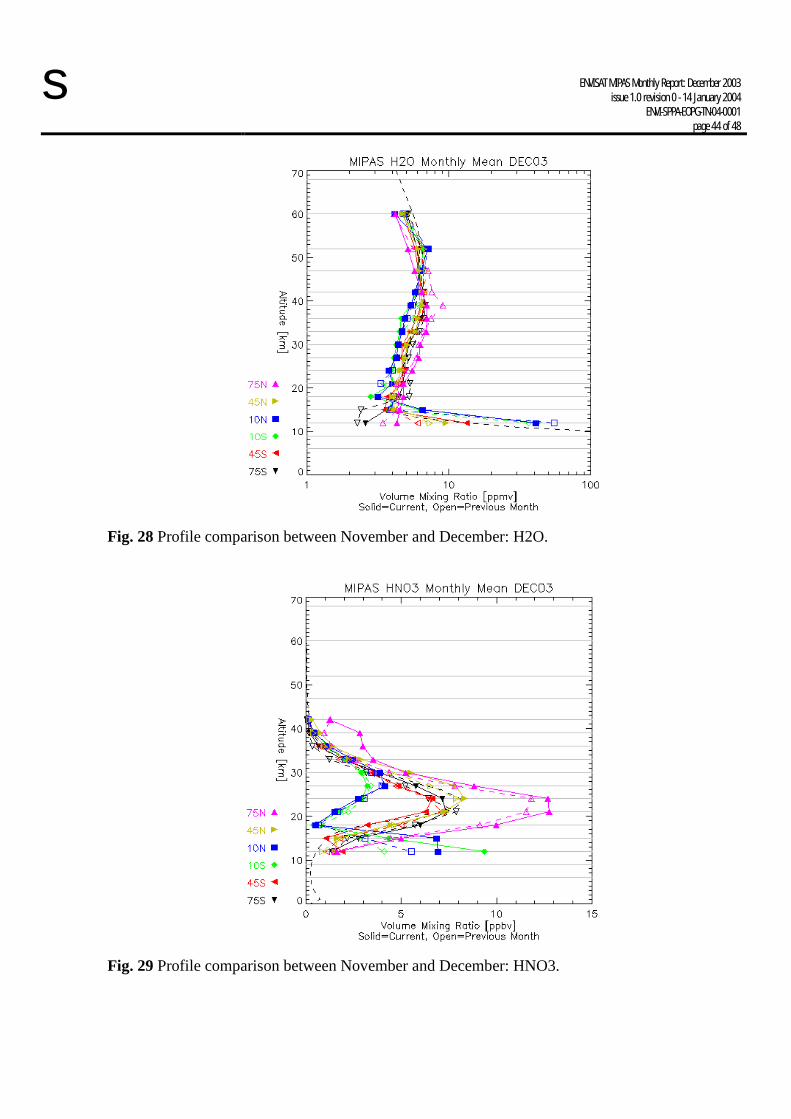
ENVISAT MIPAS Monthly Report: December 2003 issue 1.0 revision 0 - 14 January 2004
ENVI-SPPA-EOPG-TN-04-0001 page 44 of 48
s
Fig. 28 Profile comparison between November and December: H2O.
Fig. 29 Profile comparison between November and December: HNO3.

ENVISAT MIPAS Monthly Report: December 2003 issue 1.0 revision 0 - 14 January 2004
ENVI-SPPA-EOPG-TN-04-0001 page 45 of 48
s
Fig. 30 Profile comparison between November and December: N2O.
Fig. 31 Profile comparison between November and December: NO2.
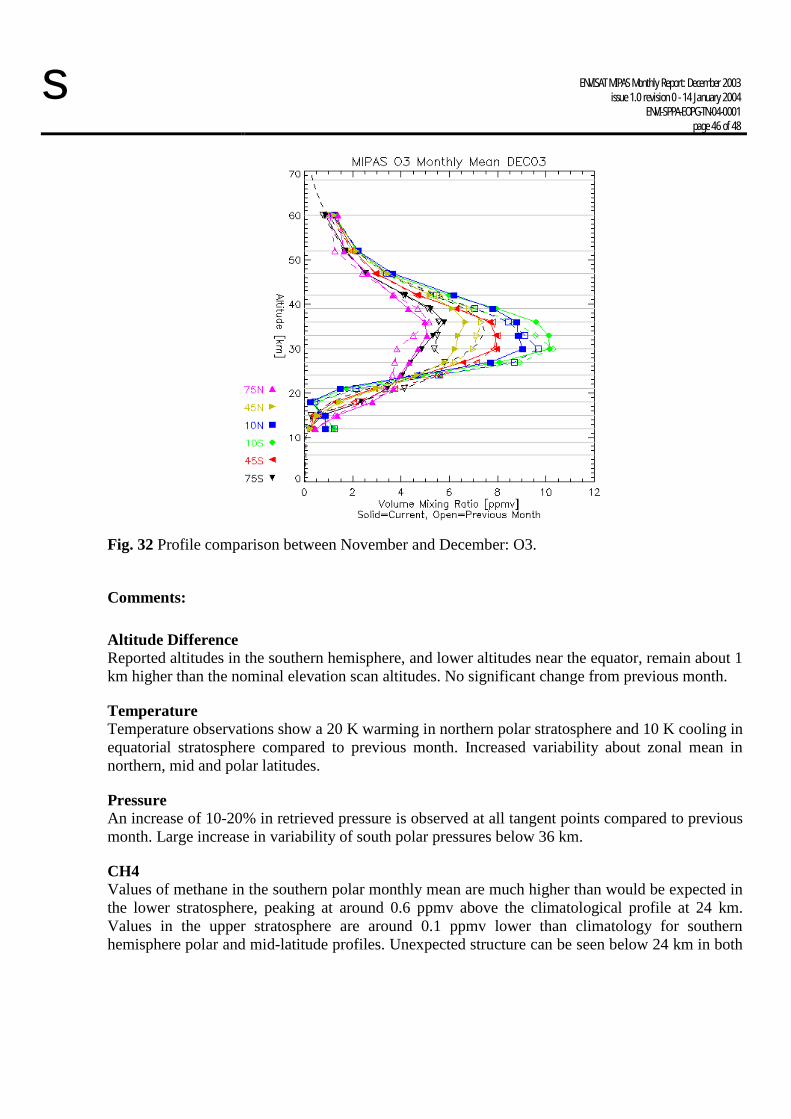
ENVISAT MIPAS Monthly Report: December 2003 issue 1.0 revision 0 - 14 January 2004
ENVI-SPPA-EOPG-TN-04-0001 page 46 of 48
s
Fig. 32 Profile comparison between November and December: O3.
Comments:
Altitude Difference Reported altitudes in the southern hemisphere, and lower altitudes near the equator, remain about 1 km higher than the nominal elevation scan altitudes. No significant change from previous month.
Temperature Temperature observations show a 20 K warming in northern polar stratosphere and 10 K cooling in equatorial stratosphere compared to previous month. Increased variability about zonal mean in northern, mid and polar latitudes.
Pressure An increase of 10-20% in retrieved pressure is observed at all tangent points compared to previous month. Large increase in variability of south polar pressures below 36 km.
CH4 Values of methane in the southern polar monthly mean are much higher than would be expected in the lower stratosphere, peaking at around 0.6 ppmv above the climatological profile at 24 km. Values in the upper stratosphere are around 0.1 ppmv lower than climatology for southern hemisphere polar and mid-latitude profiles. Unexpected structure can be seen below 24 km in both

ENVISAT MIPAS Monthly Report: December 2003 issue 1.0 revision 0 - 14 January 2004
ENVI-SPPA-EOPG-TN-04-0001 page 47 of 48
s northern and southern equatorial profiles. This has also been observed in previous months. However, the shape of the December monthly mean profiles is not the same as in previous months.
H2O Monthly means from November 2003 for northern polar latitudes showed anomalously high values of water vapour around 39 km. December values are more like the values in the climatology. Otherwise, the monthly mean water vapour profiles are largely similar to those from last month.
HNO3 Once again, the underlying retrieved structure is stable, similar to previous months. The Northern Polar VMR has increased slightly around 25 km, in line with the trend of previous months. There has also been an increase around 38 km that has not previously occurred. The equatorial lowermost levels have also shown an increase, although this is gone by 18 km. The remaining profiles show little change compared to last month.
N2O The Southern Polar VMR decrease observed last month has now reverted back to more typical mid-latitude values, rather higher than the climatology. The remaining profiles are very similar to last month's.
NO2 South Polar: No nighttime data and therefore lower SD than previous month. North Polar: Still very high nighttime values above 36 km but less high than previous month. South Equatorial: Maximum nighttime peak back to 39 km. South Mid-Lat: Maximum night-time peak still at 30 km instead of 39 km. Still problematic values at 47km for all latitudes
O3 South Polar: Second maximum at 27 km disappears (reduction of 1.5 ppmv) and better agreement with climatology than in previous month. North Polar: Increase of 1 ppmv around 30 km and better agreement with climatology at low altitude compared with previous month. Equatorial: Broadening of O3 peak and corresponding its shift with respect to climatology compared to previous month. North Mid-Lat: Decrease of 1 ppmv between 30 km and 39 km and same amount of deviation from climatology.
2.6.2 Statistics from Intercomparison with External Data 2.6.2.1 Comparison with ECMWF data TEMPERATURE The time series plots show an offset (larger MIPAS temperatures and increased departures) after the payload switch-off on 3 December. Values return to normal after the gain calibration on 9 December. This problem highlights the need for an automatic gain calibration after instrument or payload switch-offs. The time-series plots also show a warming in the middle stratosphere in the

ENVISAT MIPAS Monthly Report: December 2003 issue 1.0 revision 0 - 14 January 2004
ENVI-SPPA-EOPG-TN-04-0001 page 48 of 48
s second half of December. This is in agreement with the Stratalert reports from the Stratospheric Research Group at the FU Berlin (http://strat-www.met.fu-berlin.de/cgi-bin/alert) who report a minor stratospheric warming over Eastern Europe/ Western Asia. At the same time the mesosphere cools slightly. The MIPAS temperatures in the SH show a smaller scatter than in November, which is also seen in the time series of standard deviation of the MIPAS data. However, there are a few ’outliers’ (observations with lower temperatures than the rest) at high southern latitudes above 10 hPa. At high northern latitudes the scatter is increased compared to November, as a result of the minor stratospheric warming in the second half of December. The profile plots show that, over most of the stratosphere, the area averaged MIPAS temperatures are higher than ECMWF values, with departures less than 2%. In the mesosphere, the area averaged MIPAS temperatures are generally lower than ECMWF values with maximum departures up to -8% at the model top. The exception is the mesosphere over the winter pole, in this case the area 90-65N, where departures are positive. However, departures here are smaller than in November. OZONE MIPAS ozone data are actively assimilated in version CY26R3 of the ECMWF model. This means that the comparison with ECMWF ozone values does not give an independent validation of MIPAS ozone values any more. The time series show that the offset in the temperature data seen after the payload switch-off on 3 December propagates into the ozone retrieval and leads to lower MIPAS ozone values during those days. In 90-65N we see slightly increased ozone values in the lower stratosphere and in the 1-100 hPa column in the second half of December, which are likely to be connected to the stratospheric warming. Like for temperature, the scatter plots of MIPAS ozone data show a slightly smaller scatter in the SH than in November, but there are a few ’outliers’ that were not seen in November. The scatter plots show that there are still unrealistically large MIPAS ozone values in the tropics below 60 hPa, possibly a sign of cloud contamination that is not correctly detected by the processor. WATER VAPOUR MIPAS water vapour values are larger than ECMWF values by 10-40% over much of the stratosphere. The time series show that the offset in the temperature data seen after the payload switch-off on 3 December propagates into the water vapour retrieval and leads to lower MIPAS water vapour values during those days. The scatter plots again show some unrealistically large MIPAS water vapour values in the tropics, possibly a sign of cloud contamination.