environmentally sustainable transport in germany faculteit... · · 2017-04-05environmentally...
TRANSCRIPT

Environmentally Sustainable Transport in Germany
Hedwig Verron and Axel Friedrich Federal Environmental Agency Berlin Germany e-mail: [email protected] e-mail: [email protected]
EJTIR, 4, no. 1 (2004), pp. 71-98
Received: July 2003 Accepted: February 2004
The study reported in this paper is part of an OECD project with several case studies in different countries. The purpose of the project was to look for possible ways to reduce the environmental impact of transport to a level which is compatible with sustainability. The participants in the case studies agreed upon quantifying criteria for carbon dioxide, nitrogen oxides and volatile organic compounds, which should describe environmentally sustainable transport (EST), and each case study constructed a business-as-usual scenario and three EST scenarios, considering the period from 1990 to 2030. Each EST scenario should meet the criteria in a backcasting effort, EST1 looking for solely technical solutions, EST2 restricting and shifting transport volumes while ignoring technological progress, and EST3 combining components of both strategies. In the German case study criteria were additionally quantified for particulate matter, noise and land-take for transport purposes. The German EST1 scenario is based on hybrid electric hypercars, hydrogen for public transport, freight and aviation, and electricity from renewable sources. In the EST2 scenario total transport activity for passenger and freight transport had to be reduced by 40% and 25% respectively, compared to 1990 in order to meet the criteria. In the EST3 scenario, while highly energy efficient conventional propulsion systems and engines were used, total passenger transport decreased only slightly and freight transport even increased. Implementation measures were then defined on the basis of the EST3 scenario. Emission regulation, fuel tax, and road pricing for heavy duty vehicles were the key features in order to achieve EST in this case study. They were complemented by additional sets of measures, designed to prevent urban sprawl, diminish freight traffic growth, increase liveability of towns, improve the infrastructure and service conditions of alternative modes as well as provide energy supply by regenerative sources.
72 Environmentally Sustainable Transport in Germany
1. Introduction
Transport is the cause of many environmentally harmful effects and damage to health. The following report describes a case study, carried out by the German Federal Environmental Agency and the Wuppertal Institute for Climate, Environment and Energy as part of an OECD project on Environmentally Sustainable Transport (EST) with several case studies in different countries. The purpose of this project was to look for possible ways to reduce environmental impact of transport to a level which is compatible with sustainability. All case studies accepted the same set of criteria, defining the goals of sustainability, and followed the same methodology, constructing a business-as-usual scenario (BAU) and three EST scenarios, considering the period from 1990 to 2030. The common set of criteria was directed towards a considerable reduction of CO2, NOx and VOC. The participants in the case studies were free to add further criteria to the set. The scenarios are as follows: BAU: The “business-as-usual” scenario characterised the transport system and its activity in 2030, as projected from demographic and economic trends. It assumed present and planned technology and legislation supplemented by changes considered likely to occur. EST1: The high-technology scenario assumed that the amount of passenger and freight transport was to be the same as determined for the BAU scenario. The EST criteria were to be achieved entirely through technological change. EST2: The mobility management scenario assumed that the level of technological change was the same as for the BAU scenario. The EST criteria were to be achieved entirely through managing and reducing the demand for passenger and freight transport. EST3 combined technological progress and transport reduction strategies to meet the EST criteria. It assumed that less technological progress would take place than in EST1, and that fewer policy changes concerning transport activity would be made than in EST2. The EST scenarios were to be constructed in such a way that the sustainability criteria were all met (backcasting approach). In characterising the scenarios each case study had to find its own strategies. For the EST3 scenario policies and instruments had to be identified and implementation paths suggested in order to demonstrate in which way environmentally sustainable transport could be realised by 2030. Assessments of economic and social implications were carried out for the project in general as well as for some case studies. The German case study included an economic assessment using a system dynamics approach (Schade et al. 2002)1
2. Transport Situation in Germany
Germany has a population of 82 million people and 43 million cars. This means that Germany’s degree of motorisation is among the highest in Europe. The share of cars and motorbikes in the volume of motorised transport (based on the number of people transported and the distances) rose from 64 % in 1960 to 73 % in 1999. At the same time, the share of public road and rail transport fell from 35 % to 14 % (see Table 1).
1 See “The Economic Impact of Environmentally Sustainable Transport in Germany” by Burkhard Schade and Werner Rothengatter in this volume
Hedwig Verron and Axel Friedrich 73
Table 1. Distribution of motorised passenger transport volumes by transport modes 1960 and 1999
1960 (in %) 1999 (in %) Car/motorbike 64 73 Train 16 7 Bus, tram, underground rail 19 7 Aircraft2 1 13
Source: UBA 2002
By far the highest growth rates were seen in air transport. Whilst almost insignificant in 1960 with a share of less than 1 %, aircraft is the second most important mode of transport today. In the twenty years between 1976 and 1995 the number of air passengers in Germany trebled. The number of holidaymakers travelling by plane was almost five times higher in 1995 than in 1976 (Brosthaus et al. 2001). With present annual growth rates of 5 % and more, air transport is becoming more and more important. The trend towards cars and aircraft went hand in hand with rapid growth in the total volume of transport. With freight transport the situation is very similar, the growth rates of transport volumes being much higher than economic growth. Whilst the latter rose by around 10 % in real terms between 1991 and 1998, road haulage in the same period increased by almost 30 % (from around 246 billion tonne-kilometres to 316 billion tonne-kilometres). Above-average growth was recorded, in particular, for foreign lorry transports (+72 %). This growth took place primarily at the expense of rail transport which in 1999 only accounted for slightly more than 14 % of all freight transport mileage. The share of rail and inland waterway transport in overall volume of freight transport, which in 1960 was more than twice that of road haulage, has hence fallen to below 30 % (see Table 2). Table 2. Distribution of freight transport volumes by transport modes in Germany 1960 and 1999
1960 (in %) 1999 (in %) Road Freight 32 69 Train 37 14 Inland Navigation 29 13 Aircraft2 0 1 Long-distance pipe network 2 3
Source: UBA 2002
Altogether, whether air pollution, climate gases or land-take, the transport sector has become one of the key causes of environmental damage in Germany. In the case of nitrogen oxides and carbon monoxide, transport is responsible for more than half of all emissions. More than 20 % of Germany’s CO2 emissions are caused by transport. During the 1990s the CO2
2 In calculating the volume of air traffic, kilometres flown by air passengers departing from Germany’s airports up to the first destination airport of the respective flight are considered.

74 Environmentally Sustainable Transport in Germany
emissions of the transport sector increased by 11 %, whilst overall CO2 emissions in Germany dropped by 15 %.
3. EST Criteria
In addition to the EST criteria for CO2, NOx and VOC, which were agreed upon by all countries participating in the OECD EST project, in the German case study criteria were also considered, but further elaboration is needed to develop a reliable quantification (see Table 3). Table 3 EST Criteria for the German Case Study
Parameters Criterion Specification CO2 – 80 % NOx – 90 % VOC – 90 %
emission reduction in the transport sector in 2030 compared to 1990
all areas
PM – 99 % urban areas Noise <= 65 dB(A) all areas <= 55 dB(A) daytime <= 45 dB(A) night
residential areas
Land-take stop fragmentation by infrastructure rural areas Emissions of particulate matter have proven carcinogenic in experiments with animals. Environmental officials of the German states (the Länder) have agreed that particulate concentration levels in rural areas should be used as the starting point for determining permissible concentration levels. This means an air quality level of 0.8 µg /m³ or a 99 % reduction of emissions in urban areas compared to the situation in 1990. About 16 % of the German population is exposed to noise levels higher than 65 dB(A) (UBA 1997). As these high noise levels contribute to serious heart diseases, 65 dB(A) must not be exceeded for EST. Outdoor noise levels above 50-55 dB(A) during the day negatively affect communication and well-being and outdoor noise levels above 40-45 dB(A) at night cause sleep disturbances. Thus, for residential areas noise levels of 55 dB(A) during the day and 45 dB(A) at night were selected as EST criteria. In Germany land-take for transport purposes is continually growing. In urban areas land-take for road transport affects both the quality of the urban environment and the accessibility for non-motorised persons. In rural areas road and rail infrastructure reduces the integrity of ecosystems and the quality of recreational areas. There are not many large natural areas left, which are not yet fragmented by transport infrastructure, the number of these areas having declined substantially over the last two decades (BfN 1999). As an EST criterion for rural areas, it is suggested that fragmentation should be stopped.
4. BAU Scenario: Business as usual
For all case studies of the OECD project 1990 was determined as the base year. The German reunion took place in 1991, and due to the lack of data in the German Democratic Republic

Hedwig Verron and Axel Friedrich 75
(GDR) not all statistical data necessary for describing the base year were available for 1990. Therefore in this case study data from 1991 have been used as best estimates for the 1990 base year. For both the BAU scenario and the EST scenarios it was assumed that transport trends in other countries would follow scenario conditions similar to Germany. Population was assumed to stagnate in the long run and economic growth to be moderate. Possible effects of the scenarios on economic growth were not considered. The idea of the BAU scenario was to demonstrate what might happen if present trends continue for the whole period of 1990 – 2030. The BAU scenario was based on the following assumptions:
Transport infrastructure will grow as outlined in the Federal Transport Infrastructure Plan (BMV 1992).
Fuel prices will rise only moderately. The automobile fleet will increase considerably, to 68 million passenger cars in 2030,
which means a rate of 820 vehicles per 1,000 inhabitants. Average annual vehicle kilometres travelled per car will decrease, as will car occupancy. Specific emissions from road vehicles will be reduced significantly, and specific energy
consumption will decrease for all modes of transport. Noise emissions will fall only moderately.
The share of diesel cars in the fleet was assumed to increase from about 15 % in 1995 to 30 %, the share of electric vehicles to 10 %.
4.1 Changes in transport activity in the BAU scenario
Vehicle kilometres travelled (VKT) by cars were calculated with the number of cars and the average annual vehicle kilometres travelled per car assumed for BAU. As a result of this calculation VKT by cars will increase by almost two thirds. Due to the assumed decline in car occupancy, transport activity (given as person * km travelled) will increase by only 46% (see Fig. 1). Corresponding to long lasting trends, walking and cycling are assumed to slightly decrease, while a moderate increase was assumed for public transport. Changes in aviation were estimated based on a forecast for the year 2020 (Brosthaus et al. 2001). The resulting growth by more than 400 % is by far the highest of all transport modes3. Extrapolating the forecasts of the Federal Transport Infrastructure Plan (BMV 1992), road freight transport was assumed to grow by almost 150 %, freight transport on inland waterways by 51% and by sea by 77%3. Departing from the forecast in the Federal Infrastructure Plan but rather following the trend of the past decades rail freight was assumed to remain constant (see Fig. 2). Total transport activity was expected to grow significantly: passenger kilometres will double, and tonne kilometres will increase by 80 %.
3 In calculating the volume of air traffic as well as ocean shipping, kilometres travelled from Germany’s airports and ports up to the first destination airport or port were considered. Air cargo is included in the figures for personal travel (1 tonne km = 10 passenger km).

76 Environmentally Sustainable Transport in Germany
Figure 1. Passenger Transport Activity (1990 - BAU)
Figure 2. Freight Transport Activity (1990 - BAU)
Hedwig Verron and Axel Friedrich 77
4.2 Assumed Changes in Exhaust Technology
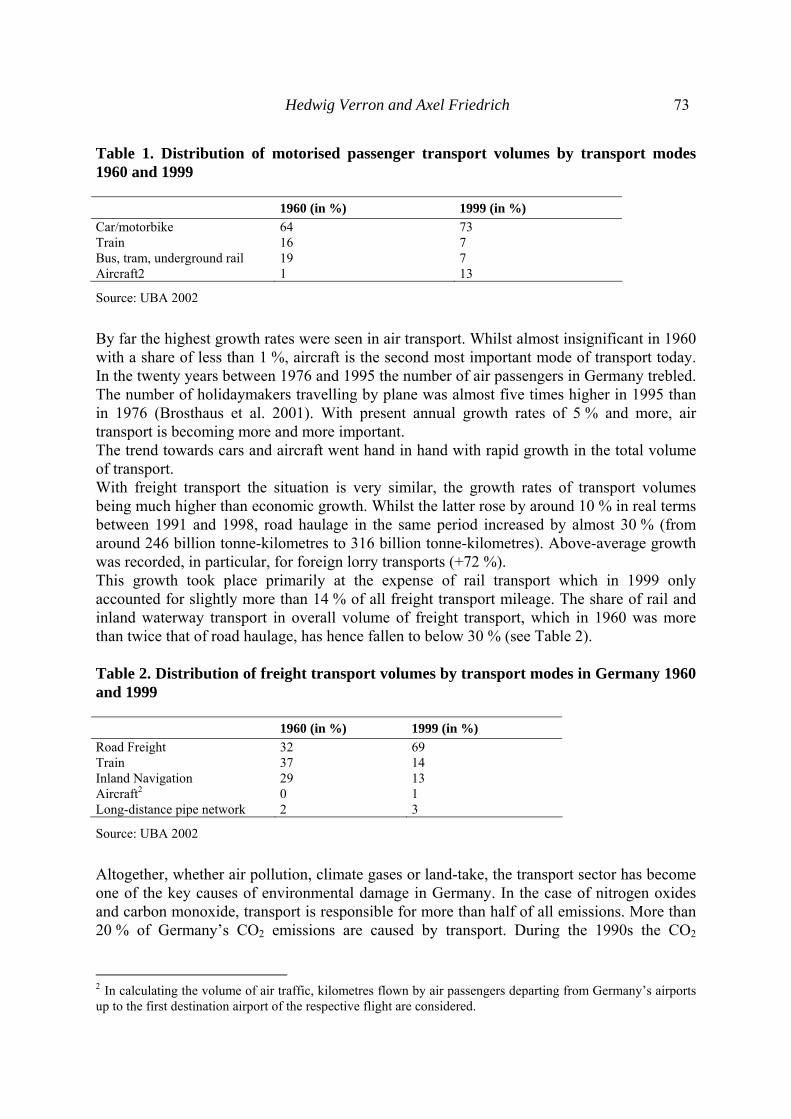
Between 1990 and 2030 the fuel efficiency of the passenger car fleet was assumed to improve by 30 to 35 % (see Table 4 below), resulting in an average emission factor of 120 g CO2 per kilometre. This value corresponds to a proposal for new cars the EU Environmental Council made in 1995 which, however, has not been further pursued. Table 4. BAU Road Vehicles Emission Reduction Compared to EURO 2 Levels (calculated on the basis of g/km values) CO2 VOC NOx PM Car / LDV (Otto) 35 % 66 % 64 / 60 % - Car / LDV (Diesel) 30 % 50 % 68 % 80 % Motorcycle 30 % 90 % 90 % - HDV (Diesel) 20 % 60 % 60 % 80 % For VOC, NOx and PM from road vehicles the assumed reductions as given in Table 4 follow the proposals the European Commission has made for EURO 4. Aircraft energy efficiency (Pkm per kilogram fuel) was assumed to rise by 45 % (IPCC 1999). NOx emissions of the fleet were expected to increase by 25 %. For railway traffic and ships we assumed a moderate increase in energy efficiency (10 to 25 %). It was expected that one third of scheduled buses will run on natural gas.
4.3 Emissions in the BAU Scenario
In order to calculate the emissions in the BAU scenario emission factors were used (Keller et al. 1999) taking into account the technical assumptions reported above, and supposing that this technology has penetrated the whole market by 2030. As a result of the technical trends, emissions of all exhaust gas components, with the exception of CO2, will decrease, despite a significant increase in motorised traffic (see Fig. 3 below). NOx will drop by about 50 %, air traffic being the main emitter, followed by road freight transport and cars. VOC emissions will decrease by 94 %, thus already meeting the EST criterion in BAU. CO2 emissions will go up almost 30 % although quite ambitious specific emission reductions have been assumed. Air traffic in 2030 will contribute 18 % to the CO2 emissions caused by transport, compared to 8 % in 1990.

78 Environmentally Sustainable Transport in Germany
Figure 3. Emissions in 1990 and 2030 (BAU) compared to the EST Criteria
4.4 Noise in the BAU Scenario
Noise emissions from road traffic will decline through further improvements to engines and exhaust systems. Moreover, there will be some progress in introducing low noise road surfaces and low noise tyres. But this will not result in a substantial reduction of road traffic noise: in urban areas we expected a decrease in noise levels by about 2 dB(A). Two opposite trends will influence rail traffic noise. On the one hand, the maintenance of track systems will be improved and wheel absorbers used in long distance passenger transport reducing noise emissions. On the other hand, noise emissions will increase due to higher speeds. As an average, no change was assumed concerning the proportion of the population exposed to high noise levels from rail traffic.
4.5 Land-take in the BAU Scenario
Under BAU conditions there will be a substantially higher demand for parking facilities, urban and extra-urban roads and airports. In order to accommodate the growing demand the construction of new highways was assumed to be inevitable, resulting in failure to meet the EST criterion concerning land-take for transport purposes.

Hedwig Verron and Axel Friedrich 79
5. EST1 Scenario: Hybrid electric hypercars and hydrogen EST1 used the same figures as BAU for vehicle km travelled and transport activity. The EST criteria were to be met solely by accelerated technological progress. Our EST1 scenario was based on three main technical features:
hybrid electric hypercars, hydrogen produced from renewable primary energy, electricity based almost entirely on renewable primary energy.
In the EST1 scenario we supposed that there is no limit to produce hydrogen from renewable sources. For passenger cars we introduced a hypercar concept (Lovins 1994). The hypercar uses a hybrid electric drive, the wheels being directly propelled by an electric motor, while electricity is generated on board by a small and efficient gasoline combustion engine. Ultralight family cars with hybrid electric drives may achieve a fuel efficiency of 1.6 l per 100 km or lower. In EST1 a fuel consumption of 1.5 l per 100 km was assumed. Full optimisation of catalyst technology will make it possible to reduce VOC and NOx emissions by 95-98 % compared to EURO 2 levels. This is comparable to an equivalent zero emission vehicle (EZEV) standard. To meet the EST criterion for PM diesel engines will no longer be used in passenger cars. For goods vehicles, diesel engines in rail traffic, and tourist coaches it was assumed that fuel cells with liquefied or compressed hydrogen, produced via electrolysis from renewable primary energy, will be used. This means that these vehicles will have zero emissions. For public transport trolley buses, light rail and electric rail will be used, which run on electricity produced from renewable sources. Jet planes were assumed to use liquefied hydrogen. NOx emissions will be reduced by 65 %. Though CO2 emissions from jet planes will be reduced to zero, emissions of H2O vapour will be higher, possibly causing additional greenhouse effects which may reduce the effects of the use of renewable energy to a 35 % decline in air traffic's contribution to radiative forcing. As the EST criterion only refers to CO2 we did not account for those effects here. Noise from road vehicle engines will be reduced to a minimum level and will thus no longer contribute substantially to overall noise emission from road traffic. Noise from tyres will be reduced by low noise road surfaces, new materials and better design of the tyres, wheel absorbers inside the tyres and noise abatement skirts in front of the wheels. These measures will reduce noise in urban areas by 9 dB(A) (UBA 1997a). Technical measures with substantial potential for reducing noise from railway traffic are available, as for example substituting disk brakes for tread brakes, wheel absorbers, noise abatement skirts, and noise abatement barriers. Noise reductions of up to 20 dB(A) can be achieved through a combination of these measures (UBA 1997a). Land-take by traffic infrastructure will be diminished by the use of advanced telematics and multi-storey roads or tunnels. Nevertheless this will not suffice to avoid building new roads in order to cope with traffic growth.
80 Environmentally Sustainable Transport in Germany
6. EST2 Scenario: Reducing Traffic Generation and Modal Shift The philosophy of the EST2 scenario was to meet the EST criteria entirely by changes in transport activity, technological development being the same as in BAU. This means shorter distances travelled, fewer motorised trips and increased use of rail, public transport, walking and cycling. The main assumptions are
90 % reduction in VKT by cars compared to 1990, 90 % reduction in fuel consumption by aircraft resulting from improved technology (rise
of energy efficiency by 45% as defined in BAU) and a reduction of VKT by 86%, substantial increase in car occupancy, 74 % decline of road freight Vkt combined with a 20 % increase in capacity utilisation, speed limit of 30 kilometres per hour in urban areas to meet the noise criteria, prohibition of night-time road freight traffic and aviation.
7. EST3 Scenario: Mobility Behaviour Change and Highly Efficient Combustion Engines The EST3 scenario combined advanced technology and demand management. In contrast to EST1 it was assumed in EST3 that hydrogen produced by renewable sources will not be available without limits. Hydrogen for fuel cell vehicles has to be produced in a relatively energy-intensive process from fossil or non-fossil primary fuels. Even if electric power for hydrogen electrolysis is generated entirely from renewable sources, the amount of energy required to produce and process the hydrogen is at least twice the energy needed to produce petrol from crude oil. The high losses incurred in synthesizing and processing hydrogen for transport puposes mean that this does not represent an environmentally viable option. At the same time, hydrogen could be used directly in power generation plants, and, replacing fossil fuels, would save two or three times the amount of CO2 compared to its use for substituting fossil fuels for transport (Eyre et al. 2002). For this reason the use of hydrogen and fuel cells for transport purposes did not play a role in our EST3 scenario. In our view highly energy efficient conventional propulsion systems and engines will be the best technology realistically available for EST3. Energy efficiency will be maximized by weight reduction, improvement of aerodynamic drag, reduction of rolling resistance, reduction of maximum power output and improved combustion processes. Exhaust emission reduction will be achieved by highly efficient catalyst technologies and engine management for Otto engines (EZEV), NOx reduction for diesel engines by selective catalytic reduction (SCR) technology. As in EST1, diesel engines will no longer be used for passenger cars and LDV (see Table 5 for details). Compared to the other case studies our view concerning the technological potential for EST was rather pessimistic. Therefore the contribution of behavioural change was higher in the German case study than in the other case studies.

Hedwig Verron and Axel Friedrich 81
Table 5. Assumptions for EST1 and EST3: Energy Efficiency and Exhaust Technology
Reductions and improvements in 2030 compared to 1990 EST1 EST3 Electric energy 91 % renewable 50 % renewable Passenger Cars
hybrid-electric hypercar, 1.5 l / 100 km, EZEV emission standard, no diesel cars
enhanced internal combustion engines, 2.5 l / 100 km, EZEV emission standard, no diesel cars
Motorcycles
< 1 l / 100 km three-way catalyst
three-way catalyst
Goods Vehicles, Tourist Coaches
fuel cell technology zero emission
diesel engines 40% reduction of fuel consumption 95% reduction of PM 90% reduction of NOx
Train (Diesel)
fuel cell technology zero emission
40% reduction of fuel consumption 95% reduction of PM 90% reduction of NOx
Ships and Vessels
40% reduction of fuel consumption 95% reduction of PM 90% reduction of NOx
40% reduction of fuel consumption 95% reduction of PM 90% reduction of NOx
Light Rail Train (Electric)
Using electricity from renewable sources zero emission
40% efficiency improvement
Local Bus
trolley buses zero emission
trolley buses, gas buses
Jet Planes
use of liquefied hydrogen with a 65% reduction of NOx
55% reduction of fuel consumption
Concerning noise, the same assumptions were made in EST3 as in EST1.
8. Results of the EST Scenarios
8.1 Transport activity
While total passenger transport activity in EST1 was the same as in BAU, it had to be reduced in EST2 by almost 40 % compared to 1990. This was due to the philosophy of the EST2 scenario, which did not include the use of advanced technology even for rail and waterway transport. Therefore, in order to meet the EST criteria, much of the transport demand in EST2 will have to be reduced instead of shifting it. Passenger kilometres travelled by car in EST2 will drop by 80 % of the base year level. Tonne kilometres in total have to be

82 Environmentally Sustainable Transport in Germany
reduced by about 25 %. While road freight drops by nearly 75 %, inland navigation will almost double and rail freight will increase by approximately 150 % (see Fig. 4 und 5 below). The results of EST3 were similar, but restrictions on car traffic and road freight were less strict. The main difference compared to EST2 however was a much higher shift to public transport, rail, and waterways due to the introduction of advanced technology. Thus, in terms of transport activity, total passenger transport will decrease only slightly as compared to 1990 and freight transport will even increase by almost 20 %. Transport by car will be less than half the volume in 1990, while public transport will grow by 350 %. Transport activity by aircraft was assumed to drop to roughly 40 % of the 1990 figure.
Figure 4. Transport Activity – Passenger Transport
Figure 5. Transport Activity - Freight
Long distance freight transport was assumed to shift mainly to railway and inland waterways. As a consequence, road freight will fall to 30 % of the base year’s volume.
Hedwig Verron and Axel Friedrich 83
8.2 Emissions
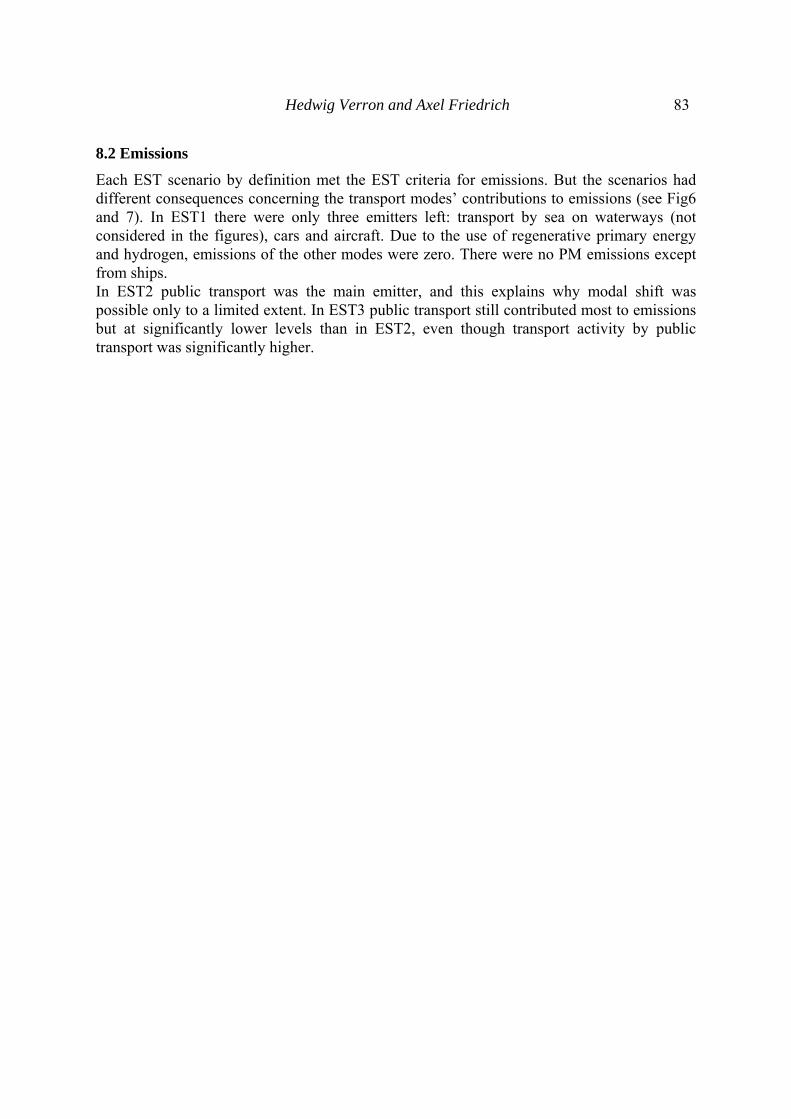
Each EST scenario by definition met the EST criteria for emissions. But the scenarios had different consequences concerning the transport modes’ contributions to emissions (see Fig6 and 7). In EST1 there were only three emitters left: transport by sea on waterways (not considered in the figures), cars and aircraft. Due to the use of regenerative primary energy and hydrogen, emissions of the other modes were zero. There were no PM emissions except from ships. In EST2 public transport was the main emitter, and this explains why modal shift was possible only to a limited extent. In EST3 public transport still contributed most to emissions but at significantly lower levels than in EST2, even though transport activity by public transport was significantly higher.

84 Environmentally Sustainable Transport in Germany
Figure 6. Emissions in EST1, EST2, and EST3 by Mode of Transport
Hedwig Verron and Axel Friedrich 85
Figure 7. Contributions of Transport Modes to Total Emissions in EST1, EST2, EST3
8.3 Noise
For every scenario the noise exposition of the population was calculated using the Federal Environmental Agency’s noise pollution model. The model estimates the noise pollution in the states of the former Federal Republic of Germany, considering the location and construction form of dwellings as well as different sound sources. The estimation was extrapolated for the whole of Germany (UBA 1997a). For road and rail traffic the results were totally diverse (see Table 7 below). In the EST1 scenario the noise levels from rail traffic will be below 65 dB(A), while noise levels from road traffic will clearly fall short of the EST criterion. In EST2 noise from road traffic will be reduced to levels far below 65 dB(A) and might reach the EST criterion, whilest for rail traffic noise, the proportion of the population exposed to levels above 65 dB(A) will increase from 3 % to about 4.5 % because of increasing rail transport activity and the lack of advanced noise reduction technology. The EST3 scenario was the only scenario which ensured noise levels below 65 dB(A) for road and rail traffic. Additional measures for road traffic in residential areas, like for example speed reduction, will be necessary to bring noise levels close to meeting the EST criterion.

86 Environmentally Sustainable Transport in Germany
Table 7. Noise results
1990 BAU EST1 EST2 EST3 Road traffic noise
16% exposed to levels >65 B(A)
16% exposed to levels >65 B(A)
4% exposed to levels >65 B(A)
no levels >65 dB(A)
no levels >65 dB(A)
Rail traffic noise
3% of population exposed to levels >65 B(A)
3% of population exposed to levels >65 B(A)
no levels >55 dB(A)
4.5% exposed to levels >65 B(A)
no levels >65 dB(A)
8.4 Land-take
In the EST1 scenario there were no feasible measures available to reduce land-take. The tremendous traffic growth will not be manageable without an increase in land-take for transport purposes. The traffic conditions of EST2 and similarly of EST3, however, supported the targets of no further fragmentation of the countryside and liveable cities. New rail infrastructure will be needed to cope with growth in rail traffic. This can be achieved by using or expanding existing corridors, and there is no need for further fragmentation of rural areas. As road traffic will decline considerably, no new road infrastructure will be needed, instead land-take for road infrastructure might even be reduced.
9. Instruments to achieve EST As in all case studies of the OECD EST project the EST3 scenario was selected as the basis for the definition of instruments. Three key features were found the most important in order to achieve EST:
Continuing regulating emissions, including CO2, and extending it to include all types of vehicles.
Increasing the variable costs of car traffic through a fuel tax. Road pricing for heavy duty vehicles.
The key features were complemented by additional sets of instruments, designed to prevent urban sprawl, diminish freight traffic growth, increase the quality of life in urban areas, and improve the infrastructure and services of alternative modes. As electricity played a major role in the EST3 scenario, energy supply by regenerative sources had to be considered too. The instruments were selected with a view to achieving the CO2 target, and assuming the targets for NOx, VOC and PM can partly be attained at the same time. No such assumption could be made for noise, so instruments aiming at noise reduction were dealt with separately. Aviation was also discussed in a section of its own, because the instruments considered are aimed solely at air traffic. Assessments of effects were based on empirical results or expert judgement. The instruments chosen have been under discussion for a number of years already. Their effects are more or less well-known.

Hedwig Verron and Axel Friedrich 87
9.1 Emission regulation: CO2 Standards for Passenger Cars
In the EST3 scenario average fuel consumption of the passenger car fleet was assumed to be 2.5 l/100km, corresponding to 58 g CO2 / km. This will only be achievable if binding CO2 standards for passenger cars will be implemented. Below, standards for passenger cars were taken as an example in order to demonstrate the basic strategy (see Fig. 8). CO2 standards for duty vehicles, trains and ships should be developed in similar ways. Additionally it will be necessary to tighten the standards for NOx and PM for duty vehicles and buses and to introduce standards for trains, ships and vessels. The CO2 standards will be introduced step by step, in line with the approach used for exhaust pollutants. In the first steps these standards may be designed according to vehicle mass in order to allow manufacturers to produce a variety of vehicle sizes while maintaining the average fleet within the standards. Alternatively the CO2-standards can be formulated according to horsepower or passenger vehicle classes (sub-compact car, compact car, vans ...). In any case it has to be assured that the average across all new vehicles complies with the standards. With each step of tightening, further restrictions will be imposed on the freedom to produce heavier vehicles with higher consumption. At the end only vehicles which do not fail to meet the standard, irrespective of their weight, will be allowed registration. With introduction and gradual tightening of the CO2 standard at 5 year intervals, the target emission of 58 g CO2 / km, which corresponds to a fuel consumption of 2.05 l/km, can be achieved within 25 years.
Figure 8. CO2 Standards for passenger cars
The CO2 limitation should be accompanied by consumption based vehicle taxes, to accelerate the renewal of the vehicle fleet.
9.2 Fuel Tax
The effects that will be achieved by increasing the fuel tax, are manifold:

88 Environmentally Sustainable Transport in Germany
The demand for low consumption vehicles will increase, accelerating the replacement of high consumption vehicles launched by emission regulation.
The options of public transport, cycling and walking will become more attractive, provided these options will be improved simultaneously.
People will tend to avoid long driving distances, which will reduce transport activity. For example, driving to distant shopping centres will no longer pay.
Urban sprawl will be reduced.
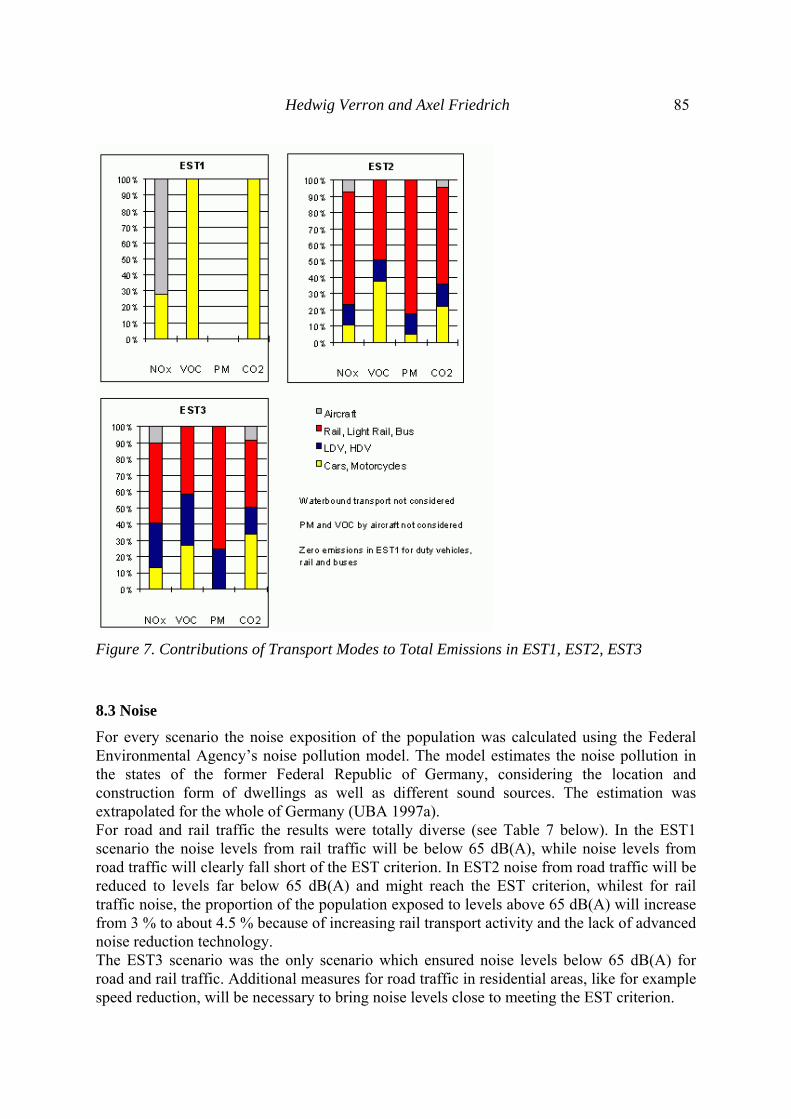
The concept of fuel tax increase had to take into account that the fuel consumption of cars in EST3 will be only about one quarter of today’s fuel consumption. The variable costs of driving would drop almost correspondingly if fuel prices remain constant. This means that the fuel tax could be raised considerably whilst the variable costs of driving remain constant or even decline. In order to reduce car traffic, the fuel tax increase has to be higher than the decrease in fuel consumption. In designing a fuel tax strategy two components were considered seperately: One component will compensate for consumption reduction, keeping fuel costs per kilometre constant. The second component will increase the costs of transport (see Fig. 9). It was proposed that fuel costs per kilometre should double by 2030 (see Fig. 10).
Figure 9: Two Component Fuel Tax
Hedwig Verron and Axel Friedrich 89
Figure 10: Fuel price increase and increase of fuel costs per kilometre
It was estimated that this instrument will reduce car traffic by 50 % (based on a long term elasticity coefficient of ε = -0.45, see Storchmann 1993).
9.3 Road Pricing for HDV
Heavy duty vehicles are paying only partly for their infrastructure and environmental costs. Together with the poor performance of railways in Europe this is a key factor for road freight’s increasing share in the whole freight transport market. In order to cover their costs a road charge for heavy duty vehicles was proposed. Correspondingly HDV could be exempted from fuel tax. A road pricing system for HDV should reflect the mileage of each individual vehicle and its environmental performance. Electronic devices will be able to count the mileage and the fuel consumption, and vehicles will be clustered according to their emission standards and their noise category. The charge may be higher for sensitive areas and lower for less sensitive areas. For the year 2030 a charge of 1.25 €/km was proposed for high consumption and high emission vehicles. For low consumption and low emission vehicles the charge should be correspondingly lower. The charging should start with 0.25 €/km, not reflecting fuel consumption or emission at this stage. Then step by step the charge should be increased until the target level of 1,25 €/km is reached. Starting with the second stage the charge should consider fuel consumption and emission class. Reacting to the charge, truck operators will purchase less polluting, less noisy and more fuel-efficient trucks earlier than they would do otherwise. This will stimulate the vehicle
90 Environmentally Sustainable Transport in Germany
manufacturers to develop and supply advanced vehicle technology as soon as possible (with positive effects on employment and in particular on research and development). Companies will try to avoid road shipping and/or improve vehicle utilisation as much as possible. This will result in higher shares for freight railways, provided a more efficient and liable rail system has been realised in the meantime. It was estimated that this measure will lead to a 50% reduction of the road freight tonne-kilometres of the BAU scenario, if the measure is accompanied by measures to improve the rail freight system (DIW 1994). The share of rail freight will increase, smaller parts of road freight will be shifted to inland waterways and road freight in general will be reduced because of less transport intensive production and retail relations.
9.4 Complementary Instruments
Low Traffic Land Use Patterns A substantial increase of the variable costs of car transport has been identified as being a powerful measure to prevent urban sprawl. Additionally several measures which directly influence land use and land use planning have to be taken into account. Settlement and transportation planning must be integrated more efficiently. Instruments and structures of regional co-operation have to be improved in order to reduce harmful competition among adjacent communities and to thus prevent urban sprawl and location of new distinct industrial or commercial areas, on the one hand, and protect nature and landscape conservation areas, on the other. Charges on land-take will minimise land consumption for buildings, leading to higher density. Taxation of parking space will help to reduce designated parking space and hence land consumption for parking. In addition, taxation of parking opportunities will reduce the advantages of commercial areas outside of settlements. Urban development should focus on in-town sites in order to minimize suburbanisation (Apel et al 1997), and residential quality in towns should be improved by public redevelopment programmes, which should be given more funds during the next decade at least. The estimated effect of these measures was a 10-15 % reduction in transport activity (Enquete-Kommission 1994).
Regional Economic Structures The exchange of goods will be organised in a less transport intensive way, if the costs of transport increase considerably. Additionally, the proximity of production and sale may be improved for some branches, especially agriculture, through support by Federal and regional authorities. Subsidies and programmes at European and national or state level to reduce inter-regional disparities in economic development are to be reviewed with respect of traffic inducing side effects. Subsidies should be generally tied to low traffic ways of organising transport. This might lead to a reduction of road freight of about 5 % (Kindermann 1997, Scherer et al. 1997).

Hedwig Verron and Axel Friedrich 91
Local and Regional Tourist and Recreational Areas In order to make people aware of the attractions of their own country, regional tourism marketing should be promoted by Federal Government, States’ governments, local governments and tourist associations. To avoid an increase in car traffic in tourist regions, tourism marketing has to be combined with the activities of local service agencies for sustainable mobility. Virgin nature areas are most attractive for tourism. Therefore, nature conservation areas have to be protected and developed by Federal Government and States’ governments. Low traffic recreational areas near towns or cities have to be preserved by local land use planning. These measures should be seen as compensation for restrictions on transport and increasing transport prices. They will help to increase acceptance of sustainable mobility and prevent or diminish dissatisfaction. Road and Rail Infrastructure Infrastructure planning for sustainable transport has to be strictly oriented on policy objectives, environmental as well as economic, social, and financial objectives (Gühneman et al. 1999). The overall effects of the new transport network, concerning all transport modes, have to be assessed, including induced traffic. Orienting transport infrastructure planning on the EST targets will support the massive modal shifts that are demonstrated in the EST3 scenario. New and more efficient railways, and public transport infrastructure will be provided, whilst construction of new highways will cease, with the exception of short bottleneck links; many highways may even be removed. The capacity of rail may be doubled by a number of rather simple measures (such as use of modern information technologies, train coupling and sharing systems or double-decker wagons,) (HaCon 1996, Deutscher Bundestag 1998). There will be growing demand for new or reconstructed rail lines on regional level, companies will, as a rule, have their own sidings.
Railway Service There is an urgent need to improve service and logistics for freight transport. This is up to railway companies in the first place, which should organise door to door freight transport as haulage contractors have done from the beginning. Research and development is required on ways to improve and accelerate road-rail transfer and the collection and distribution of goods. Federal safety regulations for railway construction and operation should be reformed in order to allow for more flexible technical solutions. The success of the deregulation of the German railway system, which started in 1994 in order to stimulate competition in railway services, has to be monitored while ensuring access to the tracks. The European Commission should take the initiative to harmonise the regulations concerning railway operation in European countries, and provide a forum for national railway companies and industry to promote harmonisation of railway technology.
Public Transport The improvement of public transport services will compensate restrictions on car traffic and help maintain total transport activity at the 1990 level. This is important to start with early in the process in order to increase public acceptance. An agreement between all actors (federal government, state governments, local governments, transport companies) will guarantee co-ordinated action. Measures which local governments can implement right away are to give

92 Environmentally Sustainable Transport in Germany
priority to public transport at traffic lights and establish bus lanes. Federal and State subsidies for transport companies may be tied to fulfilment of service quality standards. The main aspects are:
Expansion of public transport networks and shortening service intervals in order to guarantee access for everybody.
Priority lanes and priority at traffic lights for buses and light rail will accelerate public transport, restricting car traffic at the same time.
Information about connections, timetables and fares should be readily available, tariffs easy to understand, and purchasing tickets simple.
Bus stops and stations should become pleasant places. Transfers between buses, street cars and trains should be comfortable.
Public transport companies should change into service agencies for sustainable mobility.
The effects of these measures taken alone are rather small (UBA 1998a). They gain in importance when they are applied in combination with traffic restraint strategies and costs increases for car usage.
Traffic Calming Large-scale traffic calming (well known in Germany under the term „Flächenhafte Verkehrsberuhigung“, BMBau et al. 1992) is an integrated strategy to reduce traffic and speeds and the resulting noise pollution and traffic accidents. At the same time it improves the residential quality, thus complementing town redevelopment programmes. The measures comprise: reduced traffic speeds for motor vehicles, redistribution of public space in favour of pedestrians, cyclists, and public transport, reduction of parking space, motor traffic bans, preferential schemes for low-emission vehicles (bus, train), HOV and car-sharing, mixed land uses (”short-distance town“). These measures should be taken in all towns, extended to the whole town area and complemented by improvement of public transport services. The estimated result of these measure is a reduction of car traffic in towns by about 8 % (UBA 1998a).
Electricity Generation One third of total passenger kilometres and one quarter of freight kilometres travelled in the EST3 scenario will be driven by electricity. Thus, with strategies for environmentally sustainable transport, power generation based on renewable sources had to be taken into account. Non-fossil fuels can make a major contribution to climate protection and resource conservation only if energy is used efficiently. Otherwise the gains would be compensated by increasing energy consumption. The strategy to improve efficiency and increase the use of non-fossil energy included
deregulation of the energy market in order to stimulate competition, regulation of the minimum prices that have to be paid by supply companies for electricity
from non-fossil resources, energy tax on CO2 emissions from electricity generation.

Hedwig Verron and Axel Friedrich 93
Figure 11. Efficiency increase for Fossil Power Generation
The use of natural gas in conventional power plants already reduces specific CO2 emissions by 45% compared to coal. Efficiency increases by 70 % if new technologies are used (see Fig. 11). The overall result of the measures taken will be a new power generation structure with shares of renewable energy sources of up to 50 % (see Fig. 12). The efficiency gains and the use of renewable energy sources add up to CO2 reductions of more than 80%.
Figure 12. Development of the Shares of Energy Sources in Total Power Generation

94 Environmentally Sustainable Transport in Germany
10. Reduction of Noise Emissions As EST criterion, a reduction of noise reception levels from road and rail transport to a maximum of 55 dB(A)/45 dB(A) by day/by night had been defined for the German case study (outdoor rating level). In EST3 VKT of cars in towns will drop to 25 % and VKT of trucks to 40 % of the 1990 values. This results in a reduction of the equivalent sound levels between 4 and 6 dB(A) on average. The noise emissions of road vehicles can be reduced by an additional 3 dB(A) when urban speed limits are reduced to 30 km/h and driving styles become steadier through traffic calming. In order to meet the EST criteria additional measures had to be defined: Reception limits for existing routes have to be established and the limits for new traffic routes have to be tightened. The reduction to the target limits for new routes should be achieved as soon as possible, in order to avoid having to rehabilitate these routes later on. Careful route planning, secondary noise abatement measures, as for example protection walls, and the use of low noise road surfaces and railway tracks will make it possible to meet the targets. For existing routes reduction to the target values is only possible in the long term and in coordination with the realisation of other measures. The noise reception limits for existing routes should be lowered in linear steps. The first step, the introduction of limits, will require a longer period of preparation (e.g., in form of a national noise abatement programme with limits of 65/55 dB(A) from 2010 and linear reduction to 55/45 dB(A) by 2030). Noise emission limits for railway vehicles must be established. Reductions of 8 dB(A) for ICE to 20 dB(A) for freight waggons are attainable. The targets can be met for nearly the whole range of the railway lines. Locally additional measures might be necessary (e.g. secondary noise abatement measures). The noise emission limits for road vehicles have to be reduced step by step from 74 dB(A) and 80 dB(A) to 62 dB(A) and 72 dB(A) for cars and trucks respectively. Additionally noise emissions of tires and road surfaces must be reduced. For tyres reductions of 6 dB(A) can be attained, for urban road surfaces 3 dB(A) and for extra-urban road surfaces 5 dB(A). These measures will reduce urban noise levels by 9 dB(A), and together with speed limits and traffic calming will add up to an average reduction of urban noise levels by 12 dB(A). Taken together, the measures to reduce noise emissions and those to reduce VKT will diminish noise levels along urban roads by 17 dB(A) on average by 2030. For most of the roads the target values of 55 dB(A)/45 dB(A) by day/by night can be achieved. Single roads with current levels above 72 dB(A) by day have to be subjected to additional traffic restraints.
11. Meeting the EST Criteria in the Aviation Sector Aviation has the highest growth rates of all transport modes. Furthermore only little progress has been achieved to reduce the specific emissions by technical means. Since aviation may cause the biggest problems in meeting the EST criteria, major policy changes are necessary. Tight standards for new aircraft engines have to be implemented for NOx (-50 % within 10 years), CO2 and other pollutants. In a second step introduction of a new certification methodology was proposed, which certifies aircraft-engine-combinations on the basis of the seat-kilometres or tonne-kilometres offered and altitude. Only this methodology assures a

Hedwig Verron and Axel Friedrich 95
reduction of emissions per kilometre. The resulting emission reduction for new aircrafts in 2030 will be 70 % for NOx and 50 % for CO2 compared to current levels. Existing noise standards will be tightened as well. Retrofit programmes will allow older aircraft to continue to operate. Economic incentives, supported by retrofit programmes, will assure that at least 50% of the aircraft fleet operating in Germany will meet these requirements. These incentives, which will be introduced within the next 10 years, take the form of emissions based landing and en-route charges. They will increase landing charges and en-route charges for aircraft-engine-combinations with higher than average emissions in order to give incentives for the introduction of less polluting aircraft and foster demand for better technology including the necessary research and development programmes. Due to the high growth rates of aviation it will be necessary to reduce the demand for air travel. The proposed en-route charges should be designed such that that they suit this purpose as well. Additionally it was suggested to introduce the fuel tax and the value added tax (VAT) into the aviation sector, which both already have to be paid by other sectors. The fuel tax will be introduced gradually for all domestic and international flights following the scheme for road transport. This will only be possible if corresponding measures are taken in all industrialized countries. As a consequence ticket prices will go up considerably and growth of passenger kilometres will be limited. Airlines will also react by operating bigger, more efficient aircraft with higher load factors. Inefficiencies of the current air service management system should be eliminated. Less rigid routing, reduced horizontal, vertical and longitudinal distances, improved landing and take-off schemes, and improved air control systems can reduce the CO2 emissions of aviation by up to 10%.
Conclusions The objective of the EST project was to demonstrate that environmentally sustainable transport is possible, showing what forms it could take and which instruments would lead to it. From the case studies we learnt that reducing CO2 emissions from transportation by 80% by 2030 is very ambitious, whilst the reduction targets for the other exhaust emissions are more easily to be met. While other case studies prefer electric vehicles or fuel cells with hydrogen, in our view highly efficient conventional propulsion vehicles with optimised exhaust reduction systems will be the best available technique for EST. EST on the other hand cannot be achieved without major changes in transport behaviour. According to the German case study, in an environmentally sustainable transport system cars and lorries will lose their dominant role. Due to modal shift there is no need to cut down the volume of transport activity beyond the level of 1990. Packages of instruments were defined, of which emission limits for CO2, exhaust gases and noise, fuel tax and road tolls are the most important. The proposed fuel tax rise caused much discussion among the participants in the other case studies of the OECD project, most of whom preferred to rely on softer policies, such as education and information. In our view, rising transport prices is the only effective measure to reduce transport growth. Of course this will not be successful without supplementary measures, including soft policies as well as improving public and non-motorised transport options. Furthermore the German case study discussed power generation

96 Environmentally Sustainable Transport in Germany
and land use patterns because EST cannot be achieved by changes in the transport sector alone. For some problems no adequate solutions could be found. Urban freight transport is one of these. Only limited parts of urban freight can be shifted from road transport to other modes. Urban freight transport logistics did not prove to be a powerful tool in the past to reduce transport volumes, and we could see no indication of new developments in this sector which would improve the situation. Aviation too will remain a major problem. The measures identified in this case study can only be seen as first steps. New strategies must be developed in order to slow down the high growth rates in the aviation sector, not to speak of stopping growth entirely, which would be necessary in order to meet the criteria of EST. The EST project should not be merely an academic exercise but aimed at influencing transport politics. Already while it was in progress, the EST study played an important role in initiating discussion about environmentally sustainable transport in Germany, and influenced the contents of discussion. In 2002 the Federal Government published its national strategy for sustainable development. While no consensus could be found concerning quantified environmental goals for the transport sector, decoupling of transport and economic growth is explicitly defined as a national target in the strategy. By 2020, the intensity of goods transport is to be reduced by 5 % compared to 1999. This is a challenging target, given the fact that in the past the trend has gone in the opposite direction. Additionally, the strategy aims at doubling the volume of rail freight transport. Already in 1998, the German Federal Government introduced an eco-tax, which comprised a fuel tax rise by 15 cents in five steps beginning in the year 1999. This, together with price increases for crude oil, has triggered a trend of decreasing fuel demand and road vehicle kilometres travelled since 2000. In 2002 a national cycling plan was established in Germany for the first time in order to significantly boost the role of cycling. The plan aims to increase cycling’s share of trips from 13% to 27%, the current figure in the Netherlands. A motorway toll for heavy duty vehicles with a weight of 12 tonnes or more has been introduced lately. The toll amounts on average to 12.4 cents per kilometre driven and is differentiated according to vehicle emission category. These activities are very much in line with the proposals of the EST case study. Looking back we would conclude that the EST project has succeeded in influencing the political process, though with limited effects. The national strategy for sustainable development and its instruments as formulated now can only be a first step towards EST. Considering the lack of consensus concerning the environmental targets a long term perspective for the transport sector as a whole, it seems most important for further work to focus on communicating the goals of EST and a vision of living with EST. Further research is necessary to find ways to integrate EST into decision-making at all political levels.
References Apel, D., Lehmbrock, M., Pharoa, T., Thieman-Linden, J. (1997): Kompakt, mobil, urban: Stadtentwicklungskonzepte zur Verkehrsvermeidung im internationalen Vergleich. Difu-Beiträge zur Stadtforschung 24, Berlin
BfN (1999): Bundesamt für Naturschutz: Daten zur Natur. Landwirtschaftsverlag, Münster
Brosthaus, J., Schneider, J., Sonnborn, K.-S., Weyrauther, G., Hopf, R., Kuhfeld, H., Schmied, M., Köhn, A., Limprecht, B., Pastowski, A., Petersen, R., Schallaböck, K.O.,
Hedwig Verron and Axel Friedrich 97
Winter, G. (2001): Maßnahmen zur verursacherbezogenen Schadstoffreduzierung des zivilen Flugverkehrs. UBA-Texte 17/01. Federal Environmental Agency, Berlin
BMBau, Bundesministerium für Raumordnung, Bauwesen und Städtebau, Bundesministerium für Verkehr, Bundesministerium für Umwelt, Naturschutz und Reaktorsicherheit (1992): Forschungsvorhaben Flächenhafte Verkehrsberuhigung - Folgerungen für die Praxis. Bonn
BMV (1992): Bundesministerium für Verkehr: Bundesverkehrswegeplan 1992. Bonn
Deutscher Bundestag (1998): Entwicklung und Analyse von Optionen zur Entlastung des Verkehrsnetzes und zur Verlagerung von Straßenverkehr auf umweltverträglichere Verkehrsträger. Drucksache 13/11447, 28.09.1998
DIW (1994): Deutsches Institut für Wirtschaftsforschung. Verminderung der Luft- und Lärmbelastung im Güterfernverkehr 2010. UBA-Berichte 5/94. Erich-Schmidt-Verlag, Berlin
Enquete-Kommission "Schutz der Erdatmosphäre“ des Deutschen Bundestags (1994): Mobilität und Klima. Wege zu einer klimaverträglichen Verkehrspolitik. Economica Verlag, Bonn
Eyre, N., Fergusson, M., Mills, R. (2002): Fuelling Road Transport, Implications for Energy Policy. Energy Saving Trust, Institute for European Environmental Policy, National Society for Clean Air and Environmental Protection, November 2002. London, Brighton
HaCon Ingenieurgesellschaft und Universität Hannover (1996): Kapazitätsreserven der Schieneninfrastruktur im Güterfernverkehr. Deutsches Verkehrsforum e.V., Umweltbundesamt, Bonn/ Berlin
IPCC (1999): Intergovernmental Panel on Climate Change: Aviation and the Global Atmosphere. Cambridge University Press, Cambridge
Keller, M., Koch, P., Heldstab, J., Dähler-Staub, B., de Haan, P. (1999): HBEFA, Handbuch Emissionsfaktoren des Straßenverkehrs, Version 1.2, Januar 1999. Bern
Kindermann, A. (1997): Ökologische Chancen und Perspektiven von Regionalproduktion und Regionalvermarktung. Naturschutzbund Deutschland e.V., NABU, Bonn
Lovins, A. (1994): Supercars: Advanced Ultralight Hybrid Vehicles. Prepared for the Encyclopedia of Energy Technology and the Environment. Snowmass CO: Rocky Mountain Institute
OECD (1996): Environmental Criteria for Sustainable Transport. Report on Phase 1 of the Project on Environmentally Sustainable Transport (EST), Document OECD/GD(96)136, Paris
OECD (1999): Environmentally Sustainable Transport: Report on Phase II of the OECD EST Project, OECD, Paris
OECD (1999): Environmentally Sustainable Transport: Individual Project Case Studies for Phase II. Annex Volume to the Report on Phase II of the OECD EST Project on Environmentally Sustainable Transport, OECD, Paris
Gühnemann, A., Kuchenbecker, K., Rothengatter, W., Schade, W., Borken, J., Höpfner, U., Lambrecht, U., Kessel, P., Kienzler, H.-P., Selz, T., Hoppenstedt, A., Kraetschmer, D.,
98 Environmentally Sustainable Transport in Germany
Preising, A., Brannolte, U., Puschner, F. (1999): Entwicklung eines Verfahrens zur Aufstellung umweltorientierter Fernverkehrskonzepte als Beitrag zur Bundesverkehrswegeplanung. UBA-Berichte 4/99. Erich-Schmidt-Verlag, Berlin
Schade, B., Rothengatter, W., Schade, W. (2002): Strategien, Maßnahmen und ökonomische Bewertung einer dauerhaft umweltgerechten Verkehrsentwicklung. UBA-Berichte 5/02. Erich-Schmidt-Verlag, Berlin
Scherer, R., Hey, C., Rothenberger, D., Stock, C. (1997): Perspektiven der Regionalvermarktung für die verarbeitende endverbrauchernahe Industrie. EURES Institute for Regional Studies in Europe im Auftrag des Naturschutzbunds Deutschland e.V., NABU, Bonn
SRU (1994): Der Rat von Sachverständigen für Umweltfragen: Umweltgutachten 1994. Metzler-Poeschel, Stuttgart
Storchmann, K.-H. (1993): Abgaben auf den Pkw-Verkehr und ihre Wirkungen auf den Kraftstoffverbrauch im internationalen Vergleich. RWI-Mitteilungen Vol. 44, 345-374
UBA (1997): Umweltbundesamt: Daten zur Umwelt. Der Zustand der Umwelt in Deutschland. Ausgabe 1997. Erich-Schmidt-Verlag, Berlin
UBA (1997a): Maßnahmenplan Umwelt und Verkehr. Federal Environmental Agency, Environment and Transport Section, Berlin. Unpublished
UBA (1998): Federal Environmental Agency, Federal republic of Germany: Sustainable Development in Germany. Erich-Schmidt-Verlag, Berlin
UBA (1998a): Umweltbundesamt: Citair - Computergestütztes Instrument zur Prognose der Auswirkung verkehrlicher Maßnahmen zur Immissionsreduzierung, Version 1.0, Berlin
UBA (2001): Dauerhaft umweltgerechter Verkehr. Deutsche Fallstudie zum OECD Projekt Environmentally Sustainable Transport (EST). Federal Environmental Agency, Berlin
UBA (2002): Federal Environmental Agency: Sustainability in Germany. Erich-Schmidt-Verlag, Berlin