environmentally conscious petroleum engineering...
TRANSCRIPT
CHAPTER 1ENVIRONMENTALLY CONSCIOUSPETROLEUM ENGINEERING
M. Rafiqul AwalBob L. Herd Department of Petroleum EngineeringTexas Tech UniversityLubbock, Texas
1 INTRODUCTION 2
2 EXTENT OFENVIRONMENTALIMPACT OFPETROLEUM 12
2.1 Petroleum Pollution in Land andSea 12
2.2 Petroleum Pollution in theAtmosphere 14
3 ENVIRONMENTALIMPACT OF WASTES 15
4 PROVENANCE OFENVIRONMENTALDAMAGE 16
4.1 Drilling 174.2 Petroleum Production
Operations 204.3 Refinery and Petrochemical
Industries 25
5 ENVIRONMENTALCOMPLIANCE 26
6 ENVIRONMENTALREGULATIONS ON FLUIDAND SOLIDSDISCHARGE 29
7 MAJOR ACHIEVEMENTSIN ENVIRONMENTALLYCONSCIOUS PETROLEUMENGINEERING 30
7.1 Barriers in Drilling 317.2 Barriers in Production/Injection
(Cementing) 31
7.3 Cuttings Reinjection 337.4 CO2 Sequestration 337.5 Decommissioning Offshore
Platforms 36
8 TRENDS OFENVIRONMENTALIMPACT IN THE E&PINDUSTRY 39
8.1 Progress in EnvironmentalCompliance 39
8.2 Integration of EnvironmentalImpact Assessmentand EnvironmentalManagement 42
9 CALIFORNIA: ASHOWCASE FORENVIRONMENTLYCONSCIOUS PETROLEUMENGINEERING 42
9.1 California Department ofConservation 42
9.2 Long Beach, California,Production Operations 43
10 POTENTIAL SOURCES OFTHREATS TOENVIRONMENT 48
10.1 Environmental Threats ofAbandoned Wells and Fields 48
10.2 Monitoring Long-Term Storage ofCO2 in Geologic Structures 54
11 CLOSING REMARKS 57
REFERENCES 62
APPENDIX A 66
1
COPYRIG
HTED M
ATERIAL
2 Environmentally Conscious Petroleum Engineering
APPENDIX B 68
APPENDIX C 69
APPENDIX D § 3.13. RULE 13.CASING, CEMENTING,DRILLING, ANDCOMPLETIONREQUIREMENTS(AMENDED EFFECTIVEAUGUST 13, 1991) 71
APPENDIX E § 3.14. RULE 14.PLUGGING (AMENDEDEFFECTIVE MARCH 1,1992) 80
1 INTRODUCTION
Petroleum (from Greek petro —rock, and oleum —oil) has been known tomankind in two forms: oil and natural gas. Oil includes crude oil and variousrefined products from crude oil: gasoline, diesel, and heavier oils like heatingoil, furnace and bunker oil, and tar. Petroleum is second to coal in terms ofenergy reserves in earth’s subsurface structures and natural source of usefulenergy. But its use for energy began quite late: 1850s, after the first commercialoil well flowed from Colonel Drake’s well in Titusville, Pennsylvania (1859).Limited use for heat and light existed before that in various parts of the world,where natural seepage of crude oil created surface pools. Oil seeps were usedin ancient times and production of oil took place in a number of countrieslong before Drake’s well produced oil. Shortly after Drake’s well came intoproduction, several other wells went online in places such as in Canada andEurope. Some of them became oil centers in their own right.
The use of petroleum became widespread with the advent of kerosene, a liquidfuel that was initially made from coal (in 1846 by Canadian geologist AbrahamGesner) but could be made from petroleum (in 1848 by Scottish chemist JamesYoung). Kerosene steadily replaced oil from sperm whale (which almost becameextinct due to its odorless prized oil by 1950) as an affordable illuminant inNorth America and found a great demand in Europe and elsewhere on the globe(Pees 1989 and Pees and Stewart 1995).
However, the boom and industrial advance that began near Titusville onAugust 27, 1859 (Drake Day), gathered momentum so quickly and enlargedso greatly that a veritable industrial explosion took place (Owen 1975).
From early twentieth century onward, civilization has been marked by oil.Industrial production in general, and its agricultural model in particular, arelargely dependent on fossil fuels. Oil-based civilization has given birth to anurban model where the automobile becomes the determining factor in its design.
With the spread of usage of petroleum, environmental pollutions also ensued.An entirely new range of highly contaminating products derived from oil has beengenerated. These products are highly contaminating not only in their productionprocess but also in their disposal (Oil Watch).
1 Introduction 3
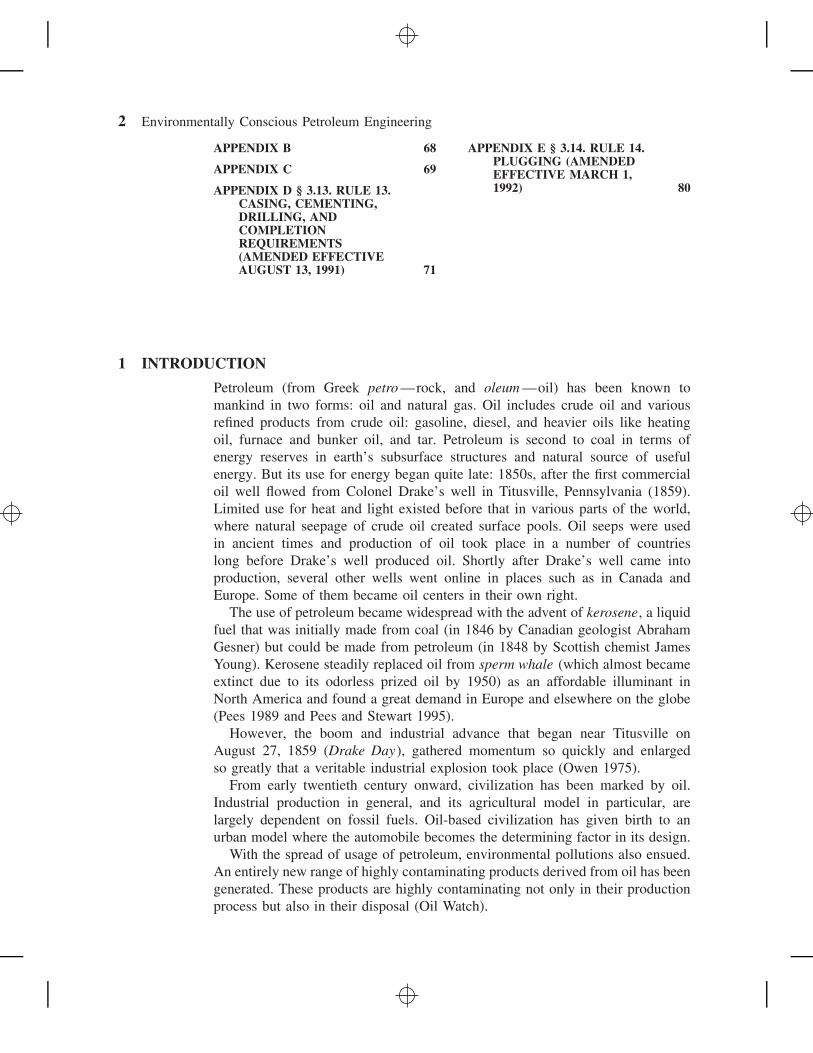
In spite of all of that, all the predictions point toward an increase in energydemand for the next decade, and oil will play a prevailing role. In the UnitedStates, for example, by 2025, even with expected dramatic gains in efficiency,total energy consumption is forecasted to increase by 36 percent, petroleum by39 percent, natural gas by 40 percent, coal by 34 percent, electricity by 49 per-cent, and renewable energy by 38 percent, according to the Energy InformationAdministration (2005). Figure 1 shows that in order to meet the demand forenergy, the role of petroleum is unchallengeable—a cold fact that only empha-sizes the need for ever-more consciousness in the extraction, transportation, anduse of petroleum.
It took many decades before petroleum engineering emerged as a formal engi-neering profession, having crystallized into a science in the late 1920s. In themeantime, oil became the lifeline of world’s naval powers, leading to fierceglobal competition to own and monopolize the new black gold . The greatestvictim was perhaps the environment , taking spills of all scales, before insti-tutionalized consciousness dawned in 1924 (Owens 1975). Before that, severaldecades saw rampant drilling and waste disposal at site, and as fierce competitionto capture the global oil market ensued between the Dutch conglomerate RoyalShell Oil Company (headed by Sir Henri Wilhelm August Deterding, b.1866,d.1939), and the American monopolist, the Standard Oil Company of New Jer-sey (headed by John D. Rockefeller, b. 1839, d.1937), oil spills, blowouts, andprolonged burning of oil wells and pits became a commonplace (Hanighen 1934).
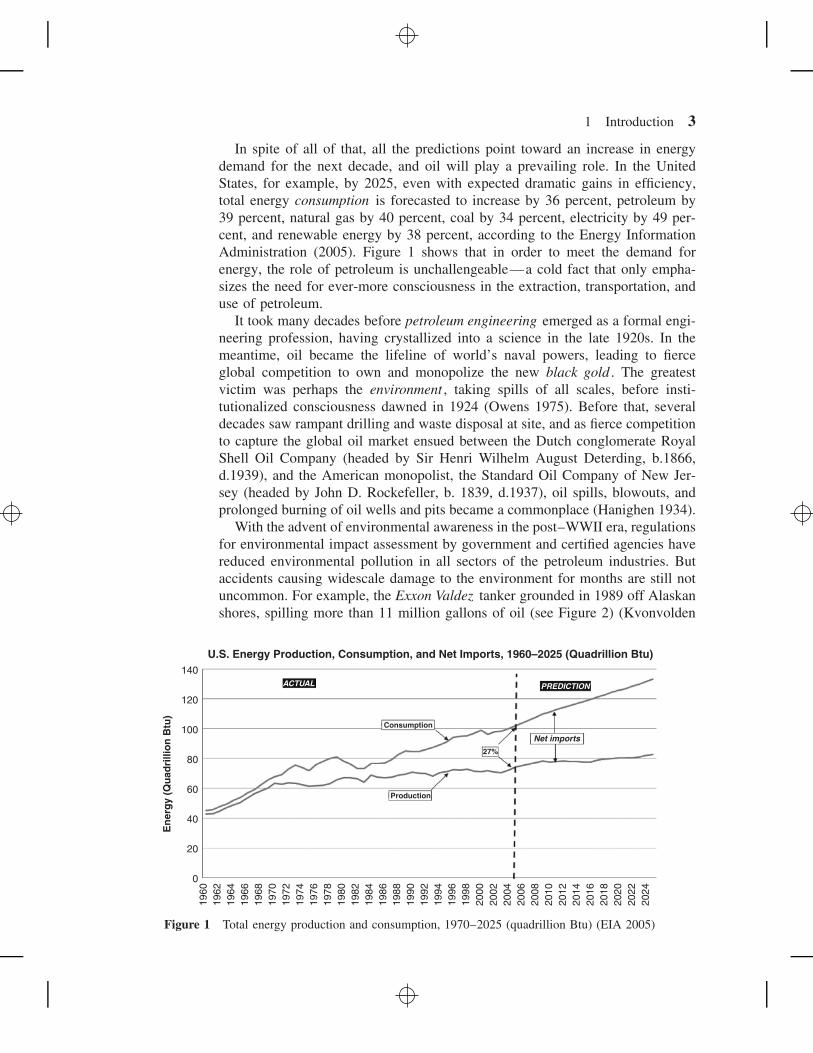
With the advent of environmental awareness in the post–WWII era, regulationsfor environmental impact assessment by government and certified agencies havereduced environmental pollution in all sectors of the petroleum industries. Butaccidents causing widescale damage to the environment for months are still notuncommon. For example, the Exxon Valdez tanker grounded in 1989 off Alaskanshores, spilling more than 11 million gallons of oil (see Figure 2) (Kvonvolden
140
Consumption
Production
27%
Net imports
PREDICTIONACTUAL
120
100
80
60
40
20
En
erg
y (Q
uad
rilli
on
Btu
)
0
1960
1962
1964
1966
1968
1970
1972
1974
1976
1978
1980
1982
1984
1986
1988
U.S. Energy Production, Consumption, and Net Imports, 1960–2025 (Quadrillion Btu)
1990
1992
1994
1996
1998
2000
2002
2004
2006
2008
2010
2012
2014
2016
2018
2020
2022
2024
Figure 1 Total energy production and consumption, 1970–2025 (quadrillion Btu) (EIA 2005)
4 Environmentally Conscious Petroleum Engineering
Figure 2 Massive oil spill from Exxon Valdez oil tanker (1989) in Alaska’s North Slope(Kvonvolden 2004)
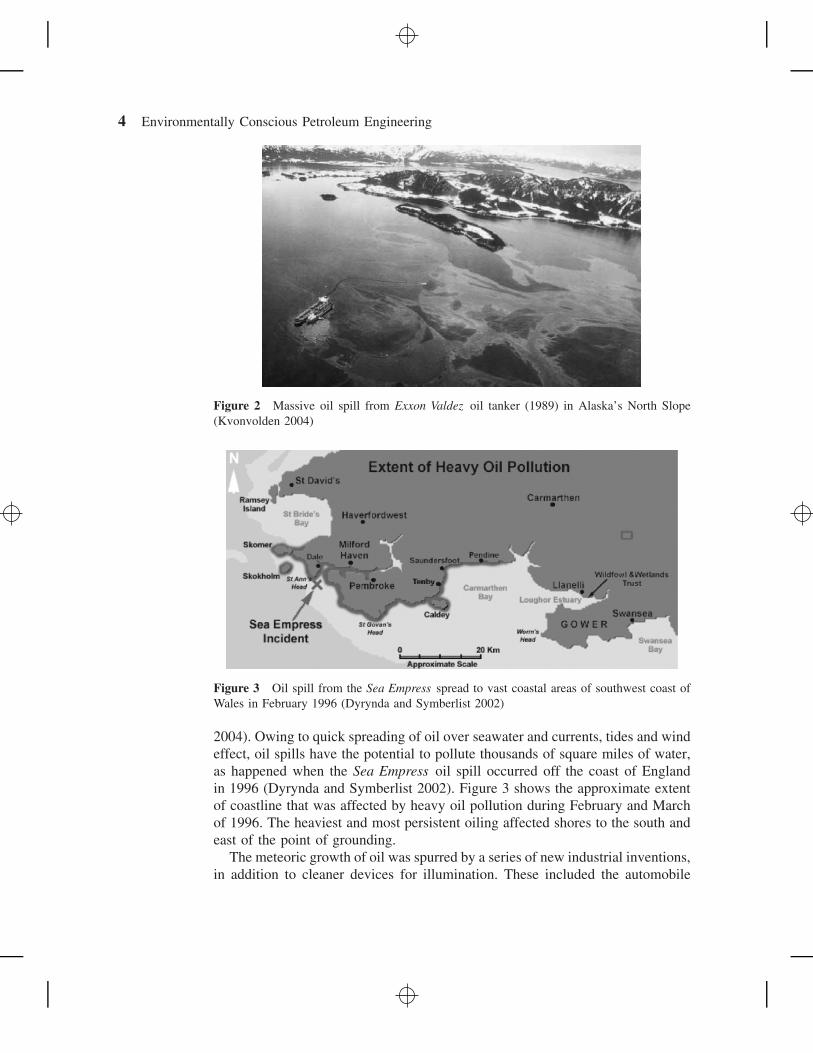
Figure 3 Oil spill from the Sea Empress spread to vast coastal areas of southwest coast ofWales in February 1996 (Dyrynda and Symberlist 2002)
2004). Owing to quick spreading of oil over seawater and currents, tides and windeffect, oil spills have the potential to pollute thousands of square miles of water,as happened when the Sea Empress oil spill occurred off the coast of Englandin 1996 (Dyrynda and Symberlist 2002). Figure 3 shows the approximate extentof coastline that was affected by heavy oil pollution during February and Marchof 1996. The heaviest and most persistent oiling affected shores to the south andeast of the point of grounding.
The meteoric growth of oil was spurred by a series of new industrial inventions,in addition to cleaner devices for illumination. These included the automobile
1 Introduction 5
(1895), electric generator (1896), motorized maritime vessels and submarines(1911), and the advent aircraft (1906) for public and goods transport. Suchneeds could then be met by occurrence of oil in shallow reservoirs, cheap andquick mobility through cross-country pipelines, and a rapid growth of refiningand petrochemical technologies that prompted thousands of useful products foreveryday life, from paving of roads to producing soaps, plastics, cosmetics, andmedicines.
Before embarking on the various types of environmental damages that arise ormay arise from petroleum, it is worthwhile to explore the vast world of petroleum.The petroleum industry is divided into two broad divisions: the upstream andthe downstream petroleum industry.
The former is often referred to as the exploration and production (E&P)industry (comprising various geological and geophysical exploration operations),followed by drilling activities and long-term well operations.
The latter include such operations as refining, petrochemical processing, andpipeline transportation of various consumer products, including natural gas.
The physical gap between the upstream and downstream is usually buttedonshore by crude oil and gas transportation pipelines—from the oil fields to therefinery. In case of offshore E&P, both pipelines (short distance of a few hundredmiles, except the Trans Alaskan Pipeline System (TAPS), and some Russianpipelines, which span several thousand miles) and maritime vessels (tankers,
Casing pipe
Tubing string
Well bore
Wellhead
Oil & gas reservoir rock
Oil
Gas
Water
Separator
Subterranean formations
Wellhead andsurface facilities
(a)
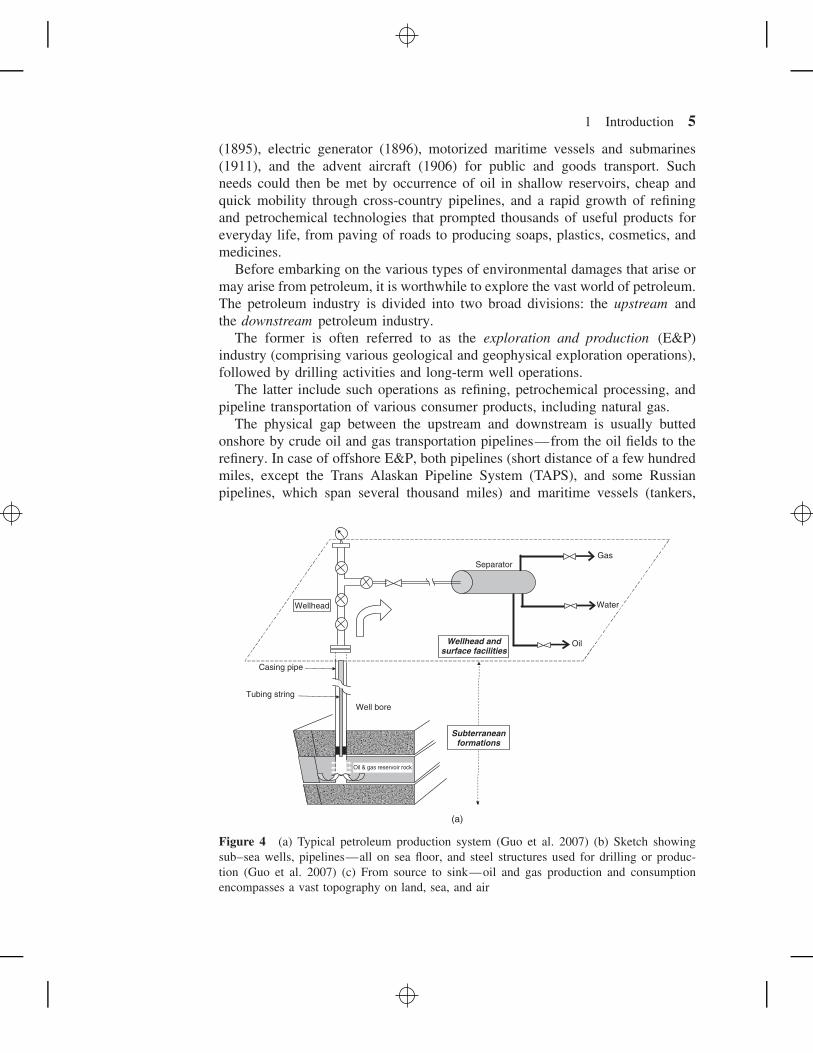
Figure 4 (a) Typical petroleum production system (Guo et al. 2007) (b) Sketch showingsub–sea wells, pipelines—all on sea floor, and steel structures used for drilling or produc-tion (Guo et al. 2007) (c) From source to sink—oil and gas production and consumptionencompasses a vast topography on land, sea, and air
6 Environmentally Conscious Petroleum Engineering
Expansiontie-inspoolpiece
Infieldflowline
Riser
Tie-in
Subsea manifold
Satellitesubseawells
Flowlines
Flowlines (several can bebundled)
Export pipeline
Existingline
To shorePipelinecrossing
Productionplatform
Flare!
Drilling orProductionplatform
(b)
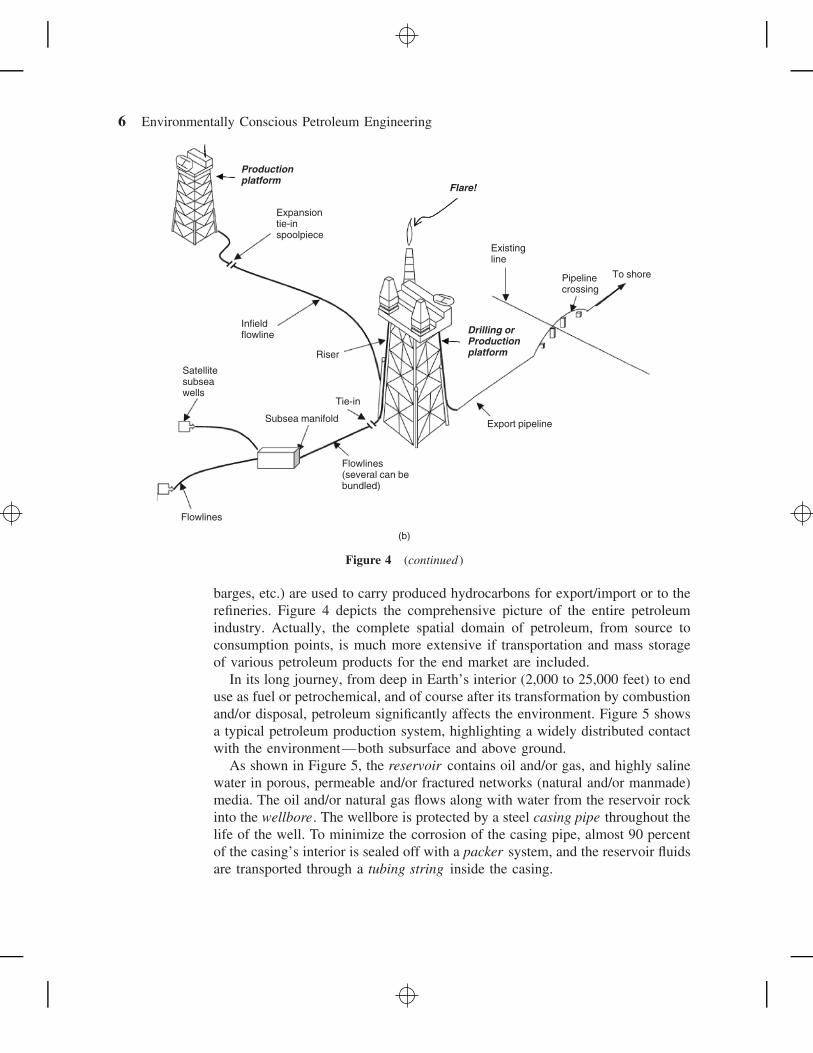
Figure 4 (continued )
barges, etc.) are used to carry produced hydrocarbons for export/import or to therefineries. Figure 4 depicts the comprehensive picture of the entire petroleumindustry. Actually, the complete spatial domain of petroleum, from source toconsumption points, is much more extensive if transportation and mass storageof various petroleum products for the end market are included.
In its long journey, from deep in Earth’s interior (2,000 to 25,000 feet) to enduse as fuel or petrochemical, and of course after its transformation by combustionand/or disposal, petroleum significantly affects the environment. Figure 5 showsa typical petroleum production system, highlighting a widely distributed contactwith the environment—both subsurface and above ground.
As shown in Figure 5, the reservoir contains oil and/or gas, and highly salinewater in porous, permeable and/or fractured networks (natural and/or manmade)media. The oil and/or natural gas flows along with water from the reservoir rockinto the wellbore. The wellbore is protected by a steel casing pipe throughout thelife of the well. To minimize the corrosion of the casing pipe, almost 90 percentof the casing’s interior is sealed off with a packer system, and the reservoir fluidsare transported through a tubing string inside the casing.

Cru
de o
il/ga
s fr
om o
nsho
rew
ells
Cru
de o
il/ga
s fr
om o
ffsho
re
plat
form
s
Pum
p an
d/or
C
ompr
esso
r st
atio
n
Tru
nk p
ipel
ines
to
exp
ort
term
inal
or
refin
ery
Pre
-ref
iner
y oi
l/gas
pr
oces
sing
&
stor
age
Pip
elin
es in
oil/
gas
field
s to
pro
cess
ing
plan
ts
Ref
iner
y /
Pet
ro-
chem
ical
pl
ants Cru
de o
il/LN
G fo
r ov
erse
as e
xpor
t
Mas
s st
orag
efa
cilit
ies
Oil/
gas
for
road
tr
ansp
ort
Res
iden
tial
user
s of
oil/
gas
Com
mer
cial
us
ers
of o
il/ga
s
Indu
stria
l use
rs
of o
il/ga
s
Tru
nk p
ipel
ines
for
regi
onal
di
strib
utio
n of
oi
l/gas
pro
duct
s
Pum
p an
d/or
C
ompr
esso
r st
atio
n
To
mar
ketin
g di
strib
utio
n fo
rco
nsum
ers
(c)
Fig
ure
4(c
onti
nued
)
7

8 Environmentally Conscious Petroleum Engineering
Injection wellCO2
CO2 plume
Abandonedwell
Upwardflow
Oil
Updip flow
Vadosezone flow
Cluster of producing oil wells
Figure 5 Clusters of production and injection wells used for petroleum extraction posenumerous environmental threats, which need continued development in petroleum engineering,and environmental awareness by government agencies and oil operators
From a number of wellheads, called the Christmas tree, surface flow lines carryoil and gas to processing plants, called gathering stations , which are located inthe oilfield itself. After initial separation of oil from associated gas and water,the partially stabilized oil is pipelined to a central tank farm (CTF), again in theoilfield. At the CTF, the crude oil is processed to specifications required byrefineries or sales for export. Because of the huge quantity of crude oil that mustbe processed for such requirements as desalting, dewaxing, sulfur removal (espe-cially for crude oils in Saudi Arabia and Brazil, which contain over 10,000 ppm ofsulfur), and deemulsification, the CTFs generate huge amount of wastes, mostlysolids and liquids.
The final processing stage for the crude oil is the refinery and petrochemicalplants, where the maximum pollution occurs—most notably in the form of atmo-spheric emissions that can be felt from miles away due to the odor of airbornechemical species, such as oxides of nitrogen and sulfur.
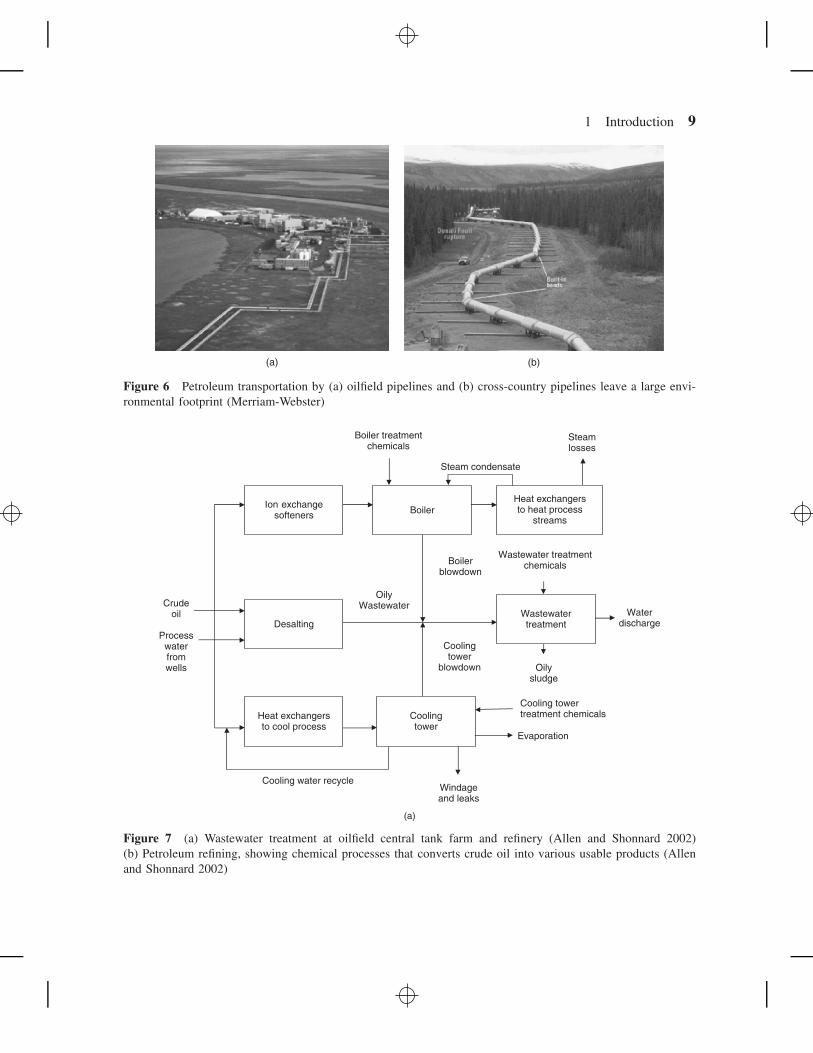
In the entire oil and gas chain, other sources of pollution are the local andtrunk pipelines, oil tankers, and huge storage tank farms (Figures 6 and 7).
1 Introduction 9
(a) (b)
Figure 6 Petroleum transportation by (a) oilfield pipelines and (b) cross-country pipelines leave a large envi-ronmental footprint (Merriam-Webster)
Ion exchange softeners Boiler
DesaltingWastewater treatment
Cooling tower
Boiler treatment chemicals
Steam condensate
Steam losses
Boiler blowdown
Water discharge
Wastewater treatment chemicals
Oily sludge
Cooling tower treatment chemicals
Windage and leaks
Cooling water recycle
Evaporation
Oily Wastewater
Heat exchangers to heat process
streams
Cooling tower
blowdown
Heat exchangers to cool process
Crude oil
Process water from wells
(a)
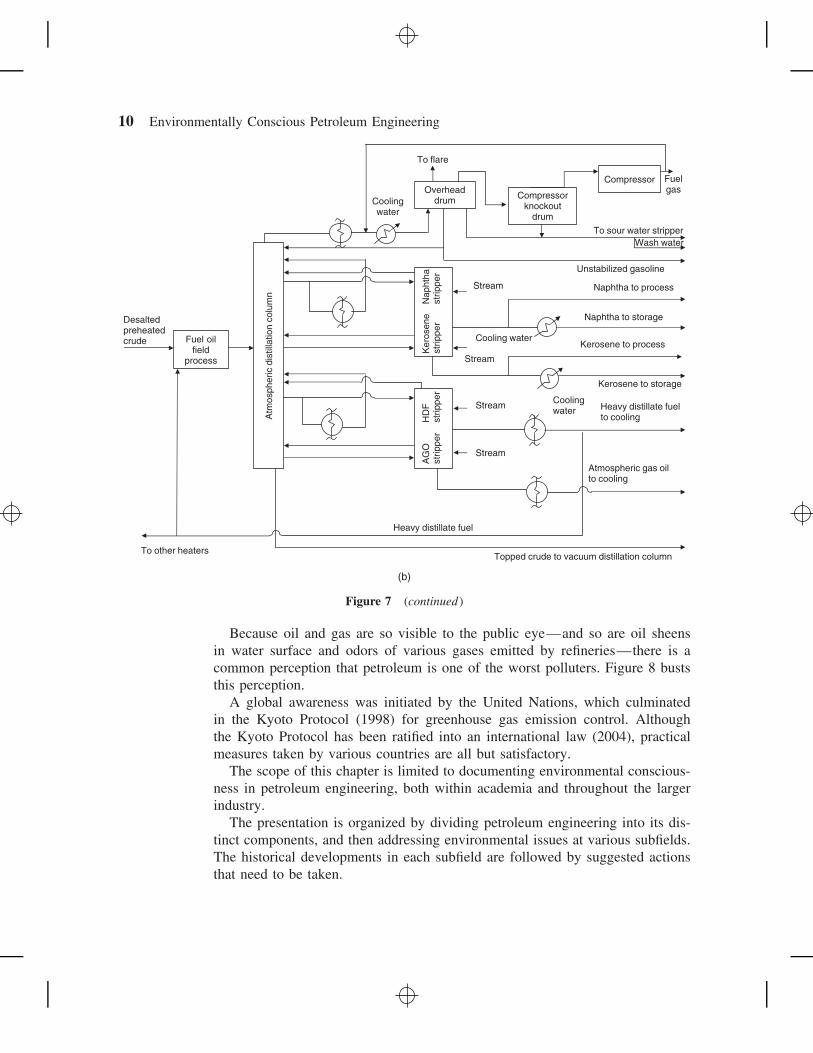
Figure 7 (a) Wastewater treatment at oilfield central tank farm and refinery (Allen and Shonnard 2002)(b) Petroleum refining, showing chemical processes that converts crude oil into various usable products (Allenand Shonnard 2002)
10 Environmentally Conscious Petroleum Engineering
Atm
osph
eric
dis
tilla
tion
colu
mn
Compressor
AG
O
strip
per
HD
F
strip
per
Ker
osen
e st
rippe
rN
apht
hast
rippe
r
To flare
Fuel gas
To sour water stripperWash water
Unstabilized gasoline
Naphtha to process
Naphtha to storage
Kerosene to process
Kerosene to storage
Stream
Stream
Stream
Stream
Cooling water
Cooling water
Heavy distillate fuel to cooling
Atmospheric gas oil to cooling
Heavy distillate fuel
Topped crude to vacuum distillation columnTo other heaters
Desalted preheatedcrude Fuel oil
field process
Cooling water
Overheaddrum Compressor
knockout drum
(b)
Figure 7 (continued )
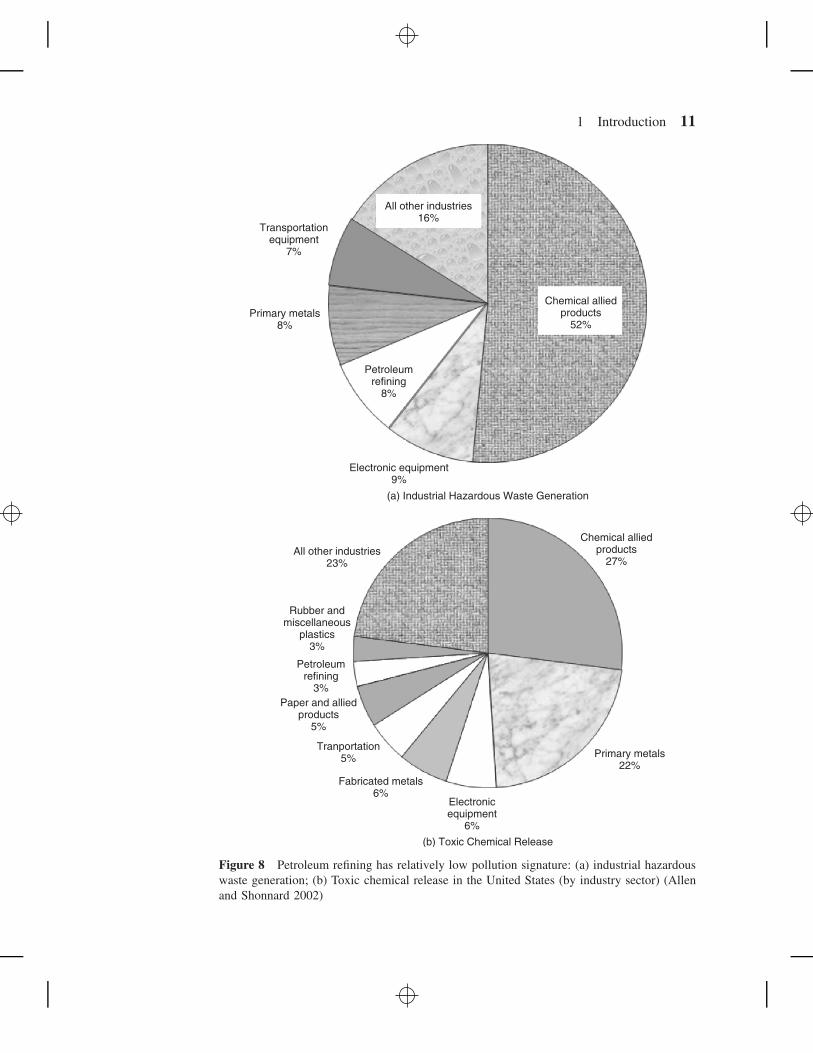
Because oil and gas are so visible to the public eye—and so are oil sheensin water surface and odors of various gases emitted by refineries—there is acommon perception that petroleum is one of the worst polluters. Figure 8 buststhis perception.
A global awareness was initiated by the United Nations, which culminatedin the Kyoto Protocol (1998) for greenhouse gas emission control. Althoughthe Kyoto Protocol has been ratified into an international law (2004), practicalmeasures taken by various countries are all but satisfactory.
The scope of this chapter is limited to documenting environmental conscious-ness in petroleum engineering, both within academia and throughout the largerindustry.
The presentation is organized by dividing petroleum engineering into its dis-tinct components, and then addressing environmental issues at various subfields.The historical developments in each subfield are followed by suggested actionsthat need to be taken.
1 Introduction 11
Transportationequipment
7%
All other industries23%
Rubber andmiscellaneous
plastics3%
Petroleumrefining
3%Paper and allied
products5%
Tranportation5%
Fabricated metals6%
Electronicequipment
6%
Primary metals22%
Chemical alliedproducts
27%
Primary metals8%
Petroleumrefining
8%
Electronic equipment9%
(a) Industrial Hazardous Waste Generation
(b) Toxic Chemical Release
Chemical alliedproducts
52%
All other industries16%
Figure 8 Petroleum refining has relatively low pollution signature: (a) industrial hazardouswaste generation; (b) Toxic chemical release in the United States (by industry sector) (Allenand Shonnard 2002)
12 Environmentally Conscious Petroleum Engineering
2 EXTENT OF ENVIRONMENTAL IMPACT OF PETROLEUM
The spread of petroleum also increased environmental pollution—in land, sea,and air—as production and distribution surpassed progress in containing oilspills during drilling and production in the oil and gas fields and during surfacetransportation—to stabilizing plants (known as central tank farms), to refineriesthrough trunk lines, and ultimately to every nook and corner of the civilizedworld for bulk and consumer distributions.
At this point, it is prudent to define some of the terms related to the environ-ment in order to avoid confusion and misinterpretation. The following definitionsare taken from California Department of Environment (Therkelsen 1973):
• Environment is all physical and biological features of an area, such as thetopography, geology, soil, hydrology, climate, plants, and wildlife.
• An environmental problem is anything that interferes with, alters, or hassome generally detrimental effect on all or any of the environmental com-ponents.
• Ecology is the study of the relationship between an organism, plant oranimal, and its environment.
• Oil fields generally constitute an environment composed of the physicalfeatures of the field, the organisms present, and all the factors associ-ated with oil exploration but mainly oil production, such as drilling andproduction equipment, access roads, and waste disposal facilities.
However, satisfactory prevention and solutions to petroleum-induced environ-mental damages should recognize that these problems are complex due to theinvolvement of many interrelated factors, all of which need to be considered.They include water and air quality, land use, wildlife and habitat requirements,aesthetic values and recreational uses, and regional economics.
World oil production continues to rise, from 8.5 million tonnes (1 tonne equalsabout 7 barrels) in 1985 to 11.7 million tonnes in 2000 (EIA 2005). In that sametime, the number of offshore oil and gas platforms rose from a few thousand toapproximately 8,300 fixed or floating offshore platforms. Current world averageproduction of petroleum is about 90 million barrels per day, with 1.5 to 2 percentannual growth (RCEP 2000).
2.1 Petroleum Pollution in Land and Sea
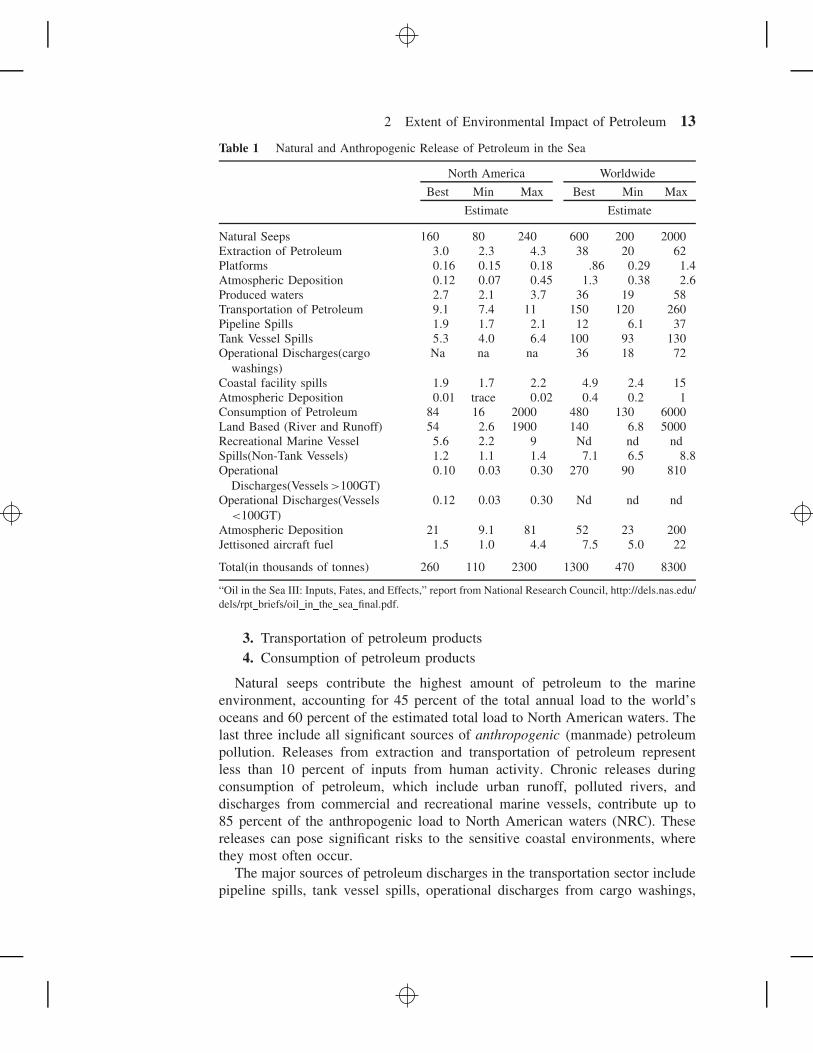
Historically, oil and gas exploration and production of petroleum have repre-sented a significant source of spills. Table 1 shows how much of it goes to thesea during maritime transportation and carried as effluent from offshore rigs,production platforms, and city sewerage.
Petroleum release in marine waters occurs from four major sources:
1. Natural seeps2. Releases that occur during the extraction of petroleum
2 Extent of Environmental Impact of Petroleum 13
Table 1 Natural and Anthropogenic Release of Petroleum in the Sea
North America Worldwide
Best Min Max Best Min Max
Estimate Estimate
Natural Seeps 160 80 240 600 200 2000Extraction of Petroleum 3.0 2.3 4.3 38 20 62Platforms 0.16 0.15 0.18 .86 0.29 1.4Atmospheric Deposition 0.12 0.07 0.45 1.3 0.38 2.6Produced waters 2.7 2.1 3.7 36 19 58Transportation of Petroleum 9.1 7.4 11 150 120 260Pipeline Spills 1.9 1.7 2.1 12 6.1 37Tank Vessel Spills 5.3 4.0 6.4 100 93 130Operational Discharges(cargo
washings)Na na na 36 18 72
Coastal facility spills 1.9 1.7 2.2 4.9 2.4 15Atmospheric Deposition 0.01 trace 0.02 0.4 0.2 1Consumption of Petroleum 84 16 2000 480 130 6000Land Based (River and Runoff) 54 2.6 1900 140 6.8 5000Recreational Marine Vessel 5.6 2.2 9 Nd nd ndSpills(Non-Tank Vessels) 1.2 1.1 1.4 7.1 6.5 8.8Operational
Discharges(Vessels >100GT)0.10 0.03 0.30 270 90 810
Operational Discharges(Vessels<100GT)
0.12 0.03 0.30 Nd nd nd
Atmospheric Deposition 21 9.1 81 52 23 200Jettisoned aircraft fuel 1.5 1.0 4.4 7.5 5.0 22
Total(in thousands of tonnes) 260 110 2300 1300 470 8300
“Oil in the Sea III: Inputs, Fates, and Effects,” report from National Research Council, http://dels.nas.edu/dels/rpt briefs/oil in the sea final.pdf.
3. Transportation of petroleum products4. Consumption of petroleum products
Natural seeps contribute the highest amount of petroleum to the marineenvironment, accounting for 45 percent of the total annual load to the world’soceans and 60 percent of the estimated total load to North American waters. Thelast three include all significant sources of anthropogenic (manmade) petroleumpollution. Releases from extraction and transportation of petroleum representless than 10 percent of inputs from human activity. Chronic releases duringconsumption of petroleum, which include urban runoff, polluted rivers, anddischarges from commercial and recreational marine vessels, contribute up to85 percent of the anthropogenic load to North American waters (NRC). Thesereleases can pose significant risks to the sensitive coastal environments, wherethey most often occur.
The major sources of petroleum discharges in the transportation sector includepipeline spills, tank vessel spills, operational discharges from cargo washings,
14 Environmentally Conscious Petroleum Engineering
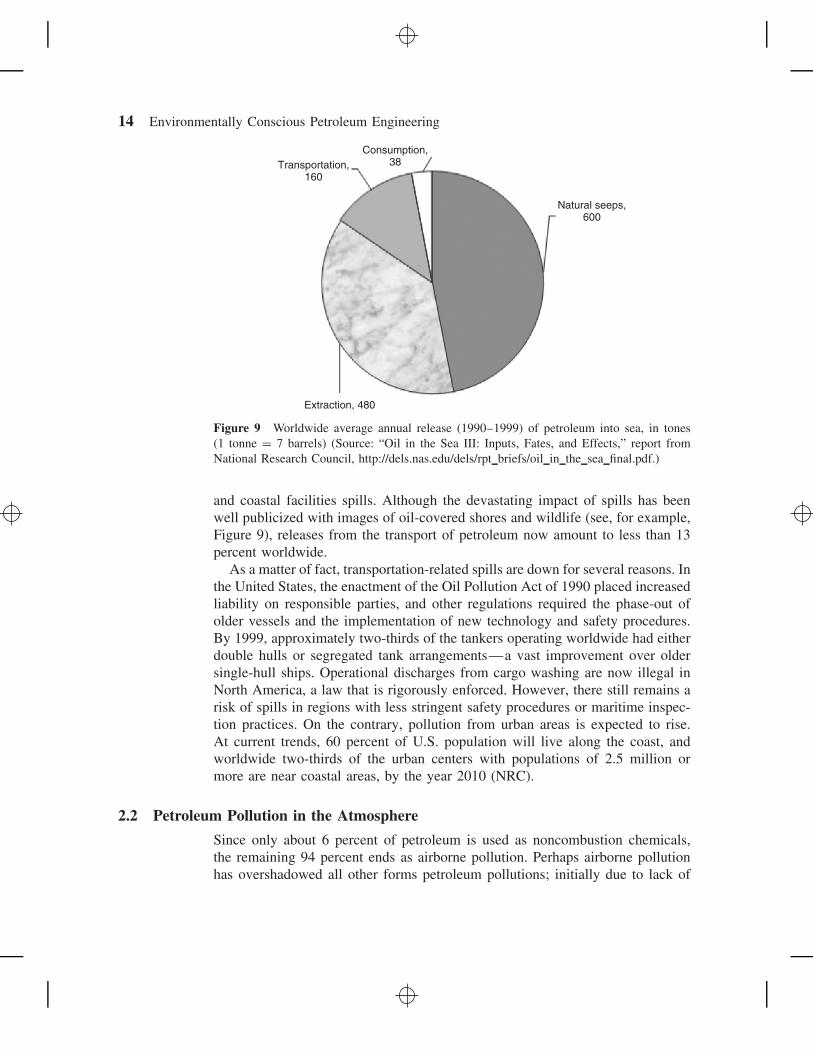
Transportation,160
Consumption,38
Natural seeps,600
Extraction, 480
Figure 9 Worldwide average annual release (1990–1999) of petroleum into sea, in tones(1 tonne = 7 barrels) (Source: “Oil in the Sea III: Inputs, Fates, and Effects,” report fromNational Research Council, http://dels.nas.edu/dels/rpt briefs/oil in the sea final.pdf.)
and coastal facilities spills. Although the devastating impact of spills has beenwell publicized with images of oil-covered shores and wildlife (see, for example,Figure 9), releases from the transport of petroleum now amount to less than 13percent worldwide.
As a matter of fact, transportation-related spills are down for several reasons. Inthe United States, the enactment of the Oil Pollution Act of 1990 placed increasedliability on responsible parties, and other regulations required the phase-out ofolder vessels and the implementation of new technology and safety procedures.By 1999, approximately two-thirds of the tankers operating worldwide had eitherdouble hulls or segregated tank arrangements—a vast improvement over oldersingle-hull ships. Operational discharges from cargo washing are now illegal inNorth America, a law that is rigorously enforced. However, there still remains arisk of spills in regions with less stringent safety procedures or maritime inspec-tion practices. On the contrary, pollution from urban areas is expected to rise.At current trends, 60 percent of U.S. population will live along the coast, andworldwide two-thirds of the urban centers with populations of 2.5 million ormore are near coastal areas, by the year 2010 (NRC).
2.2 Petroleum Pollution in the Atmosphere
Since only about 6 percent of petroleum is used as noncombustion chemicals,the remaining 94 percent ends as airborne pollution. Perhaps airborne pollutionhas overshadowed all other forms petroleum pollutions; initially due to lack of

3 Environmental Impact of Wastes 15
Table 2 Amount of CO2 Emitted per Million Btu of Energy from Various Fuels
Refined Products from Crude Oil Pounds CO2 per Million Btu
Aviation gasoline 152.7Distillate fuel (No. 1, No. 2, No. 4 Fuel Oil and Diesel) 161.4Jet fuel 156.3Kerosene 159.6Liquefied petroleum gases (LPG) 139.1Motor gasoline 156.4Petroleum coke 225.1Residual fuel (No. 5 and No. 6 fuel oil) 173.9
Natural and other fuel gasesMethane 115.3Landfill gas 115.3Flare gas 120.7Natural gas (pipeline) 117.1Propane 139.2
CoalAnthracite 227.4Bituminous 205.3Subbituminous 212.7Lignite 215.4
(Energy Information Administration 2000)
combustion efficiency, then exponential consumption in power generation andmass transport systems. In fact, global warming is attributed to anthropogenic(i.e., manmade) CO2 release in the atmosphere, in which combustion of petroleumhas taken a seat close to coal. Table 2 shows a comparison of CO2 emitted byvarious fuels.
During the past decade, however, improved production technology and safetytraining of personnel have dramatically reduced both blowouts and daily oper-ational spills. Today, accidental spills from platforms represent about 1 percent(NRC).
3 ENVIRONMENTAL IMPACT OF WASTES
Reis (1996) has given a comprehensive review of various wastes produced inconnection with production and transportation of petroleum.
The primary measure of the environmental impact of petroleum wastes is theirtoxicity to exposed organisms. The toxicity of a substance is most commonlyreported as its concentration in water that results in the death of half of theexposed organisms within a given length of 96 hours (4 days), although othertimes have been used (Reis 1996). Common test organisms include Mysid shrimpor Sheepshead Minnows for marine waters and fathead minnows or rainbow trout
16 Environmentally Conscious Petroleum Engineering
for freshwaters. The concentration that is lethal to half of the exposed populationduring the test is called LC50. High values of LC50 mean that high concentrationsof the substance are required for lethal effects to be observed, and this indicatesa low toxicity. A related measure of toxicity is the concentration at which half ofthe exposed organisms exhibit sublethal effects; this concentration is called EC50.Another measure of toxicity is reported as No Observable Effect Concentration(NOEC), the concentration below which no effects are observed.
Other effects of hydrocarbons include stunted plant growth if the hydrocarbonconcentration in contaminated soil is above about 1 percent by weight. Hydro-carbons can also impact higher organisms that may become exposed followingan accidental release. For example, marine animals that use hair or feathers forinsulation can die of hypothermia if coated with oil. Coated animals can alsoingest fatal quantities of hydrocarbons during washing and grooming activities(Reis 1996).
The high dissolved-salt concentration of most produced water can also impactthe environment. Typical dissolved-salt concentrations affect the ability of plantsto absorb water and nutrients from soil. They can also alter the mechanicalstructure of the soil, which disrupts the transport of air and water to root systems.The LC50 values for dissolved salt concentrations for freshwater organisms areon the order of 1,000 ppm (Reis 1996).
The toxicity of drilling muds varies considerably, depending on their compo-sition. Toxicities (LC50) of water-based muds containing small percentages ofhydrocarbons can be a few thousand ppm. The LC50 of polymer muds, however,can exceed one million, which means that fewer than 50 percent of a test specieswill have died during the test period. The toxicity of heavy metals found in theupstream petroleum industry varies widely. The toxicity of many heavy metalslies in their interference with the action of enzymes, which limits or stops nor-mal biochemical processes in cells. General effects include damage to the liver,kidney, or reproductive, blood forming, or nervous systems. With some metals,these effects may also include mutations or tumors, Heavy-metal concentrationsallowed in drinking water vary for each metal, but are generally below about 0.01mg/L. The heavy metals in offshore drilling fluid discharges normally combinequickly with the naturally abundant sulfates in seawater to form insoluble sul-fates and precipitates that settle to the sea floor. This process renders the heavymetals inaccessible for bioaccumulation or consumption. The various chemicalsused during production activities can also affect the environment. Their toxicitiesvary considerably, from highly toxic to essentially nontoxic.
4 PROVENANCE OF ENVIRONMENTAL DAMAGE
We now identify the sources of environmental damages encountered duringpetroleum exploration, production, and transportation. Reis (1996) has given abroad description on the subject, which are summarized in this section. Then we
4 Provenance of Environmental Damage 17
switch our discussion to some potential sources of threats to environmental thathave yet to be addressed.
In the upstream petroleum industry, drilling and production are two majoroperations that can potentially impact the environment by generating a signifi-cant volume of wastes, as well as leakage and emissions. Based on more in-depthunderstanding of these processes, operations can be improved in order to mini-mize or eliminate the adverse environmental impacts.
Drilling is the process in which a hole is made in the ground to allow subsur-face hydrocarbons to flow to the surface. The wastes generated during drillingare the rock removed to make the hole (as cuttings), the fluid used to lift thecuttings, and various materials added to the fluid to change its properties to makeit more suitable for use and to condition the hole.
Production is the process by which hydrocarbons flow to the surface to betreated and used. Water is often produced with hydrocarbons and contains avariety of contaminants. These contaminants include dissolved and suspendedhydrocarbons and other organic materials, as well as dissolved and suspendedsolids. A variety of chemicals are also used during production to ensure efficientoperations.
During drilling and production activities, a variety of air pollutants are emitted.The primary source of air pollutants are the emissions from internal combustionengines, with lesser amounts from other operations, fugitive emissions, and siteremediation activities.
4.1 Drilling
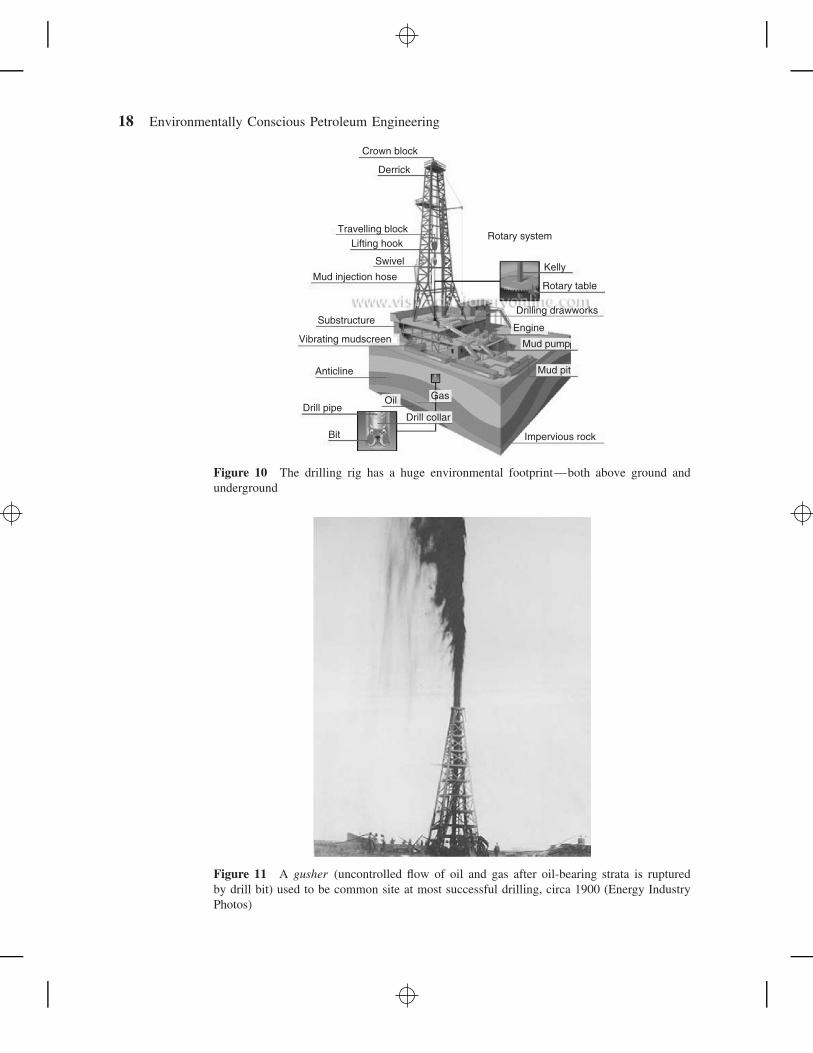
The drilling rig has a huge environmental footprint—both above ground andunderground (see Figure 10). In the early days, uncontrolled flow of oil and gasduring drilling, called gushers, were common at drilling sites, and the spillsoften exceeding millions of gallons of oil played havoc on the environment (seeFigure 11). Although modern drilling technology has advanced, human errorsstill cause similar uncontrolled flow, called a well blowout (see Figure 12). Wellblowouts are described in detail in Section 7.1.
The process of drilling oil and gas wells also generates a variety of differenttypes of wastes. Some of these wastes are natural byproducts of drilling throughthe earth (e.g., drill cuttings) and some come from materials used to drill thewell (e.g., drilling fluid and its associated additives).
During drilling, the drilling fluid tends to penetrate the permeable rock stratabecause an overpressure is always maintained to prevent blowout from high-pressure gas or oil strata. Special care is taken to avoid groundwater contam-ination while drilling under the water table. Environmental regulation requiressetting and cementing a steel casing pipe (surface casing) to isolate the freshwa-ter bearing strata from drilling fluid contamination, as drilling is continued untiltarget depth.
18 Environmentally Conscious Petroleum Engineering
Crown block
Derrick
Travelling blockLifting hook
Swivel
Mud injection hose
Substructure
Vibrating mudscreen
Anticline
Drill pipe
Bit
Oil Gas
Drill collar
Impervious rock
Mud pit
Mud pump
Engine
Drilling drawworks
Rotary table
Kelly
Rotary system
Figure 10 The drilling rig has a huge environmental footprint—both above ground andunderground
Figure 11 A gusher (uncontrolled flow of oil and gas after oil-bearing strata is rupturedby drill bit) used to be common site at most successful drilling, circa 1900 (Energy IndustryPhotos)

4 Provenance of Environmental Damage 19
Figure 12 Accidental well blowouts are still not uncommon, despite quantum progress in oil well drillingtechnology (Energy Industry Photos)
The drilling fluid is usually a water-based system of numerous solidadditives—mainly bentonite, barites, hematite, antioxidants (oxygen scavengers),corrosion inhibitors, biocides, lubricants, pH-control chemicals, polymers, andsalts (sodium and potassium chlorides). Diesel oil is the fluid base when anoil-base drilling fluid is required for drilling through water-sensitive shale strata,thus worsening the sensitivity to the environment—both surface and subsurface.
The situation is further aggravated when the drilling fluid returns to the surface,carrying cuttings of subsurface rock strata that contain heavy metals as well asradioactive materials.
Heavy metals can enter drilling fluids in two ways: Many metals are natu-rally occurring in most formations and will be incorporated into the fluid duringdrilling. Other metals are added to the drilling fluid as part of the additives usedto alter the fluid properties. Heavy metals naturally occur in most rocks andsoils, although at relatively low concentrations. Although the concentrations ofthe major elements will vary from carbonate to siliceous rocks, the concentrationof the trace elements, including heavy metals, is probably representative of rocksand soils of many other areas. Another significant source of heavy metals indrilling fluid is the thread compound (pipe dope) used on the pipe threads whenmaking up a drill string.
Drilling Fluid TreatmentsFor maintaining drilling fluid properties as well as minimizing pollution, elabo-rate treatment process is involved at the rig site. The basic equipment includesshale-shakers, de-sanders and de-silters, de-gassers, a battery of centrifugal andcyclones for unwanted solids removal, and chemical treaters. After separatingthe solids from the mud, a significant volume of liquid is normally retained withthe cuttings. Volumetric measurements from offshore platforms have shown that
20 Environmentally Conscious Petroleum Engineering
the total volume of liquids with the cuttings after discharge can be 53 to 73percent (Wojtanowicz 2008a,b,c). In some cases, further dewatering of the solidsmay be required before disposal, in which case advanced separation methods areused. One difficulty with using advanced technology for improved separations ata drill site is the high cost of equipment rental. The expenditure for this equipmentcan be easier to justify if a good economic model for their benefits is used.
Drilling Solid Waste TreatmentsThe most common method for the disposal of drilling wastes for onshore wellsis in on-site reserves pits. The contents of reserves pits vary, depending on thedrilling mud and the types of formations drilled. Reserves pits, however, cancause local environmental impact, particularly older pits that contain materialsthat are currently banned from such disposal or that were not constructed accord-ing to current regulations. The environmental impact of modern reserves pits isminimal.
Regulations for the design and monitoring of reserves pits during and afterdrilling can vary significantly with location. Unlined pits are most commonlyused for freshwater mud systems, while pits lined with an impermeable barrierare used for salt- or oil-based mud systems. Following the completion of drillingof the well, the pits are eventually dewatered, covered with a few feet of soil, andabandoned. For offshore applications, steel tanks are used as reserves pits. Thesolids, after being separated from the mud, are typically discharged into the sea,where they settle to the bottom around the drilling rig. In some areas, however,regulations require that any waste mud and cuttings be transported to shore fordisposal.
4.2 Petroleum Production Operations
The production of oil and gas generates a variety of wastes. The largest wastestream is produced water, with its associated constituents. Reis (1996) has givenan excellent review of both production process and the wastes that are generatedduring production.
Production operations involve principally flowing oil and/or gas from a dis-tributed system of wells spread over thousands of acres of land, or cluster ofwells in offshore locations—both sea floors and various types of fixed platformsor floating structures. The produced fluids are transported to central processingplants, called gathering stations via field pipelines. Large oil fields also have acentral tank farm that receives partially stabilized fluids from the satellite gather-ing stations. These gathering stations and the central farms are designed as plantsto separate undesirable liquids (brine) and solids (sand, wax, sulfur, etc.)
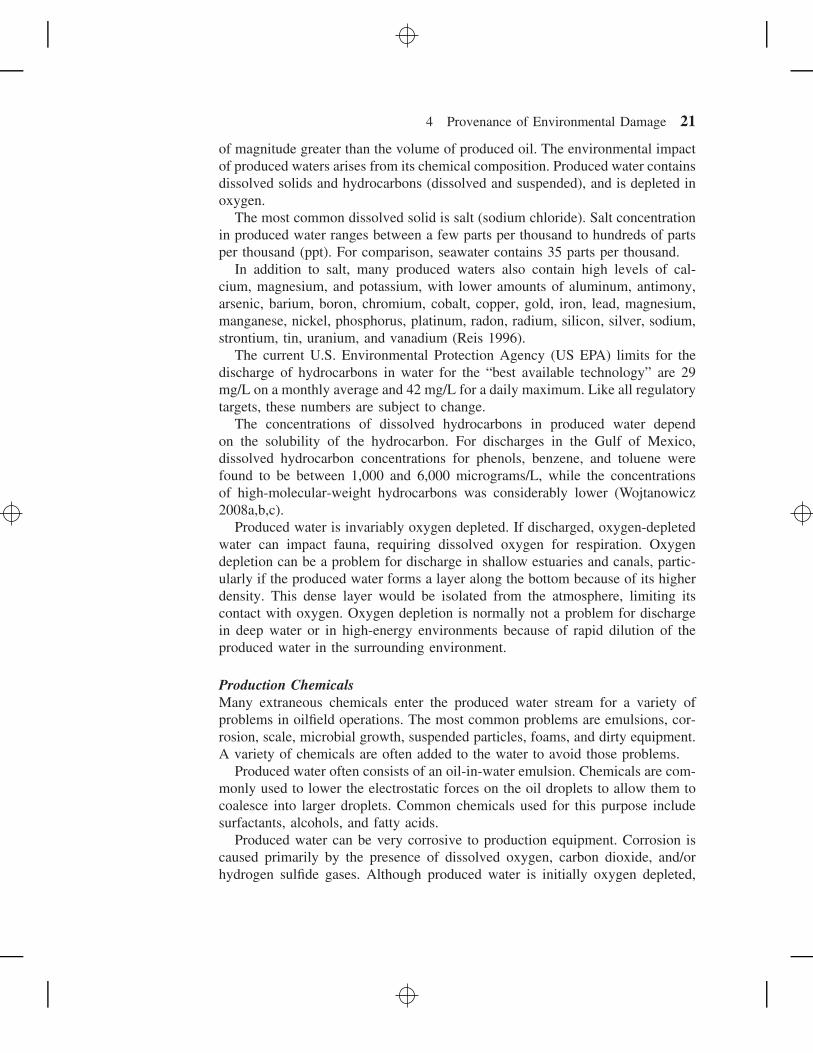
Produced WaterThe largest volume waste stream in the upstream petroleum industry is producedwater. For mature oil fields, the volume of produced water can be several orders
4 Provenance of Environmental Damage 21
of magnitude greater than the volume of produced oil. The environmental impactof produced waters arises from its chemical composition. Produced water containsdissolved solids and hydrocarbons (dissolved and suspended), and is depleted inoxygen.
The most common dissolved solid is salt (sodium chloride). Salt concentrationin produced water ranges between a few parts per thousand to hundreds of partsper thousand (ppt). For comparison, seawater contains 35 parts per thousand.
In addition to salt, many produced waters also contain high levels of cal-cium, magnesium, and potassium, with lower amounts of aluminum, antimony,arsenic, barium, boron, chromium, cobalt, copper, gold, iron, lead, magnesium,manganese, nickel, phosphorus, platinum, radon, radium, silicon, silver, sodium,strontium, tin, uranium, and vanadium (Reis 1996).
The current U.S. Environmental Protection Agency (US EPA) limits for thedischarge of hydrocarbons in water for the “best available technology” are 29mg/L on a monthly average and 42 mg/L for a daily maximum. Like all regulatorytargets, these numbers are subject to change.
The concentrations of dissolved hydrocarbons in produced water dependon the solubility of the hydrocarbon. For discharges in the Gulf of Mexico,dissolved hydrocarbon concentrations for phenols, benzene, and toluene werefound to be between 1,000 and 6,000 micrograms/L, while the concentrationsof high-molecular-weight hydrocarbons was considerably lower (Wojtanowicz2008a,b,c).
Produced water is invariably oxygen depleted. If discharged, oxygen-depletedwater can impact fauna, requiring dissolved oxygen for respiration. Oxygendepletion can be a problem for discharge in shallow estuaries and canals, partic-ularly if the produced water forms a layer along the bottom because of its higherdensity. This dense layer would be isolated from the atmosphere, limiting itscontact with oxygen. Oxygen depletion is normally not a problem for dischargein deep water or in high-energy environments because of rapid dilution of theproduced water in the surrounding environment.
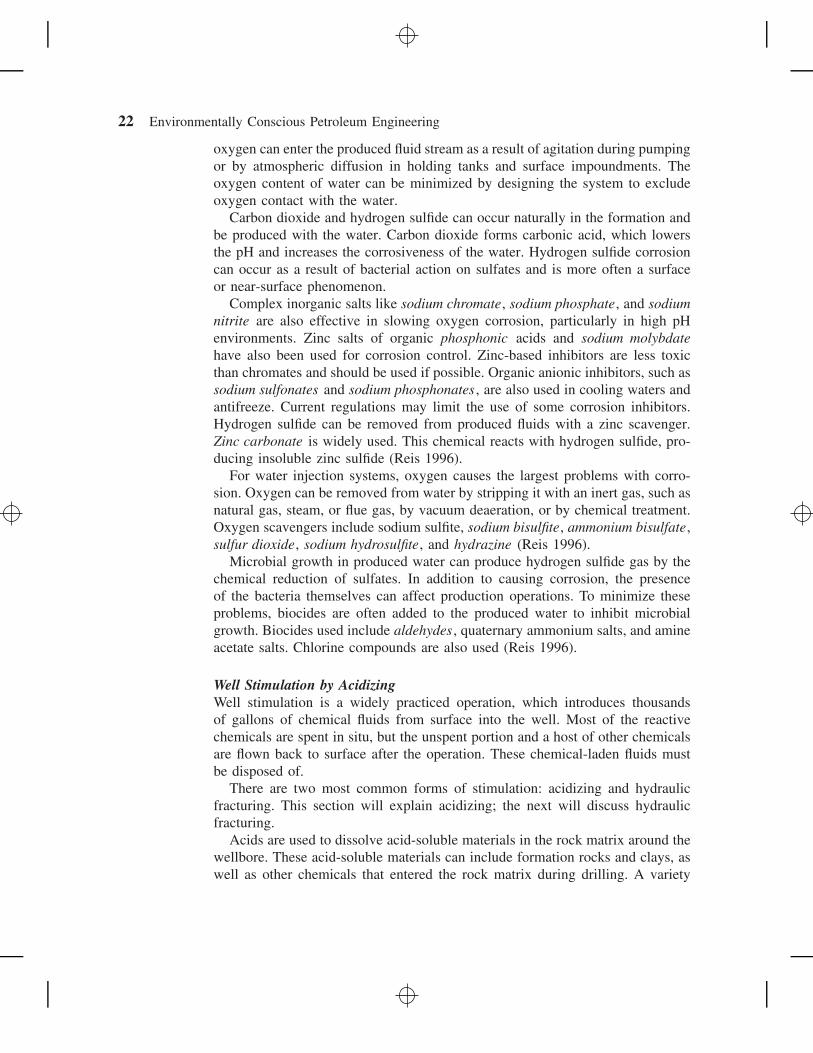
Production ChemicalsMany extraneous chemicals enter the produced water stream for a variety ofproblems in oilfield operations. The most common problems are emulsions, cor-rosion, scale, microbial growth, suspended particles, foams, and dirty equipment.A variety of chemicals are often added to the water to avoid those problems.
Produced water often consists of an oil-in-water emulsion. Chemicals are com-monly used to lower the electrostatic forces on the oil droplets to allow them tocoalesce into larger droplets. Common chemicals used for this purpose includesurfactants, alcohols, and fatty acids.
Produced water can be very corrosive to production equipment. Corrosion iscaused primarily by the presence of dissolved oxygen, carbon dioxide, and/orhydrogen sulfide gases. Although produced water is initially oxygen depleted,
22 Environmentally Conscious Petroleum Engineering
oxygen can enter the produced fluid stream as a result of agitation during pumpingor by atmospheric diffusion in holding tanks and surface impoundments. Theoxygen content of water can be minimized by designing the system to excludeoxygen contact with the water.
Carbon dioxide and hydrogen sulfide can occur naturally in the formation andbe produced with the water. Carbon dioxide forms carbonic acid, which lowersthe pH and increases the corrosiveness of the water. Hydrogen sulfide corrosioncan occur as a result of bacterial action on sulfates and is more often a surfaceor near-surface phenomenon.
Complex inorganic salts like sodium chromate, sodium phosphate, and sodiumnitrite are also effective in slowing oxygen corrosion, particularly in high pHenvironments. Zinc salts of organic phosphonic acids and sodium molybdatehave also been used for corrosion control. Zinc-based inhibitors are less toxicthan chromates and should be used if possible. Organic anionic inhibitors, such assodium sulfonates and sodium phosphonates , are also used in cooling waters andantifreeze. Current regulations may limit the use of some corrosion inhibitors.Hydrogen sulfide can be removed from produced fluids with a zinc scavenger.Zinc carbonate is widely used. This chemical reacts with hydrogen sulfide, pro-ducing insoluble zinc sulfide (Reis 1996).
For water injection systems, oxygen causes the largest problems with corro-sion. Oxygen can be removed from water by stripping it with an inert gas, such asnatural gas, steam, or flue gas, by vacuum deaeration, or by chemical treatment.Oxygen scavengers include sodium sulfite, sodium bisulfite, ammonium bisulfate,sulfur dioxide, sodium hydrosulfite, and hydrazine (Reis 1996).
Microbial growth in produced water can produce hydrogen sulfide gas by thechemical reduction of sulfates. In addition to causing corrosion, the presenceof the bacteria themselves can affect production operations. To minimize theseproblems, biocides are often added to the produced water to inhibit microbialgrowth. Biocides used include aldehydes , quaternary ammonium salts, and amineacetate salts. Chlorine compounds are also used (Reis 1996).
Well Stimulation by AcidizingWell stimulation is a widely practiced operation, which introduces thousandsof gallons of chemical fluids from surface into the well. Most of the reactivechemicals are spent in situ, but the unspent portion and a host of other chemicalsare flown back to surface after the operation. These chemical-laden fluids mustbe disposed of.
There are two most common forms of stimulation: acidizing and hydraulicfracturing. This section will explain acidizing; the next will discuss hydraulicfracturing.
Acids are used to dissolve acid-soluble materials in the rock matrix around thewellbore. These acid-soluble materials can include formation rocks and clays, aswell as other chemicals that entered the rock matrix during drilling. A variety
4 Provenance of Environmental Damage 23
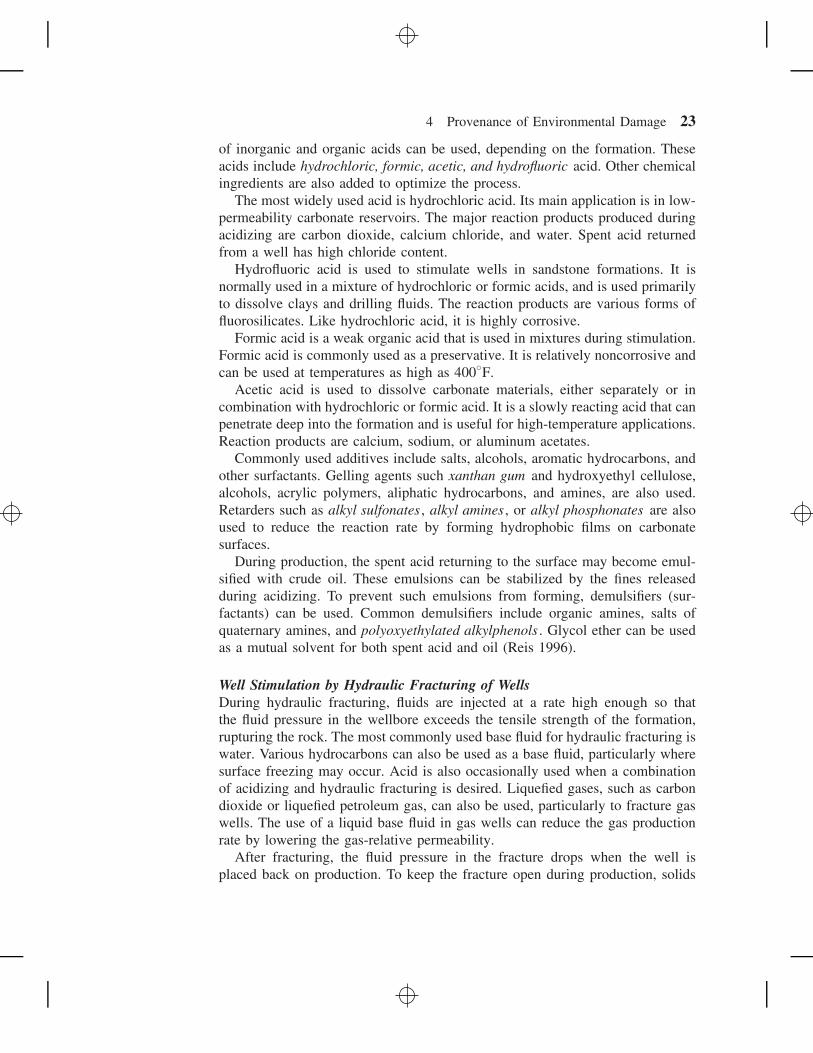
of inorganic and organic acids can be used, depending on the formation. Theseacids include hydrochloric, formic, acetic, and hydrofluoric acid. Other chemicalingredients are also added to optimize the process.
The most widely used acid is hydrochloric acid. Its main application is in low-permeability carbonate reservoirs. The major reaction products produced duringacidizing are carbon dioxide, calcium chloride, and water. Spent acid returnedfrom a well has high chloride content.
Hydrofluoric acid is used to stimulate wells in sandstone formations. It isnormally used in a mixture of hydrochloric or formic acids, and is used primarilyto dissolve clays and drilling fluids. The reaction products are various forms offluorosilicates. Like hydrochloric acid, it is highly corrosive.
Formic acid is a weak organic acid that is used in mixtures during stimulation.Formic acid is commonly used as a preservative. It is relatively noncorrosive andcan be used at temperatures as high as 400◦F.
Acetic acid is used to dissolve carbonate materials, either separately or incombination with hydrochloric or formic acid. It is a slowly reacting acid that canpenetrate deep into the formation and is useful for high-temperature applications.Reaction products are calcium, sodium, or aluminum acetates.
Commonly used additives include salts, alcohols, aromatic hydrocarbons, andother surfactants. Gelling agents such xanthan gum and hydroxyethyl cellulose,alcohols, acrylic polymers, aliphatic hydrocarbons, and amines, are also used.Retarders such as alkyl sulfonates , alkyl amines , or alkyl phosphonates are alsoused to reduce the reaction rate by forming hydrophobic films on carbonatesurfaces.
During production, the spent acid returning to the surface may become emul-sified with crude oil. These emulsions can be stabilized by the fines releasedduring acidizing. To prevent such emulsions from forming, demulsifiers (sur-factants) can be used. Common demulsifiers include organic amines, salts ofquaternary amines, and polyoxyethylated alkylphenols . Glycol ether can be usedas a mutual solvent for both spent acid and oil (Reis 1996).
Well Stimulation by Hydraulic Fracturing of WellsDuring hydraulic fracturing, fluids are injected at a rate high enough so thatthe fluid pressure in the wellbore exceeds the tensile strength of the formation,rupturing the rock. The most commonly used base fluid for hydraulic fracturing iswater. Various hydrocarbons can also be used as a base fluid, particularly wheresurface freezing may occur. Acid is also occasionally used when a combinationof acidizing and hydraulic fracturing is desired. Liquefied gases, such as carbondioxide or liquefied petroleum gas, can also be used, particularly to fracture gaswells. The use of a liquid base fluid in gas wells can reduce the gas productionrate by lowering the gas-relative permeability.
After fracturing, the fluid pressure in the fracture drops when the well isplaced back on production. To keep the fracture open during production, solids
24 Environmentally Conscious Petroleum Engineering
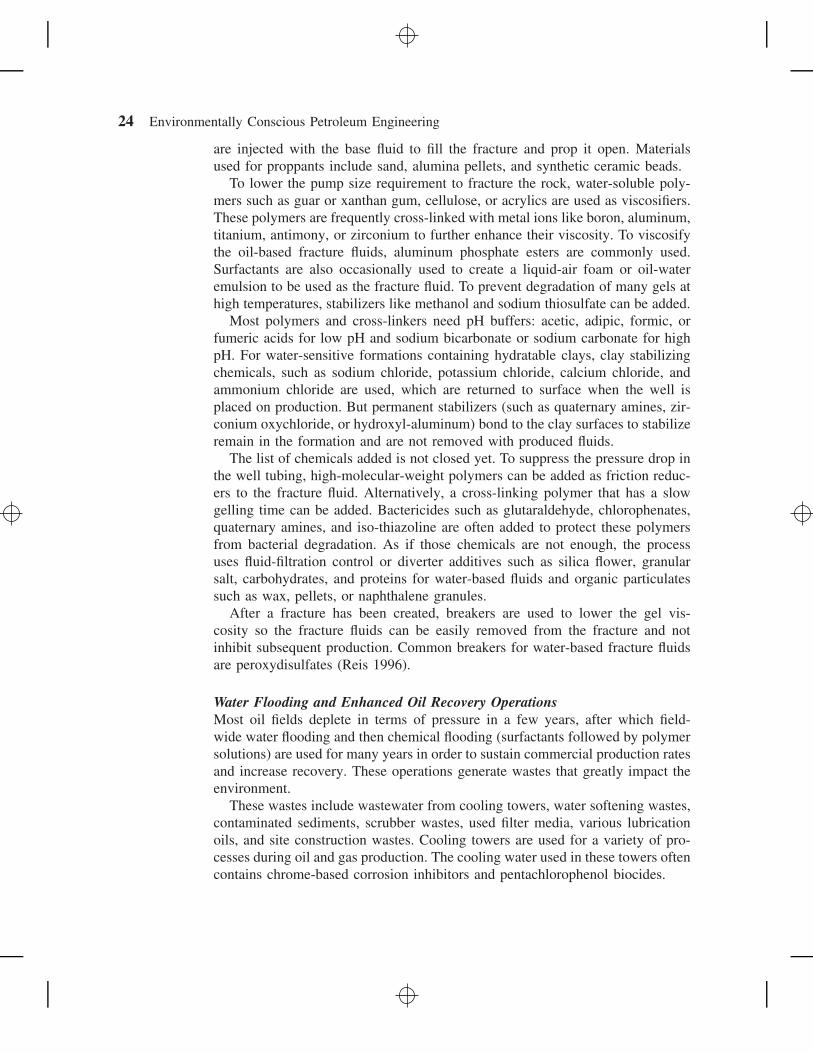
are injected with the base fluid to fill the fracture and prop it open. Materialsused for proppants include sand, alumina pellets, and synthetic ceramic beads.
To lower the pump size requirement to fracture the rock, water-soluble poly-mers such as guar or xanthan gum, cellulose, or acrylics are used as viscosifiers.These polymers are frequently cross-linked with metal ions like boron, aluminum,titanium, antimony, or zirconium to further enhance their viscosity. To viscosifythe oil-based fracture fluids, aluminum phosphate esters are commonly used.Surfactants are also occasionally used to create a liquid-air foam or oil-wateremulsion to be used as the fracture fluid. To prevent degradation of many gels athigh temperatures, stabilizers like methanol and sodium thiosulfate can be added.
Most polymers and cross-linkers need pH buffers: acetic, adipic, formic, orfumeric acids for low pH and sodium bicarbonate or sodium carbonate for highpH. For water-sensitive formations containing hydratable clays, clay stabilizingchemicals, such as sodium chloride, potassium chloride, calcium chloride, andammonium chloride are used, which are returned to surface when the well isplaced on production. But permanent stabilizers (such as quaternary amines, zir-conium oxychloride, or hydroxyl-aluminum) bond to the clay surfaces to stabilizeremain in the formation and are not removed with produced fluids.
The list of chemicals added is not closed yet. To suppress the pressure drop inthe well tubing, high-molecular-weight polymers can be added as friction reduc-ers to the fracture fluid. Alternatively, a cross-linking polymer that has a slowgelling time can be added. Bactericides such as glutaraldehyde, chlorophenates,quaternary amines, and iso-thiazoline are often added to protect these polymersfrom bacterial degradation. As if those chemicals are not enough, the processuses fluid-filtration control or diverter additives such as silica flower, granularsalt, carbohydrates, and proteins for water-based fluids and organic particulatessuch as wax, pellets, or naphthalene granules.
After a fracture has been created, breakers are used to lower the gel vis-cosity so the fracture fluids can be easily removed from the fracture and notinhibit subsequent production. Common breakers for water-based fracture fluidsare peroxydisulfates (Reis 1996).
Water Flooding and Enhanced Oil Recovery OperationsMost oil fields deplete in terms of pressure in a few years, after which field-wide water flooding and then chemical flooding (surfactants followed by polymersolutions) are used for many years in order to sustain commercial production ratesand increase recovery. These operations generate wastes that greatly impact theenvironment.
These wastes include wastewater from cooling towers, water softening wastes,contaminated sediments, scrubber wastes, used filter media, various lubricationoils, and site construction wastes. Cooling towers are used for a variety of pro-cesses during oil and gas production. The cooling water used in these towers oftencontains chrome-based corrosion inhibitors and pentachlorophenol biocides.
4 Provenance of Environmental Damage 25
In many areas, produced water is reinjected into the reservoir to assist hydro-carbon recovery. Unfortunately, the level of dissolved solids, particularly hard-ness ions (calcium and magnesium), is often too high to be used because theyreadily precipitate and can plug the formation. Thus, before produced water canbe reinjected, it must be softened to exchange the hardness ions with softer ions,such as sodium.
The most common way to soften produced water is sulfonic acid, carboxylicacid. Strong acid resins can be regenerated simply by flushing with a concentratedsolution of sodium chloride. Weak acid resins, however, must be regenerated byflushing with a strong acidlike hydrochloric or sulfuric and then neutralizing itwith sodium hydroxide.
For producing heavy and viscous crude oils, thermal methods are used, eithersteam injection or direct in situ combustion by injecting hot air. In such cases,lease crude is burned, and the combustion gases may need to be scrubbed toremove pollutants like sulfur dioxide. One way to remove sulfur dioxide fromcombustion gases is to bubble it through aqueous solutions containing causticchemicals like sodium hydroxide or sodium carbonate. Sulfur dioxide dissolvesinto water, forming sulfuric acid, which is neutralized by the caustic. Anotherform of scrubber uses various amines. In cold climates, such as Alaska’s NorthSlope, methanol is used for freeze protection of equipment (Reis 1996).
4.3 Refinery and Petrochemical Industries
Various production chains that are based on the conversion of hydrocarbonsinto chemical products make up what is known as the petrochemical industry.This is one of the keystones of industry and technology from the twentieth andbeginnings of the twenty-first centuries. The petrochemical industry has madepossible the development of many products that today are considered normaland indispensable, such as computers, textiles, unbreakable toys, and a largequantity of other products that do not exist in nature and that did not exist beforethe mass use of oil. The belief that these oil-derived products are what assure anacceptable quality of life make it seem impossible to live without them.
The huge variety of end products of the petrochemical industry can be classi-fied into five main groups: plastics, synthetic fibers, synthetic rubber, detergents,and nitrogen fertilizers. The common name for plastics comes from its prop-erty of deformability in relation to plasticity (elasticity) under the influenceof heat, pressure, or both. There are three important plastic families: thermo-plastics, thermo-resistant plastics, and polyurethanes. Thermoplastics constituteapproximately 50 percent of the consumer plastic of the world. They includephotographic films, plastic bags, pipes, furniture, construction material, toys,electronics, PVCs, valves, flowers, boots, and more.
The thermo-resistant plastics are used in electronics, decorative panels, anddomestic utensils, for example. Polyurethane plastics are products with transpar-ent glass appearance or extra-light foams. Synthetic fibers include polyamides
26 Environmentally Conscious Petroleum Engineering
for fine lingerie, carpets, curtains, and swimsuits. Polyesters are used in suits,ties, water-resistant clothing, and carpets. Acrylic fibers substitute for wool. Syn-thetic rubber is the principal supplier of the automobile industry, since it is thefundamental element of tires. It is also used in some of its varieties in shoes andmaterials for terraces and roofs. Detergents are products soluble in water whoseproperty is the ability to modify liquid surface tension, reducing or eliminatingcontained dirt. Its main uses are in the home in the form of powder, or liquids.
Industrial fertilizers for agriculture include sulfuric acid. The phosphates andsynthesized ammoniums have placed in circulation a variety of chemical fertil-izers. Via the petrochemical industry, the supply of hydrogen at a low cost haspromoted the mass use of ammonium products as nitrogen that can be assimi-lated in its three variants: nitrates, sulfates and urea, and the infinite number ofcomplex fertilizers.
However, the petrochemical industry has also created a great variety ofagro-toxins (e.g., herbicides, fungicides, insecticides, etc.), which generate alarge quantity of contaminants. The products themselves—as opposed to naturalproducts—are not biodegradable. In addition, the secondary products involvedin the production of the agro-toxins create contaminant byproducts as well. Thelocal populations that live with the area of influence of petrochemical plantsface serious health problems, due to the presence of the contaminants generatedby the industry.
Among the contaminants typical of the industry are the polyaromatic hydro-carbons (PAH), considered as the most toxic hydrocarbons, together with themonoaromatics . Once PAHs are liberated into the aquatic environment, the degra-dation via microorganisms is often very slow, which leads to its accumulationin sediments, soils, aquatic and land plants, fish, and invertebrates. PAHs affecthuman health as well: Individuals develop cancer if exposed to a mixture of thesecomponents via inhalation or touch for prolonged periods of time. The alkaliben-zines are very resistant to degradation and can accumulate in sediments. In toxicterms, the acute exposure to these products can cause depression to the cen-tral nervous system, leading to alterations in speech. The heavy metals (whichinclude lead, mercury, zinc and copper) all are toxic to humans as to wild life(Reis 1996; Wojtanowicz 2008a,b,c).
Oil is therefore more than just energy. Via the petrochemical industry, fivemillion different products can be obtained. It transformed the twentieth century.It also made us a civilization dependent on oil and on the transnationals thatcontrol oil exploitation and the petrochemical industry (RCEP 2000).
5 ENVIRONMENTAL COMPLIANCE
Historically, environmental compliance of the oil and gas industry (also referredto as hydrocarbon or petroleum industry) has evolved from one of regulation toself-motivation. Initial awareness to petroleum-related environmental pollution
5 Environmental Compliance 27
was slow, but concern for oil patch workers’ safety and the need for con-servation resulted in improved methods. Although the petroleum industry hasoften reacted to new regulations by changing operational practices the minimumamount required to meet the letter of the regulations, with time, several factorshave led to environmentally responsible, cost-effective practices:
• Complex and rapidly changing regulatory environment• Mutual education between regulators and the petroleum industry• Increased public awareness of environmental concerns
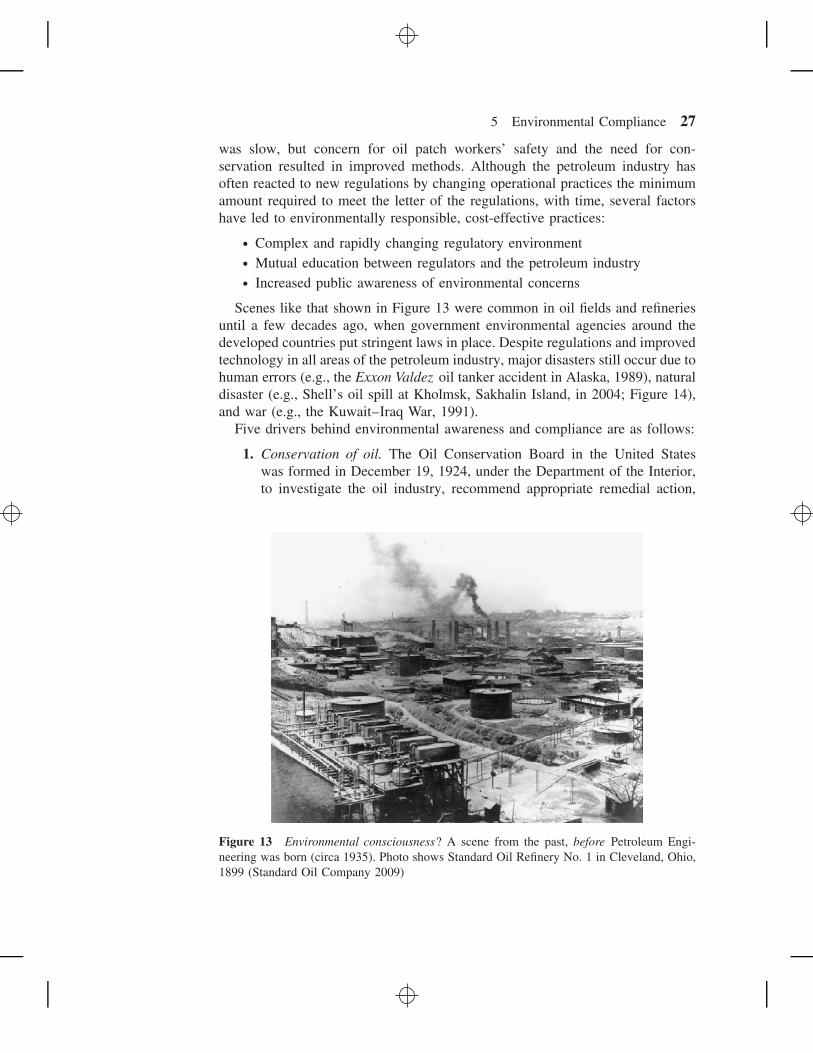
Scenes like that shown in Figure 13 were common in oil fields and refineriesuntil a few decades ago, when government environmental agencies around thedeveloped countries put stringent laws in place. Despite regulations and improvedtechnology in all areas of the petroleum industry, major disasters still occur due tohuman errors (e.g., the Exxon Valdez oil tanker accident in Alaska, 1989), naturaldisaster (e.g., Shell’s oil spill at Kholmsk, Sakhalin Island, in 2004; Figure 14),and war (e.g., the Kuwait–Iraq War, 1991).
Five drivers behind environmental awareness and compliance are as follows:
1. Conservation of oil. The Oil Conservation Board in the United Stateswas formed in December 19, 1924, under the Department of the Interior,to investigate the oil industry, recommend appropriate remedial action,
Figure 13 Environmental consciousness? A scene from the past, before Petroleum Engi-neering was born (circa 1935). Photo shows Standard Oil Refinery No. 1 in Cleveland, Ohio,1899 (Standard Oil Company 2009)

28 Environmentally Conscious Petroleum Engineering
Figure 14 Oil spills rarely occur, but when they do, environment takes a heavy toll. Photoshows Shell’s Oil Spill at Kholmsk, Sakhalin Island (ECA Watch)
and cooperate with industry and state agencies in promoting resourceconservation (Oil Watch).
2. Health, safety, and environment (HSE). Such practices aimed at improvingtechnology at various phases of petroleum—exploration, production anddistribution are motivated partly by operating companies’ concern for theirbottom line and for public awareness leading to government regulations.A shift in about 1990 to downhole oil-water separation and in situ under-ground disposal of brine is a prime example of oil field operating costcontrol that also pays a rich dividend to the environment (Wojtanowicz2008a,b,c).
3. Superior technology. The Industrial Revolution has set in a perpetualpenchant for improving efficiency and smaller footprints in everythingmanmade.
4. Standard of living. Man’s quest for a higher standard of living has ledto modifying dirty fossil fuels into cleaner forms (e.g., coal-to-liquid,underground coal gasification, reducing underground oil to cleaner gasesby in situ microbial reduction, and use of solar panels to operate oil fieldinstruments).
5. Global warming and climate control. The unusual rise of global atmo-spheric temperature over land masses since 1990 is attributed to, amongother things, anthropogenic CO2 released by fossil fuel combustion. Thetwentieth century’s last two decades were the hottest in 400 years and

6 Environmental Regulations on Fluid and Solids Discharge 29
possibly the warmest for several millennia, according to a number ofclimate studies. And the United Nations’ Intergovernmental Panel on Cli-mate Change (IPCC) reports that 11 of the past 12 years are among thedozen warmest since 1850 (National Geographic 2007).
This partnership requires cooperation, teamwork, commitment, credibility, andtrust among all parties involved in the exploration for and production of oil,including operating company managers, engineers, geologists, contractors, sub-contractors, work crews, regulators, courts, and legislators.
Companies conforming to standards set by the American Petroleum Institute(API) have formally adopted a set of principles toward ensure environmentalresponsibility. These principles are known as the Guiding Principles for Envi-ronmentally Responsible Petroleum Operations (American Petroleum Institute2009).
6 ENVIRONMENTAL REGULATIONS ON FLUID AND SOLIDSDISCHARGE
Two types of muds that are normally used in drilling operation are water-basedmuds (WBMs) and oil-based muds (OBMs). WBMs are by far the most com-monly used muds, both onshore and offshore. WBMs are widely used in shallowwells and often in shallower portions of deeper wells, but are not effective indeeper wells. The uses of WBMs generate 7,000 to 13,000 bbl of waste per well.Depending on the depth and diameter of the well, about 1,400 to 2,800 bbl ofthat amount are drill cuttings (McMordie 1980). WBMs use water as their basefluid and do not contain any oil. WBMs are very economical and easy to disposeof because they can be fully biodegraded and are considered as having very lowtoxicity. In many countries, both WBMs and cuttings are discharged on site tothe ocean.
During the past 30 years, OBMs have been developed and refined to overcomethe limitation of WBMs applications. OBMs have been the mud of choice for arange of special situations, including high temperatures, hydratable shales, highangle and extended-reach well, high-density mud, and drilling trough to salt.Wells drilled with OBMs normally produced lower waste volume than thosedrilled with WBMs because very little slumping or caving in of the walls of thehole occurs. Also, the mud is reconditioned and reused rather than dischargedat the end of the well. Only the drill cuttings will be expelled into the ocean.The average volume of OBM waste is estimated at 2,000 to 8,000 bbl per well.The base fluids of OBM are normally either diesel or mineral oil, even thoughnowadays many other types of low-toxicity oil are developed. Because theycontain oil, OBMs waste cannot be discharged on site under the regulation ofmany countries (McMordie 1980).
Frac-packing has emerged as a preferred method of completing offshore wellsin unconsolidated formations such as those prevalent in the Gulf of Mexico.
30 Environmentally Conscious Petroleum Engineering
Fracturing fluids are a complex mixture of polymers and additives that must bebalanced to achieve such properties as high viscosity, proper formation com-patibility, appropriate breakers, and proper concentration to achieve the desiredbreak times for cleanup. Some jobs may require up to a dozen additives.
The frac-pack operation manufactures and pumps large volumes of stimula-tion fluids from the fracturing stimulation vessel into the well. Most operationsrequire at least two work string volumes of fracturing fluid to be reversed outand safely disposed. Greater than 3 miles (4.8 km) from shore, discharging thefluids offshore minimizes costs, risks, and logistics and deck space requirements.To qualify as offshore-disposable, the fluids must meet stringent criteria. No dis-charge of free oil means that waste streams cannot be discharged when theywould cause a film or sheen on or discoloration of the surface of the receivingwater.
In recent years, the development of completion fluids for use in offshore wellshas taken on a new component—namely, that of satisfying new and pendingenvironmental requirements. The fluid system must have a mysid shrimp toxi-cology (MST) of more than 30,000 ppm, and biodegradability of minimum 60percent in 28 days, according to the Organization of Economic Cooperation andDevelopment (OECD) (Baycroft 2005; Baycroft et al. 2005).
The new fluid includes chemical technology that meets all environmental goals,improves overall fluid performance, and maintains pricing levels within 5 percentof older fluids. Offshore disposability is a significant advantage that reduces oper-ational costs . The new fluid system has a hexane extractable materials (HEM)value for oil and grease that averages less than 10 mg/l, along with a MST ofover 30,000 ppm, which meets the toxicity standard for water-based drilling mud.Additionally, biodegradability meets or exceeds the OECD requirement (Baycroft2005; Baycroft et al. 2005).
Various governments have set environmental compliances on drilling and wellcompletion fluids and solids discharge in seawater. For example, the Indonesiangovernment requires for both WBMs and OBMs 96 h LC50 at 30,000 ppm SPP(suspended particulate phase) to shrimp (Soegianto et al. 2008). The LC50 is astandard test (set by the US EPA: 96-hour Acute Static LC50. EPA Method 58FR 34592, Mysidopsis bahia) to determine the concentration of the substancewhich will prove lethal to 50 percent of a test population of the marine organismin 96 hours (Burke and Veil 1995).
The chapter appendixes show major U.S. environmental regulations pertainingto oilfield operations.
7 MAJOR ACHIEVEMENTS IN ENVIRONMENTALLYCONSCIOUS PETROLEUM ENGINEERING
The petroleum industry has developed various equipment, technologies, and oper-ational procedures since the time of Colonel Drake, albeit at a slow pace until

7 Major Achievements in Environmentally Conscious Petroleum Engineering 31
the 1950s, to cope with various hazardous situations and problems. With grow-ing public awareness for pollutions, of which oil spills are most conspicuous,and consequent government regulations, the oil industry has eventually taken aproactive role in remedying and mitigating environmental impacts and in handlinginadvertent spills when they occur. From basic concerns for safety of man andequipment in the petroleum chain, the industry has evolved to take environmentalsafety as a stimulus to its bottom line.
7.1 Barriers in Drilling
During drilling, a major source of surface contamination occurs when a wellblowout occurs. A blowout is an uncontrolled flow of oil and/or gas that happensif the drilling fluid fails to contain the high pressure encountered during drillingthrough a known or unknown oil- or gas-bearing rock formation.
In order to prevent blowout, two barriers are used: a heavy drilling fluid, whereheavy minerals like barium sulfate are used, and a high-pressure control devicecalled the blowout preventer (BOP), which is installed at the surface betweenthe surface casing and the rig floor.
7.2 Barriers in Production/Injection (Cementing)
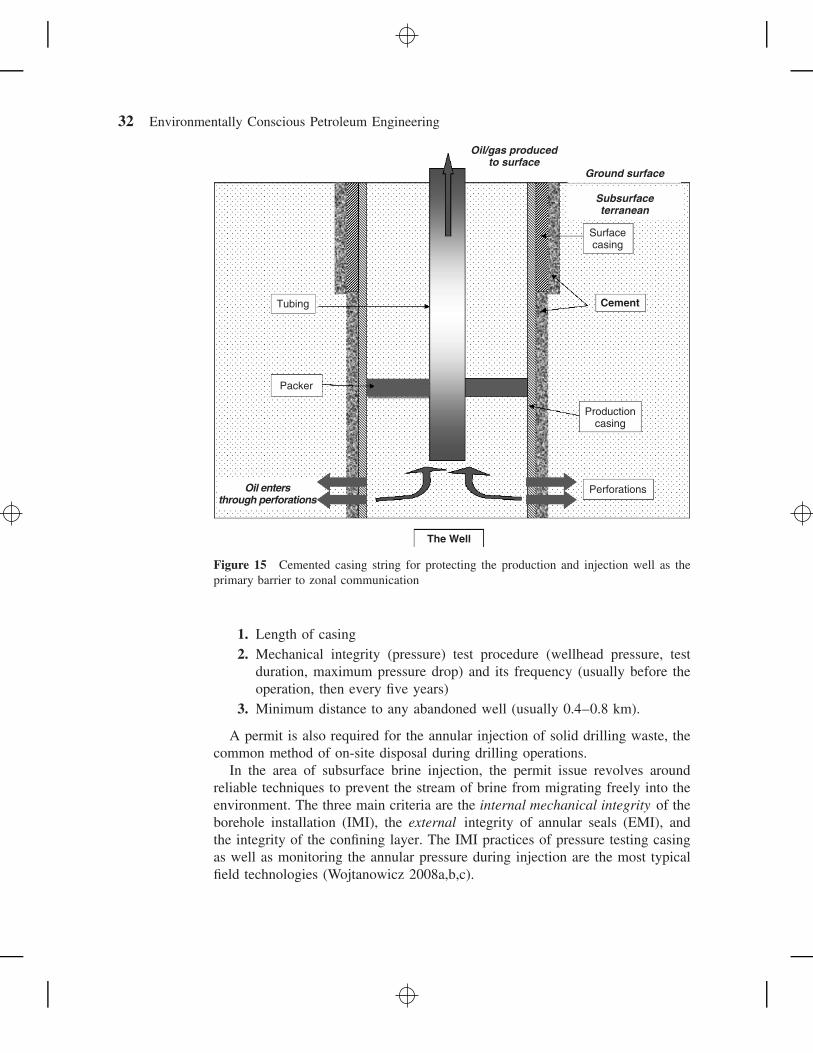
The problem of hydraulic integrity of well annular seals has been addressedthrough both regulatory and technological measures. The two areas of regulatoryinitiatives to control annular integrity are drilling permit regulations and injec-tion permit regulations . Drilling regulations focus mostly on the integrity of thesurface casing. Typically, drilling permits require the surface pipe to be entirelycemented to protect freshwater sands from oil and gas zones (see Figure 15). Inaddition, typical drilling regulations may specify minimum footage for surfacepipe, minimum waiting-on-cement (WOC) time, minimum volume of cementslurry to be used, minimum length of cement sheath above the top produc-ing zone and at the salt–fresh groundwater interfaces, and the minimum testingrequirements after completion (pressure test or cement-bond log tests (CBL)).
Currently, no quantitative requirements exist to verify a potential annular flowbetween well casing and formations. For production casing, drilling permits arenot very specific about the verification of annular integrity, even though thisintegrity is most important in effectively isolating upper zones from producedhydrocarbons and brines.
Subsurface injection permits require an operator to provide evidence of thehydrodynamic integrity of the well’s annular seal. However, no direct stan-dardized tests for such integrity exist (Wojtanowicz 2008a,b,c). Usually, permitdecisions are based on indirect evidence of the well’s integrity, such as CBL,electric logs, the driller’s log, and geological cross-plots, which indicate to theregulatory agency that no unusual environmental risk is involved. Typical genericcriteria for wells injecting oilfield brines address three issues:
32 Environmentally Conscious Petroleum Engineering
Oil/gas producedto surface
Ground surface
Subsurfaceterranean
Oil entersthrough perforations
Surfacecasing
Cement
Productioncasing
Perforations
The Well
Packer
Tubing
Figure 15 Cemented casing string for protecting the production and injection well as theprimary barrier to zonal communication
1. Length of casing2. Mechanical integrity (pressure) test procedure (wellhead pressure, test
duration, maximum pressure drop) and its frequency (usually before theoperation, then every five years)
3. Minimum distance to any abandoned well (usually 0.4–0.8 km).
A permit is also required for the annular injection of solid drilling waste, thecommon method of on-site disposal during drilling operations.
In the area of subsurface brine injection, the permit issue revolves aroundreliable techniques to prevent the stream of brine from migrating freely into theenvironment. The three main criteria are the internal mechanical integrity of theborehole installation (IMI), the external integrity of annular seals (EMI), andthe integrity of the confining layer. The IMI practices of pressure testing casingas well as monitoring the annular pressure during injection are the most typicalfield technologies (Wojtanowicz 2008a,b,c).
7 Major Achievements in Environmentally Conscious Petroleum Engineering 33
7.3 Cuttings Reinjection
Subsurface disposal of solid waste has evolved from downhole injection of solids-free liquids combined with the well stimulation technique of hydraulic fracturingto the new technology of subsurface injection of slurrified solids (fluids havingvarious concentrations of solids, from less than 1 percent to over 20 percentby volume). Slurry injection operations are batch processed, where drill cuttingsare mixed with waste mud and water in the mixing/processing tanks, sent to aholding tank, and then injected downhole (Wojtanowicz 2008a,b c).
In the early 1980s, high-permeability annular injection of small volumes ofdrill cuttings became an environmentally sound alternative for on-site disposalof drilling waste, particularly in the Gulf Coast area. Later, slurry fracture injec-tion technology was developed for disposal of drill cuttings from oil-based mudsin Alaska and the North Sea, and for NORM (naturally occurring radioactivematerials) disposal. In the mid-1990s, the first large commercial facility with ded-icated injection wells began operation. This was followed by large-scale injectionoperations in Alaska and Gulf of Mexico (Wojtanowicz 2008a,b,c).
At present, annular injection is available for routine use offshore, with severaldifferent service companies providing a range of operations and engineeringsupport. An example of continuing evolution of the technology was documentedin a study on commingled drill cuttings and produced water injection. Also,slurry fracture injection has been used for disposal of oilfield wastes other thandrilling mud and cuttings, such as produced sand, sediment from tank bottoms,unset cement, and unused fracture sand. However, the most common sources ofwaste injected are from ongoing drilling operations and from mud and cuttingsstockpiled in tanks or stored in earthen pits (Wojtanowicz 2008a,b,c).
7.4 CO2 Sequestration
The oil industry has use CO2 as a means for enhanced oil recovery since the1950s. Initially CO2 was injected into the oil reservoir with water in dissolvedform. In the 1960s the CO2 injection became more popular when more oil couldbe recovered by achieving CO2 miscibility with oil under high pressure. At highpressures a far greater supply of CO2 is required, thereby creating a better CO2
sink.The oil industry experience with bulk CO2 injection proved beneficial to
the world when awareness of global warming and consequent demand for CO2
sequestration in suitable underground geological structures grew in the late 1980s.For underground storage, both oil and gas reservoirs and aquifers are potentialstorage sites.
Oil and gas reservoirs have proven their storage capacities for hydrocarbonsover millions of years, and are thus considered as safe storage sites for CO2.In recent years, millions of tonnes of CO2 have been injected into oil reservoirsfor profitable EOR, and no serious leaks to the atmosphere have been reported.
34 Environmentally Conscious Petroleum Engineering
This widespread use of CO2 injection in the oil industry, where CO2 often istransported over land hundreds of miles in pipes, also proves that CO2 injectionis a method that has been accepted as safe by society. Currently, more than 400million tonnes CO2 per year are injected (Holt et al. 2000).
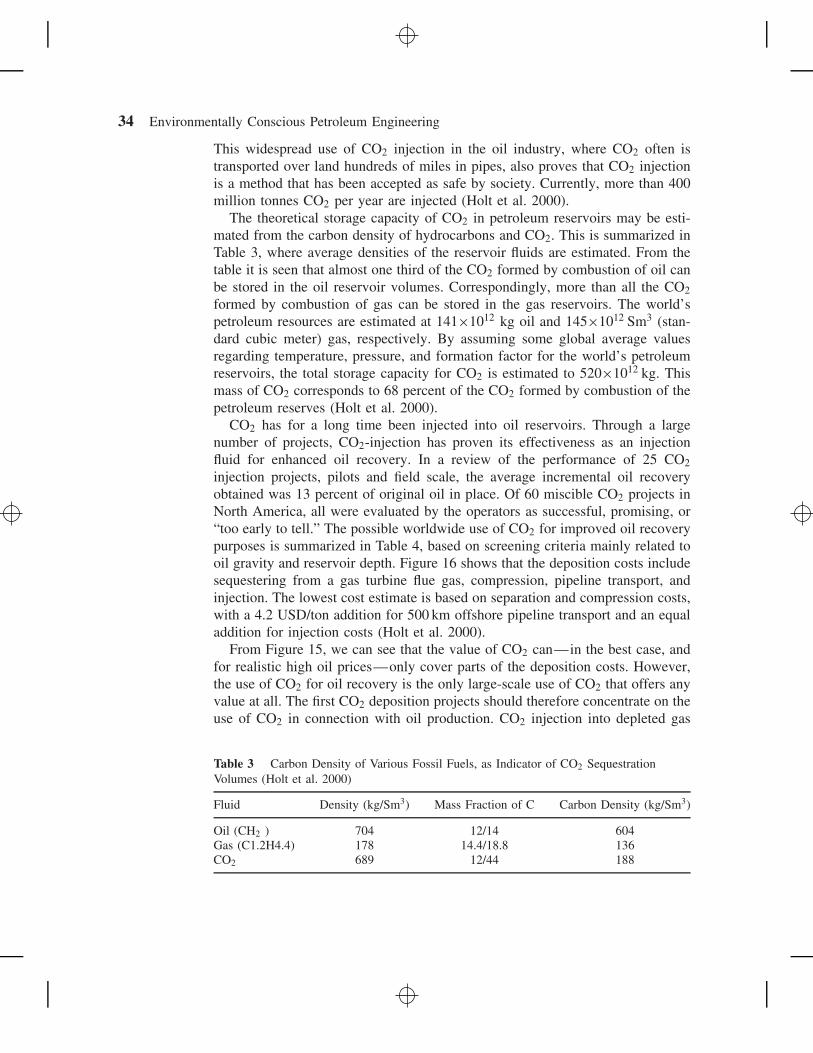
The theoretical storage capacity of CO2 in petroleum reservoirs may be esti-mated from the carbon density of hydrocarbons and CO2. This is summarized inTable 3, where average densities of the reservoir fluids are estimated. From thetable it is seen that almost one third of the CO2 formed by combustion of oil canbe stored in the oil reservoir volumes. Correspondingly, more than all the CO2
formed by combustion of gas can be stored in the gas reservoirs. The world’spetroleum resources are estimated at 141×1012 kg oil and 145×1012 Sm3 (stan-dard cubic meter) gas, respectively. By assuming some global average valuesregarding temperature, pressure, and formation factor for the world’s petroleumreservoirs, the total storage capacity for CO2 is estimated to 520×1012 kg. Thismass of CO2 corresponds to 68 percent of the CO2 formed by combustion of thepetroleum reserves (Holt et al. 2000).
CO2 has for a long time been injected into oil reservoirs. Through a largenumber of projects, CO2-injection has proven its effectiveness as an injectionfluid for enhanced oil recovery. In a review of the performance of 25 CO2
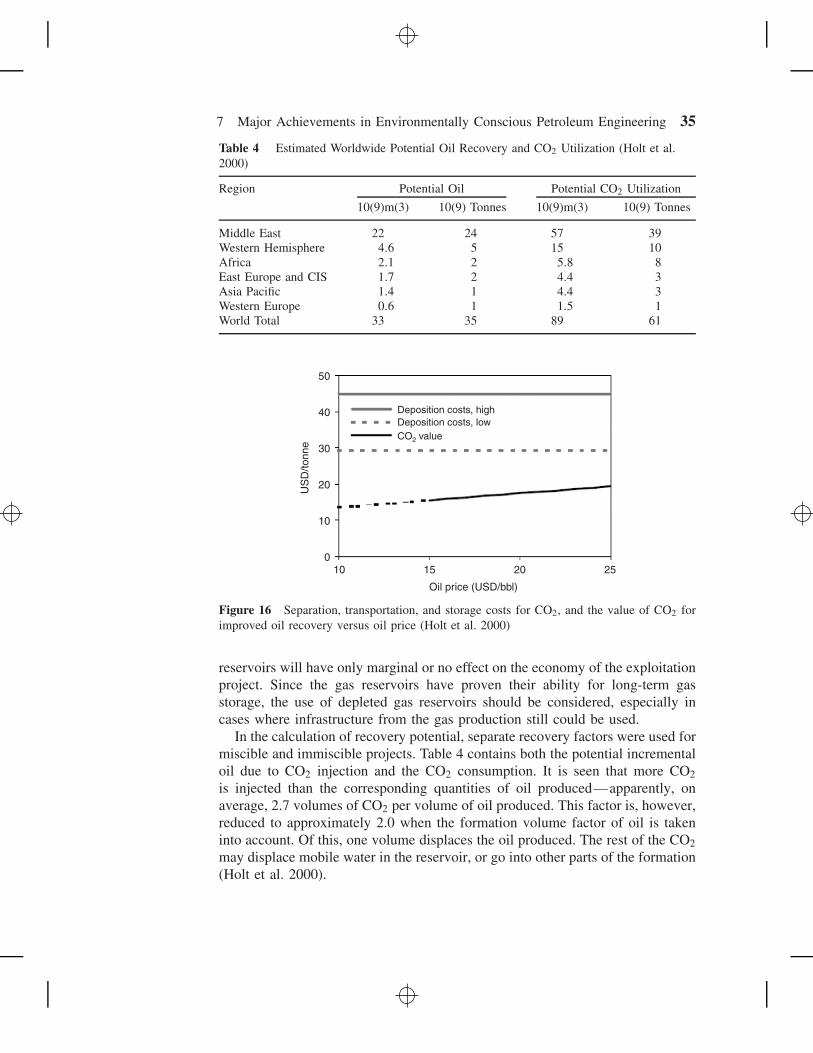
injection projects, pilots and field scale, the average incremental oil recoveryobtained was 13 percent of original oil in place. Of 60 miscible CO2 projects inNorth America, all were evaluated by the operators as successful, promising, or“too early to tell.” The possible worldwide use of CO2 for improved oil recoverypurposes is summarized in Table 4, based on screening criteria mainly related tooil gravity and reservoir depth. Figure 16 shows that the deposition costs includesequestering from a gas turbine flue gas, compression, pipeline transport, andinjection. The lowest cost estimate is based on separation and compression costs,with a 4.2 USD/ton addition for 500 km offshore pipeline transport and an equaladdition for injection costs (Holt et al. 2000).
From Figure 15, we can see that the value of CO2 can—in the best case, andfor realistic high oil prices—only cover parts of the deposition costs. However,the use of CO2 for oil recovery is the only large-scale use of CO2 that offers anyvalue at all. The first CO2 deposition projects should therefore concentrate on theuse of CO2 in connection with oil production. CO2 injection into depleted gas
Table 3 Carbon Density of Various Fossil Fuels, as Indicator of CO2 SequestrationVolumes (Holt et al. 2000)
Fluid Density (kg/Sm3) Mass Fraction of C Carbon Density (kg/Sm3)
Oil (CH2 ) 704 12/14 604Gas (C1.2H4.4) 178 14.4/18.8 136CO2 689 12/44 188
7 Major Achievements in Environmentally Conscious Petroleum Engineering 35
Table 4 Estimated Worldwide Potential Oil Recovery and CO2 Utilization (Holt et al.2000)
Region Potential Oil Potential CO2 Utilization
10(9)m(3) 10(9) Tonnes 10(9)m(3) 10(9) Tonnes
Middle East 22 24 57 39Western Hemisphere 4.6 5 15 10Africa 2.1 2 5.8 8East Europe and CIS 1.7 2 4.4 3Asia Pacific 1.4 1 4.4 3Western Europe 0.6 1 1.5 1World Total 33 35 89 61
50
40 Deposition costs, highDeposition costs, lowCO2 value
30
20
10
010 15
Oil price (USD/bbl)
20 25
US
D/to
nne
Figure 16 Separation, transportation, and storage costs for CO2, and the value of CO2 forimproved oil recovery versus oil price (Holt et al. 2000)
reservoirs will have only marginal or no effect on the economy of the exploitationproject. Since the gas reservoirs have proven their ability for long-term gasstorage, the use of depleted gas reservoirs should be considered, especially incases where infrastructure from the gas production still could be used.
In the calculation of recovery potential, separate recovery factors were used formiscible and immiscible projects. Table 4 contains both the potential incrementaloil due to CO2 injection and the CO2 consumption. It is seen that more CO2
is injected than the corresponding quantities of oil produced—apparently, onaverage, 2.7 volumes of CO2 per volume of oil produced. This factor is, however,reduced to approximately 2.0 when the formation volume factor of oil is takeninto account. Of this, one volume displaces the oil produced. The rest of the CO2
may displace mobile water in the reservoir, or go into other parts of the formation(Holt et al. 2000).
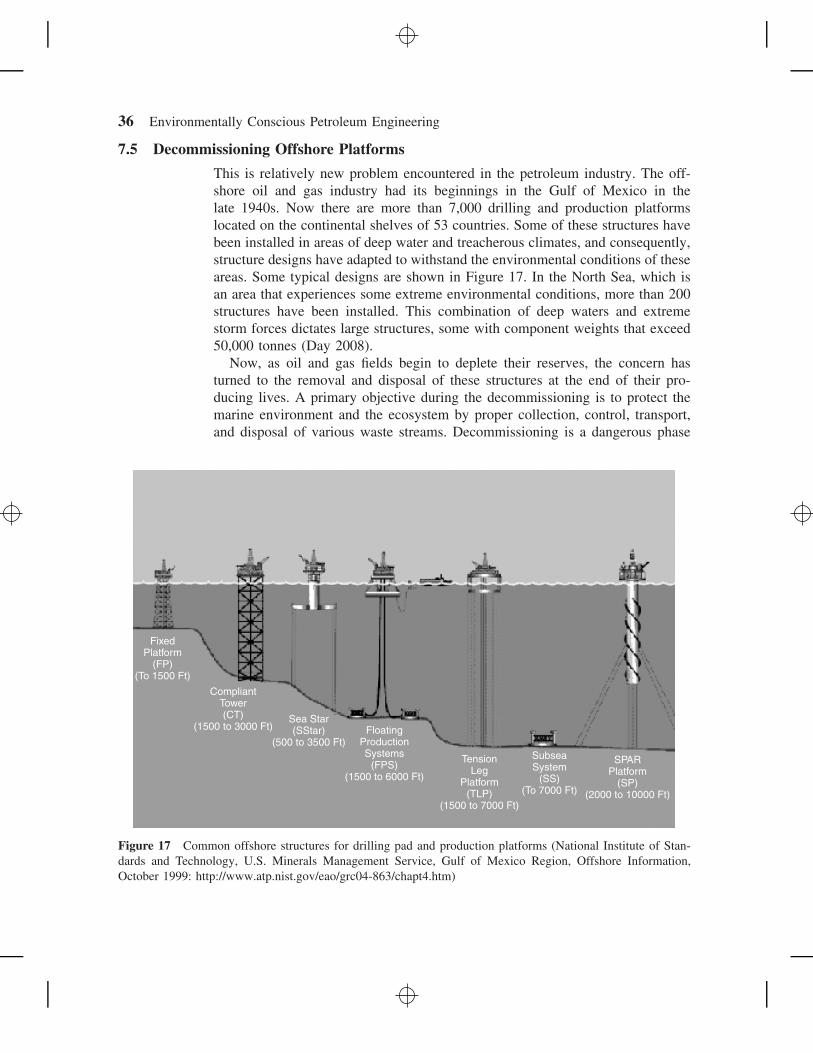
36 Environmentally Conscious Petroleum Engineering
7.5 Decommissioning Offshore Platforms
This is relatively new problem encountered in the petroleum industry. The off-shore oil and gas industry had its beginnings in the Gulf of Mexico in thelate 1940s. Now there are more than 7,000 drilling and production platformslocated on the continental shelves of 53 countries. Some of these structures havebeen installed in areas of deep water and treacherous climates, and consequently,structure designs have adapted to withstand the environmental conditions of theseareas. Some typical designs are shown in Figure 17. In the North Sea, which isan area that experiences some extreme environmental conditions, more than 200structures have been installed. This combination of deep waters and extremestorm forces dictates large structures, some with component weights that exceed50,000 tonnes (Day 2008).
Now, as oil and gas fields begin to deplete their reserves, the concern hasturned to the removal and disposal of these structures at the end of their pro-ducing lives. A primary objective during the decommissioning is to protect themarine environment and the ecosystem by proper collection, control, transport,and disposal of various waste streams. Decommissioning is a dangerous phase
FixedPlatform
(FP)(To 1500 Ft)
CompliantTower(CT)
(1500 to 3000 Ft)Sea Star(SStar)
(500 to 3500 Ft)Floating
ProductionSystems
(FPS)(1500 to 6000 Ft)
TensionLeg
Platform(TLP)
(1500 to 7000 Ft)
SubseaSystem
(SS)(To 7000 Ft)
SPARPlatform
(SP)(2000 to 10000 Ft)
Figure 17 Common offshore structures for drilling pad and production platforms (National Institute of Stan-dards and Technology, U.S. Minerals Management Service, Gulf of Mexico Region, Offshore Information,October 1999: http://www.atp.nist.gov/eao/grc04-863/chapt4.htm)
7 Major Achievements in Environmentally Conscious Petroleum Engineering 37
of the abandonment operation and creates the possibility of environmental pol-lution. Platform decommissioning will result in large amounts of waste liquidsand solids. Many platforms will have chemical treatment additives, as well aspossible toxic/hazardous materials such as methanol, biocides, antifoams, oxygenscavengers, corrosion inhibitors, paints, and solvents, some of which may causedamage to the marine environment if accidentally discharged (Day 2008).
Estimates indicate that the cost of some removals may exceed the cost of theoriginal installation. Innovative removal and disposal techniques must be devel-oped to limit costs and minimize the impact on the environment. Internationallaw provides the basic foundation of the legal requirements for the removal anddisposal of offshore structures. The removal of installations was addressed by the1958 Geneva Convention on the Continental Shelf , which stated that any installa-tions that are abandoned or disused must be entirely removed. However, severalparties to the Convention were soon adopting some form of local standards toallow for partial or nonremoval. The more widely accepted statement of interna-tional law is contained in the United Nations Convention on the Law of the Sea(UNCLOS), which allows for partial removal and has been widely accepted as itappears to represent customary international law in relation to abandonment. TheInternational Maritime Organization (IMO) guidelines were issued using UNC-LOS as a basis. These guidelines state that if the structure exists in less than75 m of water and weighs less than 4,000 tonnes, it must be totally removed.Structures installed after January 1988 will have a water depth criterion of 100 m,forcing the owner to plan for the eventual abandonment in the initial design. Ifthe removal is done partially, the installation must maintain a 55 m clear watercolumn. There are exceptions in the guideline that allow for nonremoval, such asif the structure can serve a new use, including enhancement of a living resource;if the structure can be left without causing undue interference with other uses ofthe sea; or where removal is technically not feasible or an unacceptable risk tothe environment or personnel. If the installation is to remain in place, it must beadequately maintained to prevent structural failure (Day 2008).
In general, the entire abandonment process of offshore platforms consists ofseven steps:
1. Well abandonment. This involves the permanent plugging and abandon-ment of nonproductive well bores.
2. Acquiring environmental permits.3. Engineering. An abandonment plan must be developed.4. Decommissioning. All process equipment and facilities are shut down.
Waste streams and associated activities are removed to ready the platformfor a safe and environmentally sound demolition.
5. Structure removal. The deck or floating production facility is removedfrom the site, followed by removal of the jacket, bottom tether structures,or gravity base.
38 Environmentally Conscious Petroleum Engineering
6. Disposal. This phase involves the disposal, recycle, or reuse of platformcomponents onshore or offshore.
7. Site clearance. This includes final cleanup of sea-floor debris.
Disposal MethodsOnce a platform or portions of a platform have been removed, the structure mustbe disposed of. Some disposal options include the following:
• Onshore transport. Generally, topside deck facilities will be disposed ofinshore because of the difficulty and expense in completely removing allof the hydrocarbons and their byproducts at the installation site rather thanshore side. When disposal inshore is chosen, the structural component willbe either totally or partially cut up for scrap.
• Toppling in place, or emplacement. This method is generally performedafter the topsides have been removed. The legs are severed selectively sothat the jacket can be toppled with two legs acting as hinges. The toppledstructure must maintain 55 m of clear water column clearance as requiredby the International Maritime Organization (IMO) guidelines. Emplace-ment is much the same procedure as toppling except that the top sectionis completely cut from the lower section, lifted off and placed next to thelower section.
• Disposal to reef site. It has been estimated by the Gulf of Mexico FisheryManagement Council that oil and gas structures account for 23 percent ofthe hard bottom habitat in that area (Day 2008). Therefore, prior to theemplacement of petroleum-related structures, suitable habitats in whichnew species could expand their range did not exist. Countries may estab-lish a rigs-to-reef program to maintain the hard bottom habitats that thesestructures provide.
• Deep-water dumping. This method is particularly reserved for huge floatingsystems located in the North Sea. Essentially, the structure is disconnectedfrom its moorings and towed to the deep ocean waters, where it is thenflooded and sunk. Prior to any dumping operations, all components placedin the ocean waters must be free of hydrocarbons in harmful quantities toavoid pollution of the open sea.
The final phase of the abandonment process involves restoration of the siteto its original predevelopment conditions by clearing the seafloor of debris andobstructions after platform removal, leaving the site trawlable (in shallow areas)and safe for fishing or other maritime uses. Deeper water sites may not requiretrawling simulations to clear the area.
The successful abandonment and disposal requires awareness of the socialand political climate in the region, since public perception will play a key role

8 Trends of Environmental Impact in the E&P Industry 39
in performing a successful disposal program. This necessitates that theenvironmental issues should be addressed by the operator up front, keeping inthe loop all stakeholder groups and regulatory agencies with transparent disposalplans and environmental effects of the plan and alternative plans (Day 2008).
8 TRENDS OF ENVIRONMENTAL IMPACT IN THE E&PINDUSTRY
For more than 100 years, oilfield science and technology have been continuallyimproving. The oil industry has evolved from one that was interested mainly ininventing tools and equipment to one that is not only economically, but also envi-ronmentally, conscious. In the 1980s, low oil prices forced oilfield technologyto focus on economic efficiency and productivity. Simultaneously, environmen-tal regulatory pressure added a new factor to petroleum engineering economics:the cost of working within the constraints of an environmental issue. InitialE&P industry activities for environmental protection were motivated by graduallytightening environmental regulations, being felt a burden to corporate profitabil-ity. There has been a paradigm shift, however, in that environmental performanceis now considered by many oil operators as a potentially important contributorto the bottom line.
8.1 Progress in Environmental Compliance
In the 1990s, the industry has absorbed this cost and made a considerable progressin pollution control. In this short span of time, environmental management hasalso shifted gears from end-of-pipe pollution control toward pollution prevention.A great stride in technological explosions has caused this transformed in environ-mental management in the oil industry. Progress in oilfield technology, includingmodifications and improvements has been directed, of course, primarily towardproductivity enhancement. Improved environmental performances have spun offin the process. This shift of focus can be judged from three facts, which shouldbe taken in the backdrop of sevenfold increase in the average new discovery ofoil and gas reserves compared to that in the late 1980s (Wojtanowicz 2008a,b,c;EIA 2004):
1. Since the early 1990s, emissions of air toxics decreased by almost 24percent.
2. The rate of annual wetland losses decreased from almost 500,000 acresper year three decades ago to less than 100,000 acres per year, on average,since 1986.
3. Between 1991 and 1997, volumes of the 17 most toxic chemicals inhazardous waste fell 44 percent.
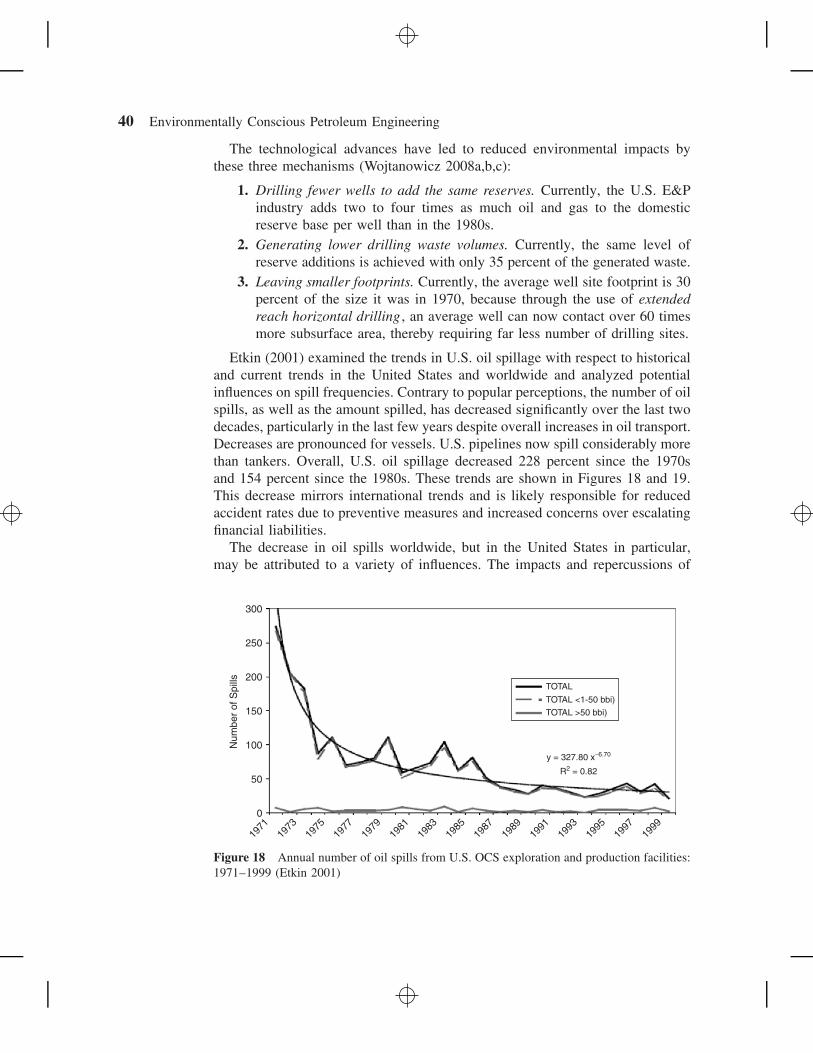
40 Environmentally Conscious Petroleum Engineering
The technological advances have led to reduced environmental impacts bythese three mechanisms (Wojtanowicz 2008a,b,c):
1. Drilling fewer wells to add the same reserves. Currently, the U.S. E&Pindustry adds two to four times as much oil and gas to the domesticreserve base per well than in the 1980s.
2. Generating lower drilling waste volumes. Currently, the same level ofreserve additions is achieved with only 35 percent of the generated waste.
3. Leaving smaller footprints. Currently, the average well site footprint is 30percent of the size it was in 1970, because through the use of extendedreach horizontal drilling , an average well can now contact over 60 timesmore subsurface area, thereby requiring far less number of drilling sites.
Etkin (2001) examined the trends in U.S. oil spillage with respect to historicaland current trends in the United States and worldwide and analyzed potentialinfluences on spill frequencies. Contrary to popular perceptions, the number of oilspills, as well as the amount spilled, has decreased significantly over the last twodecades, particularly in the last few years despite overall increases in oil transport.Decreases are pronounced for vessels. U.S. pipelines now spill considerably morethan tankers. Overall, U.S. oil spillage decreased 228 percent since the 1970sand 154 percent since the 1980s. These trends are shown in Figures 18 and 19.This decrease mirrors international trends and is likely responsible for reducedaccident rates due to preventive measures and increased concerns over escalatingfinancial liabilities.
The decrease in oil spills worldwide, but in the United States in particular,may be attributed to a variety of influences. The impacts and repercussions of
300
250
200
150
TOTAL
y = 327.80 x−6.70
TOTAL <1-50 bbi)
TOTAL >50 bbi)
100
50
0
1971
1973
1975
1977
1979
1981
1983
1985
1987
1989
1991
1993
1995
1997
1999
Num
ber
of S
pills
R2 = 0.82
Figure 18 Annual number of oil spills from U.S. OCS exploration and production facilities:1971–1999 (Etkin 2001)
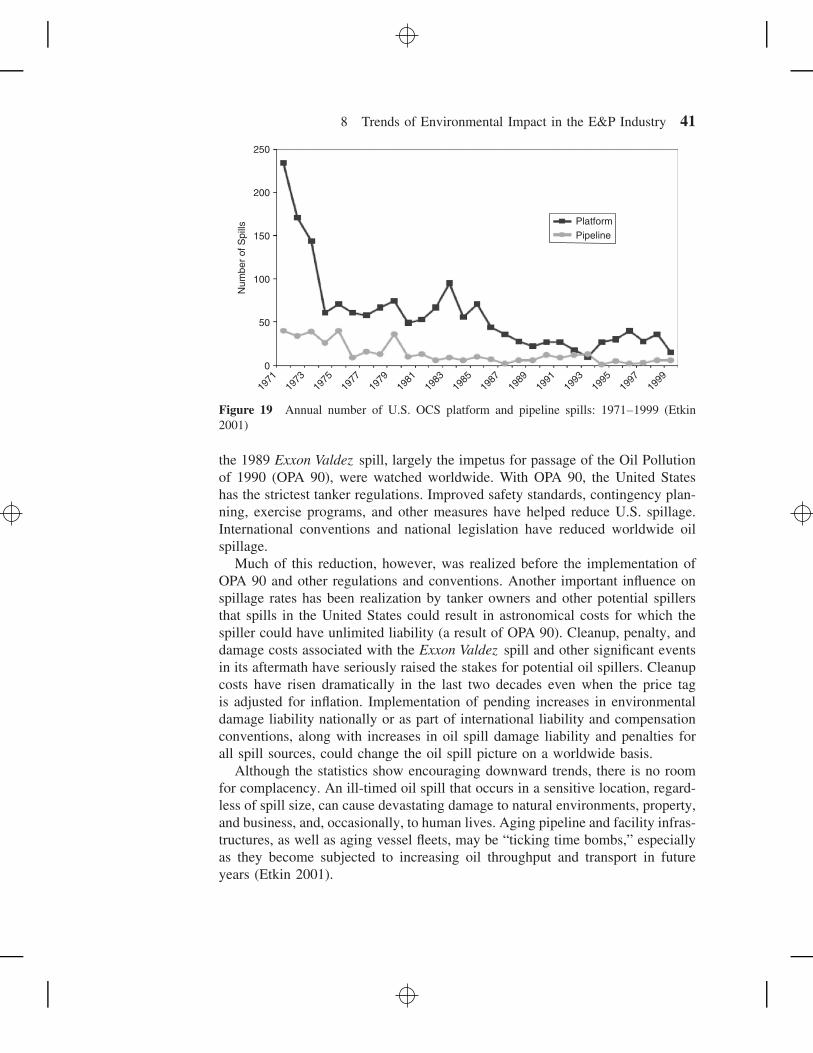
8 Trends of Environmental Impact in the E&P Industry 41
250
200
150
PlatformPipeline
100
50
0
Num
ber
of S
pills
1971
1973
1975
1977
1979
1981
1983
1985
1987
1989
1991
1993
1995
1997
1999
Figure 19 Annual number of U.S. OCS platform and pipeline spills: 1971–1999 (Etkin2001)
the 1989 Exxon Valdez spill, largely the impetus for passage of the Oil Pollutionof 1990 (OPA 90), were watched worldwide. With OPA 90, the United Stateshas the strictest tanker regulations. Improved safety standards, contingency plan-ning, exercise programs, and other measures have helped reduce U.S. spillage.International conventions and national legislation have reduced worldwide oilspillage.
Much of this reduction, however, was realized before the implementation ofOPA 90 and other regulations and conventions. Another important influence onspillage rates has been realization by tanker owners and other potential spillersthat spills in the United States could result in astronomical costs for which thespiller could have unlimited liability (a result of OPA 90). Cleanup, penalty, anddamage costs associated with the Exxon Valdez spill and other significant eventsin its aftermath have seriously raised the stakes for potential oil spillers. Cleanupcosts have risen dramatically in the last two decades even when the price tagis adjusted for inflation. Implementation of pending increases in environmentaldamage liability nationally or as part of international liability and compensationconventions, along with increases in oil spill damage liability and penalties forall spill sources, could change the oil spill picture on a worldwide basis.
Although the statistics show encouraging downward trends, there is no roomfor complacency. An ill-timed oil spill that occurs in a sensitive location, regard-less of spill size, can cause devastating damage to natural environments, property,and business, and, occasionally, to human lives. Aging pipeline and facility infras-tructures, as well as aging vessel fleets, may be “ticking time bombs,” especiallyas they become subjected to increasing oil throughput and transport in futureyears (Etkin 2001).
42 Environmentally Conscious Petroleum Engineering
There is no denying that environmental performance is an important factorimpacting corporate image. Petroleum industry is particularly vulnerable to pub-lic image because, on one hand, it must seek public approval for accessinggeographical areas and developing natural reserves, while on the other hand,its image can be easily damaged by highly visible accidents of oil spills orwell blowouts. Moreover, the investment community now considers a company’senvironmental performance in corporate assessments. The petroleum industry isexpected to perform concurrently in three areas: productivity, environment, andsociety. This triple bottom line concept operates on the principle that better per-formance of one of the three pillars—representing economic, environmental, andsocial considerations—cannot be considered substitutable for underperformancein another (Whitaker 1999). Therefore, a successful technological progress mustaddress a technology that combines productivity advantage with environmentalprotection and, as such, makes the operator accountable to the public.
8.2 Integration of Environmental Impact Assessmentand Environmental Management
Environmental impact assessment (EIA) for upstream oil and gas projects hasa history that extends for at least 30 years. Initially, they were only requiredin a handful of highly regulated environments. Now, it is a rarity to find amajor oil and gas project anywhere in the world that is not required, either bylegislation or corporate standards, to undertake an EIA. They are now almostuniversally expected not as a part of doing business, but as an integral part ofdoing business the right way. EIA practices including methodologies, interpre-tation of data, and determination of levels of significance are well developed.Mitigation measures are standardized in many circumstances, and comparisonsacross companies, industries, and countries are relatively easy.
9 CALIFORNIA: A SHOWCASE FOR ENVIRONMENTLYCONSCIOUS PETROLEUM ENGINEERING
The state of California is a showcase of environmentally conscious petroleumengineering, where both public and government awareness and control vis-a-visE&P industry initiatives have created many examples of minimizing environ-mental impacts to acceptable limits.
9.1 California Department of Conservation
The California Department of Conservation started as California Division of Oiland Gas in 1915 in the early days of oil for the purpose of supervising the drilling,operation, maintenance, and abandonment of wells to prevent waste or damageto oil and gas deposits. These duties were expanded in 1931 to include wellspacing regulation and freshwater protection. But it took a long time before moreserious attention to environment was given. In 1970, the Public Awareness Code
9 California: A Showcase for Environmently Conscious Petroleum Engineering 43
was amended to include the responsibility of preventing “damage to life, health,property . . . . By reason of the drilling operation, maintenance or abandonmentof wells .” The Department issued written guidelines for oil operators regardingsuch environmental problems as oil field sump construction and placement, wastefluid transport, tank settings, waste disposal, production leakage, air pollution,hazardous operations, and scenic values (California Department of Conservation2007).
The first instance of oil operator initiatives to protect the environment canbe traced back to 1932, when several oil companies formed the Valley WasteDisposal, Inc. in Kern Country. The nonprofit corporation was responsible fordisposing of a portion of oil field waste fluids. Many oil companies undertooksuch activities as fencing or filling sumps that were located in natural drainagechannels or those that have shown wildlife loss. But a government report pub-lished in 1973 shows the gap between what have been done and what is expected(California Department of Conservation 2007):
Over the last twenty years and primarily since 1969, the oil industry has oftenbeen the focus of considerable public criticism regarding its treatment of the envi-ronment, but little constructive advice has been offered to help alleviate and solveproblems. . . . . After 80 years of indiscriminate drilling and production techniques,the oil industry needs to work more with its surroundings, to act as a habitat andwildlife preserver, and to properly manage all the resources over which it haspurview.
9.2 Long Beach, California, Production Operations
As already shown, the 1970s is the decade for the surge of public conscious-ness for environment, heralded by William H. Curry (president, AmericanAssociation for Petroleum Geologists) early in 1971: “Environment, Ecology,Pollution—these are called the bywords of today!” (Allen 1972).
Unlike other industries, the unique problem with the petroleum upstreamindustry is that petroleum is where you find it, and the drilling and produc-ing operations cannot be moved to an area zoned for heavy industries. Yet thecity of Long Beach, California, created an environmental showcase in coopera-tion with a consortium of oil companies (THUMS Long Beach Co., which standfor five oil companies, namely, Texaco, Humble, Union, Mobil, and Shell) in the1970s in order to control a host of environmental problems related to oil drillingand production (Allen, 1972). The company operates the eastern offshore sectionof California’s Wilmington oil field (which lies beneath Long Beach Harbor),having produced 930 million barrels of oil equivalent from the Wilmington field,with an estimated 100 million barrels still to be recovered (California Departmentof Conservation 2007; Hoovers 2009).
One of the earliest environmental problems tackled was land subsidencecaused by oil withdrawal from subterranean geological structures. Landsubsidence is a major problem because the center of the Wilmington oil field is
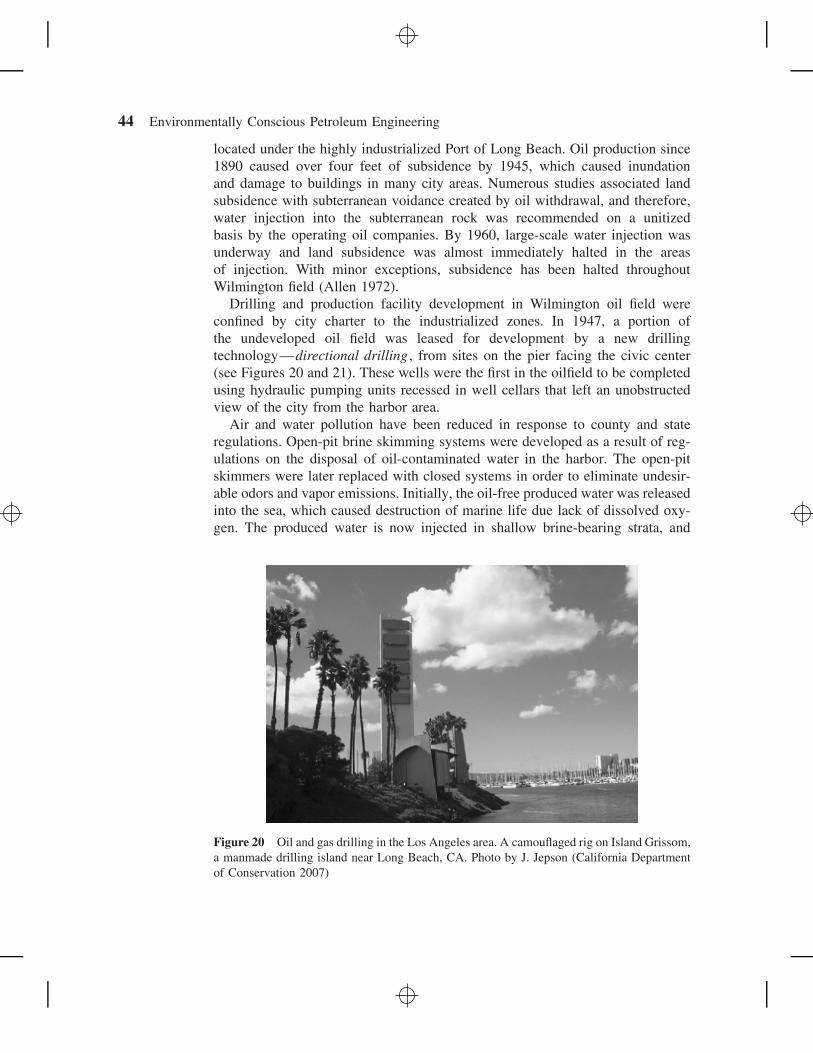
44 Environmentally Conscious Petroleum Engineering
located under the highly industrialized Port of Long Beach. Oil production since1890 caused over four feet of subsidence by 1945, which caused inundationand damage to buildings in many city areas. Numerous studies associated landsubsidence with subterranean voidance created by oil withdrawal, and therefore,water injection into the subterranean rock was recommended on a unitizedbasis by the operating oil companies. By 1960, large-scale water injection wasunderway and land subsidence was almost immediately halted in the areasof injection. With minor exceptions, subsidence has been halted throughoutWilmington field (Allen 1972).
Drilling and production facility development in Wilmington oil field wereconfined by city charter to the industrialized zones. In 1947, a portion ofthe undeveloped oil field was leased for development by a new drillingtechnology—directional drilling , from sites on the pier facing the civic center(see Figures 20 and 21). These wells were the first in the oilfield to be completedusing hydraulic pumping units recessed in well cellars that left an unobstructedview of the city from the harbor area.
Air and water pollution have been reduced in response to county and stateregulations. Open-pit brine skimming systems were developed as a result of reg-ulations on the disposal of oil-contaminated water in the harbor. The open-pitskimmers were later replaced with closed systems in order to eliminate undesir-able odors and vapor emissions. Initially, the oil-free produced water was releasedinto the sea, which caused destruction of marine life due lack of dissolved oxy-gen. The produced water is now injected in shallow brine-bearing strata, and
Figure 20 Oil and gas drilling in the Los Angeles area. A camouflaged rig on Island Grissom,a manmade drilling island near Long Beach, CA. Photo by J. Jepson (California Departmentof Conservation 2007)
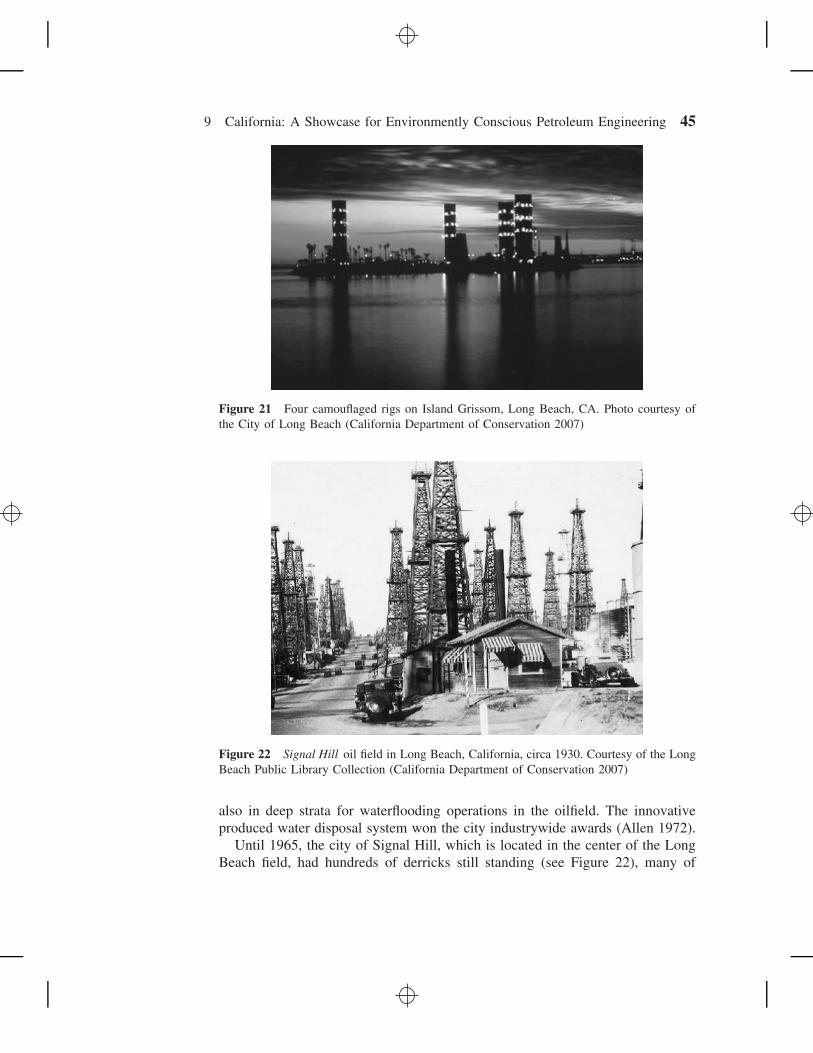
9 California: A Showcase for Environmently Conscious Petroleum Engineering 45
Figure 21 Four camouflaged rigs on Island Grissom, Long Beach, CA. Photo courtesy ofthe City of Long Beach (California Department of Conservation 2007)
Figure 22 Signal Hill oil field in Long Beach, California, circa 1930. Courtesy of the LongBeach Public Library Collection (California Department of Conservation 2007)
also in deep strata for waterflooding operations in the oilfield. The innovativeproduced water disposal system won the city industrywide awards (Allen 1972).
Until 1965, the city of Signal Hill, which is located in the center of the LongBeach field, had hundreds of derricks still standing (see Figure 22), many of
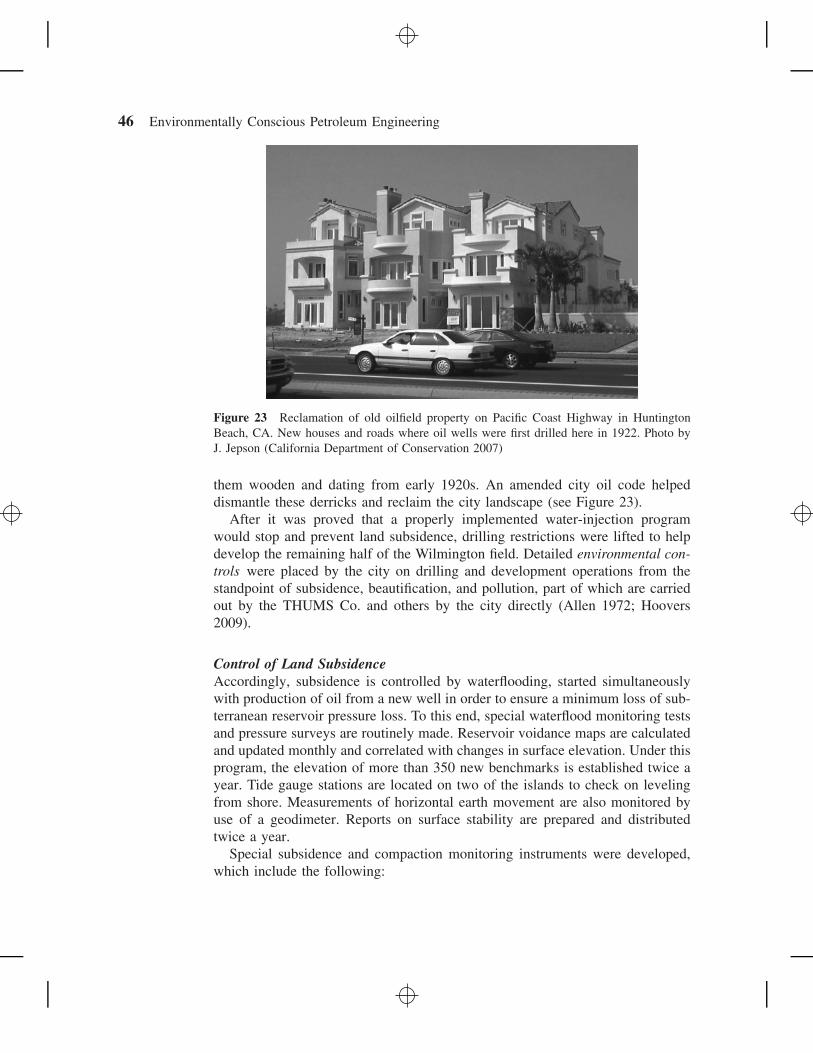
46 Environmentally Conscious Petroleum Engineering
Figure 23 Reclamation of old oilfield property on Pacific Coast Highway in HuntingtonBeach, CA. New houses and roads where oil wells were first drilled here in 1922. Photo byJ. Jepson (California Department of Conservation 2007)
them wooden and dating from early 1920s. An amended city oil code helpeddismantle these derricks and reclaim the city landscape (see Figure 23).
After it was proved that a properly implemented water-injection programwould stop and prevent land subsidence, drilling restrictions were lifted to helpdevelop the remaining half of the Wilmington field. Detailed environmental con-trols were placed by the city on drilling and development operations from thestandpoint of subsidence, beautification, and pollution, part of which are carriedout by the THUMS Co. and others by the city directly (Allen 1972; Hoovers2009).
Control of Land SubsidenceAccordingly, subsidence is controlled by waterflooding, started simultaneouslywith production of oil from a new well in order to ensure a minimum loss of sub-terranean reservoir pressure loss. To this end, special waterflood monitoring testsand pressure surveys are routinely made. Reservoir voidance maps are calculatedand updated monthly and correlated with changes in surface elevation. Under thisprogram, the elevation of more than 350 new benchmarks is established twice ayear. Tide gauge stations are located on two of the islands to check on levelingfrom shore. Measurements of horizontal earth movement are also monitored byuse of a geodimeter. Reports on surface stability are prepared and distributedtwice a year.
Special subsidence and compaction monitoring instruments were developed,which include the following:

9 California: A Showcase for Environmently Conscious Petroleum Engineering 47
• Precision casing string joint-length measuring tool for detecting possibledeep compaction
• Test wells for measuring shallow compaction by a cable extensometer.
All data are continually reviewed and operational measures are taken whennecessary to ensure that no subsidence occurs (Allen 1972).
Control of Water PollutionSince the THUMS artificial drilling islands were to be constructed directly off-shore from the civic center and beaches, special care had to be exercised toavoid water pollution. The city adopted a policy of not allowing dumping orrun-off of water over the side. This included storm water that might pick up oilywastes. All solid wastes, such as drill cuttings, are collected and barged away fordumping. Oil-stained wastewater is removed by vacuum truck or sent ashore bypipeline. All liquid production is piped to shore for separation, and after filteringsent back to the islands for reinjection into the oil zones. These pipelines arecoated, as well as fitted with cathodic protection devices against corrosion andpressure-sensitive automatic shut-off valves.
Weekly aerial inspections are made from a helicopter to locate spills or leaks.In addition, emergency spill containment measures, such as floating boom equip-ment, is kept on each drilling island, ready to be use to corral any leak or spillthat might occur despite all precautions. Tug boats and other marine equipmentare always kept ready for placing the floating booms. A coordinated oil-spilldisaster program has been established that, if needed, can deploy and integratethe services of all major parties—both public and private (Allen 1972).
Control of Air PollutionVapor-recovery systems are installed on all tank facilities; this not only keepsthe air clean but also generates revenue from the sale of recovered hydrocarbonproducts. Traces of hydrogen sulfide gas (H2S) are extracted from all producedgas before marketing in order to reduce or eliminate undesirable odors. To thisend, the produced gas is processed in a plant at the industrial zone.
Control of Noise and Visual PollutionThe drilling rig enclosures on Island Grissom and Island White are all sound-proofed, electric-powered, and self-contained structures that are moved from drillsite location to location on rails. Noise level is checked using a decibel meter.
Prevention of Oil SpillsThe manmade drilling islands were constructed to contain spills from any leakaround a well. Surface conductor pipe was set from ground surface to 800 to 1,000feet on all wells, exceeding required standards. Multiple blowout preventer (BOP)
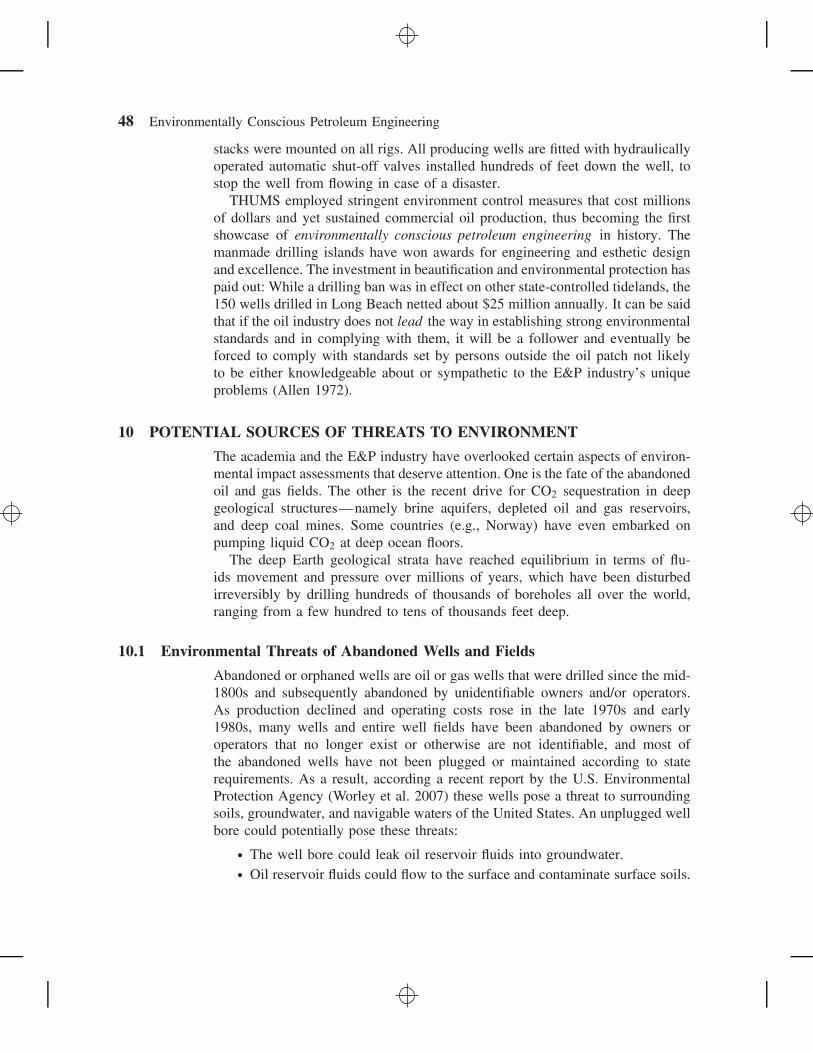
48 Environmentally Conscious Petroleum Engineering
stacks were mounted on all rigs. All producing wells are fitted with hydraulicallyoperated automatic shut-off valves installed hundreds of feet down the well, tostop the well from flowing in case of a disaster.
THUMS employed stringent environment control measures that cost millionsof dollars and yet sustained commercial oil production, thus becoming the firstshowcase of environmentally conscious petroleum engineering in history. Themanmade drilling islands have won awards for engineering and esthetic designand excellence. The investment in beautification and environmental protection haspaid out: While a drilling ban was in effect on other state-controlled tidelands, the150 wells drilled in Long Beach netted about $25 million annually. It can be saidthat if the oil industry does not lead the way in establishing strong environmentalstandards and in complying with them, it will be a follower and eventually beforced to comply with standards set by persons outside the oil patch not likelyto be either knowledgeable about or sympathetic to the E&P industry’s uniqueproblems (Allen 1972).
10 POTENTIAL SOURCES OF THREATS TO ENVIRONMENT
The academia and the E&P industry have overlooked certain aspects of environ-mental impact assessments that deserve attention. One is the fate of the abandonedoil and gas fields. The other is the recent drive for CO2 sequestration in deepgeological structures—namely brine aquifers, depleted oil and gas reservoirs,and deep coal mines. Some countries (e.g., Norway) have even embarked onpumping liquid CO2 at deep ocean floors.
The deep Earth geological strata have reached equilibrium in terms of flu-ids movement and pressure over millions of years, which have been disturbedirreversibly by drilling hundreds of thousands of boreholes all over the world,ranging from a few hundred to tens of thousands feet deep.
10.1 Environmental Threats of Abandoned Wells and Fields
Abandoned or orphaned wells are oil or gas wells that were drilled since the mid-1800s and subsequently abandoned by unidentifiable owners and/or operators.As production declined and operating costs rose in the late 1970s and early1980s, many wells and entire well fields have been abandoned by owners oroperators that no longer exist or otherwise are not identifiable, and most ofthe abandoned wells have not been plugged or maintained according to staterequirements. As a result, according a recent report by the U.S. EnvironmentalProtection Agency (Worley et al. 2007) these wells pose a threat to surroundingsoils, groundwater, and navigable waters of the United States. An unplugged wellbore could potentially pose these threats:
• The well bore could leak oil reservoir fluids into groundwater.• Oil reservoir fluids could flow to the surface and contaminate surface soils.
10 Potential Sources of Threats to Environment 49
• Oil reservoir fluids could discharge into the navigable waters of the UnitedStates.
• The open well hole could present a public safety hazard.
The orphan well is a category of abandoned wells, which is in the larger contextof idle wells. Some idle wells have identifiable owners who are responsible forthe well until the end of its productive life and through its plugging.
There are thousands of orphan wells in the oil-producing states, many of whichare creating environmental hazards. Additionally, orphan wells represent a smallpercentage of idle wells in the United States, and the majority of these wells donot pose a risk to human health and environment.
The environmental problem lies in the fact that these wells were not properlycleaned out and plugged before they were abandoned, and thus pose the threatof leaking fluids or gases from the reservoirs to which they lead. Oilfield theft ofwellheads, valves, and pumping equipment has exacerbated the problem.
These idle wells can be idled with state approval, where they are deemed ashaving economic potential once the prices of the natural resource rises to a levelthat is profitable to resume production, or they can be without state approval, inwhich case they differ from orphan only in that they have an identifiable ownerwith responsibility over its proper handling.
It may be difficult to garner additional support from the E&P industry toshoulder the burden of producing revenues for the orphan well plugging fundsdue to issues of equity.
Most states have established abandoned well-plugging funds or orphanwell-plugging funds using revenues from fines, penalties, taxes on the gas andpetroleum industry, and so on. The current trend of extracting revenues forgenerating and sustaining orphaned well funds from the petroleum industry isnot the most viable option for addressing such a large problem. The amount offunding required will take hundreds of years to collect. The cost of plugging anabandoned or orphan well varies widely. It can range from less than $1,000 tomore than $250,000, depending on the depth of the well, the ease or difficultyof access to the well location, obstructions in the well bore, cave-ins in oraround the well, stuck casing or tubing, and other factors. For example, by theend of 1997, Pennsylvania had spent $2,196,677.49 plugging 94 orphan wells.At that time, there were approximately 7,554 orphan wells still remaining to beplugged, 550 of which were known to be threatening the environment. However,in January 1998, there was only a balance of $119,101.56 in Pennsylvania’swell-plugging funds, and the state only generates approximately $300,000 inrevenues per year to add to the funds. Thus, the expense of plugging thesewells exceeds Pennsylvania capacity to generate timely and adequate revenuesfor its abandoned or orphan well-plugging funds. Using of Pennsylvania asan example, the expense of plugging wells exceeds most states’ financialcapabilities as well (Woorley et al. 2001).
50 Environmentally Conscious Petroleum Engineering
Cement-Plug Deterioration over Long TermThe integrity of groundwater aquifers must be maintained and protected to pre-serve our groundwater resources. This goal can be achieved by properly casingand cementing new production and injection wells, as well as cement-pluggingabandoned or old wells based on knowledge of the well site’s soils and geology.If these abandoned water wells are not properly sealed, they can provide a directconduit for surface water carrying pollutants to groundwater. Proper plugging ofwells restores barriers to contamination.
In theory, well construction requires that the subsurface isolation of aquifersand other strata to be restored with annular seals (casing pipe—backed bycement, grout, and resin mixtures). Failure of these seals would provide conduitsfor vertical transport of pollutants. The pollutants may originate from either well-bore fluids (drilling mud or injected wastewater) or formation fluids (oil, gas, orbrine).
Pollution is caused by the loss of external integrity of injection or productionwells resulting in upward migration of fluids outside cemented well bores. Pollu-tion of air, surface waters, or groundwater aquifers may result from the migrationof produced petroleum hydrocarbons, injected brines, or other toxic waste fluids.The migration takes place in the annular space between the well casing stringand borehole walls. This phenomenon has long been known in petroleum ter-minology as fluid cross-flow, channeling , or gas migration . Most of these termsrefer to the failure of well cements (Wojtanowicz 2008a,b,c).
In recent years, annular seal integrity has been achieved through improvementsin well cementing technology in three main areas:
1. Steel–cement bonding techniques2. Mud displacement practices3. Cement slurry design to prevent fluids from migrating after placement
The most recent techniques have been developed to prevent the formationof channels due to gas migration in annuli after cementing. As the annularcement—still in liquid state—loses hydrostatic pressure, the well becomesunder-balanced, and formation gas invades the slurry and finds its wayupward, resulting in the loss of well’s integrity. Cement slurry vibrationusing a low-frequency cyclic pulsation is used by the construction industryfor improving quality of cement in terms of better compaction, compressivestrength, and fill-up. In the oil industry, the idea of keeping cement slurry inmotion after placement has been postulated a promising method for prolongingslurry fluidity in order to sustain hydrostatic pressure and prevent entry of gasinto the well’s annulus (Wojtanowicz 2008a,b,c).
Industrial use of the technology has been carried out by two companies inthree oilfields of Eastern Alberta, Canada (Woorley et al. 2001). It is reportedthat the top pulsation method showed a 91 percent success rate in preventing gasflow after cementing.
10 Potential Sources of Threats to Environment 51
Casing CorrosionUnderground casing strings, along with the cement sheathes behind them, serveas effective barriers to interstrata fluid migrations and leaks to the surface. Thecasing strings are regularly protected against corrosion, to which they are par-ticularly subject because of the salt water, by cathodic protection method. Thecathodic protection system is usually in place during the active life of a well,production, or injection. The system requires supply of electricity as a utilityand subsurface wiring. Without the cathodic protection system, the buried casingstrings are vulnerable to a high rate of corrosion, rendering them unfit for thepurpose for which they were placed. The cathodic protection system can keepthe casing strings during the expected life of the well, usually 20 years. Oncethe well is abandoned, including the cathodic protection system, the casing pipesdeteriorate rapidly, and soon after, pressure leaks develop at locations undergoingmaximum metal removal from corrosion.
Therefore, the fate of the wells abandoned for decades does not require agenius to imagine. As a matter of fact, thousands of abandoned wells have beenfound to have caused environmental havocs. These are briefly reported in thefollowing case study.
Case Study of Abandoned Wells in the United StatesSince the first commercial oil well was drilled in Pennsylvania in 1859, DEPestimates as many as 350,000 oil and gas wells have been drilled in the com-monwealth, with many of those wells having been abandoned without properplugging (Rathbun 2009).
It was not until the mid-1960s that the oil-producing states in the United Statesenacted regulations to protect freshwater supplies by requiring that hundredsof feet of cement be poured into the wells at different levels in the processof closing them properly. A majority of the wells listed as plugged in Texasrecords were plugged before the rules were in place. Brine pumped up withoil had been disposed in open pits from the 1920s to 1960, when that use ofpits was prohibited. There were at least 44 abandoned, unplugged wells in thefield, and since 1972 brine had been pumped through injection wells at highpressures.
Suro (1992) reported that from the Louisiana bayous to the arid plains ofTexas and Oklahoma, thousands of oil and gas wells, abandoned at the end oftheir productive life, have become conduits for noxious liquids that bubble upfrom deep below the earth’s surface to kill crops and taint drinking water. Forstate governments in America’s oil patch, these abandoned wells have becomean expensive legacy left by a fading industry.
The Federal Environmental Protection Agency estimates that there are about1.2 million abandoned oil and gas wells nationwide and that some 200,000 ofthem may not be properly plugged. In Texas alone, officials calculate there are40,000 to 50,000 abandoned wells that could pose pollution problems.

52 Environmentally Conscious Petroleum Engineering
Often drilled to depths of a mile or more, oil wells typically tap into sandyformations permeated with a brine that is up to four times saltier than seawaterand that is laced with radioactivity, heavy metals, and other toxins. Withoutextensive and costly plugging, that brine can flow up the well shaft and seep intofreshwater aquifers or sometimes reach the surface.
Occasionally, the brine from abandoned wells hits the surface with explo-sive force. In the last few years it has erupted through a parking lot in SanAngelo, Texas. Mixed with natural gas, it spewed into the backyard of a homein Bartlesville, Oklahoma, and oozed onto a freeway construction site in Tulsa.
But the damage is usually slower and more insidious. A single unpluggedexploration hole in West Texas leaked brine for 22 years before being discovered,polluting the ground water beneath 400 to 600 acres of land, a 1990 study bythe Bureau of Economic Geology at University of Texas found.
Many of the problem wells date to a freewheeling time before the oil businesskept records or was regulated. In Texas, state records indicate that the sites ofsome 386,000 wells were never registered.
Oilfields have usually been overseen by state agencies like the Texas RailroadCommission or the Oklahoma Corporation Commission whose primary purposeis to promote the oil industry rather than protect the environment. The dangersposed by abandoned and improperly plugged wells began to attract attention fromstate officials only in the mid-1980s. The oil industry was a cherished source ofrevenue, and there was little research to distinguish contamination in oil fieldsfrom the naturally occurring salinity common in places like West Texas.
Since 1990, both Texas and Oklahoma have created funds specifically dedi-cated to plugging abandoned wells by imposing new taxes or fees on companiesdrilling or operating oil wells.
With exhausted fields and low prices driving down production, the numberof wells abandoned by bankrupt operators has increased rapidly since the mid-1980s. In 1991, Oklahoma began plugging 260 wells that were orphaned whena single company went bankrupt. The average cost is $4,000 a well.
In the oil patch of Oklahoma and West Texas, brine formations lay at depthsof 1,000 to 8,000 feet, where they are under tremendous pressure. Many strata ofvirtually impermeable rock lay between the brine and the freshwater aquifers,which are near the surface down to depths of 500 feet. Water moves laterallyacross the aquifers, slowly but across great distances, to streams and creeks.
The future health of these aquifers is a growing concern in Texas because theyfeed big river systems like the Colorado and the Brazos. Major cities, ranches,farms, and electric power plants all the way to the Gulf Coast depend on theserivers.
Approaches to Locate and Handle Abandoned WellsBorton et al. (2007) reported a study to locate abandoned wells in northwesternOhio; it was subjected to extensive oil production at the end of the 1800s. As a
10 Potential Sources of Threats to Environment 53
result, there is a high density of abandoned wells throughout the region, whichcan present a groundwater pollution hazard. Although some wells can be locatedby their casing protruding from the ground, many landowners have remove thecasing, making the well impossible to locate by inspection. The focus of thisstudy was to develop and refine a rapid and low-cost method for the locationof abandoned oil wells in northwestern Ohio using resistivity, magnetics, anda hand-held spectrometer. The resistivity, measured with a capacitively coupledresistivity apparatus, was relatively low around the location of the well. Inter-pretation of resistivity contour maps generally yielded a likely location for thewell within approximately 5 meters. Depth inversions show a relative low inresistivity almost directly under the pipe in all but 4 of the 10 wells studied. Themagnetic intensity contour maps showed a high within 2 meters of the knownwells. The spectra of soil samples taken from each well site show a small absorp-tion band near 2.2 μm. Though this band was found at every site, it is so smallthat this study found it impractical for locating wells. Overall, the most effectiveapproach involves collection of magnetic data first, followed by electrical resis-tivity and inversion modeling over sites indicated as probable by the magneticdata.
Southern Oil Company has identified an attractive and profitable opportunityto exploit the huge potential of orphaned wells in the northwest part of thestate of Louisiana and participate in the recovery of 6.7 billion barrels of knownreserves. With approximately 9,000 active wells and 16,000 nonproductive wells,the potential to activate as profitable producing units stemmed from the recentsurge in oil prices.
Oil was first discovered in Louisiana in 1905. In 1908, the annual productionreached 500,000 barrels (1,370 barrels per day). Since the first drillings, theCaddo Pine Island Field has produced approximately 400 million barrels overa period of 100 years. Production has been primarily from the Annona chalkformation. Publically available geological reports indicate a remaining reserve ofapproximately 6.7 billion barrels available for extraction.
In 1920, about 25,000 wells were in full production. Oil prices dropped tohistorical lows, and more wells were removed from production and became clas-sified as abandoned or orphaned. Producing wells declined to 15,000 in the 1980s,and only 9,000 remain in production. Today 16,000 nonproducing wells have thepotential to be activated as profitable producing wells, based on current oil prices.
To reactivate these wells to full production using local contractors, SouthernOil funds the reactivation and maintenance of oil well leaseholds and receivesperpetual and very long-term revenue rights (see Figure 24).
The reactivation includes the following:
• Acid cleaning and replacing well casings• Refurbishing or replacing holding tanks• Ecologically correct containment barrier
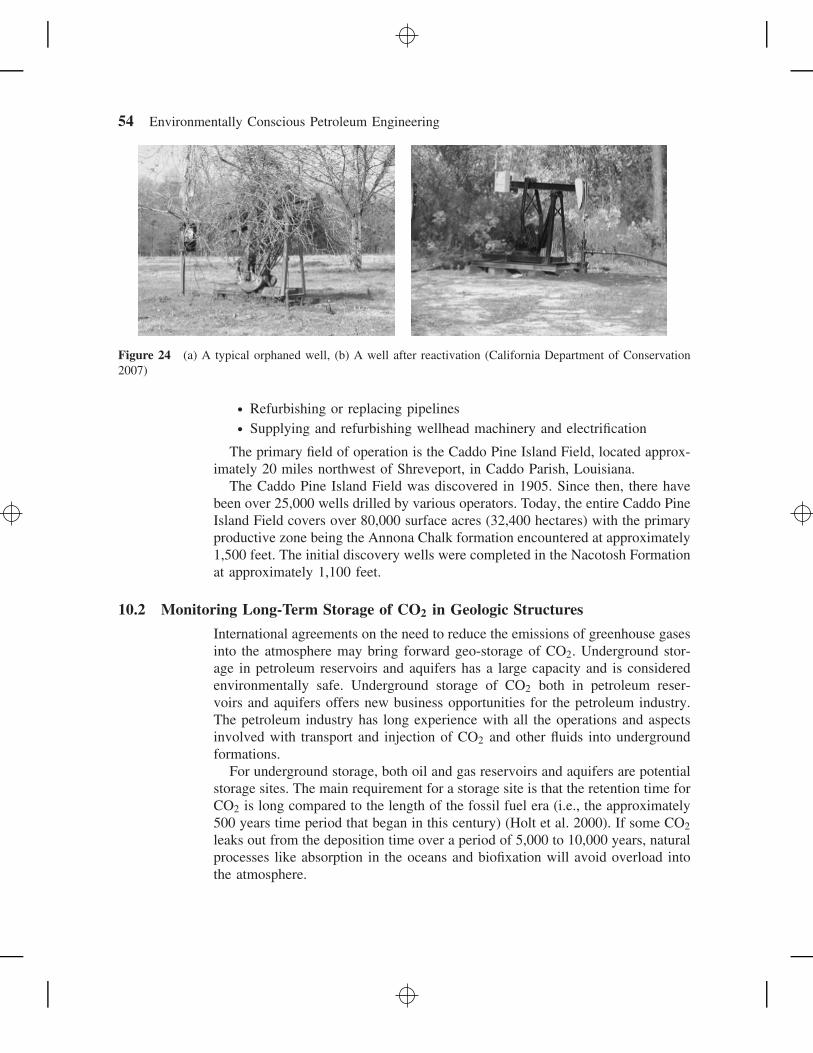
54 Environmentally Conscious Petroleum Engineering
Figure 24 (a) A typical orphaned well, (b) A well after reactivation (California Department of Conservation2007)
• Refurbishing or replacing pipelines• Supplying and refurbishing wellhead machinery and electrification
The primary field of operation is the Caddo Pine Island Field, located approx-imately 20 miles northwest of Shreveport, in Caddo Parish, Louisiana.
The Caddo Pine Island Field was discovered in 1905. Since then, there havebeen over 25,000 wells drilled by various operators. Today, the entire Caddo PineIsland Field covers over 80,000 surface acres (32,400 hectares) with the primaryproductive zone being the Annona Chalk formation encountered at approximately1,500 feet. The initial discovery wells were completed in the Nacotosh Formationat approximately 1,100 feet.
10.2 Monitoring Long-Term Storage of CO2 in Geologic Structures
International agreements on the need to reduce the emissions of greenhouse gasesinto the atmosphere may bring forward geo-storage of CO2. Underground stor-age in petroleum reservoirs and aquifers has a large capacity and is consideredenvironmentally safe. Underground storage of CO2 both in petroleum reser-voirs and aquifers offers new business opportunities for the petroleum industry.The petroleum industry has long experience with all the operations and aspectsinvolved with transport and injection of CO2 and other fluids into undergroundformations.
For underground storage, both oil and gas reservoirs and aquifers are potentialstorage sites. The main requirement for a storage site is that the retention time forCO2 is long compared to the length of the fossil fuel era (i.e., the approximately500 years time period that began in this century) (Holt et al. 2000). If some CO2
leaks out from the deposition time over a period of 5,000 to 10,000 years, naturalprocesses like absorption in the oceans and biofixation will avoid overload intothe atmosphere.

10 Potential Sources of Threats to Environment 55
Oil and gas reservoirs have proven their storage capacities for hydrocarbonsover millions of years, and are thus considered as safe storage sites for CO2.In recent years, millions of tonnes of CO2 have been injected into oil reservoirsfor profitable EOR, and no serious leaks to the atmosphere have been reported.CO2 has for a long time been injected into oil reservoirs, and through a largenumber of projects CO2-injection has proven its effectiveness as an injection fluidfor enhanced oil recovery. In a review of the performance of 25 CO2 injectionprojects, pilots and field scale (Holt et al. 2000), the average incremental oilrecovery obtained was 13 percent of original oil in place.
Regarding aquifer storage, the feasibility of each potential aquifer must beconsidered. At depths of more than 700 meters, the CO2 will typically be storedin dense phase (> 600 kg/Sm3) and the formation should have a high porosityand a well-defined cap rock. If the integrity of the cap rock is less than per-fect, possible escape of CO2 from the aquifer can be predicted by simulationif the formation is well characterized. The result of such simulations is shownin Figure 25. In these examples, CO2 is injected into a reservoir with 2,000millidarcy horizontal permeability only 8,000 meters from a spill point (e.g., anopen fracture or the boundary of the cap rock). Although CO2 migrates towardthe spill point, some of the CO2 will gradually dissolve in the reservoir water,reducing CO2 loss to the atmosphere. Even in these unfavorable situations, aconsiderable residence time can be expected. In a similar reservoir with 500millidarcy horizontal permeability, the loss over a 5,000-year period would benegligible.
Possible leakage of CO2 through existing wells appears to be especiallyimportant in mature sedimentary basins that have been intensively explored and
25
20
15
10
Esc
aped
CO
2, %
of I
njec
ted
Am
ount
5
02000
Seal dipping upward toward the spill point, 1:1000
Perfectly horizontal seal
3000 4000 5000
Year
6000 7000 8000
Figure 25 Simulated CO2 escape profiles from a reservoir with a spill point 8000 m fromthe CO2 injection well—6 million tonnes CO2 was injected yearly for 25 years (Holt et al.2000)
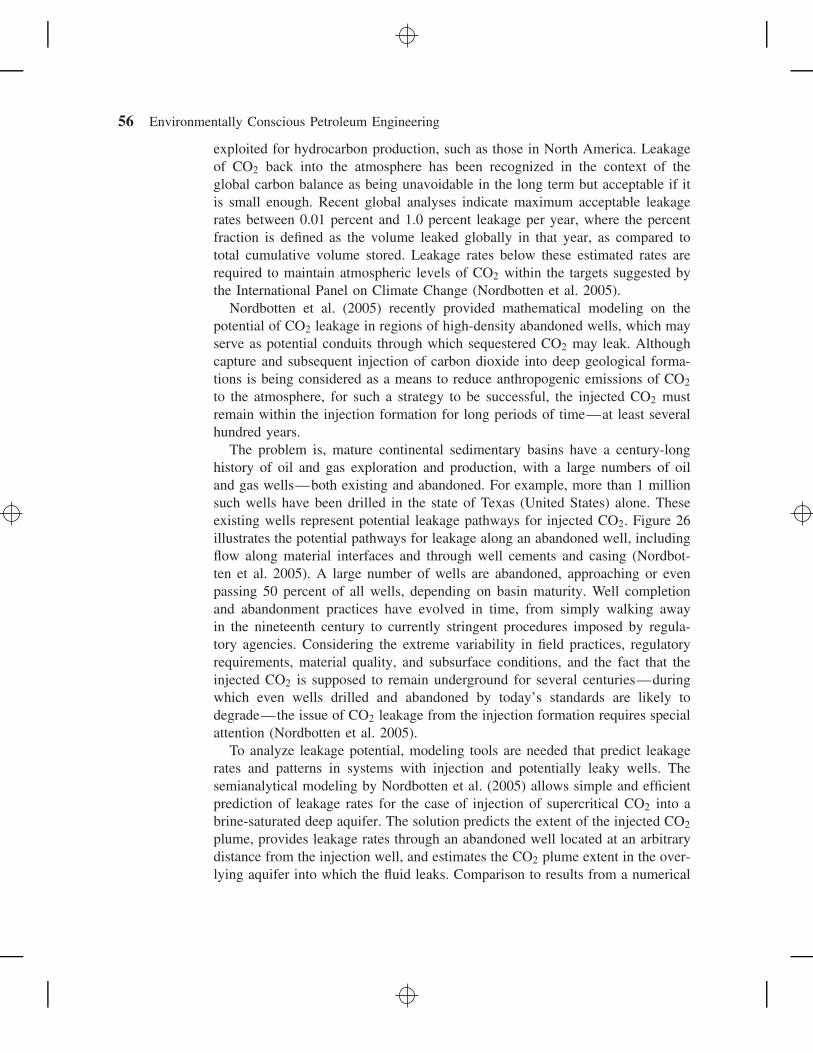
56 Environmentally Conscious Petroleum Engineering
exploited for hydrocarbon production, such as those in North America. Leakageof CO2 back into the atmosphere has been recognized in the context of theglobal carbon balance as being unavoidable in the long term but acceptable if itis small enough. Recent global analyses indicate maximum acceptable leakagerates between 0.01 percent and 1.0 percent leakage per year, where the percentfraction is defined as the volume leaked globally in that year, as compared tototal cumulative volume stored. Leakage rates below these estimated rates arerequired to maintain atmospheric levels of CO2 within the targets suggested bythe International Panel on Climate Change (Nordbotten et al. 2005).
Nordbotten et al. (2005) recently provided mathematical modeling on thepotential of CO2 leakage in regions of high-density abandoned wells, which mayserve as potential conduits through which sequestered CO2 may leak. Althoughcapture and subsequent injection of carbon dioxide into deep geological forma-tions is being considered as a means to reduce anthropogenic emissions of CO2
to the atmosphere, for such a strategy to be successful, the injected CO2 mustremain within the injection formation for long periods of time—at least severalhundred years.
The problem is, mature continental sedimentary basins have a century-longhistory of oil and gas exploration and production, with a large numbers of oiland gas wells—both existing and abandoned. For example, more than 1 millionsuch wells have been drilled in the state of Texas (United States) alone. Theseexisting wells represent potential leakage pathways for injected CO2. Figure 26illustrates the potential pathways for leakage along an abandoned well, includingflow along material interfaces and through well cements and casing (Nordbot-ten et al. 2005). A large number of wells are abandoned, approaching or evenpassing 50 percent of all wells, depending on basin maturity. Well completionand abandonment practices have evolved in time, from simply walking awayin the nineteenth century to currently stringent procedures imposed by regula-tory agencies. Considering the extreme variability in field practices, regulatoryrequirements, material quality, and subsurface conditions, and the fact that theinjected CO2 is supposed to remain underground for several centuries—duringwhich even wells drilled and abandoned by today’s standards are likely todegrade—the issue of CO2 leakage from the injection formation requires specialattention (Nordbotten et al. 2005).
To analyze leakage potential, modeling tools are needed that predict leakagerates and patterns in systems with injection and potentially leaky wells. Thesemianalytical modeling by Nordbotten et al. (2005) allows simple and efficientprediction of leakage rates for the case of injection of supercritical CO2 into abrine-saturated deep aquifer. The solution predicts the extent of the injected CO2
plume, provides leakage rates through an abandoned well located at an arbitrarydistance from the injection well, and estimates the CO2 plume extent in the over-lying aquifer into which the fluid leaks. Comparison to results from a numerical
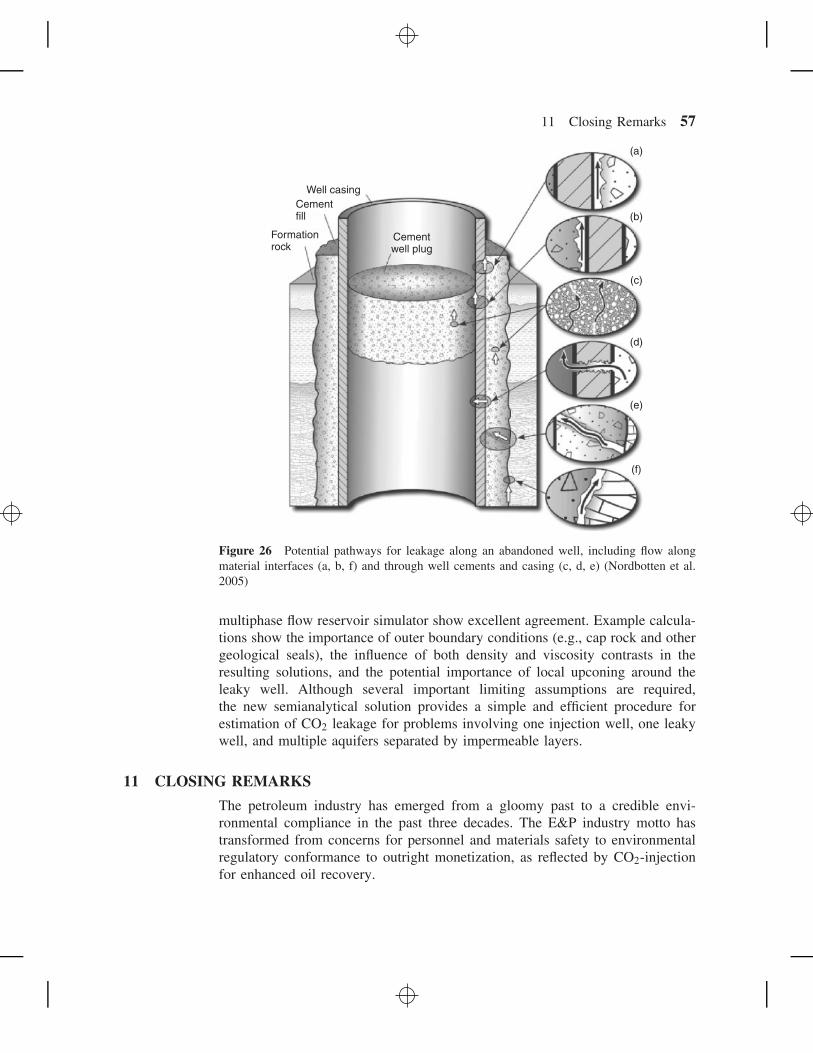
11 Closing Remarks 57
Well casingCementfill
Cementwell plug
(a)
(b)
(c)
(d)
(e)
(f)
Formationrock
Figure 26 Potential pathways for leakage along an abandoned well, including flow alongmaterial interfaces (a, b, f) and through well cements and casing (c, d, e) (Nordbotten et al.2005)
multiphase flow reservoir simulator show excellent agreement. Example calcula-tions show the importance of outer boundary conditions (e.g., cap rock and othergeological seals), the influence of both density and viscosity contrasts in theresulting solutions, and the potential importance of local upconing around theleaky well. Although several important limiting assumptions are required,the new semianalytical solution provides a simple and efficient procedure forestimation of CO2 leakage for problems involving one injection well, one leakywell, and multiple aquifers separated by impermeable layers.
11 CLOSING REMARKS
The petroleum industry has emerged from a gloomy past to a credible envi-ronmental compliance in the past three decades. The E&P industry motto hastransformed from concerns for personnel and materials safety to environmentalregulatory conformance to outright monetization, as reflected by CO2-injectionfor enhanced oil recovery.
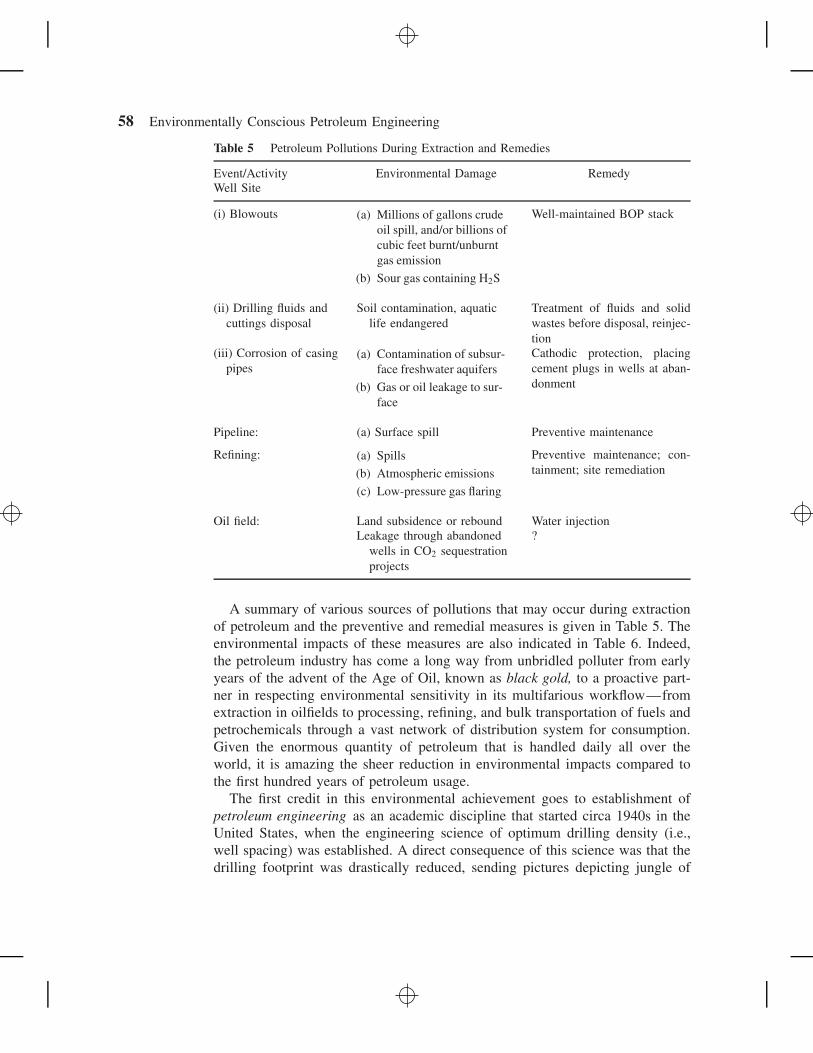
58 Environmentally Conscious Petroleum Engineering
Table 5 Petroleum Pollutions During Extraction and Remedies
Event/Activity Environmental Damage RemedyWell Site
(i) Blowouts (a) Millions of gallons crudeoil spill, and/or billions ofcubic feet burnt/unburntgas emission
(b) Sour gas containing H2S
Well-maintained BOP stack
(ii) Drilling fluids andcuttings disposal
Soil contamination, aquaticlife endangered
Treatment of fluids and solidwastes before disposal, reinjec-tion
(iii) Corrosion of casingpipes
(a) Contamination of subsur-face freshwater aquifers
(b) Gas or oil leakage to sur-face
Cathodic protection, placingcement plugs in wells at aban-donment
Pipeline: (a) Surface spill Preventive maintenance
Refining: (a) Spills
(b) Atmospheric emissions
(c) Low-pressure gas flaring
Preventive maintenance; con-tainment; site remediation
Oil field: Land subsidence or rebound Water injectionLeakage through abandoned
wells in CO2 sequestrationprojects
?
A summary of various sources of pollutions that may occur during extractionof petroleum and the preventive and remedial measures is given in Table 5. Theenvironmental impacts of these measures are also indicated in Table 6. Indeed,the petroleum industry has come a long way from unbridled polluter from earlyyears of the advent of the Age of Oil, known as black gold, to a proactive part-ner in respecting environmental sensitivity in its multifarious workflow—fromextraction in oilfields to processing, refining, and bulk transportation of fuels andpetrochemicals through a vast network of distribution system for consumption.Given the enormous quantity of petroleum that is handled daily all over theworld, it is amazing the sheer reduction in environmental impacts compared tothe first hundred years of petroleum usage.
The first credit in this environmental achievement goes to establishment ofpetroleum engineering as an academic discipline that started circa 1940s in theUnited States, when the engineering science of optimum drilling density (i.e.,well spacing) was established. A direct consequence of this science was that thedrilling footprint was drastically reduced, sending pictures depicting jungle of
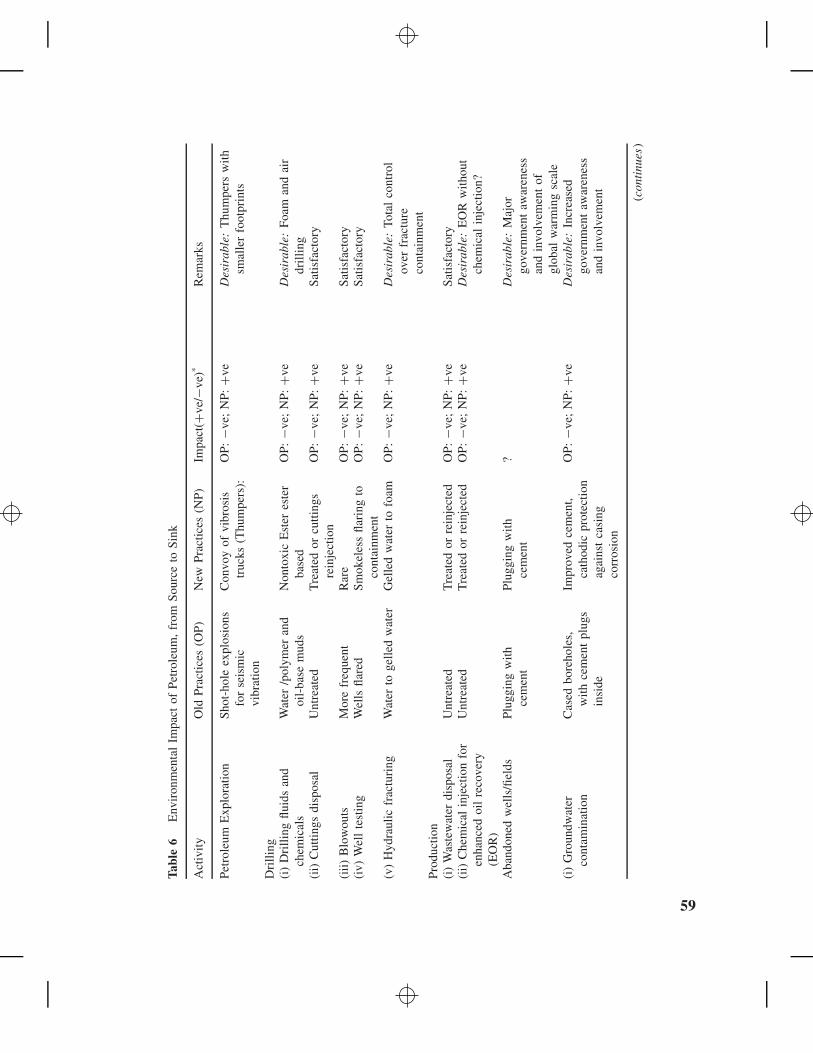
Tabl
e6
Env
iron
men
tal
Impa
ctof
Petr
oleu
m,
from
Sour
ceto
Sink
Act
ivity
Old
Prac
tices
(OP)
New
Prac
tices
(NP)
Impa
ct(+
ve/−
ve)*
Rem
arks
Petr
oleu
mE
xplo
ratio
nSh
ot-h
ole
expl
osio
nsfo
rse
ism
icvi
brat
ion
Con
voy
ofvi
bros
istr
ucks
(Thu
mpe
rs):
OP:
−ve;
NP:
+ve
Des
irab
le:
Thu
mpe
rsw
ithsm
alle
rfo
otpr
ints
Dri
llin
g(i
)D
rill
ing
fluid
san
dch
emic
als
Wat
er/p
olym
eran
doi
l-ba
sem
uds
Non
toxi
cE
ster
este
rba
sed
OP:
−ve;
NP:
+ve
Des
irab
le:
Foam
and
air
dril
ling
(ii)
Cut
tings
disp
osal
Unt
reat
edT
reat
edor
cutti
ngs
rein
ject
ion
OP:
−ve;
NP:
+ve
Satis
fact
ory
(iii
)B
low
outs
Mor
efr
eque
ntR
are
OP:
−ve;
NP:
+ve
Satis
fact
ory
(iv)
Wel
lte
stin
gW
ells
flare
dSm
okel
ess
flari
ngto
cont
ainm
ent
OP:
−ve;
NP:
+ve
Satis
fact
ory
(v)
Hyd
raul
icfr
actu
ring
Wat
erto
gelle
dw
ater
Gel
led
wat
erto
foam
OP:
−ve;
NP:
+ve
Des
irab
le:
Tota
lco
ntro
lov
erfr
actu
reco
ntai
nmen
tPr
oduc
tion
(i)
Was
tew
ater
disp
osal
Unt
reat
edT
reat
edor
rein
ject
edO
P:−v
e;N
P:+v
eSa
tisfa
ctor
y(i
i)C
hem
ical
inje
ctio
nfo
ren
hanc
edoi
lre
cove
ry(E
OR
)
Unt
reat
edT
reat
edor
rein
ject
edO
P:−v
e;N
P:+v
eD
esir
able
:E
OR
with
out
chem
ical
inje
ctio
n?
Aba
ndon
edw
ells
/fiel
dsPl
uggi
ngw
ithce
men
tPl
uggi
ngw
ithce
men
t?
Des
irab
le:
Maj
orgo
vern
men
taw
aren
ess
and
invo
lvem
ent
ofgl
obal
war
min
gsc
ale
(i)
Gro
undw
ater
cont
amin
atio
nC
ased
bore
hole
s,w
ithce
men
tpl
ugs
insi
de
Impr
oved
cem
ent,
cath
odic
prot
ectio
nag
ains
tca
sing
corr
osio
n
OP:
−ve;
NP:
+ve
Des
irab
le:
Incr
ease
dgo
vern
men
taw
aren
ess
and
invo
lvem
ent
(con
tinu
es)
59
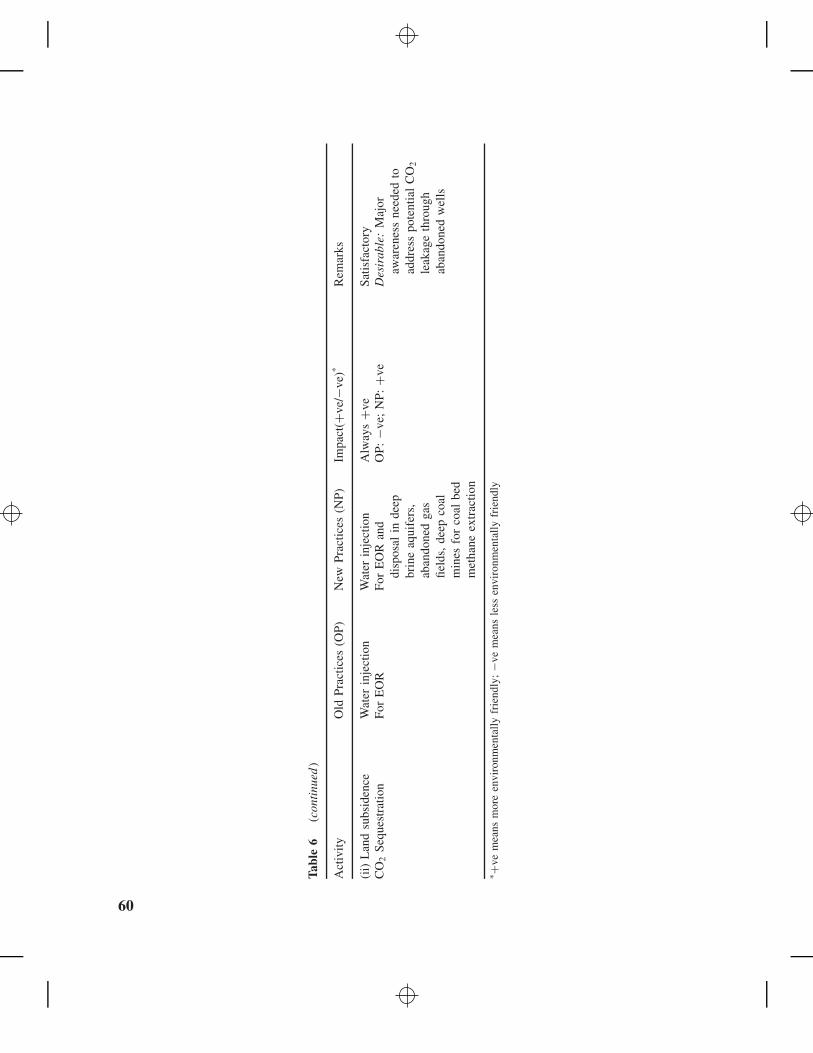
Tabl
e6
(con
tinu
ed)
Act
ivity
Old
Prac
tices
(OP)
New
Prac
tices
(NP)
Impa
ct(+
ve/−
ve)*
Rem
arks
(ii)
Lan
dsu
bsid
ence
Wat
erin
ject
ion
Wat
erin
ject
ion
Alw
ays
+ve
Satis
fact
ory
CO
2Se
ques
trat
ion
For
EO
RFo
rE
OR
and
disp
osal
inde
epbr
ine
aqui
fers
,ab
ando
ned
gas
field
s,de
epco
alm
ines
for
coal
bed
met
hane
extr
actio
n
OP:
−ve;
NP:
+ve
Des
irab
le:
Maj
oraw
aren
ess
need
edto
addr
ess
pote
ntia
lC
O2
leak
age
thro
ugh
aban
done
dw
ells
∗ +ve
mea
nsm
ore
envi
ronm
enta
lly
frie
ndly
;−v
em
eans
less
envi
ronm
enta
lly
frie
ndly
60
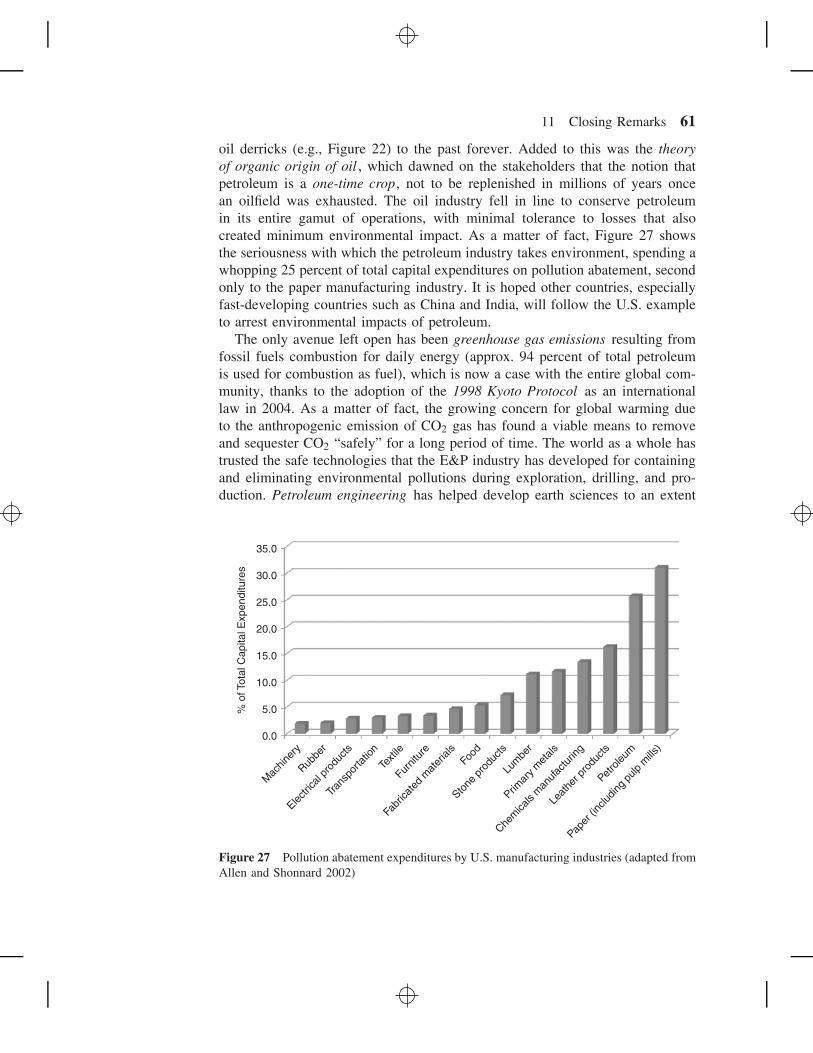
11 Closing Remarks 61
oil derricks (e.g., Figure 22) to the past forever. Added to this was the theoryof organic origin of oil , which dawned on the stakeholders that the notion thatpetroleum is a one-time crop, not to be replenished in millions of years oncean oilfield was exhausted. The oil industry fell in line to conserve petroleumin its entire gamut of operations, with minimal tolerance to losses that alsocreated minimum environmental impact. As a matter of fact, Figure 27 showsthe seriousness with which the petroleum industry takes environment, spending awhopping 25 percent of total capital expenditures on pollution abatement, secondonly to the paper manufacturing industry. It is hoped other countries, especiallyfast-developing countries such as China and India, will follow the U.S. exampleto arrest environmental impacts of petroleum.
The only avenue left open has been greenhouse gas emissions resulting fromfossil fuels combustion for daily energy (approx. 94 percent of total petroleumis used for combustion as fuel), which is now a case with the entire global com-munity, thanks to the adoption of the 1998 Kyoto Protocol as an internationallaw in 2004. As a matter of fact, the growing concern for global warming dueto the anthropogenic emission of CO2 gas has found a viable means to removeand sequester CO2 “safely” for a long period of time. The world as a whole hastrusted the safe technologies that the E&P industry has developed for containingand eliminating environmental pollutions during exploration, drilling, and pro-duction. Petroleum engineering has helped develop earth sciences to an extent
35.0
30.0
25.0
20.0
15.0
10.0
5.0
0.0
Mac
hiner
y
Rubbe
r
Electri
cal p
rodu
cts
Trans
porta
tion
Texti
le
Furnit
ure
Fabr
icate
d m
ater
ials
Food
Stone
pro
ducts
Lum
ber
Primar
y met
als
Chem
icals
man
ufactu
ring
Leat
her p
rodu
cts
Petro
leum
Paper
(inc
luding
pulp
mills
)
% o
f Tot
al C
apita
l Exp
endi
ture
s
Figure 27 Pollution abatement expenditures by U.S. manufacturing industries (adapted fromAllen and Shonnard 2002)
62 Environmentally Conscious Petroleum Engineering
that the international community finds it safe to sequester CO2 in deep geologi-cal structures used and identified by the E&P industry. The use of depleted gasfields, coalbed methane reservoirs, and oil fields all have provided a platform forcontinuing to benefit from fossil fuels for energy.
However, a word of caution must be sounded before concluding the story ofpetroleum vis-a-vis environmental safety. With many oil and gas fields aging toabandonment, another problem with potential threat to the environment is lurkingon the horizon. The thousands of abandoned oil and gas wells pose two kindsof environmental problems: (1) uncontrolled flow of high salinity brines, withor without heavy metals, oil and gas seepage with and without hydrogen sulfide,and (2) channels for sequestered CO2 to seep into the atmosphere.
Both problems can be tackled to a great extent with the current state of artin science and technology, but practical solutions and applications methodolo-gies must be developed to assure environmental security to future generations.Klusman (2003), and Celia and Bachu (2003) heralded the timely call on thisthreat, and Nordbotten et al. (2005) have opened the science that is needed towrite a new chapter in petroleum engineering. Here lies an opportunity, for bothacademia and the energy industries, to embark on cross-cutting research anddevelopment programs with active participation by all governments.
REFERENCES
Allen, D. R. (1972), “Environmental Aspects of Oil Producing Operations—Long Beach,California,” Journal of Petroleum Technology , February.
Allen, D. T., and Shonnard, D. R. (2002), Green Engineering: Environmentally ConsciousDesign of Chemical Processes , Prentice Hall, Upper Saddle River, NJ.
American Petroleum Institute (2009), API Environmental Guidance Document: Onshore SolidWaste Management in Exploration and Production Operations Washington, D.C.
Baycroft, P. (2005), “Low-Toxicity Frac Fluid Cuts Costs Offshore,” Hart E&P Magazine,(November 1).
Baycroft, P. D., McElfresh, P. M., Crews, J. B., Spies, B., Wilson, B., Conrad, M., andBlackman, M. (2005), “Frac-packing with Low Environmental Impact Hydraulic FracturingFluid Benefits the Operator,” SPE/EPA/DOE Exploration and Production EnvironmentalConference, March 7–9, Galveston, TX.
Borton, T., Vincent, R. K., and Onasch, C. (2007), “A Method for Locating Aban-doned Oil Wells in Wood County, Ohio Using Remote Sensing and GeophysicalTechniques,” The Geological Society of America (GSA), Joint South-Centraland North-Central Sections 41st Annual Meeting, April 11–13, Lawrence, KS,http://gsa.confex.com/gsa/2007SC/finalprogram/index.html.
Burke, J. C., and Veil, A. J. (1995), “Synthetic-Based Drilling Fluids Have Many Environ-mental Pulses,” Oil and Gas Journal , Vol. 93, pp. 59–64.
California Department of Conservation (2007), http://www.conservation.ca.gov/dog/photogallery/Pages/Index.aspx.

References 63
Celia, M. A., Bachu, S. (2003), “Geological Sequestration of CO2: Is Leakage Unavoidableand Acceptable?” Proceedings of the Sixth International Greenhouse Gas Technologies Con-ference Kyoto, Japan), October 1–5, 2002; Gale, J., Kaya, Y. (eds.), Pergamon, Vol. I, pp.477–482.
Cone, A., and Johns, W. R., (1870), “Petrolia, A Brief History of the Pennsylvania PetroleumRegion,” d. Appleton and Company, New York, 652 p.
Day, M. D. (2008), “Decommissioning of Offshore Oil and Gas Installations,” in Stefan T.Orszulik (ed.), Environmental Technology in the Oil Industry, Oxoid Ltd, Hampshire, U.K.Springer.
Dickey, P. A. (1941), “Oil Geology of the Titusville Quadrangle, Pennsylvania,” PennsylvaniaTopographic and Geologic Survey, Mineral Resource Report 22.
Dickey, P. A. (1959), “The First Oil Well, Oil Industry Centennial,” Journal of PetroleumTechnology , Vol. 59, pp. 14–25.
Dyrynda, P., and Symberlist, R. (2002), “Oil Pollution Following the Sea Empress Spill,”http://www.swan.ac.uk/empress/oil/pollute.htm.
ECA Watch, “Photo Gallery of Shell’s Oil Spill at Kholmsk, Sakhalin Island,” http://www.eca-watch.org/problems/eu russ/russia/sakhalin/ShellOilSpillPics.html.
Energy Industry Photos, www.energyindustryphotos.com.
Energy Information Administration (EIA) (2000), “Voluntary Reporting of Green-house Gases Program: Fuel and Energy Source Codes and Emission Coefficients,”http://www.eia.doe.gov/oiaf/1605/coefficients.html.
Energy Information Administration (2004), U.S. Crude Oil, Natural Gas, and Natural Gas Liq-uids Reserves, 2003 Annual Report, DOE/EIA-0216 (2003) Advanced Summary, Septem-ber 2004.
Energy Information Administration (EIA) (2005), “Annual Energy Outlook 2005 ,”http://tonto.eia.doe.gov/ftproot/forecasting/0383(2005.pdf.
Etkin, D. S. (2001), “Analysis of Oil Spill Trends in the United States and Worldwide,” TheInternational Oil Spill Conference, Tampa, FL, March 26–29.
Giddens, P. H. (1938), The Birth of the Oil Industry . The Macmillan Company, New York,216 p.
Guo, B., Lyons, W. C., and Gholambor, A. (2007), Petroleum Production Engineering—AComputer-Assisted Approach . Gulf Professional Publishing, Houston, TX.
Hanighen, F. C. (1934), The Secret War , a volume in the Hyperion reprint series: The Historyand Politics of Oil, Hyperion Press, Inc., Westport, CT (Original publisher information at:http://catalogue.nla.gov.au/Record/139578.)
Holt, T., Lindeberg, E. G. B., and Taber, J. J. (2000), “Technologies and Possibilities forLarger-Scale CO2 Separation and Underground Storage,” SPE 63103, SPE Annual Tech-nical Conference and Exhibition held in Dallas, TX, October 1–4.
Hoovers (2009), “THUMS Long Beach Company,” http://www.hoovers.com/thums-long-beach-co./--ID 47660--/free-co-profile.xhtml.
Klusman, R. W. (2003), “Evaluation of Leakage Potential from a Carbon DioxideEOR/Sequestration Project,” Energy Convers. Manage., Vol. 44, pp. 1921–1940.
Kvonvolden, K. (2004), “Oil Pollution in Prince William Sound, Alaska,” http://images.google.com/imgres?imgurl=http://menlocampus.wr.usgs.gov/50years/accomplishments/images/PWS tanker oil spill.jpg&imgrefurl=http://menlocampus.wr.usgs.gov/50years/
64 Environmentally Conscious Petroleum Engineering
accomplishments/oil.html&usg= wK08rZ 0uRHrdXFdDUwouryqQRo=&h=371&w=580&sz=56&hl=en&start=1&um=1&tbnid=FfGGuf1kP59QsM:&tbnh=86&tbnw=134&prev=/images%3Fq%3Doil%2Bpollution%26hl%3Den%26rlz%3D1T4SUNA enUS266US284%26um%3D1.
Malachosky, E., Shannon, B. E., and Jackson, J. E. (1993), “Offshore Disposal of Oil-basedDrilling Fluid Waste: An Environmentally Acceptable Solution,” SPE 23373, Proc. FirstInternational Conference on Health Safety and Environment, The Hague, The Netherlands,November 10–14, pp. 465–473; also SPE Drilling and Completion, December, 1992, pp.283–287, 27.
McMordie, W. C. (1980), “Oil Base Drilling Fluids,” Symposium on Research on Environ-mental Fate and Effect of Drilling Fluids and Cuttings. Lake Buena Vista, FL.
Merriam-Webster, “Crude Oil Pipeline,” http://visual.merriam-webster.com/energy/geothermal-fossil-energy/oil/crude-oil-pipeline.php; and“Drilling Rig,”http://visual.merriam-webster.com/energy/geothermal-fossil-energy/oil/drilling-rig.php.
Melton, H. R., Smith, J. P., Martin, C. R., Nedwed, T. J., Mairs, H. L., and Raught, D. L.(2000), “Offshore Discharge of Drilling Fluids and Cuttings; A Scientific Perspective onPublic Policy,” Rio Oil and Gas Conference. Rio de Janeiro, Brazil.
National Geographic (2007), “Global Warming Fast Facts,” National Geographic News,http://news.nationalgeographic.com/news/2004/12/1206 041206 global warming.html.
Natural Gas at: http://www.naturalgas.org/images/offshore drill platform.gif.
Nordbotten, J. M., Celia, M. A., Bachu, S., and Dahle, H. K. (2005), “Semianalytical Solutionfor CO2 Leakage through an Abandoned Well,” Environmental Science and Technology ,Vol. 39, No. 2, pp. 602–611.
Owen, J. W. (1975), “Trek of the Oil Finders,” American Association of PetroleumGeologists, Tulsa, Oklahoma, Memoir 6, Semi-Centennial Convention Volume,http://www.petroleumhistory.org/OilHistory/pages/drake/beginning.html.
Oil Watch , http://www.oilwatch.org/doc/boletin/bole56en.pdf.
Pees, S. T. ( 1989a), Oil History , in http://www.petroleumhistory.org/OilHistory/pages/Whale/whale.html.
Pees, S. T., ed. ( 1989b), History of the Petroleum Industry Symposium, American Associationof Petroleum Geologists, Guidebook, 84 p.
Pees, S. T., and Stewart, A.W. (1995), “The Setting in Oil Creek Valley, Pa., and the Chrono-logical Progress of the Drake Well Museum, an Important Repository of Oil IndustryHistory.” Northeastern Geology and Environmental Sciences, Vol. 17, No. 3, p. 282–294.
Rathbun, T. (2009), “Pennsylvania Dept. of Environmental Protection Completes 12 Aban-doned Oil and Gas Well Plugging Projects in 2008,” in PR Newswire, March 4, 2009, avail-able at http://news.prnewswire.com/ViewContent.aspx?ACCT=109&STORY=/www/story/03-04-2009/0004982825&EDATE=.
RCEP (2000), “Energy—The Changing Climate,” The Royal Commission on EnvironmentalPollution, June, HMSO, London.
Records of the Petroleum Administrative Board, on Federal Oil Conservation Board . quotedfrom: http://www.archives.gov/research/guide-fed-records/groups/232.html.
Reis, J. C. (1996), Environmental Control in Petroleum Engineering , Gulf Publishing Com-pany, Houston, TX.
References 65
Soegianto, A., Irawan, B., and Affandi, M. (2008), “Toxicity of Drilling Waste and Its Impacton Gill Structure of Post Larvae of Tiger Prawn (Penaeus monodon),” Global Journal ofEnvironmental Research, Vol. 2, No. 1, pp. 36–41.
Standard Oil Company (2009), http://www.ohiohistorycentral.org/image.php?rec=1573&img=2144; Also available at: “JDR Photo Album,” http://www.pocanticohills.org/rockefeller/refinery1.htm.
Suro, R. (1992), “Abandoned Oil and Gas Wells Become Pollution Portals,” The New YorkTimes, May 3, 1992, http://query.nytimes.com/gst/fullpage.html?res=9E0CE7DF133CF930A35756C0A964958260&sec=&spon=&pagewanted=all.
Southern Oil Company, Louisiana, http://southern-oil.com/aboutSO/missionstatement.html.
Therkelsen, R. L. (1973), “Wildlife Habitat Enhancement of Oil Fields in Kern County,California,” California Division of Oil and Gas, Sacramento, CA, pp. iii and 14.
Whitaker, Marvin (1999), “Emerging ‘Triple Bottom Line’ Model for Industry Weighs Envi-ronmental, Economic, and Social Considerations,” Oil and Gas Journal , (December 20).
Wojtanowicz, A. K. (2008a), “Environmental Control of Drilling Fuilds and Produced Water,”in Stefan T. Orszulik (ed.), Environmental Technology in the Oil Industry, 2nd ed., OxoidLtd, Hampshire, U.K. Springer.
Wojtanowicz, A. K. (2008b), “Environmental Control of Well Integrity,” in Stefan T. Orszulik(ed.), Environmental Technology in the Oil Industry, 2nd ed., Oxoid Ltd, Hampshire, U.K.Springer.
Wojtanowicz, A. K. (2008c), “Environmental Control Technology for Oilfield Processes,” inStefan T. Orszulik (ed.), Environmental Technology in the Oil Industry, 2nd ed., Oxoid Ltd,Hampshire, U.K. Springer.
Worley, R., Franklin, R., and Zenone, V. E. (2001), “The National Problem of Oil WellFields,” The International Oil Spill Conference, Tampa, FL, March 26–29.
Wyoming Dept. of Environmental Quality (1998), “Plugging Abandoned Wells,”http://deq.state.wy.us/wqd/groundwater/downloads/Private%20Wells/wellheadplug.asp.

66 Environmentally Conscious Petroleum Engineering
APPENDIX A*
*Source: Amy L. Gilliand, Environmental Reference Manual , 2nd ed., Texas Independent Producers
& Royalty Owners Association, Austin, TX, 1993–1994, pp. 96–98.
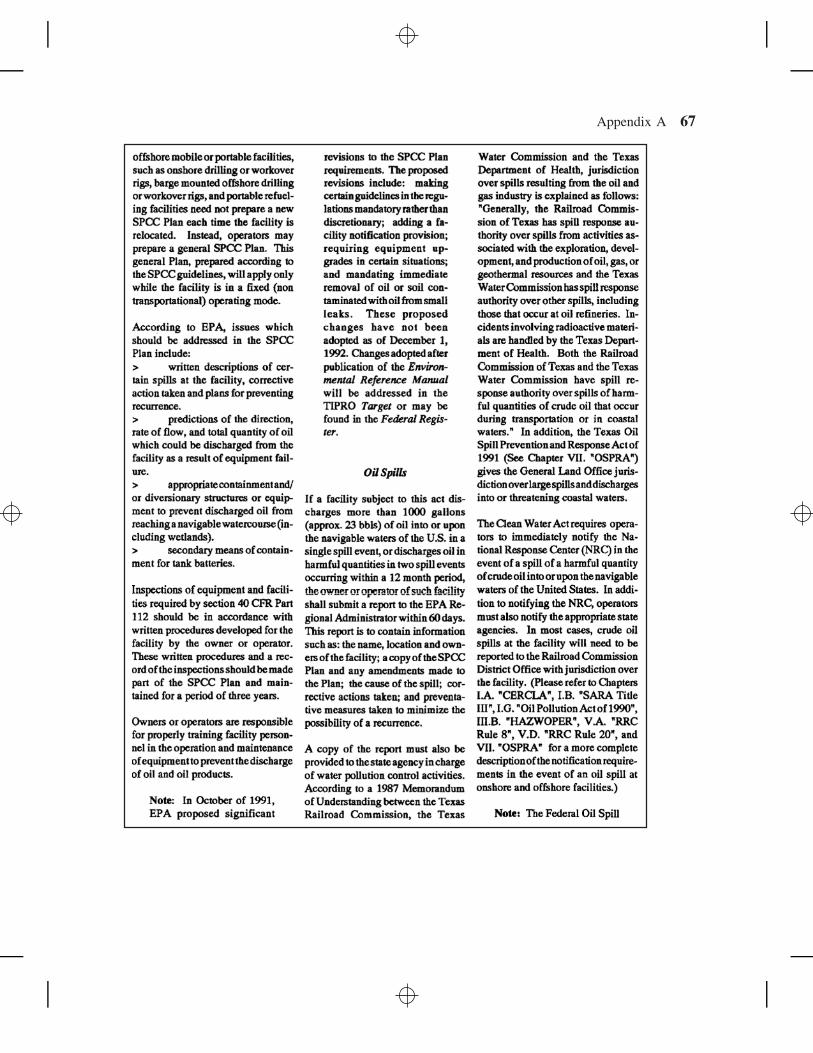
Appendix A 67
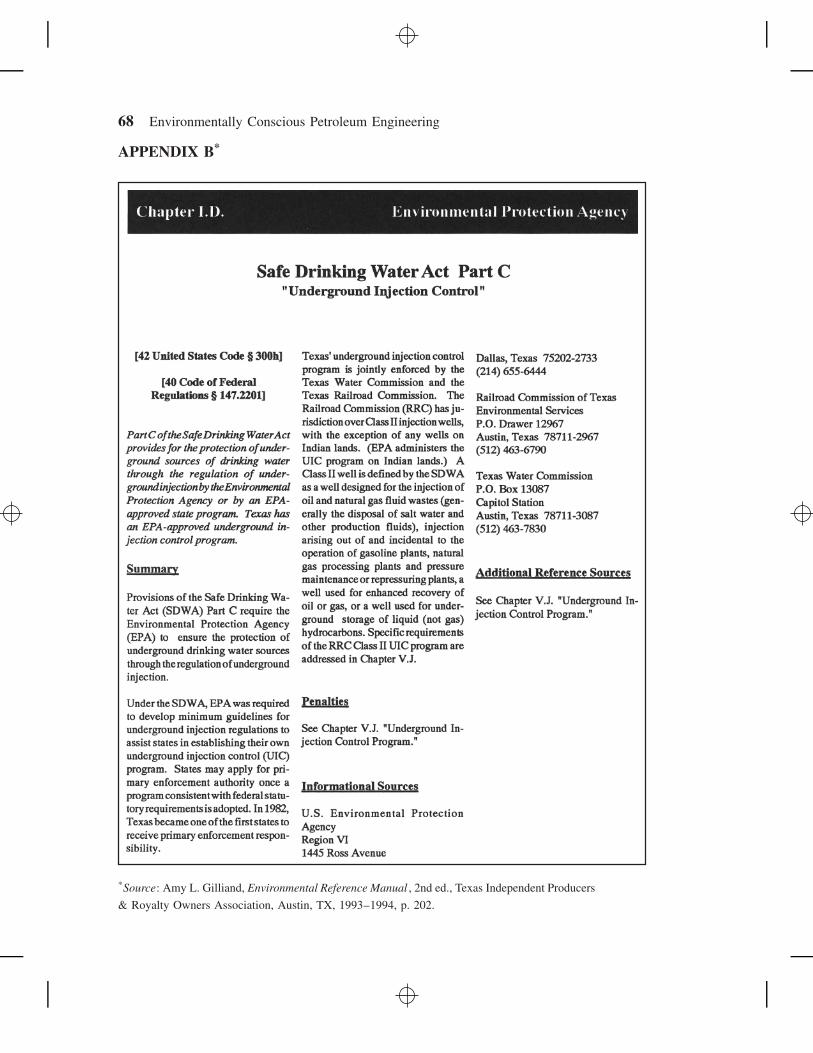
68 Environmentally Conscious Petroleum Engineering
APPENDIX B*
*Source: Amy L. Gilliand, Environmental Reference Manual , 2nd ed., Texas Independent Producers
& Royalty Owners Association, Austin, TX, 1993–1994, p. 202.

Appendix C 69
APPENDIX C*
*Source: Amy L. Gilliand, Environmental Reference Manual , 2nd ed., Texas Independent Producers
& Royalty Owners Association, Austin, TX, 1993–1994, p. 408–409.
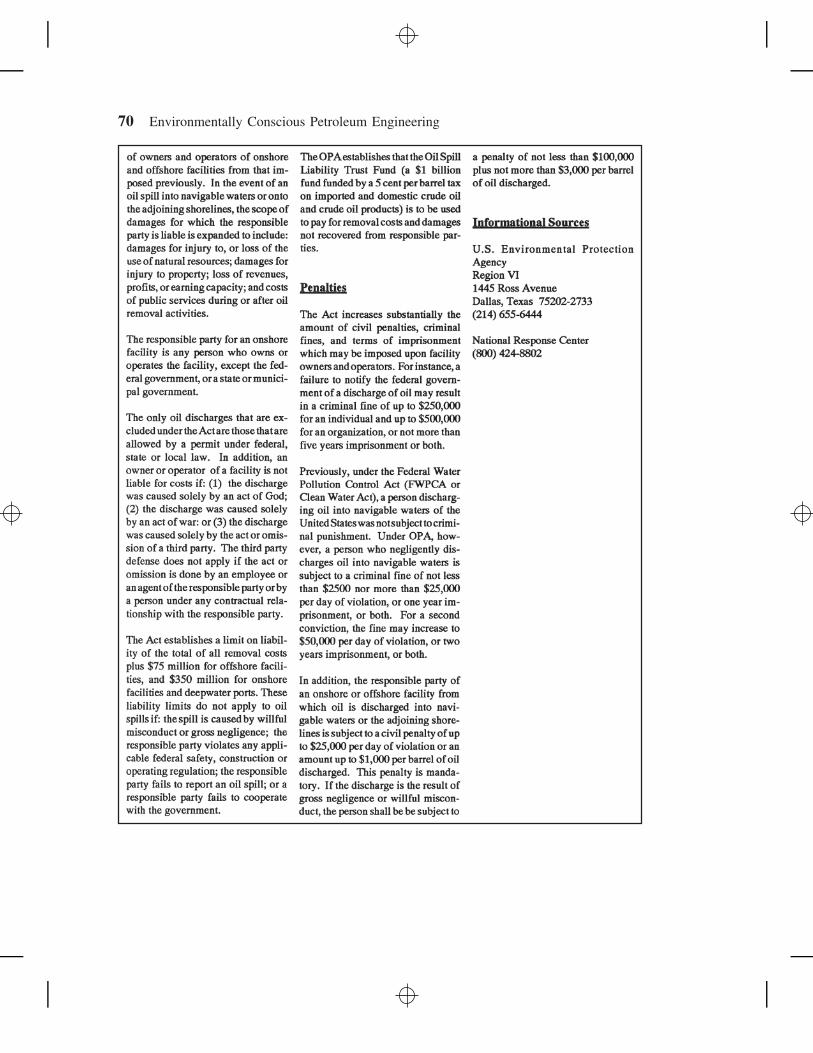
70 Environmentally Conscious Petroleum Engineering
Appendix D 71
APPENDIX D § 3.13. RULE 13. CASING, CEMENTING,DRILLING, AND COMPLETION REQUIREMENTS (AMENDEDEFFECTIVE AUGUST 13, 1991)*
(a) General.(1) The operator is responsible for compliance with this section during all
operations at the well. It is the intent of all provisions of this sectionthat casing be securely anchored in the hole in order to effectively con-trol the well at all times, all usable-quality water zones be isolated andsealed off to effectively prevent contamination or harm, and all poten-tially productive zones be isolated and sealed off to prevent verticalmigration of fluids or gases behind the casing. When the section doesnot detail specific methods to achieve these objectives, the responsibleparty shall make every effort to follow the intent of the section, usinggood engineering practices and the best currently available technology.
(2) Definitions. The following words and terms, when used in this chapter,shall have the following meanings, unless the context clearly indicatesotherwise.(A) Stand under pressure--To leave the hydrostatic column pressure in
the well acting as the natural force without adding any externalpump pressure. The provisions are complied with if a float collar isused and found to be holding at the completion of the cement job.
(B) Zone of critical cement--For surface casing strings shall be the bot-tom 20% of the casing string, but shall be no more than 1,000 feetnor less than 300 feet. The zone of critical cement extends to theland surface for surface casing strings of 300 feet or less.
(C) Protection depth--Depth to which usable-quality water must be pro-tected, as determined by the Texas Department of Water Resources,which may include zones that contain brackish or saltwater if suchzones are correlative and/or hydrologically connected to zones thatcontain usable-quality water.
(D) Productive horizon--Any stratum known to contain oil, gas, orgeothermal resources in commercial quantities in the area.
(b) Onshore and inland waters.(1) General.
(A) All casing cemented in any well shall be steel casing that has beenhydrostatically pressure tested with an applied pressure at least equalto the maximum pressure to which the pipe will be subjected in thewell. For new pipe, the mill test pressure may be used to fulfill this
∗ Source: Amy L. Gilliand, Environmental Reference Manual , 2nd ed., Texas Independent Producers& Royalty Owners Association, Austin, TX, 1993–1994, p. 629–637.
72 Environmentally Conscious Petroleum Engineering
requirement. As an alternative to hydrostatic testing, a full lengthelectromagnet, ultrasonic, radiation thickness gauging, or magneticparticle inspection may be employed.
(B) Wellhead assemblies shall be used on w∼ to maintain surface controlof the well. Each component of the wellhead shall have a pressurerating equal to or greater than the anticipated pressure to which thatparticular component might be exposed during the course of drilling,testing, or producing the well.
(C) A blowout preventer or control head and other connections to keepthe well under control at all times shall be installed as soon as sur-face casing is set. This equipment shall be of such construction andcapable of such operation as to satisfy any reasonable test which maybe required by the Commission or its duly accredited agent.
(D) When cementing any string of casing more than 200 feet long, beforedrilling the cement plug the operator shall test the casing at a pumppressure in pounds per square inch (psi) calculated by multiplyingthe length of the casing string by 0.2. The maximum test pressurerequired, however, unless otherwise ordered by the Commission, neednot exceed 1,500 psi. If, at the end of 30 minutes, the pressure showsa drop of 10% or more from the original test pressure, the casing shallbe condemned until the leak is corrected. A pressure test demonstrat-ing less than a 10% pressure drop after 30 minutes is proof that thecondition has been corrected.
(E) Wells drilling to formations where the expected reservoir pressureexceeds the weight of the drilling fluid column shall be equippedto divert any wellbore fluids away from the rig floor. All divertersystems shall be maintained in an effective working condition. Nowell shall continue drilling operations if a test or other informa-tion indicates the diverter system is unable to function or operate asdesigned.
(2) Surface casing.(A) Amount required
(i) An operator shall set and cement sufficient surface casing toprotect all usable-quality water strata, as defined by the TexasDepartment of Water Resources. Before drilling any well in anyfield or area in which no field rules are in effect or in (∼ whichsurface casing requirements are not specified in the applicablefield rules, an operator shall obtain a letter from the Texas Depart-ment of Water Resources stating! the protection depth. In nocase, however, is surface casing to be set deeper than 200 ∼;!Ifeet below the specified depth without prior approval from theCommission.
Appendix D 73
(ii) Any well drilled to a total depth of 1,000 feet or less belowthe ground surface may be drilled without setting surface casingprovided no shallow gas sands or ! abnormally high pressuresare known to exist at depths shallower than 1,000 feet below theground surface; and further, provided that production casing iscemented from the shoe to the ground surface by the pump andplug method.
(B) Cementing. Cementing shall be by the pump and plug method. Suffi-cient cement shall be used to fill the annular space outside the casingfrom the shoe to the ground surface or to the bottom of the cellar. Ifcement does not circulate to ground surface or the bottom of the cel-lar, the operator or his representative shall obtain the approval of theDistrict Director for the procedures to be used to perform additionalcementing operations, if needed, to cement surface casing from thetop of the cement to the ground surface.
(C) Cement quality.(i) Surface casing strings must be allowed to stand under pressure
until the cement has reached a compressive strength of at least500 psi in the zone of critical cement before drilling plug or ini-tiating a test. The cement mixture in the zone of critical cementshall have a 72-hour compressive strength of at least 1,200 psi.
(ii) An operator may use cement with volume extenders above thezone of critical cement to cement the casing from that pointto the ground surface, but in no case shall the cement have acompressive strength of less than 100 psi at the time of drill outnor less than 250 psi 24 hours after being placed.
(iii) In addition to the minimum compressive strength of the cement,the API free water separation shall average no more than sixmilliliters per 250 milliliters of cement tested in accordance withthe current API RP 10B.
(iv) The Commission may require a better quality of cement mixtureto be used in any well or any area if evidence of local condi-tions indicates a better quality of cement is necessary to preventpollution or to provide safer conditions in the well or area.
(D) Compressive strength tests. Cement mixtures for which publishedperformance data are not available must be tested by the operator orservice company. Tests shall be made on representative samples ofthe basic mixture of cement and additives used, using distilled wateror potable tap water for preparing the slurry. The tests must be con-ducted using the equipment and procedures adopted by the AmericanPetroleum Institute, as published in the current API RP 10B. Testdata showing competency of a proposed cement mixture to meet
74 Environmentally Conscious Petroleum Engineering
the above requirements must be furnished to the Commission priorto the cementing operation. To determine that the minimum com-pressive strength has been obtained, operators shall use the typicalperformance data for the particular cement used in the well (contain-ing all the additives, including any accelerators used in the slurry) atthe following temperatures and at atmospheric pressure.(i) For the cement in the zone of critical cement, the test temperature
shall be within 10 degrees Fahrenheit of the formation equilib-rium temperature at the top of the zone of critical cement.
(ii) For the filler cement, the test temperature shall be the temperaturefound 100 feet below the ground surface level, or 60 degreesFahrenheit, whichever is greater.
(E) Cementing report. Upon completion of the well, a cementing reportmust be filed with the Commission furnishing complete data con-cerning the cementing of surface casing in the well as specified on aform furnished by the Commission. The operator of the well or hisduly authorized agent having personal knowledge of the facts, andrepresentatives or the cementing company performing the cementingjob, must sign the form attesting to compliance with the cementingrequirements of the Commission.
(F) Centralizers. Surface casing shall be centralized at the shoe, aboveand below a stage collar or diverting tool, if run, and through usable-quality water zones. In nondeviated holes, pipe centralization asfollows is required: a centralizer shall be placed every fourth jointfrom the cement shoe or to the bottom of the cellar. All centraliz-ers shall meet API spec 10D specifications. In deviated holes, theoperator shall provide additional centralization.
(G) Alternative surface casing programs.(i) An alternative method of freshwater protection may be approved
upon written application to the appropriate District Director. Theoperator shall state the reason (economics, well control, etc.)for the alternative freshwater protection method and outline thealternate program for casing and cementing through the protec-tion depth for strata containing usable-quality water. Alternativeprograms for setting more than specified amounts of surfacecasing for well control purposes may be requested on a field orarea basis. Alternative programs for setting less than specifiedamounts of surface casing will be authorized on an individualwell basis only. The District Director may approve, modify,or reject the proposed program. If the proposal is modified orrejected, the operator may request a review by the Director of
Appendix D 75
Field Operations. If the proposal is not approved administra-tively, the operator may request a public hearing. An operatorshall obtain approval of any alternative program before com-mencing operations.
(ii) Any alternate casing program shall require the first string ofcasing set through the protection depth to be cemented in amanner that will effectively prevent the migration of any fluidto or from any stratum exposed to the wellbore outside thisstring of casing. The casing shall be cemented from the shoeto ground surface in a single stage, if feasible, or by a multi-stage process with the stage tool set at least 50 feet below theprotection depth.
(iii) Any alternate casing program shall include pumping sufficientcement to fill the annular space from the shoe or multi-stagetool to the ground surface. If cement is not circulated to theground surface or the bottom of the cellar, the operator shallrun a temperature surveyor cement bond log. The appropriateDistrict Office shall be notified prior to running the requiredtemperature surveyor bond log. After the top of cement outsidethe casing is determined, the operator or his representative shallcontact the appropriate District Director and obtain approval forthe procedures to be used to perform any required additionalcementing operations. Upon completion of the well, a cementingreport shall be filed with the Commission on the prescribed form.
(iv) Before parallel (nonconcentric) strings of pipe are cemented ina well, surface or intermediate casing must be set and cementedthrough the protection depth.
(3) Intermediate casing.(A) Cementing method. Each intermediate string of casing shall be
cemented from the shoe to a point at least 600 feet above the shoe.If any productive horizon is open to the wellbore above the casingshoe, the casing shall be cemented from the shoe up to a point atleast 600 feet above the top of the shallowest productive horizonor to a point at least 200 feet above the shoe of the next shallowercasing string that was set and cemented in the well.
(B) Alternate method. In the event the dIstance from the casIng shoeto the top of the shallowest productive horizon make cementing,as specified above, impossible or impractical, the multi-stage processmay be used to cement the casing in a manner that will effectively sealoff all such possible productive horizons and prevent fluid migration,1 to or from such strata within the wellbore.
76 Environmentally Conscious Petroleum Engineering
(4) Production casing.(A) Cementing method. The producing string of casing shall be cemented
by the pump and plug method, or another method approved by theCommission, with sufficient cement to fill the annular space backof the casing to the surface or to a point at least 600 feet abovethe shoe. If any productive horizon is open to the wellbore above thecasing shoe, the casing shall be cemented in a manner that effectivelyseals off all such possibly productive horizons by one of the methodsspecified for intermediate casing in paragraph (3) of this subsection.
(B) Isolation of associated gas zones. The position of the gas-oil contactshall be determined by coring, electric log, or testing. The producingstring shall be landed and cemented below the gas-oil contact, or setcompletely through and perforated in the oil-saturated portion of thereservoir below the gas-oil contact.
(5) Tubing and storm choke requirements.(A) Tubing requirements for oil wells. All flowing oil wells shall be
equipped with and produced through tubing. When tubing is runinside casing in any flowing oil well, the bottom of the tubing shallbe at a point not higher than 100 feet above the top of the producinginterval nor more than 50 feet above the top of a line, if one is used.In a multiple zone structure, however, when an operator elects toequip a well in such a manner that small through-the-tubing typetools may be used to perforate, complete, plug back, or recompletewithout the necessity of removing the installed tubing, the bottom ofthe tubing may be set at a distance up to, but not exceeding, 1,000feet above the top of the perforated or open-hole interval actuallyopen for production into the wellbore. In no case shall tubing be setat a depth of less than 70% of the distance from the surface of theground to the top of the interval actually open to production.
(B) Storm choke. All flowing oil, gas, and geothermal resource wellslocated in bays, estuaries, lakes, rivers, or streams must be equippedwith a storm choke or similar safety device installed in the tubing aminimum of 100 feet below the mud line.
(c) Texas offshore casing, cementing, drilling, and completion requirements.(1) Casing. The casing program shall include at least three strings of pipe, in
addition to such drive pipe as the operator may desire, which shall be setin accordance with the following program.(A) Conductor casing. A string of new pipe, or reconditioned pipe with
substantially the same characteristics as new pipe, shall be set andcemented at a depth of not less than 300 feet TVD (true verticaldepth) nor more than 800 feet TVD below the mud line. Sufficientcement shall be used to fill the annular space back of the pipe to
Appendix D 77
the mud line; however, cement may be washed out or displaced toa maximum depth of 50 feet below the mud line to facilitate piperemoval on abandonment. Casing shall be set and cemented in allcases prior to penetration of known shallow oil and gas formations,or upon encountering such formations.
(B) .(i) Surface casing. All surface casing shall be a string of new pipewith a mill test of at least 1,100 pounds per square inch (psi)or reconditioned pipe that has been tested to an equal pressure.Sufficient cement shall be used to fill the annular space behindthe pipe to the mud line; however, cement may be washed outor displaced to a maximum depth of 50 feet below the mudline to facilitate pipe removal on abandonment. Surface casingshall be set and cemented in all cases prior to penetration ofknown shallow oil and gas formations, or upon encountering suchformations. In all cases, surface casing shall be set prior to drillingbelow 3,500 feet TVD. Minimum depths for surface casing areas follows.
Surface Casing Depth Table
Proposed Total VerticalDepth of Well Surfaceto 7,000 feet 25% of proposed
Total depth of well7,000–10,000 feet 2,000 feet10,000 and be 2,500 feet
(ii) Casing test. Cement shall be allowed to stand under pressure fora minimum of eight hours before drilling plug or initiating tests.Casing shall be tested by pump pressure to at least 1,000 psi. If,at the end of 30 minutes, the pressure shows a drop, of 100 psi ormore, the casing shall be condemned until the leak is corrected.A pressure test demonstrating a drop of less than 100 psi after30 minutes is proof that the condition has been corrected.
(C) Production casing or oil string. The production casing or oil stringshall be new or reconditioned pipe with a mill test of at least 2,000 psithat has been tested to an equal pressure and after cementing shallbe tested by pump pressure to at least 1,500 psi. If, at the end of30 minutes, the pressure shows a drop of 150 psi or more, the cas-ing shall be condemned. After corrective operations, the casing shallagain be tested in the same manner. Cementing shall be by the pumpand plug method. Sufficient cement shall be used to fill the calculatedannular space above the shoe to protect any prospective producinghorizons and to a depth that isolates abnormal pressure from normal
78 Environmentally Conscious Petroleum Engineering
pressure (0.465 gradient). A float collar or other means to stop thecement plug shall be inserted in the casing string above the shoe.Cement shall be allowed to stand under pressure for a minimum ofeight hours before drilling the plug or initiating tests.
(2) Blowout preventers.(A) Before drilling below the conductor casing, the operator shall install
at least one remotely controlled blowout preventer with a mechanismfor automatically diverting the drilling fluid to the mud system whenthe blowout preventer is activated.
(B) After setting and cementing the surface casing, a minimum of tworemotely controlled hydraulic ram-type blowout preventers (oneequipped with blind rams and one with pipe rams), valves, andmanifolds for circulating drilling fluid shall be installed for thepurpose of controlling the well at all times. The ram-type blowoutpreventers, valves, and manifolds shall be tested to 100% of ratedworking pressure, and the annular-type blowout preventer shallbe tested to 1,000 psi at the time of installation. During drillingand completion operations, the ram-type blowout preventers shallbe tested by closing at least once each trip, and the annular-typepreventer shall be tested by closing on drill pipe once each week.
(3) Kelly cock. During drilling, the well shall be fitted with an upper kellycock in proper working order to close in the drill string below hose andswivel, when necessary for well control. A lower kelly safety valve shallbe installed so that it can be run through the blowout preventer. Whenneeded for well control, the operator shall maintain at all times on the rigfloor safety valves to include:(A) full-opening valve of similar design as the lower kelly safety valves;
and(B) inside blowout preventer valve with wrenches, handling tools, and
necessary subs for all drilling pipe sizes in use.(4) Mud program. The characteristics, use, and testing of drilling mud and
conduct of related drilling procedures shall be designed to prevent theblowout of any well. Adequate supplies of mud of sufficient weight andother acceptable characteristics shall be maintained. Mud tests shall bemade frequently. Adequate mud testing equipment shall be kept on thedrilling platform at all times. The hole shall be kept full of mud at all times.When pulling drill pipe, the mud volume required to fill the hole eachtime shall be measured to assure that it corresponds with the displacementof pipe pulled. A derrick floor recording mud pit level indicator shallbe installed and operative at all times. A careful watch for swabbingaction shall be maintained when pulling out of hole. Mud-gas separationequipment shall be installed and operated.
Appendix D 79
(5) Casinghead.(A) Requirement. All wells shall be equipped with casingheads of suffi-
cient rated working pressure, with adequate connections and valvesavailable, to permit pumping mud-laden fluid between any two stringsof casing at the surface.
(B) Casinghead test procedure. Any well showing sustained pressure onthe casinghead, or leaking gas or oil between the surface casing andthe oil string, shall be tested in the following manner. The well shallbe killed with water or mud and pump pressure applied. Should thepressure gauge on the casinghead reflect the applied pressure, the cas-ing shall be condemned. After corrective measures have been taken,the casing shall be tested in the same manner. This method shall beused when the origin of the pressure cannot be determined otherwise.
(6) Christmas tree. All completed wells shall be equipped with Christmas treefittings and wellhead connections with a rated working pressure equal to,or greater than, the surface shut-in pressure of the well. The tubing shallbe equipped with a master valve, but two master valves shall be usedon all wells with surface pressures in excess of 5,000 psi. All wellheadconnections shall be assembled and tested prior to installation by a fluidpressure equal to the test pressure of the fitting employed.
(7) Storm choke and safety valve. A storm choke or similar safety device shallbe installed in the tubing of all completed flowing wells to a minimumof 100 feet below the mud line. Such wells shall have the tubing-casingannulus sealed below the mud line. A safety valve shall be installed atthe wellhead downstream of the wing valve. All oil, gas, and geothermalresource gathering lines shall have check valves at their connections tothe wellhead.
(8) Pipeline shut-otI valve. All gathering pipelines designed to transport oil,gas, condensate, or other oil or geothermal resource field fluids from awell or platform shall be equipped with automatically controlled shut-off valves at critical points in the pipeline system. Other safety equipmentmust be in full working order as a safeguard against spillage from pipelineruptures.
(9) Training. Effective January 1, 1981, all tool pushers, drilling superin-tendents, and operators’ representatives (when the operator is in controlof the drilling) shall be required to furnish certification of satisfactorycompletion of a USGS-approved school on well control equipment andtechniques. The certification shall be renewed every two years by attend-ing a USGS-approved refresher course. These training requirements applyto all drilling operations on lands which underlie fresh or marine watersin Texas.
80 Environmentally Conscious Petroleum Engineering
APPENDIX E § 3.14. RULE 14. PLUGGING (AMENDEDEFFECTIVE MARCH 1, 1992)†
(a) Application to plug.(1) Notification of intention to plug any well or wells drilled for oil, gas, or
geothermal resources or for any other purpose over which the commissionhas 1urisdiction, except those specifically addressed in § 3.100(f)(1) ofthis title (relating to Seismic Holes and Core Holes) (Statewide Rule 100),shall be given to the commission prior to plugging. Notification shall bemade, in writing, to the district office on the appropriate form.
(2) This written notification must be received by the District Office at leastfive days prior to the beginning of plugging operations and shall show theproposed procedure as well as the complete casing record. The work ofplugging the well or wells shall not commence before the date set out inthe notification for the beginning of plugging operations unless authorizedby the District Director. The operator shall call the District Office at leastfour hours before commencing plugging operations and proceed with thework as outlined, unless the proposed plugging procedure is not approvedby the District Director. Exceptions may be granted at the discretion ofthe District Director when either a workover or a drilling rig is alreadyat work on location, ready to commence plugging operations. Operationsshall not be suspended prior to plugging the well unless the hole is casedand casing is cemented in place in compliance with Commission rules.
(3) The landowner and the operator may file an application to conditionan abandoned well located on the landowner’s tract for usable qualitywater production operations, provided the landowner assumes responsi-bility for plugging the well and obligates himself, his heirs, successors, andassignees as a condition to the Commission’s approval of such applicationto complete the plugging operations. The application shall be made on theform prescribed by the Commission. In all cases, the operator responsiblefor plugging the well must place all cement plugs required by this rule upto the base of the usable quality water strata, as determined by the TexasDepartment of Water Resources.
(4) Before plugging any well, notice shall be given to the surface owner ofthe well site tract, or the resident if the owner is absent. If they so desire,a representative of the surface owner, in addition to the Commission rep-resentative, may be present to witness the plugging of the well. Pluggingshall not be delayed because of the inability to deliver notice to the surfaceowner or resident.
† Source: Amy L. Gilliand, Environmental Reference Manual , 2nd ed., Texas Independent Producers& Royalty Owners Association, Austin, TX, 1993–1994, p. 641–647.
Appendix E 81
(b) Plugging: Commencement of Operations, Extensions, and Responsibility.(1) A plugging record shall be completed, duly verified, and filed, in dupli-
cate, on the appropriate form in the District Office within 30 days afterplugging operations are completed. A cementing report made by the partycementing the well shall be attached to, or made a part of, the pluggingreport.
(2) Plugging operations on each dry or inactive well must be commencedwithin a period of one year after drilling or operations cease and shallproceed with due diligence until completed. For good cause, a reasonableextension of time in which to start the plugging operations may be grantedpursuant to the following procedures.(A) The Commission or its delegate may administratively grant an exten-
sion of time of one year if the well is in compliance with all otherlaws and Commission rules relating to conservation and safety or theprevention or control of pollution, is not a pollution hazard; and(i) provided that the operator pays the proper fee as provided in §
3.76 of this title (relating to Fees, Performance Bonds and Alter-nate Forms of Financial Security Required to be Filed) (StatewideRule 78), obtains a permit for this extension, and no more thanthree extensions have been granted after June 1, 1992 for thewell under the provisions of this clause; or
(ii) the operator files an individual or blanket performance bond asprovided in § 3.76 or a letter of credit.
(B) Any administratively granted extension of time is subject to reviewby the Commission or its delegate at any time.
(C) If the Commission or its delegate declines administratively to grantor to continue an extension of time, the operator shall plug the wellor request a hearing on the matter.
(D) The Commission or its delegate may allow a well to be the sub-ject of more than four extensions granted after June 1, 1992 underthe provisions of subparagraph (A)(i) of this paragraph, upon writtenapplication and a showing that no pollution of surface or subsurfacewater could occur as a result of granting the extension. If such appli-cation is administratively denied, the Commission may subsequentlygrant the extension.
(E) All wells more than 25 years old that become inactive and subject tothe provisions of this paragraph shall be plugged or tested annuallyto determine whether the well poses a potential threat of harm tonatural resources, including surface and subsurface water, oil andgas. In general, a fluid level test is a sufficient test for purposes ofthis subparagraph. However, the Commission or its delegate mayrequire alternate methods of testing, and more frequent tests, if it is
82 Environmentally Conscious Petroleum Engineering
necessary to ensure the well does not pose a potential threat of harmto natural resources. Wells that are returned to continuous production,as evidenced by three consecutive months of production, within a yearafter the well becomes inactive need not be tested. Alternate methodsof testing may be approved by the Commission or its delegate bywritten application and upon a showing that such a test will provideinformation sufficient to determine that the well does not pose athreat to natural resources. No test shall be conducted without priorapproval from the District Office. The District Office shall be notifiedat least three days before the test is conducted. The test results shallbe filed with the District Office, on a Commission-approved form,within 30 days of the completion of the test. Fluid level tests shall beconducted on an annual basis according to the following schedule.
(i) Wells that become both inactive and more than 25 years oldafter June 1, 1992 shall be tested within one year after the wellbecomes both inactive and more than 25 years old, unless thewell has undergone a hydraulic pressure test within five yearsof the date a test is required under this clause and the results ofsuch test are on file with the Commission.
(ii) Wells that are both inactive and more than 45 years old as ofJune 1, 1992 shall be tested before June 1, 1993.
(iii) Wells that are both inactive and 35 to 45 years old as of June1, 1992 shall be tested before June 1, 1994.
(iv) Wells that are both inactive and 25 to 35 years old as of June1, 1992 shall be tested before June 1, 1995.
(F) As of January 1, 1997, all wells that are, or become, both more than25 years old and inactive for more than 10 years, shall be testedfor mechanical integrity so long as the well remains inactive. Suchtests shall be conducted every five years. However, the Commis-sion or its delegate may require that a well undergo a mechanicalintegrity test more frequently than every five years if conditions indi-cate that more frequent testing is necessary to prevent the threatof harm to natural resources. A hydraulic pressure test is a suffi-cient mechanical integrity test for purposes of this section. Alternatemethods of testing for mechanical integrity may be approved by theCommission or its delegate upon written application and a showingthat such alternate method of testing will provide information suffi-cient to determine that the casing is sound and not subject to leakage.No test shall be conducted without prior approval from the DistrictOffice. The District Office shall be notified at least three days beforethe test is conducted. The test results shall be filed with the Dis-trict Office, on a Commission-approved form, within 30 days of thecompletion of the test. Wells for which mechanical integrity tests are
Appendix E 83
conducted pursuant to this subparagraph are not subject to the annualtest requirements of subparagraph (E) of this paragraph.
(3) Proper plugging is the responsibility of the operator of the well. Forpurposes of plugging responsibility, the Commission will presume thatthe operator designated on the most recent Commission-approved Pro-ducer’s Transportation Authority and Certificate of Compliance was theperson responsible for the physical operation and control of the well at thetime the well was abandoned or ceased operation. This presumption maybe refuted at a hearing called for the purpose of determining pluggingresponsibility.
(c) General plugging requirements.(1) In plugging wells, it is essential that all formations bearing usable qual-
ity water, oil, gas, or geothermal resources be protected. All cementingoperations during plugging must be performed under the direct supervi-sion of the operator or his authorized representative, who shall not be anemployee of the service or cementing company hired to plug the well.Direct supervision means supervision on location at the well site.
(2) Cement plugs shall be set to isolate each productive horizon and usablequality water strata. A “productive horizon,” as used in this rule, is definedas any stratum known to contain oil, gas, or geothermal resources incommercial quantities in the area.
(3) Cement plugs must be placed by the circulation or squeeze method throughtubing or drill pipe.
(4) All cement for plugging shall be an appropriate API oil well cementwithout volume extenders and mixed in accordance with API standards.Slurry weights shall be reported on the cementing report. The DistrictDirector may require specified cementing compositions to be used in spe-cial situations; for example, when high temperature, salt section, or highlycorrosive sections are present.
(5) Operators shall use only cementers approved by the Director of FieldOperations. Cementing companies, service companies, or operators canqualify as approved cementers by demonstrating that they are able andqualified to mix and pump cement in compliance with this rule. If theDirector of Field Operations refuses to administratively approve a cement-ing company, the company may request a hearing on the matter. Afterhearing, the examiner shall recommend final action by the Commission.
(6) The District Director may require additional cement plugs to cover andcontain any productive horizon or to separate any water stratum fromany other water stratum if the water qualities or hydrostatic pressuresdiffer sufficiently to justify separation. The tagging of any such plugs andrespotting may be required.
84 Environmentally Conscious Petroleum Engineering
(7) For onshore or inland wells, a 10-foot cement plug shall be placed in thetop of the well, and casing shall be cut off three feet below the groundsurface.
(8) Mud-laden fluid of at least 9 1/2 pounds per gallon shall be placed in allportions of the well not filled with cement. The hole must be in staticcondition at the time the plugs are placed.
(9) Non-drillable material that would hamper or prevent re-entry of a wellshall not be placed in any wellbore during plugging operations, exceptin the case of a well plugged and abandoned under the provision of 16TAC §3.35. Pipe and unretrievable junk shall not be cemented in the holeduring plugging operations without prior approval by the District Director.
(10) All cement plugs, except the top plug, shall have sufficient slurry volumeto fill 100 feet of hole, plus 10% for each 1,000 feet of depth from theground surface to the bottom of the plug.
(11) After plugging work is completed, the operator must fill the rat hole,mouse hole, and cellar, and must remove all loose junk and trash fromthe location. All pits must be backfilled within a reasonable period oftime.
(d) Plugging requirements for wells with surface casing.(1) When insufficient surface casing is set to protect all usable quality water
strata and such usable quality water strata are exposed to the wellborewhen production or intermediate casing is pulled from the well or as aresult of such casing not being run, a cement plug shall be placed from 50feet below the base of the deepest usable quality water stratum to 50 feetabove the top of the stratum. This plug shall be evidenced by taggingwith tubing or drill pipe. The plug must be res potted if it has not beenproperly placed. In addition, a cement plug must be set across the shoeof the surface casing. This plug be a minimum of 100 feet in length andshall extend at least 50 feet above and below the shoe.
(2) When sufficient surface casing has been set to protect all usable qualitywater strata cement plug shall be placed across the shoe of the surfacecasing. This plug shall be a minimum of 100 feet in length and shallextend at least 50 feet above the shoe and at least 50 feet below the shoe.
(3) If surface casing has been set deeper than 200 feet below the base ofthe deepest usable quality water stratum, an additional cement plug shallbe placed inside the surface casing across the base of the deepest usablequality water stratum. This plug shall be a minimum of 100 feet in lengthand shall extend from 50 feet below the base of the deepest usable qualitywater stratum to 50 feet above the top of the stratum.
Appendix E 85
(e) Plugging requirements for wells with intermediate casing.(1) For wells in which the intermediate casing has been cemented through
all usable quality water strata and all productive horizons, a cement plugmeeting the requirements of subsection (c)(10) of this section shall beplaced inside the casing and centered opposite the base of the deepestusable quality water stratum, but extend no less than 50 feet above andbelow the stratum.
(2) For wells in which intermediate casing is not cemented through all usablequality water strata and all productive horizons, and if the casing willnot be pulled, the intermediate casing shall be perforated at the requireddepths to place cement outside of the casing by squeeze cementing throughcasing perforations.
(f) Plugging requirements for wells with production casing.(1) For wells in which the production casing has been cemented through all
usable quality water strata and all productive horizons, a cement plugmeeting the requirements of subsection (c)(10) of this section shall beplaced inside the casing and centered opposite the base of the deepestusable quality water stratum and across any multi-stage cementing tool.
(2) For wells in which the production casing has not been cemented throughall usable quality water strata and all productive horizons and if the casingwill not be pulled, the production casing shall be perforated at the requireddepths to place cement outside of the casing by squeeze cementing throughcasing perforations.
(3) The District Director may approve a cast iron bridge plug to be placedimmediately above each perforated interval, provided at least 20 feet ofcement is placed on top of each bridge plug. A bridge plug shall not beset in any well at a depth where the pressure or temperature exceeds theratings recommended by the bridge plug manufacturer.
(g) Plugging requirements for well with screen or liner.(1) If practical, the screen or liner shall be removed from the well.(2) If the screen or liner is not removed, a cement plug in accordance with
subsection (c)(10) of this section shall be placed at the top of the liner.
(h) Plugging requirements for wells without production casing and open-holecompletions.
(1) Any productive horizon or any formation in which a pressure or formationwater problem is known to exist shall be isolated by cement plugs centeredat the top and bottom of the formation. Each cement plug shall havesufficient slurry volume to fill a calculated height as specified in subsection(c)(10) of this section.
(2) If the gross thickness, of any such formation is less than 100 feet, thetubing or drill pipe shall be suspended 50 feet below the base of the
86 Environmentally Conscious Petroleum Engineering
formation. Sufficient slurry volume shall be pumped to fill the calculatedheight from the bottom of the tubing or drill pipe up to a point at least50 feet above the top of the formation, plus 10% for each 1,000 feet ofdepth from the ground surface to the bottom of the plug.(i) The District Director shall review and approve the “Notification of
Intention to Plug” in a manner so as to accomplish the purposes ofthis section. The District Director may approve, modify, or reject theoperator’s “Notification of Intention to Plug”. If the proposal is mod-ified or rejected, the operator may request a review by the Directorof Field Operations. If the proposal is not administratively approved,the operator may request a hearing on the matter. After hearing, theexaminer shall recommend final action by the Commission.
(ii) Plugging Horizontal Drainhole Wells. All plugs in horizontal drain-hole wells shall be set in accordance with subsection (c)(10) of thissection. The productive horizon isolation plug shall be set from adepth 50 feet below the top of the productive horizon to a depth either50 feet above the top of the productive horizon, or 50 feet above theproduction casing shoe if the production casing is set above the top ofthe productive horizon. If the production casing shoe is set below thetop of the productive horizon, then the productive horizon isolationplug shall be set from a depth 50 feet below the production casingshoe to a depth that is 50 feet above the top of the productive horizon.In accordance with subsection (c)(6) of this section, the Commissionor its delegate may require additional plugs.