environmental science - caribbean examinations council
TRANSCRIPT
CXC A25/U2/10
CARIBBEAN EXAMINATIONS COUNCIL
Caribbean Advanced Proficiency Examinations
CAPE®
ENVIRONMENTAL SCIENCE SYLLABUS
Effective for examinations from May/June 2011
CXC A25/U2/10
© 2010, Caribbean Examinations Council
All rights reserved. No part of this publication may be reproduced, stored in a retrieval system, or transmitted in any form, or by any means electronic, photocopying, recording or otherwise without prior permission of the author or publisher.
Correspondence related to the syllabus should be addressed to:
The Pro-Registrar Caribbean Examinations Council Caenwood Centre 37 Arnold Road, Kingston 5, Jamaica, W.I.
Telephone: (876) 630-5200 Facsimile Number: (876) 967-4972 E-mail address: [email protected] Website: www.cxc.org
Copyright © 2004 by Caribbean Examinations Council The Garrison, St Michael BB14038, Barbados
Published by the Caribbean Examinations Council
CXC A25/U2/10
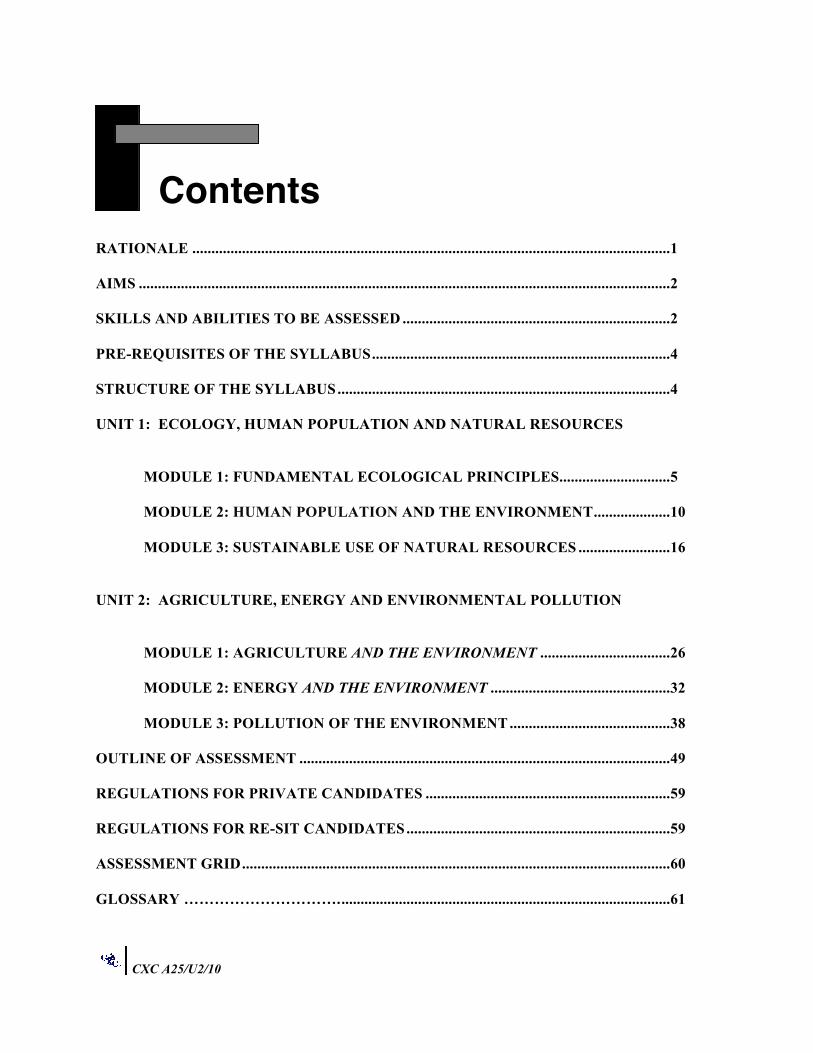
RATIONALE .............................................................................................................................1
AIMS ...........................................................................................................................................2
SKILLS AND ABILITIES TO BE ASSESSED ......................................................................2
PRE-REQUISITES OF THE SYLLABUS..............................................................................4
STRUCTURE OF THE SYLLABUS.......................................................................................4
UNIT 1: ECOLOGY, HUMAN POPULATION AND NATURAL RESOURCES
MODULE 1: FUNDAMENTAL ECOLOGICAL PRINCIPLES.............................5
MODULE 2: HUMAN POPULATION AND THE ENVIRONMENT....................10
MODULE 3: SUSTAINABLE USE OF NATURAL RESOURCES ........................16
UNIT 2: AGRICULTURE, ENERGY AND ENVIRONMENTAL POLLUTION
MODULE 1: AGRICULTURE AND THE ENVIRONMENT ..................................26
MODULE 2: ENERGY AND THE ENVIRONMENT ...............................................32
MODULE 3: POLLUTION OF THE ENVIRONMENT..........................................38
OUTLINE OF ASSESSMENT .................................................................................................49
REGULATIONS FOR PRIVATE CANDIDATES ................................................................59
REGULATIONS FOR RE-SIT CANDIDATES.....................................................................59
ASSESSMENT GRID................................................................................................................60
GLOSSARY ………………………….......................................................................................61
Contents ContentsIntroduction

CXC A25/U2/10
This document CXCA25/U2/10 replaces CXC A25/U2/04 issued in 2004.
Please note that the syllabus has been revised and amendments are indicated by italics.
First Issued 2004 Revised 2010
Please check the website www.cxc.org for updates on CXC’s syllabuses.
CXC A25/U2/10
he Caribbean Advanced Proficiency Examinations (CAPE) are designed to provide certification of the academic, vocational and technical achievement of students in the Caribbean who, having completed a minimum of five years of secondary education, wish to further their studies. The
examinations address the skills and knowledge acquired by students under a flexible and articulated system where subjects are organised in 1-Unit or 2-Unit courses with each Unit containing three Modules. Subjects examined under CAPE may be studied concurrently or singly.
The Caribbean Examinations Council offers three types of certification. The first is the award of a certificate showing each CAPE Unit completed. The second is the CAPE diploma, awarded to candidates who have satisfactorily completed at least six Units, including Caribbean Studies. The third is the CAPE Associate Degree, awarded for the satisfactory completion of a prescribed cluster of seven CAPE Units including Caribbean Studies and Communication Studies. For the CAPE diploma and the CAPE Associate Degree, candidates must complete the cluster of required Units within a maximum period of five years.
Recognized educational institutions presenting candidates for a CAPE Associate Degree in one of the nine categories must, on registering these candidates at the start of the qualifying year, have them confirm in the required form, the Associate Degree they wish to be awarded. Candidates will not be awarded any possible alternatives for which they did not apply.
T
T
Introduction

CXC A25/U2/10
CXC A25/U2/10 1
♦ RATIONALE
cience plays a major role in the evolution of knowledge by empowering us with the skills required for creative and independent problem-solving. It arouses our natural curiosity, encourages our ability to enquire, to pose questions, and to conduct research required to obtain
answers. This approach leads to the construction of hypotheses, theories and laws that help us to explain natural phenomena, to understand human activities in relation to natural phenomena, and through this to meet the challenge of survival and progress in a diverse and changing world.
The environment and natural resource base of the Caribbean are critical for the welfare of Caribbean people. Natural resource and environmental management and conservation are pre-requisites for sustainable development in the region. Achieving sustainable development requires an appreciation of the value of natural resources and the environment, and the development of the knowledge base and skills required for effective management. A firm grounding in these skills, knowledge and attitudes is provided through a study of Environmental Science.
Environmental Science is an interdisciplinary subject which draws on the content of several disciplines to offer a balanced scientific and holistic perspective of environmental issues. It provides knowledge, skills and attitudes to identify, prevent and solve environmental problems and thereby prepares students for ultimate careers in diverse fields of relevance to environmental management and to sustainable development of the Caribbean Region.
This CAPE syllabus in Environmental Science presents a coherent course of study which provides a specific knowledge base of the environment and which facilitates the development of related skills and attitudes. The syllabus takes into account the requirements for tertiary education at regional and international institutions. It is intended for a wide range of students, including traditional sixth form students, part-time, mature and private students.
T
S
Environmental Science Syllabus
This syllabus will contribute to the development of the Ideal Caribbean Person as articulated by the CARICOM Heads of Government in the following areas: respect for human life and awareness of the importance of living in harmony with the environment; multiple literacies; independent and critical thinking and the innovative application of science and technology to problem solving. Based on the UNESCO Pillars of Learning, this course of study will also contribute to a person who will learn how to do, learn to live together and learn to transform themselves and society.
CXC A25/U2/10 2
♦ AIMSThe syllabus aims to:
1. stimulate interest in the environment;
2. develop an understanding of the interdisciplinary and holistic nature of the environment;
3. develop knowledge and understanding of environmental issues and principles and the abilityto apply these to environmental management, particularly in a Caribbean context;
4. develop the ability to identify critical research questions and formulate hypothesis or guidingstatements.
5. develop the ability to collect, collate, analyze and interpret environmental data;
6. develop the ability to communicate environmental information and ideas logically andconcisely in a variety of forms;
7. provide an understanding of interactions between people and the environment;
8. increase an awareness of the importance of living in harmony with the environment;
9. recognize and evaluate the socio-economic, political and ethical issues in EnvironmentalScience;
10. foster positive attitudes, values and commitment to identifying, solving and preventingenvironmental problems;
11. develop an understanding of how natural resources and the environment affect quality of lifeand the quest for sustainable development in the Caribbean.
♦ SKILLS AND ABILITIES TO BE ASSESSED
The skills and abilities which students are expected to develop on completion of the syllabus have been grouped under three main headings:
(i) Knowledge and Comprehension; (ii) Application of Knowledge; (iii) Practical Abilities.
CXC A25/U2/10 3
Knowledge and Comprehension
The examination will test candidates’ skills and abilities to:
(i) Define terms and explain concepts;
(ii) describe processes;
(iii) state principles and properties;
(iv) explain interactions and inter-relationships.
Application of Knowledge
The examination will test candidates’ skills and abilities to:
(i) analyze and discuss different environmental situations;
(ii) evaluate and justify options (for the use of resources);
(iii) compare and contrast alternative solutions to environmental problems;
(iv) select techniques and methodologies appropriate to different environmental situations;
(v) suggest possible solutions to specific environmental problems;
(vi) draw inferences from environmental data.
Practical Abilities
The examination will test candidates’ skills and abilities to:
(i) select techniques, designs, methodologies and instruments appropriate to different environmental situations;
(ii) use instruments to measure environmental parameters;
(iii) collect and collate data;
(iv) analyze, interpret and present data;
(v) use quantitative techniques appropriately;
(vi) develop appropriate solutions to specific environmental problems.
CXC A25/U2/10 4
♦ PRE-REQUISITES OF THE SYLLABUS
Any person with a good grasp of the contents of the Caribbean Secondary Education Certificate (CSEC) Integrated Science or Physics or Chemistry or Biology or Geography or Agricultural Science syllabuses, or the equivalent, should be able to pursue the course of study defined by the syllabus. However, successful participation in the course of study will also depend on the possession of good verbal and written communication skills.
♦ STRUCTURE OF THE SYLLABUS
The subject is organised in two Units. Each Unit contains a body of knowledge and skills drawn from several disciplines that impact on the environment. Unit 1 addresses Ecology, Human Population and Natural Resource Use, while Unit 2 deals with Agriculture, Energy, and Environmental Pollution.
A Unit comprises three Modules, each requiring 50 hours. The total time for each Unit, is therefore, expected to be 150 hours. Each Unit can independently offer students a comprehensive programme of study with appropriate balance between depth and coverage to provide a basis for further study in this field.
UNIT 1: Ecology, Human Population and Natural Resources
Module 1 - Fundamental Ecological Principles Module 2 - Human Population and the Environment Module 3 - Sustainable Use of Natural Resources
UNIT 2: Agriculture, Energy and Environmental Pollution
Module 1 - Agriculture and the Environment Module 2 - Energy and the Environment Module 3 - Pollution of the Environment
In this syllabus, the specific objectives which are denoted by an asterisk (*) are particularly suitable for practical exercises. However, the project need not be limited to these objectives.
CXC A25/U2/10 5
♦ UNIT 1: ECOLOGY, HUMAN POPULATION AND NATURALRESOURCES
MODULE 1: FUNDAMENTAL ECOLOGICAL PRINCIPLES
GENERAL OBJECTIVES
On completion of this Module, students should:
1. understand the basic ecological concepts;
2. understand the processes that govern the interactions of organisms with the biotic and abioticcomponents of their environment;
3. understand the relationship between people and the environment;
4. acquire knowledge and develop practical and analytical skills.
SPECIFIC OBJECTIVES EXPLANATORY NOTES
Students should be able to:
1. differentiate between key ecological terms and concepts;
Ecology: species, population, community, ecosystem, biosphere, atmosphere, hydrosphere, lithosphere, habitat, niche, biome, ecotone.
2. explain the relationship betweenliving organisms and theirenvironment;
(i) The biotic and abiotic environments.
(ii) Tolerance ranges and limiting factors.
(iii) Ecological niches:
(a) fundamental niche;
(b) realised niche.
CXC A25/U2/10 6
UNIT 1 MODULE 1: FUNDAMENTAL ECOLOGICAL PRINCIPLES (cont’d)
SPECIFIC OBJECTIVES EXPLANATORY NOTES
Students should be able to:
3. outline the importance ofbiogeochemical cycles;
(i) Carbon Cycle.
(ii) Nitrogen Cycle.
(iii) Phosphorus Cycle.
(iv) Water Cycle.
Include basic chemical equations and formula for biogeochemical cycles.
4. Explain the significance ofbiogeochemical cycles to organisms;
5. explain how energy and nutrientsflows within ecosystems;
(i) Productivity of producers and ecosystems.
(ii) Food chains and webs.
(iii) Trophic levels.
(iv) Ecological pyramids.
6. discuss types of interactions betweenorganisms in communities;
(i) Competition.
(ii) Predator-prey.
(iii) Symbiosis:
(a) parasitism;
(b) commensalism;
(c) mutualism.
7. explain how ecosystems are self-sustaining;
Ecological succession and climax communities.
8. explain the process of natural selectionand adaptation to the environment;
Natural selection, evolution and adaptation.
CXC A25/U2/10
7
SPECIFIC OBJECTIVES
EXPLANATORY NOTES
Students should be able to: 9. determine population size using
appropriate sampling methods; Population sampling methods for moving and
non-moving organisms (for example, quadrats, transects, capture, mark, release, recapture).
10. calculate species diversity;
Where D – species Diversity N – total number of organism of all species n - total number of organism of a particular species
11. analyse the relationship between species diversity and ecosystem stability;
(i) Diversity within species. (ii) Diversity between species. (iii) Community and ecosystem stability.
12. identify factors affecting population growth in a natural ecosystem;
(i) Biotic potential.
(ii) Exponential population growth.
(iii) Environmental resistance. 13. explain the concept of carrying
capacity;
14. evaluate human interactions within
natural ecosystems;
(i) Human beings as part of the natural ecosystems.
(ii) Benefits of natural ecosystems. (iii) Anthropogenic impact on ecosystems and
biodiversity and the need to maintain its integrity.
15. investigate at least two ecosystems
in a territory;* Consider both terrestrial and aquatic (freshwater
and marine) ecosystems.
UNIT 1 MODULE 1: FUNDAMENTAL ECOLOGICAL PRINCIPLES (cont’d)
CXC A25/U2/10
8
16.
measure and discuss environmental parameters in a given habitat;*
17. apply scientific method to
experimental design and analysis; See suggested teaching-learning activities.
18. Present and interpret data using
appropriate charts, table, graphs.
Suggested Teaching and Learning Activities To facilitate students’ attainment of the objectives of this Module, teachers are advised to engage students in the teaching and learning activities listed below. 1. Define environmental science 2. Formulate hypothesis, develop guiding statements and generate and interpret data. 3. Discuss current environmental issues and highlight the importance of adopting an inter-
disciplinary approach. 4. Sample an ecosystem to determine population density and distribution. 5. Conduct study visits, to identify species diversity. 6. Investigate environmental parameters in a natural aquatic environment. 7. Create models of existing ecosystems in a specific location. 8. Create food webs and analyse possible disruption of feeding relationships. 9. Study the source(s) and distribution of a country’s freshwater supply and its level of
dependence on natural water cycles. 10. Visit to an ecosystem to identify and quantify human use of its components.
UNIT 1 MODULE 1: FUNDAMENTAL ECOLOGICAL PRINCIPLES (cont’d)
CXC A25/U2/10
9
UNIT 1 MODULE 1: FUNDAMENTAL ECOLOGICAL PRINCIPLES (cont’d) RESOURCES Botkin, D., and Keller, E. Environmental Science: Earth as a Living Planet, New York:
John Wiley and Sons, 1997. Chiras, Daniel D. Environmental Science. Action for a Sustainable Future,
United States of America: The Benjamin/Cummings Publishing Company Inc., 1994.
Cunningham, W. and Saigo, B. Environmental Science. A Global Concern, New York:
McGraw Hill, 2001. Ehrlich, P. and Ehrlich, A. The Population Explosion, New York: Simon and Schuster,
1990. Jackson, et al. Global Issues 1999-2000, Guilford, CT: Duskin Publishing
Group Inc., 1998. Jordan, C. Conservation, New York: John Wiley and Sons, 1995. Miller, G. Tyler Living in the Environment, Principles, Connections and
Solutions: Wadsworth Publishing, California, 1994.
Nebel, B. and Wright, R. Environmental Science: The Way the World Works, New
Jersey: Prentice Hall, 1997. The Cropper Foundation (TCF), 2009. Sustainable
Development. Terms and concept: A reference for teachers and student. Port-of-Spain, Trinidad
Biodiversity of the Caribbean. A learning Resource
prepared for Eastern Caribbean States, Canada: EKOS Communications Inc. 2009.
Websites: www.redlist.org/info/captions www.biomeso.net [email protected]
CXC A25/U2/10
10
UNIT 1 MODULE 2: HUMAN POPULATION AND THE ENVIRONMENT GENERAL OBJECTIVES On completion of this Module, students should: 1. understand the historical and geographical trends in human population growth and
consumption patterns; 2. understand the socio-environmental impacts related to population growth; 3. understand the factors that affect the growth rate of human populations; 4. appreciate the need for sustainable development; 5. acquire knowledge and develop practical and analytical skills.
SPECIFIC OBJECTIVES EXPLANATORY NOTES
Students should be able to: 1. assess the relationship between people
and the environment; (i) Adaptation of people to the environment
(including but not limited to how people adapt to the environment, crops they grow, culture, clothes, shelter).
(ii) Abiotic and biotic factors that affect the
distribution of population and their activities.
(iii) Dependence of people on ecological
systems and processes. 2. explain the demographic
characteristics of human population;
(i) Age and sex structure.
(ii) Fertility rates.
(iii) Mortality rates.
(iv) Life span and life expectancy.
(v) Immigration.
(vi) Emigration.
(vii) Doubling time.
CXC A25/U2/10
11
UNIT 1 MODULE 2: HUMAN POPULATION AND THE ENVIRONMENT (cont’d)
SPECIFIC OBJECTIVES EXPLANATORY NOTES
Students should be able to: 3. describe historical trends in human
population size;
Compare historical and current trends in human population growth.
4. describe the current geographical
distribution of human population growth;
Current geographical distribution of human population growth:
(i) in developing nations; (ii) in developed nations.
5. interpret demographic tables, graphs
and charts;
(i) Age and sex structure. (ii) Fertility rate, mortality rate, birth rate,
6. calculate changes in demographic
characteristics;
(i) Population size and growth rate. Fertility rate; mortality rate; migration rate, birth rate.
(ii) Percentage increase in population
(iii) Doubling time
7. assess the factors affecting population
growth rate;
(i) Culture.
(ii) Religion.
(iii) Level and cost of education.
(iv) Social and economic status of women.
(v) Availability of pension schemes.
(vi) Level of affluence.
(vii) Economic development.

CXC A25/U2/10
12
UNIT 1 MODULE 2: HUMAN POPULATION AND THE ENVIRONMENT (cont’d)
SPECIFIC OBJECTIVES EXPLANATORY NOTES
Students should be able to:
8. assess the effectiveness of population control methods and measures;
Population Control Measures: (i) Direct - Family Planning measures and
methods, government policies (ii) Indirect - Natural disasters (floods,
earthquakes, volcanoes, hurricanes). 9. assess the relationship between
population growth and poverty; (i) The Indices of poverty:
(a) access to education; (b) access to health care; (c) access to basic needs such as
food, housing, water. (ii) Per capita, Gross Domestic Product and
Gross National Product (GDP and GNP), Human Development Index (HDI), Gender Development Index (GDI).
(iii) Environmental impacts of population
growth (for example, deforestation in Haiti. Include social, biological, economic, physical considerations).
10. describe current geographical
variation in human consumption patterns;
(i) Consumption patterns as quantified by statistics on:
(a) per capita water consumption;
(b) per capita food consumption;
(c) per capita fuel consumption;
(d) per capita greenhouse gas emissions;
(e) per capita waste production.
CXC A25/U2/10 13
UNIT 1 MODULE 2: HUMAN POPULATION AND THE ENVIRONMENT (cont’d)
SPECIFIC OBJECTIVES EXPLANATORY NOTES
Students should be able to:
(ii) Current trends in per capita consumption particularly influenced by lifestyles in developed and developing countries.
11. explain the principal ways in whichpeople impact negatively on theenvironment;
Environmental impacts of over consumption in developed and developing countries.
(i) Overexploitation.
(ii) Habitat destruction.
(iii) Pollution.
(iv) Introduction of exotic species.
12. explain how the impacts mentionedin Specific Objective 11 may bemitigated;
(i) Change in lifestyles.
(ii) The use of substitutes.
(iii) Application of environmentally friendly technology.
(iv) Efficient use of natural resources, for example, recycling. Refer to Module 3, Specific Objective 10.
13. explain the environmental impactsof urbanisation;
(i) Causes of urbanisation.
(ii) Environmental impacts of urbanisation (including but not limited to sanitation, water supply, traffic congestion, housing, pollution, health care).
14. explain the relationship betweenpopulation growth and sustainabledevelopment.
(i) Concept of sustainable development.
(ii) Goals of sustainable development.
CXC A25/U2/10
14
(iii) Population growth and changing
consumption patterns as constraints to sustainable development in a finite world.
(iv) Strategic Imperative for Sustainable
Development #4 “Ensuring a Sutainable Level of Population” (Our Common Future, Brundtland Report, 1987).
Suggested Teaching and Learning Activities To facilitate students’ attainment of the objectives of this Module, teachers are advised to engage students in the teaching and learning activities listed below. 1. Study a local population based on census statistics; generate population age structure, for all
individuals and separately by sex. 2. Calculate crude birth rates, age-specific birth rates, total fertility rates, crude death rates, age-
specific death rates, infant mortality rates, percentage annual increase in population size, and doubling times for populations.
3. Interpret World Population Data Sheets, as produced, for example, by the Population
Reference Bureau Inc. 4. Arrange a debate on high population growth or high consumerism as principal causes of
global environmental problems, using, for example, reports from the 1992 Rio Conference. 5. Conduct case studies of population size management and of related changes in consumption
patterns. 6. Organise a debate on the definitions of development and sustainable development, and on the
question of what constitutes an acceptable standard of living. 7. Discuss the main issues addressed by:
(i) the 1972 Stockholm Conference; (ii) the 1980 International Union for the Conservation of Nature (IUCN) World
Conservation Strategy;
(iii) the 1987 Brundtland Report (Our Common Future);
UNIT 1 MODULE 2: HUMAN POPULATION AND THE ENVIRONMENT (cont’d)
CXC A25/U2/10
15
(iv) the 1992 United Nations Conference on Environment and Development (The Rio
Conference); (v) the 1994 United Nations Conference on Small Island Developing States; (vi) the 2002 World Summit on Sustainable Development Johannesburg.
RESOURCES Chiras, D. Environmental Science. Action for a Sustainable Future,
United States of America: The Benjamin/Cummings Publishing Company, Inc. 1994.
Cunningham, W. and Saigo, B. Environmental Science, A Global Concern: Sixth Edition, New
York: McGraw Hill, 2001. Ehrlich, P. and Ehrlich, A. The Population Explosion, New York: Simon and Schuster,
1990. Jordan, C. F. Conservation, New York: John Wiley and Sons, 1995. Miller, G. Tyler
Living in the Environment, Principles, Connections and Solutions: Wadsworth Publishing, California, 1994.
Nebel, B., and Wright, R. Environmental Science: The Way the World Works, New
Jersey: Prentice Hall, 1997. WWF, IUCN, UNEP Caring for the Earth: A Strategy for Sustainable Living, 1981. Websites: www.american.edu/TED/hp21.htm www.undp.org/gef/ www.un.org.esa/esa/sustdev/documents/agenda21/index.htm
The Cropper Foundation (TCF), Sustainable Development. Terms and concept: A reference for teachers and student. Port-of-Spain, Trinidad: 2009. Biodiversity of the Caribbean. A learning Resource prepared for Eastern Caribbean States, 2009. Canada: EKOS Communications Inc.
UNIT 1 MODULE 2: HUMAN POPULATION AND THE ENVIRONMENT (cont’d)
CXC A25/U2/10
16
UNIT 1 MODULE 3: SUSTAINABLE USE OF NATURAL RESOURCES
GENERAL OBJECTIVES On completion of this Module, students should: 1. be aware of the major ‘natural resources’ in the Caribbean; 2. understand the factors affecting natural resource use and the environmental impacts of their
use; 3. be aware of measures and tools available for sustainable use and conservation of natural
resources; 4. understand the value of natural resources; 5. understand the concept of ecological sustainability and implications for natural resource use; 6. acquire knowledge and develop practical and analytical skills.
SPECIFIC OBJECTIVES EXPLANATORY NOTES
Students should be able to: 1. explain the term natural resources; Temporal Dimensions and limitations placed by
technology. 2. differentiate between renewable and
non-renewable natural resources; exhaustible and inexhaustible resources;
(i) Types and examples of natural resources: renewable and non-renewable.
(ii) Types and examples of exhaustible and
inexhaustible resources. 3. differentiate between the consumptive
and non-consumptive use of natural resources;
(i) Consumptive use (logging, fishing, quarrying).
(ii) Non-consumptive use - bioprospecting,
ecotourism, research.
CXC A25/U2/10
17
SPECIFIC OBJECTIVES EXPLANATORY NOTES
Students should be able to: 4.
identify the major categories of natural resources in Caribbean countries;
(i) Biodiversity: (a) species (b) genetic (c) Ecosystems: forest; coral reefs;
wetlands; seagrass beds; mangroves; freshwater and marine ecosystems.
(ii) Water as a resource, for example, waterfalls, lakes, streams, groundwater.
(iii) Minerals and hydrocarbons: bauxite; gold;
sand and gravel; oil; natural gas.
(iv) Soil, landscape and seascape, (beaches, cliffs, mountains).
5. identify the location and distribution of
natural resources in the Caribbean;
6. assess the importance of natural
resources in the Caribbean;
(i) Livelihood (Income generating activity). (ii) Foreign exchange earner. (iii) Food security. (iv) Raw material for industrial processes. (v) Recreation. (vi) Sacred and spiritual value. (vii) Ecosystem value. (viii) Intrinsic value. (ix) Research and teaching.
UNIT 1 MODULE 3: SUSTAINABLE USE OF NATURAL RESOURCES (cont’d)
CXC A25/U2/10
18
UNIT 1 MODULE 3: SUSTAINABLE USE OF NATURAL RESOURCES (cont’d)
SPECIFIC OBJECTIVES EXPLANATORY NOTES
Students should be able to: 7. evaluate factors affecting natural resource use in the Caribbean;
(i) Political - government policies on natural resource use:
(a) economic development
policies; (b) environmental and natural resources policies.
(ii) Economic: role of foreign investment; export of natural resources as primary products; sectoral activities - tourism, agriculture, mining, manufacturing, national debt.
Refer to Specific Objective 10, Explanatory Note (iv).
8. access the environmental impact of
natural resource use including tourism; (i) Biodiversity:
(a) species depletion and
extinction; (b) habitat disruption and
destruction; (c) disruption of ecosystem
processes.
CXC A25/U2/10
19
UNIT 1 MODULE 3: SUSTAINABLE USE OF NATURAL RESOURCES (cont’d)
SPECIFIC OBJECTIVES EXPLANATORY NOTES
Students should be able to: (ii) Water as a resource:
(a) Pollution and depletion of
surface and groundwater, degradation of water, depletion of aquifers. Human health risks (water borne disease)
(b) watershed destruction.
(iii) Minerals and hydrocarbons:
(a) physical conversion of vegetation and land;
(b) transformation of landscape (c) dust and noise pollution;
(d) pollution from the discharge of
process chemicals;
(e) sedimentation and siltation;
(f) beach loss and change in river course;
(g) oil spills;
(h) human health risks;
(i) social dynamics (displacement of
communities and introduction of new settlements).
CXC A25/U2/10
20
SPECIFIC
OBJECTIVES EXPLANATORY NOTES
Students should be able to:
(iv) Soil, landscape and seascape:
(a) transformation of natural landscape to built environment;
(b) soil degradation, erosion
and sedimentation; soil productivity
(c) beach erosion
(d) degradation and
destruction of coral reefs, seagrass beds and mangroves
9. justify the need for
natural resource conservation;
(v) Soil, landscape and seascape:
(e) transformation
of natural landscape to built environment;
(f) soil
degradation, erosion and sedimentation; soil productivity
(g) beach erosion
(h) degradation and
destruction of coral reefs, seagrass beds and mangroves
(i) The broad concept of natural resource conservation including: management; rehabilitation; restoration; preservation; conservation (in-situ and ex-situ).
(ii) Reasons for resource conservation:
(a) ecological: depletion or
degradation of natural resources and the threat to sustainable development; conservation of components of life support systems; conservation of endangered and threatened species;
(b) ethical: sacredness; right
to exist;
(c) aesthetical value.
UNIT 1 MODULE 3: SUSTAINABLE USE OF NATURAL RESOURCES (cont’d)
CXC A25/U2/10 21
10. describe measuresand tools availablefor naturalresourcemanagement andconservation;
(i) Rates and techniques for exploitation of renewable resources; Sustainable Yield Management.
(ii) Use of substitutes for non-renewable resources; use of appropriate technology. Refer to Module 2, Specific Objective 12.
(iii) Reduction and minimisation of waste - recycling of solid, liquid and gaseous wastes.
(iv) Use of economic instruments: user fees; taxes; penalties; incentives; economic valuation of natural resources; environmental accounting and greening of national budgets.
(v) Land Use Planning and Zoning Regulation;Integrated Development Planning and Integrated Coastal Zone Management.
(vi) Environmental Impact Assessments (A brief introduction to EIA as a Planning and decision making tool to natural resource management and conservation).
UNIT 1 MODULE 3: SUSTAINABLE USE OF NATURAL RESOURCES (cont’d)
CXC A25/U2/10
22
(vii) Protected Area Systems (International Union for the Conservation of Nature (IUCN) Classification): a. role; b. ecotourism
(viii) Community Based Natural
Resource Management (participation, monitoring and evaluation).
(ix) Environmental legislation,
policies and plans (Sustainable Development Plans, Natural Environmental Action Plans (NEAP), Forest Management Plans, Integrated Coastal Zone Management Plans; Enforcement and implementation.
(x) Education, public awareness,
advocacy and training. (Agenda 21, Chapter 36).
(xi) International environmental and conservation agreements.
(a) United Nations
Framework Convention on Climate Change (UNFCCC and Kyoto Protocol);
(b) United Nations Convention on Biological Diversity (UNCBD);
(c) United Nations
Convention to Combat Desertification (UNCCD);
UNIT 1 MODULE 3: SUSTAINABLE USE OF NATURAL RESOURCES (cont’d)
CXC A25/U2/10
23
UNIT 1 MODULE 3: SUSTAINABLE USE OF NATURAL RESOURCES (cont’d)
SPECIFIC OBJECTIVES EXPLANATORY NOTES
Students should be able to: (d) Specifically Protected Areas and
Wildlife (SPAW);
(e) Ramsar Convention;
(f) Marine Pollution (MARPOL).
11. analyse the effectiveness of measures implemented for natural resource management and conservation;
Refer to SO 10
12. describe ways in which Indigenous
People have used and managed their natural resources.
(i) Agriculture: rotation of fields during slash/burn activities, use of organic fertilizers, intercropping;
(ii) Use of forest: timber and non-timber
forest products (NTFPS); (iii) Fishing: traditional fishing methods (iv) Case studies from Belize, Dominica,
Guyana, St. Vincent and the Grenadines and Suriname.
Suggested Teaching and Learning Activities
To facilitate students’ attainment of the objectives of this Module, teachers are advised to engage students in the teaching and learning activities listed below.
1. Case studies of Community Based Natural Resources Management, for example, forest,
wetlands. 2. Research on indigenous people and natural resources. 3. Field exercises: species identification; visit to industry; visits and assessment of community
based natural resource management initiatives, visit to indigenous communities.
CXC A25/U2/10
24
UNIT 1 MODULE 3: SUSTAINABLE USE OF NATURAL RESOURCES (cont’d) 4. Discuss the main issues relating to the natural obligation under UNFCCC, UNCCD and the
UNCBD. 5. Visits to or lectures by representatives of natural resource agencies. 6. View videos and slides of natural resource management activities and protected areas. RESOURCES Bossi, R. and Cintro, G. Mangroves of the wider Caribbean: toward sustainable
Management, Barbados: Caribbean Conservation Association, 1990.
Chiras, D. Environmental Science. Action for a Sustainable Future,
United States of America: The Benjamin/Cummings Publishing Company Inc., 1994.
Cunningham, W. and Saigo, B. Environmental Science, A Global Concern, New York:
McGraw Hill, 2001. Cutter, S. and William, R. Exploitation, Conservation, Preservation: A geographic
perspective on natural resource use, John Haynes – Bohaham, 2001.
David, B., Breton, I. Brom, D., and Horne, M.
Wasted Resource Management; Resilience, Adaptation and Community Diversity, Canada: IDRC International Development Research Centre.
Ehrlich, P. and Ehrlich, A. The Population Explosion, New York: Simon and Schuster, 1990.
Goodbody, I. and Thomas-Hope, E.
Natural Resource Management for Sustainable Development of the Caribbean, Canoe Press, University of the West Indies, Mona. 2002
Gupta, A. Ecology and Development in the Third World, New York:
Routledge, 1988. Hinckly, A. Renewable Resources in our Future, New York: Pergamon
Press Limited, 1980. Jordan, C. Conservation, New York: John Wiley and Sons, 1995.
CXC A25/U2/10
25
Miller, G. Tyler
Living in the Environment, Principles Connections and Solutions, California: Wadsworth Publishing Company, 1994.
Nebel, B., and Wright, R. Environmental Science: The Way the World Works, New Jersey: Prentice Hall, 1997.
Tivy, J. and O' Hare, G. Human Impact on the Ecosystem, (Conceptual Frameworks in
Geography) United Kingdom: Longman Group 1982. CERMES, Sustainable Management of 46 Shared Marine
Resources of the Caribbean Large Marine Ecosystem and Adjacent Regions. UWI, Cave Hill campus.
WCD (World Commission on Environment and Development) Our Common Future, 1987.
WWF (World Wildlife Fund) 2008. Local to Global Environmental Conservation. Agenda 21
Websites: www.wri.org/wri/biodiv www.earthwatch.org www.canari.org http://cavehill.uwi.edu/cermes/CLMEPub/ENG/Brochure_Eng. www.panda.org
UNIT 1 MODULE 3: SUSTAINABLE USE OF NATURAL RESOURCES (cont’d)
CXC A25/U2/10
26
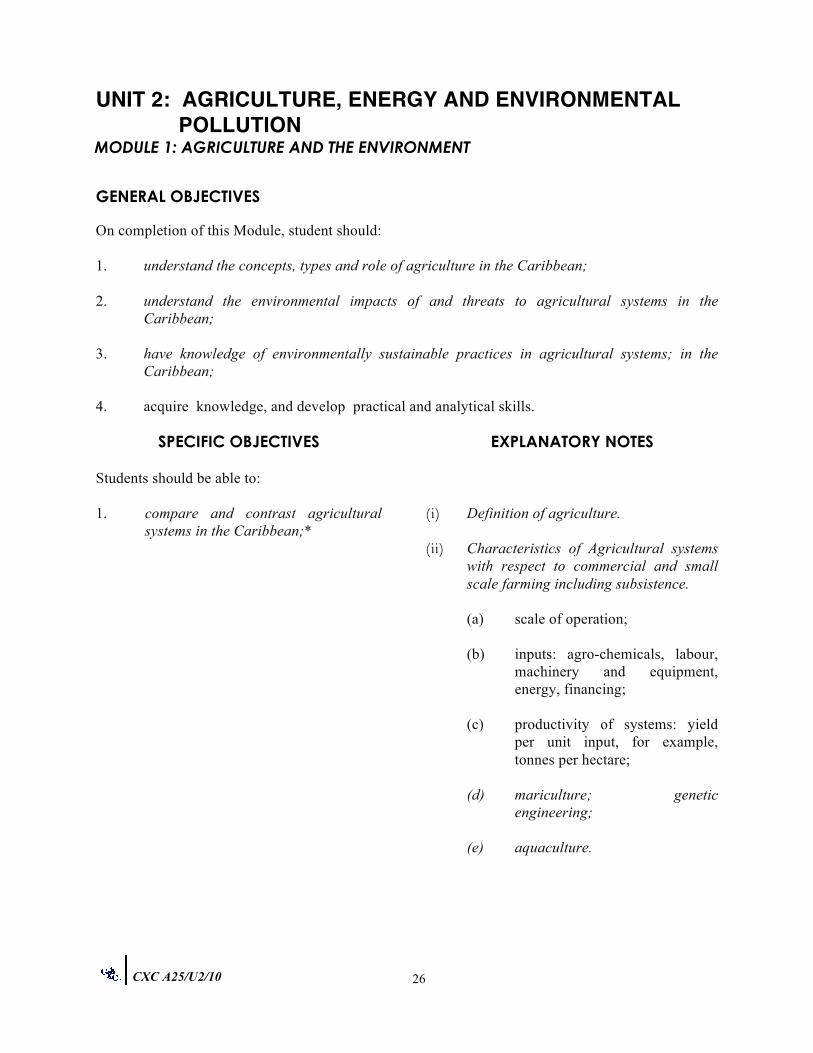
UNIT 2: AGRICULTURE, ENERGY AND ENVIRONMENTAL POLLUTION MODULE 1: AGRICULTURE AND THE ENVIRONMENT
GENERAL OBJECTIVES On completion of this Module, student should: 1. understand the concepts, types and role of agriculture in the Caribbean; 2. understand the environmental impacts of and threats to agricultural systems in the
Caribbean; 3. have knowledge of environmentally sustainable practices in agricultural systems; in the
Caribbean; 4. acquire knowledge, and develop practical and analytical skills.
SPECIFIC OBJECTIVES EXPLANATORY NOTES
Students should be able to: 1. compare and contrast agricultural
systems in the Caribbean;* (i) Definition of agriculture.
(ii) Characteristics of Agricultural systems
with respect to commercial and small scale farming including subsistence.
(a) scale of operation; (b) inputs: agro-chemicals, labour,
machinery and equipment, energy, financing;
(c) productivity of systems: yield
per unit input, for example, tonnes per hectare;
(d) mariculture; genetic
engineering;
(e) aquaculture.
CXC A25/U2/10
27
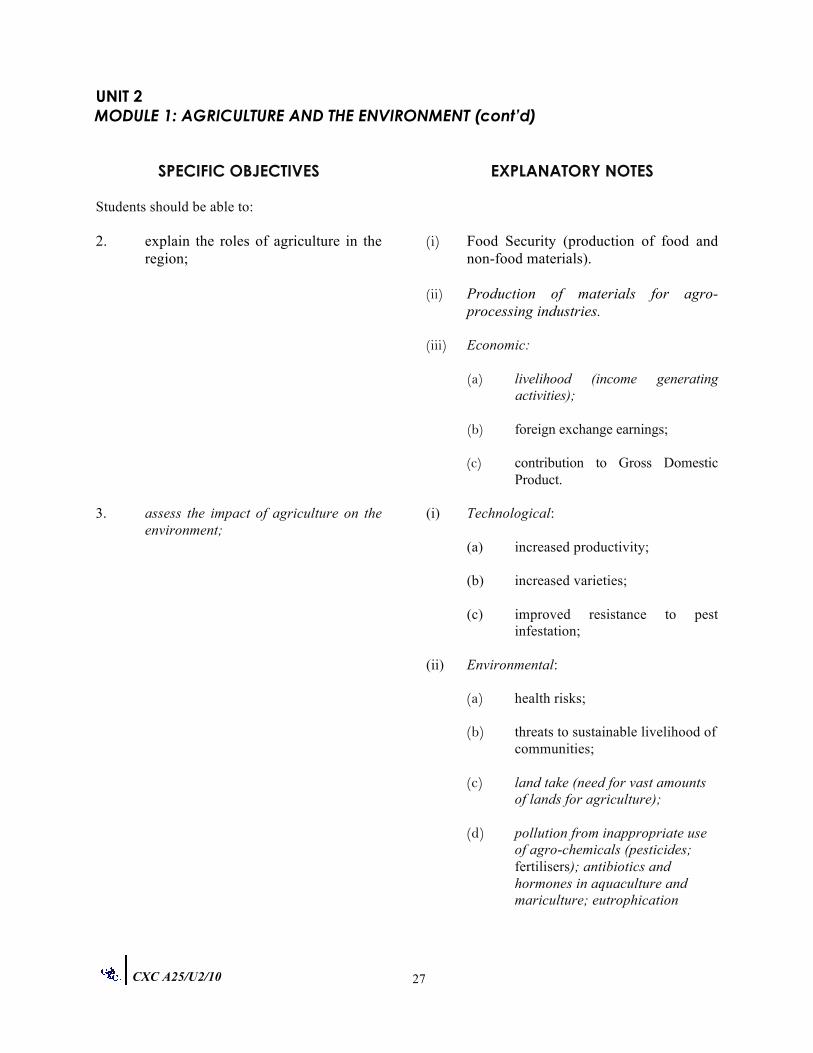
UNIT 2 MODULE 1: AGRICULTURE AND THE ENVIRONMENT (cont’d)
SPECIFIC OBJECTIVES EXPLANATORY NOTES
Students should be able to: 2. explain the roles of agriculture in the
region; (i) Food Security (production of food and
non-food materials). (ii) Production of materials for agro-
processing industries. (iii) Economic:
(a) livelihood (income generating activities);
(b) foreign exchange earnings;
(c) contribution to Gross Domestic Product.
3. assess the impact of agriculture on the
environment; (i) Technological:
(a) increased productivity; (b) increased varieties;
(c) improved resistance to pest
infestation; (ii) Environmental:
(a) health risks; (b) threats to sustainable livelihood of
communities; (c) land take (need for vast amounts
of lands for agriculture); (d) pollution from inappropriate use
of agro-chemicals (pesticides; fertilisers); antibiotics and hormones in aquaculture and mariculture; eutrophication
CXC A25/U2/10
28
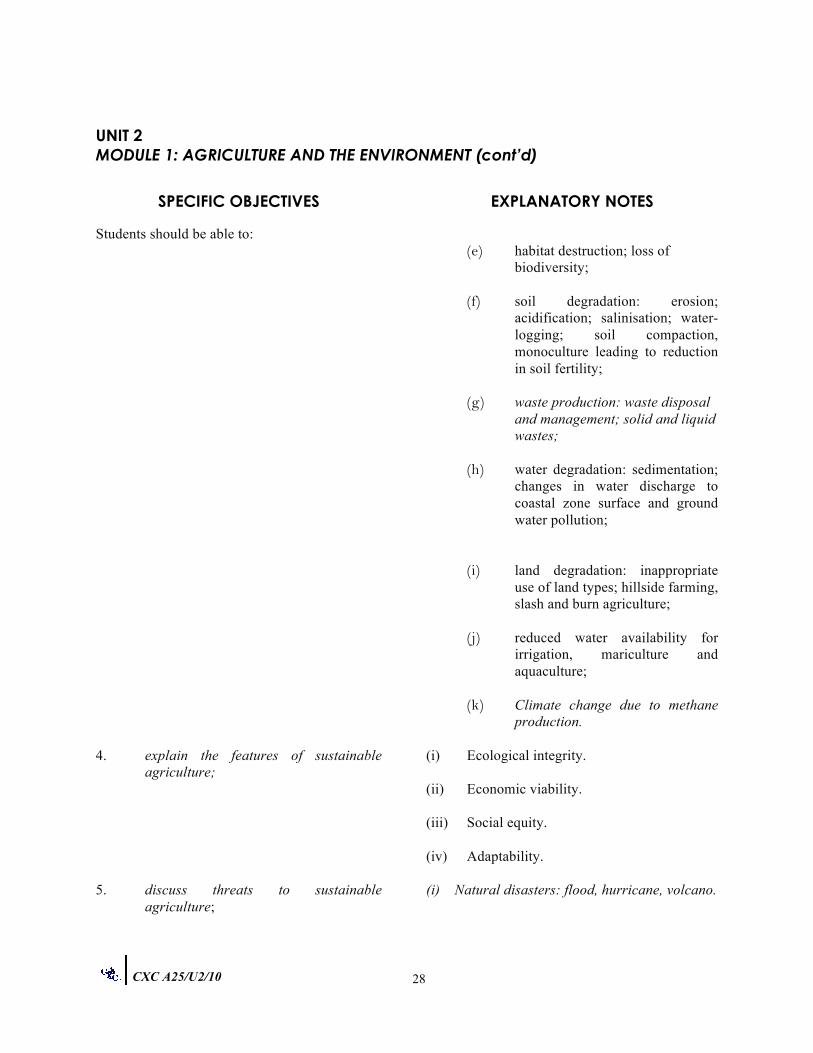
UNIT 2 MODULE 1: AGRICULTURE AND THE ENVIRONMENT (cont’d)
SPECIFIC OBJECTIVES EXPLANATORY NOTES
Students should be able to: (e) habitat destruction; loss of
biodiversity;
(f) soil degradation: erosion; acidification; salinisation; water-logging; soil compaction, monoculture leading to reduction in soil fertility;
(g) waste production: waste disposal
and management; solid and liquid wastes;
(h) water degradation: sedimentation;
changes in water discharge to coastal zone surface and ground water pollution;
(i) land degradation: inappropriate use of land types; hillside farming, slash and burn agriculture;
(j) reduced water availability for
irrigation, mariculture and aquaculture;
(k) Climate change due to methane
production. 4. explain the features of sustainable
agriculture; (i) Ecological integrity.
(ii) Economic viability. (iii) Social equity. (iv) Adaptability.
5.
discuss threats to sustainable agriculture;
(i) Natural disasters: flood, hurricane, volcano.
CXC A25/U2/10
29
UNIT 2 MODULE 1: AGRICULTURE AND THE ENVIRONMENT (cont’d)
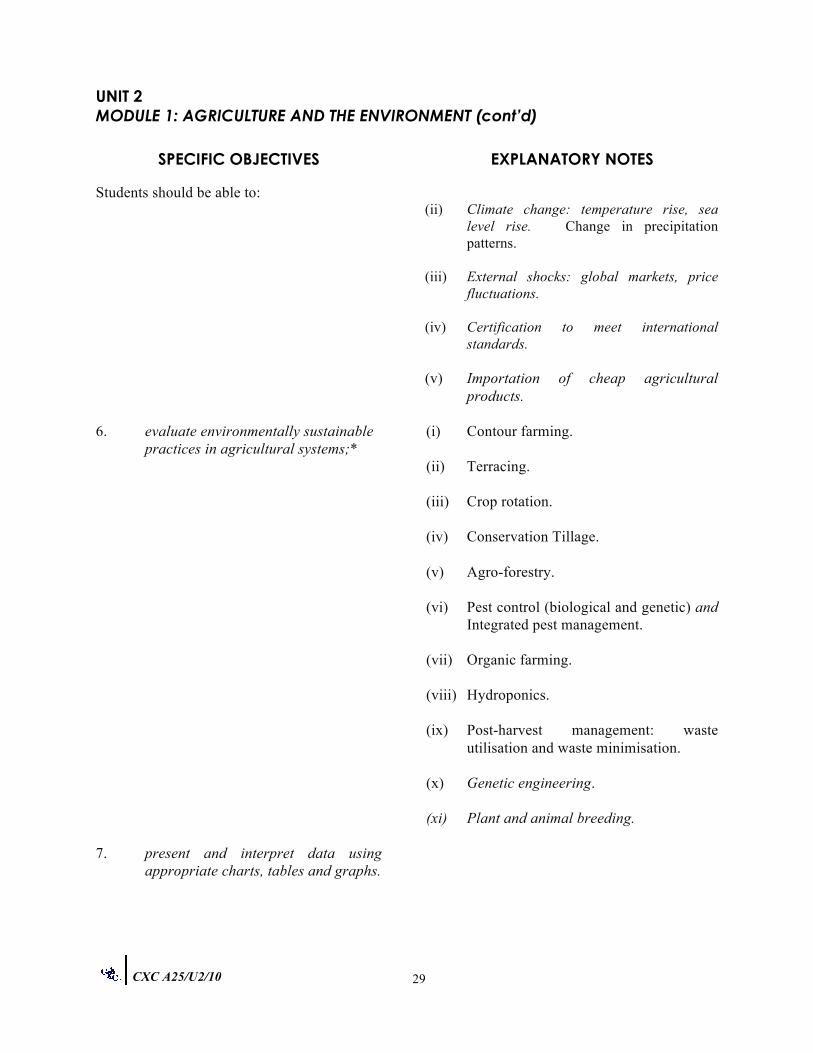
SPECIFIC OBJECTIVES EXPLANATORY NOTES
Students should be able to: (ii) Climate change: temperature rise, sea
level rise. Change in precipitation patterns.
(iii) External shocks: global markets, price fluctuations.
(iv) Certification to meet international standards.
(v) Importation of cheap agricultural
products.
6. evaluate environmentally sustainable
practices in agricultural systems;* (i) Contour farming.
(ii) Terracing. (iii) Crop rotation.
(iv) Conservation Tillage. (v) Agro-forestry. (vi) Pest control (biological and genetic) and
Integrated pest management. (vii) Organic farming. (viii) Hydroponics. (ix) Post-harvest management: waste
utilisation and waste minimisation.
(x) Genetic engineering.
(xi) Plant and animal breeding. 7. present and interpret data using
appropriate charts, tables and graphs.
CXC A25/U2/10
30
UNIT 2 MODULE 1: AGRICULTURE AND THE ENVIRONMENT Suggested Teaching and Learning Activities To facilitate students’ attainment of the objectives of this Module, teachers are advised to engage students in the teaching and learning activities listed below. 1. Conduct field visits to agrochemical factories, agriculture, aquaculture and mariculture farms
to observe and analyse their operations. 2. Provide the opportunities for students to identify agro-chemicals used in territory and analyse
their composition. 3. Invite guest lecturers to discuss issues in agriculture. 4. Allow students to create models illustrating soil erosion. 5. Allow students to conduct fertiliser experiments on plants. 6. Conduct brain-storming sessions to explore entrepreneurial opportunities for use of un-used
production (for example, fruit under trees; non-meat parts of livestock). 7. Collect and document information on land use in a country, to assess how prime agricultural
land is being used. 8. Allow students to conduct investigations on waste production and management in an
agricultural entity. 9. Conduct investigation on water quality at agriculture operations. 10. Give students assignments in which they compare soil types and fertility in different
agricultural systems. 11. Conduct field trips to compare productivity of different farms. RESOURCES
CXC A25/U2/10
31
Arms, K. Environmental Science: Second Edition, Philadelphia: Holt,
Rinehart and Winston, 2007. Byrne, K. Environmental Science: Second Edition, United Kingdom:
Nelson Thornes, 2001. Chiras, D. Environmental Science. Action for a Sustainable Future,
Unites States of America: The Benjamin/Cummings Publishing Company Inc., 1994.
Cunningham, W., and Saigo, B.
Environmental Science, A Global Concern: Sixth Edition, New York: McGraw Hill, 2001.
Ehrlich, P. and Ehrlich, A. The Population Explosion, New York: Simon and
Schuster, 1990. Enger, E. and Smith, B. Environmental Science, A Study of Inter-relationships,
New York: McGraw Hill, 2004. Goodbody, I. and Thomas-Hope, E.
Natural Resource Management for Sustainable Development of the Caribbean, Canoe Press, University of the West Indies, Mona, 2002.
Goudie, A. and Viles, H. The Earth Transformed: An Introduction to Human
Impacts on the Environment: First Edition, Cambridge, Massachusetts: Blackwell Publishers Incorporated, 1997.
Jordan, C. Conservation, New York: John Wiley and Sons, 1995. Nebel, B. and Wright, R. Environmental Science: The Way the World Works, New
Jersey: Prentice Hall, 1997. Miller, G. Tyler
Living in the Environment, Principles, Connections and Solutions, California: Wadsworth Publishing Company, 1994.
WCD (World Commission on Environment and Development) Our Common Future, Brundtland Report, 1987.
Website
www.mhhe.com/environmental science www.ecs.co.sz/env_articles UNIT 2
CXC A25/U2/10
32
MODULE 2: ENERGY AND THE ENVIRONMENT GENERAL OBJECTIVES On completion of this Module, students should: 1. understand the nature of energy and its use; 2. understand the socio-economic and environmental impacts of provision and the use of
energy. 3. appreciate the advantages of using renewable energy sources; 4. acquire knowledge and develop practical and analytical skills in the areas covered.
SPECIFIC OBJECTIVES EXPLANATORY NOTES
Students should be able to: 1. describe the nature, form and
conversion of energy; (i) Definition: energy, kinetic energy,
potential energy, power. (ii) Units of measurement: Joule, MJ, TJ,
GJ, Watt, MW, KWh. (iii) Types of energy: solar, heat, light,
electrical, nuclear, chemical. (iv) Examples of energy and conversion,
efficiency of conversion. (v) Renewable and non-renewable sources
of energy. 2. explain the importance of energy to
society;
(i) Use of energy within societies. (ii) Socio-economic dependency on energy
use.
CXC A25/U2/10
33
UNIT 2 MODULE 2: ENERGY AND THE ENVIRONMENT (cont’d)
SPECIFIC OBJECTIVES EXPLANATORY NOTES Students should be able to:
Primary Energy Sources
3. describe the characteristics of various energy sources;*
A. Non-renewable (i) Fossil fuels: location of reserves,
extraction, transportation processing and uses.
(ii) Nuclear Power: nuclear fission and nuclear fusion; use of nuclear fission, nuclear power plant (basic structure and operation).
(iii) Nuclear fuel cycle
B. Renewable
(i) Solar energy: harnessing and use:
(a) active (photothermal); (b) passive (solar cookers, solar
furnaces);
(c) photovoltaic cells. (ii) Indirect solar power: principal features
and methods of harnessing:
(a) wind energy; (b) hydroelectric energy; (c) biofuels: biomass fuel, biogas.
(iii) Geothermal energy.
(iv) Wave, tidal and ocean thermal energy.
CXC A25/U2/10
34
UNIT 2 MODULE 2: ENERGY AND THE ENVIRONMENT (cont’d)
SPECIFIC OBJECTIVES EXPLANATORY NOTES
Students should be able to:
Secondary Energy Source Fuel cells: structure and process, Proton exchange fuel cell.
(i) Technological limitations
(ii) Geographical restrictions.
(iii) Reliability of supply. (iv) Economic (cost of production),
political (energy policy of country) and social.
5. describe the conventional generation
and distribution of electricity;* (i) Conventional generation.
(ii) Transmission.
6. evaluate the use of renewable
energy;*
7. discuss factors affecting electricity
generating capacity and demand; (i) Generation rates.
(ii) Demand patterns. (iii) Energy storage. (iv) Stock piling capability for fossil fuels. (v) Diversity of energy sources. (vi) Economic cost. (vii) Government policies.
CXC A25/U2/10
35
8. discuss various methods of energy conservation and improving efficiency;
(i) Definition: energy conservation, energy efficiency.
(ii) Approaches to energy conservation
(including but not limited to transportation energy conservation, domestic energy conservation, industrial energy conservation).
Improving energy efficiency: (i) Energy efficient buildings. (ii) Co-generation. (iii) Combined cycles. (iv) Use of alternative energy sources (for
example, biofuels). (v) Use of renewable energy (for example,
wind, solar, water).
(vi) Technological (for example, types of lighting, appliances and machines).
Sustainable lifestyle (practices that reduce the demand on natural resources).
9. outline the impact of various forms of energy in the environment;
(i) Environmental:
(a) global warming; (b) pollution impact; (c) habitat destruction.
(ii) Socio-economic:
(a) health issues; (b) dislocation of communities.
CXC A25/U2/10
36
UNIT 2 MODULE 2: ENERGY AND THE ENVIRONMENT (cont’d)
SPECIFIC OBJECTIVES EXPLANATORY NOTES
Students should be able to:
10. explain the total cost of energy use. (i) Political. (ii) Economic. (iii) Social. (iv) Environmental. (v) Technological.
11. interpret data using appropriate
charts, tables and graphs.
CXC A25/U2/10
37
UNIT 2 MODULE 2: ENERGY AND THE ENVIRONMENT (cont’d) Suggested Teaching and Learning Activities To facilitate students’ attainment of the objectives of this module, teachers are advised to engage students in the teaching and learning activities listed below. 1. Conduct field visits to renewable energy facilities, for example, wind farms, solar water
heater manufacturers and photovoltaic (PV) installations. 2. Conduct research on renewable energy systems used in the country and the extent of their
market penetration. 3. Invite guest lecturers to discuss renewable energy. 4. Use contour maps to evaluate loss of area in the country if global warming leads to sea level
rise. 5. Construct a simple device to measure energy use. 6. Construct a simple renewable energy device, for example, a solar water heater, a solar crop
dryer, a PV powered device, and a simple solar cooker. 7. Allow students to investigate diversity and percentage contribution to total annual generation
capacity in your country. 8. Conduct investigations on energy use in home and school and recommend methods of
improving energy use and conservation. 9. Assign students to conduct an assessment of energy efficiency in buildings with respect to the
features that characterise an energy efficient building. 10. Construct a model to depict an energy efficient building. 11. Assign students to conduct an investigation on the energy use of various sectors. 12. Collect documentation on policies that govern energy use, transportation and extraction, and
promote energy conservation and efficiency.
CXC A25/U2/10
38
UNIT 2 MODULE 2: ENERGY AND THE ENVIRONMENT (cont’d) RESOURCES Arms, K. Environmental Science, Philadelphia: Saunders College
Publishing (Harcourt Brace Publisher), 1994. Byrne, K. Environmental Science: Second Edition, United Kingdom:
Nelson Thornes, 2001. Chiras, D. Environmental Science. Action for a Sustainable Future,
United States of America: The Benjamin/Cummings Publishing Company Inc., 1994.
Cunningham, W. and Saigo, B.
Environmental Science, A Global Concern: Sixth Edition, New York: McGraw Hill, 2001.
Ehrlich, P. and Ehrlich, A. The Population Explosion, New York: Simon and
Schuster, 1990. Enger, E., and Smith, B. Environmental Science, A Study of Inter-relationships,
New York: McGraw Hill, 2002. Goodbody, I. and Thomas-Hope, E.
Natural Resource Management for Sustainable Development of the Caribbean, Canoe Press, University of the West Indies, Mona. 2002
Jordan, C. Conservation, New York: John Wiley and Sons, 1995, Miller, G. Tyler
Living in the Environment, Principles, Connections and Solutions: Wadsworth Publishing Company. Belmont, California, 1994.
Nebel, B., Wright, R. Environmental Science: The Way the World Works, New
Jersey: Prentice Hall, 1997. WCD (World Commission on Environment and
Development) Our Common Future, Brundtland Report, 1987. WWF, IUCN, UNEP - Caring for the Earth: A Strategy for Sustainable Living, 1981.
Websites: www.mhhe.com/environmentalscience www.worldresourcesinstitute www.eclac.org/publications
CXC A25/U2/10
39
UNIT 2 MODULE 3: POLLUTION OF THE ENVIRONMENT GENERAL OBJECTIVES On completion of this Module, students should: 1. be aware of the major types and sources of pollution; 2. understand the environmental impacts of pollution; 3. understand the methods available for monitoring, analyzing and mitigating pollution and its
environmental impacts; 4. acquire knowledge and develop practical and analytical skills in the areas covered.
SPECIFIC OBJECTIVES EXPLANATORY NOTES
Students should be able to: 1. describe the general sources and
nature of pollutants; (i) Definition of pollution and pollutant.
(ii) Local examples of pollutants and
incidences of pollution. (iii) Nature of pollutants: persistence,
mobility, synergistic effects, toxicity. (iv) Movement through the environment.
2. identify environmental receptors of
specific pollutants;* Environmental receptors (micro-organisms,
plants, animals, humans).
3. describe the various pathways of pollution in the ecosystem and the biosphere;
Environmental pathways (biotic and abiotic), feeding relationships, bioaccumulation and biomagnification.
CXC A25/U2/10 40
UNIT 2 MODULE 3: POLLUTION OF THE ENVIRONMENT (cont’d)
SPECIFIC OBJECTIVES EXPLANATORY NOTES
Students should be able to:
4. outline the underlying causes ofpollution;
(i) Resource extraction, transportation, processing and use.
- inappropriate technology, industrialisation;
(ii) Population growth: behavioural pattern, lifestyle, consumption pattern.
- lack of environmental consciousness;
5. outline the underlying causes ofpollution;
(iii) Institutional Framework:
(a) Environmental standards, policies, legislation (Absence and limited implementation).
(b) Limited economic instruments (lack of incentives – tax rebates, limited implementation of pollution principles.
(iv) Lack of environmental ethics.
6. discuss the major sources,impact and mitigation of pollution.*
A. Atmospheric Pollution
(i) The Atmosphere.
(a) structure and composition;
(b) physical processes and features related to the movement of pollutants (wind, air effects of topography on the movement of pollutants).
CXC A25/U2/10
41
UNIT 2 MODULE 3: POLLUTION OF THE ENVIRONMENT (cont’d) SPECIFIC OBJECTIVES EXPLANATORY NOTES Students should be able to: (ii) Primary Air Pollutants:
(a) types: carbon monoxide; nitrogen
oxides; sulphur oxides; suspended particulate matter; volatile organic compounds (include formulae of pollutant);
(b) sources; (c) environmental pathways and
receptors;
(d) environmental impacts (for example, public health, Carbon Monoxide (CO) poisoning, acid rain).
(iii) Secondary Air Pollutants
(a) types: photochemical smog and
acid rain; (b) mechanism of formation and
characteristics including equations;
(c) environmental pathways and
receptors; (d) environmental impacts (for
example, acidification of soil and water, damage to buildings).
CXC A25/U2/10
42
UNIT 2 MODULE 3: POLLUTION OF THE ENVIRONMENT (cont’d) SPECIFIC OBJECTIVES EXPLANATORY NOTES Students should be able to: (iv) Global Impacts of Atmospheric
Pollutants
Global Warming:
(a) greenhouse effect and earth’s heat balance;
(b) sources of greenhouse gases:
anthropogenic and natural; (c) greenhouse effect and global
warming;
(d) impacts of global warming (for example, sea level rise, increased temperatures, increased intensities of weather phenomena;
Ozone Depletion: (a) Ozone depleting substances and
sources: natural and anthropogenic substances;
(b) chemical equation of formation
and destruction of ozone;
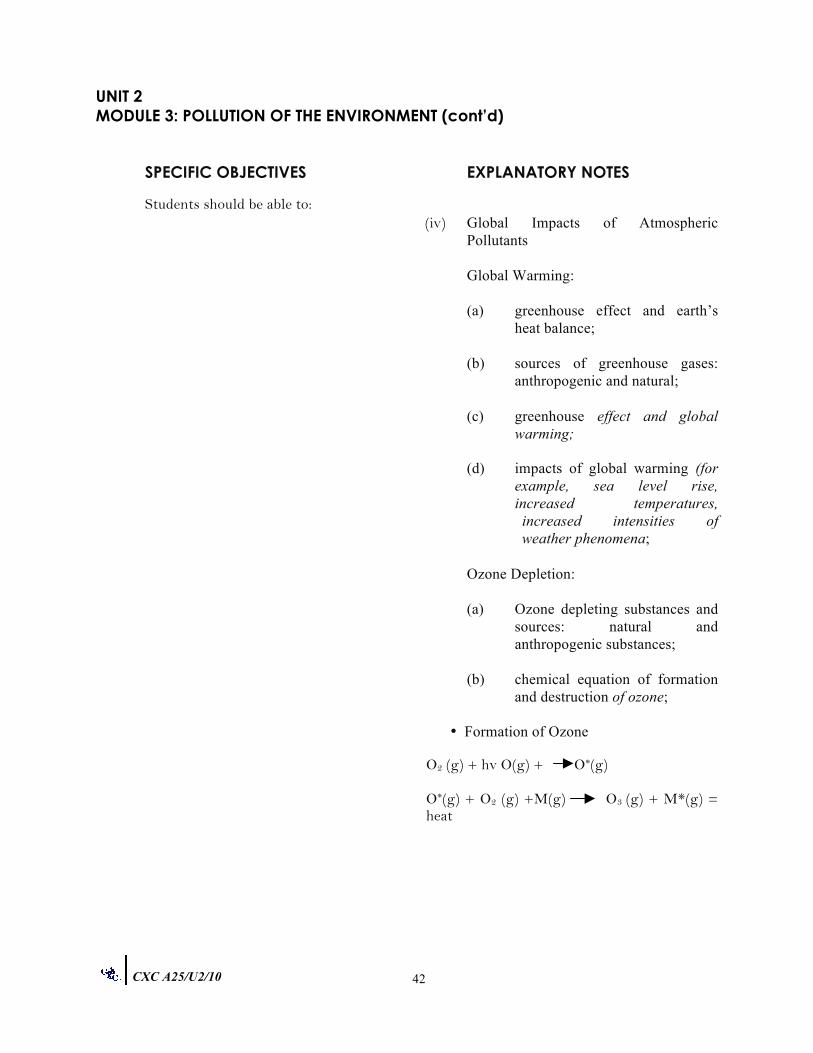
• Formation of Ozone O2 (g) + hv O(g) + O*(g) O*(g) + O2 (g) +M(g) O3 (g) + M*(g) = heat
CXC A25/U2/10
43
UNIT 2 MODULE 3: POLLUTION OF THE ENVIRONMENT (cont’d)
SPECIFIC OBJECTIVES EXPLANATORY NOTES
Students should be able to:
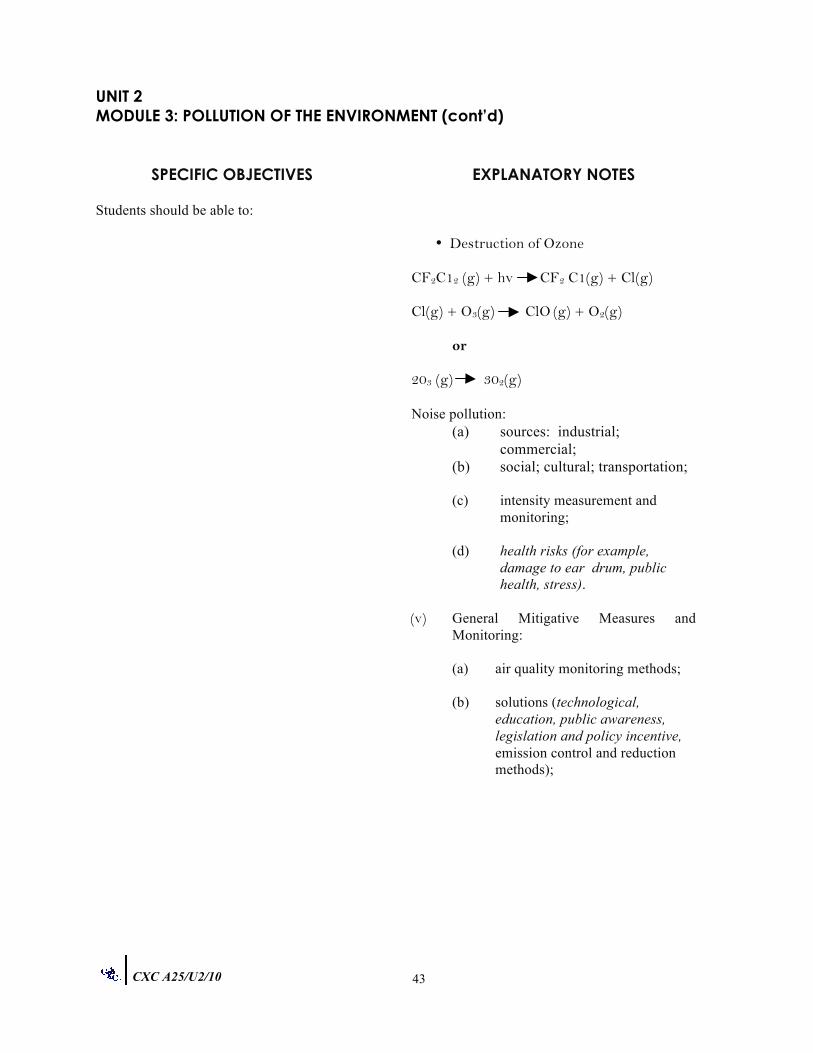
• Destruction of Ozone CF2C12 (g) + hv CF2 C1(g) + Cl(g) Cl(g) + O3(g) ClO (g) + O2(g)
or
203 (g) 302(g)
Noise pollution: (a) sources: industrial;
commercial; (b) social; cultural; transportation;
(c) intensity measurement and
monitoring; (d) health risks (for example,
damage to ear drum, public health, stress).
(v) General Mitigative Measures and
Monitoring: (a) air quality monitoring methods; (b) solutions (technological,
education, public awareness, legislation and policy incentive, emission control and reduction methods);
CXC A25/U2/10
44
UNIT 2 MODULE 3: POLLUTION OF THE ENVIRONMENT (cont’d) SPECIFIC OBJECTIVES EXPLANATORY NOTES Students should be able to: B. Water Pollution
(i) Properties of water:
(a) physical: colour, taste, odour, appearance, turbidity;
(b) chemical: pH, dissolved oxygen
(DO) content, salinity.
Water pollutants and their sources: (sediment, heat, nutrients and biodegradable organic matter, pathogens, sewage and toxic chemicals). Sources (agriculture, municipal and domestic, industrial, atmospheric).
(ii) Point and non-point sources.
(iii) Factors affecting concentration of pollutants:
(a) volume of emission; (b) (c) volume of receiving water; (d) residence time;
(e) rate of degradation and removal
of pollutants. (iv) Environmental pathways and receptors.
(v) Environmental impacts:
(a) eutrophication; (b) deoxygenation;
CXC A25/U2/10
45
UNIT 2 MODULE 3: POLLUTION OF THE ENVIRONMENT (cont’d)
(c) coral reef destruction;
(d) fish kills;
(e) public health issues.
(vi) General mitigative measures and
monitoring. (a) solutions SPECIFIC OBJECTIVES EXPLANATORY NOTES Students should be able to:
(i) technological (treatment of drinking water, treatment of sewage and industrial effluent);
(ii) education and public
awareness;
(iii) legislation and policy, for example, effluent discharge regulations.
(b) water quality monitoring
methods (water quality parameters - nitrates, phosphates, Biological Oxygen Demand (BOD); Chemical Oxygen Demand (COD); Total Suspended Solids (TSS); faecal coliforms. An understanding of the protocol for testing each parameter is required);
CXC A25/U2/10
46
UNIT 2 MODULE 3: POLLUTION OF THE ENVIRONMENT (cont’d)
C. Land Pollution (i) Sources: industrial; agricultural;
municipal; domestic. (ii) Causes of land pollution:
(a) atmospheric fallout; (b) waste disposal (domestic,
industrial, open dumps, sanitary landfills);
(c) dumping of mineral extraction spoils;
(d) agricultural processes (see
Unit 2 Module 1); (e) oil spills.
(iii) Environmental pathways and receptors.
(iv) Environmental impacts (for example, reduced aesthetic quality, lowering of land value, health implications, change in land use).
‘
CXC A25/U2/10 47
SPECIFIC OBJECTIVES EXPLANATORY NOTES
Students should be able to: (v) General mitigative measures and
monitoring
(a) Waste minimisation (reduction, recycling, reuse, rethink).
(b) Environmental Impact Assessments. (Refer to Unit 1, Module 3, Specific Objective 10.)
(c) Legislation, incentives and penalties.
(d) Public awareness and participation.
(e) Public awareness and education.
(f) Clean up of pollution (bioremediation and phytoremediation).
(g) Incineration.
(a) (h) Research and development (research on status of environmental components and development of policy).
6. analyse the environmental impactsof pollution from specific sources;*
(i) Sources (medical and industrial waste).
(ii) Toxic effects (carcinogenic, mutagenic, tetratogenic effects).
(iii) Improper disposal methods.
7. assess the effectiveness of measuresto mitigate environmental impacts ofpollution;
8. discuss the importance ofinternational conventions andagreements regarding pollutioncontrol;
(i) United Nations Convention on Climate Change (UNFCCC) and Kyoto Protocol.
(ii) Montreal Protocol.
CXC A25/U2/10
48
UNIT 2 MODULE 3: POLLUTION OF THE ENVIRONMENT (cont’d) SPECIFIC OBJECTIVES EXPLANATORY NOTES Students should be able to: (iii) International Convention for the
Prevention of Marine Pollution (MARPOL).
(iv) Cartagena Convention. (v) Basel Convention. (vi) United Nations Convention on Law of
the Sea UNCLOS). 9. interpret data using appropriate
charts, tables and graphs.
Suggested Teaching and Learning Activities To facilitate students’ attainment of the objectives of this Module, teachers are advised to engage students in the teaching and learning activities listed below. 1. Assign students to investigate and categorise local pollution problems. 2. Assign students to monitor individual waste production on a weekly basis. 3. Conduct research to compare emission from leaded, unleaded and diesel fuels. 4. Assign experimental work to investigate lead content of vegetation near highways. 5. Conduct field studies on the collection and disposal of garbage. 6. Collect information on industries and their potential to produce pollution. 7. Conduct research to analyse the effectiveness of local legislation to reduce greenhouse gases. 8. Conduct field studies on industries or factories and analysis of their processes with respect to
developing waste reduction strategies. Assign students to investigate respiration ailments in a community.
CXC A25/U2/10
49
UNIT 2 MODULE 3: POLLUTION OF THE ENVIRONMENT (cont’d) 9. Assign students to analyse air and water quality in urban areas. 10. Review relevant literature to establish size and location of ozone hole. 11. Assign students to carry out water quality measurements: and faecal coliform: BOD, COD, TSS, pH. 12. Conduct an investigation on the categories and sources of pollutants in water bodies.
13. Conduct experiments to identify the relationship between DO and temperature.
14. Collect information on the level of sewage treatment at selected treatment plants. 15. Conduct soil sampling exercise for pollutants and their concentration levels (urban, agricultural
and industrial areas). 16. Assign students to conduct home audit for sources and categories of pollutants. 17. Conduct investigations on the extent of recycling activities in the country, identification of waste
that could be recycled. 18. Conduct brain-storming session on business opportunities based on use of waste as a resource. 19. Assign students to measure noise levels. 20. Assign students to develop strategic plans on climate change. 21. Encourage students to garner information on national policies on pollution control. 22. Assign students to collect data on environmental impact assessments and make recommendations.
23. Encourage students to view An Inconvenient Truth and read ITTC Report, Stern Report.
CXC A25/U2/10
50
UNIT 2 MODULE 3: POLLUTION OF THE ENVIRONMENT (cont’d) RESOURCES Arms, K. Environmental Science, Philadelphia: Saunders College Publishing
(Harcourt Brace Publisher), 1994.
Chiras, D. Environmental Science. Action for a Sustainable Future, United States of America: The Benjamin/Cummings Publishing Company Inc., 1994.
Clarke, R. Marine Pollution, Toronto: Oxford University Press Inc., 1997. Cunningham, W. and Saigo, B. Environmental Science, A global concern, McGraw Hill. Enger, E. and Smith, B. Environmental Science, A Study of Inter-relationships, New York:
McGraw Hill, 2002. Farmer, A. Managing Environmental Pollution, London: Routledge, 1997.
Goodbody, I. and Thomas-Hope, E.
Natural Resource Management for Sustainable Development of the Caribbean, Canoe Press, University of the West Indies, Mona, 2002.
Ehrlich, P. and Ehrlich, A. The Population Explosion, New York: Simon and Schuster,
1990. Jordan, C. Conservation, New York: John Wiley and Sons, 1995. Miller, G. Replenish the Earth, California: Wadsworth Publications, 1996. Nebel, B. and Wright, R. Environmental Science: The Way the World Works, New Jersey:
Prentice Hall, 1997. Reeve, R. Environmental Analysis, New York: John Wiley and Sons, 1999. Viessman, W. Jr., and Hammer, M.
Water Supply and Pollution Control, California: Addison Wesley, 1998.
Website: www.mhhe.com/environmentalscience http://www.basel.int/convention/about.html http://ozone.unep.org/publications/exemplary-projects www.occ.gov.uk/activities/stern www.imo.org/safety/mainframe
CXC A25/U2/10
51
♦ OUTLINE OF ASSESSMENT Each Unit will be assessed separately. The scheme of assessment for each Unit will be the same. A candidate’s performance on each Unit will be reported as an overall grade and a grade on each Module of the Unit. The assessment will comprise two components, external and internal. EXTERNAL ASSESSMENT (70%) At the end of the academic year in which a Unit of the syllabus is taken, the student is expected to sit two written papers for a total of 4 hrs.
Paper 01 (1 hour 30 minutes)
The paper comprises forty-five compulsory, multiple-choice items, fifteen based on each Module.
(30%)
Paper 02 (2 hours 30 minutes)
The paper comprises six compulsory questions, two based on each Module.
(40%)
INTERNAL ASSESSMENT (30%) The Internal Assessment in respect of each Unit will contribute 30% to the total assessment of a candidate’s performance on that Unit. (i) Paper 03A
The assessment for each Unit will be in the form of a journal. The journal will comprise reports on site visits and laboratory exercises. The journal should focus on at least one specific objective from any of the three Modules in the Unit and incorporate the relevant practical skills.
(ii) Paper 03B
This is an alternate to Paper 03A and is intended for private candidates.
MODERATION OF INTERNAL ASSESSMENT Each year an Internal Assessment Record Sheet will be sent to schools submitting students for the examinations. All Internal Assessment Record Sheets and sample of assignments must be submitted to CXC by May 31 of the year of the examination. A sample of assignments will be requested for moderation purposes by CXC. These samples will be re-assessed by CXC Examiners who moderate the Internal Assessment. Teachers’ marks may be adjusted as a result of moderation. The Examiners’ comments will be sent to schools.
CXC A25/U2/10
52
Copies of the students’ assignment that are not submitted must be retained by the school until three months after publication by CXC of the examination results. ASSESSMENT DETAILS External Assessment by Written Papers (70% of Total Assessment) Paper 01 (1 hour 30 minutes – 30% of Total Assessment) 1. Composition of the Paper
The paper comprises forty-five multiple-choice items, fifteen items based on each Module. 2. Syllabus Coverage
(i) Knowledge of the entire syllabus is required (ii) The intention of this paper is to test candidates’ knowledge across the breadth of the
syllabus. 3. Question Type
Questions may be based on diagrams, data, graph, photographs or prose. 4. Mark Allocation
(i) One mark will be assigned for each item.
(ii) The maximum mark available for this paper is forty-five and will be weighted to ninety.
(iii) This paper contributes 30% towards the final assessment. (iv) The marks will be awarded for Knowledge and Comprehension, Application of
Knowledge and Practical Abilities. 5. Use of Calculators
Candidates will be allowed to use a non-programmable calculator in the examinations. Each candidate is responsible for providing his/her own calculator and to ensure that it functions throughout the examinations.
6. Use of Geometrical Instruments Candidates are allowed to use geometrical instruments in the examinations. Each candidate is responsible for providing his or her own instruments.
CXC A25/U2/10
53
Paper 02 (2 hours 30 minutes – 70% of Total Assessment) 1. Composition of Paper
The paper is arranged into three sections. Each section represents one of the three Modules of the Unit. Each section contains two compulsory questions.
2. Syllabus Coverage
(i) Comprehensive knowledge of the entire syllabus is required. (ii) Each question may focus on a single theme or develop a single theme or several
unconnected themes. 3. Question Type
Questions are of a free-response form and may be based on diagrams, data, graph, photographs or prose. Responses are to be written in the separate booklet provided.
4. Mark Allocation
(i) Each question is worth 20 marks and the number allocated to each sub-question will appear on the examination paper.
(ii) The maximum mark for this paper is 120.
(iii) This paper contributes 40% towards the final assessment.
(iv) The marks will be awarded for Knowledge and Comprehension, Application of
Knowledge and Practical Abilities. 5. Use of Calculators
Candidates will be allowed to use a non-programmable calculator in the examinations. Each candidate is responsible for providing his/her own calculator and to ensure that it functions throughout the examinations.
6. Use of Geometrical Instruments Candidates are allowed to use geometrical instruments in the examinations. Each candidate is responsible for providing his or her own instruments.
CXC A25/U2/10
54
INTERNAL ASSESSMENT Internal Asessment is an integral part of student assessment in the course covered by this syllabus. It is intended to assist students in acquiring certain knowledge, skills, and attitudes that are associated with the subject. The activity for the Internal Assessment is linked to the syllabus and should form part of the learning activities to enable the student to achieve the objectives of the syllabus. During the course of study for the subject, students obtain marks for the competence they develop and demonstrate in undertaking their Internal Assessment assignments. These marks contribute to the final marks and grades that are awarded to students for their performance in the examination. During the course of study for the subject, students obtain marks for the competence they develop and demonstrate in undertaking their Internal Assessment assignments. These marks contribute to the final marks and grades that are awarded to students for their performance in the examination. The guidelines provided in this syllabus for selecting appropriate tasks are intended to assist teachers and students in selecting assignments that are valid for the purpose of Internal Assessment. The guidelines provided for the assessment of these assignments are intended to assist teachers in awarding marks that are reliable estimates of the achievement of students in the Internal Assessment component of the course. In order to ensure that the scores awarded by teachers are not out of line with the CXC standards, the Council undertakes the moderation of a sample of the Internal Assessment assignments marked by each teacher. The Internal Assessment component is compulsory. The assignment is assessed by the teacher, using Internal Assessment Criteria provided below. The following are the skills that will be assessed: (i) the selection of techniques, designs, methodologies and instruments appropriate to different
environmental situations; (ii) the collection and collation of data; (iii) the analysis, interpretation and presentation of such data; (iv) the use of appropriate quantitative techniques;
(v) the development of appropriate models as possible solutions to specific environmental
problems. The Internal Assessment should relate to at least ONE specific objective in the Unit.
CXC A25/U2/10
55
CRITERIA FOR THE INTERNAL ASSESSMENT The following are the guidelines for assessing the journal. 1. The journal is internally assessed by the teacher and externally moderated by CXC. 2. Each candidate will be required to complete a journal in which he/she will be expected to
demonstrate the practical skills listed on Page 53.
THE JOURNAL
The reports for a series of site-visits and laboratory exercises associated with the site-visits are recorded in the journal. The journal will comprise:
(a) an entry for each site visit (b) a report for the journal (c) a final report on the set of site-visits
Each student is expected to conduct and write a final report on a minimum of four (4) site visits and four (4) laboratory exercises.
(i) Site visits should be based either on visits to one site where changes over a period of
time are observed OR on a series of visits to different sites to compare and contrast similar processes or occurrences.
(ii) Laboratory exercises should relate to each or any of the series of site-visits.
(iii) The entries for the site-visits and the reports for the laboratory exercises MUST
inform the final report for the journal. The final report must not exceed 1500 words. Teachers are expected to work closely with students by providing feedback on all aspects of the project. Students should be encouraged to develop the habit of keen observation, relevant and precise reporting, concise recording and the ability for critical thinking, problem-solving and decision-making. Each student is required to keep a record (journal) for the reports on the laboratory exercises and a final report for entries on the site-visits. It is recommended that the assessment criteria be available to candidates at all times. (A) Site-Visit The entry for each site-visit should be recorded using the format below:
CXC A25/U2/10
56
(i) Entry Number
(ii) Date
(iii) Site (Location)
(iv) Objective(s) 1 mark
(v) Activities 4 marks
(vi) Observations 2 marks
(vii) Comments 2 marks
(viii) Follow-up Activities 1 mark 10 Marks
The teacher is required to assess each site-visit for a maximum of 10 marks. The total from a maximum of 40 marks should be scaled to 10 marks. No fractional marks should be awarded.
(B) Laboratory Exercise
The areas that will be assessed in the report for each laboratory exercise are: (a) Planning and Designing; 4 marks
(b) Observation and Recording; 5 marks
(c) Manipulation and Measurement; 2 marks
(d) Analysis and Interpretation; 6 marks
(e) Reporting and Presentation. 3 marks
Total 20 marks (Scaled to 10 marks)
The teacher is required to mark and award a score out of a maximum of 20 marks for each laboratory report and then scale to 10 marks. No fractional marks should be awarded. These entries for the site-visits and the laboratory reports should inform the final report for the journal. Laboratory exercises should be reported using the format below:
i) Title ii) Aim
CXC A25/U2/10
57
iii) Materials iv) Procedure
v) Data Collection/Results vi) Discussion and Conclusions
(C) Final Report for Journal The areas that will be assessed in the final report for the journal are summarised in the table below.
Final Report for Journal
Marks
1. Clarity of the statement of the real world problem being studied (project description)
2
2. Definition of the scope of the project (purpose of project)
3
3. Adequacy of information/data gathered and the appropriateness of the design chosen for investigating the problem
3
4. Appropriateness of the literature review
5
5. Presentation of data/Analysis of data
6
6. Discussion of findings
8
7. Conclusion
3
8. Recommendations
4
9. Communication of information
4
10. Bibliography
2
Total 40
CXC A25/U2/10
58
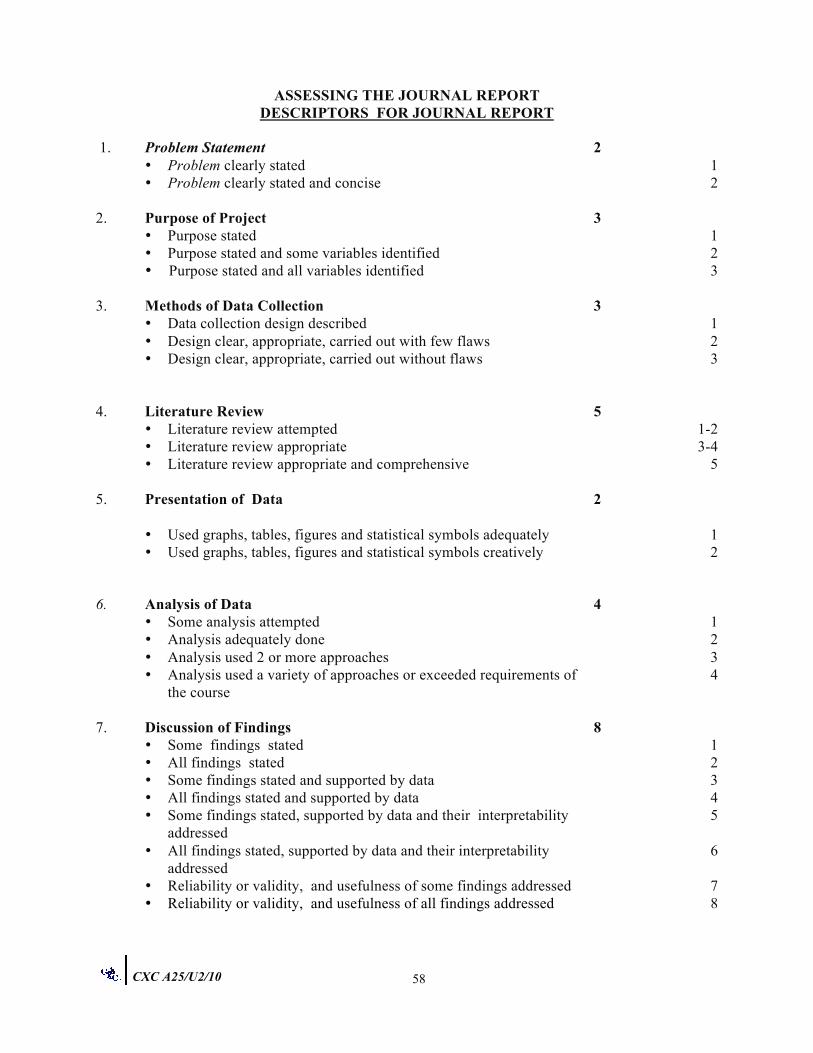
ASSESSING THE JOURNAL REPORT DESCRIPTORS FOR JOURNAL REPORT
1. Problem Statement 2 • Problem clearly stated 1 • Problem clearly stated and concise 2 2. Purpose of Project 3 • Purpose stated 1 • Purpose stated and some variables identified 2 • Purpose stated and all variables identified 3 3. Methods of Data Collection 3 • Data collection design described 1 • Design clear, appropriate, carried out with few flaws 2 • Design clear, appropriate, carried out without flaws 3
4. Literature Review 5 • Literature review attempted 1-2 • Literature review appropriate 3-4 • Literature review appropriate and comprehensive 5 5. Presentation of Data 2
• Used graphs, tables, figures and statistical symbols adequately 1 • Used graphs, tables, figures and statistical symbols creatively 2 6. Analysis of Data 4 • Some analysis attempted 1 • Analysis adequately done 2 • Analysis used 2 or more approaches 3 • Analysis used a variety of approaches or exceeded requirements of
the course 4
7. Discussion of Findings 8 • Some findings stated 1 • All findings stated 2 • Some findings stated and supported by data 3 • All findings stated and supported by data 4 • Some findings stated, supported by data and their interpretability
addressed 5
• All findings stated, supported by data and their interpretability addressed
6
• Reliability or validity, and usefulness of some findings addressed 7 • Reliability or validity, and usefulness of all findings addressed 8
CXC A25/U2/10
59
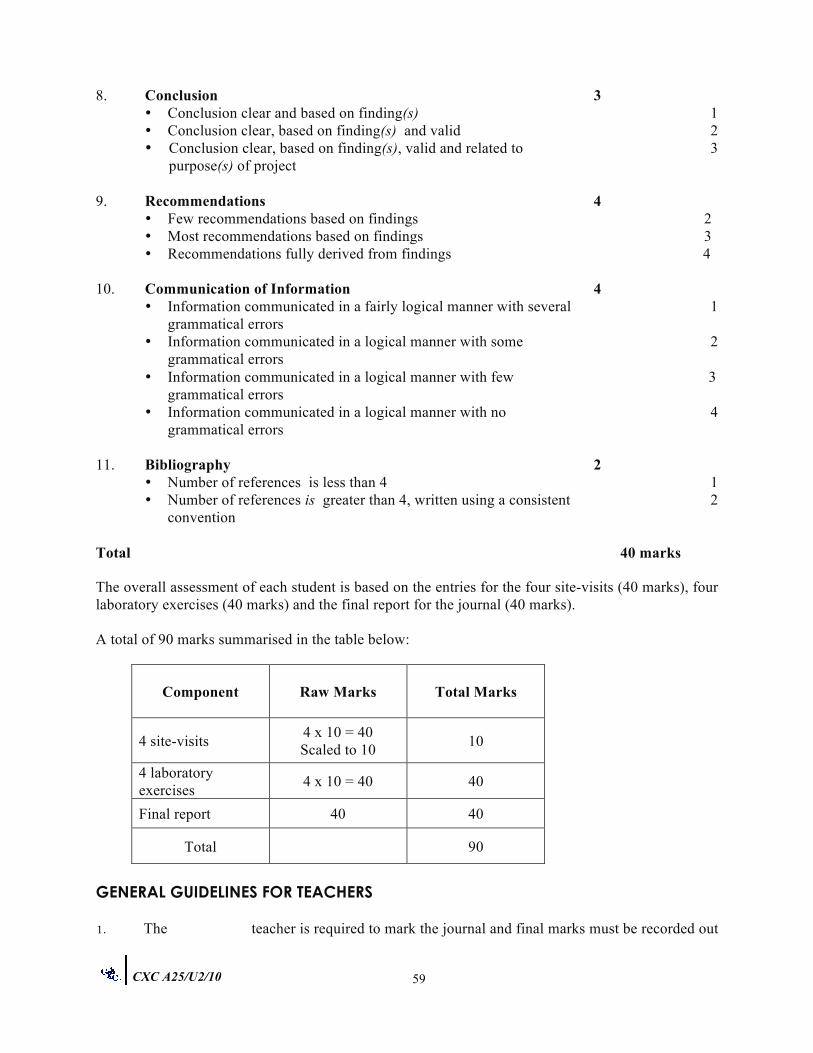
8. Conclusion 3 • Conclusion clear and based on finding(s) 1 • Conclusion clear, based on finding(s) and valid 2 • Conclusion clear, based on finding(s), valid and related to
purpose(s) of project 3
9. Recommendations 4 • Few recommendations based on findings 2 • Most recommendations based on findings 3 • Recommendations fully derived from findings 4 10. Communication of Information 4 • Information communicated in a fairly logical manner with several
grammatical errors 1
• Information communicated in a logical manner with some grammatical errors
2
• Information communicated in a logical manner with few grammatical errors
3
• Information communicated in a logical manner with no grammatical errors
4
11. Bibliography 2 • Number of references is less than 4 1 • Number of references is greater than 4, written using a consistent
convention 2
Total 40 marks The overall assessment of each student is based on the entries for the four site-visits (40 marks), four laboratory exercises (40 marks) and the final report for the journal (40 marks). A total of 90 marks summarised in the table below:
Component
Raw Marks
Total Marks
4 site-visits 4 x 10 = 40 Scaled to 10 10
4 laboratory exercises 4 x 10 = 40 40
Final report 40 40
Total 90
GENERAL GUIDELINES FOR TEACHERS 1. The teacher is required to mark the journal and final marks must be recorded out
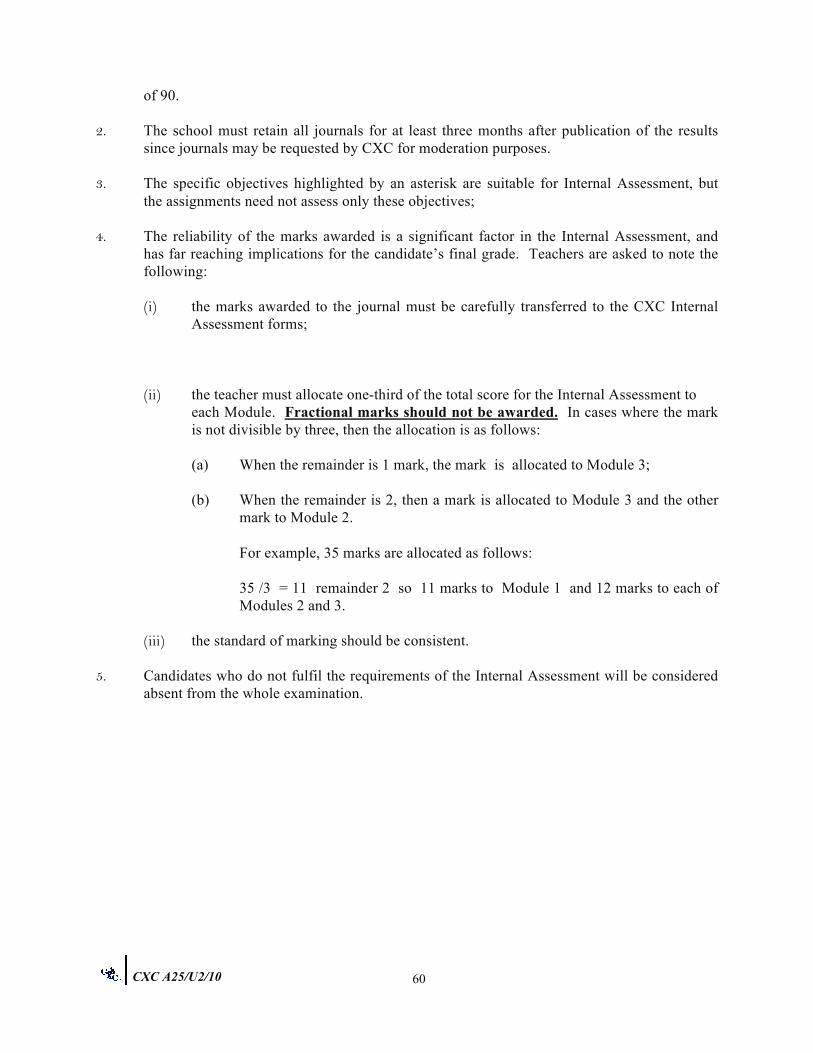
CXC A25/U2/10
60
of 90. 2. The school must retain all journals for at least three months after publication of the results
since journals may be requested by CXC for moderation purposes. 3. The specific objectives highlighted by an asterisk are suitable for Internal Assessment, but
the assignments need not assess only these objectives;
4. The reliability of the marks awarded is a significant factor in the Internal Assessment, and has far reaching implications for the candidate’s final grade. Teachers are asked to note the following: (i) the marks awarded to the journal must be carefully transferred to the CXC Internal
Assessment forms; (ii) the teacher must allocate one-third of the total score for the Internal Assessment to
each Module. Fractional marks should not be awarded. In cases where the mark is not divisible by three, then the allocation is as follows:
(a) When the remainder is 1 mark, the mark is allocated to Module 3;
(b) When the remainder is 2, then a mark is allocated to Module 3 and the other
mark to Module 2.
For example, 35 marks are allocated as follows:
35 /3 = 11 remainder 2 so 11 marks to Module 1 and 12 marks to each of Modules 2 and 3.
(iii) the standard of marking should be consistent.
5. Candidates who do not fulfil the requirements of the Internal Assessment will be considered
absent from the whole examination.
CXC A25/U2/10
61
♦ REGULATIONS FOR PRIVATE CANDIDATES Candidates who are registered privately will be required to sit Paper 01, Paper 02 and Paper 03B. Detailed information on Papers 01 and 02 is given on pages 49 - 51 of this syllabus. Paper 03B (Alternate to Internal School Based-Assessment) 30%- This paper will be of two (2) hours duration and will consist of THREE questions as follows: (i) a practical question; (ii) a question based on data collection; (iii) a planning and design exercise. This paper will constitute 30% of the overall assessment of the candidates performance on the Unit.
♦ REGULATIONS FOR RESIT CANDIDATES Resit candidates must complete Papers 01 and 02 and Paper 03 of the examination for the year for which they re-register. Resit candidates may elect not to repeat the Internal Assessment component, provided they re-write the examination no later than two years following their first attempt. Candidates may opt to complete an Internal Assessment (IA) for each Unit written or may opt to re-use another IA score which satisfies any of the conditions listed below. (i) A candidate who re-writes the examination in the same Unit within two years may re-use the
moderated IA score earned in the previous sitting within the preceding two years. (ii) Candidates re-using IA scores in this way must register as “Resit candidates” and provide
the previous candidate number.
All resit candidates may enter through schools, recognized educational institutions, or the Local Registrar’s Office.
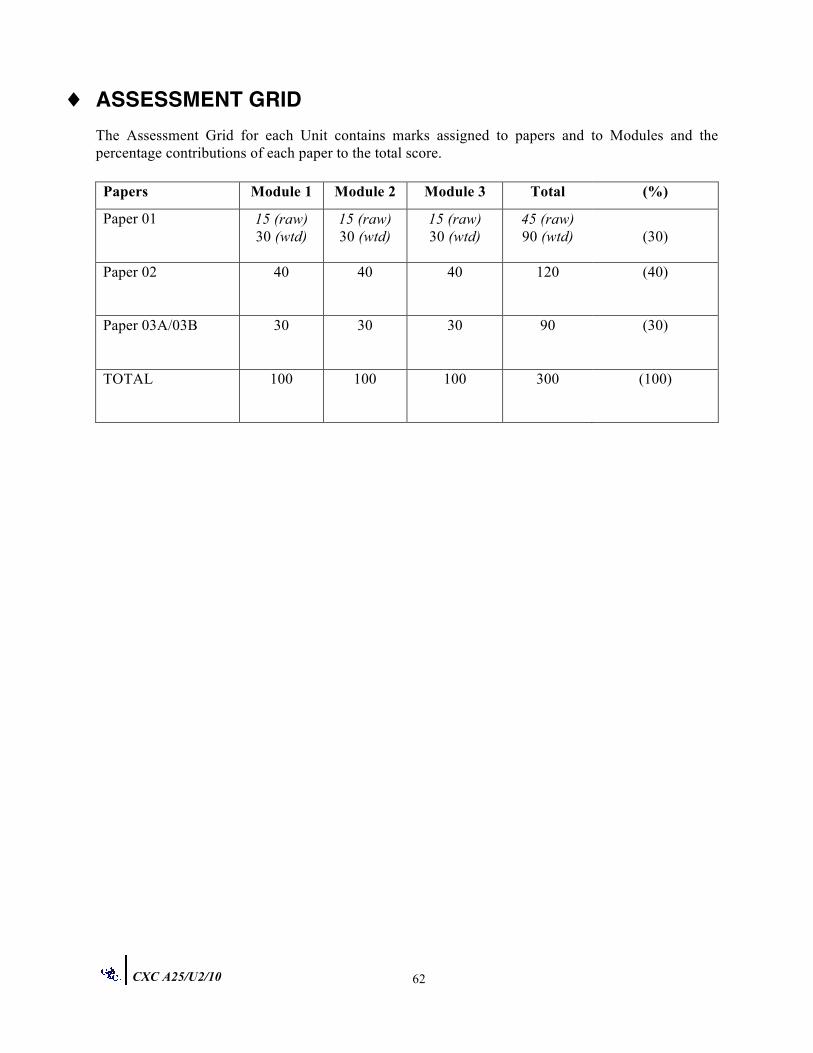
CXC A25/U2/10
62
♦ ASSESSMENT GRID
The Assessment Grid for each Unit contains marks assigned to papers and to Modules and the percentage contributions of each paper to the total score.
Papers Module 1 Module 2 Module 3 Total (%)
Paper 01 15 (raw) 30 (wtd)
15 (raw) 30 (wtd)
15 (raw) 30 (wtd)
45 (raw) 90 (wtd)
(30)
Paper 02 40
40 40 120 (40)
Paper 03A/03B 30
30 30 90 (30)
TOTAL 100
100 100 300 (100)
CXC A25/U2/10
63
♦ GLOSSARY WORD DEFINITION/MEANING
NOTES
analyse examine in detail annotate add a brief note to a label Simple phrase or a few words only. apply use knowledge/principles to solve problems Make inferences/conclusions. assess present reasons for the importance of particular
structures, relationships or processes Compare the advantages and disadvantages or the merits and demerits of a particular structure, relationship or process.
calculate arrive at the solution to a numerical problem Steps should be shown; units must
be included. classify divide into groups according to observable
characteristics
comment state opinion or view with supporting reasons compare state similarities and differences An explanation of the significance
of each similarity and difference stated may be required for comparisons which are other than structural.
construct use a specific format to make and/or draw a
graph, histogram, pie chart or other representation using data or material provided or drawn from practical investigations, build (for example, a model), draw scale diagram
Such representations should normally bear a title, appropriate headings and legend.
deduce make a logical connection between two or more
pieces of information; use data to arrive at a conclusion
define state concisely the meaning of a word or term This should include the defining
equation/formula where relevant. demonstrate show; direct attention to...
CXC A25/U2/10
64
WORD DEFINITION/MEANING
NOTES
derive to deduce, determine or extract from data by a set of logical steps some relationship, formula or result
This relationship etc. may be general or specific.
describe provide detailed factual information of the appearance or arrangement of a specific structure or a sequence of a specific process
Description may be in words, drawings or diagrams or any appropriate combination. Drawings or diagrams should be annotated to show appropriate detail where necessary.
determine find the value of a physical quantity design plan and present with appropriate practical detail Where hypotheses are stated or
when tests are to be conducted, possible outcomes should be clearly stated and/or the way in which data will be analyzed and presented.
develop expand or elaborate an idea or argument with
supporting reasons
diagram simplified representation showing the
relationship between components.
differentiate/ state or explain briefly those distinguish differences between or among items (between/ which can be used to define the among) items or place them into separate categories.
discuss present reasoned argument; consider points both
for and against; explain the relative merits of a case
draw make a line representation from specimens or
apparatus which shows an accurate relation between the parts
In the case of drawings from specimens, the magnification must always be stated.
estimate make an approximate quantitative judgement evaluate weigh evidence and make judgements based on
given criteria The use of logical supporting reasons for a particular point of view is more important than the view held; usually both sides of an argument should be considered.
CXC A25/U2/10
65
WORD DEFINITION/MEANING
NOTES
explain give reasons based on recall; account for find locate a feature or obtain as from a graph formulate devise a hypothesis identify name or point out specific components or
features
illustrate show clearly by using appropriate examples or diagrams, sketches
interpret explain the meaning of justify explain the correctness of investigate use simple systematic procedures to observe,
record data and draw logical conclusions
label add names to identify structures or parts
indicated by pointers
list itemize without detail measure take accurate quantitative readings using
appropriate instruments
name give only the name of No additional information is
required. note write down observations observe pay attention to details which characterize a
specimen, reaction or change taking place; to examine and note scientifically
Observations may involve all the senses and/or extensions of them but would normally exclude the sense of taste.
outline give basic steps only plan prepare to conduct an investigation predict use information provided to arrive at a likely
conclusion or suggest a possible outcome
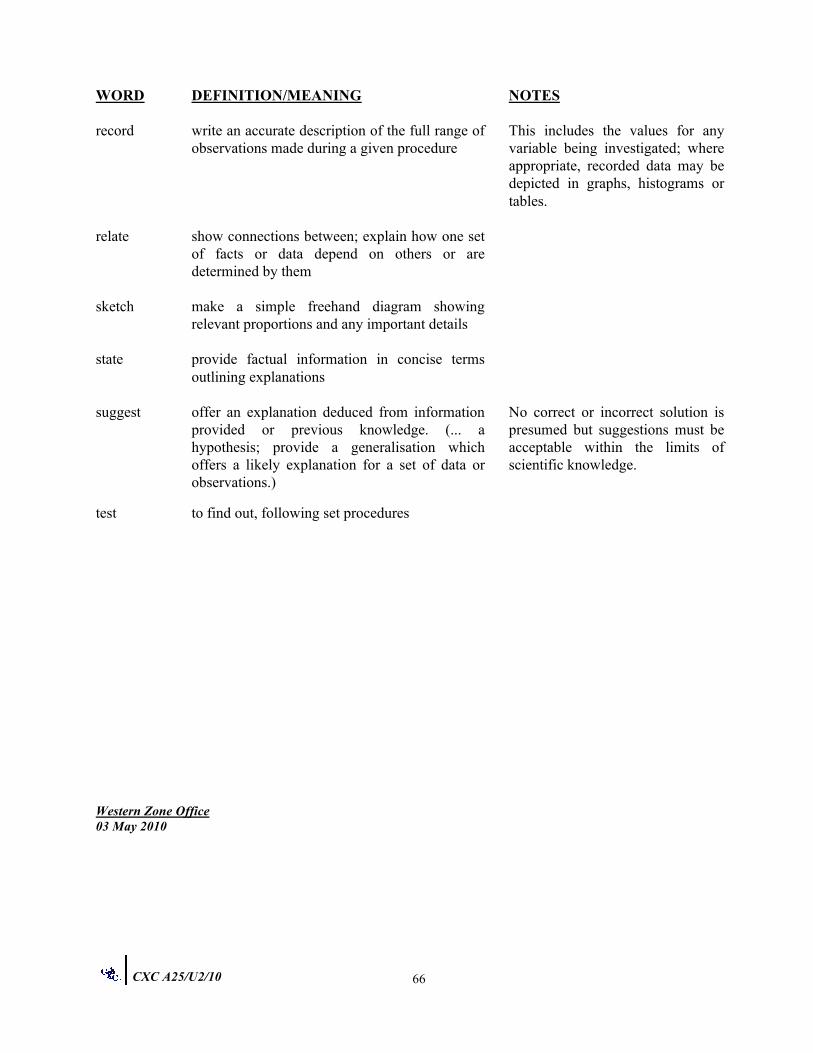
CXC A25/U2/10 66
WORD DEFINITION/MEANING NOTES
record write an accurate description of the full range of observations made during a given procedure
This includes the values for any variable being investigated; where appropriate, recorded data may be depicted in graphs, histograms or tables.
relate show connections between; explain how one set of facts or data depend on others or are determined by them
sketch make a simple freehand diagram showing relevant proportions and any important details
state provide factual information in concise terms outlining explanations
suggest offer an explanation deduced from information provided or previous knowledge. (... a hypothesis; provide a generalisation which offers a likely explanation for a set of data or observations.)
No correct or incorrect solution is presumed but suggestions must be acceptable within the limits of scientific knowledge.
test to find out, following set procedures
Western Zone Office 03 May 2010
CARIBBEAN EXAMINATIONS COUNCIL
Caribbean Advanced Proficiency Examination CAPE®
Environmental Science
Specimen Papers and Mark Schemes/Keys
Specimen Papers: - Unit 1, Paper 01 Unit 1, Paper 02 Unit 1, Paper 03/2
- Unit 2, Paper 01 Unit 2, Paper 02 Unit 2, Paper 03/2
Mark Schemes and Keys: - Unit 1, Paper 01 Unit 1, Paper 02 Unit 1, Paper 03/2
- Unit 2, Paper 01 Unit 2, Paper 02 Unit 2, Paper 03/2
TEST CODE 02120010/SPEC/2010
C A R I B B E A N E X A M I N A T I O N S C O U N C I L
ADVANCED PROFICIENCY EXAMINATION
ENVIRONMENTAL SCIENCEUNIT 1
SPECIMEN PAPER
Paper 01
90 minutes
READ THE FOLLOWING INSTRUCTIONS CAREFULLY.
1. This test consists of 45 items. You will have 90 minutes to answer them.
2. In addition to this test booklet, you should have an answer sheet.
3. Do not be concerned that the answer sheet provides spaces for more answers than there are items
in this test.
4. Each item in this test has four suggested answers lettered (A), (B), (C), (D). Read each item
you are about to answer and decide which choice is best.
5. On your answer sheet, fi nd the number which corresponds to your item and shade the space
having the same letter as the answer you have chosen. Look at the sample item below.
Sample Item
The interaction of plants and animals with components
such as air and water describes
Sample Answer
(A) a biome A B C D
(B) a biosphere
(C) an ecosystem
(D) an ecological niche
The best answer to this item is “an ecosystem”, so answer space (C) has been shaded.
6. If you want to change your answer, erase it completely before you fi ll in your new choice.
7. When you are told to begin, turn the page and work as quickly and as carefully as you can. If
you cannot answer an item, omit it and go on to the next one. You may return to the omitted
item later. Your score will be the total number of correct answers.
8. You may use a silent electronic calculator.
DO NOT TURN THIS PAGE UNTIL YOU ARE TOLD TO DO SO.
Copyright © 2009 Caribbean Examinations Council ®
All rights reserved.
02120010/SPEC/2010
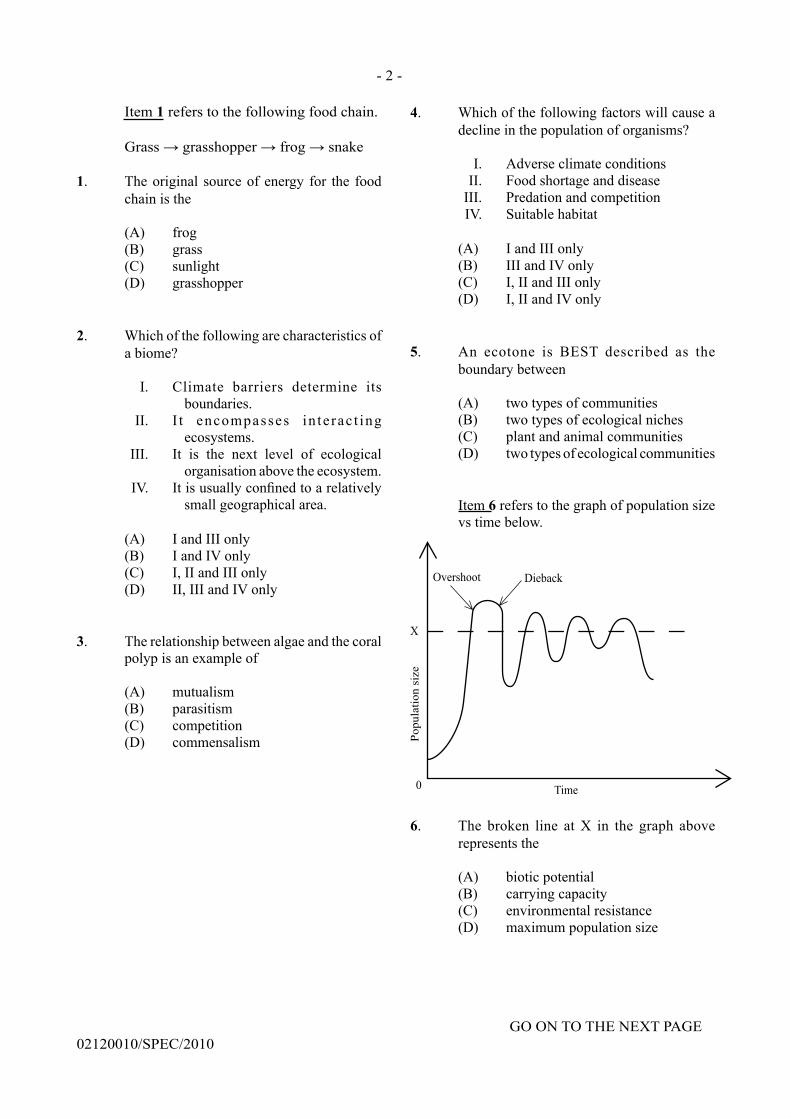
- 2 -
GO ON TO THE NEXT PAGE
02120010/SPEC/2010
Item 1 refers to the following food chain.
Grass → grasshopper → frog → snake
1. The original source of energy for the food
chain is the
(A) frog
(B) grass
(C) sunlight
(D) grasshopper
2. Which of the following are characteristics of
a biome?
I. Climate barriers determine its
boundaries.
II. I t encompasses in te rac t ing
ecosystems.
III. It is the next level of ecological
organisation above the ecosystem.
IV. It is usually confi ned to a relatively
small geographical area.
(A) I and III only
(B) I and IV only
(C) I, II and III only
(D) II, III and IV only
3. The relationship between algae and the coral
polyp is an example of
(A) mutualism
(B) parasitism
(C) competition
(D) commensalism
4. Which of the following factors will cause a
decline in the population of organisms?
I. Adverse climate conditions
II. Food shortage and disease
III. Predation and competition
IV. Suitable habitat
(A) I and III only
(B) III and IV only
(C) I, II and III only
(D) I, II and IV only
5. An ecotone is BEST described as the
boundary between
(A) two types of communities
(B) two types of ecological niches
(C) plant and animal communities
(D) two types of ecological communities
Item 6 refers to the graph of population size
vs time below.
6. The broken line at X in the graph above
represents the
(A) biotic potential
(B) carrying capacity
(C) environmental resistance
(D) maximum population size
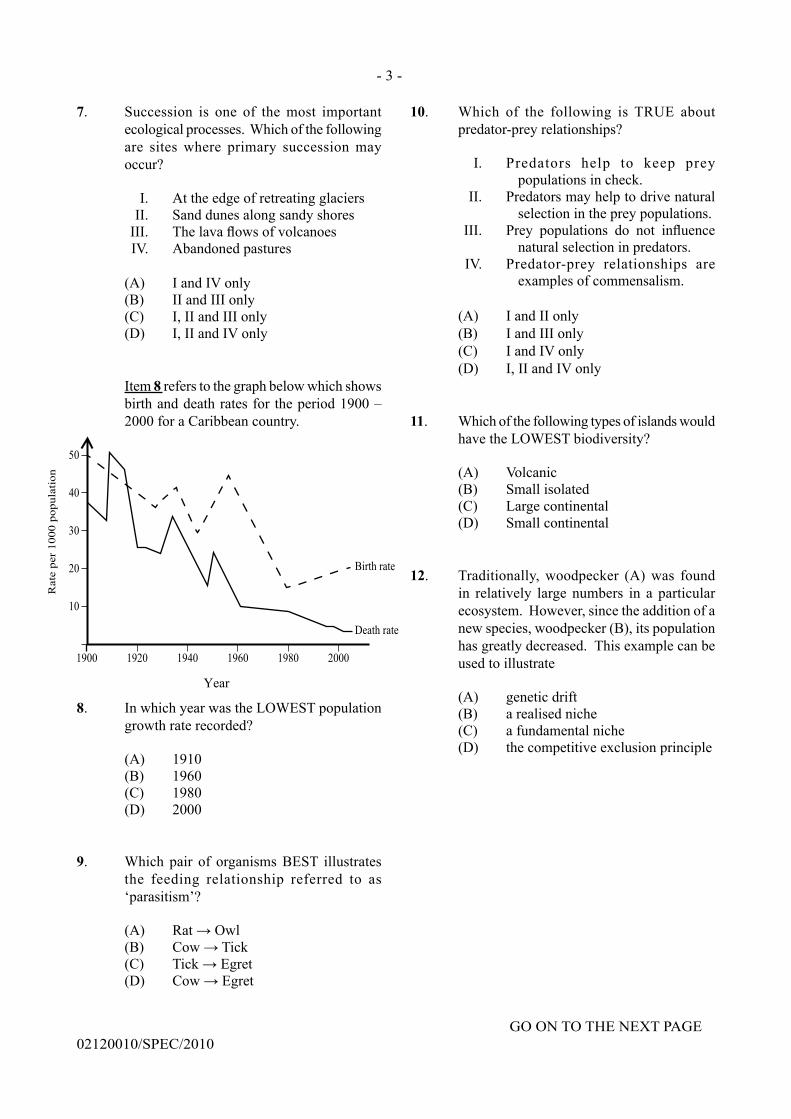
- 3 -
GO ON TO THE NEXT PAGE
02120010/SPEC/2010
7. Succession is one of the most important
ecological processes. Which of the following
are sites where primary succession may
occur?
I. At the edge of retreating glaciers
II. Sand dunes along sandy shores
III. The lava fl ows of volcanoes
IV. Abandoned pastures
(A) I and IV only
(B) II and III only
(C) I, II and III only
(D) I, II and IV only
Item 8 refers to the graph below which shows
birth and death rates for the period 1900 –
2000 for a Caribbean country.
8. In which year was the LOWEST population
growth rate recorded?
(A) 1910
(B) 1960
(C) 1980
(D) 2000
9. Which pair of organisms BEST illustrates
the feeding relationship referred to as
‘parasitism’?
(A) Rat → Owl
(B) Cow → Tick
(C) Tick → Egret
(D) Cow → Egret
10. Which of the following is TRUE about
predator-prey relationships?
I. Predators help to keep prey
populations in check.
II. Predators may help to drive natural
selection in the prey populations.
III. Prey populations do not infl uence
natural selection in predators.
IV. Predator-prey relationships are
examples of commensalism.
(A) I and II only
(B) I and III only
(C) I and IV only
(D) I, II and IV only
11. Which of the following types of islands would
have the LOWEST biodiversity?
(A) Volcanic
(B) Small isolated
(C) Large continental
(D) Small continental
12. Traditionally, woodpecker (A) was found
in relatively large numbers in a particular
ecosystem. However, since the addition of a
new species, woodpecker (B), its population
has greatly decreased. This example can be
used to illustrate
(A) genetic drift
(B) a realised niche
(C) a fundamental niche
(D) the competitive exclusion principle
Year
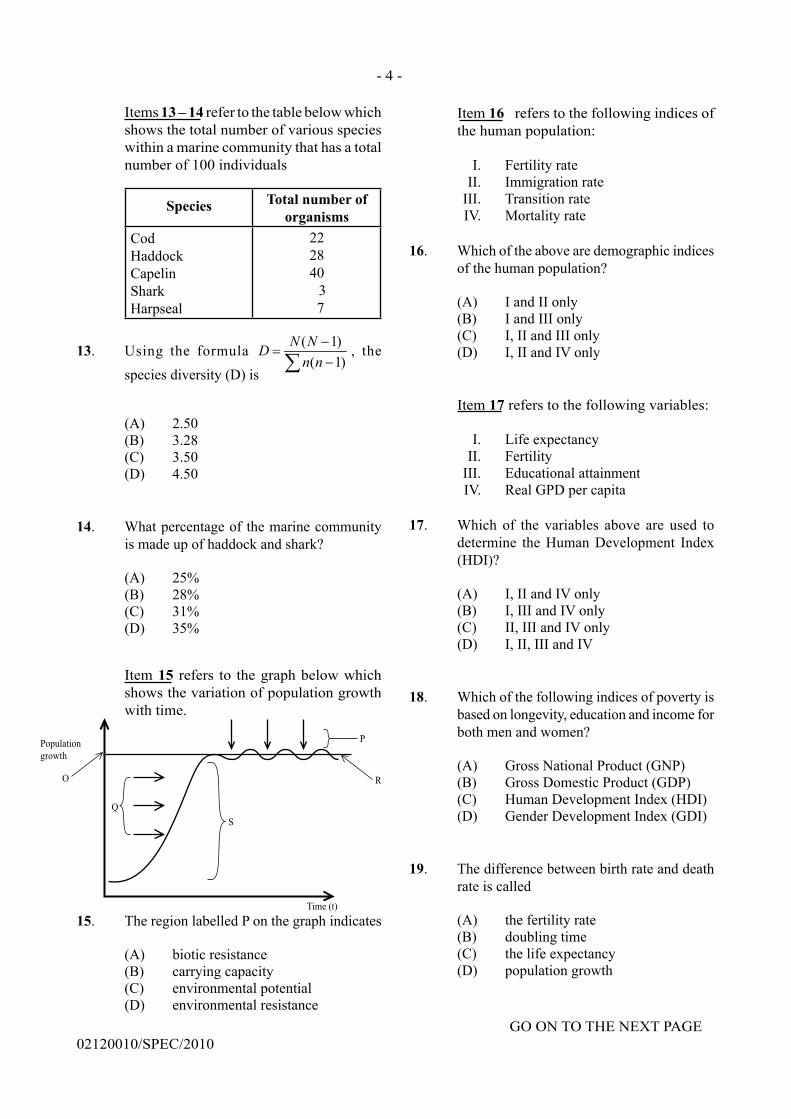
- 4 -
GO ON TO THE NEXT PAGE
02120010/SPEC/2010
Items 13 – 14 refer to the table below which
shows the total number of various species
within a marine community that has a total
number of 100 individuals
SpeciesTotal number of
organisms
Cod
Haddock
Capelin
Shark
Harpseal
22
28
40
3
7
13. Using the formula ( 1)
( 1)
N ND
n n
−=
−∑, the
species diversity (D) is
(A) 2.50
(B) 3.28
(C) 3.50
(D) 4.50
14. What percentage of the marine community
is made up of haddock and shark?
(A) 25%
(B) 28%
(C) 31%
(D) 35%
Item 15 refers to the graph below which
shows the variation of population growth
with time.
15. The region labelled P on the graph indicates
(A) biotic resistance
(B) carrying capacity
(C) environmental potential
(D) environmental resistance
Item 16 refers to the following indices of
the human population:
I. Fertility rate
II. Immigration rate
III. Transition rate
IV. Mortality rate
16. Which of the above are demographic indices
of the human population?
(A) I and II only
(B) I and III only
(C) I, II and III only
(D) I, II and IV only
Item 17 refers to the following variables:
I. Life expectancy
II. Fertility
III. Educational attainment
IV. Real GPD per capita
17. Which of the variables above are used to
determine the Human Development Index
(HDI)?
(A) I, II and IV only
(B) I, III and IV only
(C) II, III and IV only
(D) I, II, III and IV
18. Which of the following indices of poverty is
based on longevity, education and income for
both men and women?
(A) Gross National Product (GNP)
(B) Gross Domestic Product (GDP)
(C) Human Development Index (HDI)
(D) Gender Development Index (GDI)
19. The difference between birth rate and death
rate is called
(A) the fertility rate
(B) doubling time
(C) the life expectancy
(D) population growth
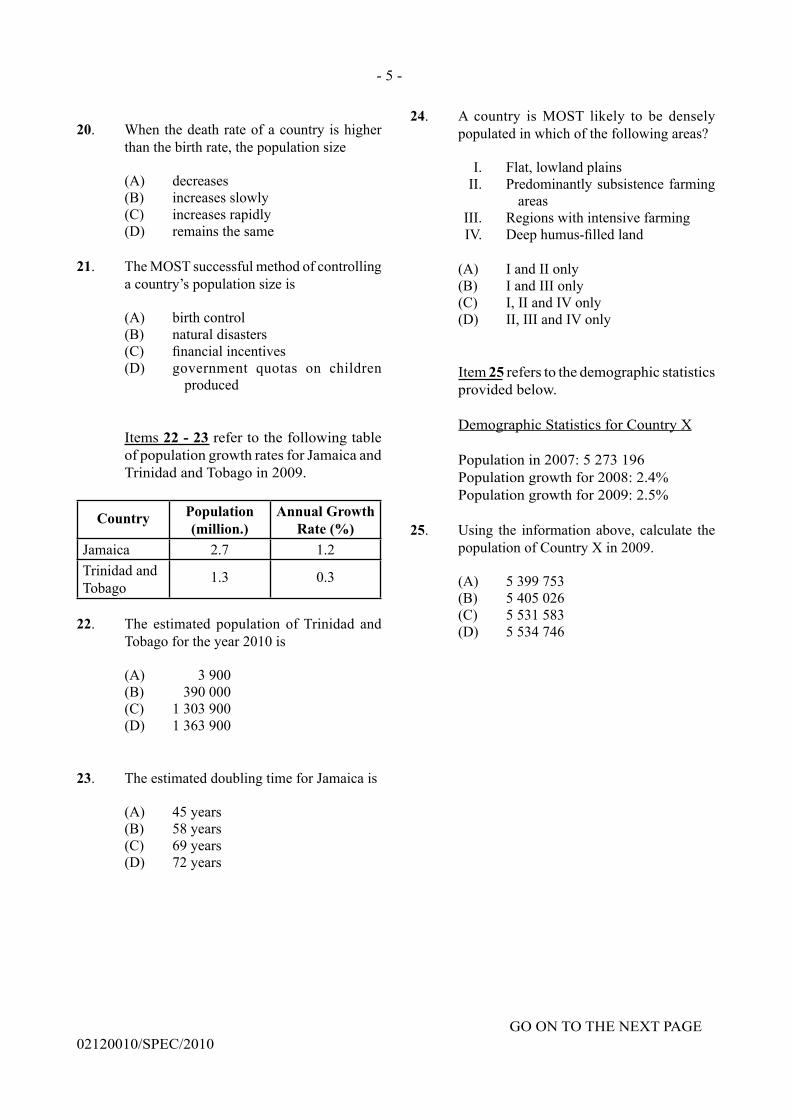
- 5 -
GO ON TO THE NEXT PAGE
02120010/SPEC/2010
20. When the death rate of a country is higher
than the birth rate, the population size
(A) decreases
(B) increases slowly
(C) increases rapidly
(D) remains the same
21. The MOST successful method of controlling
a country’s population size is
(A) birth control
(B) natural disasters
(C) fi nancial incentives
(D) government quotas on children
produced
Items 22 - 23 refer to the following table
of population growth rates for Jamaica and
Trinidad and Tobago in 2009.
CountryPopulation
(million.)
Annual Growth
Rate (%)
Jamaica 2.7 1.2
Trinidad and
Tobago1.3 0.3
22. The estimated population of Trinidad and
Tobago for the year 2010 is
(A) 3 900
(B) 390 000
(C) 1 303 900
(D) 1 363 900
23. The estimated doubling time for Jamaica is
(A) 45 years
(B) 58 years
(C) 69 years
(D) 72 years
24. A country is MOST likely to be densely
populated in which of the following areas?
I. Flat, lowland plains
II. Predominantly subsistence farming
areas
III. Regions with intensive farming
IV. Deep humus-fi lled land
(A) I and II only
(B) I and III only
(C) I, II and IV only
(D) II, III and IV only
Item 25 refers to the demographic statistics
provided below.
Demographic Statistics for Country X
Population in 2007: 5 273 196
Population growth for 2008: 2.4%
Population growth for 2009: 2.5%
25. Using the information above, calculate the
population of Country X in 2009.
(A) 5 399 753
(B) 5 405 026
(C) 5 531 583
(D) 5 534 746
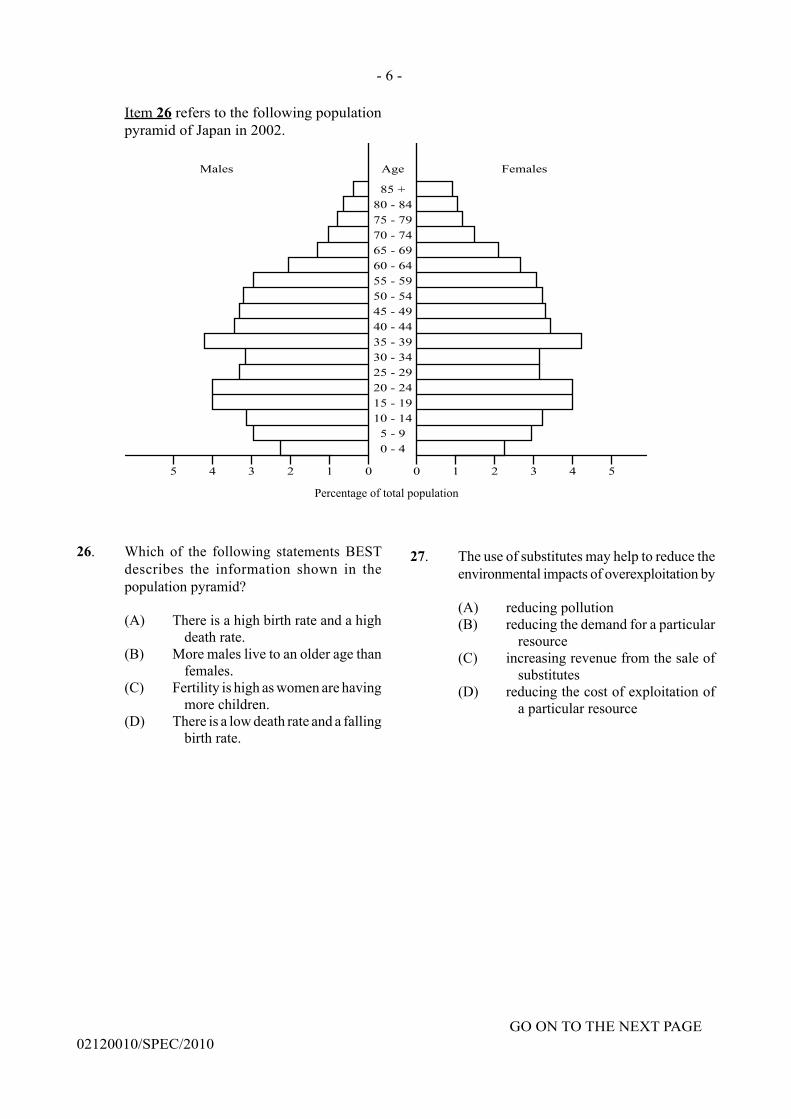
- 6 -
GO ON TO THE NEXT PAGE
02120010/SPEC/2010
Item 26 refers to the following population
pyramid of Japan in 2002.
26. Which of the following statements BEST
describes the information shown in the
population pyramid?
(A) There is a high birth rate and a high
death rate.
(B) More males live to an older age than
females.
(C) Fertility is high as women are having
more children.
(D) There is a low death rate and a falling
birth rate.
27. The use of substitutes may help to reduce the
environmental impacts of overexploitation by
(A) reducing pollution
(B) reducing the demand for a particular
resource
(C) increasing revenue from the sale of
substitutes
(D) reducing the cost of exploitation of
a particular resource
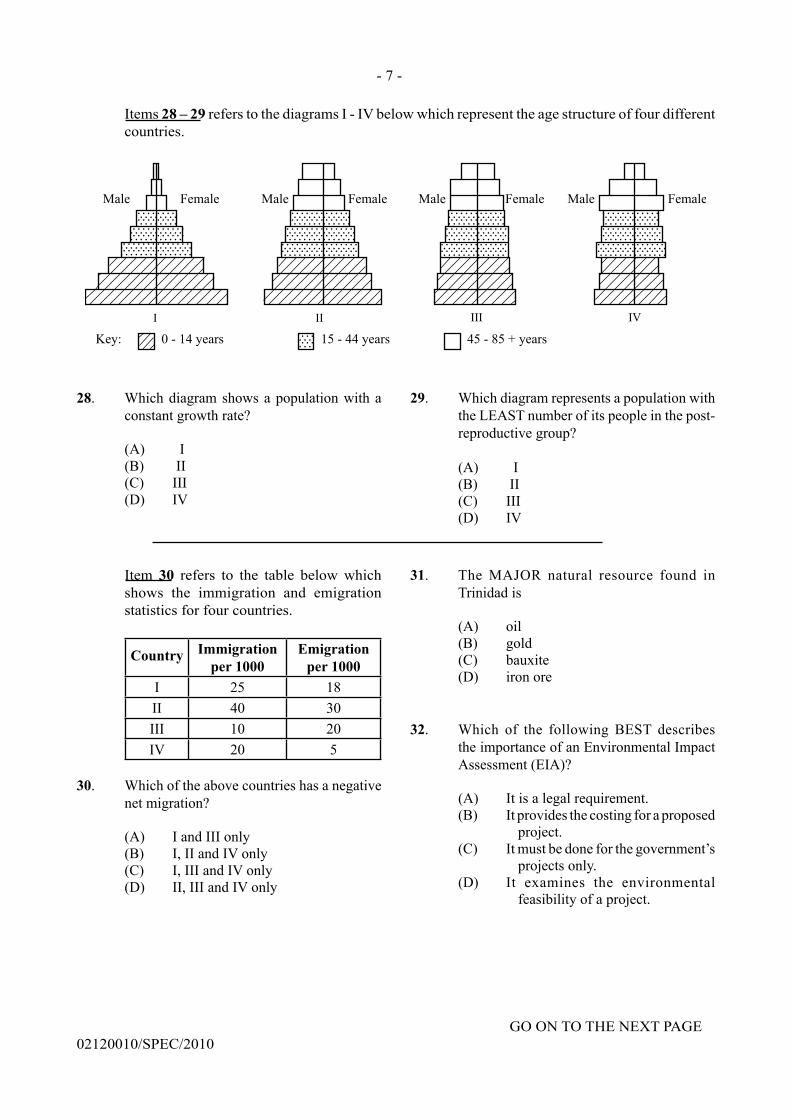
- 7 -
GO ON TO THE NEXT PAGE
02120010/SPEC/2010
Items 28 – 29 refers to the diagrams I - IV below which represent the age structure of four different
countries.
28. Which diagram shows a population with a
constant growth rate?
(A) I
(B) II
(C) III
(D) IV
29. Which diagram represents a population with
the LEAST number of its people in the post-
reproductive group?
(A) I
(B) II
(C) III
(D) IV
Item 30 refers to the table below which
shows the immigration and emigration
statistics for four countries.
CountryImmigration
per 1000
Emigration
per 1000
I 25 18
II 40 30
III 10 20
IV 20 5
30. Which of the above countries has a negative
net migration?
(A) I and III only
(B) I, II and IV only
(C) I, III and IV only
(D) II, III and IV only
31. The MAJOR natural resource found in
Trinidad is
(A) oil
(B) gold
(C) bauxite
(D) iron ore
32. Which of the following BEST describes
the importance of an Environmental Impact
Assessment (EIA)?
(A) It is a legal requirement.
(B) It provides the costing for a proposed
project.
(C) It must be done for the government’s
projects only.
(D) It examines the environmental
feasibility of a project.
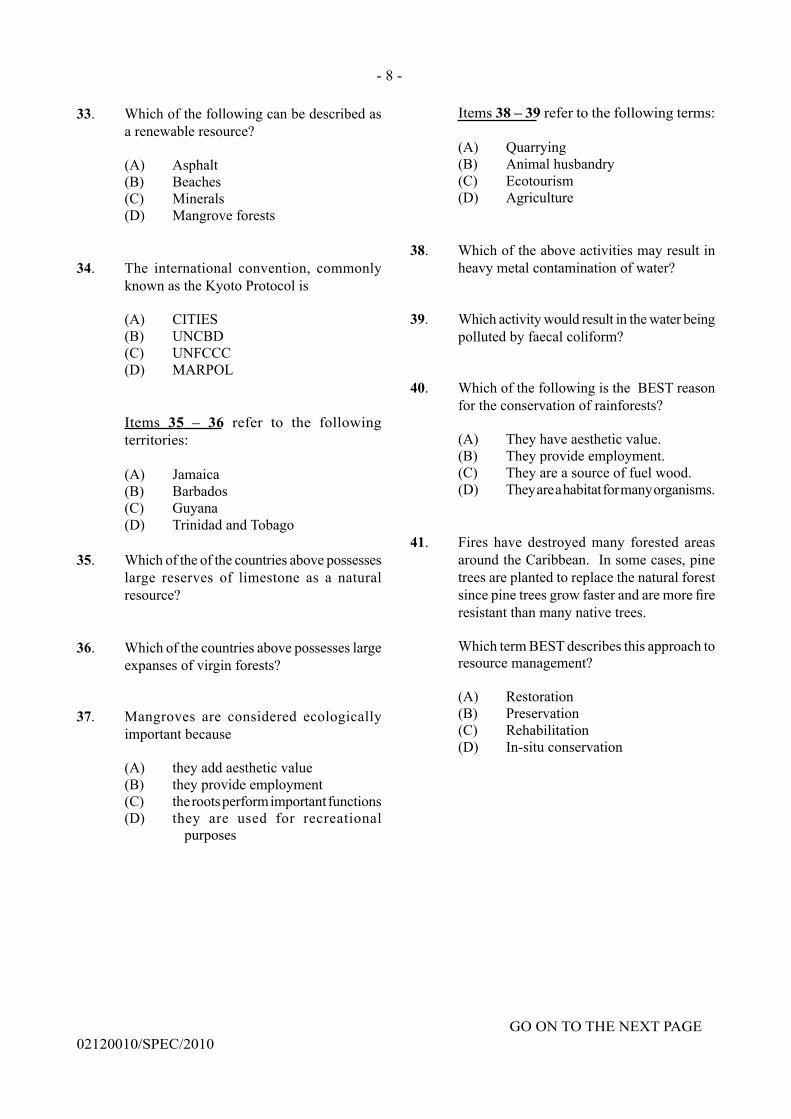
- 8 -
GO ON TO THE NEXT PAGE
02120010/SPEC/2010
33. Which of the following can be described as
a renewable resource?
(A) Asphalt
(B) Beaches
(C) Minerals
(D) Mangrove forests
34. The international convention, commonly
known as the Kyoto Protocol is
(A) CITIES
(B) UNCBD
(C) UNFCCC
(D) MARPOL
Items 35 – 36 refer to the following
territories:
(A) Jamaica
(B) Barbados
(C) Guyana
(D) Trinidad and Tobago
35. Which of the of the countries above possesses
large reserves of limestone as a natural
resource?
36. Which of the countries above possesses large
expanses of virgin forests?
37. Mangroves are considered ecologically
important because
(A) they add aesthetic value
(B) they provide employment
(C) the roots perform important functions
(D) they are used for recreational
purposes
Items 38 – 39 refer to the following terms:
(A) Quarrying
(B) Animal husbandry
(C) Ecotourism
(D) Agriculture
38. Which of the above activities may result in
heavy metal contamination of water?
39. Which activity would result in the water being
polluted by faecal coliform?
40. Which of the following is the BEST reason
for the conservation of rainforests?
(A) They have aesthetic value.
(B) They provide employment.
(C) They are a source of fuel wood.
(D) They are a habitat for many organisms.
41. Fires have destroyed many forested areas
around the Caribbean. In some cases, pine
trees are planted to replace the natural forest
since pine trees grow faster and are more fi re
resistant than many native trees.
Which term BEST describes this approach to
resource management?
(A) Restoration
(B) Preservation
(C) Rehabilitation
(D) In-situ conservation
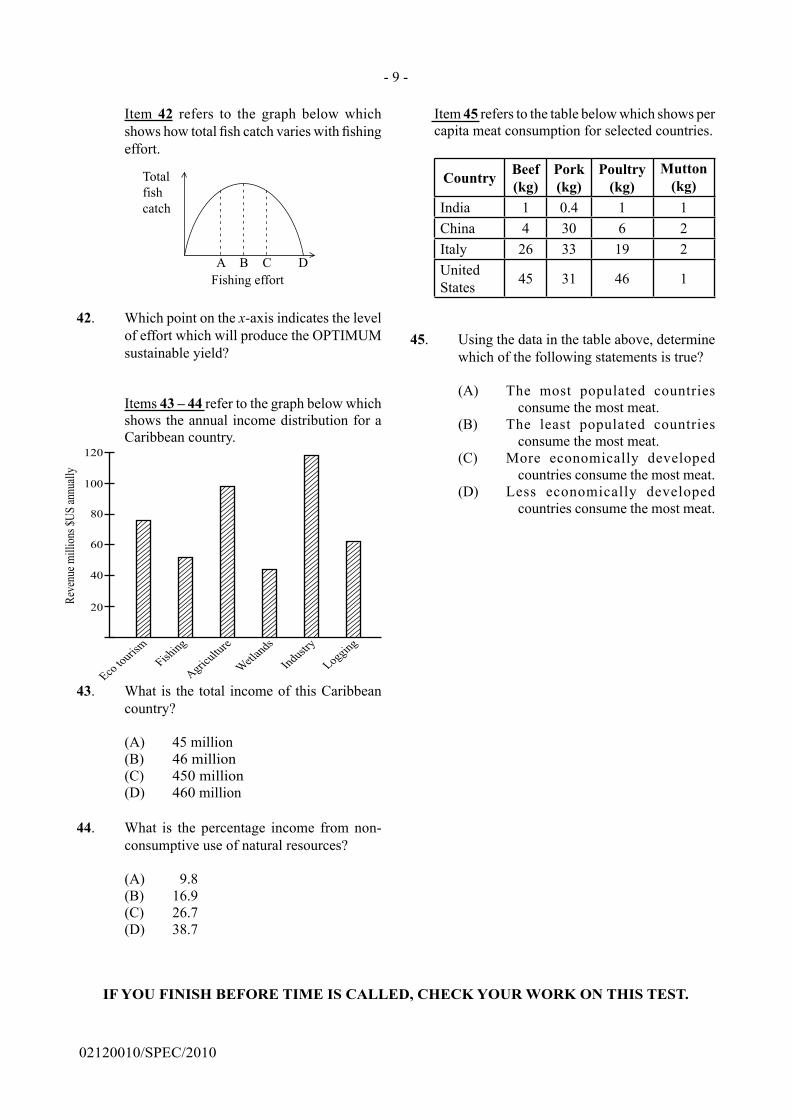
IF YOU FINISH BEFORE TIME IS CALLED, CHECK YOUR WORK ON THIS TEST.
02120010/SPEC/2010
- 9 -
Item 42 refers to the graph below which
shows how total fi sh catch varies with fi shing
effort.
42. Which point on the x-axis indicates the level
of effort which will produce the OPTIMUM
sustainable yield?
Items 43 – 44 refer to the graph below which
shows the annual income distribution for a
Caribbean country.
43. What is the total income of this Caribbean
country?
(A) 45 million
(B) 46 million
(C) 450 million
(D) 460 million
44. What is the percentage income from non-
consumptive use of natural resources?
(A) 9.8
(B) 16.9
(C) 26.7
(D) 38.7
Item 45 refers to the table below which shows per
capita meat consumption for selected countries.
CountryBeef
(kg)
Pork
(kg)
Poultry
(kg)
Mutton
(kg)
India 1 0.4 1 1
China 4 30 6 2
Italy 26 33 19 2
United
States45 31 46 1
45. Using the data in the table above, determine
which of the following statements is true?
(A) The most populated countries
consume the most meat.
(B) The least populated countries
consume the most meat.
(C) More economically developed
countries consume the most meat.
(D) Less economically developed
countries consume the most meat.
TEST CODE 02120020/SPEC/2010
C A R I B B E A N E X A M I N A T I O N S C O U N C I L
ADVANCED PROFICIENCY EXAMINATION
ENVIRONMENTAL SCIENCE
UNIT 1: ECOLOGY, HUMAN POPULATION AND NATURAL RESOURCES
SPECIMEN PAPER
PAPER 02
2 hours 30 minutes
Copyright © 2009 Caribbean Examinations Council®
All rights reserved.
02120020/SPEC/ 2010
INSTRUCTIONS TO CANDIDATES
1. Do NOT open this examination paper until instructed to do so.
2. This paper consists of SIX questions, TWO from each Module.
3. Answer ALL questions.
4. Write your answers in the answer booklet provided.
5. You may use a silent, non-programmable, scientific calculator.
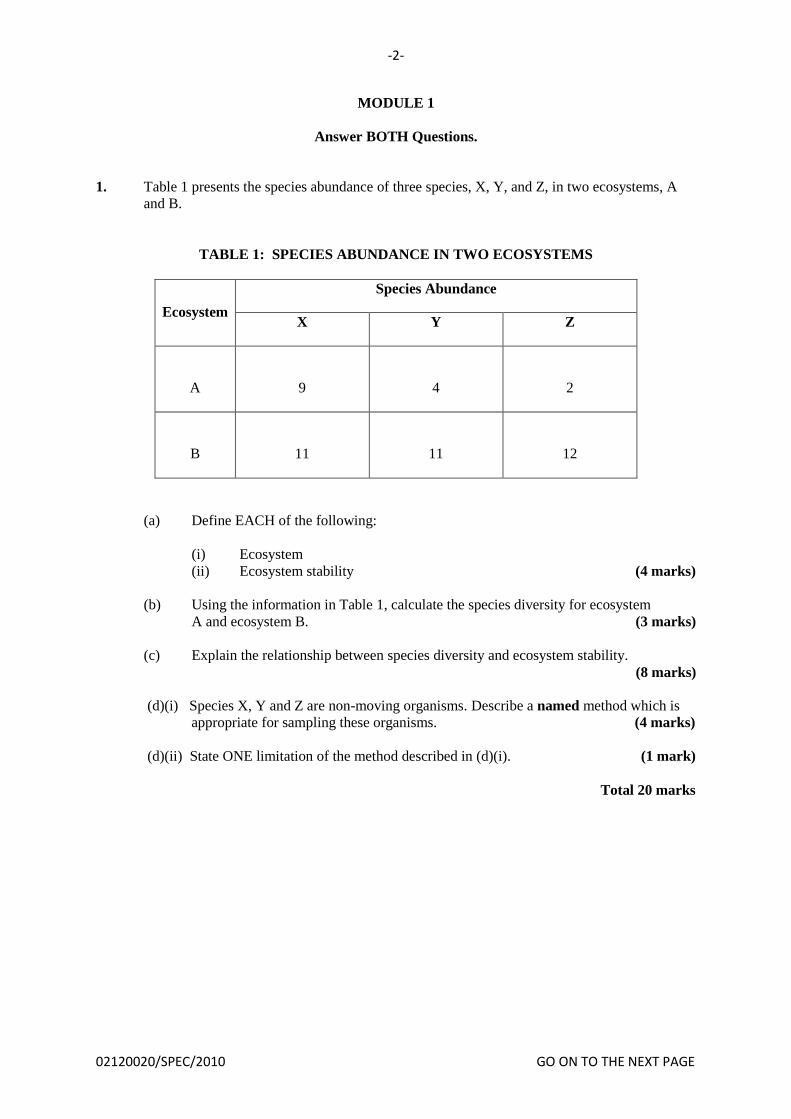
-2-
02120020/SPEC/2010 GO ON TO THE NEXT PAGE
MODULE 1
Answer BOTH Questions.
1. Table 1 presents the species abundance of three species, X, Y, and Z, in two ecosystems, A
and B.
TABLE 1: SPECIES ABUNDANCE IN TWO ECOSYSTEMS
Ecosystem
Species Abundance
X Y Z
A
9
4
2
B
11
11
12
(a) Define EACH of the following:
(i) Ecosystem
(ii) Ecosystem stability (4 marks)
(b) Using the information in Table 1, calculate the species diversity for ecosystem
A and ecosystem B. (3 marks)
(c) Explain the relationship between species diversity and ecosystem stability.
(8 marks)
(d)(i) Species X, Y and Z are non-moving organisms. Describe a named method which is
appropriate for sampling these organisms. (4 marks)
(d)(ii) State ONE limitation of the method described in (d)(i). (1 mark)
Total 20 marks
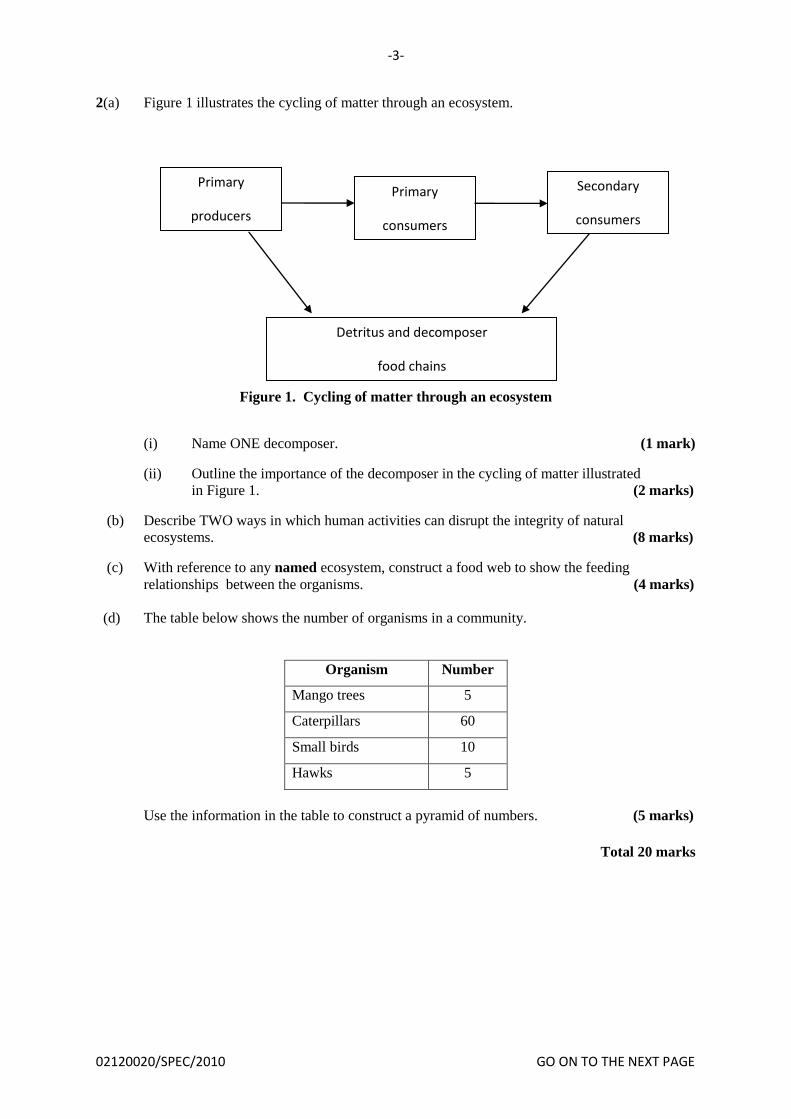
-3-
02120020/SPEC/2010 GO ON TO THE NEXT PAGE
2(a) Figure 1 illustrates the cycling of matter through an ecosystem.
Figure 1. Cycling of matter through an ecosystem
(i) Name ONE decomposer. (1 mark)
(ii) Outline the importance of the decomposer in the cycling of matter illustrated
in Figure 1. (2 marks)
(b) Describe TWO ways in which human activities can disrupt the integrity of natural
ecosystems. (8 marks)
(c) With reference to any named ecosystem, construct a food web to show the feeding
relationships between the organisms. (4 marks)
(d) The table below shows the number of organisms in a community.
Organism Number
Mango trees 5
Caterpillars 60
Small birds 10
Hawks 5
Use the information in the table to construct a pyramid of numbers. (5 marks)
Total 20 marks
Primary
producers
Primary
consumers
Secondary
consumers
Detritus and decomposer
food chains
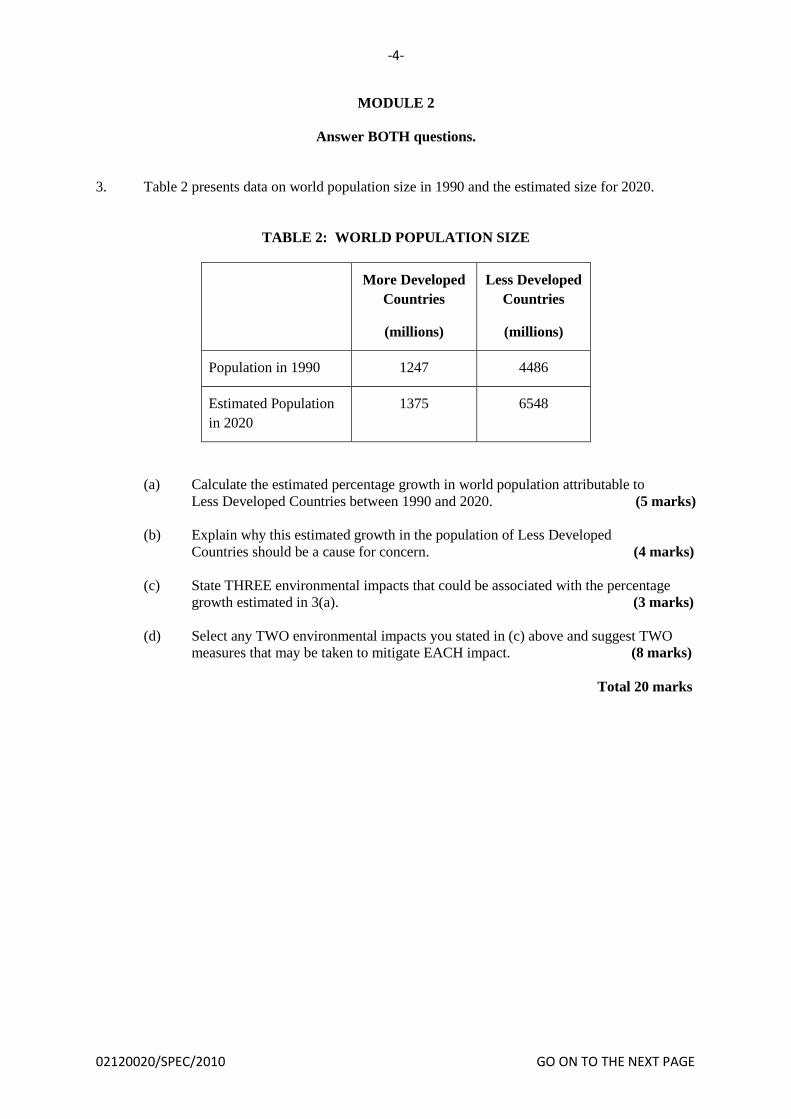
-4-
02120020/SPEC/2010 GO ON TO THE NEXT PAGE
MODULE 2
Answer BOTH questions.
3. Table 2 presents data on world population size in 1990 and the estimated size for 2020.
TABLE 2: WORLD POPULATION SIZE
More Developed
Countries
(millions)
Less Developed
Countries
(millions)
Population in 1990 1247 4486
Estimated Population
in 2020
1375 6548
(a) Calculate the estimated percentage growth in world population attributable to
Less Developed Countries between 1990 and 2020. (5 marks)
(b) Explain why this estimated growth in the population of Less Developed
Countries should be a cause for concern. (4 marks)
(c) State THREE environmental impacts that could be associated with the percentage
growth estimated in 3(a). (3 marks)
(d) Select any TWO environmental impacts you stated in (c) above and suggest TWO
measures that may be taken to mitigate EACH impact. (8 marks)
Total 20 marks
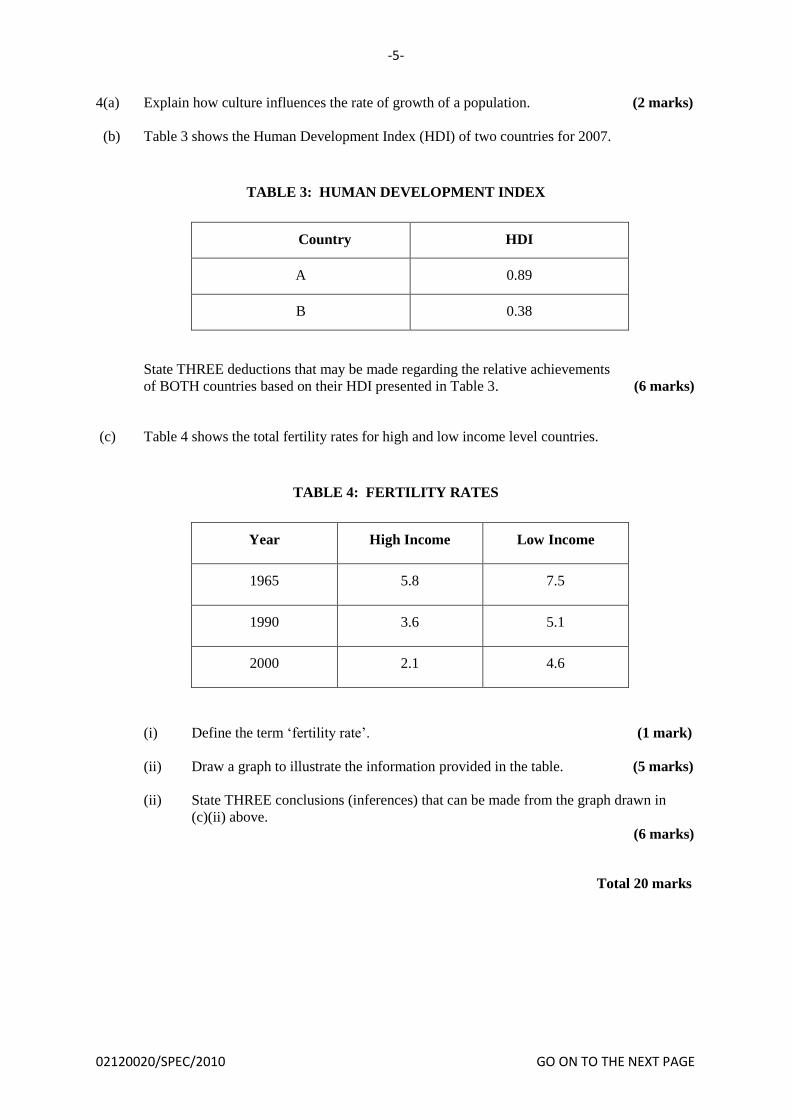
-5-
02120020/SPEC/2010 GO ON TO THE NEXT PAGE
4(a) Explain how culture influences the rate of growth of a population. (2 marks)
(b) Table 3 shows the Human Development Index (HDI) of two countries for 2007.
TABLE 3: HUMAN DEVELOPMENT INDEX
Country HDI
A 0.89
B 0.38
State THREE deductions that may be made regarding the relative achievements
of BOTH countries based on their HDI presented in Table 3. (6 marks)
(c) Table 4 shows the total fertility rates for high and low income level countries.
TABLE 4: FERTILITY RATES
Year High Income Low Income
1965 5.8 7.5
1990 3.6 5.1
2000 2.1 4.6
(i) Define the term ‘fertility rate’. (1 mark)
(ii) Draw a graph to illustrate the information provided in the table. (5 marks)
(ii) State THREE conclusions (inferences) that can be made from the graph drawn in
(c)(ii) above.
(6 marks)
Total 20 marks
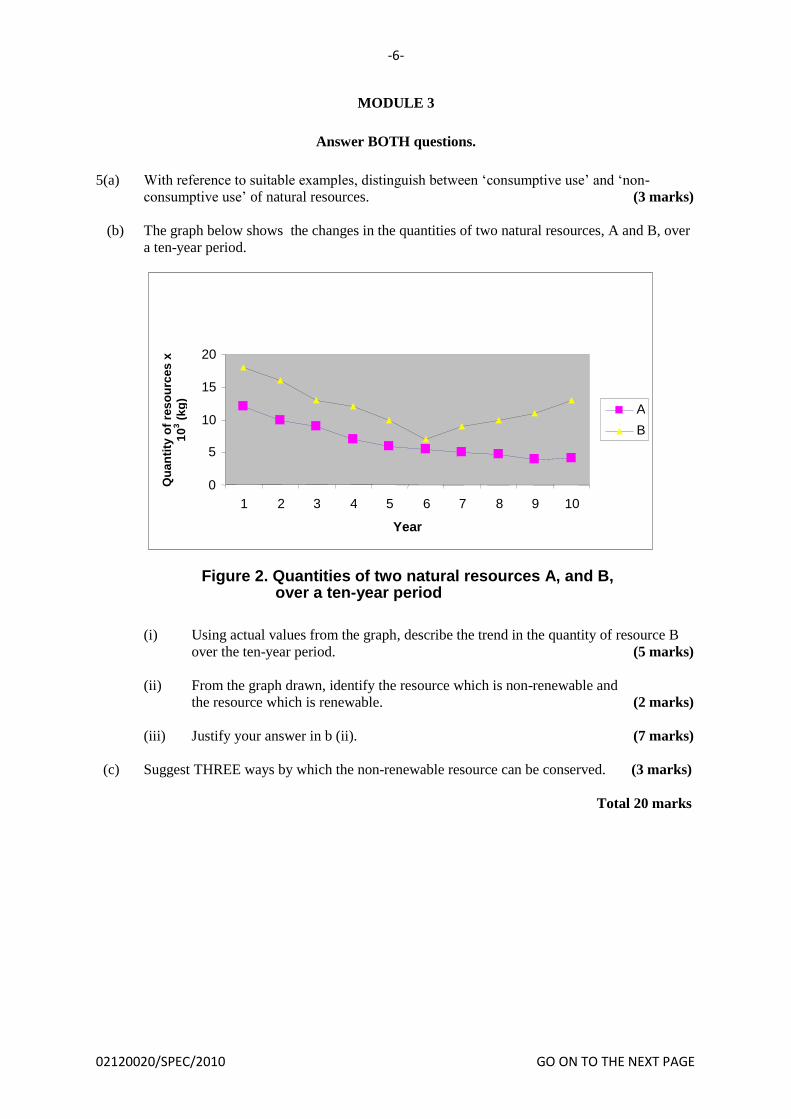
-6-
02120020/SPEC/2010 GO ON TO THE NEXT PAGE
MODULE 3
Answer BOTH questions.
5(a) With reference to suitable examples, distinguish between ‘consumptive use’ and ‘non-
consumptive use’ of natural resources. (3 marks)
(b) The graph below shows the changes in the quantities of two natural resources, A and B, over
a ten-year period.
(i) Using actual values from the graph, describe the trend in the quantity of resource B
over the ten-year period. (5 marks)
(ii) From the graph drawn, identify the resource which is non-renewable and
the resource which is renewable. (2 marks)
(iii) Justify your answer in b (ii). (7 marks)
(c) Suggest THREE ways by which the non-renewable resource can be conserved. (3 marks)
Total 20 marks
0
5
10
15
20
1 2 3 4 5 6 7 8 9 10
Year
A
B
Qu
an
tity
of
res
ou
rces
x
10
3 (
kg
)
Figure 2. Quantities of two natural resources A, and B, over a ten-year period
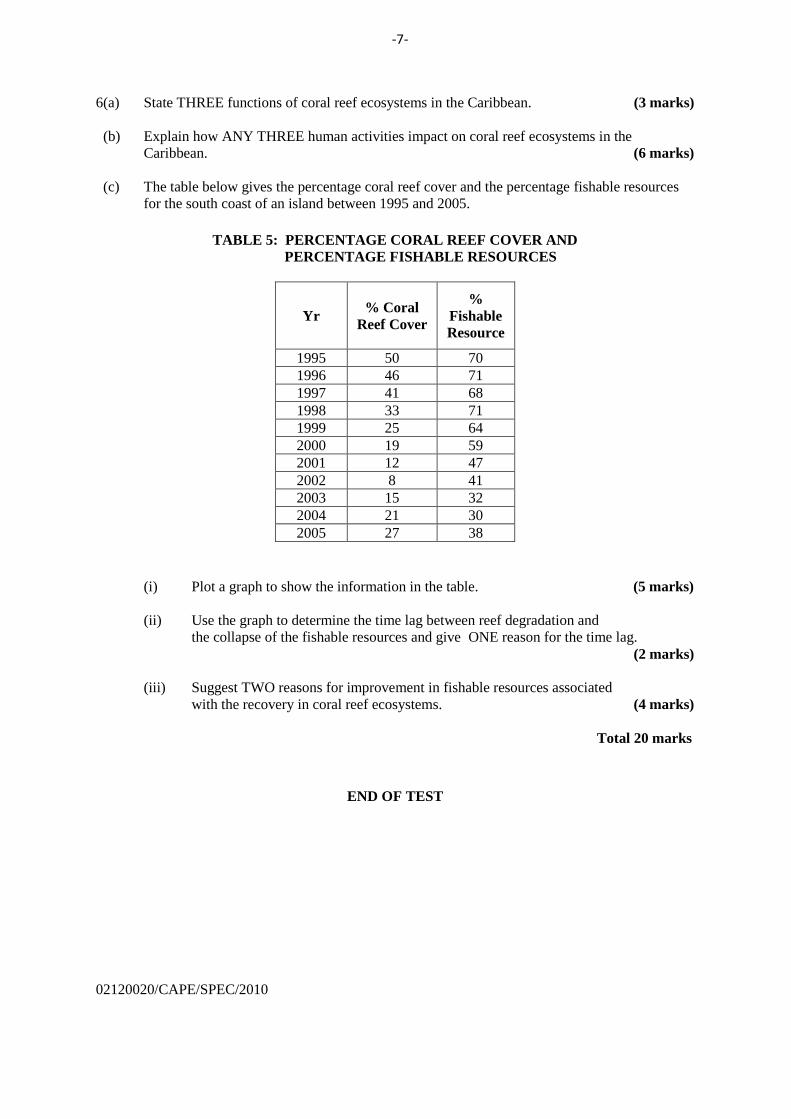
6(a) State THREE functions of coral reef ecosystems in the Caribbean. (3 marks)
(b) Explain how ANY THREE human activities impact on coral reef ecosystems in the
Caribbean. (6 marks)
(c) The table below gives the percentage coral reef cover and the percentage fishable resources
for the south coast of an island between 1995 and 2005.
TABLE 5: PERCENTAGE CORAL REEF COVER AND
PERCENTAGE FISHABLE RESOURCES
Yr % Coral
Reef Cover
%
Fishable
Resource
1995 50 70
1996 46 71
1997 41 68
1998 33 71
1999 25 64
2000 19 59
2001 12 47
2002 8 41
2003 15 32
2004 21 30
2005 27 38
(i) Plot a graph to show the information in the table. (5 marks)
(ii) Use the graph to determine the time lag between reef degradation and
the collapse of the fishable resources and give ONE reason for the time lag.
(2 marks)
(iii) Suggest TWO reasons for improvement in fishable resources associated
with the recovery in coral reef ecosystems. (4 marks)
Total 20 marks
END OF TEST
02120020/CAPE/SPEC/2010
-7-
TEST CODE 02120032/SPEC/2010
C A R I B B E A N E X A M I N A T I O N S C O U N C I L
ADVANCED PROFICIENCY EXAMINATION
ENVIRONMENTAL SCIENCE
UNIT 1: ECOLOGY, HUMAN POPULATION AND NATURAL RESOURCES
SPECIMEN PAPER
PAPER 03/2
2 hours
Copyright © 2009 Caribbean Examinations Council®
All rights reserved.
02120032/SPEC/ 2010
INSTRUCTIONS TO CANDIDATES
1. This paper consists of THREE questions.
2. Answer ALL questions.
3. Write your answers in the answer booklet provided.
4. Graph paper is provided.
5. You may use a silent, non-programmable, scientific calculator
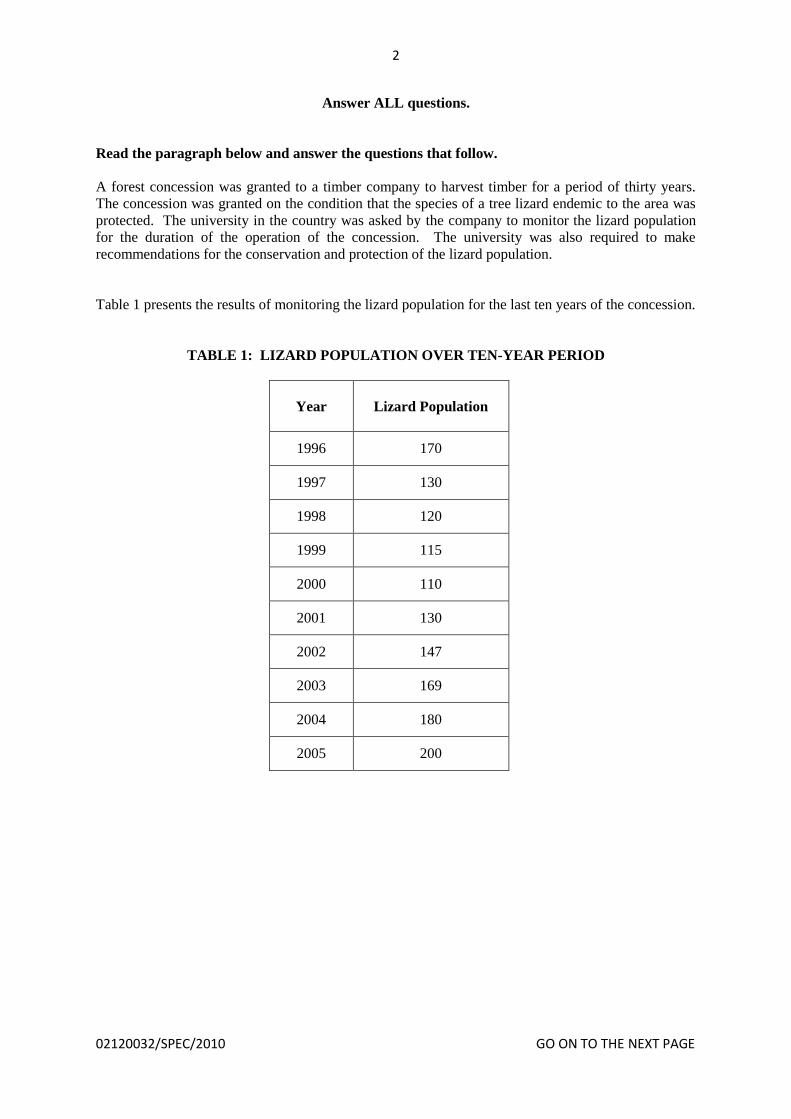
2
02120032/SPEC/2010 GO ON TO THE NEXT PAGE
Answer ALL questions.
Read the paragraph below and answer the questions that follow.
A forest concession was granted to a timber company to harvest timber for a period of thirty years.
The concession was granted on the condition that the species of a tree lizard endemic to the area was
protected. The university in the country was asked by the company to monitor the lizard population
for the duration of the operation of the concession. The university was also required to make
recommendations for the conservation and protection of the lizard population.
Table 1 presents the results of monitoring the lizard population for the last ten years of the concession.
TABLE 1: LIZARD POPULATION OVER TEN-YEAR PERIOD
Year Lizard Population
1996 170
1997 130
1998 120
1999 115
2000 110
2001 130
2002 147
2003 169
2004 180
2005 200
3
02120032/SPEC/2010 GO ON TO THE NEXT PAGE
1. The mark-release-recapture method was used to collect the data presented in Table 1.
(a) Why is this method suitable for the lizard population? (3 marks)
(b) Outline the mark-release-recapture method for collecting the data presented in
Table 1. (7 marks)
(c) State TWO assumptions that must be made when using the mark-release- recapture
method to estimate population size. (4 marks)
(d) Describe FOUR steps of a monitoring plan to track the lizard population. State ONE
objective for EACH step described. (8 marks)
(e) Use the information in Table 1 to plot an appropriate graph showing the variation in
the lizard population during the period 1996 – 2005. (8 marks)
Total 30 marks
2. Figure 1 shows the age structure diagram for a country. The fertility rate of the country is at
replacement level and its population size is 56.6 million.
Figure 1. Age structure diagram
4
02120032/SPEC/2010 GO ON TO THE NEXT PAGE
(a) State what is meant by the terms
(i) fertility rate
(ii) replacement fertility rate. (4 marks)
(b) Use the diagram to calculate
(i) the number of people in the 41 – 60 age group (5 marks)
(ii) the percentage of the population in the pre-reproductive years. (7 marks)
(c) (i) How is the population of the country expected to change over the next ten years?
(1 mark)
(ii) Justify your answer in (c) (i). (4 marks)
(d) Explain how EACH of the following factors may affect fertility rates:
(i) Educational opportunities
(ii) Social and economic status of women
(iii) Family planning services (9 marks)
Total 30 marks
5
02120032/SPEC/2010 GO ON TO THE NEXT PAGE
3 Figure 2 shows the effect of increased harvesting effort (number of fishing boats) on the
daily fish catch. .
(a) (i) Describe the trend observed in Figure 2. (8 marks)
(ii) Using the graph, determine what fishing effort will produce a daily catch of 3500 kg
of fish . (2 marks)
(b) (i) What is meant by the term ‘maximum sustainable yield (MSY)’ in relation to the
harvesting of the fishing stock? (2 marks)
(ii) At which of the three points, A, B or C, shown on Figure 2 should harvesting take
place to achieve the maximum sustainable yield? (1 mark)
(iii) Give THREE reasons why it is best to harvest the fishing resource at the
MSY. (6 marks)
(c) Explain the effect of EACH of the following on the harvesting of the fishing resource in
Figure 2:
(i) Population growth
(ii) Level of environmental awareness (6 marks)
(d) (i) Recommend ONE conservation measure that may be used to improve the status of the
fishing resource. (1 mark)
(ii) Give TWO reasons for the recommendation provided in (d)(i). (4 marks)
Total 30 marks
END OF TEST
02120032/SPEC/2010
6
TEST CODE 02220010/SPEC/2010
C A R I B B E A N E X A M I N A T I O N S C O U N C I L
ADVANCED PROFICIENCY EXAMINATION
ENVIRONMENTAL SCIENCEUNIT 2
SPECIMEN PAPER
Paper 01
90 minutes
READ THE FOLLOWING INSTRUCTIONS CAREFULLY.
1. This test consists of 45 items. You will have 90 minutes to answer them.
2. In addition to this test booklet, you should have an answer sheet.
3. Do not be concerned that the answer sheet provides spaces for more answers than there are items
in this test.
4. Each item in this test has four suggested answers lettered (A), (B), (C), (D). Read each item
you are about to answer and decide which choice is best.
5. On your answer sheet, fi nd the number which corresponds to your item and shade the space
having the same letter as the answer you have chosen. Look at the sample item below.
Sample Item
Suspended particles in water cause
Sample Answer
(A) acidity A B C D
(B) alkalinity
(C) salinity
(D) turbidity
The best answer to this item is “turbidity”, so answer space (D) has been shaded.
6. If you want to change your answer, erase it completely before you fi ll in your new choice.
7. When you are told to begin, turn the page and work as quickly and as carefully as you can. If
you cannot answer an item, omit it and go on to the next one. You may return to the omitted
item later.Your score will be the total number of correct answers.
8. You may use a silent electronic calculator.
DO NOT TURN THIS PAGE UNTIL YOU ARE TOLD TO DO SO.
Copyright © 2009 Caribbean Examinations Council ®
All rights reserved.
02220010/SPEC/2010
- 2 -
GO ON TO THE NEXT PAGE
02220010/SPEC/2010
1. Which of the following may cause soil
degradation?
I. Leaching
II. Strip farming
III. Water logging
IV. Mono-culture farming
(A) I and II only
(B) I, II and III only
(C) I, III and IV only
(D) I, II, III and IV
2. Which of the following BEST describes
subsistence farming?
(A) Large scale for profi t
(B) Providing just enough for the
farmer’s own family
(C) Involving large amounts of inputs
for example, fertilisers
(D) Involving few people and large
amounts of land
3. Which of the following are effects of the
continuous use of fertilisers?
I. Few organisms in the soil
II. Reduced soil humus content
III. Poor crumb structure of soil
IV. Decreased soil mineral content
(A) I and II only
(B) I and III only
(C) I, II and III only
(D) I, II, III and IV
4. Which method of increasing soil fertility has
the GREATEST environmental impact?
(A) Adding cow manure to the soil
(B) Ploughing a cover crop into the soil
(C) Planting pigeon peas between rows
of other crops
(D) Adding inorganic fertiliser to the
soil
5. The farming of ocean fi sh is BEST described
as
(A) apiculture
(B) aeroponics
(C) mariculture
(D) hydroponics
6. Which of the following are environmentally
sustainable agricultural practices?
I. Agro-forestry
II. Contour farming
III. Integrated pest management
IV. Mono-culture farming
(A) I and III only
(B) I, II and III only
(C) I, II and IV only
(D) I, II, III and IV
7. Agriculture plays an important role in the
economies of various countries. Which of the
following are the MOST important economic
roles played by agriculture?
I. Provides form of food security
II. Contributes to Gross Domestic
Product (GDP)
III. Provides opportunity for scientifi c
research
IV. Attracts foreign exchange
(A) I, II and III only
(B) I, II and IV only
(C) I, III and IV only
(D) II, III and IV only
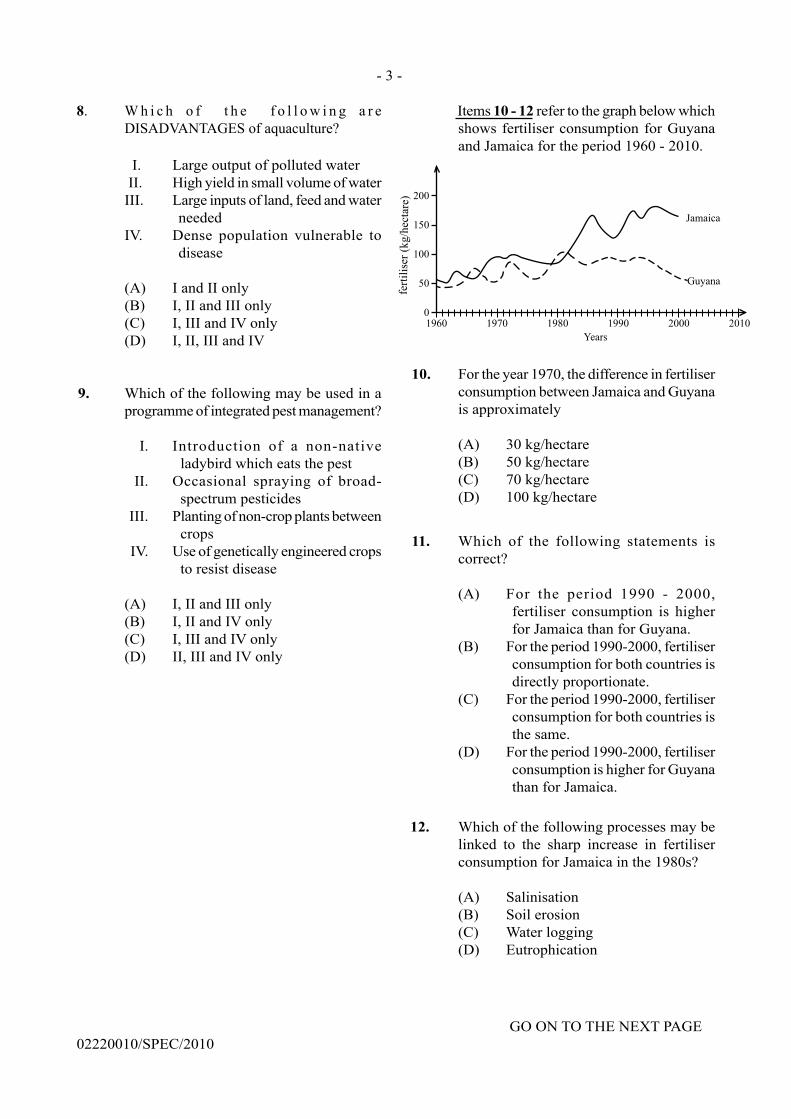
- 3 -
GO ON TO THE NEXT PAGE
02220010/SPEC/2010
8. W h i c h o f t h e f o l l o w i n g a r e
DISADVANTAGES of aquaculture?
I. Large output of polluted water
II. High yield in small volume of water
III. Large inputs of land, feed and water
needed
IV. Dense population vulnerable to
disease
(A) I and II only
(B) I, II and III only
(C) I, III and IV only
(D) I, II, III and IV
9. Which of the following may be used in a
programme of integrated pest management?
I. Introduction of a non-native
ladybird which eats the pest
II. Occasional spraying of broad-
spectrum pesticides
III. Planting of non-crop plants between
crops
IV. Use of genetically engineered crops
to resist disease
(A) I, II and III only
(B) I, II and IV only
(C) I, III and IV only
(D) II, III and IV only
Items 10 - 12 refer to the graph below which
shows fertiliser consumption for Guyana
and Jamaica for the period 1960 - 2010.
10. For the year 1970, the difference in fertiliser
consumption between Jamaica and Guyana
is approximately
(A) 30 kg/hectare
(B) 50 kg/hectare
(C) 70 kg/hectare
(D) 100 kg/hectare
11. Which of the following statements is
correct?
(A) For the period 1990 - 2000,
fertiliser consumption is higher
for Jamaica than for Guyana.
(B) For the period 1990-2000, fertiliser
consumption for both countries is
directly proportionate.
(C) For the period 1990-2000, fertiliser
consumption for both countries is
the same.
(D) For the period 1990-2000, fertiliser
consumption is higher for Guyana
than for Jamaica.
12. Which of the following processes may be
linked to the sharp increase in fertiliser
consumption for Jamaica in the 1980s?
(A) Salinisation
(B) Soil erosion
(C) Water logging
(D) Eutrophication
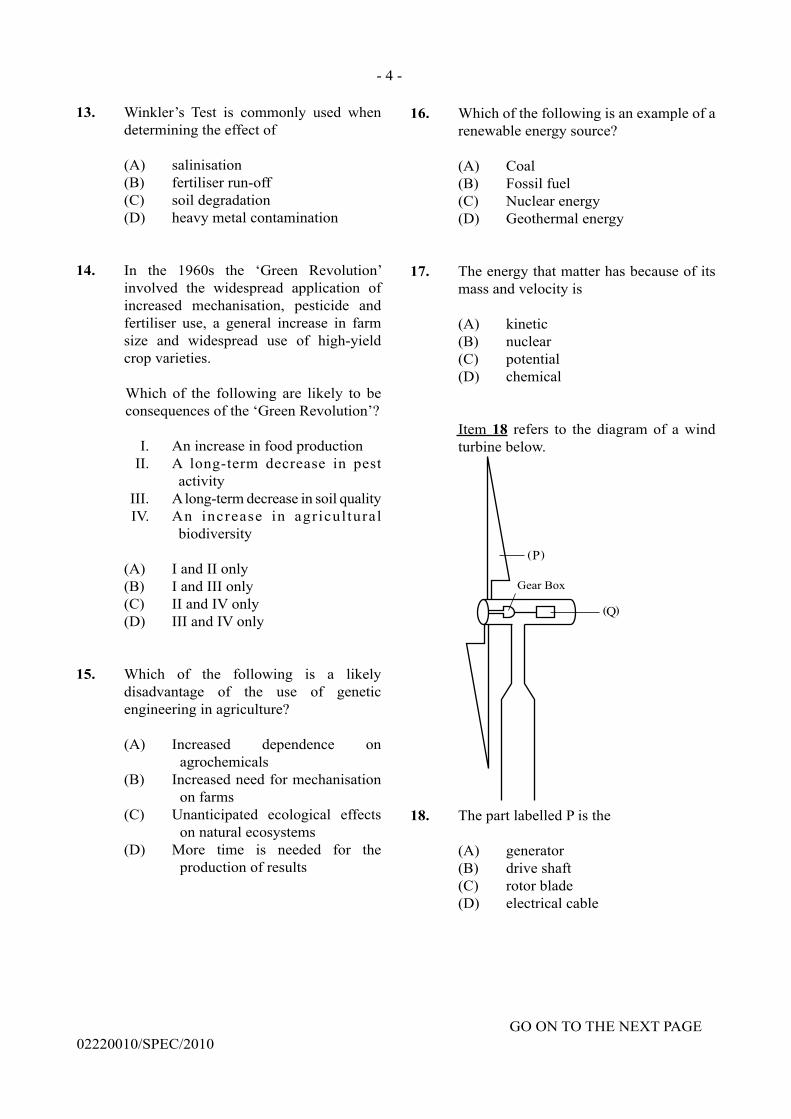
- 4 -
GO ON TO THE NEXT PAGE
02220010/SPEC/2010
13. Winkler’s Test is commonly used when
determining the effect of
(A) salinisation
(B) fertiliser run-off
(C) soil degradation
(D) heavy metal contamination
14. In the 1960s the ‘Green Revolution’
involved the widespread application of
increased mechanisation, pesticide and
fertiliser use, a general increase in farm
size and widespread use of high-yield
crop varieties.
Which of the following are likely to be
consequences of the ‘Green Revolution’?
I. An increase in food production
II. A long-term decrease in pest
activity
III. A long-term decrease in soil quality
IV. An increase in agricultural
biodiversity
(A) I and II only
(B) I and III only
(C) II and IV only
(D) III and IV only
15. Which of the following is a likely
disadvantage of the use of genetic
engineering in agriculture?
(A) Increased dependence on
agrochemicals
(B) Increased need for mechanisation
on farms
(C) Unanticipated ecological effects
on natural ecosystems
(D) More time is needed for the
production of results
16. Which of the following is an example of a
renewable energy source?
(A) Coal
(B) Fossil fuel
(C) Nuclear energy
(D) Geothermal energy
17. The energy that matter has because of its
mass and velocity is
(A) kinetic
(B) nuclear
(C) potential
(D) chemical
Item 18 refers to the diagram of a wind
turbine below.
18. The part labelled P is the
(A) generator
(B) drive shaft
(C) rotor blade
(D) electrical cable
- 5 -
GO ON TO THE NEXT PAGE
02220010/SPEC/2010
19. Which of the following actions can increase
the energy effi ciency of a building?
I. Aligning building to maximise air
fl ow
II. Using central air conditioning
III. Having large glass windows
IV. Using light coloured paints on the
wall
(A) I and III only
(B) III and IV only
(C) I, III and IV only
(D) I, II, III and IV
20. Which of the following are potential
environmental impacts of wind energy?
I. Bird kills
II. Noise pollution
III. Water pollution
IV. Loss of biodiversity
(A) I, II and III only
(B) I, II and IV only
(C) I, III and IV only
(D) I, II, III and IV
21. In the Caribbean, many islands rely on
the importation of fossil fuels to generate
electricity for domestic and industrial use.
The cost attached to this importation of
fuel can be classifi ed as
(A) social
(B) regional
(C) political
(D) economic
22. Which of the following energy conversions
shows the conversion of energy in the
production of electricity from crude oil?
(A) Chemical → mechanical → heat
→ electrical
(B) Chemical → heat → mechanical
→ electrical
(C) Heat → chemical → mechanical
→ electrical
(D) Mechanical → light → heat →
electrical
23. Which of the following may be done in
the home to help conserve energy?
I. Turn off the light when not in the
room.
II. Unplug cell phone chargers and
other devices when not in use.
III. Leave on the tap while brushing
your teeth.
IV. Do not turn off the computer
because it uses more energy on
start up.
(A) I and II only
(B) I and III only
(C) II and IV only
(D) III and IV only
24. Which of the following may be adopted
to promote the use of hybrid vehicles (a
vehicle which uses alternative energy
sources) in the Caribbean?
I. Charge no import duty on hybrid
vehicles
II. Increase taxes on fuel for traditional
vehicles
III. Increase taxes on gas and diesel
engine vehicles
IV. Upgrade and increase the existing
fuel stations to accommodate
hybrid vehicles
(A) I and IV only
(B) I, II and IV only
(C) I, III and IV only
(D) I, II, III and IV
- 6 -
GO ON TO THE NEXT PAGE
02220010/SPEC/2010
Items 25 - 26 refer to the diagram below
which shows the energy conversion in a
car’s engine.
25. The energy effi ciency of the engine is
(A) 20%
(B) 50%
(C) 70%
(D) 100%
26. The remaining 64 kW is
(A) used for braking
(B) lost as heat energy
(C) used for water cooling
(D) re-circulated into the engine
27. Water stored in a dam is an example of
(A) solar energy
(B) water energy
(C) kinetic energy
(D) potential energy
Item 28 refers to the following pie chart
which represents global primary energy
supply.
28. The total percentage of global energy
supplied by fossil fuels is
(A) 21.2%
(B) 35.0%
(C) 69.2%
(D) 79.5%
Item 29 refers to the graph below which
shows the number of Industrial plants in
fi ve Caribbean countries.
29. Based on the graph, which Caribbean
country will have the GREATEST demand
for electricity?
(A) Guyana
(B) Jamaica
(C) Barbados
(D) Trinidad & Tobago
- 7 -
GO ON TO THE NEXT PAGE
02220010/SPEC/2010
Item 30 refers to the diagram below.
30. The diagram shows the essential features
of
(A) a fuel cell
(B) an electric motor
(C) a nuclear fusion reactor
(D) a nuclear fi ssion reactor
31. The BEST example of a point source of
water pollution is
(A) storm water
(B) factory effl uent
(C) acid precipitation
(D) agricultural run-off
32. Ozone, O3, is
(A) a primary air pollutant in the
troposphere
(B) a secondary air pollutant in the
troposphere
(C) a primary air pollutant in the
stratosphere
(D) a secondary air pollutant in the
stratosphere
33. Which international agreement was
designed to protect the ozone layer?
(A) Kyoto Protocol
(B) Montreal Protocol
(C) Basel Convention
(D) Cartagena Convention
Item 34 refers to the equations below.
CF2 Cl
2 (g) + hv → CF
2 Cl (g) + Cl (g)
Cl (g) + O3 (g) → ClO (g) + O
2 (g)
34. The equations above BEST describe the
(A) greenhouse effect
(B) process of oxidation
(C) process of carbonation
(D) destruction of the ozone layer
35. On which of the following does the
toxicity of a substance depend?
I. The amount of the substance the
person has ingested, inhaled or
absorbed through the skin
II. How frequently the person is
exposed to the substance
III. The genetic make-up of an
individual
IV. The percentage of individuals in
the population who are affected
by the chemical substance
(A) I and III only
(B) I, II and III only
(C) I, II and IV only
(D) I, III and IV only
36. A synergistic interaction
(A) either decreases or multiplies the
harmful effect of a toxin
(B) is an immediate or rapid harmful
reaction to an exposure
(C) reduces the harmful effect of a
toxin
(D) multiplies the harmful effect of a
toxin
H2
Electrolyte
solutionKOH
O2
H2O
- 8 -
GO ON TO THE NEXT PAGE
02220010/SPEC/2010
37. Which of the following activities may result
in an increase in pollution?
I. Individual
II. Recreational
III. Festival
IV. Tourism
(A) I and II only
(B) II and III only
(C) I, II and III only
(D) I, II, III and IV
38. Which of the following should be considered
when disposing hazardous waste?
I. Security of disposal site
II. Methods of transporting the waste
to disposal site
III. Weight of the hazardous waste
IV. Geological activity
(A) I, II and III only
(B) I, II and IV only
(C) II, III and IV only
(D) I, II, III and IV
Items 39 - 40 refer to the diagram below showing a section of a village with locations labelled
(A), (B), (C) and (D).
39. Which location on the diagram is the BEST location for a water treatment plant that produces
potable water?
40. At which location on the diagram will the nitrates be in the HIGHEST concentration?
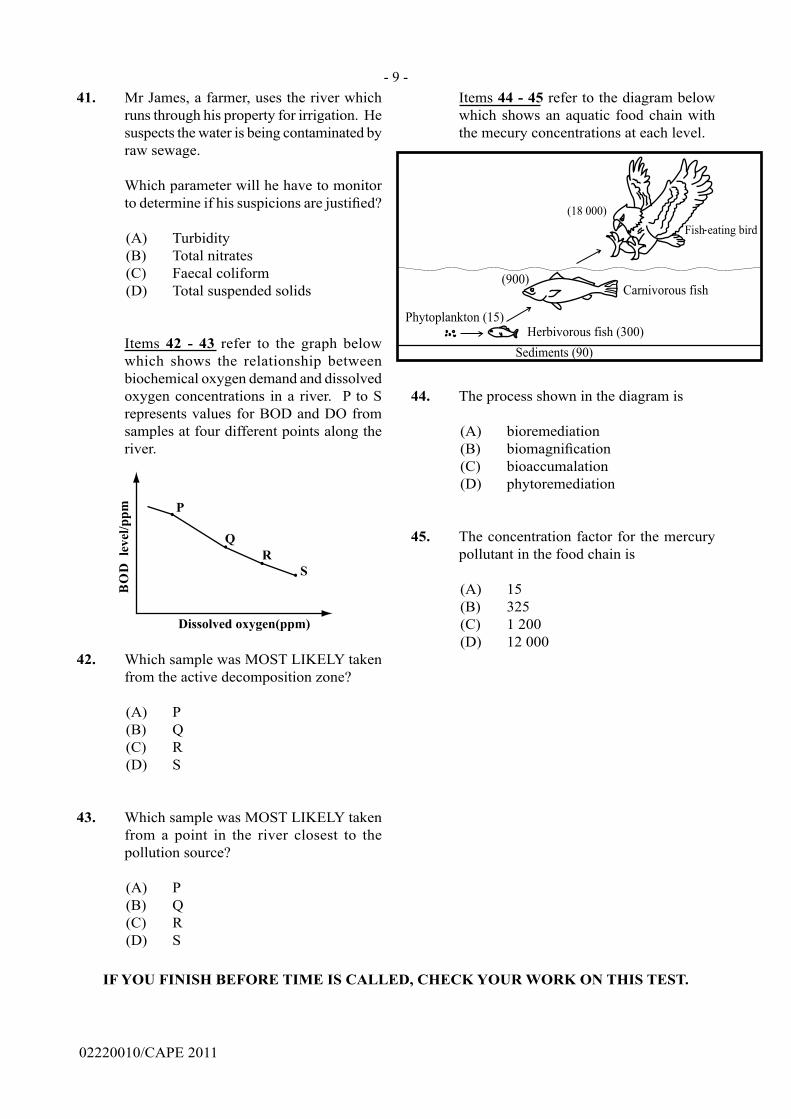
IF YOU FINISH BEFORE TIME IS CALLED, CHECK YOUR WORK ON THIS TEST.
02220010/CAPE 2011
- 9 -
Items 44 - 45 refer to the diagram below
which shows an aquatic food chain with
the mecury concentrations at each level.
44. The process shown in the diagram is
(A) bioremediation
(B) biomagnifi cation
(C) bioaccumalation
(D) phytoremediation
45. The concentration factor for the mercury
pollutant in the food chain is
(A) 15
(B) 325
(C) 1 200
(D) 12 000
41. Mr James, a farmer, uses the river which
runs through his property for irrigation. He
suspects the water is being contaminated by
raw sewage.
Which parameter will he have to monitor
to determine if his suspicions are justifi ed?
(A) Turbidity
(B) Total nitrates
(C) Faecal coliform
(D) Total suspended solids
Items 42 - 43 refer to the graph below
which shows the relationship between
biochemical oxygen demand and dissolved
oxygen concentrations in a river. P to S
represents values for BOD and DO from
samples at four different points along the
river.
42. Which sample was MOST LIKELY taken
from the active decomposition zone?
(A) P
(B) Q
(C) R
(D) S
43. Which sample was MOST LIKELY taken
from a point in the river closest to the
pollution source?
(A) P
(B) Q
(C) R
(D) S
TEST CODE 02220020/SPEC/2010
C A R I B B E A N E X A M I N A T I O N S C O U N C I L
ADVANCED PROFICIENCY EXAMINATION
ENVIRONMENTAL SCIENCE
UNIT 2: AGRICULTURE, ENERGY AND ENVIRONMENTAL POLLUTION
SPECIMEN PAPER
PAPER 02
2 hours 30 minutes
Copyright © 2009 Caribbean Examinations Council®
All rights reserved.
02220020/ SPEC/ 2010
INSTRUCTIONS TO CANDIDATES
1. Do NOT open this examination paper until instructed to do so.
2. This paper consists of SIX questions, TWO from each Module.
3. Answer ALL questions.
4. Write your answers in the answer booklet provided.
5. You may use a silent, non-programmable, scientific calculator.
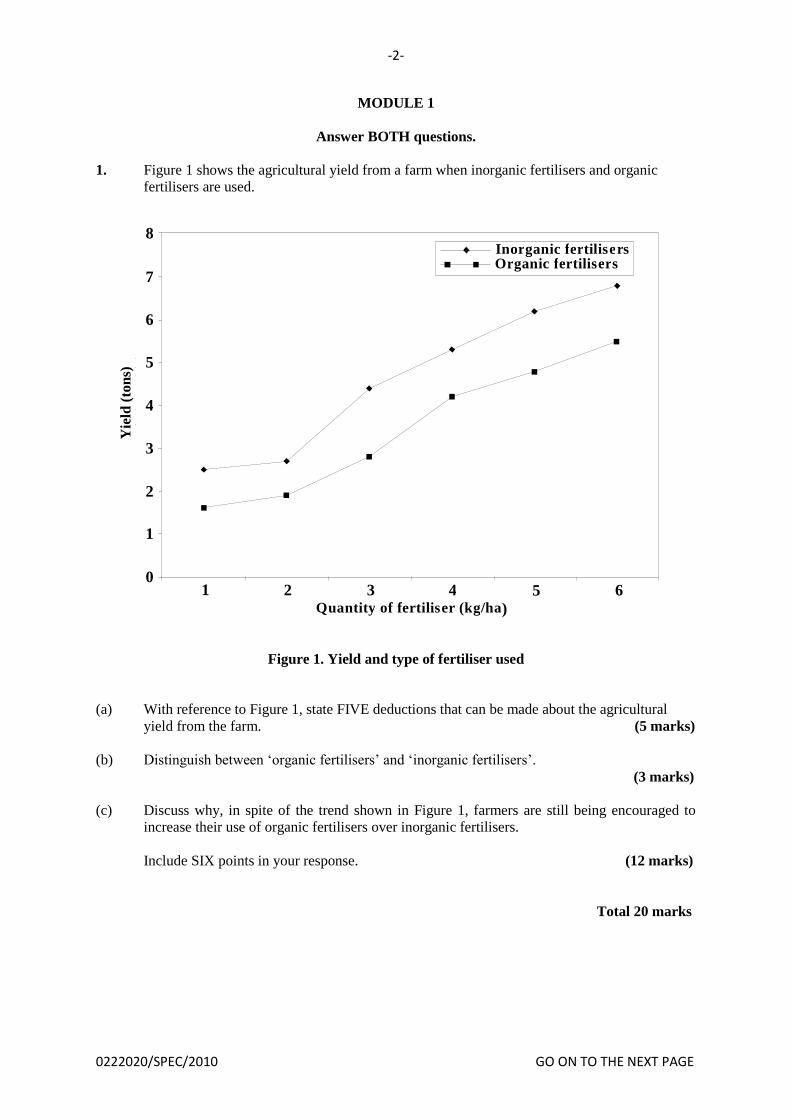
-2-
0222020/SPEC/2010 GO ON TO THE NEXT PAGE
MODULE 1
Answer BOTH questions.
1. Figure 1 shows the agricultural yield from a farm when inorganic fertilisers and organic
fertilisers are used.
Figure 1. Yield and type of fertiliser used
(a) With reference to Figure 1, state FIVE deductions that can be made about the agricultural
yield from the farm. (5 marks)
(b) Distinguish between ‘organic fertilisers’ and ‘inorganic fertilisers’.
(3 marks)
(c) Discuss why, in spite of the trend shown in Figure 1, farmers are still being encouraged to
increase their use of organic fertilisers over inorganic fertilisers.
Include SIX points in your response. (12 marks)
Total 20 marks
0
1
1
2
2
3
3
4
4
5
5
6
6
7
8
Y i e
( t o n s )
Q u a n t i t y o f f e r t i l i s e r ( k g / h a )
I n o r g a n i c f e r t i l i s e r s O r g a n i c f e r t i l i s e r s
Yie
ld (
ton
s)
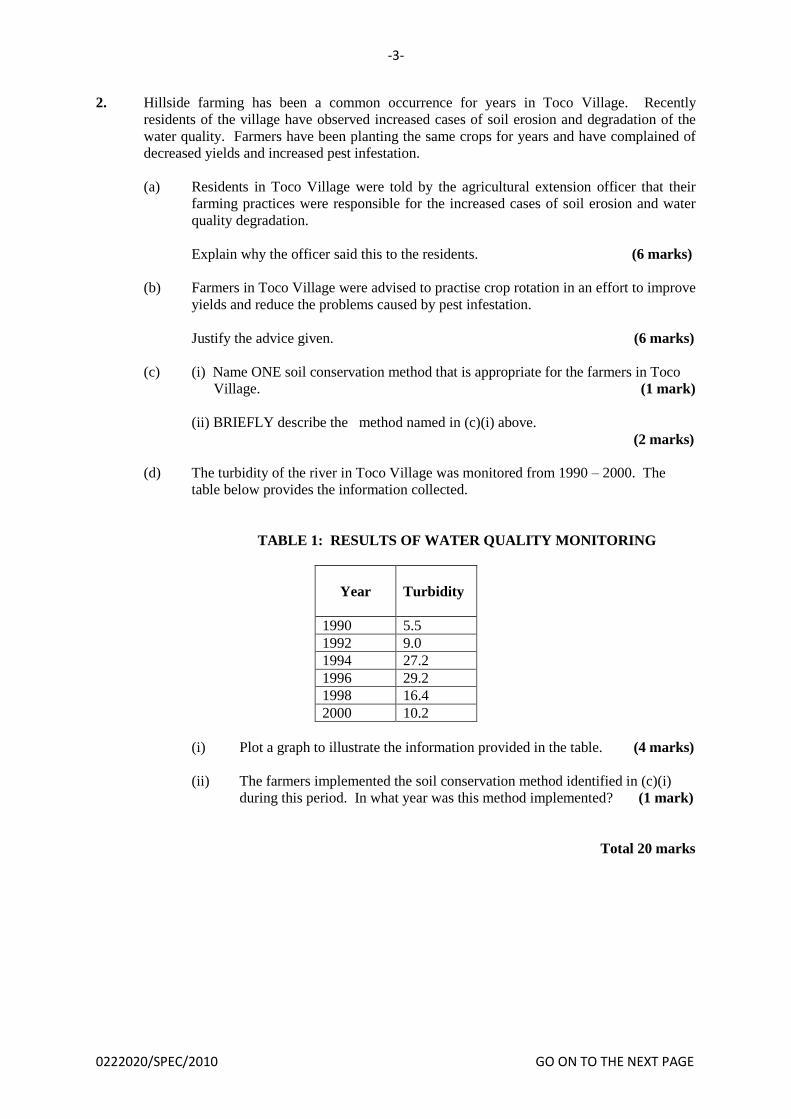
-3-
0222020/SPEC/2010 GO ON TO THE NEXT PAGE
2. Hillside farming has been a common occurrence for years in Toco Village. Recently
residents of the village have observed increased cases of soil erosion and degradation of the
water quality. Farmers have been planting the same crops for years and have complained of
decreased yields and increased pest infestation.
(a) Residents in Toco Village were told by the agricultural extension officer that their
farming practices were responsible for the increased cases of soil erosion and water
quality degradation.
Explain why the officer said this to the residents. (6 marks)
(b) Farmers in Toco Village were advised to practise crop rotation in an effort to improve
yields and reduce the problems caused by pest infestation.
Justify the advice given. (6 marks)
(c) (i) Name ONE soil conservation method that is appropriate for the farmers in Toco
Village. (1 mark)
(ii) BRIEFLY describe the method named in (c)(i) above.
(2 marks)
(d) The turbidity of the river in Toco Village was monitored from 1990 – 2000. The
table below provides the information collected.
TABLE 1: RESULTS OF WATER QUALITY MONITORING
Year
Turbidity
1990 5.5
1992 9.0
1994 27.2
1996 29.2
1998 16.4
2000 10.2
(i) Plot a graph to illustrate the information provided in the table. (4 marks)
(ii) The farmers implemented the soil conservation method identified in (c)(i)
during this period. In what year was this method implemented? (1 mark)
Total 20 marks
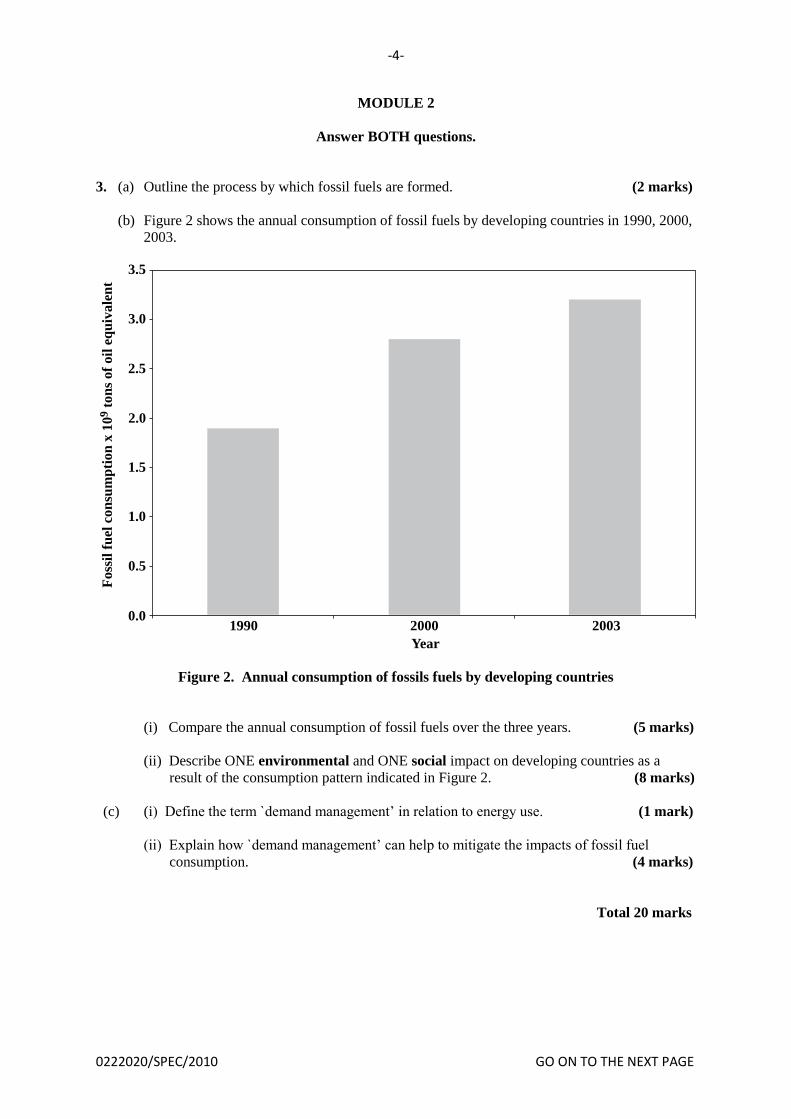
-4-
0222020/SPEC/2010 GO ON TO THE NEXT PAGE
MODULE 2
Answer BOTH questions.
3. (a) Outline the process by which fossil fuels are formed. (2 marks)
(b) Figure 2 shows the annual consumption of fossil fuels by developing countries in 1990, 2000,
2003.
Figure 2. Annual consumption of fossils fuels by developing countries
(i) Compare the annual consumption of fossil fuels over the three years. (5 marks)
(ii) Describe ONE environmental and ONE social impact on developing countries as a
result of the consumption pattern indicated in Figure 2. (8 marks)
(c) (i) Define the term `demand management’ in relation to energy use. (1 mark)
(ii) Explain how `demand management’ can help to mitigate the impacts of fossil fuel
consumption. (4 marks)
Total 20 marks
0.0
1.0
1990
2.0
2000
3.0
1.5
2.5
3.5
2003
0.5
Year
Fo
ssil
fuel
con
sum
pti
on
x1
09
ton
sof
oil
equ
ivale
nt
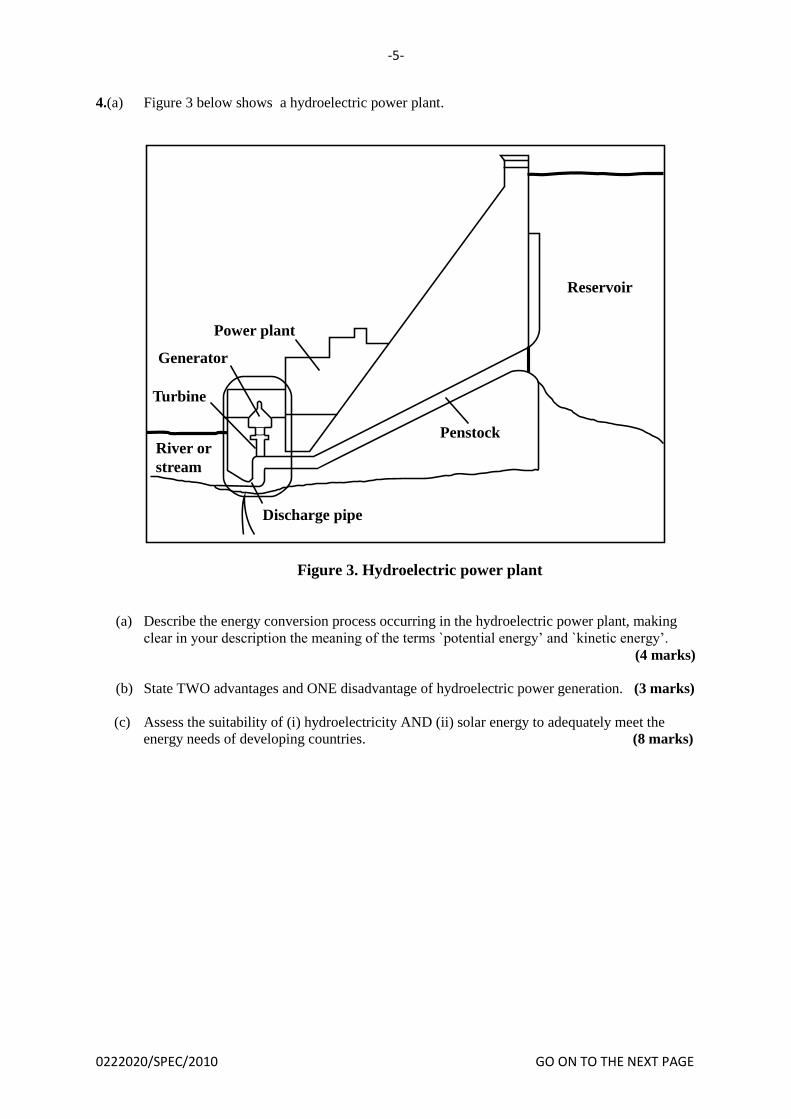
-5-
0222020/SPEC/2010 GO ON TO THE NEXT PAGE
4.(a) Figure 3 below shows a hydroelectric power plant.
Figure 3. Hydroelectric power plant
(a) Describe the energy conversion process occurring in the hydroelectric power plant, making
clear in your description the meaning of the terms `potential energy’ and `kinetic energy’.
(4 marks)
(b) State TWO advantages and ONE disadvantage of hydroelectric power generation. (3 marks)
(c) Assess the suitability of (i) hydroelectricity AND (ii) solar energy to adequately meet the
energy needs of developing countries. (8 marks)
Reservoir
Penstock
Discharge pipe
River or
stream
Turbine
Generator
Power plant

-6-
0222020/SPEC/2010 GO ON TO THE NEXT PAGE
(d) The data below represent the percentage use of various types of energy in the world.
Type of Energy
Percentage
Use
Biomass 11.0
Coal 22.0
Geothermal, solar, wind 2.5
Hydropower 4.5
Natural gas 21.0
Nuclear 6.0
Oil 33.0
(i) Plot a bar graph to illustrate the data in the table. (4 marks)
(ii) What percentage of commercial energy used in the world is renewable? (1 mark)
Total 20 marks
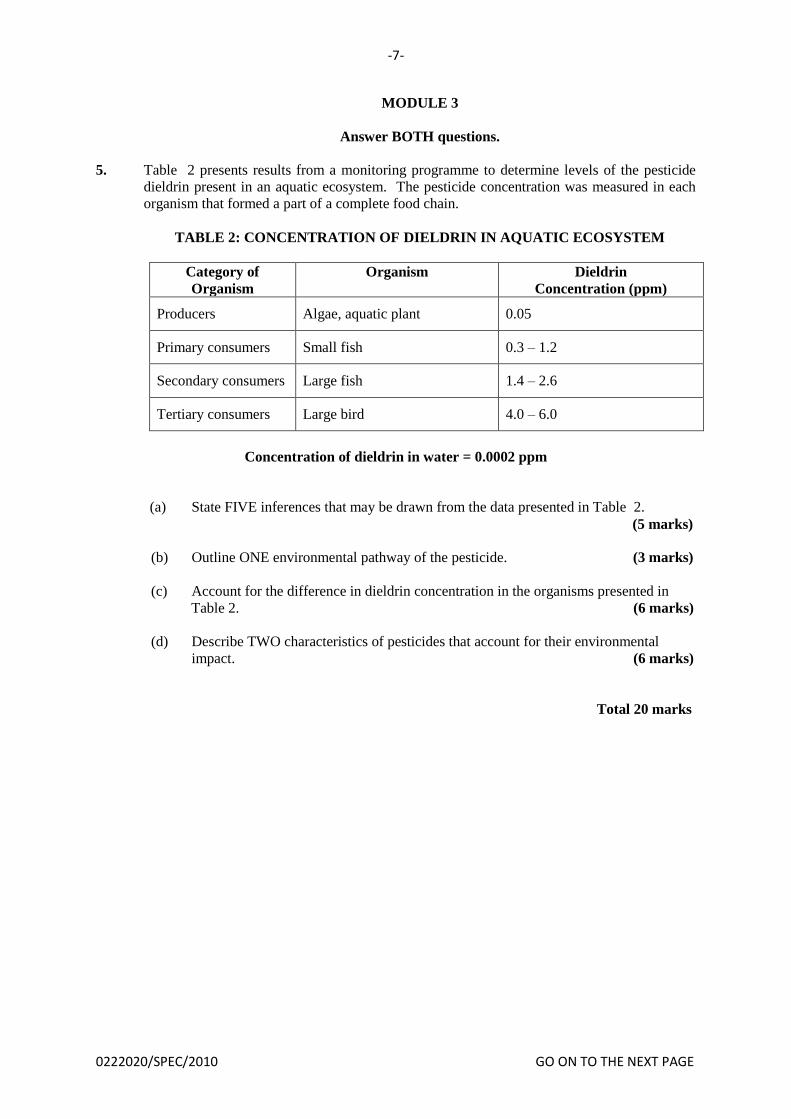
-7-
0222020/SPEC/2010 GO ON TO THE NEXT PAGE
MODULE 3
Answer BOTH questions.
5. Table 2 presents results from a monitoring programme to determine levels of the pesticide
dieldrin present in an aquatic ecosystem. The pesticide concentration was measured in each
organism that formed a part of a complete food chain.
TABLE 2: CONCENTRATION OF DIELDRIN IN AQUATIC ECOSYSTEM
Category of
Organism
Organism Dieldrin
Concentration (ppm)
Producers Algae, aquatic plant 0.05
Primary consumers Small fish 0.3 – 1.2
Secondary consumers Large fish 1.4 – 2.6
Tertiary consumers Large bird 4.0 – 6.0
Concentration of dieldrin in water = 0.0002 ppm
(a) State FIVE inferences that may be drawn from the data presented in Table 2.
(5 marks)
(b) Outline ONE environmental pathway of the pesticide. (3 marks)
(c) Account for the difference in dieldrin concentration in the organisms presented in
Table 2. (6 marks)
(d) Describe TWO characteristics of pesticides that account for their environmental
impact. (6 marks)
Total 20 marks
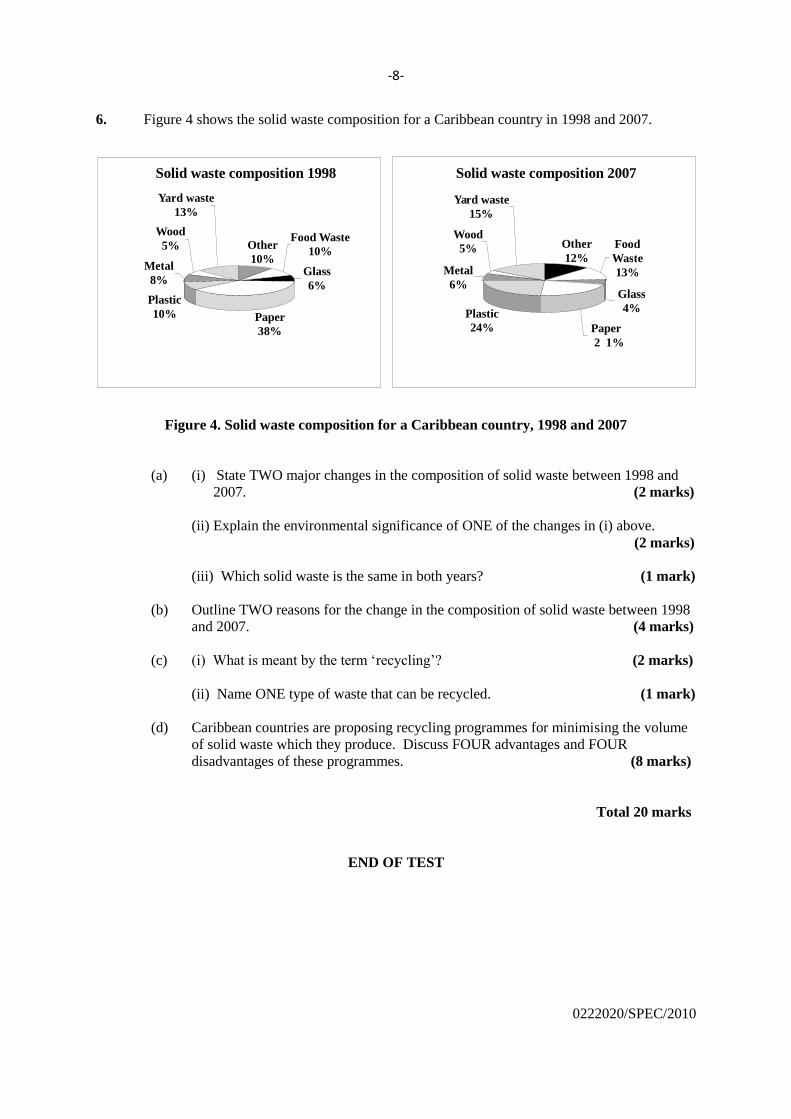
6. Figure 4 shows the solid waste composition for a Caribbean country in 1998 and 2007.
Figure 4. Solid waste composition for a Caribbean country, 1998 and 2007
(a) (i) State TWO major changes in the composition of solid waste between 1998 and
2007. (2 marks)
(ii) Explain the environmental significance of ONE of the changes in (i) above.
(2 marks)
(iii) Which solid waste is the same in both years? (1 mark)
(b) Outline TWO reasons for the change in the composition of solid waste between 1998
and 2007. (4 marks)
(c) (i) What is meant by the term ‘recycling’? (2 marks)
(ii) Name ONE type of waste that can be recycled. (1 mark)
(d) Caribbean countries are proposing recycling programmes for minimising the volume
of solid waste which they produce. Discuss FOUR advantages and FOUR
disadvantages of these programmes. (8 marks)
Total 20 marks
END OF TEST
0222020/SPEC/2010
P l a s t i c 1 0 % P a p e r
3 8 %
G l a s s 6 %
O t h e r 1 0 %
F o o d W a s t e 1 0 %
M e t a l 8 %
W o o d 5 %
Y a r d w a s t e 1 3 %
S o l i d w a s t e c o m p o s i t i o n 1 9 9 8 S o l i d w a s t e c o m p o s i t i o n 2 0 0 7
P l a s t i c 2 4 % P a p e r
2 1%
G l a s s 4 %
O t h e r 1 2 %
F o o d W a s t e 1 3 % M e t a l
6 %
W o o d 5 %
Y a r d w a s t e 1 5 %
-8-
TEST CODE 02220032/SPEC
C A R I B B E A N E X A M I N A T I O N S C O U N C I L
ADVANCED PROFICIENCY EXAMINATION
ENVIRONMENTAL SCIENCE
UNIT 2: AGRICULTURE, ENERGY AND ENVIRONMENTAL POLLUTION
SPECIMEN PAPER
PAPER 03/2
2 hours
Copyright © 2009 Caribbean Examinations Council®
All rights reserved.
02220032/ SPEC/2010
INSTRUCTIONS TO CANDIDATES
1. This paper consists of THREE questions.
2. Answer ALL questions.
3. Write your answers in the answer booklet provided.
4. Graph paper is provided.
5. You may use a silent, non-programmable, scientific calculator.
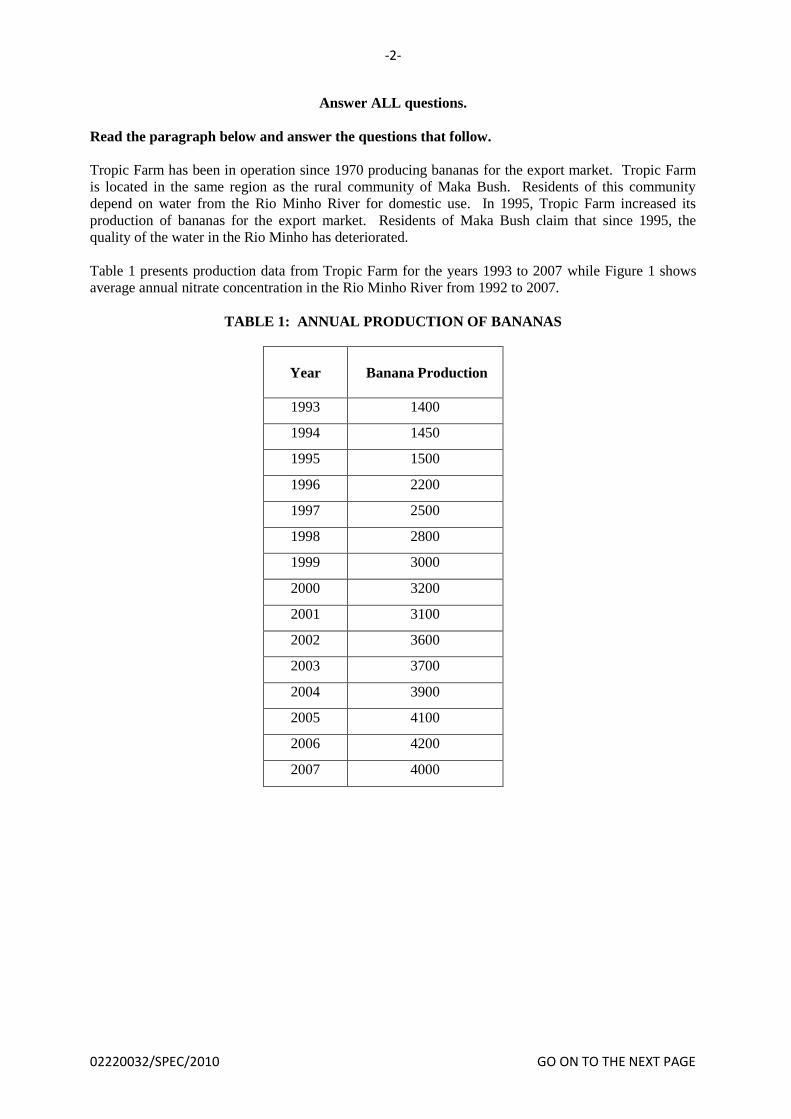
-2-
02220032/SPEC/2010 GO ON TO THE NEXT PAGE
Answer ALL questions.
Read the paragraph below and answer the questions that follow.
Tropic Farm has been in operation since 1970 producing bananas for the export market. Tropic Farm
is located in the same region as the rural community of Maka Bush. Residents of this community
depend on water from the Rio Minho River for domestic use. In 1995, Tropic Farm increased its
production of bananas for the export market. Residents of Maka Bush claim that since 1995, the
quality of the water in the Rio Minho has deteriorated.
Table 1 presents production data from Tropic Farm for the years 1993 to 2007 while Figure 1 shows
average annual nitrate concentration in the Rio Minho River from 1992 to 2007.
TABLE 1: ANNUAL PRODUCTION OF BANANAS
Year
Banana Production
1993 1400
1994 1450
1995 1500
1996 2200
1997 2500
1998 2800
1999 3000
2000 3200
2001 3100
2002 3600
2003 3700
2004 3900
2005 4100
2006 4200
2007 4000
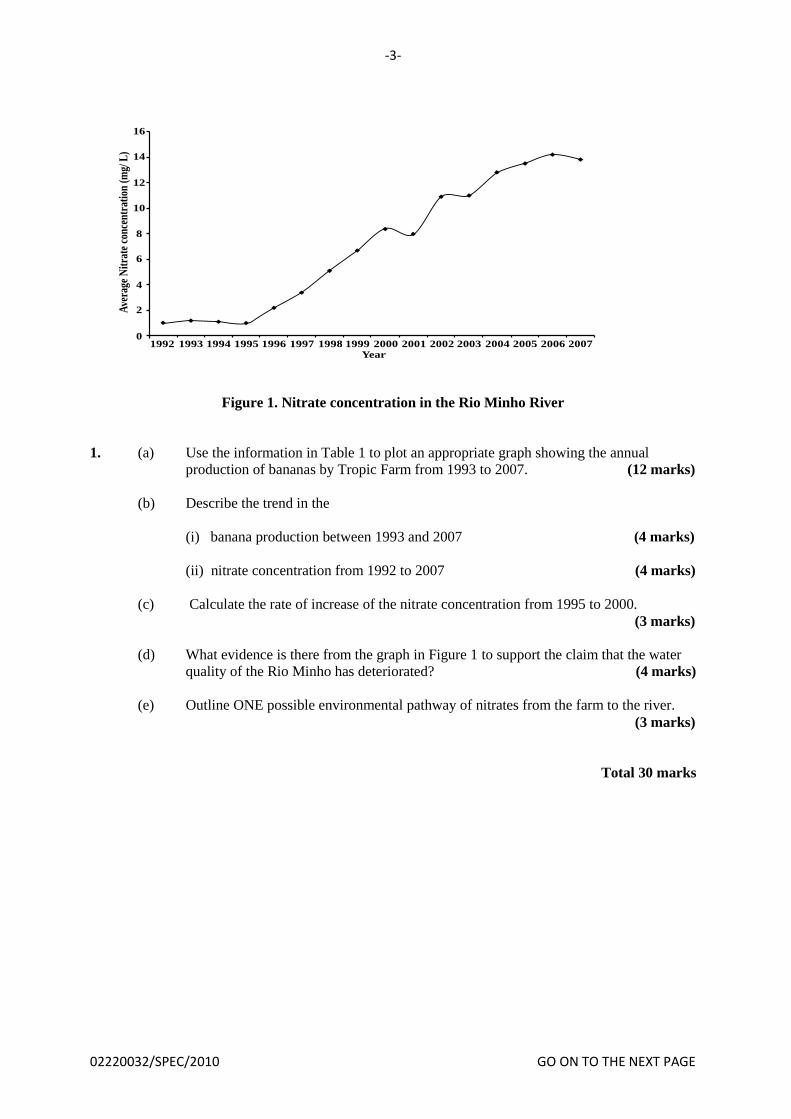
-3-
02220032/SPEC/2010 GO ON TO THE NEXT PAGE
Figure 1. Nitrate concentration in the Rio Minho River
1. (a) Use the information in Table 1 to plot an appropriate graph showing the annual
production of bananas by Tropic Farm from 1993 to 2007. (12 marks)
(b) Describe the trend in the
(i) banana production between 1993 and 2007 (4 marks)
(ii) nitrate concentration from 1992 to 2007 (4 marks)
(c) Calculate the rate of increase of the nitrate concentration from 1995 to 2000.
(3 marks)
(d) What evidence is there from the graph in Figure 1 to support the claim that the water
quality of the Rio Minho has deteriorated? (4 marks)
(e) Outline ONE possible environmental pathway of nitrates from the farm to the river.
(3 marks)
Total 30 marks
1992 1993 1994 1995 1996 1997 1998 1999 2000 2001 2002 2003 2004 2005 2006 2007Year
0
2
4
6
8
10
12
14
16A
vera
geN
itra
teco
nce
ntr
atio
n(m
g/L
)
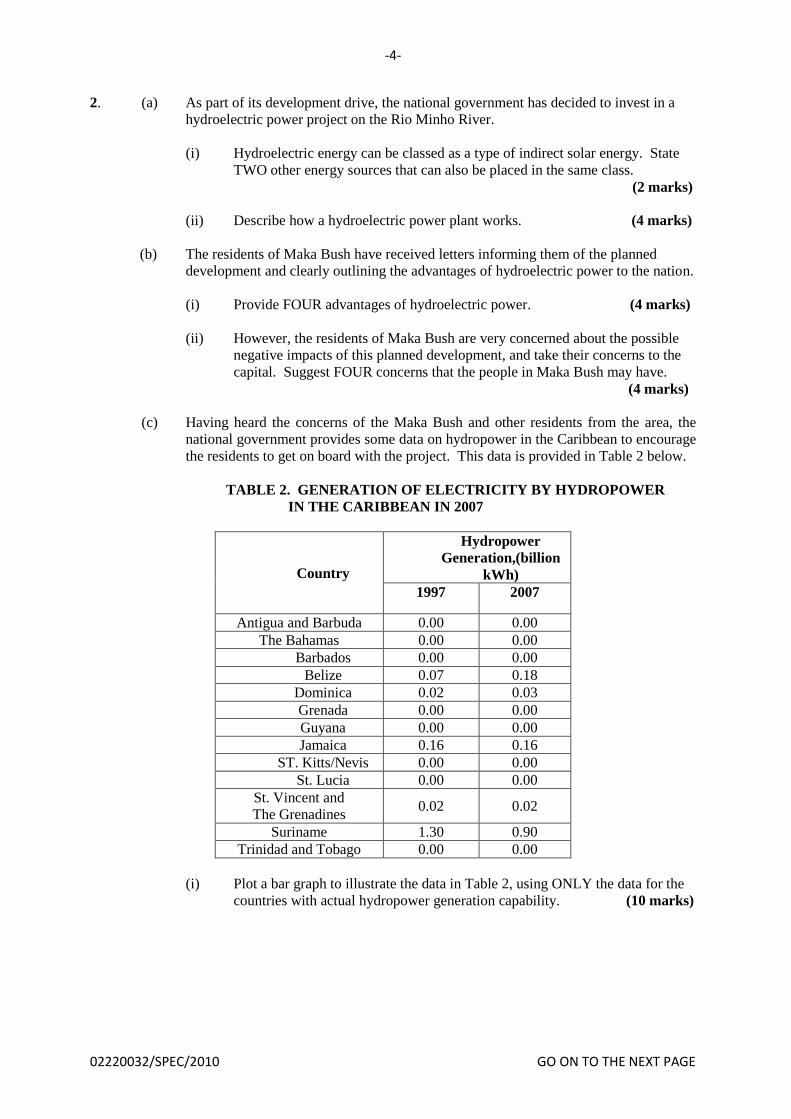
-4-
02220032/SPEC/2010 GO ON TO THE NEXT PAGE
2. (a) As part of its development drive, the national government has decided to invest in a
hydroelectric power project on the Rio Minho River.
(i) Hydroelectric energy can be classed as a type of indirect solar energy. State
TWO other energy sources that can also be placed in the same class.
(2 marks)
(ii) Describe how a hydroelectric power plant works. (4 marks)
(b) The residents of Maka Bush have received letters informing them of the planned
development and clearly outlining the advantages of hydroelectric power to the nation.
(i) Provide FOUR advantages of hydroelectric power. (4 marks)
(ii) However, the residents of Maka Bush are very concerned about the possible
negative impacts of this planned development, and take their concerns to the
capital. Suggest FOUR concerns that the people in Maka Bush may have.
(4 marks)
(c) Having heard the concerns of the Maka Bush and other residents from the area, the
national government provides some data on hydropower in the Caribbean to encourage
the residents to get on board with the project. This data is provided in Table 2 below.
TABLE 2. GENERATION OF ELECTRICITY BY HYDROPOWER
IN THE CARIBBEAN IN 2007
Country
Hydropower
Generation,(billion
kWh)
1997 2007
Antigua and Barbuda 0.00 0.00
The Bahamas 0.00 0.00
Barbados 0.00 0.00
Belize 0.07 0.18
Dominica 0.02 0.03
Grenada 0.00 0.00
Guyana 0.00 0.00
Jamaica 0.16 0.16
ST. Kitts/Nevis 0.00 0.00
St. Lucia 0.00 0.00
St. Vincent and
The Grenadines 0.02 0.02
Suriname 1.30 0.90
Trinidad and Tobago 0.00 0.00
(i) Plot a bar graph to illustrate the data in Table 2, using ONLY the data for the
countries with actual hydropower generation capability. (10 marks)
-5-
02220032/SPEC/2010 GO ON TO THE NEXT PAGE
(ii) Describe the trend in electricity generation by hydropower in the Caribbean.
(3 marks)
(iii) What percentage of the electricity generated by hydropower was produced by
Belize and St. Vincent and The Grenadines in 2007? (3 marks)
3. (a) Outline THREE reasons why it is necessary to monitor the water quality of water
bodies.
(3 marks)
(b) (i) Identify THREE parameters, excluding nitrates, that should be measured in a
programme to monitor the water quality of the Rio Minho River. (3 marks)
(ii) Justify your choice of parameters to be measured in 3 (b)(i) above.
(6 marks)
(c) Outline the procedure to test for THREE of these water quality parameters.
(12 marks)
(d) (i) State THREE changes which may occur in a river ecosystem that has a high
concentration of nitrates. (3 marks)
(ii) Give ONE reason for EACH change stated in (d)(i). (3 marks)
Total 30 marks
END OF TEST
-5-
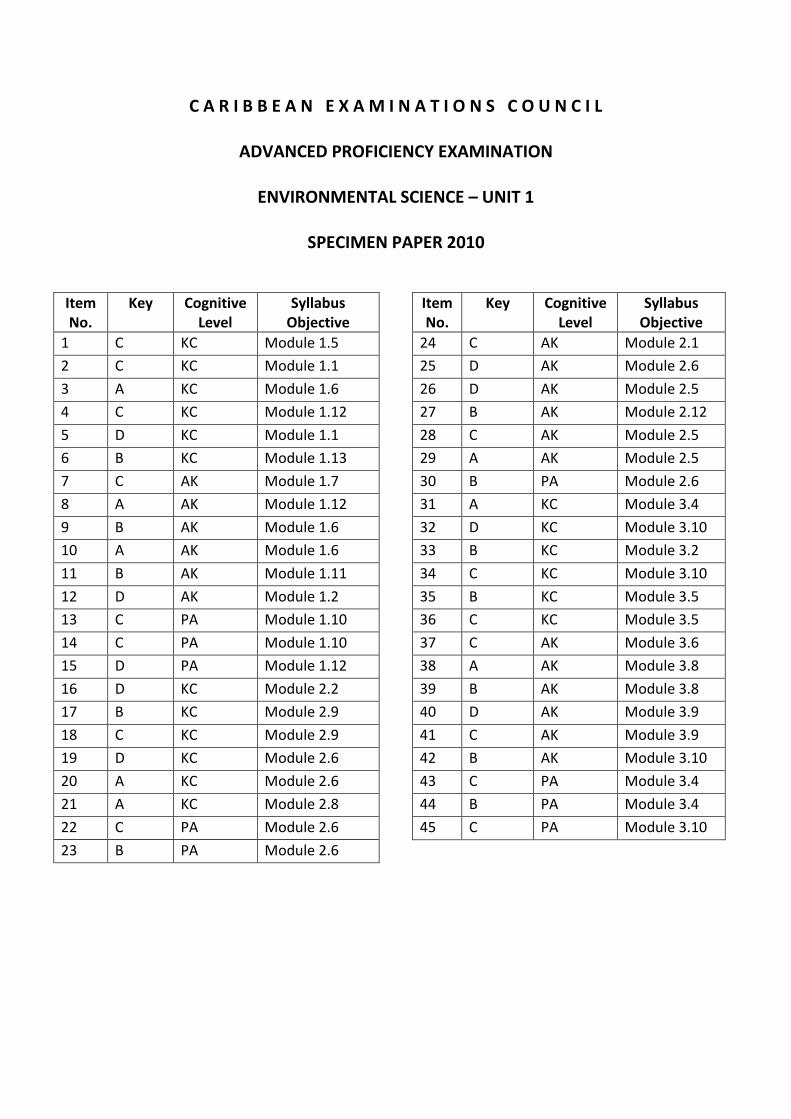
C A R I B B E A N E X A M I N A T I O N S C O U N C I L
ADVANCED PROFICIENCY EXAMINATION
ENVIRONMENTAL SCIENCE – UNIT 1
SPECIMEN PAPER 2010
Item No.
Key Cognitive Level
Syllabus Objective
1 C KC Module 1.5
2 C KC Module 1.1
3 A KC Module 1.6
4 C KC Module 1.12
5 D KC Module 1.1
6 B KC Module 1.13
7 C AK Module 1.7
8 A AK Module 1.12
9 B AK Module 1.6
10 A AK Module 1.6
11 B AK Module 1.11
12 D AK Module 1.2
13 C PA Module 1.10
14 C PA Module 1.10
15 D PA Module 1.12
16 D KC Module 2.2
17 B KC Module 2.9
18 C KC Module 2.9
19 D KC Module 2.6
20 A KC Module 2.6
21 A KC Module 2.8
22 C PA Module 2.6
23 B PA Module 2.6
Item No.
Key Cognitive Level
Syllabus Objective
24 C AK Module 2.1
25 D AK Module 2.6
26 D AK Module 2.5
27 B AK Module 2.12
28 C AK Module 2.5
29 A AK Module 2.5
30 B PA Module 2.6
31 A KC Module 3.4
32 D KC Module 3.10
33 B KC Module 3.2
34 C KC Module 3.10
35 B KC Module 3.5
36 C KC Module 3.5
37 C AK Module 3.6
38 A AK Module 3.8
39 B AK Module 3.8
40 D AK Module 3.9
41 C AK Module 3.9
42 B AK Module 3.10
43 C PA Module 3.4
44 B PA Module 3.4
45 C PA Module 3.10
02120020/CAPE/MS2010/SPEC
C A R I B B E A N E X A M I N A T I O N S C O U N C I L HEADQUARTERS
ADVANCED PROFICIENCY EXAMINATION
ENVIRONMENTAL SCIENCE
SPECIMEN PAPER
UNIT 1 – PAPER 02
MARK SCHEME
-2-
Environmental Science
Specimen Paper
Paper 02 - Mark Scheme
Question
Syllabus Objective
Suggested Response Instructions Marks
KC AK PS 1 (a) (i) 1(a) (ii) 1 (b) 1 (c)
1.1 1.11 1.10 1.10;1.11
All of the interacting organisms in an area together with the physical environment. The ability of biological communities to remain stable and constant over time. D= N(N-1) Σ n(n-1) Species diversity A = 2.4 Species diversity B = 3.09 Ecosystem stability is dependent on species diversity; ecosystem stability increase as species diversity increases. Ecosystems are interconnected by
feeding relationships, (1 mark) the higher the species diversity the more complex and interconnected the eco system (1mark)as a result it is more resistant to changes and can recover easily from disruptions (1 mark).
Sometimes diverse communities
contain keystone species, (1mark) and when these are removed associated species are also eliminated (1 mark) disrupting the ecosystem stability, in these cases species diversity makes the ecosystem less stable (1mark).
1 mark formula, 1 mark for calculation and 1 mark for answer 1 mark for each point
2
2
3
2
3
3
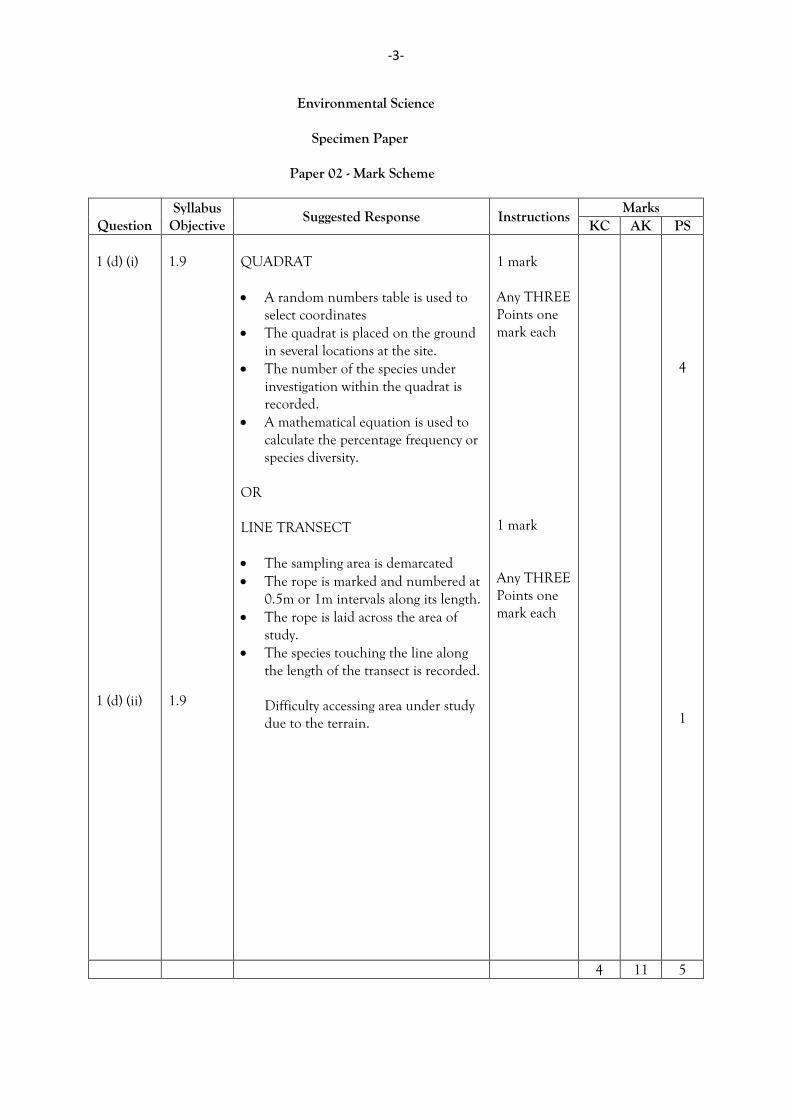
-3-
Environmental Science Specimen Paper Paper 02 - Mark Scheme
Question
Syllabus Objective
Suggested Response Instructions Marks
KC AK PS 1 (d) (i) 1 (d) (ii)
1.9 1.9
QUADRAT A random numbers table is used to
select coordinates The quadrat is placed on the ground
in several locations at the site. The number of the species under
investigation within the quadrat is recorded.
A mathematical equation is used to calculate the percentage frequency or species diversity.
OR LINE TRANSECT The sampling area is demarcated The rope is marked and numbered at
0.5m or 1m intervals along its length. The rope is laid across the area of
study. The species touching the line along
the length of the transect is recorded. Difficulty accessing area under study due to the terrain.
1 mark Any THREE Points one mark each 1 mark Any THREE Points one mark each
4 1
4 11 5
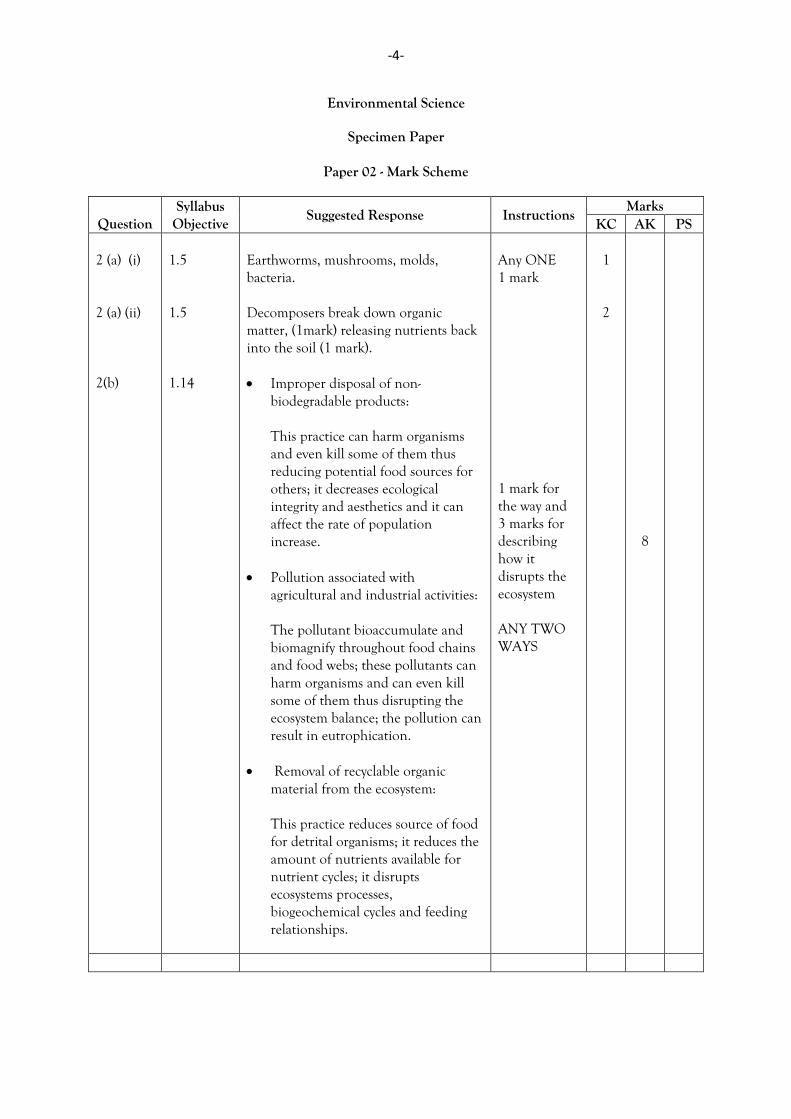
-4-
Environmental Science
Specimen Paper
Paper 02 - Mark Scheme
Question
Syllabus Objective
Suggested Response Instructions Marks
KC AK PS 2 (a) (i) 2 (a) (ii) 2(b)
1.5 1.5 1.14
Earthworms, mushrooms, molds, bacteria. Decomposers break down organic matter, (1mark) releasing nutrients back into the soil (1 mark). Improper disposal of non-
biodegradable products: This practice can harm organisms and even kill some of them thus reducing potential food sources for others; it decreases ecological integrity and aesthetics and it can affect the rate of population increase.
Pollution associated with agricultural and industrial activities: The pollutant bioaccumulate and biomagnify throughout food chains and food webs; these pollutants can harm organisms and can even kill some of them thus disrupting the ecosystem balance; the pollution can result in eutrophication.
Removal of recyclable organic
material from the ecosystem: This practice reduces source of food for detrital organisms; it reduces the amount of nutrients available for nutrient cycles; it disrupts ecosystems processes, biogeochemical cycles and feeding relationships.
Any ONE 1 mark 1 mark for the way and 3 marks for describing how it disrupts the ecosystem ANY TWO WAYS
1 2
8
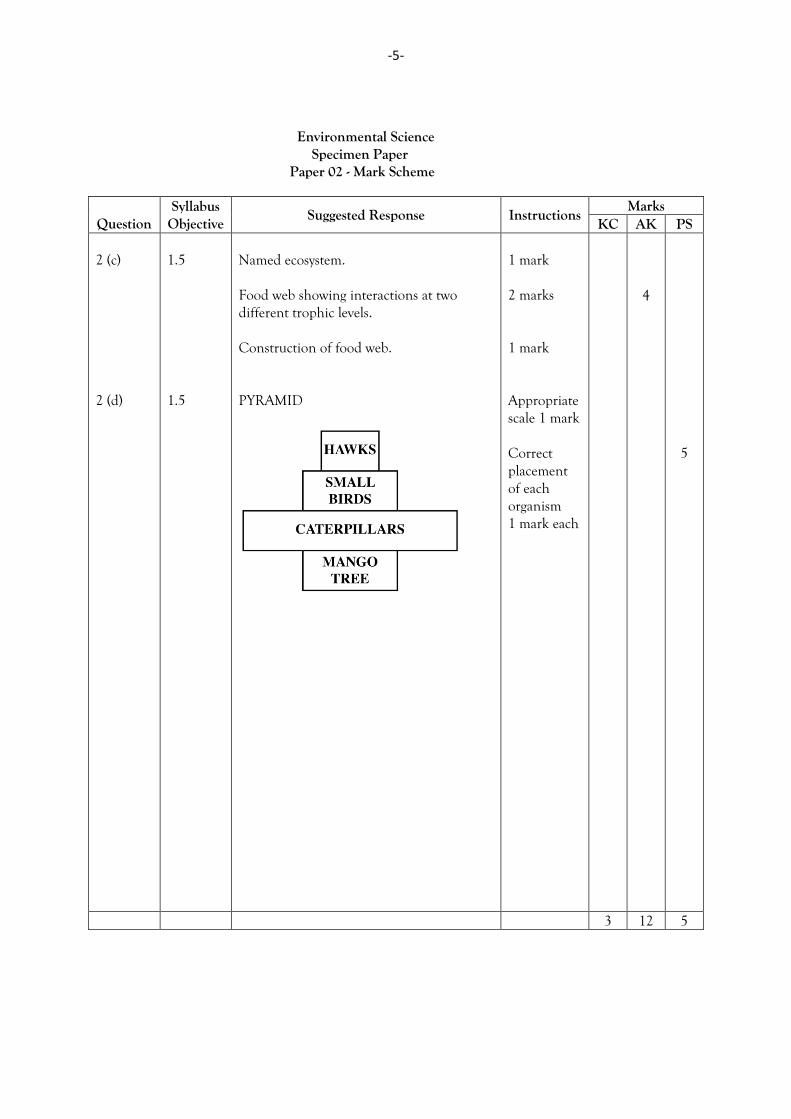
-5-
Environmental Science Specimen Paper Paper 02 - Mark Scheme
Question
Syllabus Objective
Suggested Response Instructions Marks
KC AK PS 2 (c) 2 (d)
1.5 1.5
Named ecosystem. Food web showing interactions at two different trophic levels. Construction of food web. PYRAMID
1 mark 2 marks 1 mark Appropriate scale 1 mark Correct placement of each organism 1 mark each
4
5
3 12 5
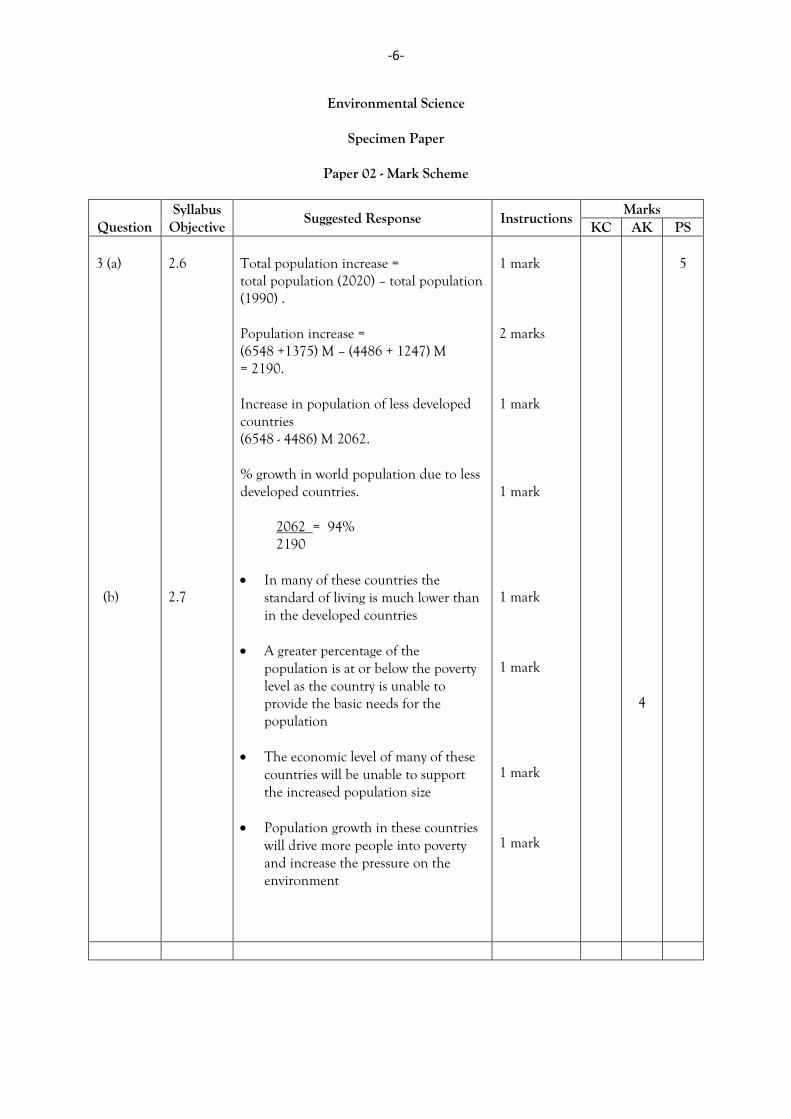
-6-
Environmental Science
Specimen Paper
Paper 02 - Mark Scheme
Question
Syllabus Objective
Suggested Response Instructions Marks
KC AK PS 3 (a) (b)
2.6 2.7
Total population increase = total population (2020) – total population (1990) .
Population increase = (6548 +1375) M – (4486 + 1247) M = 2190.
Increase in population of less developed countries (6548 - 4486) M 2062.
% growth in world population due to less developed countries.
2062 = 94% 2190
In many of these countries the standard of living is much lower than in the developed countries
A greater percentage of the
population is at or below the poverty level as the country is unable to provide the basic needs for the population
The economic level of many of these
countries will be unable to support the increased population size
Population growth in these countries
will drive more people into poverty and increase the pressure on the environment
1 mark 2 marks 1 mark 1 mark 1 mark 1 mark 1 mark 1 mark
4
5
-7-
Environmental Science Specimen Paper Paper 02 - Mark Scheme
Question
Syllabus Objective
Suggested Response Instructions Marks
KC AK PS 3 (c) 3 (d)
2.17 2.12
Increased pollution Premature depletion of resources More land use Increase production of food to keep
pace with population growth The use of technology to produce
more food Introduction of government policies
to support family planning.
Government incentives for pollution reduction
Lifestyle changes The use of substitutes
1 mark each Any FOUR points 2 marks each
3
8
3 12 5
-8-
Environmental Science Specimen Paper Paper 02 - Mark Scheme
Question
Syllabus Objective
Suggested Response Instructions Marks
KC AK PS 4 (a) 4 (b) 4 (c) (i)
2.7 2.9 2.5
The number of children a couple is expected to have may be determined by the culture of the society because some cultures promote high fertility rates and this in turn leads to high population growth rates. In these societies child labour contributes to the family’s income.
The life expectancy of an infant born
in country A is higher than that of an infant born in Country B
The population of Country A is more educated than the population of Country B
The GDP per capita in Country A is
higher than in Country B
There is a higher standard of living in Country A than in Country B
The average number of children born to each woman during her reproductive years.
Full explanation 2 marks; partial explanation 1 mark 2 marks for each deduction which shows comparison 1 mark if comparison is not indicated
2
1
6
-9-
Environmental Science
Specimen Paper
Paper 02 - Mark Scheme
Question
Syllabus Objective
Suggested Response Instructions Marks
KC AK PS 4 (c) (ii) 4 (c) (iii)
2.5
Graph: Axis - 1 mark Plotting of points - 2 marks Title - 1 mark The fertility rates for both low and
high income level countries decreased during the period 1965 - 1990.
The fertility rates for both low and high income level countries decreased during the period 1990 - 2000.
The fertility rates for both low and
high income level countries decreased during the period 1965 - 2000.
The fertility rates for low income
countries decreased less than that for high income countries over the period 1965 - 2000.
2 marks for each conclusion
6
5
3 12 5
-10-
Environmental Science Specimen Paper Paper 02 - Mark Scheme
Question
Syllabus Objective
Suggested Response Instructions Marks
KC AK PS 5 (a) 5 (b) (i) (ii) (iii)
3.3 3.2 3.2 3.2
Consumptive use of natural resources refers to use of natural resources in which these resources are utilized and removed from other natural environments (e.g. catching fish for food). Non-consumptive use of natural resources does not require that the resources be removed from their natural habitat (e.g. use of forest resources for ecotourism). The quantity of resource B declined from a start of 18 x 103 – kg up to Year 6 when the amount was 7 x 10³ – kg, this was followed by an increase from Year 7 to Year 10 when the amount was 13 x 103 – kg. A is non-renewable B is renewable Justification - Non-renewable resources which exist in fixed quantities and once used cannot be replaced. The quantity of resource A decreased during exploitation but after exploitation ceased the quantity of the resource remained the same after the eighth year. Renewable resources are those that can be replaced or replenished through natural processes. Resource B replenished itself after exploitation.
(1 mark) for consumptive use; (1 mark) for non-consumptive use and (1 mark) for any correct example.
1 mark each
2 marks
2 marks
2 marks 1 mark
3
2 7
5
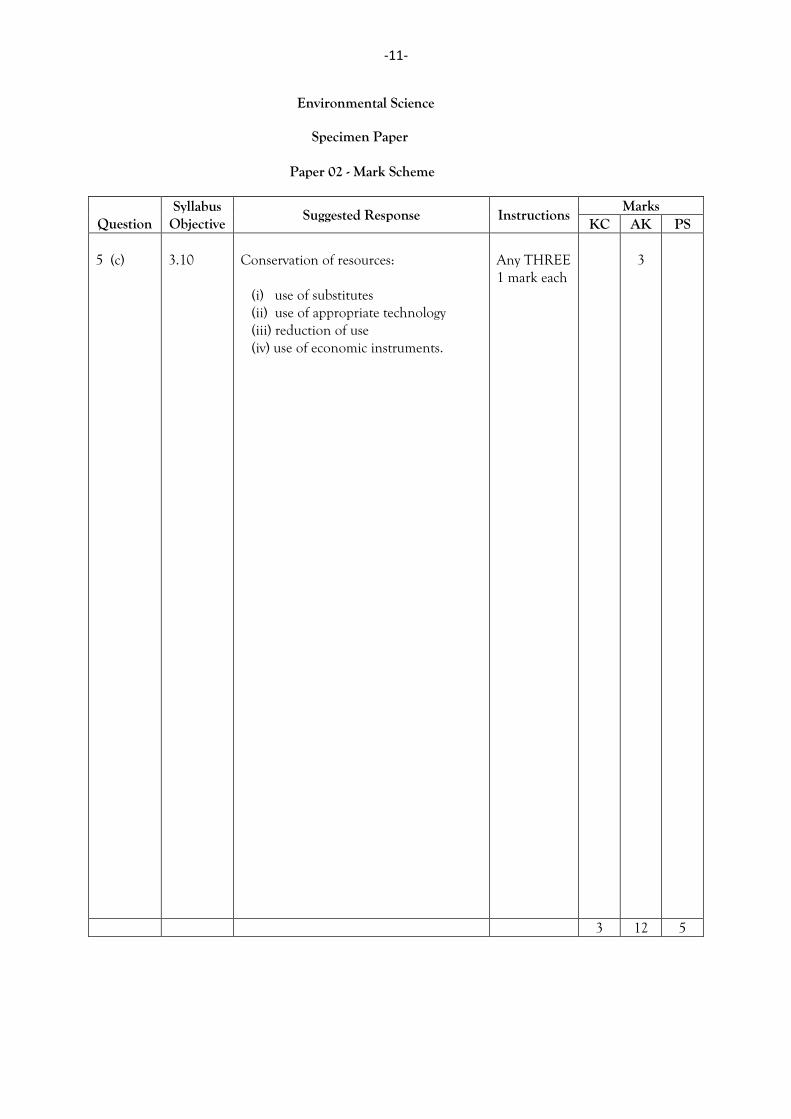
-11-
Environmental Science
Specimen Paper Paper 02 - Mark Scheme
Question
Syllabus Objective
Suggested Response Instructions Marks
KC AK PS 5 (c)
3.10
Conservation of resources: (i) use of substitutes (ii) use of appropriate technology (iii) reduction of use (iv) use of economic instruments.
Any THREE 1 mark each
3
3 12 5
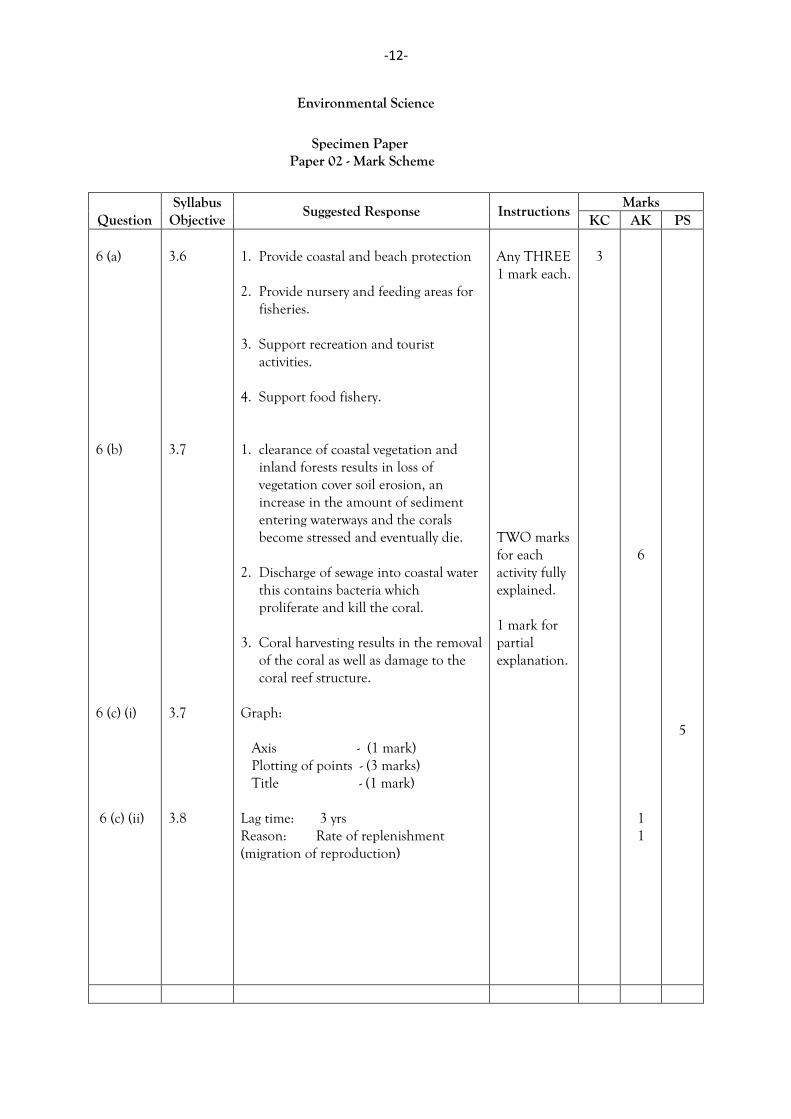
-12-
Environmental Science Specimen Paper Paper 02 - Mark Scheme
Question
Syllabus Objective
Suggested Response Instructions Marks
KC AK PS 6 (a) 6 (b) 6 (c) (i) 6 (c) (ii)
3.6 3.7 3.7 3.8
1. Provide coastal and beach protection 2. Provide nursery and feeding areas for fisheries. 3. Support recreation and tourist activities. 4. Support food fishery. 1. clearance of coastal vegetation and inland forests results in loss of vegetation cover soil erosion, an increase in the amount of sediment entering waterways and the corals become stressed and eventually die. 2. Discharge of sewage into coastal water this contains bacteria which proliferate and kill the coral. 3. Coral harvesting results in the removal of the coral as well as damage to the coral reef structure. Graph: Axis - (1 mark) Plotting of points - (3 marks) Title - (1 mark)
Lag time: 3 yrs Reason: Rate of replenishment (migration of reproduction)
Any THREE 1 mark each.
TWO marks for each activity fully explained. 1 mark for partial explanation.
3
6 1 1
5
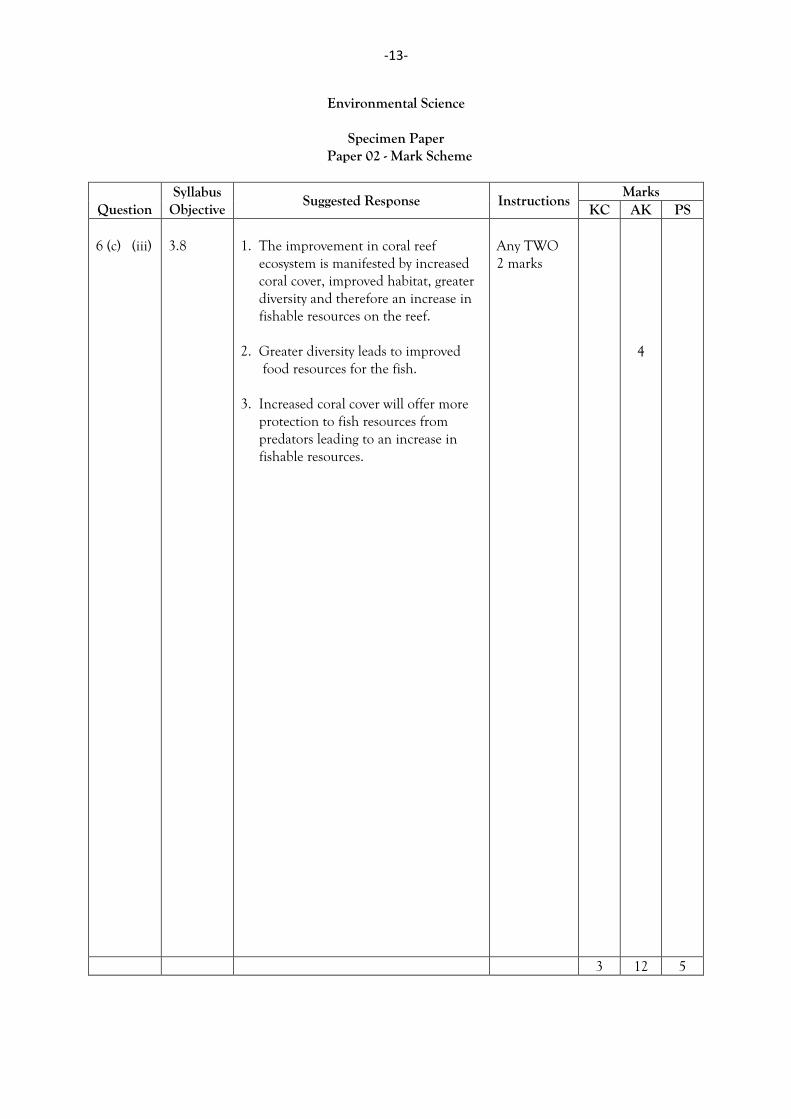
-13-
Environmental Science
Specimen Paper Paper 02 - Mark Scheme
Question Syllabus
Objective Suggested Response Instructions
Marks KC AK PS
6 (c) (iii)
3.8
1. The improvement in coral reef ecosystem is manifested by increased coral cover, improved habitat, greater diversity and therefore an increase in fishable resources on the reef. 2. Greater diversity leads to improved food resources for the fish. 3. Increased coral cover will offer more protection to fish resources from predators leading to an increase in fishable resources.
Any TWO 2 marks
4
3 12 5
02120032/CAPE/MS2010/SPEC
C A R I B B E A N E X A M I N A T I O N S C O U N C I L HEADQUARTERS
ADVANCED PROFICIENCY EXAMINATION
ENVIRONMENTAL SCIENCE
SPECIMEN PAPER
Unit 1 – Paper 03/2
MARK SCHEME
-2-
Environmental Science
Specimen Paper Unit 1 Paper 03/2
Mark Scheme
Question
Syllabus Objective
Suggested Response Instructions Marks
KC AK PS 1 (a) 1 (b)
1.10 1.10
Lizards are moving organisms (1) and it is difficult to count directly the number of organisms within a given area (1); they may not all be visible (1)
Outline of the mark-release-recapture method: - A sample of the population is
captured. (1)
- Each individual in the sample is marked in a non-harmful way (1) and then released back into the general population (1)
- after an appropriate length of time
organisms are recaptured and (1)
- the number of marked organisms recaptured is noted (1)
- An estimate of the population is
obtained by calculation using the following equation. (1)
no. of population = no. in recaptured sample ------------------------------------- --------------------------------------------------- no. in first sample no. already mixed in recaptured sample (1)
3
7
-3-
Environmental Science
Specimen Paper Unit 1 Paper 03/2
Mark Scheme
Question
Syllabus Objective
Suggested Response Instructions Marks
KC AK PS 1 (c) 1 (d)
1.10 1.19
Two assumptions that must be made when using the mark-release-recapture method to estimate population size: An appropriate time-scale for the
population of marked and unmarked lizards to mingle.
Marking does not affect or harm the species’ chance of survival and reproduction.
Each individual in the population
has an equal chance or probability of being caught.
Monitoring plan to keep track of the population Plan a visit to the site - to observe the situation
- to evaluate and determine the next
steps
- to have discussion with the workers, managers and concession holder.
- To choose sampling sites and
determine requirements for sampling and monitoring.
Any two assumptions 2 marks each Any four steps 1 mark each One objective per step 1 mark each
4
8
-4-
Environmental Science
Specimen Paper Unit 1 Paper 03/2
Mark Scheme
Question
Syllabus Objective
Suggested Response Instructions Marks
KC AK PS 1 (d) Cont’d
Review previous data collected - to get information on specific site
peculiarities - to familiarize oneself with previous
limitations
Plan number and time of visits - to undertake sampling - to trap, mark and release animals - to recapture and check numbers of
lizards - to observe if there are any new
threats to the population and to make recommendations for dealing with these threats
Analyze population data - to calculate estimates of lizard
population at each sampling time - to establish database so that
information can be added to it and regular updates of the data to be made
Disseminate information - on status of monitoring and
population data and other species information to assist others to be informed and participate in conservation efforts.
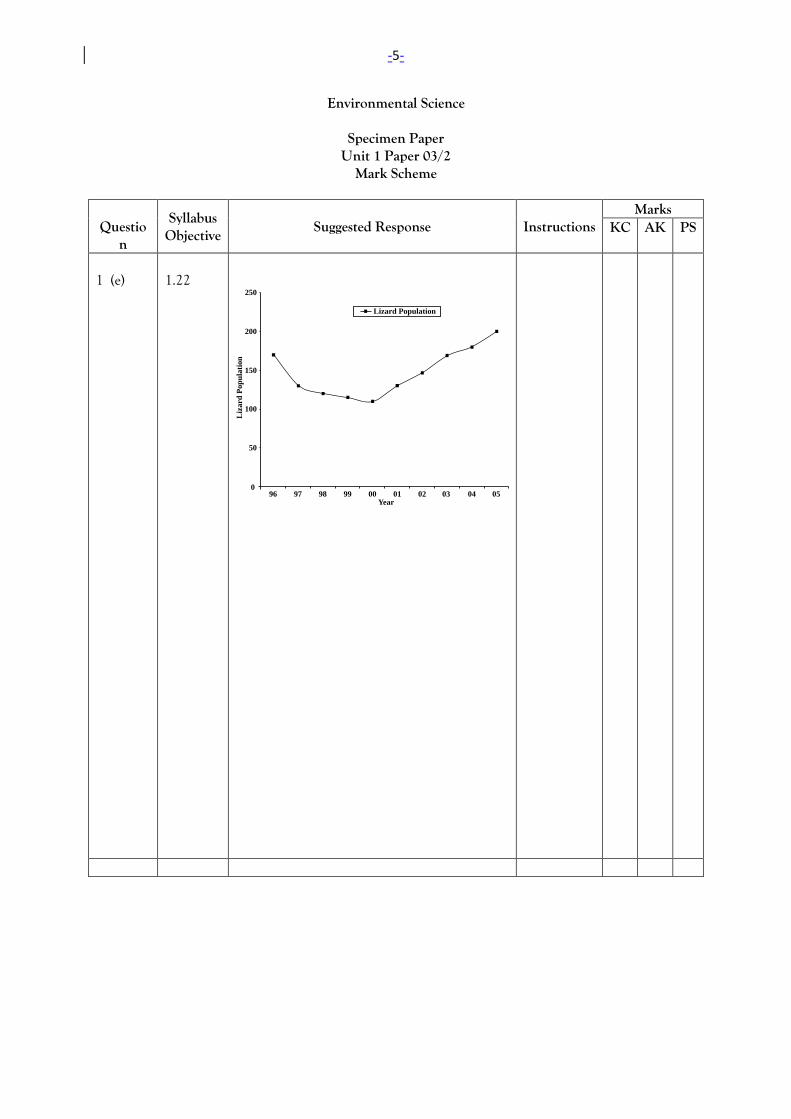
-5-
Environmental Science
Specimen Paper Unit 1 Paper 03/2
Mark Scheme
Questio
n
Syllabus Objective
Suggested Response Instructions Marks
KC AK PS
1 (e)
1.22
96 97 98 99 00 01 02 03 04 05Year
0
50
100
150
200
250
Liz
ard
Popu
lati
on
Lizard Population
-6-
Environmental Science
Specimen Paper Unit 1 Paper 03/2
Mark Scheme
Question
Syllabus Objective
Suggested Response Instructions Marks
KC AK PS
Title of Graph – 1 mark Labelling of axes – 2 marks Appropriate scales – 2 marks Plotting of points correctly – 5 marks Smooth curve – 2 marks Plotting of graphs 9 or more accurate points – 5 marks 7 - 8 “ “ – 4 “ 5 - 6 “ “ – 3 “ 3 - 4 “ “ – 2 “ 1 - 2 “ “ – 1 “ 0 “ “ – 0 “
8
3 4 23
-7-
Environmental Science
Specimen Paper Unit 1 Paper 03/2
Mark Scheme
Question Syllabus
Objective Suggested Response Instructions
Marks KC AK
2 (a) (i)
(ii)
(b) (i)
(b) (ii)
(c) (i)
2.2
2.2
2.5
2.5
2.5
The number of children a couple must have to replace themselves.
The average number of children born to each woman during her reproductive lifetime.
28+18+14+19=79
Pre-reproductive years 0 – 14
8+7+6+6=27
Percentage = 27\56.6=47.7
The population is expected to increase over the next ten years.
Incomplete definition 1 mark only
1 mark for answer and 4 marks for extracting information from chart
1 mark
4 marks for extracting date; 1 mark for answer
1 mark
2
2
5
7
1
-8-
Environmental Science
Specimen Paper Unit 1 Paper 03/2
Mark Scheme
Question Syllabus
Objective Suggested Response Instructions
Marks KC AK PS
(c) (ii)
(d) (i)
2.5
2.7;2.8
The largest percentage of thepopulation is in the pre-reproductiveage group.
When these children mature theywill become the parents of the nextgeneration.
This group of parents will be largerthan the previous group.
Even if the fertility rate remains atreplacement level the population willstill continue to grow.
Educational opportunities
Women with higher educationalbackgrounds marry later (1), delayingthe birth of their first child reducingtheir childbearing years (1).
Educated women control theirfertility by using contraceptives (1).
Social and economic status
In some societies women are notexposed to education (1) and otherways of uplifting their social status,evidence shows that this lack of socialstatus (1) results in high fertility rates.
In contrast women with social statushave the education and means tocontrol their fertility rates (1).
Family Planning Services Provides information on
reproductive physiology (1) and contraceptives (1)
This information allows women tocontrol fertility rate (1) by the use of fertility pills.
1mark for each justification
(3 marks)
1 mark for each underlined point
(3 marks)
1 mark for each underlined point
(3 marks)
1 mark for each underlined point
9
4
4 9 17
-9-
Environmental Science
Specimen Paper Unit 1 Paper 03/2
Mark Scheme
Question Syllabus
Objective Suggested Response Instructions
Marks KC AK PS
3 (a) (i)
3 (a) (ii)
(b) (i)
(b) (ii)
(b) (iii)
3.4
3.4
3.10
3.10
3.10
As the fishing effort increases thedaily fish catch increases.
The increasing trend continues up toa fishing effort of 35 boats afterwhich as fishing effort increases dailycatch decreases.
The decreasing trend continues andreaches 0 when fishing effort is equalto 70 boats.
The maximum daily catch is 4500 kgof fish with 35 boats operating.
Fishing effort-25 boats.
MSY- The largest amount of a resource that can be harvested without causing a decline in the stock of the natural resource.
Point B
Harvesting at B will allow the stockto be sustained since it will be easyfor it to recover.
The minimum viable threshold willnot be exceeded and the populationwill sustain its biomass.
There will be enough members left toreproduce, replenish and sustain thepopulation.
2 marks for each point fully described.
Partial description 1 mark.
2 marks for each reason fully explained.
1 mark for partial explanation.
2
6
8
2
1
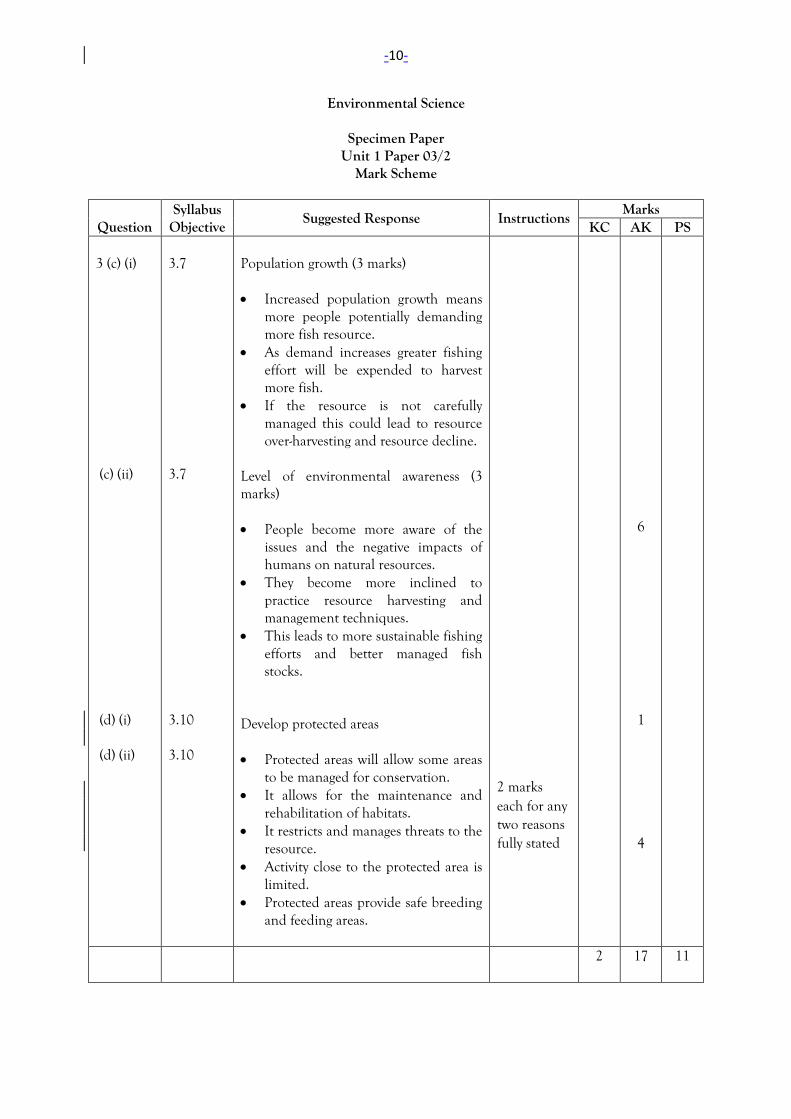
-10-
Environmental Science
Specimen Paper Unit 1 Paper 03/2
Mark Scheme
Question Syllabus
Objective Suggested Response Instructions
Marks KC AK PS
3 (c) (i)
(c) (ii)
(d) (i)
(d) (ii)
3.7
3.7
3.10
3.10
Population growth (3 marks)
Increased population growth meansmore people potentially demandingmore fish resource.
As demand increases greater fishingeffort will be expended to harvestmore fish.
If the resource is not carefullymanaged this could lead to resourceover-harvesting and resource decline.
Level of environmental awareness (3 marks)
People become more aware of theissues and the negative impacts ofhumans on natural resources.
They become more inclined topractice resource harvesting andmanagement techniques.
This leads to more sustainable fishingefforts and better managed fishstocks.
Develop protected areas
Protected areas will allow some areasto be managed for conservation.
It allows for the maintenance andrehabilitation of habitats.
It restricts and manages threats to theresource.
Activity close to the protected area islimited.
Protected areas provide safe breedingand feeding areas.
2 marks each for any two reasons fully stated
6
1
4
2 17 11

C A R I B B E A N E X A M I N A T I O N S C O U N C I L
ADVANCED PROFICIENCY EXAMINATION
ENVIRONMENTAL SCIENCE – UNIT 2
SPECIMEN PAPER 2010
Item No.
Key Cognitive Level
Syllabus Objective
1 C KC Module 1.3
2 B KC Module 1.1
3 C KC Module 1.3
4 D AK Module 1.3
5 C AK Module 1.1
6 B KC Module 1.3
7 B AK Module 1.2
8 C KC Module 1.1
9 A AK Module 1.6
10 B PA Module 1.3
11 A PA Module 1.3
12 A AK Module 1.3
13 B PA Module 1.3
14 B AK Module 1.3
15 C AK Module 1.6
16 D KC Module 2.3
17 A KC Module 2.1
18 C KC Module 2.3
19 C KC Module 2.8
20 B KC Module 2.9
21 D KC Module 2.10
22 B AK Module 2.1
23 A AK Module 2.8
Item No.
Key Cognitive Level
Syllabus Objective
24 D AK Module 2.8
25 A PA Module 2.5
26 B AK Module 2.1
27 D AK Module 2.1
28 D PA Module 2.3
29 D PA Module 2.7
30 A AK Module 2.3
31 B KC Module 3.5
32 B KC Module 3.5
33 B KC Module 3.8
34 D KC Module 3.5
35 B KC Module 3.1
36 D KC Module 3.1
37 D AK Module 3.4
38 B AK Module 3.5
39 A AK Module 3.5
40 C AK Module 3.5
41 C PA Module 3.5
42 D PA Module 3.5
43 A PA Module 3.5
44 B AK Module 3.3
45 C AK Module 3.3
02220020/CAPE/MS/2010
C A R I B B E A N E X A M I N A T I O N S C O U N C I L HEADQUARTERS
ADVANCED PROFICIENCY EXAMINATION
ENVIRONMENTAL SCIENCE
SPECIMEN PAPER
Unit 2 – Paper 02
MARK SCHEME
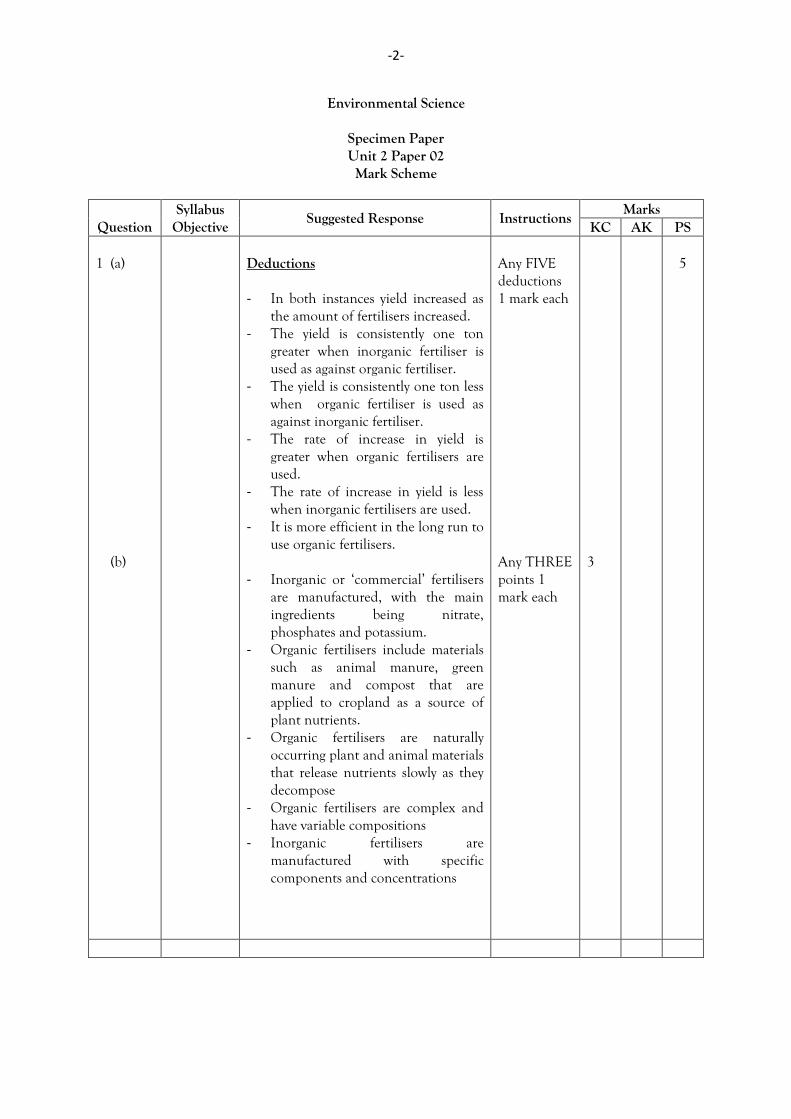
-2-
Environmental Science
Specimen Paper Unit 2 Paper 02 Mark Scheme
Question Syllabus
Objective Suggested Response Instructions
Marks KC AK PS
1 (a)
(b)
Deductions
- In both instances yield increased as the amount of fertilisers increased.
- The yield is consistently one ton greater when inorganic fertiliser is used as against organic fertiliser.
- The yield is consistently one ton less when organic fertiliser is used as against inorganic fertiliser.
- The rate of increase in yield is greater when organic fertilisers are used.
- The rate of increase in yield is less when inorganic fertilisers are used.
- It is more efficient in the long run to use organic fertilisers.
- Inorganic or ‘commercial’ fertilisers are manufactured, with the main ingredients being nitrate, phosphates and potassium.
- Organic fertilisers include materials such as animal manure, green manure and compost that are applied to cropland as a source of plant nutrients.
- Organic fertilisers are naturally occurring plant and animal materials that release nutrients slowly as they decompose
- Organic fertilisers are complex and have variable compositions
- Inorganic fertilisers are manufactured with specific components and concentrations
Any FIVE deductions 1 mark each
Any THREE points 1 mark each
3
5
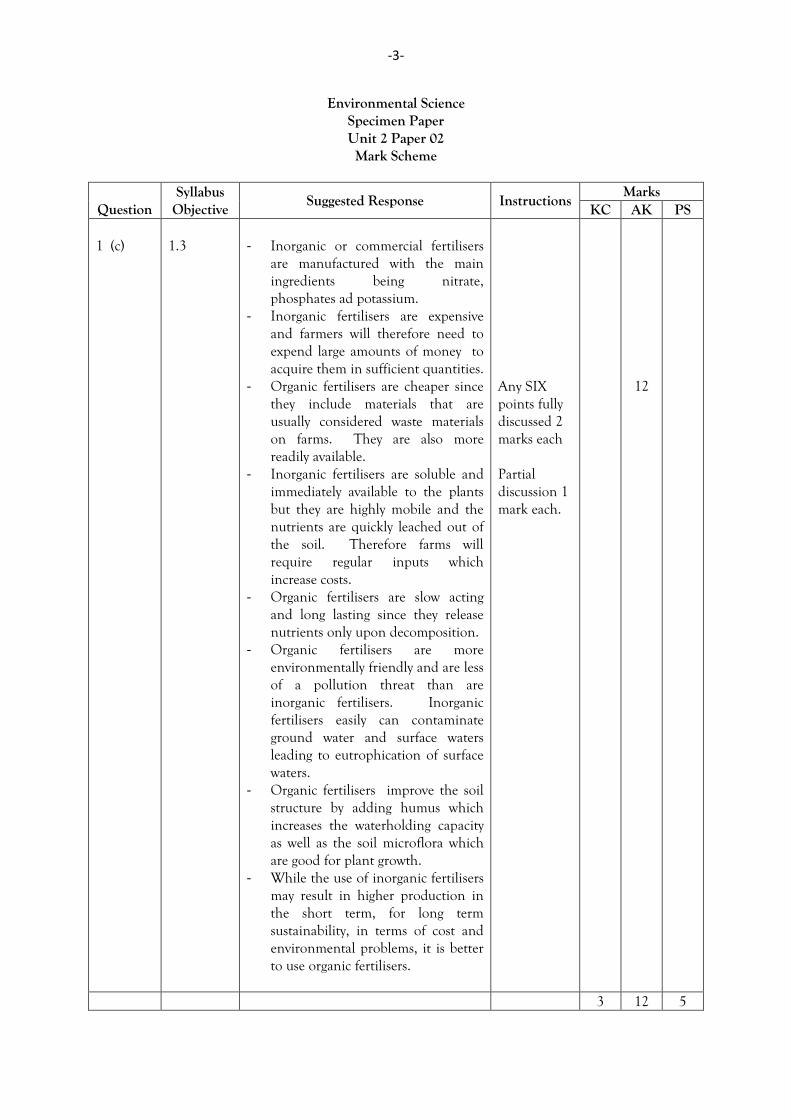
-3-
Environmental Science Specimen Paper Unit 2 Paper 02 Mark Scheme
Question Syllabus
Objective Suggested Response Instructions
Marks KC AK PS
1 (c)
1.3
- Inorganic or commercial fertilisers
are manufactured with the main ingredients being nitrate, phosphates ad potassium.
- Inorganic fertilisers are expensive and farmers will therefore need to expend large amounts of money to acquire them in sufficient quantities.
- Organic fertilisers are cheaper since they include materials that are usually considered waste materials on farms. They are also more readily available.
- Inorganic fertilisers are soluble and immediately available to the plants but they are highly mobile and the nutrients are quickly leached out of the soil. Therefore farms will require regular inputs which increase costs.
- Organic fertilisers are slow acting and long lasting since they release nutrients only upon decomposition.
- Organic fertilisers are more environmentally friendly and are less of a pollution threat than are inorganic fertilisers. Inorganic fertilisers easily can contaminate ground water and surface waters leading to eutrophication of surface waters.
- Organic fertilisers improve the soil structure by adding humus which increases the waterholding capacity as well as the soil microflora which are good for plant growth.
- While the use of inorganic fertilisers may result in higher production in the short term, for long term sustainability, in terms of cost and environmental problems, it is better to use organic fertilisers.
Any SIX points fully discussed 2 marks each Partial discussion 1 mark each.
12
3 12 5
-4-
Environmental Science
Specimen Paper Unit 2 Paper 02 Mark Scheme
Question Syllabus
Objective Suggested Response Instructions
Marks KC AK PS
2 (a) (b)
- Farmers often clear the vegetation
from hillsides before farming. - This exposes the soil to erosion since
the vegetation cover is removed and the roots are no longer in place to hold the soil particles together.
- Water runs downhill, and the faster it runs the greater is the loss of soil.
- As water runoff increases downhill, more soil will be washed downhill.
- This soil gets into the river and other water systems.
- Sedimentation levels increase erosion.
- When agrochemicals are used by farmers, these are easily leached into the waterways.
- When the same crop is grown
continuously, pests for that crop tend to accumulate to destructive levels because they have an abundance of food source and favorable conditions.
- Rotating the crops will prevent an accumulation of pests for any one specific crop, thereby reducing the likelihood of pest infestation and pest damage.
- Different crops have different and specific nutrient requirements. Growing one crop continuously can deplete the soil of nutrients that are specifically required by that crop.
- The depletion of nutrients can result in decreased yields since over time, limited amounts of these nutrients would be available. However, when practised, it keeps the soil covered with vegetation.
Any SIX points 1 mark each. Any THREE points fully discussed 2 marks each Partial discussion 1 mark each.
6
6
-5-
Environmental Science
Specimen Paper Unit 2 Paper 02 Mark Scheme
Question Syllabus
Objective Suggested Response Instructions
Marks KC AK PS
2 (c) (i) (ii)
Contour ploughing, terracing, strip farming Contour ploughing Ploughing and planting is done in rows across rather than up and down the sloped contour of the land. Each row planted along the contour of the land acts as a small dam to help hold soil and slow the runoff of the water. Terracing Each slope is converted into a series of broad, nearly level terraces that run across the contour of the land. Strip farming This is the planting of different kinds of crops in alternating strips along the contours of the land.
Any ONE 1 mark Complete description 2 marks Partial description 1 mark.
1
2
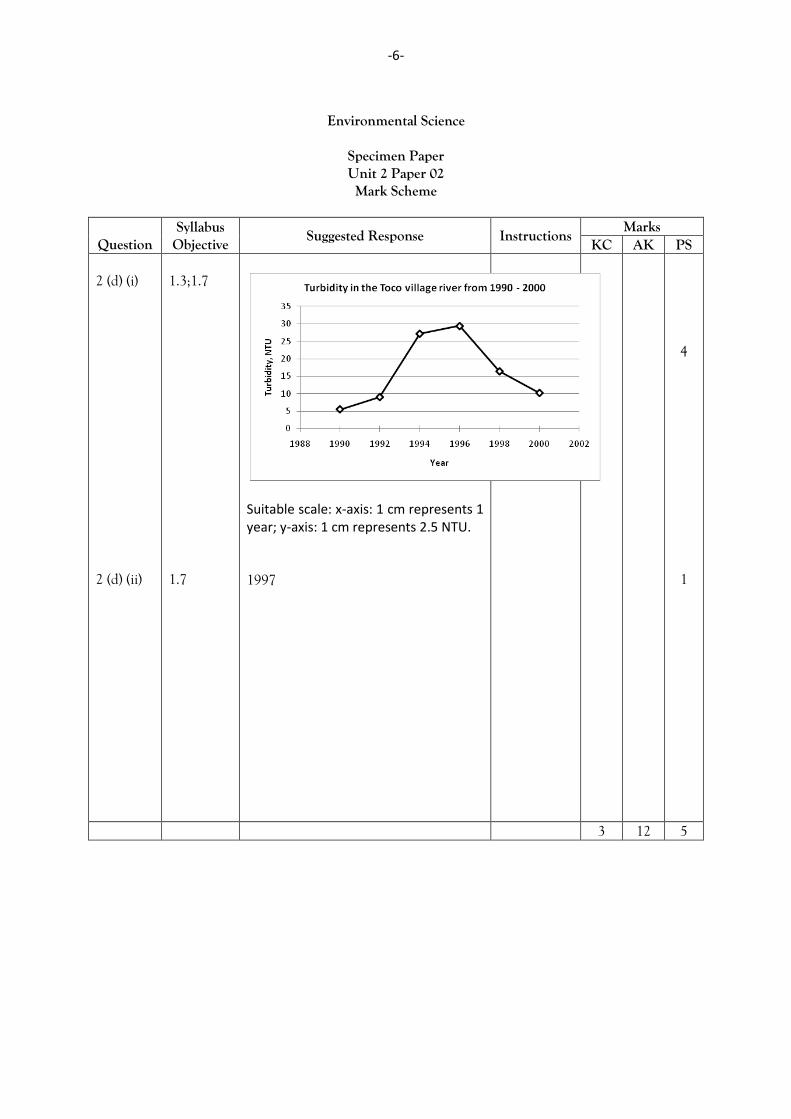
-6-
Environmental Science
Specimen Paper Unit 2 Paper 02 Mark Scheme
Question Syllabus
Objective Suggested Response Instructions
Marks KC AK PS
2 (d) (i)
2 (d) (ii)
1.3;1.7
1.7
Suitable scale: x-axis: 1 cm represents 1 year; y-axis: 1 cm represents 2.5 NTU.
1997
4
1
3 12 5
-7-
Environmental Science
Specimen Paper Unit 2 Paper 02 Mark Scheme
Question Syllabus
Objective Suggested Response Instructions
Marks KC AK PS
3 (a) (b) (i)
2.3 2.11
- Fossils fuels are formed from
decayed plants and animals that have been converted to crude oil, coal, natural gas, or heavy oils by exposure to heat and pressure in the earth’s crust over hundred of millions of years.
- For the years 1990 and 2000, annual
fossil fuel consumption increased by 0.9 x 10⁹ tons of oil equivalent from 1.9 x 10⁹ tons of oil equivalent to 2.8 x 10⁹ tons of oil equivalent. (1 mark)
- This represents an average annual
increase of 0.98 for the period 1990 to 2000. (1 mark)
- For the years 2000 and 2003 the
total increase was 0.4 x 10⁹ tons of oil equivalent representing an average increase of 0.1 x 10⁹ tons of oil equivalent. (1 mark)
- The average annual fossil fuel
consumption for the period 2000 to 2003 is 25% greater than that for 1900 to 2000). (1 mark)
- For the years 1990 to 2003 the total
increase was 1.3 x 10⁹ tons of oil equivalent. (1 mark)
EACH point 1 mark
2
5
Environmental Science
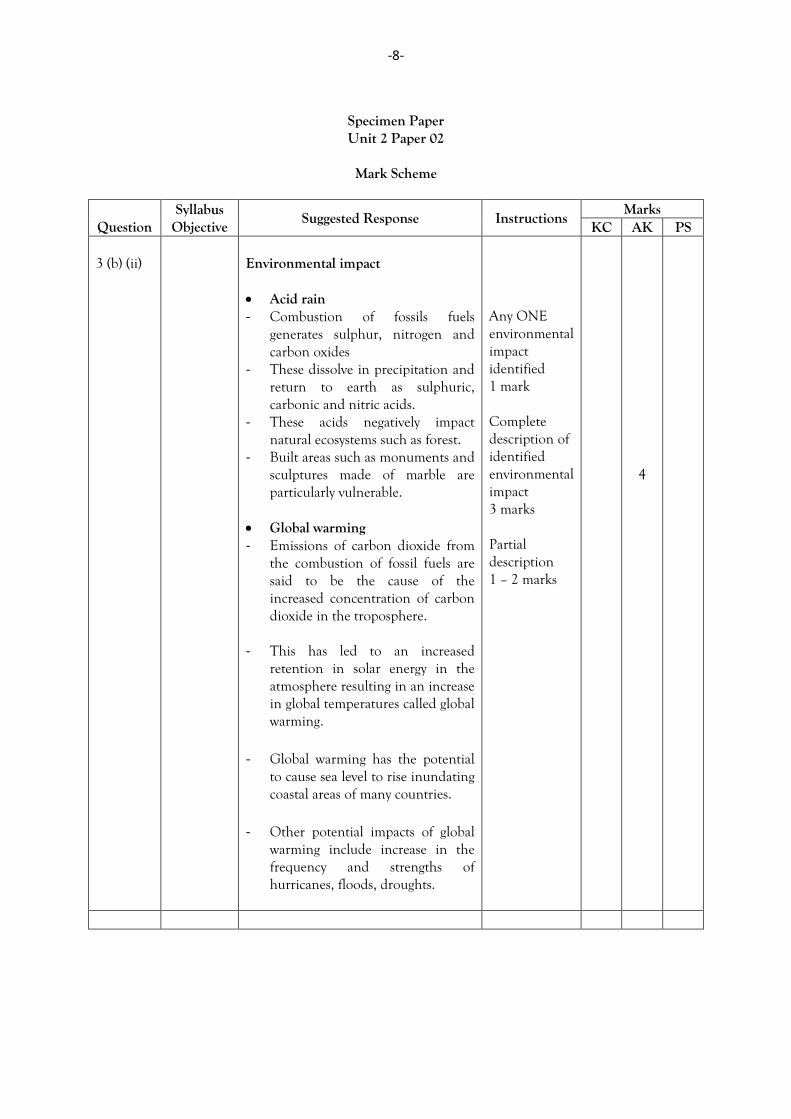
-8-
Specimen Paper Unit 2 Paper 02
Mark Scheme
Question Syllabus
Objective Suggested Response Instructions
Marks KC AK PS
3 (b) (ii)
Environmental impact Acid rain - Combustion of fossils fuels
generates sulphur, nitrogen and carbon oxides
- These dissolve in precipitation and return to earth as sulphuric, carbonic and nitric acids.
- These acids negatively impact natural ecosystems such as forest.
- Built areas such as monuments and sculptures made of marble are particularly vulnerable.
Global warming - Emissions of carbon dioxide from
the combustion of fossil fuels are said to be the cause of the increased concentration of carbon dioxide in the troposphere.
- This has led to an increased
retention in solar energy in the atmosphere resulting in an increase in global temperatures called global warming.
- Global warming has the potential
to cause sea level to rise inundating coastal areas of many countries.
- Other potential impacts of global
warming include increase in the frequency and strengths of hurricanes, floods, droughts.
Any ONE environmental impact identified 1 mark Complete description of identified environmental impact 3 marks Partial description 1 – 2 marks
4
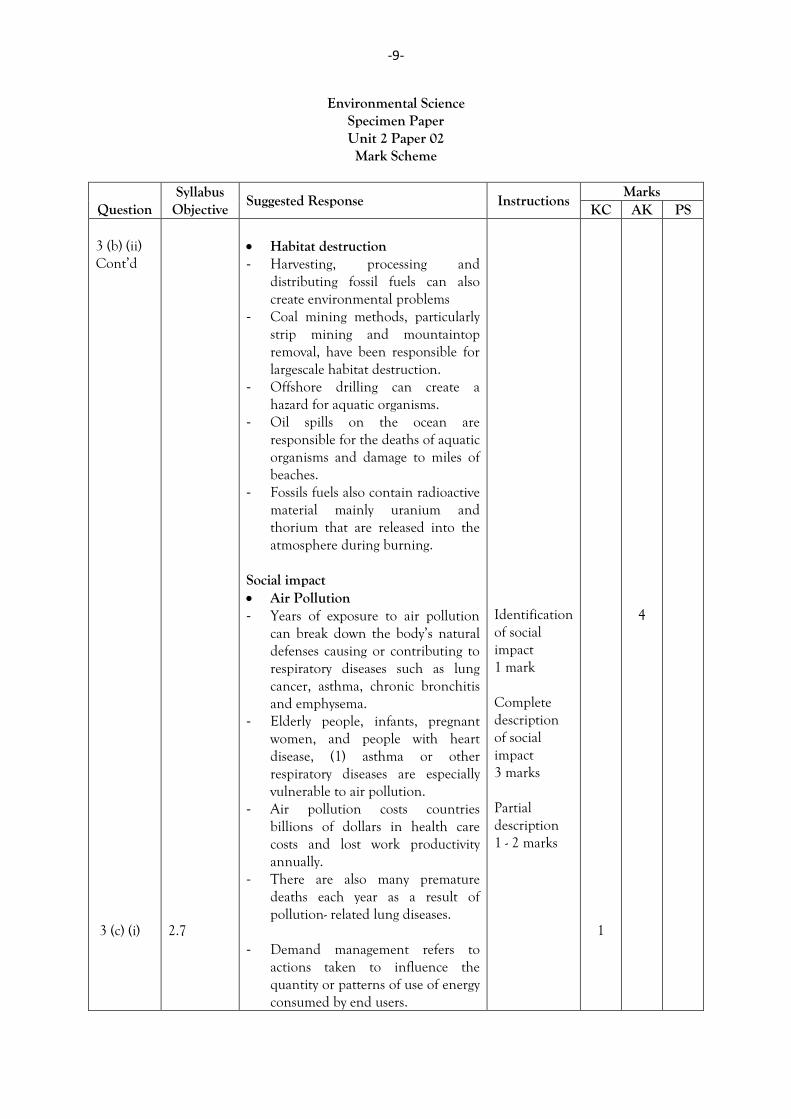
-9-
Environmental Science Specimen Paper Unit 2 Paper 02 Mark Scheme
Question Syllabus
Objective Suggested Response Instructions
Marks KC AK PS
3 (b) (ii) Cont’d 3 (c) (i)
2.7
Habitat destruction - Harvesting, processing and
distributing fossil fuels can also create environmental problems
- Coal mining methods, particularly strip mining and mountaintop removal, have been responsible for largescale habitat destruction.
- Offshore drilling can create a hazard for aquatic organisms.
- Oil spills on the ocean are responsible for the deaths of aquatic organisms and damage to miles of beaches.
- Fossils fuels also contain radioactive material mainly uranium and thorium that are released into the atmosphere during burning.
Social impact Air Pollution - Years of exposure to air pollution
can break down the body’s natural defenses causing or contributing to respiratory diseases such as lung cancer, asthma, chronic bronchitis and emphysema.
- Elderly people, infants, pregnant women, and people with heart disease, (1) asthma or other respiratory diseases are especially vulnerable to air pollution.
- Air pollution costs countries billions of dollars in health care costs and lost work productivity annually.
- There are also many premature deaths each year as a result of pollution- related lung diseases.
- Demand management refers to
actions taken to influence the quantity or patterns of use of energy consumed by end users.
Identification of social impact 1 mark Complete description of social impact 3 marks Partial description 1 - 2 marks
1
4
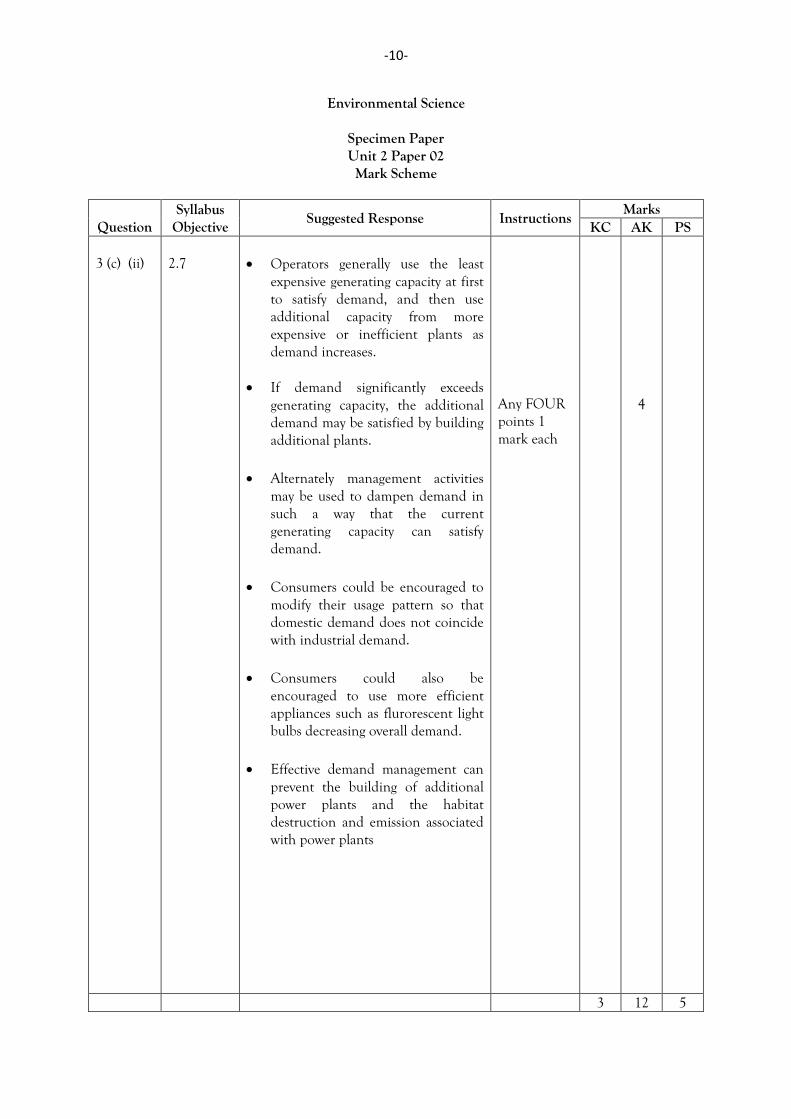
-10-
Environmental Science
Specimen Paper Unit 2 Paper 02 Mark Scheme
Question Syllabus
Objective Suggested Response Instructions
Marks KC AK PS
3 (c) (ii)
2.7
Operators generally use the least
expensive generating capacity at first to satisfy demand, and then use additional capacity from more expensive or inefficient plants as demand increases.
If demand significantly exceeds
generating capacity, the additional demand may be satisfied by building additional plants.
Alternately management activities
may be used to dampen demand in such a way that the current generating capacity can satisfy demand.
Consumers could be encouraged to modify their usage pattern so that domestic demand does not coincide with industrial demand.
Consumers could also be
encouraged to use more efficient appliances such as flurorescent light bulbs decreasing overall demand.
Effective demand management can prevent the building of additional power plants and the habitat destruction and emission associated with power plants
Any FOUR points 1 mark each
4
3 12 5
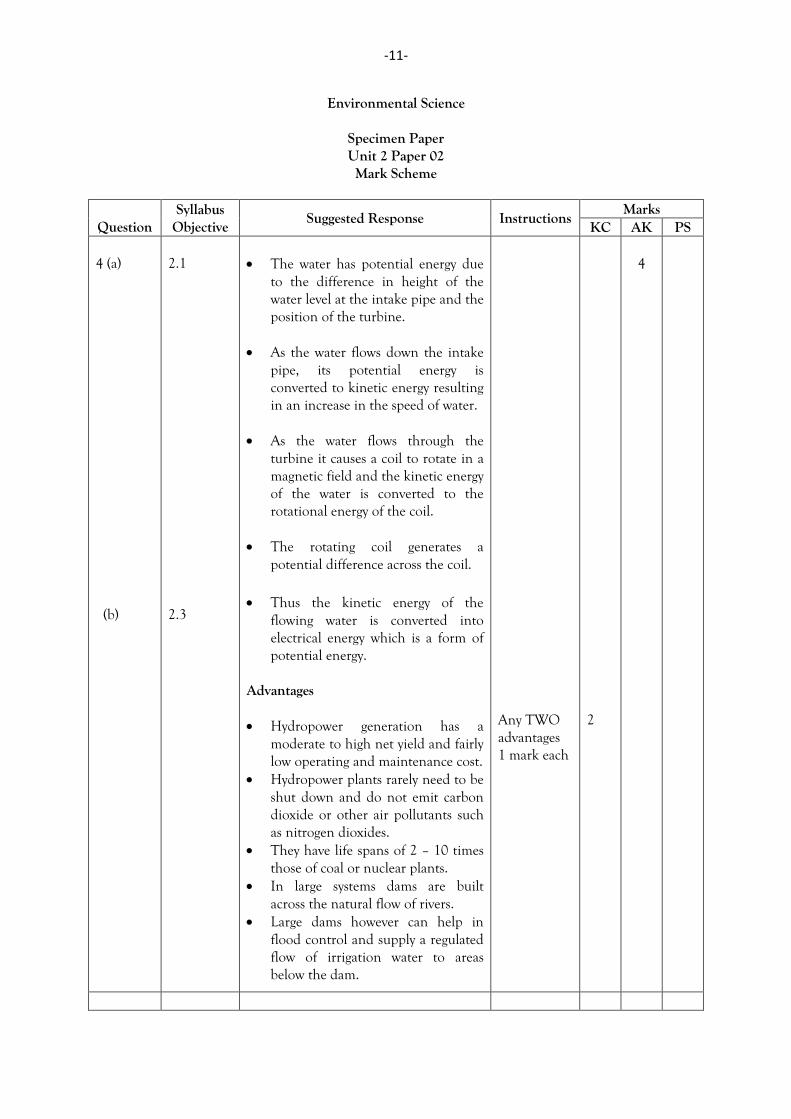
-11-
Environmental Science
Specimen Paper Unit 2 Paper 02 Mark Scheme
Question Syllabus
Objective Suggested Response Instructions
Marks KC AK PS
4 (a) (b)
2.1 2.3
The water has potential energy due
to the difference in height of the water level at the intake pipe and the position of the turbine.
As the water flows down the intake
pipe, its potential energy is converted to kinetic energy resulting in an increase in the speed of water.
As the water flows through the
turbine it causes a coil to rotate in a magnetic field and the kinetic energy of the water is converted to the rotational energy of the coil.
The rotating coil generates a
potential difference across the coil.
Thus the kinetic energy of the flowing water is converted into electrical energy which is a form of potential energy.
Advantages Hydropower generation has a
moderate to high net yield and fairly low operating and maintenance cost.
Hydropower plants rarely need to be shut down and do not emit carbon dioxide or other air pollutants such as nitrogen dioxides.
They have life spans of 2 – 10 times those of coal or nuclear plants.
In large systems dams are built across the natural flow of rivers.
Large dams however can help in flood control and supply a regulated flow of irrigation water to areas below the dam.
Any TWO advantages 1 mark each
2
4
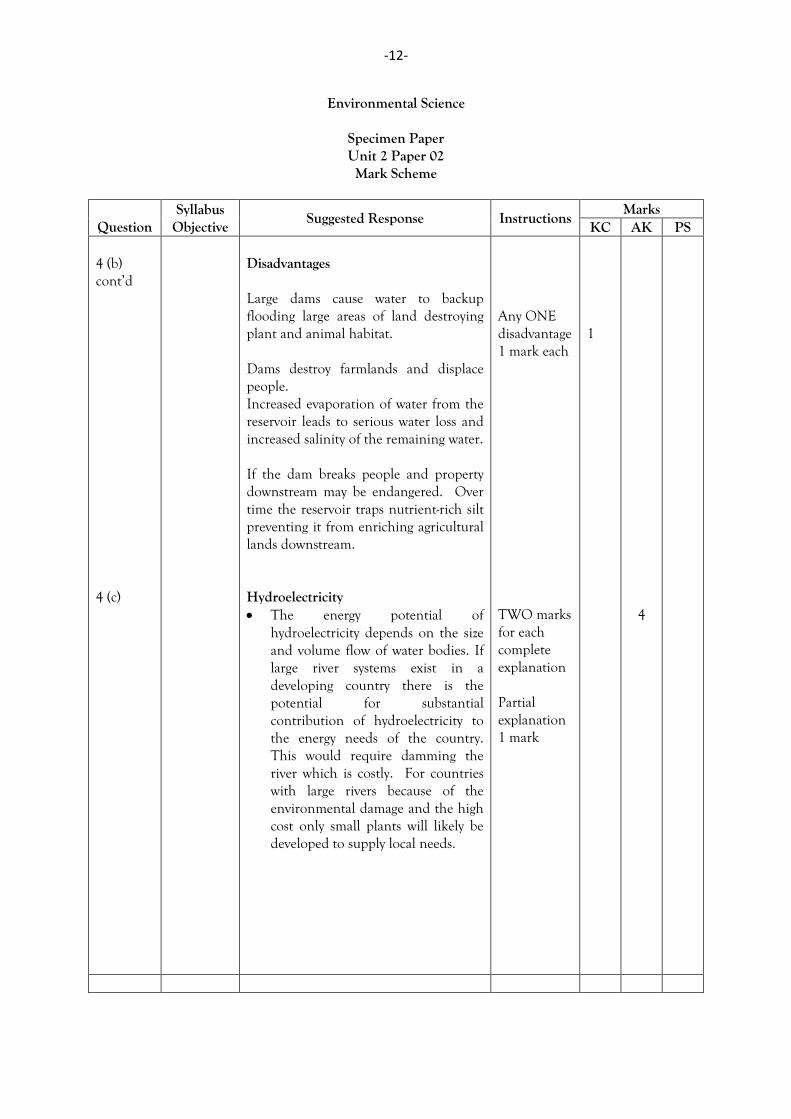
-12-
Environmental Science
Specimen Paper Unit 2 Paper 02 Mark Scheme
Question Syllabus
Objective Suggested Response Instructions
Marks KC AK PS
4 (b) cont’d 4 (c)
Disadvantages Large dams cause water to backup flooding large areas of land destroying plant and animal habitat. Dams destroy farmlands and displace people. Increased evaporation of water from the reservoir leads to serious water loss and increased salinity of the remaining water. If the dam breaks people and property downstream may be endangered. Over time the reservoir traps nutrient-rich silt preventing it from enriching agricultural lands downstream. Hydroelectricity The energy potential of
hydroelectricity depends on the size and volume flow of water bodies. If large river systems exist in a developing country there is the potential for substantial contribution of hydroelectricity to the energy needs of the country. This would require damming the river which is costly. For countries with large rivers because of the environmental damage and the high cost only small plants will likely be developed to supply local needs.
Any ONE disadvantage 1 mark each TWO marks for each complete explanation Partial explanation 1 mark
1
4
-13-
Environmental Science
Specimen Paper Unit 2 Paper 02 Mark Scheme
Question Syllabus
Objective Suggested Response Instructions
Marks KC AK PS
4 (c) Cont’d
Many developing countries have
small rivers which are able to generate small amounts of electricity. However, seasonal changes in volume flow make these small-scale systems unreliable. Hydropower therefore appears to have limited scope to supply the energy needs of these countries.
Solar Energy Solar energy is widely dispersed over the earth’s entire surface which makes it available to all developing countries. Its intensity varies with latitude so that countries closer to the equator receive a greater intensity of solar energy. Its intensity also varies with season, cloud cover and time of day. The technology to utilize solar energy is well developed. One problem of using solar energy to generate electricity is that a back-up system must be available to generate electricity at nights, and on cloudy days when solar power output is low. The current technology used to trap the sun’s energy is efficient but technological developments will improve efficiency of collection making it more cost effective. The initial cost of converting to solar energy is high;, however, the long-term energy savings of solar power compensate for the high start-up cost.
Any TWO complete explanations 2 marks each Partial explanations 1 mark
4
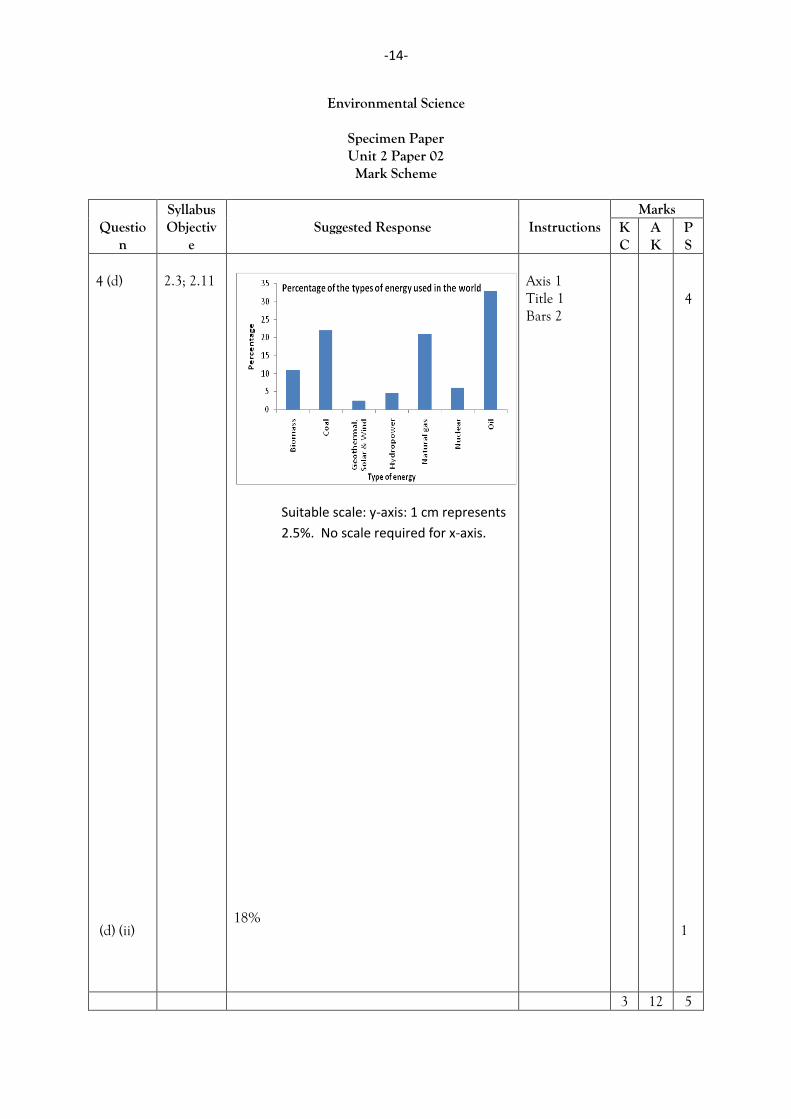
-14-
Environmental Science
Specimen Paper Unit 2 Paper 02 Mark Scheme
Question
Syllabus Objectiv
e Suggested Response Instructions
Marks KC
AK
PS
4 (d) (d) (ii)
2.3; 2.11
Suitable scale: y-axis: 1 cm represents
2.5%. No scale required for x-axis.
18%
Axis 1 Title 1 Bars 2
4
1
3 12 5
-15-
Environmental Science
Specimen Paper Unit 2 Paper 02 Mark Scheme
Question Syllabus
Objective Suggested Response Instructions
Marks KC AK PS
5 (a) (b)
All organisms have dieldrin
concentration greater than that of the water.
The dieldrin concentration at each trophic level varies with organism.
Dieldrin concentration increases as
the trophic levels increase.
Tertiary organisms have a minimum concentration 20 000 times greater than in the water.
Bioaccumulation and biomagnification are taking place.
Environmental pathways: Pesticide in air settles in soil and on
crops.
Erosion and leaching of soil cause pesticide to move into fresh water bodies such as rivers.
The pesticide is transferred to aquifers which flow to water bodies such as river and oceans.
OR Pesticide in air dissolves in rain
(precipitation).
This falls on soil and into water bodies
As water (precipitation) percolates through soil, it may dissolve out pesticide.
1 mark for each inference Any ONE pathway 3 marks
3
5
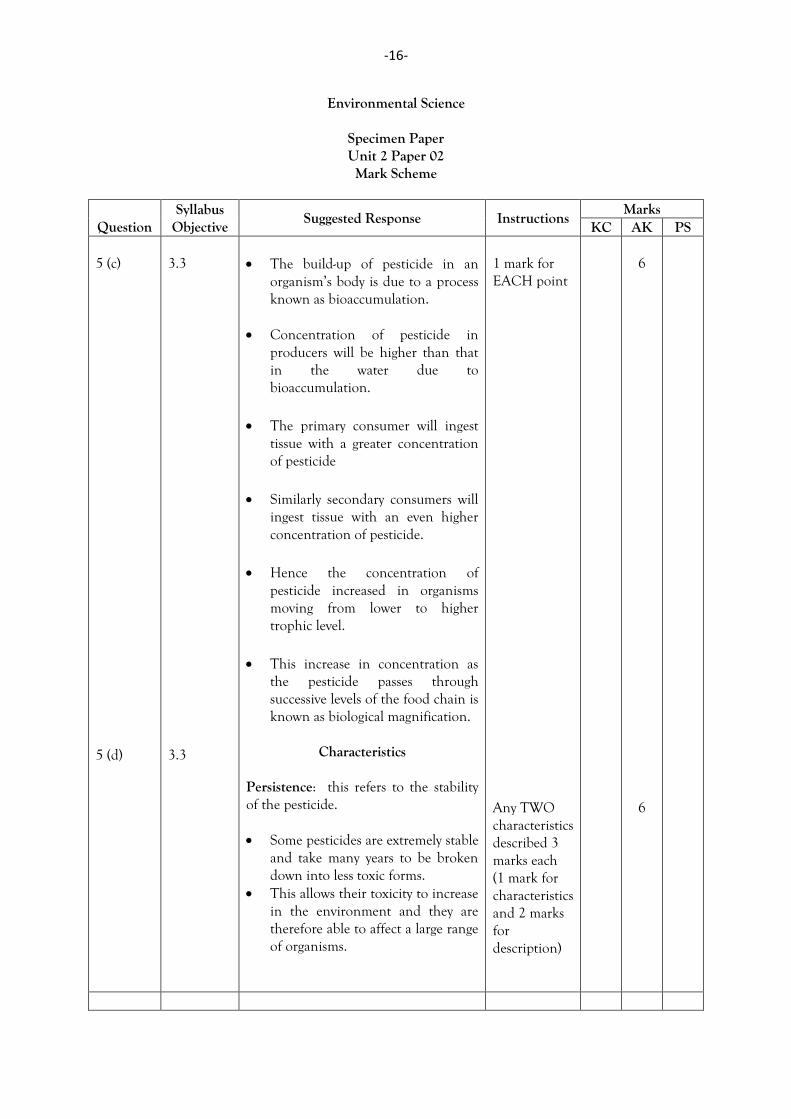
-16-
Environmental Science
Specimen Paper Unit 2 Paper 02 Mark Scheme
Question Syllabus
Objective Suggested Response Instructions
Marks KC AK PS
5 (c) 5 (d)
3.3 3.3
The build-up of pesticide in an
organism’s body is due to a process known as bioaccumulation.
Concentration of pesticide in producers will be higher than that in the water due to bioaccumulation.
The primary consumer will ingest
tissue with a greater concentration of pesticide
Similarly secondary consumers will ingest tissue with an even higher concentration of pesticide.
Hence the concentration of
pesticide increased in organisms moving from lower to higher trophic level.
This increase in concentration as the pesticide passes through successive levels of the food chain is known as biological magnification.
Characteristics
Persistence: this refers to the stability of the pesticide. Some pesticides are extremely stable
and take many years to be broken down into less toxic forms.
This allows their toxicity to increase in the environment and they are therefore able to affect a large range of organisms.
1 mark for EACH point Any TWO characteristics described 3 marks each (1 mark for characteristics and 2 marks for description)
6
6
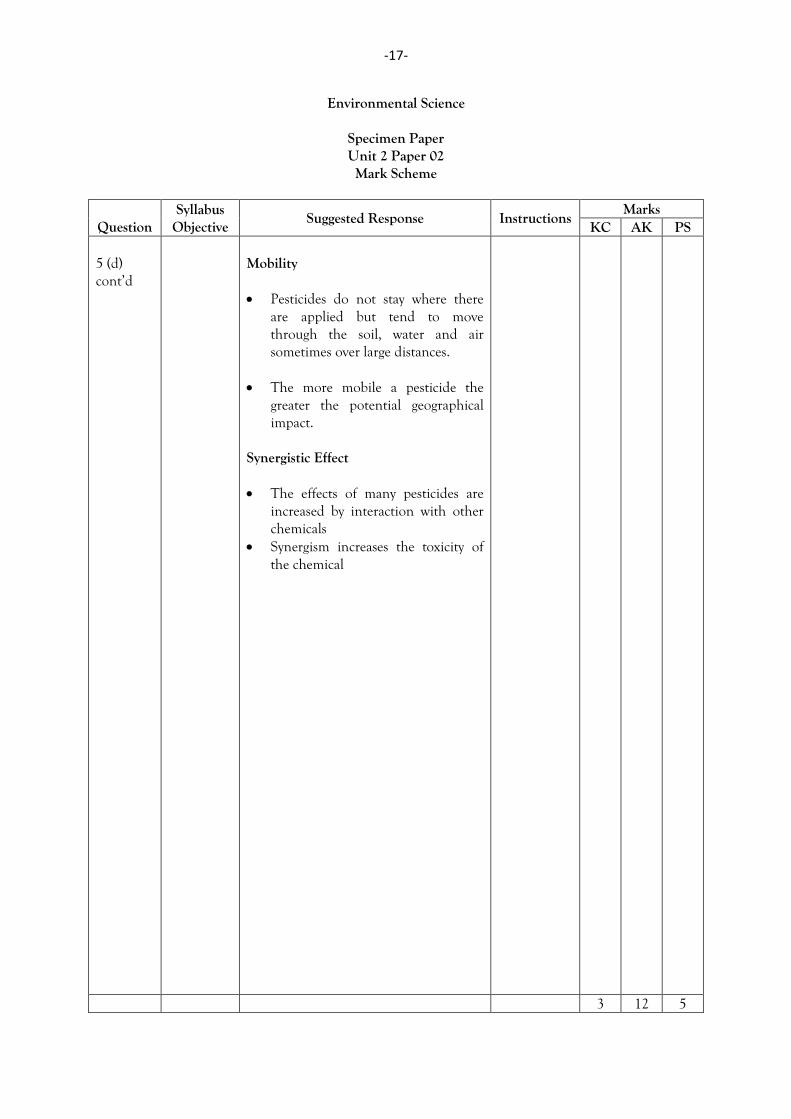
-17-
Environmental Science
Specimen Paper Unit 2 Paper 02 Mark Scheme
Question Syllabus
Objective Suggested Response Instructions
Marks KC AK PS
5 (d) cont’d
Mobility Pesticides do not stay where there
are applied but tend to move through the soil, water and air sometimes over large distances.
The more mobile a pesticide the greater the potential geographical impact.
Synergistic Effect The effects of many pesticides are
increased by interaction with other chemicals
Synergism increases the toxicity of the chemical
3 12 5
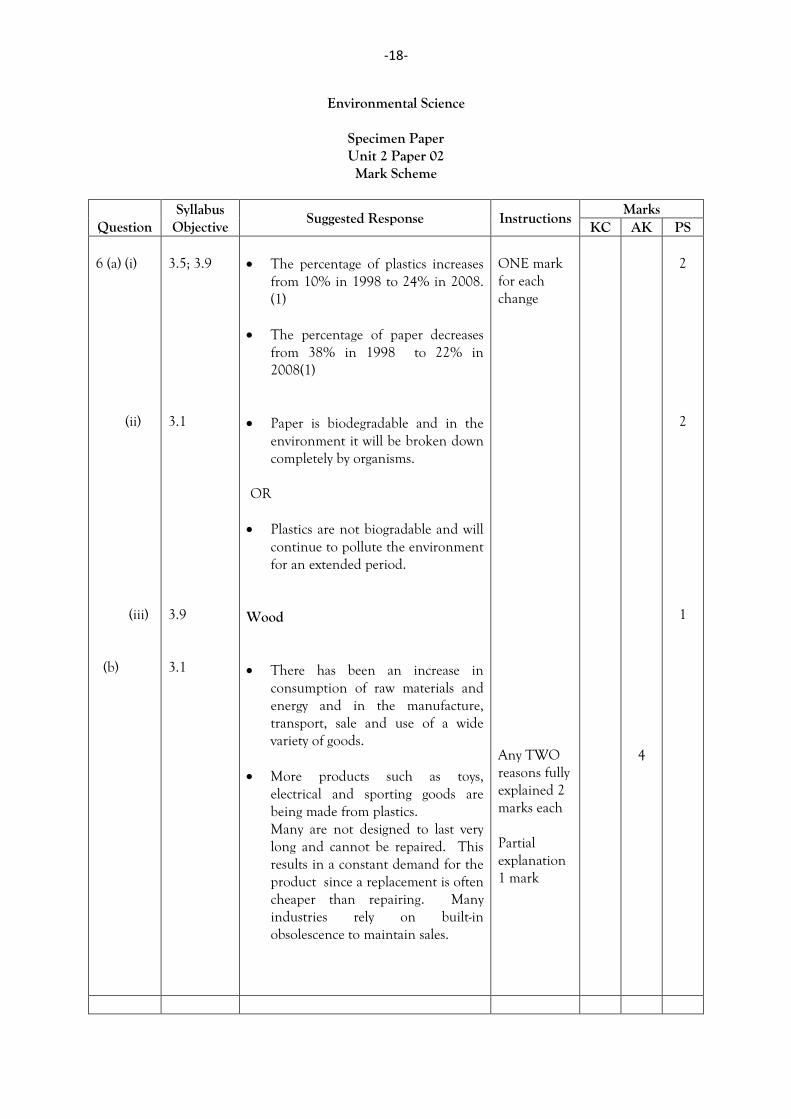
-18-
Environmental Science
Specimen Paper Unit 2 Paper 02 Mark Scheme
Question Syllabus
Objective Suggested Response Instructions
Marks KC AK PS
6 (a) (i) (ii) (iii) (b)
3.5; 3.9 3.1 3.9 3.1
The percentage of plastics increases
from 10% in 1998 to 24% in 2008. (1)
The percentage of paper decreases
from 38% in 1998 to 22% in 2008(1)
Paper is biodegradable and in the
environment it will be broken down completely by organisms.
OR Plastics are not biogradable and will
continue to pollute the environment for an extended period.
Wood
There has been an increase in
consumption of raw materials and energy and in the manufacture, transport, sale and use of a wide variety of goods.
More products such as toys, electrical and sporting goods are being made from plastics. Many are not designed to last very long and cannot be repaired. This results in a constant demand for the product since a replacement is often cheaper than repairing. Many industries rely on built-in obsolescence to maintain sales.
ONE mark for each change Any TWO reasons fully explained 2 marks each Partial explanation 1 mark
4
2
2
1
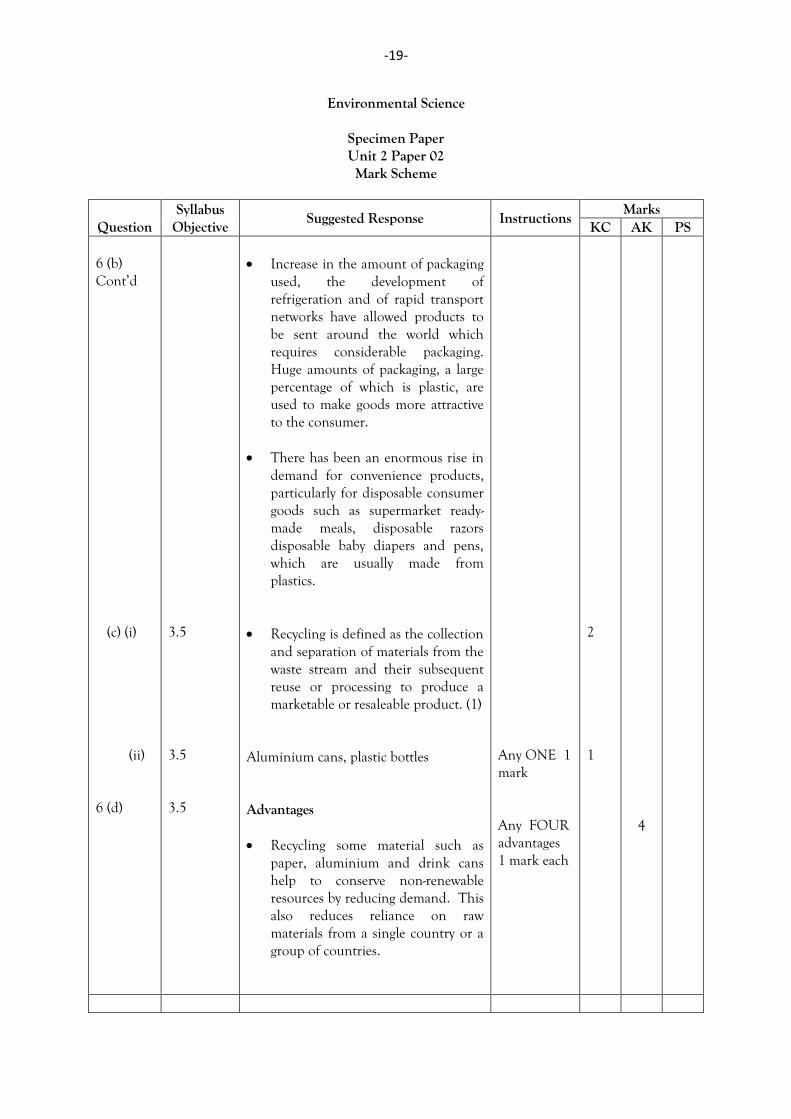
-19-
Environmental Science
Specimen Paper Unit 2 Paper 02 Mark Scheme
Question Syllabus
Objective Suggested Response Instructions
Marks KC AK PS
6 (b) Cont’d (c) (i) (ii) 6 (d)
3.5 3.5 3.5
Increase in the amount of packaging
used, the development of refrigeration and of rapid transport networks have allowed products to be sent around the world which requires considerable packaging. Huge amounts of packaging, a large percentage of which is plastic, are used to make goods more attractive to the consumer.
There has been an enormous rise in
demand for convenience products, particularly for disposable consumer goods such as supermarket ready-made meals, disposable razors disposable baby diapers and pens, which are usually made from plastics.
Recycling is defined as the collection
and separation of materials from the waste stream and their subsequent reuse or processing to produce a marketable or resaleable product. (1)
Aluminium cans, plastic bottles Advantages Recycling some material such as
paper, aluminium and drink cans help to conserve non-renewable resources by reducing demand. This also reduces reliance on raw materials from a single country or a group of countries.
Any ONE 1 mark Any FOUR advantages 1 mark each
2 1
4
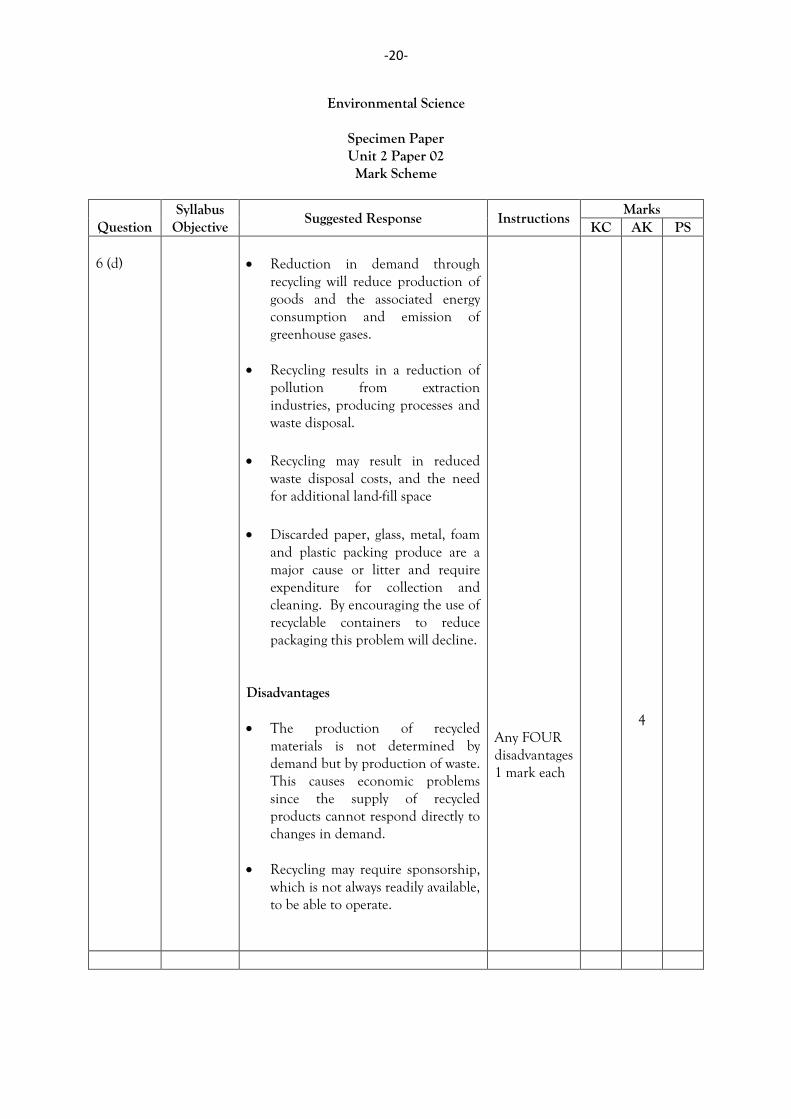
-20-
Environmental Science
Specimen Paper Unit 2 Paper 02 Mark Scheme
Question Syllabus
Objective Suggested Response Instructions
Marks KC AK PS
6 (d)
Reduction in demand through
recycling will reduce production of goods and the associated energy consumption and emission of greenhouse gases.
Recycling results in a reduction of pollution from extraction industries, producing processes and waste disposal.
Recycling may result in reduced
waste disposal costs, and the need for additional land-fill space
Discarded paper, glass, metal, foam and plastic packing produce are a major cause or litter and require expenditure for collection and cleaning. By encouraging the use of recyclable containers to reduce packaging this problem will decline.
Disadvantages The production of recycled
materials is not determined by demand but by production of waste. This causes economic problems since the supply of recycled products cannot respond directly to changes in demand.
Recycling may require sponsorship, which is not always readily available, to be able to operate.
Any FOUR disadvantages 1 mark each
4
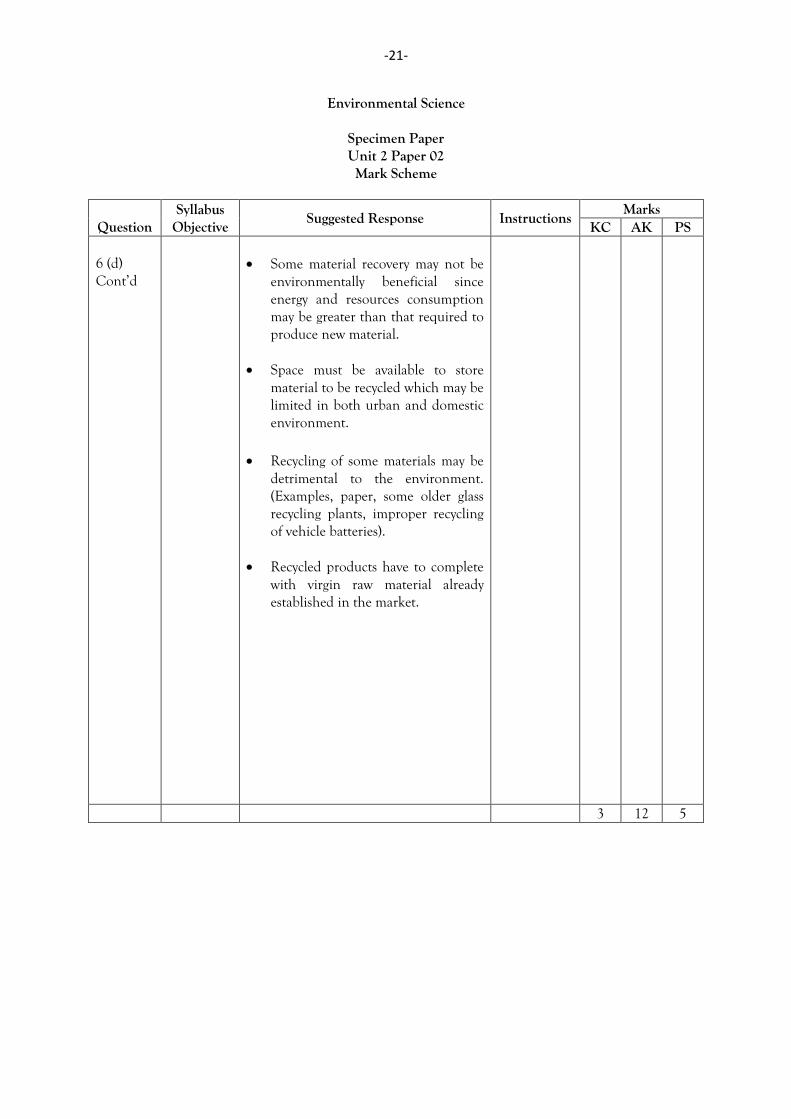
-21-
Environmental Science
Specimen Paper Unit 2 Paper 02 Mark Scheme
Question Syllabus
Objective Suggested Response Instructions
Marks KC AK PS
6 (d) Cont’d
Some material recovery may not be
environmentally beneficial since energy and resources consumption may be greater than that required to produce new material.
Space must be available to store material to be recycled which may be limited in both urban and domestic environment.
Recycling of some materials may be
detrimental to the environment. (Examples, paper, some older glass recycling plants, improper recycling of vehicle batteries).
Recycled products have to complete with virgin raw material already established in the market.
3 12 5
02220032/CAPE/MS
C A R I B B E A N E X A M I N A T I O N S C O U N C I L HEADQUARTERS
ADVANCED PROFICIENCY EXAMINATION
ENVIRONMENTAL SCIENCE
SPECIMEN PAPER
Unit 2 – Paper 03/2
MARK SCHEME
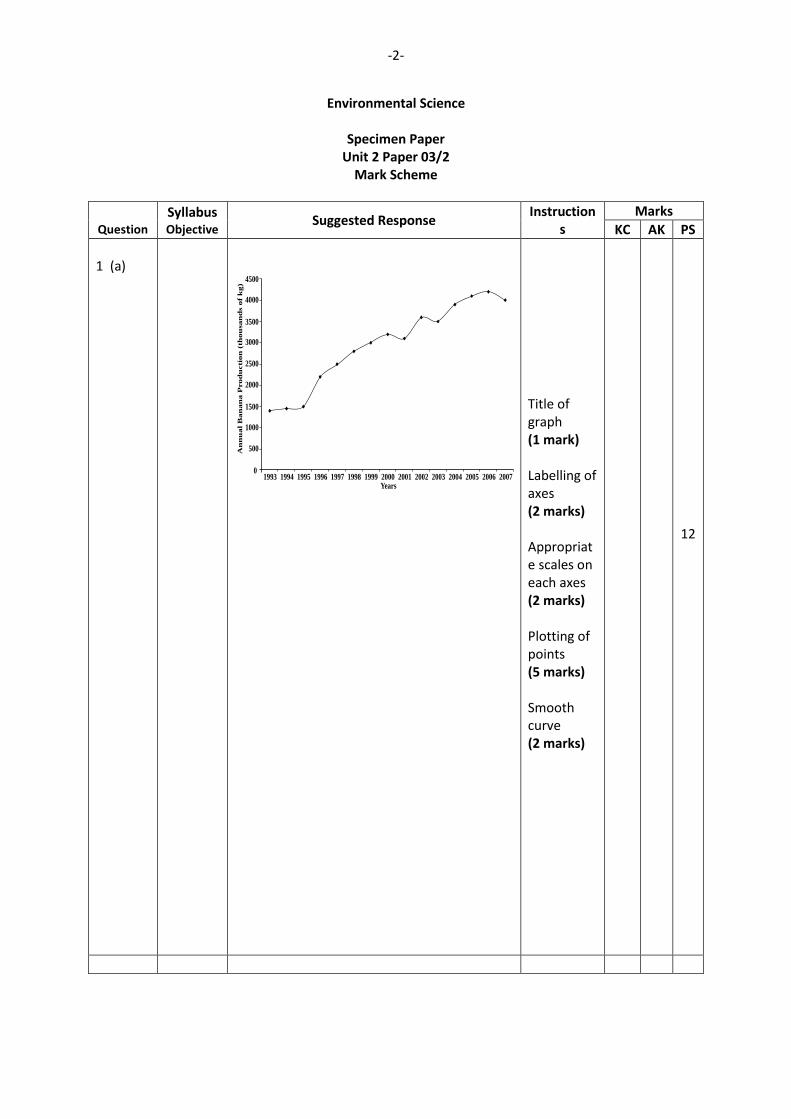
-2-
Environmental Science
Specimen Paper Unit 2 Paper 03/2
Mark Scheme
Question
Syllabus Objective
Suggested Response Instruction
s Marks
KC AK PS
1 (a)
Title of graph (1 mark) Labelling of axes (2 marks) Appropriate scales on each axes (2 marks) Plotting of points (5 marks) Smooth curve (2 marks)
12
1993 1994 1995 1996 1997 1998 1999 2000 2001 2002 2003 2004 2005 2006 2007Years
0
500
1000
1500
2000
2500
3000
3500
4000
4500
An
nu
alB
an
an
aP
rodu
cti
on
(th
ou
san
ds
of
kg)
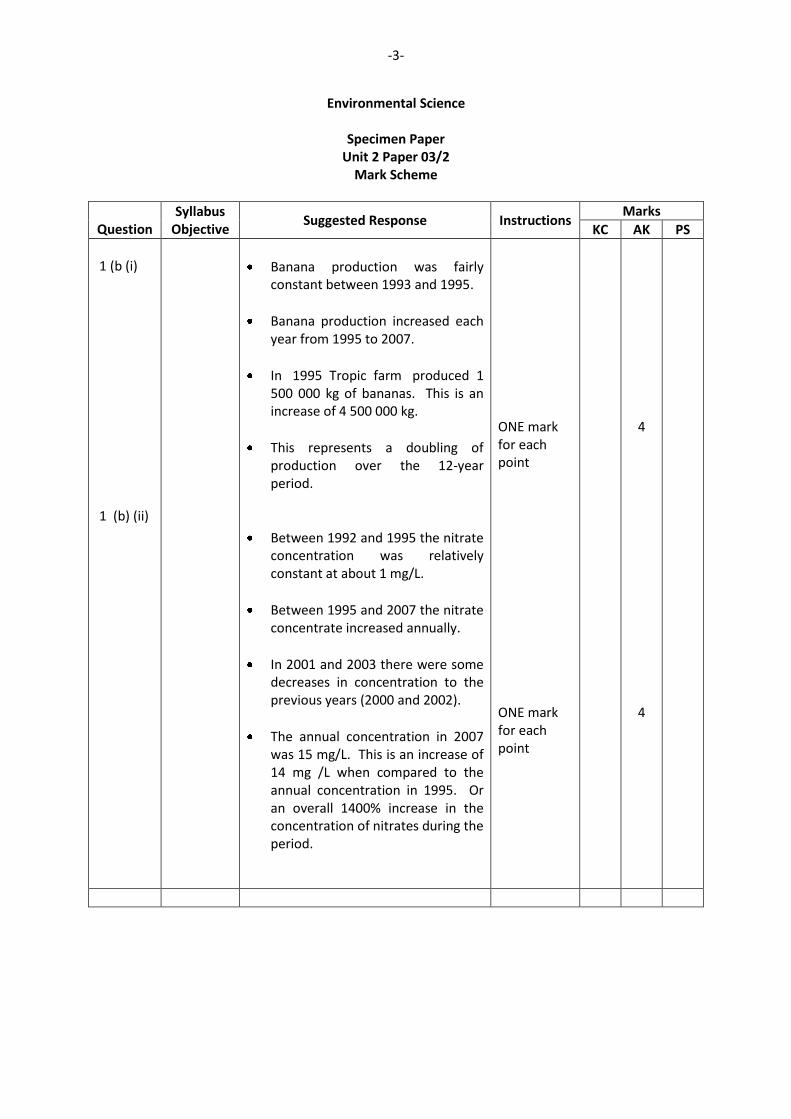
-3-
Environmental Science
Specimen Paper Unit 2 Paper 03/2
Mark Scheme
Question
Syllabus Objective
Suggested Response Instructions Marks
KC AK PS
1 (b (i) 1 (b) (ii)
Banana production was fairly constant between 1993 and 1995.
Banana production increased each year from 1995 to 2007.
In 1995 Tropic farm produced 1 500 000 kg of bananas. This is an increase of 4 500 000 kg.
This represents a doubling of production over the 12-year period.
Between 1992 and 1995 the nitrate concentration was relatively constant at about 1 mg/L.
Between 1995 and 2007 the nitrate concentrate increased annually.
In 2001 and 2003 there were some decreases in concentration to the previous years (2000 and 2002).
The annual concentration in 2007 was 15 mg/L. This is an increase of 14 mg /L when compared to the annual concentration in 1995. Or an overall 1400% increase in the concentration of nitrates during the period.
ONE mark for each point
ONE mark for each point
4
4
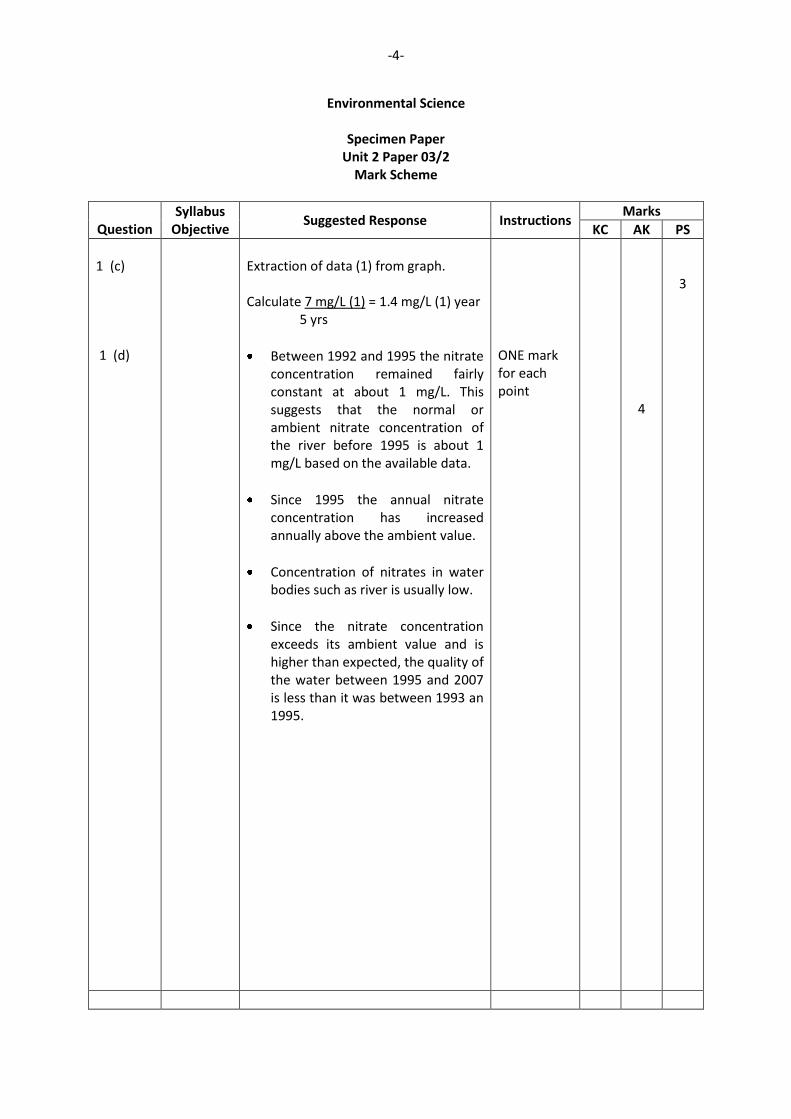
-4-
Environmental Science
Specimen Paper Unit 2 Paper 03/2
Mark Scheme
Question
Syllabus Objective
Suggested Response Instructions Marks
KC AK PS
1 (c) 1 (d)
Extraction of data (1) from graph.
Calculate 7 mg/L (1) = 1.4 mg/L (1) year 5 yrs
Between 1992 and 1995 the nitrate concentration remained fairly constant at about 1 mg/L. This suggests that the normal or ambient nitrate concentration of the river before 1995 is about 1 mg/L based on the available data.
Since 1995 the annual nitrate concentration has increased annually above the ambient value.
Concentration of nitrates in water bodies such as river is usually low.
Since the nitrate concentration exceeds its ambient value and is higher than expected, the quality of the water between 1995 and 2007 is less than it was between 1993 an 1995.
ONE mark for each point
4
3
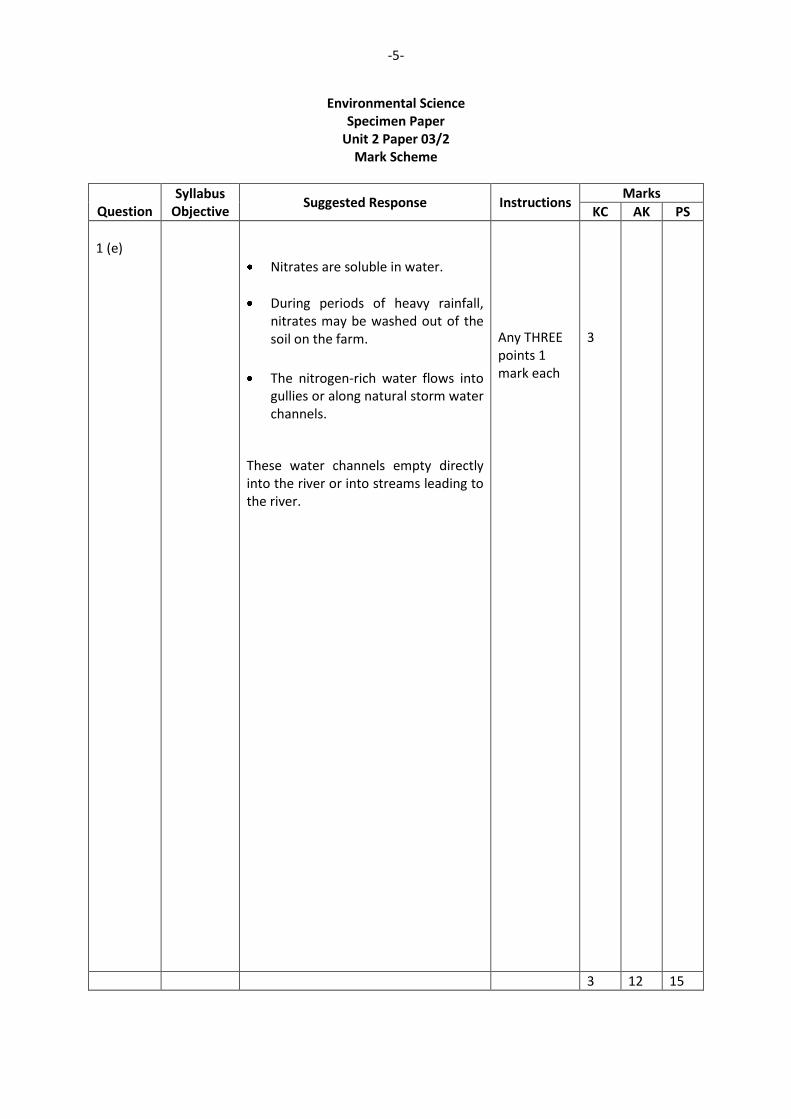
-5-
Environmental Science Specimen Paper
Unit 2 Paper 03/2 Mark Scheme
Question
Syllabus Objective
Suggested Response Instructions Marks
KC AK PS
1 (e)
Nitrates are soluble in water.
During periods of heavy rainfall, nitrates may be washed out of the soil on the farm.
The nitrogen-rich water flows into gullies or along natural storm water channels.
These water channels empty directly into the river or into streams leading to the river.
Any THREE points 1 mark each
3
3 12 15
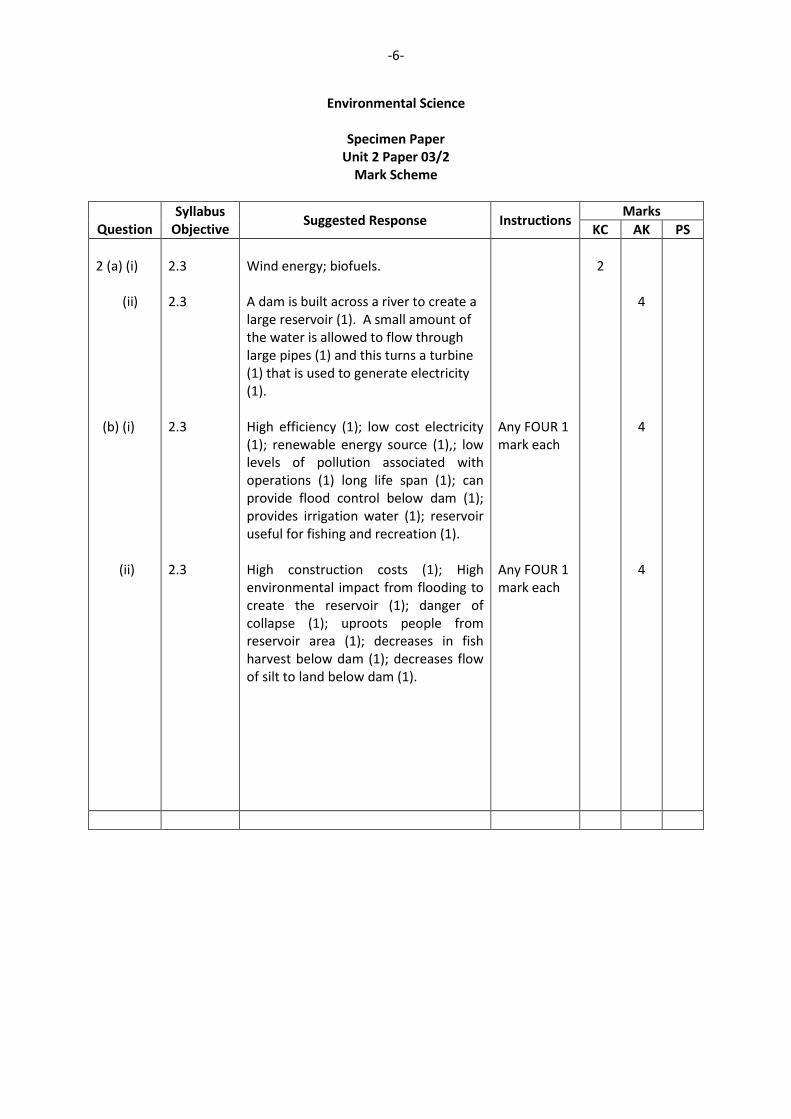
-6-
Environmental Science
Specimen Paper Unit 2 Paper 03/2
Mark Scheme
Question
Syllabus Objective
Suggested Response Instructions Marks
KC AK PS
2 (a) (i) (ii) (b) (i) (ii)
2.3 2.3 2.3 2.3
Wind energy; biofuels. A dam is built across a river to create a large reservoir (1). A small amount of the water is allowed to flow through large pipes (1) and this turns a turbine (1) that is used to generate electricity (1). High efficiency (1); low cost electricity (1); renewable energy source (1),; low levels of pollution associated with operations (1) long life span (1); can provide flood control below dam (1); provides irrigation water (1); reservoir useful for fishing and recreation (1). High construction costs (1); High environmental impact from flooding to create the reservoir (1); danger of collapse (1); uproots people from reservoir area (1); decreases in fish harvest below dam (1); decreases flow of silt to land below dam (1).
Any FOUR 1 mark each Any FOUR 1 mark each
2
4
4
4
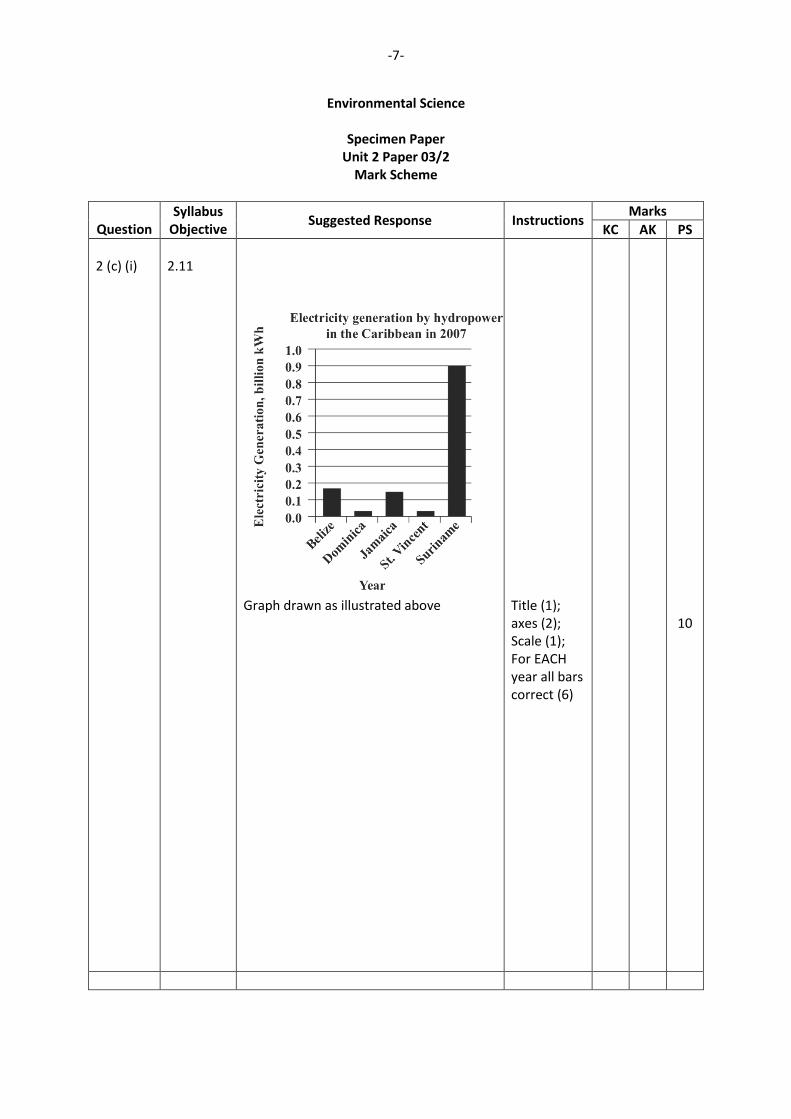
-7-
Environmental Science
Specimen Paper Unit 2 Paper 03/2
Mark Scheme
Question
Syllabus Objective
Suggested Response Instructions Marks
KC AK PS
2 (c) (i)
2.11
Graph drawn as illustrated above
Title (1); axes (2); Scale (1); For EACH year all bars correct (6)
10

-8-
Environmental Science
Specimen Paper Unit 2 Paper 03/2
Mark Scheme
Question
Syllabus Objective
Suggested Response Instructions Marks
KC AK PS
2 (c) (ii) (iii)
2.11 2.11
Trend
Suriname produced a significant amount of electricity using hydropower.
Small island such as Antigua, Barbados, Grenada and St. Lucia did not use hydropower for electricity generation.
St. Vincent and Grenada used hydropower to generate a small amount of electricity.
Jamaica and Belize used hydropower to generate a moderate amount of electricity.
Belize & St. Vincent 0.18 + 0.02 = 0.20 billion kWh (1) Total for Caribbean = 0.18 + 0.03 + 0.16 + 0.02 + 0.9 = 1.29 billion kWh (1) % for Belize & St. Vincent = 0.2/1.29*100 = 15.5% (1)
Any THREE points 1 mark each
3
3
2 12 16
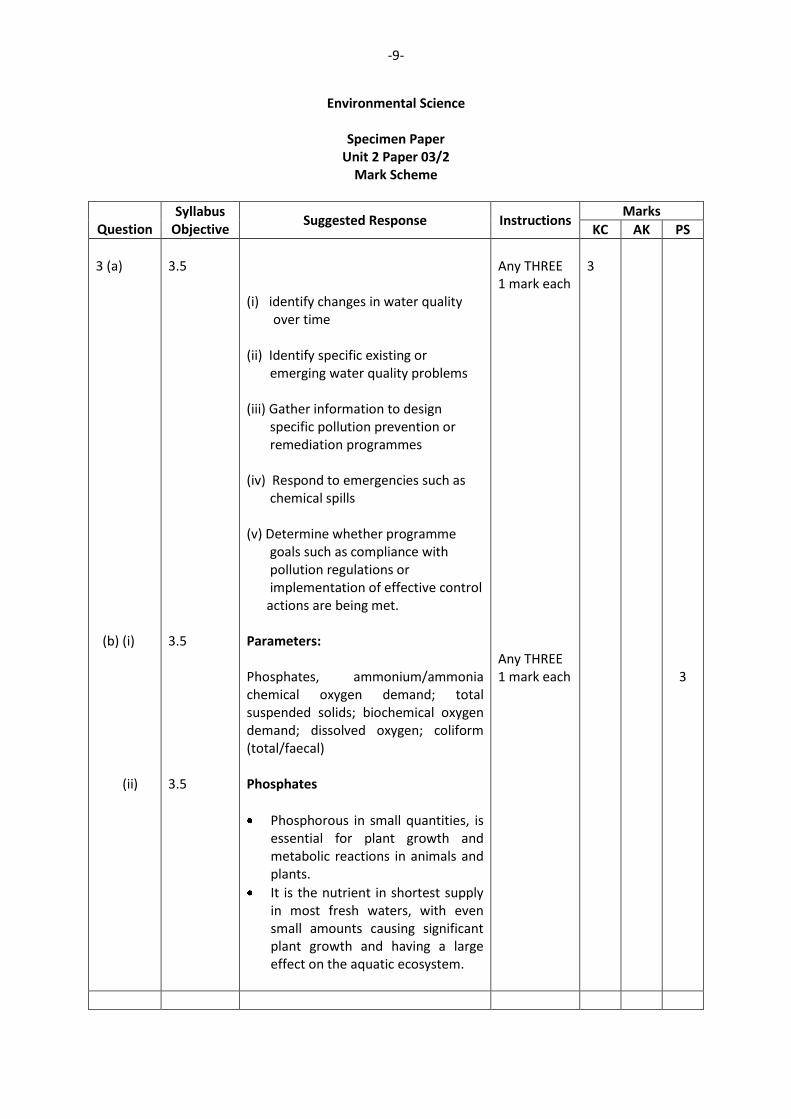
-9-
Environmental Science
Specimen Paper Unit 2 Paper 03/2
Mark Scheme
Question
Syllabus Objective
Suggested Response Instructions Marks
KC AK PS
3 (a) (b) (i) (ii)
3.5 3.5 3.5
(i) identify changes in water quality over time (ii) Identify specific existing or emerging water quality problems (iii) Gather information to design specific pollution prevention or remediation programmes (iv) Respond to emergencies such as chemical spills (v) Determine whether programme goals such as compliance with pollution regulations or implementation of effective control actions are being met. Parameters: Phosphates, ammonium/ammonia chemical oxygen demand; total suspended solids; biochemical oxygen demand; dissolved oxygen; coliform (total/faecal) Phosphates
Phosphorous in small quantities, is essential for plant growth and metabolic reactions in animals and plants.
It is the nutrient in shortest supply in most fresh waters, with even small amounts causing significant plant growth and having a large effect on the aquatic ecosystem.
Any THREE 1 mark each Any THREE 1 mark each
3
3
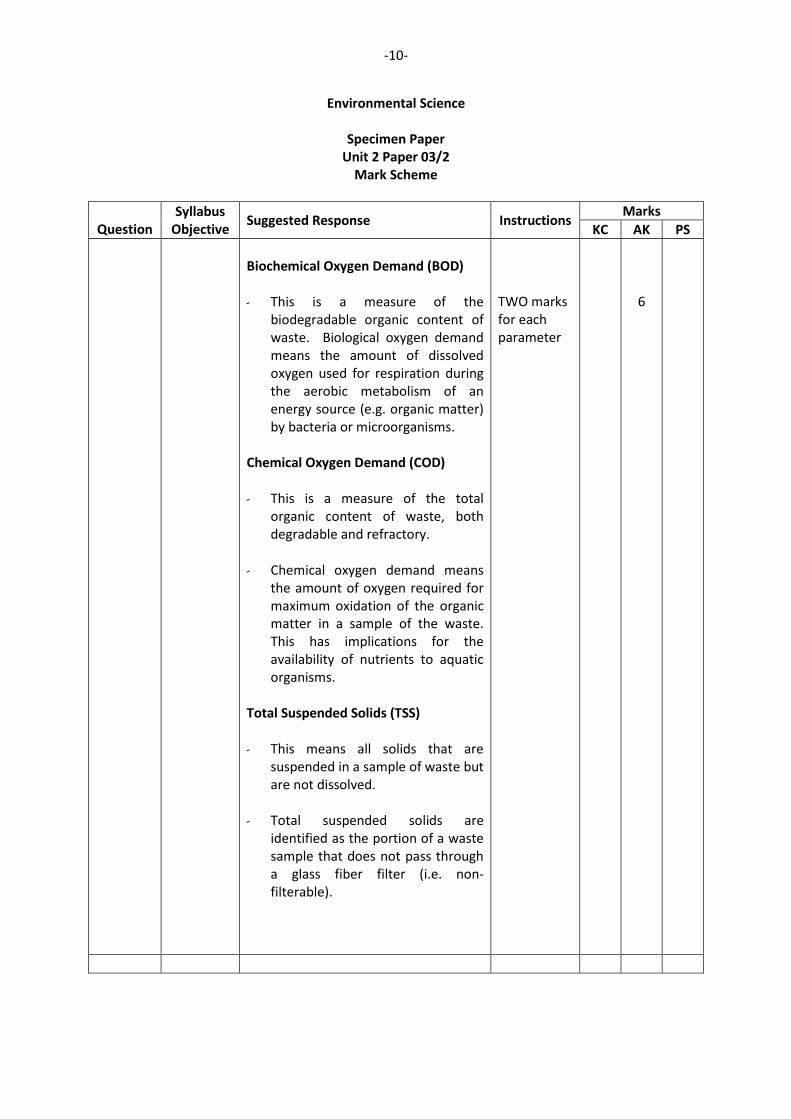
-10-
Environmental Science
Specimen Paper Unit 2 Paper 03/2
Mark Scheme
Question
Syllabus Objective
Suggested Response Instructions Marks
KC AK PS
Biochemical Oxygen Demand (BOD) - This is a measure of the
biodegradable organic content of waste. Biological oxygen demand means the amount of dissolved oxygen used for respiration during the aerobic metabolism of an energy source (e.g. organic matter) by bacteria or microorganisms.
Chemical Oxygen Demand (COD) - This is a measure of the total
organic content of waste, both degradable and refractory.
- Chemical oxygen demand means the amount of oxygen required for maximum oxidation of the organic matter in a sample of the waste. This has implications for the availability of nutrients to aquatic organisms.
Total Suspended Solids (TSS) - This means all solids that are
suspended in a sample of waste but are not dissolved.
- Total suspended solids are
identified as the portion of a waste sample that does not pass through a glass fiber filter (i.e. non-filterable).
TWO marks for each parameter
6
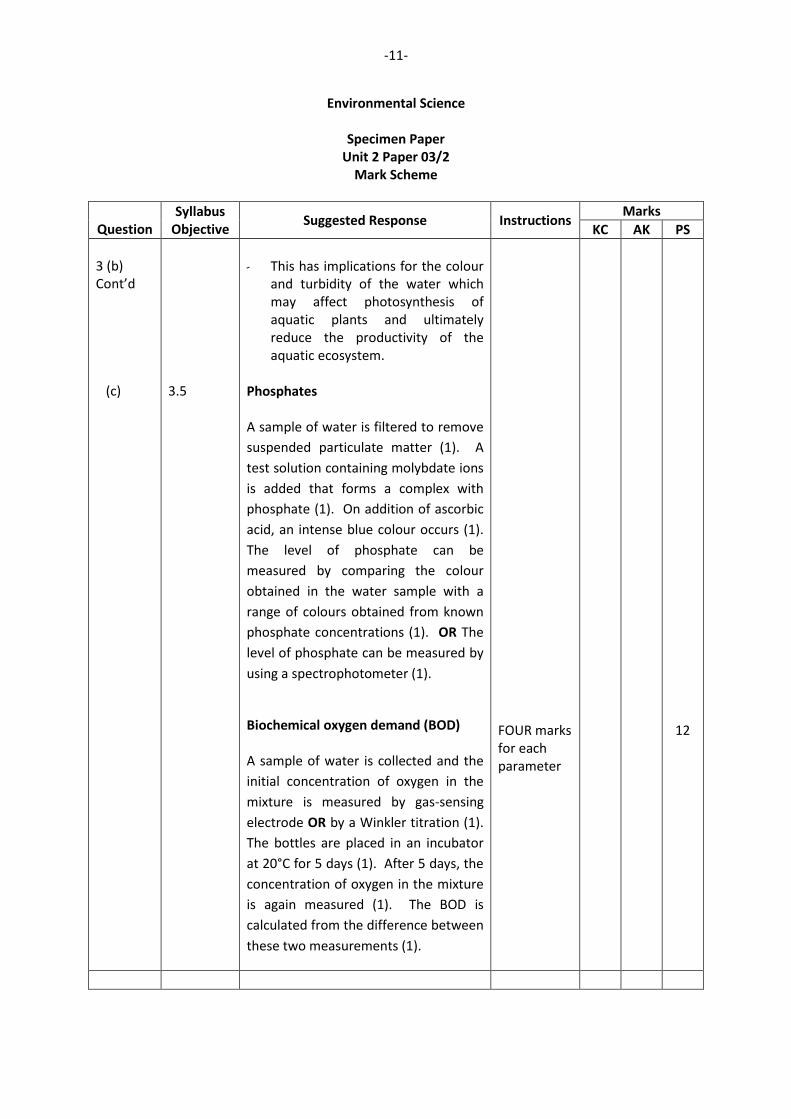
-11-
Environmental Science
Specimen Paper Unit 2 Paper 03/2
Mark Scheme
Question
Syllabus Objective
Suggested Response Instructions Marks
KC AK PS
3 (b) Cont’d (c)
3.5
- This has implications for the colour
and turbidity of the water which may affect photosynthesis of aquatic plants and ultimately reduce the productivity of the aquatic ecosystem.
Phosphates A sample of water is filtered to remove
suspended particulate matter (1). A
test solution containing molybdate ions
is added that forms a complex with
phosphate (1). On addition of ascorbic
acid, an intense blue colour occurs (1).
The level of phosphate can be
measured by comparing the colour
obtained in the water sample with a
range of colours obtained from known
phosphate concentrations (1). OR The
level of phosphate can be measured by
using a spectrophotometer (1).
Biochemical oxygen demand (BOD) A sample of water is collected and the
initial concentration of oxygen in the
mixture is measured by gas-sensing
electrode OR by a Winkler titration (1).
The bottles are placed in an incubator
at 20°C for 5 days (1). After 5 days, the
concentration of oxygen in the mixture
is again measured (1). The BOD is
calculated from the difference between
these two measurements (1).
FOUR marks for each parameter
12
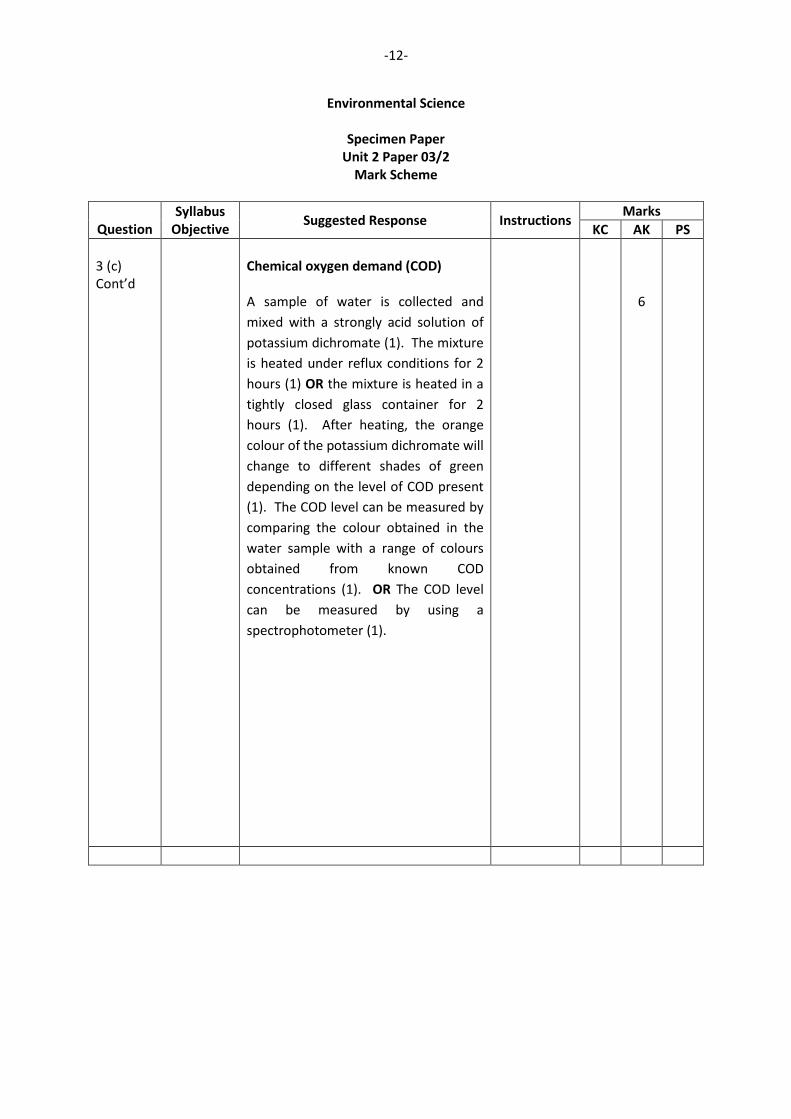
-12-
Environmental Science
Specimen Paper Unit 2 Paper 03/2
Mark Scheme
Question
Syllabus Objective
Suggested Response Instructions Marks
KC AK PS
3 (c) Cont’d
Chemical oxygen demand (COD) A sample of water is collected and
mixed with a strongly acid solution of
potassium dichromate (1). The mixture
is heated under reflux conditions for 2
hours (1) OR the mixture is heated in a
tightly closed glass container for 2
hours (1). After heating, the orange
colour of the potassium dichromate will
change to different shades of green
depending on the level of COD present
(1). The COD level can be measured by
comparing the colour obtained in the
water sample with a range of colours
obtained from known COD
concentrations (1). OR The COD level
can be measured by using a
spectrophotometer (1).
6
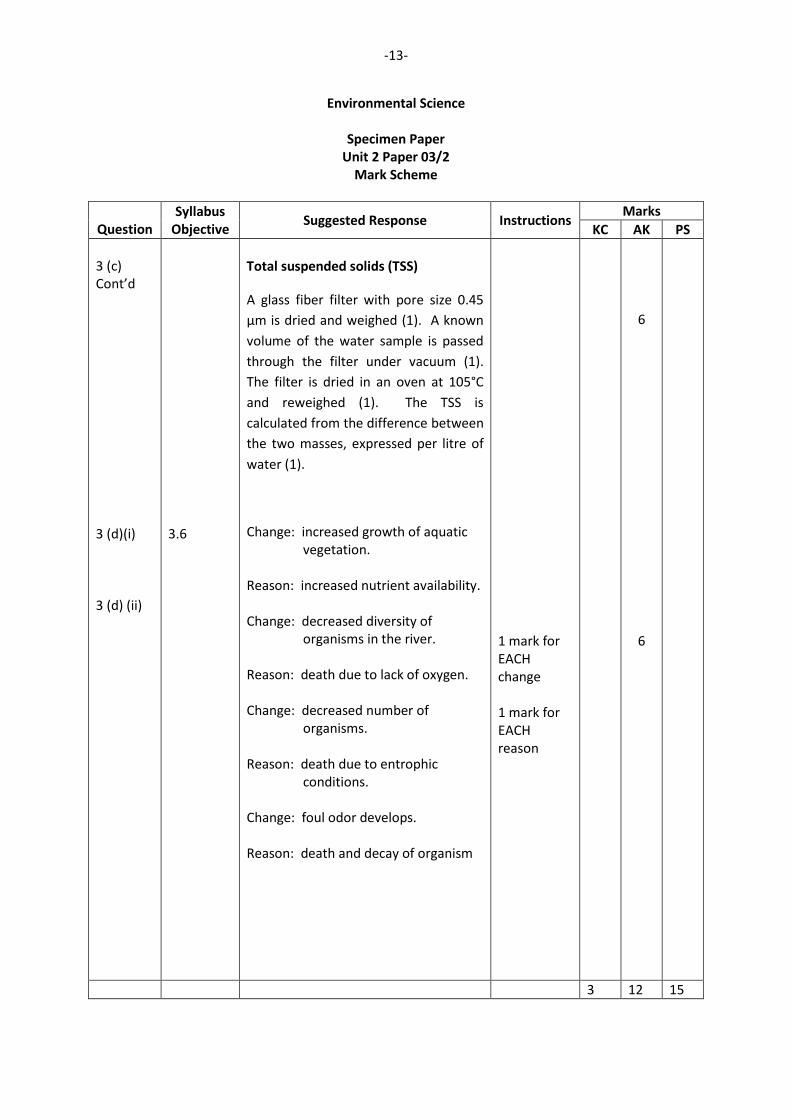
-13-
Environmental Science
Specimen Paper Unit 2 Paper 03/2
Mark Scheme
Question
Syllabus Objective
Suggested Response Instructions Marks
KC AK PS
3 (c) Cont’d 3 (d)(i) 3 (d) (ii)
3.6
Total suspended solids (TSS)
A glass fiber filter with pore size 0.45
µm is dried and weighed (1). A known
volume of the water sample is passed
through the filter under vacuum (1).
The filter is dried in an oven at 105°C
and reweighed (1). The TSS is
calculated from the difference between
the two masses, expressed per litre of
water (1).
Change: increased growth of aquatic vegetation. Reason: increased nutrient availability. Change: decreased diversity of organisms in the river. Reason: death due to lack of oxygen. Change: decreased number of organisms. Reason: death due to entrophic conditions. Change: foul odor develops. Reason: death and decay of organism
1 mark for EACH change 1 mark for EACH reason
6
6
3 12 15