applied mathematics - caribbean examinations council
TRANSCRIPT

CARIBBEAN EXAMINATIONS COUNCIL
REPORT ON CANDIDATES’ WORK IN THE
CARIBBEAN ADVANCED PROFICIENCY EXAMINATION®
MAY/JUNE 2012
APPLIED MATHEMATICS
Copyright © 2012 Caribbean Examinations Council
St Michael Barbados
All rights reserved.

2
GENERAL COMMENTS
The revised Applied Mathematics syllabus was examined this year for the fourth time. This is
a two-unit course comprising three papers. Paper 01, consisting of 45 multiple choice items,
and Paper 02, consisting of six essay questions were examined externally, while Paper 03 was
examined internally by class teachers and moderated by CXC. Contributions from Papers 01,
02 and 03 to each unit were 30 per cent, 50 per cent and 20 per cent, respectively.
Unit 1, Statistical Analysis, tested Collecting and Describing Data, Managing Uncertainty
and Analysing and Interpreting Data.
Unit 2, Mathematical Applications, tested Discrete Mathematics, Probability and Probability
Distributions and Particle Mechanics.
In 2012, the number of candidates writing the examinations for Units 1 and 2 were 672 and
237, respectively.
Approximately 80 per cent of the candidates registered for Unit 1, Statistical Analysis, and 83
per cent of the candidates registered for Unit 2, Mathematical Applications, obtained
acceptable grades, I–V. The standard of work seen from most of the candidates in this
examination was satisfactory.
In Unit 1, candidates appeared to be well prepared in Describing and Collecting Data and
somewhat in Managing Uncertainty, while Analysing and Interpreting Data seemed to be a
challenge for many candidates.
In Unit 2, candidates appeared to be well prepared in Discrete Mathematics and Probability
and Distributions. Particle Mechanics again seemed to be a challenge for many candidates.
Generally, candidates are still having difficulty with algebraic manipulations.
Overall, for Paper 031, the School-Based Assessment (SBA), students demonstrated a high
degree of mastery in the mathematical principles pertaining to the syllabus. In most cases,
the mathematical analyses were relevant and carried out with few flaws.
There was evidence of originality and creativity and projects were appropriately applied to
real-world problems and situations. Over 90 per cent of the students were able to effectively
communicate information in a logical way using correct grammar and mathematical
language.

3
DETAILED COMMENTS
UNIT 1
Paper 01 – Multiple Choice
Performance on the 45 multiple choice items on Paper 01 produced a mean score of 57.15,
standard deviation of 18.15 and scores ranging from 14 to 90.
Paper 02 – Essay
Module 1: Collecting and Describing Data
Question 1
This tested the candidates‟ ability to
distinguish between population and a sample, a census and a sample survey, a
parameter and a statistic
define a sample frame
distinguish between random and non-random samples
identify different sampling methods
calculate the number of items in a sample
construct a stem and leaf diagram
calculate the inter-quartile range
determine the median from a set of data.
Though this question was generally well done, many candidates could not identify cluster
sampling. Most candidates were able to identify systematic sampling.
Candidates had difficulty explaining the advantages of using different methods of sampling.
Most candidates were able to calculate the number of workers in the sample using option B.
For Part (b), many candidates could not give a definition for a sampling frame. For Part (c),
the stem and leaf diagram was generally well done, but then candidates could not state the
advantage of using the stem and leaf diagram.
In determining the median, candidates were able to state the location of the median, but did
not state the median.
Most candidates knew how to find the IQR, but many of them read the values for Q1 and Q3
incorrectly.

4
Answers
(a) (i) A: Cluster sampling, non-random
B: Stratified sampling, random
C: Systematic sampling, random
(ii) Not all workers will have a chance of being selected
(iii) Possibility of bias
(iv) 16 workers.
(b) (i) Sampling frame is a set of elements from the population from which the
sample is drawn
(ii) Households may not have a telephone
(ii) Only persons listening to the programme will call
(c) (i) Stem Leaf
4 0 2 7
5 3 6 7 8 8 9 9
6 0 1 2 3 4 6 7 9
7 1 4 4 5
8 1 2 2 key: 7|4 = 74
(ii) All data values are preserved
(iii) Median = 62; IQR = 15
Question 2
This question tested candidates‟ ability to
identify a population, census, sample, statistic, parameter
determine the mode and median from a frequency distribution
calculate the mean and the standard deviation from a frequency distribution
use cumulative frequency curves.

5
Calculation of the standard deviation was a problem since many candidates could not
correctly quote the formula for standard deviation.
Candidates also had problems identifying the normal distribution. Candidates used
descriptions such as „symmetric to left and to the right‟, „normally symmetric‟, „left skewed
normally‟.
Whereas candidates could read values from the graph, using the graph to calculate values
proved to be a challenge.
Answers
(a) Population, census, sample, statistics, parameter
(b) (i) Mode = 3, Median = 3
(ii) Mean = 3; SD = 1.48
(iii) The distribution is normal
(c) 350; 35; 7.14 per cent IQR = 14; x = 36.5 minutes
Module 2
Question 3
This question tested candidates‟ ability to
calculate the probability of (i) the union of two events: ( )P P Q and (ii) the
conditional probability of two events ( )P P Q
identify (i) independent and (ii) mutually exclusive events
solve probability problems
use a probability distribution table to obtain probabilities.
Parts (a) (i) a) was attempted by approximately 96 per cent of the candidates, with about 98
per cent giving a satisfactory response.
Part (a) (i) b) was attempted by approximately 96 per cent of candidates, with about 85 per
cent giving a satisfactory response. Some candidates gave the incorrect definition for
( ) ( ) ( )( )
( ) ( ) ( )
P R Q P R P QP R Q or or
P R P Q P R
.
Parts (a) (ii) a) and b) were attempted by approximately 96 per cent of candidates, with about
70 per cent giving a satisfactory response. Many candidates were unable to state their

6
answers in clear mathematical terminology (jargon) and provide correct reasons to support
their answers.
Parts (b) (i) a) and b) were attempted by approximately 90 per cent of candidates, with less
than 50 per cent providing satisfactory responses. Many candidates were unable to
distinguish between Parts (a) and (b). This indicated that candidates lack proper
understanding of the concept ( )P F E and ( )P E onlyor F only .
Part (b) (i) c) was attempted by approximately 90 per cent of candidates, with more than 80
per cent providing satisfactory responses. However, many candidates did not approximate
correctly to three significant figures.
For Part (b) (ii), most candidates were unable to identify the concept of combined probability;
as a result, less than 30 per cent of candidates who attempted this part provided satisfactory
responses.
Parts (c) (i) and (ii) were generally well done, with approximately 96 per cent of candidates
attempting and 98 per cent giving satisfactory responses. However, a few candidates were
unable to identify and use the correct formula for the mean; they attempted to divide the
mean by the total number of orders.
Answers
(a) (i) 0.88; 0.2 (ii) Not independent; Not mutually exclusive
(b) (i) 0.07; 0.65; 0.483 (ii) 0.21
(c) (i) 0.45 (ii) 6.48
Question 4
This question tested candidates‟ ability to
identify a binomial distribution and state its parameters
calculate probability using the binomial distribution
use the normal distribution to calculate probabilities.
Most candidates attempted Part (a) (i); however, the parameters in some cases were either
interchanged or incorrect. Some candidates were unable to state the distribution as binomial,
using normal notation instead.
In Part (a) (ii) a), most candidates attempted to use the formula; however, values used were
incorrectly substituted. In some cases, candidates incorrectly stated the formula
.

7
For Part (a) (ii) b), several candidates failed to use the property
In many instances was used.
The majority of candidates attempted Part (a) (iii) but did not do the entire question. They
were able to correctly use the formula for E[X].
For Part (b) (i), most candidates had a general understanding of standardizing; however, some
used the wrong values at times. Candidates who demonstrated an understanding of this
concept rounded off their values too early; this had an effect on their final answers. Some
also used continuity correction which was unnecessary. The remaining set of candidates was
unable to arrive at the correct answer because of standardizing using the variance rather than
standard deviation or finding the root of 14.5 in a few cases. Also, some candidates did not
know to subtract their value from 1. Another common mistake was misreading the values
from the table or adding values incorrectly; for instance, for (1.379) 0.9147 0.0014 the
expression 0.9147 + 0.14 was frequently seen.
In Part (b) (ii), some candidates were able to formulate the statement and
standardize; however, others read the table for (0.2) or even if they arrived at the correct
conclusion 1(0.8) , they could not read the tables successfully. Candidates were able to
derive the equation , but in the other cases
was seen.
Most candidates failed to accurately complete Part (b) (iii). Again, continuity correction was
commonly seen and many candidates were able to standardize but as in Part (b) (i),
candidates rounded off too early so again table values were incorrect. Also, candidates failed
to demonstrate an understanding of solving probabilities using the normal distribution. For
instance, ( 1.379 1.379) 2(1 (1.379))P Z was frequently observed.
Very few candidates had difficulty understanding what was required for Part (b) (iv). The
answer calculated in Part (b) (iii) was correctly used to solve this part of the question.
Answers
(a) Bin (12, 0.45); 0.0923; 0.999; 18
(b) 0.0839; 642.2; 0.8332; 54.

8
Module 3
Question 5
The question tested candidates‟ ability to
state the mean, variance and distribution of the mean, of the sample
calculate the probabilities that the sample mean is less than a given value
calculate a 98 per cent confidence interval for the mean length
calculate an unbiased estimate for the standard deviation
state the condition necessary for a valid use of a t-test to test the hypothesis about the
mean of x
state the null hypothesis H0 and an alternative hypothesis H1
apply a one-tailed test
determine the critical value from tables for a given test and level of significance
identify the critical region for a given test
state a valid conclusion of the given test.
In Part (a) (i), many candidates were able to correctly identify the normal distribution and
state the mean. However, they had difficulty identifying the variance.
In Part (a) (ii), many candidates used the incorrect value rather than . However, most of
them were able to read off the table values as well as apply 1 ( )z to calculate the
probabilities.
In Part (b), many candidates used a one-tailed test as opposed to the two-tailed test. Many
candidates also used the variance instead of the standard deviation. As a result, many
candidates did not obtain the interval (75.73, 76.07).
In Part (c) (i), many candidates were able to write a correct formula. However, depending on
the formula that they used, they did not use the factor. However, most candidates found
the square root of their answer.
Part (c) (ii) was well answered and most candidates were able to identify two conditions
necessary for the t-test; many candidates did not state that the distribution must be normal.
For Part (c) (iii) a), most candidates were able to set up the hypothesis correctly but neglected
to test for , for example, H0 : = 3.5 and H1 : < 3.5. Many candidates used statements
rather than symbols, but did not state that it was the mean battery life that was being tested.
Several candidates used a two-tailed test.

9
In Part (c) (iii) b), many candidates used their unbiased estimation from Part (c) (i) and
obtained an incorrect tcalc. Several candidates used in the denominator. Several candidates
obtained a positive value for tcalc because they used (3.5 - 3.4).
In Part (c) (iii), although many candidates were able to identify the correct degrees of
freedom and read the correct table value of 1.895, they did not identify the critical region.
In Part (c) (iii), most candidates were able to state whether the null hypothesis was rejected or
accepted, but could not interpret this with a valid conclusion.
Answers
(a)
49
712420
2.,NX ; 0.0491
(b) (75.73, 76.07)
(c) (i) 0.2; (ii) Small sample size, variance unknown, normal distribution (iii) Accept
H0: μ = 3.5; the advertisement is not overstating μ
Question 6
This question tested candidates‟ ability to
formulate a null hypothesis , and an alternative hypothesis
relate the level of significance of the probability of rejecting given that is true
determine the critical values from tables for a given test and level of significance
determine the degrees of freedom
determine probabilities from - tables
apply a test for independence in a contingency table
draw scatter diagrams to represent bivariate data
give a practical interpretation of the regression coefficient
draw the regression line of passing through on a scatter diagram
make estimations using the appropriate regression line.
This question was attempted by 95 per cent of the candidates. Eighty per cent of them
performed exceptionally well on this question.
For Part (a) (i), most candidates gave appropriate responses for the hypothesis. Few of the
candidates however misrepresented the null and the alternative hypothesis.
In Part (a) (ii), most candidates demonstrated the ability to calculate the degree of freedom
using the correct formula. Some candidates included the totals in their rows and columns
during their calculations.

10
In Part (a) (iii), candidates demonstrated their understanding of the critical region using either
a graphical or calculated approach. Some candidates, after identifying the critical value, did
not convert this to a critical region.
In Part (a) (iv), the majority of candidates was able to complete the table effectively. For Part
(a) (v), most candidates were able to give an appropriate conclusion using their results from
Part (a) (i) and (ii).
In Part (b) (i), the majority of candidates demonstrated their ability to plot six or more points
correctly. For Part (b) (ii) a), only a minority of candidates were able to demonstrate their
understanding of the x coefficient and its relationship to the rainfall at the two stations. In
Part (b) (ii) b), most candidates were able to state the formula for mean and use it correctly.
In Part (c), candidates were able to plot the mean on their graph but a significantly large
number of candidates were unable to draw the regression line correctly.
In Part (d), candidates demonstrated their knowledge to find y given x either graphically or by
calculations.
Answers
(a) χ2 ≥ 5.991, (v) reject H0; opinion is dependent of sex.
(b) (ii) For every 1 cm increase of rainfall at Station A there will be a 0.8 cm increase
at Station B
(iii) Mean rainfall at A = 4.3; Mean rainfall at B = 3.87
(c) y = 3.98
Paper 031 – School-Based Assessment (SBA)
Statistical Analysis
Approximately 80 per cent of students were able to score marks for project title and purpose.
If they did lose marks, it was because they failed to clearly state the variables used in the
study. Students are reminded to be concise in the statement of purpose. In some cases, the use
of statistical theory was limited by students‟ choice of topic. Students also displayed a lack of
creativity in topic selection.
A few students failed to secure the two marks allotted for data collection. In some cases the
method selected was not appropriate and often when appropriate, students failed to
adequately describe their choice. Most were able to describe the general method and select
an appropriate method but failed to describe its application adequately.

11
Students were able to get the three marks allotted to data presentation and demonstrated
adequate expertise in the use of statistical language, jargon and symbols. Marks were lost
because tables and charts were not labelled and in some cases were ambiguous.
Most students demonstrated fair statistical knowledge. Minor inaccuracies of statistical
concepts were identified and often overlooked by teachers. Teachers need to pay special
attention to the calculation of averages as well as the expected values for the chi-squared
distribution. In most cases, there was a logical flow of data and this was extended to the
discussion.
Approximately half of the students failed to relate their findings to the purpose of the project,
although all the calculations would have been completed. In many cases, this section was too
wordy. Students need to be concise in their conclusion. The conclusion must also be clearly
stated and must be related to the purpose of the project.
Students who refer to websites must make an effort to follow the accepted convention in a
consistent manner. Students must also make an effort to select reliable websites. Most books
listed were properly referenced. Students must endeavour to use multiple references.
Students‟ choice of font style and size made projects very difficult for reading. They are
urged to follow conventional formatting used in academic papers. (Times New Roman, font
size 12, double spacing, etc.)
Areas of Strengths and Weakness
Strengths
Recalling of basic definitions, for example, a sample, a population
Drawing a stem and leaf diagram
Reading values from the normal distribution, the chi square and the t-tables
Standardizing the normal distribution
Recognizing when the binomial distribution is to be used.

12
Weaknesses
Using independent events inappropriately
Calculating unbiased estimate of the standard deviation
Being unable to obtain a sample mean given the end points of a confidence interval
Being unable to define a critical region given the critical value
Interchanging the H0 and the H1 for the χ2 test
Determining when to use the t-test rather than the Z test
Failing to use three significant figures when giving answers.
Paper 032 – Alternative to School-Based Assessment
Scripts for ten candidates were marked and the overall performance was satisfactory.
Question 1
This question tested candidates' ability to
explain why sampling is necessary
determine what constitutes a population
identify sampling methods
distinguish between qualitative and quantitative data
construct a histogram from a grouped frequency distribution
determine the mode and median from grouped frequency distribution
calculate the mean and trimmed mean from a sample.
Marks for this question ranged from 7 to 17 with half of the candidates earning fewer than
ten marks and the other half earning ten or more marks. Completing the histogram and
calculating the mean were generally well done. Although candidates could easily identify the
modal and median class, they had difficulty stating the actual mode and median. Most
candidates had no idea what trimmed mean meant as they simply found ten per cent of the
mean calculated in the previous section of the question.

13
Answers
1. (a) (i) Impossible to identify the entire population
(ii) The ice-cream lovers in the island
(iii) Cluster
(iv) Qualitative
(b) (i) Individual data values are lost
(iii) Mode = 54.5 (iv) Median = 54.5
(c) (i) Mean = 218.47 (ii) Trimmed mean = 191.72
Question 2
This question tested candidates' ability to
list elements of a probability space
identify elements of an event
calculate the probability of event
recognise the conditions for using the binomial distribution
use the binomial distribution to calculate probability
use the normal distributions as an approximation for the binomial distribution.
For this question, marks ranged from 0 to 20. Four candidates performed poorly, obtaining
either zero or two marks and one candidate failed to respond to this question. The other five
candidates performed well with scores ranging from 14 to the maximum possible marks
obtainable, 20. Candidates who performed poorly obviously had no knowledge of this topic.
Candidates who did well generally had difficulty with Part (b) (ii) – using an appropriate
approximation for finding ( 340)P x .
Answers
(a) (i) 0.049 (ii) 0.347 (iii) 0.189
(b) (i) 0.240 (ii) 0.0032

14
Question 3
This question tested candidates' ability to
calculate unbiased estimates for the mean and the variance
formulate null and alternative hypotheses
evaluate the t-test statistic
apply the t-distribution in a hypothesis test of the mean and determine the validity of
the t-test
use the regression line to estimate values of y
calculate and interpret the product moment correlation coefficient.
Marks awarded for this question ranged from 1 to 20 with one candidate not providing a
response. Three candidates performed very well with scores of 18 or more, while all other
candidates got awarded scores of ten or fewer than ten. From the three questions in the paper,
this question had the poorest performance. The best performance was seen in Parts (a) (i) a)
and (b) (i). Candidates failed to differentiate between working with a sample and working
with a population. Although candidates had the formula and values for Part (b), these made
errors in substitution and simplification.
Answers
(a) (i) Mean = 13.33 ; SD = 5.35
(ii) Accept H0
(iii) Distribution must be normal
(b) (i) y = 48.35 (ii) r = 0.51; moderate, positive
The questions in this paper were of appropriate difficulty; adequate time was given to
candidates to complete the examination and the marks were appropriately allotted to the
various items. It is evident that some candidates were prepared for this paper while others
were unprepared and therefore performed poorly.

15
UNIT 2
Paper 01 – Multiple Choice
Performance on the 45 multiple-choice items on Paper 01 produced a mean score of 58.42,
standard deviation of 17.40 and scores ranging from 21 to 90.
Paper 02 – Essay
Question 1
This question tested candidates‟ ability to
derive and graph linear inequalities in two variables
determine whether a selected trial point satisfies a given inequality
determine the solution set that satisfies a set of linear inequalities in two variables
determine the feasible region of a linear programming
identify the objective function and constraints of a linear programming problem
determine a unique optimal solution (where it exists) of a linear programming
problem
formulate linear programming models in two variables from real-world data.
This question was attempted by the majority of candidates with about 60 per cent of them
providing satisfactory responses and 20 per cent getting a mark over 19.
In Part (a), few candidates achieved full marks as they were unable to define the variables
and as the number of backhoes of Type A and Type B respectively. Candidates were also
unable to reproduce the correct linear programming model with some candidates forgetting to
include the non-negative constraints, as well as to „maximize‟ the objective function.
In Part (b), many candidates were unable to represent the equations of the straight lines on the
Cartesian plane accurately. They were, however, able to shade the feasible region based on
the lines that were drawn.
Part (c) posed problems for candidates as they read the coordinates of the vertices
inaccurately, (0, 15) instead of (0, 16). Also one of the vertices ( did not contain
non-negative integers. Candidates approximated this vertex to (17, 8) which was found to lie
outside the feasible region. Many candidates were, however, able to attain the correct
number of each type of backhoe to give a maximum weight of the soil to be removed and the
maximum weight of the soil.

16
Answers
(a) (i) Maximize: P = 40x + 60y where x is the number of backhoes of Type A and y is the
number of backhoes of Type B
(ii) 50x + 20y ≤ 1000; 2x + 8y ≤ 128; x + y ≤ 25; x ≥ 0; y ≥ 0
(c) (i) 12 backhoes of Type A and 13 backhoes of Type B
(ii) The maximum weight of soil removed in one day = 1260 tonnes
Question 2
This question tested candidates‟ ability to
formulate simple propositions
determine if propositions are equivalent using truth tables
use the laws of Boolean algebra to simplify Boolean expressions
represent a Boolean expression by a switching or logic circuit.
Part (a) (i) was well done by the candidates. Most candidates obtained full marks. Part (a) (ii)
was also well done by the majority of candidates.
For Part (b), many candidates found it difficult to determine the truth value. Candidates used
truth tables to determine the answer. However, this method was not required. Candidates
need to spend more time with this type of proof.
For Part (c) (i), 80 per cent of the candidates were able to assign propositional statements.
However, only about 60 per cent were able to express the statement in symbolic form.
Problems encountered were missing brackets and incorrectly placed brackets.
For Part (c) (ii), candidates encountered problems simplifying logic symbolic statements and did
not change the OR to AND.
Candidates understood the concept of “NOT (NOT p)”.
For Part (d) (i), the majority of candidates obtained the correct solution. Many candidates
recognized the solution by carefully observing the diagram.
For Part (d) (ii), about 80 per cent of the candidates were able to construct the truth table
from Part d (i) above. Simple mistakes were made in obtaining “ ~ B C ”. Hence, this
affected their final result.
For Part (e), most candidates were able to draw the three logic gates. Weaker candidates did
not realize that the brackets should have been worked first in order to obtain the final correct
solution.
17
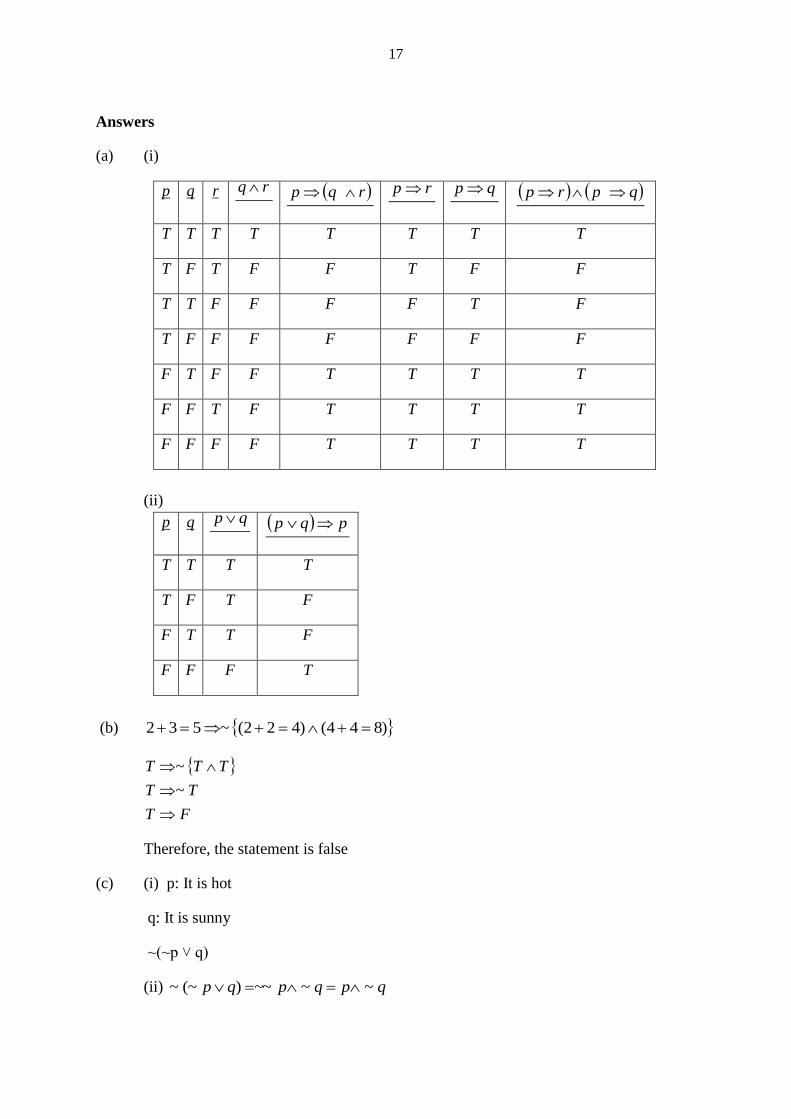
Answers
(a) (i)
p q r rq rqp rp qp qprp
T T T T T T T T
T F T F F T F F
T T F F F F T F
T F F F F F F F
F T F F T T T T
F F T F T T T T
F F F F T T T T
(ii)
p q qp pqp
T T T T
T F T F
F T T F
F F F T
(b) )844()422(~532
FT
TT
TTT
~
~
Therefore, the statement is false
(c) (i) p: It is hot
q: It is sunny
~(~p ˅ q)
(ii) qpqpqp ~~~~)(~~

18
(d) (i) A ˄ (~B ˅ C)
(ii)
A B C ~B CB~ )(~ CBA
1 1 1 0 1 1
1 1 0 0 0 0
1 0 1 1 1 1
1 0 0 1 1 1
0 1 1 0 1 0
0 0 1 1 1 0
0 0 0 1 1 0
The circuit is on when:
A is on, B is off and C is off
A is on, B is off and C is on
A is on, B is on and C is on
(e)

19
Module 2
Question 3
This question tested candidates' ability to
apply the properties of the probability density function f of a continuous random
variable X
calculate the expected value of a continuous function
calculate P(X ≥ 1)
use the cumulative distribution function
solve problems using the normal distribution with a continuity correction.
The question was generally well answered with over 65 per cent of candidates being awarded
a mark of 16 or more (out of 25 possible marks). Of these candidates, a little less than half
scored 20 marks or more.
Common errors made by several candidates were:
Poor handling of algebraic manipulation of equations obtained after integration in Part
(a) (i).
Improperly interpreting the interval for Part (a) (i) by treating the variable as discrete
rather than continuous
Failing to use the given function as a cumulative distribution function although this
was stated in Part (b),.
In Part (c) (ii), candidates failed to take the inverse of when required to solve the
equation )6732.0(3
16x 1
. Most candidates did not follow the instruction to give
the answer exactly or to three significant figures.
Answers
(a) (i) 3 1,64 4
a b
(ii) 57( 1)64
P X
(b) (i) 26125
(ii) 3.97

20
(c) (i) 0.0668 (ii) 17.3
Question 4
This question tested candidates‟ ability to
formulate and use the probability function f(x) = P(X = x)
apply the formula for probability using the Binomial distribution.
Nearly half of the candidates writing this paper were awarded scores higher than 15 out of the
25 possible marks. Close to 30 per cent of candidates did very well, obtaining scores of 20 or
more. A small number of candidates did not respond to this question and 35 per cent obtained
a score of ten or fewer than ten.
The question was set at an appropriate level of difficulty; however, some common errors
were:
Failing to take into account all the probabilities required by the question, especially
( 0)P X .
Inappropriately making an approximation using the normal or Poisson distributions
where the binomial was the appropriate distribution to use.
Making computational errors when calculating probabilities in Part (a) (iii).
Using an incomplete formula for calculating the variance.
The best responses were those given for Part (a) (ii).
Answers
(a) (ii) 4,5,6,7,8
(iii)
x 4 5 6 7 8
( )P X x 121
27
13
27
121
(iv) 6
(v) 0.976
(b) (i) 4 1620
4 0.04 0.96C (ii) 0.238

21
Module 3
Question 5
This question tested the candidates‟ ability to
calculate the coefficient of friction between an object and a surface
calculate the parallel force required to pull an object down an inclined plane at a
constant speed
calculate the total power output of the motion
verify the horizontal range of a projectile and then determine the maximum range and
the time of flight for a shell fired from a gun.
In Part (a) (i), candidates knew the formula F R , but applied it incorrectly.
Some candidates drew the 600 N force parallel to the horizontal instead of parallel to the
plane. Candidates need to read the questions carefully.
Part (a) (ii) presented a challenge to candidates. Some of them used the 600 N from
Part (a) (i). Candidates also had difficulty resolving forces parallel to the plane correctly.
Teachers need to remind students to draw force diagrams so they can get a visual
representation of what they are doing.
Part (b) was poorly done. Candidates did not recall that in the equation W Fd , the force
needed to be found in the direction of the motion.
In Part (c), candidates were required to know when to use 21
2v u at or s ut at . If they
set 0v in v u at , then they would get the time to reach the maximum height. Also, If
they set 0s in 21
2s ut at , then the non-zero value of t is the time of flight.
In conclusion, candidates need more independent practice in problem solving.
Answers
(a) (i) 0.517 (ii) 31.2 N
(c) (ii) 45
(iii) a) 12250 m b) 49.5 s

22
Question 6
This tested candidates‟ ability to calculate the
negative acceleration (deceleration) and substitute into an appropriate equation of
motion to find the velocity
velocity immediately after impact using the law of conservation of momentum
kinetic energy
constant force acting on the object
braking force using F ma and 2 2 2v u as .
In Part (a) (i), candidates incorrectly implemented the conservation of momentum. Some did
not negate the acceleration.
For Part (a) (ii), candidates incorrectly substituted the given velocity 6 ms-1
.
In Part (b), many candidates used the velocity from Part (a) to find the change in kinetic
energy instead of finding the final velocity using the equation v u at t and using it to find
the answer.
In Part (c), some candidates used the braking force as 3850 N instead of 3150 N. Some
forgot to negate the acceleration. The majority of candidates got an answer of 487 m as a
result of applying integration.
Answers
(a) (i) Velocity = 3.464 ms-1
(ii) Velocity = 5.83 ms-1
(b) (i) Change in kinetic energy = 3360 J (ii) The force = 24 N
(c) Minimum length of the runway = 595 m
Paper 031 – School-Based Assessment (SBA)
Mathematical Applications
Some students failed to identify the relevant variables as well as mathematical concepts to be
used in the statement of task and did not clearly state the method(s) being used, or provide an
adequate description of its use.
In the section Mathematical Knowledge and Analysis, most students were able to
successfully carry out simple mathematical processes and correctly interpret the resulting
data.

23
The evaluation section was poorly done. Approximately 75 per cent of students failed to
identify limitations and problems encountered during their study. Students were unable to
articulate how to rectify the problems that were encountered during their study.
On the other hand, students were able to obtain full marks in the communication of
information section. Many of them were able to articulate and present their findings in a
logical manner, and in most cases, using proper grammar.
Overall, teachers did a fairly good job in guiding students in topic selection, and in the
modelling of various experiments. However, attention must be paid to the assignment of
marks in the rubric provided. Teachers are reminded that fractional marks are not to be
awarded to students.
Allocation of Marks
Approximately 84 per cent of students were able to secure marks in the 41–60 range.
Approximately 60 per cent of all students sampled scored excellent grades in the SBA
(51–60).
Approximately five per cent of students scored under 31 marks out of a possible 60
marks.
Areas of Concern
About 20 per cent of students ignored the stipulated format for the presentation of the
project.
The statement of the task was not explicit enough in about 30 per cent of the projects.
Some students analysed the data before the data was even collected. As a result, some
tables were not clear, and many tables were presented without headings and without
reasons for their use.
Some students presented more data than was needed for their analysis.
Areas of Strength and Weakness
Strengths
Construction of the truth table.
Construction of a logic gate.
Identifying a feasible region.
Producing a linear programming model.
Working with resolving forces vertically and horizontally.

24
Weaknesses
The majority of students did not write their answers to three significant figures.
Few students used diagrams for the mechanics questions.
Motion in two directions, for example, forces perpendicular to each other.
Using the law of conservation of momentum too early to solve the problem.
Too often students omitted to identify variables.
Plotting straight lines.
Not recognizing that they should use integer values: too many used decimal values
Too often students did not identify logic assignments, for example, p: it is hot
Paper 032 – Alternative to School-Based Assessment
The seven candidates doing this paper performed poorly. Only one candidate performed
well. Understanding of the basic concepts was weak.
Module 1
Question 1
This question tested candidates' ability to
construct an activity network diagram
calculate earliest start time, latest start time and float time
identify the critical path in an activity network.
Candidates failed to demonstrate any understanding and synthesis of the graphical
representation of the project flow network and how to compute the values (earliest start time,
latest start time, float time) needed to determine the critical path and minimum completion
time.

25
Module 2
Question 2
This question tested candidates' ability to
solve problems involving probabilities of the normal distribution
calculate expected values
use the formula for a geometric distribution.
Candidates demonstrated a lack of understanding of basic probability concepts. Candidates
had an idea of the need to standardize but were unable to correctly carry out the desired
operation.
Answers
(a) (i) 0.252 (ii) 0.161 (iii) 80
(b) 0.913
(c) 0.36
Module 3
Question 3
This question tested candidates' ability to
resolve forces, on particles, in mutually perpendicular directions
calculate and use displacement, velocity, acceleration and time in simple equations
apply Newton‟s laws of motion
apply rates of change for velocity and acceleration.
Algebraic manipulation of the mechanics problem in Part (c), including the appropriate use of
integration, was extremely weak. Generally, candidates failed to demonstrate a grasp of basic
concepts in force, work and displacement. Most candidates used the incorrect function (sine)
instead of the correct trigonometric function (cosine) when resolving the resulting force.
Candidates mostly failed to identify the appropriate formula to use in computing for time in
Part (b). Candidates did not recognize the use of differentiation of the velocity to generate
the equation to find the time.

26
Answers
(a) W = 5280 J
(b) t = 35.7 s
(c) k = 0.1; a = 10 e-0.2s
.
Overall, the difficulty level of the questions was reasonable and appropriate for this level.
The time provided for solutions was adequate. The conceptual grounding of the candidates
(except one) attempting this paper was very weak.