environmental scan 2011 - home - productivity · pdf filethe changing landscape ... report of...
TRANSCRIPT
SERVICESKILLSA U S T R A L I AENVIRONMENTAL
TRENDS & INTELLIGENCE
SCAN2010
WHOLESALE, RETAIL & FLORISTRY SERVICES
2011
environmental scan 2011
ContentsIntroduction . . . . . . . . . . . . . . . . . . . . . . . . . . . . . . . . . . . . . . . . . . . . . . . . . . . . . . 1
The role of Service Skills Australia . . . . . . . . . . . . . . . . . . . . . . . . . . . . . . . . . . . 1Objectives . . . . . . . . . . . . . . . . . . . . . . . . . . . . . . . . . . . . . . . . . . . . . . . . . . . . . . . 1Key messages . . . . . . . . . . . . . . . . . . . . . . . . . . . . . . . . . . . . . . . . . . . . . . . . . . . . 2
Latest industry intelligence . . . . . . . . . . . . . . . . . . . . . . . . . . . . . . . . . . . . . . . . . 3The contribution of the industries . . . . . . . . . . . . . . . . . . . . . . . . . . . . . . . . . . . . 3
Retail and wholesale . . . . . . . . . . . . . . . . . . . . . . . . . . . . . . . . . . . . . . . . . . . . 3Floristry . . . . . . . . . . . . . . . . . . . . . . . . . . . . . . . . . . . . . . . . . . . . . . . . . . . . . . . 4
Nature of the workforce . . . . . . . . . . . . . . . . . . . . . . . . . . . . . . . . . . . . . . . . . . . . 6Retention . . . . . . . . . . . . . . . . . . . . . . . . . . . . . . . . . . . . . . . . . . . . . . . . . . . . . 8Small and medium enterprises . . . . . . . . . . . . . . . . . . . . . . . . . . . . . . . . . . . . 9Enterprise Based Productivity Places Program (EBPPP) . . . . . . . . . . . . . . . 10
Regional aspects . . . . . . . . . . . . . . . . . . . . . . . . . . . . . . . . . . . . . . . . . . . . . . . . 11Macro-environment factors . . . . . . . . . . . . . . . . . . . . . . . . . . . . . . . . . . . . . . . . 14
The changing landscape . . . . . . . . . . . . . . . . . . . . . . . . . . . . . . . . . . . . . . . . 14Growing population . . . . . . . . . . . . . . . . . . . . . . . . . . . . . . . . . . . . . . . . . . . . 14Ageing population . . . . . . . . . . . . . . . . . . . . . . . . . . . . . . . . . . . . . . . . . . . . . 15Economic factors . . . . . . . . . . . . . . . . . . . . . . . . . . . . . . . . . . . . . . . . . . . . . . 15Sustainability . . . . . . . . . . . . . . . . . . . . . . . . . . . . . . . . . . . . . . . . . . . . . . . . . 16Business trends . . . . . . . . . . . . . . . . . . . . . . . . . . . . . . . . . . . . . . . . . . . . . . . 17Technology . . . . . . . . . . . . . . . . . . . . . . . . . . . . . . . . . . . . . . . . . . . . . . . . . . . 18
Identified workforce development needs . . . . . . . . . . . . . . . . . . . . . . . . . . . . . 19Qualifications . . . . . . . . . . . . . . . . . . . . . . . . . . . . . . . . . . . . . . . . . . . . . . . . . 20Institutional delivery . . . . . . . . . . . . . . . . . . . . . . . . . . . . . . . . . . . . . . . . . . . 20Assessment practice . . . . . . . . . . . . . . . . . . . . . . . . . . . . . . . . . . . . . . . . . . . 20Quality delivery – industry’s contribution . . . . . . . . . . . . . . . . . . . . . . . . . . . 21Completion rates . . . . . . . . . . . . . . . . . . . . . . . . . . . . . . . . . . . . . . . . . . . . . . 22Core skills . . . . . . . . . . . . . . . . . . . . . . . . . . . . . . . . . . . . . . . . . . . . . . . . . . . . 23
Suggested approaches to workforce development . . . . . . . . . . . . . . . . . . . . . 24Discuss, Display, Do – a new model for the recognition of prior learning . 24VET in schools . . . . . . . . . . . . . . . . . . . . . . . . . . . . . . . . . . . . . . . . . . . . . . . . 25Integrating higher education and VET into the retail sector . . . . . . . . . . . . 26
Current impact of training packages . . . . . . . . . . . . . . . . . . . . . . . . . . . . . . . . . 27
Future directions for endorsed components of training packages . . . . . . . . . 30SFL10 Floristry Training Package . . . . . . . . . . . . . . . . . . . . . . . . . . . . . . . . . . . 30SIR07 Retail Services Training Package . . . . . . . . . . . . . . . . . . . . . . . . . . . . . . 30
Appendix A – Report of continuous improvement . . . . . . . . . . . . . . . . . . . . . . 32
Appendix B – Definition of core skills and core skill levels . . . . . . . . . . . . . . . 34
Appendix C – Retail, wholesale and floristry occupations in demand . . . . . . 38
Endnotes . . . . . . . . . . . . . . . . . . . . . . . . . . . . . . . . . . . . . . . . . . . . . . . . . . . . . . . . 39
This document supports the Service Skills Australia 2011 Environmental Scan .For information on trends in other service industries, see our Environmental Scan findings for:
Community Pharmacy• Funeral Services• Hairdressing and Personal Services• Sport, Fitness, Community and Outdoor Recreation• Tourism, Hospitality and Events .•
All of these documents can be viewed and downloaded from our website, www.serviceskills.com.au
© 2011 published by Service Skills Australia
Retail, Wholesale and Floristry Services environmental scan 2011 1.
introduction
the role of service skills australiaService Skills Australia (SSA) is the Industry Skills Council for the service industries . Skills councils are the recognised national bodies providing advice to government and industry on industry training and skill development needs .
SSA is an independent, not-for-profit body, managed by industry members and funded by the Australian government . The strategic goals of SSA, developed in partnership with the industries, are to:
develop a culture within the service industries which promotes • and enhances the skills development of its workforce
develop policies, programs and services, including industry • training packages, that support industry needs in relation to skills and workforce development
achieve quality skills outcomes throughout the service industries•
produce quality workforce development information and use • industry intelligence to inform decision making .
SSA represents the interests of businesses across sectors, including tourism, hospitality and events; sport, fitness and recreation; and retail, wholesale and personal services .
objectivesThis environmental scan provides an industry-specific overview of current and future trends and developments in the retail, wholesale and floristry industries in relation to workforce development and vocational education and training (VET) . Developed in partnership with industry and based on data mostly collected between February and December 2010, the scan reflects key issues and provides information on current and future skill demands, and their context, to inform the continuous improvement of SSA’s suite of skills and workforce development strategies, including training packages .
2. service skills australia
key messagesSSA’s Environmental Scan 2010 advocated for skill development in the right way and in the right timeframe . Skill development needs to occur in a way that ensures that the right skills are being developed for the job outcome, context of learners, and learners’ work circumstances1 . These issues are still valid and current .
There is a lack of recognition of the significant contribution that the retail, wholesale and floristry sectors bring to the Australian economy.
This key message from 2010 scan is still current . Policy settings will need to recognise the strong linkages between the service industries and other industrial sectors in order to ensure sustainable workforce, communities and national economy .
Businesses and employees in the retail, wholesale and floristry industries bear the consequence of a broad misconception that their industries comprise low-skilled workers with a lesser need for support and resourcing to develop skills . Consequences may be seen to include poor funding support, lack of recognition of careers in the industry, and ongoing issues in the quality of training and assessment delivered by some providers .
Driven by changes in consumer trends and the demographics of the Australian and international population, the nature of the industries is changing . The complexity of the businesses, organisations and workforce that make up the industries needs to be understood by skill markets and policy makers to avoid a ‘one size fits all’ response to productivity and participation outcomes .
Any consideration of strategies to improve the capability of the retail, wholesale and floristry workforce needs to be predicated on a clear understanding of these changes . Engagement with the retail sector over the last 12 months has identified the following areas of priority.
There is an ongoing challenge to attract skilled labour and improve 1 . the perception of the industry .
Industry have identified challenges in retaining a skilled 2 . workforce , including improving succession planning to ensure the development of the next set of leaders for a sustainable industry .
“There is a lack
of recognition of
the significant
contribution that the
retail, wholesale and
floristry sectors bring
to the Australian
economy.”
Retail, Wholesale and Floristry Services environmental scan 2011 3.
latest industry intelligencethe contribution of the industries
Retail and wholesale
The retail and wholesale industries are made up of mainly small and medium sized businesses . In 2009 they included almost 215,500 businesses2 and supported a large number of small and medium enterprises (SMEs), large employers as well as retail chains and franchising companies .
The contribution of the wholesale trade to Australia’s gross domestic product (GDP) for 2009-10 was AUD57 .9 billion (4 .8%), with a similar figure of over AUD53 billion (4.4%) for the retail trade sector3 .
Businesses in the industries cover a wide range of formats, such as supermarkets, department stores, discount department stores, speciality chains, commission-based retail and convenience stores .
The concentration of businesses varies between retail sub-sectors . The department store segment shows a high level of concentration, with key retailers holding 95% of market share . Medium levels of concentration exist in takeaway food, footwear and domestic appliance retailing . Low levels of concentration are found in the liquor, sport, camping equipment and photographic equipment retailing sectors4 .
Projected growth varies across the retail sector . In the four years to 2014-15 employment in the retail trade industry is expected to grow at an average rate of 1 .8% per annum, which equates to around 106,600 new jobs . Supermarket and grocery stores and clothing, footwear and accessory retailers are expected to have the strongest annual employment growth at 3 .3% per annum in the four years to 2014-15, followed by hardware, building and garden supplies retail (3 .1% per annum) . Negative employment growth is projected for department stores (-0 .3%) and commission-based retail (buying and selling, -0 .8%)5 .
In the four years to 2014-15, employment in wholesale trade is expected to increase at an average rate of .5% per annum, which equates to a rise of around 11,300 jobs over the period6 .
Besides economic factors, the value of the retail and wholesale industries for Australia’s economy and population cannot be under-estimated . These industries provide the first job for many Australians, be it part-time during studies or as a first full-time job7 . They provide the foundation for the basic work-related skills and knowledge of many individuals for their ongoing careers, whether in the service industries or outside them .
4. service skills australia
Floristry
Throughout Australia, flower retailers are an example of low volatility (volatility calculated through total number of entries and business closures as a percentage of the total business count) . Industry revenue volatility can depend on such factors as changes in consumer sentiment and changes in the cost of inputs . Strong increases in consumer sentiment or discretionary income will facilitate greater expenditure on floriculture products. Similarly, higher input prices will also lead to greater revenue as higher prices are passed on to the final consumer (although the extent to which this occurs depends on the degree of competition between flower retailers). However, given that these factors usually change gradually, overall revenue volatility is low. It’s worth noting that while consumer sentiment has varied significantly in recent years, these changes are often offset by changes in monetary and fiscal policy8 .
The floristry industry is dominated by small businesses with less than 20 employees and shows a low level of concentration . There is a degree of price/quality segmentation, depending on location and customer base .
Florists are thought to derive around 55% of their revenue from floral arrangements, 20% from cut flowers, 10% from plants and 15% from delivery services and other merchandise9 . The majority of florists have expanded their product range to include non-floral items and other merchandise, such as chocolates, gift cards, balloons, or champagne, which are often combined with floral arrangements.
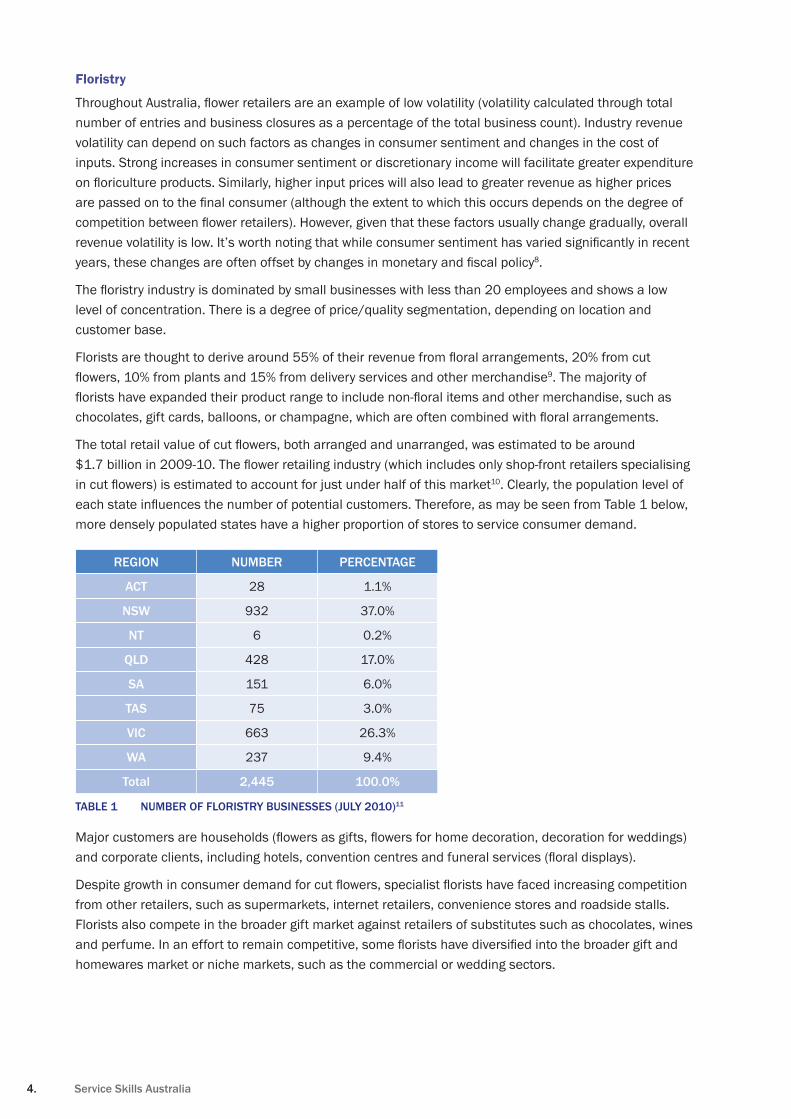
The total retail value of cut flowers, both arranged and unarranged, was estimated to be around $1.7 billion in 2009-10. The flower retailing industry (which includes only shop-front retailers specialising in cut flowers) is estimated to account for just under half of this market10 . Clearly, the population level of each state influences the number of potential customers. Therefore, as may be seen from Table 1 below, more densely populated states have a higher proportion of stores to service consumer demand .
region number Percentage
act 28 1 .1%
nsW 932 37 .0%
nt 6 0 .2%
Qld 428 17 .0%
sa 151 6 .0%
tas 75 3 .0%
vic 663 26 .3%
Wa 237 9 .4%
total 2,445 100.0%
number of floristry businesses (july 2010)table 1 11
Major customers are households (flowers as gifts, flowers for home decoration, decoration for weddings) and corporate clients, including hotels, convention centres and funeral services (floral displays).
Despite growth in consumer demand for cut flowers, specialist florists have faced increasing competition from other retailers, such as supermarkets, internet retailers, convenience stores and roadside stalls . Florists also compete in the broader gift market against retailers of substitutes such as chocolates, wines and perfume. In an effort to remain competitive, some florists have diversified into the broader gift and homewares market or niche markets, such as the commercial or wedding sectors .
Retail, Wholesale and Floristry Services environmental scan 2011 5.
Engagement with industry has also identified an increasing skill need in floral design and leadership to support sustainable business in a highly competitive market .
Industry feedback to SSA has identified that consumer trends have changed significantly over the last decade, with an increasing migration from the traditional sales channels of retail florist shop fronts and telephone orders to online retail . This change in consumer habits has necessitated changes in the way floristry businesses interact with their customers and overall markets. Today’s retail florist businesses and staff require increasing knowledge and skills in information technology to manage, monitor and maintain business operations to cater to this trend. Over the past five years, revenue growth has primarily been driven by increasing costs of cut flowers. Higher cut-flower production costs have driven this, due to rising prices of transport, fertilisers and other inputs into cut-flower production. In 2008-09, growth in these costs began to slow, while some costs declined, and industry revenue growth slowed to 3 .4% . In addition, consumer sentiment was battered by instability in the stock market and a significant slowdown in the Australian economy. In 2009-10, poor macroeconomic conditions are expected to persist, while growth in wholesale flower prices is expected to be low. The industry is forecast to grow by a further 1 .2% in 2009-1012 .
6. service skills australia
nature of the WorkforceIn November 2010 the sector employed around 1 .5 million people, of which approximately 43% worked part-time13 . Traditionally, the industry workforce has a high percentage of casual employees .
In the wholesale industry:
The workforce is predominantly male . In the year to February 2010, the male share of employment in • the industry was 67 .9% compared with the average of 54 .4% for all industries .
Employment is largely full-time, with only 17% of workers being employed on a part-time basis . •
Compared with other industries, the wholesale industry has an above average share of ‘prime age’ • workers, aged 25 to 44 . 47 .6% of the wholesale workforce was part of this age group in 2009 . In contrast, the share of employed younger workers, aged 15 to 24, was below the average for all industries (11 .3% compared with 16 .8% for all industries)14 .
In the retail industry:
1 .175 million people are employed as at February 2010 (or 10 .7% of the total workforce), making it the • largest employing industry in the Australian economy .
Employment is dominated by female workers . 56 .2% of the retail workforce is female, compared to • 45 .6% for all industries . There is a large share of female part-time employees (33 .8%) and a smaller share of male full-time workers in the industry (29 .3%) .
72 .5% of the workforce is aged under 45 years, and a relatively low 27 .6% are aged 45 years and older . • This reflects a high proportion of youth employment, with many working part-time while in full-time education .
Just under 36% of the workforce are aged 24 and younger, with 19 .1% of the workforce being made up • of people aged 15 to 19 .
The median age of workers in 2009 was 32, and it has the second lowest percentage of workers aged • 45 years and over .
In May 2009, 59.1% of workers were employed in the industry without a non-school qualification, • compared with 38 .7% for all industries15 .
Compared to the rest of the workforce, only a minority of workers in the sector hold qualifications (39 per cent in 2008), but the proportion holding qualifications has been increasing. Retail managers (50 per cent) were among the most likely to hold qualifications and retail assistants (28 per cent) and checkout operators (23 per cent) were least likely to hold qualifications.
Half of all retail managers held qualifications in 2008, an increase of 7 percentage points from 2002. A significant number of them held qualifications at the degree or higher level16 .
In 2010, Service Skills Australia engaged the Centre for the Economics of Education and Training to undertake a research project to report on the productivity growth in the service industries . The report focuses on four industry categories: wholesale services; retail services; accommodation and food services; and art and recreation services .
Retail, Wholesale and Floristry Services environmental scan 2011 7.
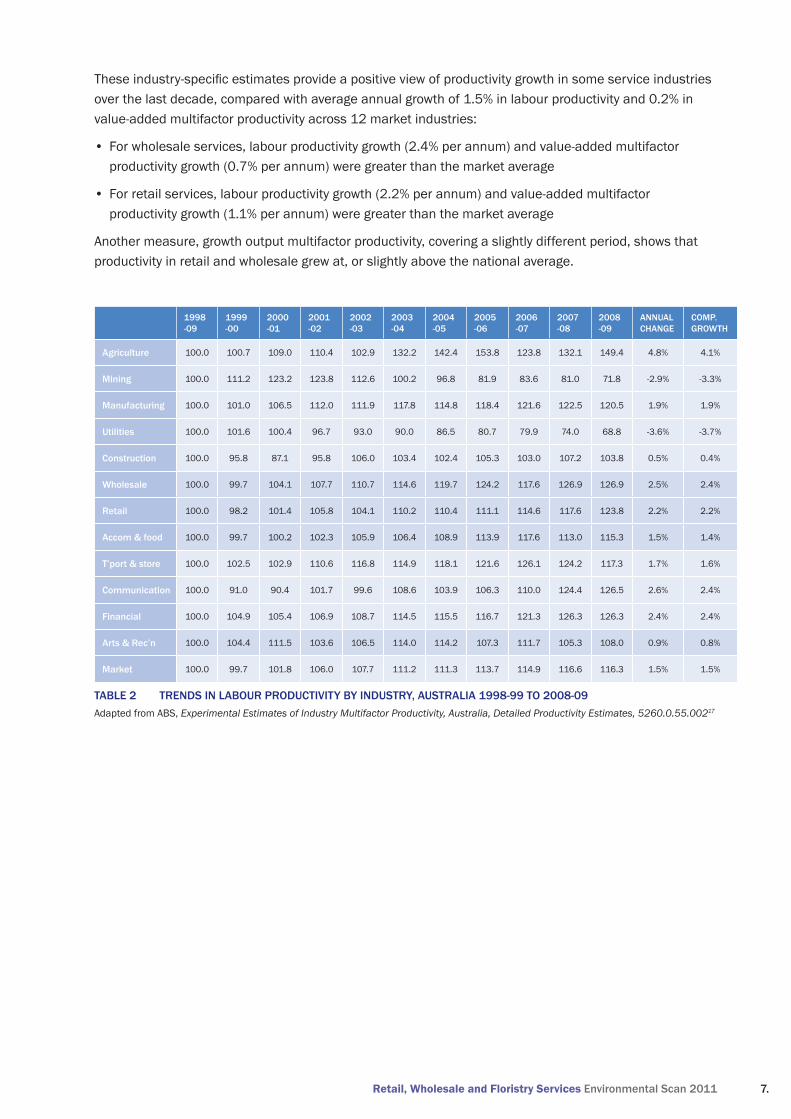
These industry-specific estimates provide a positive view of productivity growth in some service industries over the last decade, compared with average annual growth of 1 .5% in labour productivity and 0 .2% in value-added multifactor productivity across 12 market industries:
For wholesale services, labour productivity growth (2 .4% per annum) and value-added multifactor • productivity growth (0 .7% per annum) were greater than the market average
For retail services, labour productivity growth (2 .2% per annum) and value-added multifactor • productivity growth (1 .1% per annum) were greater than the market average
Another measure, growth output multifactor productivity, covering a slightly different period, shows that productivity in retail and wholesale grew at, or slightly above the national average .
1998 -09
1999 -00
2000 -01
2001 -02
2002 -03
2003 -04
2004 -05
2005 -06
2006 -07
2007 -08
2008 -09
annual change
comP. groWth
agriculture 100 .0 100 .7 109 .0 110 .4 102 .9 132 .2 142 .4 153 .8 123 .8 132 .1 149 .4 4 .8% 4 .1%
mining 100 .0 111 .2 123 .2 123 .8 112 .6 100 .2 96 .8 81 .9 83 .6 81 .0 71 .8 -2 .9% -3 .3%
manufacturing 100 .0 101 .0 106 .5 112 .0 111 .9 117 .8 114 .8 118 .4 121 .6 122 .5 120 .5 1 .9% 1 .9%
utilities 100 .0 101 .6 100 .4 96 .7 93 .0 90 .0 86 .5 80 .7 79 .9 74 .0 68 .8 -3 .6% -3 .7%
construction 100 .0 95 .8 87 .1 95 .8 106 .0 103 .4 102 .4 105 .3 103 .0 107 .2 103 .8 0 .5% 0 .4%
Wholesale 100 .0 99 .7 104 .1 107 .7 110 .7 114 .6 119 .7 124 .2 117 .6 126 .9 126 .9 2 .5% 2 .4%
retail 100 .0 98 .2 101 .4 105 .8 104 .1 110 .2 110 .4 111 .1 114 .6 117 .6 123 .8 2 .2% 2 .2%
accom & food 100 .0 99 .7 100 .2 102 .3 105 .9 106 .4 108 .9 113 .9 117 .6 113 .0 115 .3 1 .5% 1 .4%
t’port & store 100 .0 102 .5 102 .9 110 .6 116 .8 114 .9 118 .1 121 .6 126 .1 124 .2 117 .3 1 .7% 1 .6%
communication 100 .0 91 .0 90 .4 101 .7 99 .6 108 .6 103 .9 106 .3 110 .0 124 .4 126 .5 2 .6% 2 .4%
financial 100 .0 104 .9 105 .4 106 .9 108 .7 114 .5 115 .5 116 .7 121 .3 126 .3 126 .3 2 .4% 2 .4%
arts & rec’n 100 .0 104 .4 111 .5 103 .6 106 .5 114 .0 114 .2 107 .3 111 .7 105 .3 108 .0 0 .9% 0 .8%
market 100 .0 99 .7 101 .8 106 .0 107 .7 111 .2 111 .3 113 .7 114 .9 116 .6 116 .3 1 .5% 1 .5%
trends in labour Productivity by industry, australia 1998-99 to 2008-09table 2 Adapted from ABS, Experimental Estimates of Industry Multifactor Productivity, Australia, Detailed Productivity Estimates, 5260.0.55.00217
8. service skills australia
1998 -09
1999 -00
2000 -01
2001 -02
2002 -03
2003 -04
2004 -05
2005 -06
2006 -07
2007 -08
2008 -09
annual change
comP. groWth
agriculture 100 .0 104 .1 110 .0 112 .5 94 .6 119 .0 124 .4 128 .8 106 .7 113 .3 129 .2 3 .3% 2 .6%
mining 100 .0 104 .8 113 .3 111 .8 106 .9 98 .0 97 .7 89 .8 89 .1 82 .5 75 .2 -2 .7% -2 .8%
manufacturing 100 .0 99 .7 103 .0 106 .3 107 .1 108 .6 104 .5 103 .6 104 .3 104 .7 99 .1 -0 .1% -0 .1%
utilities 100 .0 98 .9 97 .9 95 .7 93 .5 90 .4 87 .1 83 .4 80 .8 75 .4 72 .9 -3 .1% -3 .1%
construction 100 .0 98 .2 86 .8 95 .1 105 .7 105 .1 104 .1 107 .2 105 .7 108 .4 103 .5 0 .5% 0 .3%
Wholesale 100 .0 99 .9 101 .8 104 .3 106 .1 106 .8 107 .9 108 .9 104 .1 108 .0 106 .9 0 .7% 0 .7%
retail 100 .0 98 .4 99 .7 104 .0 102 .5 106 .8 106 .2 105 .2 107 .6 109 .0 111 .7 1 .1% 1 .1%
accom & food 100 .0 99 .8 100 .4 100 .7 102 .7 102 .6 104 .0 106 .1 107 .2 102 .9 102 .7 0 .3% 0 .3%
t’port & store 100 .0 102 .2 103 .3 108 .6 113 .9 112 .7 115 .7 117 .5 121 .0 120 .1 113 .0 1 .3% 1 .2%
communication 100 .0 93 .5 91 .4 94 .3 94 .6 97 .6 94 .4 94 .8 96 .1 101 .2 98 .1 -0 .1% -0 .2%
financial 100 .0 103 .2 101 .9 102 .6 102 .2 106 .1 106 .0 108 .0 113 .8 117 .1 115 .0 1 .4% 1 .4%
arts & rec’n 100 .0 102 .0 106 .2 100 .1 102 .0 107 .4 108 .2 103 .7 107 .5 103 .1 105 .9 0 .6% 0 .6%
market 100 .0 99 .8 99 .9 102 .7 103 .5 105 .4 104 .6 104 .7 104 .7 104 .6 101 .7 0 .2% 0 .2%
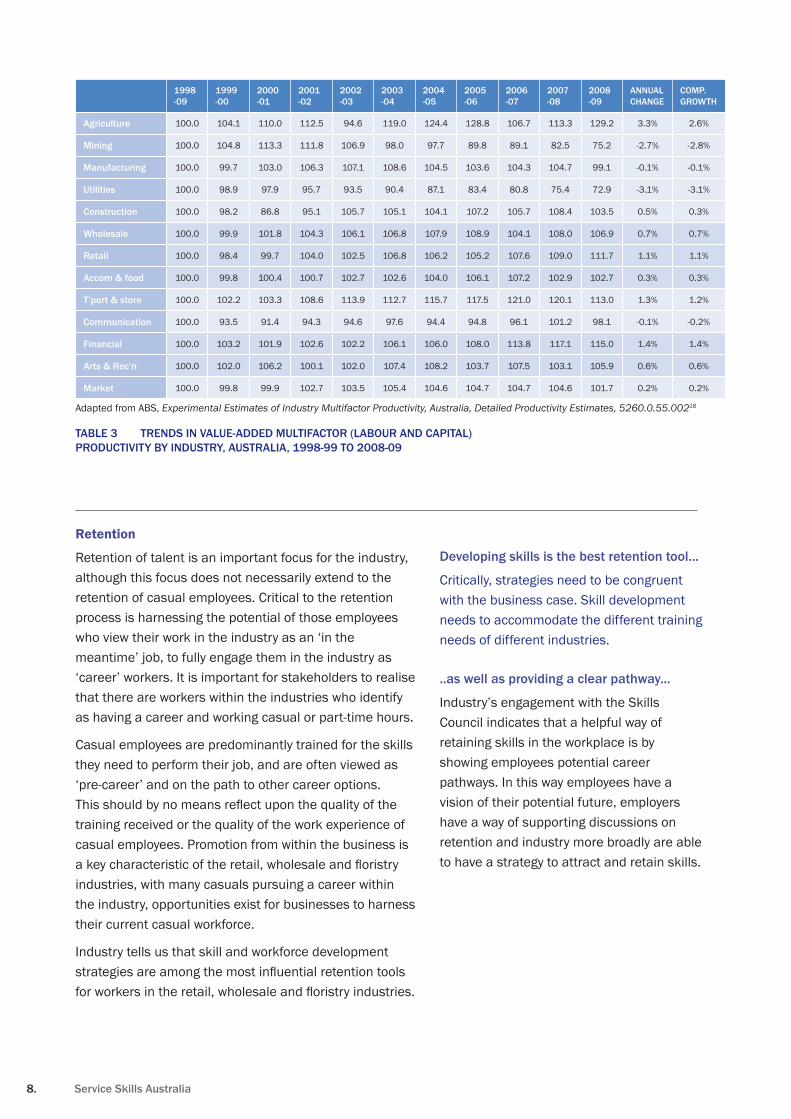
Adapted from ABS, Experimental Estimates of Industry Multifactor Productivity, Australia, Detailed Productivity Estimates, 5260.0.55.00218
trends in value-added multifactor (labour and caPital) table 3 Productivity by industry, australia, 1998-99 to 2008-09
Retention
Retention of talent is an important focus for the industry, although this focus does not necessarily extend to the retention of casual employees . Critical to the retention process is harnessing the potential of those employees who view their work in the industry as an ‘in the meantime’ job, to fully engage them in the industry as ‘career’ workers . It is important for stakeholders to realise that there are workers within the industries who identify as having a career and working casual or part-time hours .
Casual employees are predominantly trained for the skills they need to perform their job, and are often viewed as ‘pre-career’ and on the path to other career options . This should by no means reflect upon the quality of the training received or the quality of the work experience of casual employees . Promotion from within the business is a key characteristic of the retail, wholesale and floristry industries, with many casuals pursuing a career within the industry, opportunities exist for businesses to harness their current casual workforce .
Industry tells us that skill and workforce development strategies are among the most influential retention tools for workers in the retail, wholesale and floristry industries.
developing skills is the best retention tool…
Critically, strategies need to be congruent with the business case . Skill development needs to accommodate the different training needs of different industries .
..as well as providing a clear pathway...
Industry’s engagement with the Skills Council indicates that a helpful way of retaining skills in the workplace is by showing employees potential career pathways . In this way employees have a vision of their potential future, employers have a way of supporting discussions on retention and industry more broadly are able to have a strategy to attract and retain skills .
Retail, Wholesale and Floristry Services environmental scan 2011 9.
Small and medium enterprises
There is evidently a range of qualities that successful businesses must have to effectively build and sustain their operations . To a certain extent, big business has the ability to sustain a range of systems and processes to underpin growth and longevity and these must be constantly attended to . Business success is often predicated on an ability to think and work through to a long-term vision rather than a short-term vision .
SSA believes that a key role of government should be to provide advice and support to SMEs to support the development of skills and systems to improve productivity .
Leaders and managers of SMEs fulfil a wide range of roles and so require a variety of skills. The global financial crisis (GFC) highlighted the need for managers to have a greater knowledge and understanding of financial matters, technology, business planning and human resource management . SSA’s 2010 Environmental Scan for Wholesale, Retail and Floristry reported industry feedback that strongly supported the need for managers to have a better understanding of the global economy and how it relates to their businesses, and to have financial management skills to understand business processes that maintain profitability19; this remains the case in 2011 .
The importance of having succession plans in place and the need for succession planning to be included in management training were identified by industry to be important . Effective succession planning reduces the time and expense by employers when continually recruiting, and increases staff motivation through training opportunities and advancement within the business .
Leadership and management skills benefit far more than the business bottom line . Human resource management skills are critical to managing workforces with diverse needs and improving their productivity and morale, which in turn can improve individual and social wellbeing and so contribute to socioeconomic mobility and economic growth . To be effective, training for managers in broad areas of finance and human resource in the retail, wholesale and floristry industries requires a long-term approach. Convincing employers that training at Certificate IV and Diploma levels is necessary for relevant existing workers may be a way of starting the process . While this may be relatively easy for large businesses, it will be more difficult for smaller businesses where the employer is also the manager .
“Effective succession
planning reduces the
time and expense
by employers when
continually recruiting,
and increases staff
motivation through
training opportunities
and advancement within
the business.”
10. service skills australia
Enterprise Based Productivity Places Program (EBPPP)
The returns on investment for training in the service industries is evidenced through the Enterprise Based Productivity Places Program (EBPPP) and delivers returns for the broader economy, as illustrated by the productivity figures outlined earlier in this report. Learning adopted by an owner and implemented in their business can have a significant multiplier effect – be it related to productivity, skills utilisation and/or financial return.
In round one of the program, SSA received 1020 funded training places, which included 396 for the WRAPS sector . In round two, SSA received a further 186 places, which gave WRAPS a cumulative total of 456 (38%) places .
SSA promoted the program across its network and highlighted the opportunity for:
Micro and small business participation•
The inclusion of traditionally non-funded cohorts (owners, self-employed, • casuals, part-timers without adequate hours to access traineeships, existing qualifications etc.)
building sector and geographic capacity•
Identifying and responding to a community of interest i .e . the option for • communities/enterprises/associations to identify needs beyond the traditional scope of one Industry Skills Council
Driving the relationship between training (and RTOs) and enterprise to • generate value-add .
EBPPP places employers at the centre of the exercise, where their needs determined responses from the supply side of the equation (RTOs) . Additionally, flexibility around eligibility realised a major engagement with business owners who demonstrated their skills to drive productivity and innovation . Learners who are business owners/self-employed have been targeted for return on investment case studies to be submitted upon completion . These case studies will provide an overview of what training and assessment services were delivered, what business needs were addressed and what measurable impact the combination achieved . The results will reinforce the notion that small businesses are a significant contributor to the economy and workforce .
Retail, Wholesale and Floristry Services environmental scan 2011 11.
regional asPectsWhile broad conclusions may be made about certain sections of the service industries, it is crucial to the nation’s workforce development not to homogenise workforce development responses .
Not unexpectedly, not every national trend is reflected at state level. Even within a state, there are regional variations based on the health of the industries, demographic trends (employment, growth, ageing, migration, etc .) and local economic drivers .
Usually, overall share of retail trade revenue generated by each state is correlated to:
number of stores operating in region•
consumer demand for specific goods in state•
population share of state .•
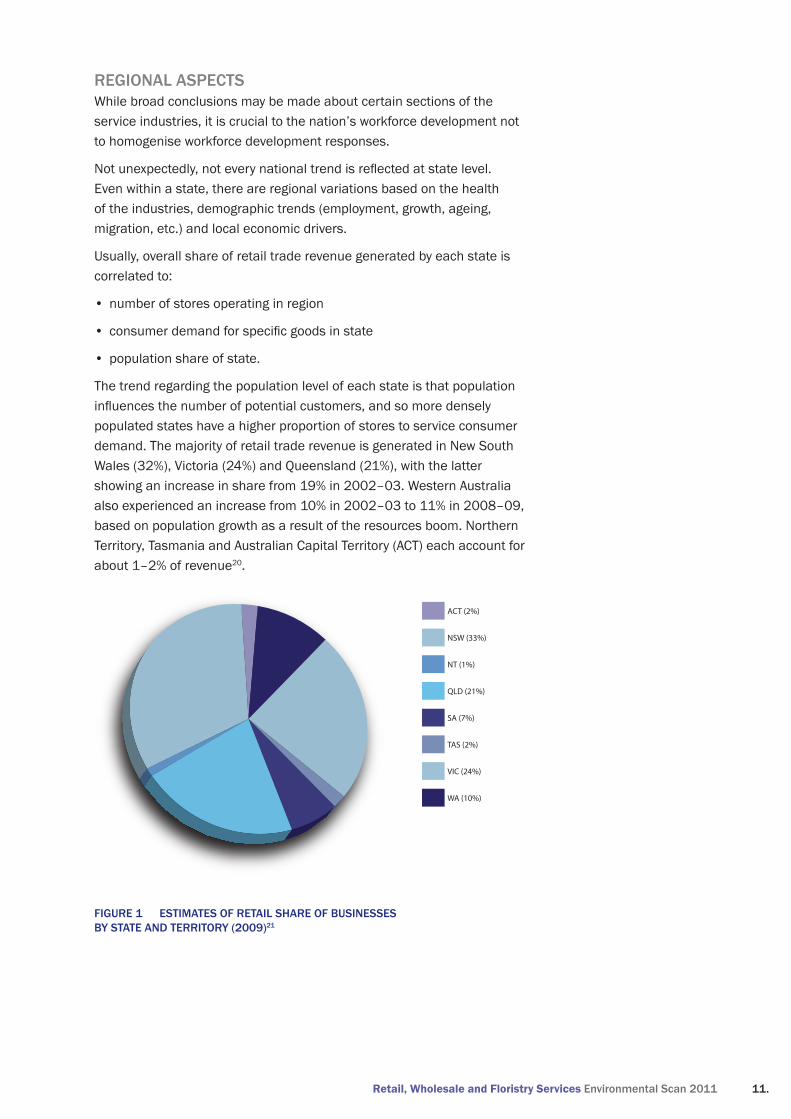
The trend regarding the population level of each state is that population influences the number of potential customers, and so more densely populated states have a higher proportion of stores to service consumer demand . The majority of retail trade revenue is generated in New South Wales (32%), Victoria (24%) and Queensland (21%), with the latter showing an increase in share from 19% in 2002–03 . Western Australia also experienced an increase from 10% in 2002–03 to 11% in 2008–09, based on population growth as a result of the resources boom . Northern Territory, Tasmania and Australian Capital Territory (ACT) each account for about 1–2% of revenue20 .
ACT (2%)
NSW (33%)
NT (1%)
QLD (21%)
SA (7%)
TAS (2%)
VIC (24%)
WA (10%)
estimates of retail share of businesses figure 1 by state and territory (2009)21
12. service skills australia
new south Wales
New South Wales (NSW) had the highest number of retail and wholesale businesses in Australia in 200922, which mirrors the high population density in the state .
The contribution of net overseas migration was a major component of population growth for NSW for the year ended 30 June 2010, with 62 .6% (66,034 persons) . However, negative net interstate migration was experienced by NSW (-10,540 persons)23 .
victoria
Net overseas migration made a contribution of 60,420 people to the population of Victoria for the 2009/2010 financial year24 . The increasing cultural diversity of the Victorian workforce and its customer base means that the ability to provide services attuned to different cultures is an essential skill for many employees, especially in service-related industries .
Queensland
Queensland continues to be the most popular destination for Australians moving interstate . The state is projected to experience the largest percentage increase in population between mid-2007 and 2056 of any state or territory, more than doubling the 2007 population of 4 .2 million to 8 .7 million people by 205625 .
Along with Western Australia (WA), Queensland is forecast to achieve the strongest retail growth to 2010―11, with its predicted growth of 7.5% being above the national average of 6%26 .
south australia
Compared to all other states and territories for the 2009/2010 financial year, South Australia reported the greatest proportion of population growth due to net overseas migration at 76 .6% (15,371 persons)27 . For service-related industries, this indicates the need for cultural awareness and an ability to work with different cultures .
By 2056, SA is forecast to have the second highest median age in Australia (43 .9 years)28 . The effects of this ageing population will be felt, and so employers should support the participation of older workers to not only maintain the skill and experience base but also to better align their workforce with the ageing customer base29 .
Western australia
The continuous increase in WA’s population, which is projected to more than double between 2007 and 2056, reaching 4 .3 million people30, will further boost the demand for the service industries . Along with Queensland, WA is forecast to achieve the strongest retail growth to 2010―11, with its predicted growth of 7 .5% being above the national average of 6%31 .
The state government has lifted a cap on the size of the state’s shopping centres . It is anticipated that the removal of the cap on retail space will lead to numerous multi-million dollar retail expansions . Shopping Centre Council of Australia figures show that during the past decade, $55 million was spent on retail development in WA, in comparison with $1 .7 billion in Victoria and $3 .5 billion in NSW32 . New laws governing Perth’s retail trading hours came into force on 1 November 2010 . Under the new laws, shops now have the option to trade until 9pm on weeknights .
In 2010, the Retail and Personal Services Training Council of Western Australia conducted an extensive survey to gather information for a workforce development strategy . The research found that many employers within small businesses in WA do not see the need, or do not have the knowledge or capacity, to forward plan, especially when it comes to the attraction and retention of staff . The majority of small businesses are owned
Retail, Wholesale and Floristry Services environmental scan 2011 13.
and managed by one person, by family members or employ fewer than five employees. Planning for these businesses is largely conducted on a day to day basis and, at best, 12 months is considered long term . The high level of survey responses from employers indicating that training was either not applicable or too expensive was a cause for concern; however employees indicated that a good working environment and good management were more important than training . Also of concern was the fact that only 3 .9% of respondents stated that they had employed Indigenous workers, which clearly shows that further promotion of the employment of Indigenous people and funding available through the Indigenous Wage Subsidy Initiative is imperative33 .
tasmania
Tasmania is forecast to have the fastest ageing population in Australia, which will result in Australia’s highest median age of 45 .7 in 2056, compared to an Australia-wide median age of 42 .434 . This trend is mainly based on the fact that Tasmania traditionally experiences a loss to interstate migration in younger age groups and a gain in older age groups35 . The major effect that this age demographic signals, is the even greater competition it will mean for available workers in the retail and wholesale industries .
northern territory
The transient nature of many people who live in the Northern Territory (NT) impacts greatly upon the ability to employ and retain qualified employees . Industry feedback has reported a particular challenge in the recruitment and retention of retail managers . Other factors impacting upon recruitment in NT are the relatively low unemployment rate (3 .1%, compared to 5 .2% nationally36) and the high price of accommodation37 . Feedback has also revealed concerns about the casualisation of the workforce in the Territory, which creates difficulties in terms of the promotion of career pathways .
The importance of upskilling indigenous employees was also highlighted through the industry consultation process . Failure to effectively attract, retain and upskill indigenous workers could
potentially lead to urban drift in the region, a move that would have implications at a national level. Certificate II is therefore seen as a crucial qualification for regional and remote Australia.
As the territory has large remote areas, good IT infrastructure is vital in order to continuously train, keep up with current trends and developments, and deliver up-to-date services . An increasing number of businesses are also utilising social networking sites in an attempt to attract new staff .
Two important trends in the NT’s demographic for the retail, wholesale and floristry industries are the age structure of the territory and its forecast growth .
The population of the NT is the youngest of any Australian state or territory, and will continue to be so in the future . In mid 2007 the NT had a median age of 31 .1, followed by the ACT with 34 .5 . By 2056, the median age in the NT will have only increased to 34 .5, while the Australia-wide median age is forecast to be 42 .4 . Additionally, the NT’s population is projected to increase by 186,600 people between mid 2007 and 2056, to 401,600 people. This is a significant increase of 214,900 people in the 2007 NT population38 . Hence, the effect of its ageing population (see further information below) while still noticeable, may not be felt as much in the NT as in other Australian states .
australian capital territory
Of importance for employers is that between June 1999 and June 2009, the ACT’s net interstate migration fluctuated considerably, but declined overall by 2019 people . In 2008-2009 alone the ACT recorded its third largest net loss of this ten-year period (822 persons) .39
In seasonally adjusted terms, total retail turnover in the ACT decreased by 0 .2% from August 2010 ($378 .4m) to September 2010 ($377 .6m) . While this was against the national trend of continuous positive growth in retail trade since March 2010, there was still notable increases in Household goods retailing (+0 .9%) and Clothing, footwear and personal accessory retailing (+1 .0%) . Furthermore, this was the smallest decrease in retail trade for the ACT since July 2009 (also -0 .2%)40 .
14. service skills australia
macro-environment factors
The changing landscape
Change is a constant within the retail, wholesale and floristry industries. The difference between those businesses that foresee and adapt to change and those that don’t is survival .
Among the changes that the retail, wholesale and floristry industries have seen in the past several years is that the pace of change is accelerating . Being first to market is the key to success. This is very important in understanding how responsive the training and education sector needs to be to keep up with industry . Industry cannot afford to wait and will do whatever it takes to not only keep up with, but get in front of, change .
The retail, wholesale and floristry industries are commercial environments and are based on quick delivery and immediate results making execution critical to viability and success . This drives a very results-focused environment, where decision making and problem solving happen at a fast pace .
The retail, wholesale and floristry industries are very diverse in relation to the products and services provided and the size of businesses and customer segmentation, and have experienced significant growth and change over the past several years . Industry feedback suggests this will continue in the future, albeit at a faster rate .
Growing population
Australia’s estimated resident population of 22 million in June 200941 is projected to increase to between 30 .9 and 42 .5 million people by 2056, and to between 33 .7 and 62 .2 million people by 210142 .
This population growth will lead to an increased demand for workers in the service industries; whose skills needs will be driven by the staff efficiency and productivity gains required to service the growing number of customers and changing nature of their needs .
Consultation with the floristry industry has revealed concerns in some regions about the impact a growing population will have upon water restrictions . Such restrictions in SA are already reported to have had an impact upon the price of flowers which has led to a loss of smaller local growers .
“PoPulation groWth Will lead to an increased demand for Workers in the service industries; Whose skills needs Will be driven by the staff efficiency and Productivity gains reQuired to service the groWing number of customers and changing nature of their needs.”
Retail, Wholesale and Floristry Services environmental scan 2011 15.
Ageing population
Population ageing is occurring globally, with a substantial shift in the age structure towards older ages . The median age of Australia’s population (36 .8 years at June 2009)43 is projected to increase to between 38.7―40.7 years in 2026 and to between 41.9―45.2 years in 205644 .
Australia’s population aged 15―64 years, which encompasses much of the working-age population, is projected to decline from 67% in 2004, to between 57―59% in 205145 . As labour force growth is forecast to be slower than population growth, participation rates will decrease .
Industry feedback has reported a noted increase in the number of job applications from mature age candidates .
Consultation with the floristry industry in 2009 also revealed that mature female workers are generally considered to be valuable employees because of their strong rapport with target customer markets . Workplaces that employ older workers reported that despite challenges posed by the use of new technologies, this labour cohort clearly demonstrates a willingness to learn new skills .
With the reduced youth pool, many retail businesses (especially large department stores) are already looking at other groups as sources of labour . Older women in particular are increasingly valued for their life experiences and preference for part-time work .
The ageing Australian population presents a challenge for those businesses that require the manual handling of heavy objects . From a workplace health and safety perspective, there is an increasing need to consider mechanical processes to overcome this issue . Some employers spoke of introducing workplace programs to help staff maintain health and fitness46 .
The Wholesale, Retail and Personal Services sector employs a very large number of young people . In 2009, 22 per cent were aged 15–19 years . In the whole workforce only 7 per cent of people are in this age group .
In some occupations the proportion is much higher, for instance, 32 percent of sale assistants and 46 per cent of checkout operators in 2009 were young workers . Many of them are likely to be students working part-time, for whom these jobs provide income support while studying .
However there has been an increase in the number of older workers (45 years or older) among retail assistants . In 2009, 20 per cent were in this age group compared to 17 per cent in 2001 . Older workers also occupied most retail manager positions—43 per cent in 200947 .
Economic factors
Business sales in retail are of a cyclical nature and react quickly to economic trends and changes in consumer spending patterns . The level of consumer spending varies in response to various factors, the most noticeable being interest rate changes and fluctuations in petrol prices.
The Australian economy, like most other economies around the world, experienced the fallout from the global financial crisis. While the impact of the crisis has been rather severe for many countries, Australia has escaped relatively unscathed from the experience . The Government’s stimulus packages together with the continuing demand for Australian resources from China, Japan, South Korea and India cushioned the economy from the worst effects of the crisis . Retail spending was assisted by the cash handouts to households in the first stimulus package. As the economy is weaned off the stimulus, some slowing in consumer spending can be expected48 .
16. service skills australia
Sustainability
Consumers and potential employees are increasingly aware of environmental issues . Those customers aware of environmental issues will often choose products with low energy consumption as a first preference.
The retail and wholesale industries have significant potential to provide a range of sustainable products and services, as well as advice on water and energy-efficient products to consumers49 . However the trend towards purchasing sustainable and organic products – whether food, clothes or toys – depends on the customer’s level of disposable income and living costs, as well as consumer confidence.
Much work has been done by product manufacturers and retailers to promote the benefits of environmentally-friendly items as a form of product differentiation and to attract this emerging group of consumers . Retailers have also reviewed their own facilities, including heating, cooling, refrigeration and waste disposal processes, in order to reduce costs and promote their businesses as environmentally conscious .
Environmental sustainability issues addressed in SIR07 Retail Services Training Package may be found in the following units of competency .
SIRXCLM001A Organise and maintain work • areas (offered at Certificates I, II, and III qualification levels)
SIRXGLC003A Comply with legislative • requirements affecting business activities (offered at Certificate II qualification level)
These units cover areas relating to the legislative requirements of environmental protection, waste removal, hazardous substances and dangerous goods (such as flammable goods, explosive goods and waste), avoiding spills, and using personal protective clothing .
WRF04 Floristry Training Package was superseded by the endorsement of the SFL10 Floristry Training Package in 2010 . The updated training package includes sustainability skills from the perspective of both individual tasks and management .
Successful completion of the floristry qualifications requires knowledge of the environmental impact of constructing and maintaining floristry products and practices that minimise their impact, especially those that relate to energy use . Knowledge is also required of correct and environmentally sound disposal methods for all types of waste, in particular hazardous substances, spoiled and diseased flower and plant materials, and those with a propensity to propagate weeds . Safe use of hazardous substances, such as cleaning and conditioning agents and preservatives, is also required .
Retail, Wholesale and Floristry Services environmental scan 2011 17.
Business trends
The importance of value was highlighted in industry feedback to SSA, with the observation that customers need to feel they are getting greater value for money. The identification of this increasingly discerning group of customers is also reinforced by The Australian Centre for Retail Studies (ACRS), who identifies ‘the Value Consumer’ as an emerging group who exercise greater caution and expect more for their money50 . Factors such as interest rate levels were also identified by industry as having an impact upon consumer trends, with rate rises, or the expectation of rises immediately being felt at the cash registers .
In addition to the emergence of the Value Consumer described above, ACRS also identified the following groups of consumers emerging in the retail sector:
The Busy Consumer – A time-poor customer • who chooses retailers who meet their lifestyle needs; placing increasing importance on speed, simplicity and convenience . In an effort to simplify the buying process, consumers are expecting multiple channels through which to communicate and engage with retailers .
The Green Consumer – Highly concerned • about the environment and willing to do and spend more to be environmentally friendly . Green consumers consistently and primarily discriminate product purchases in favour of the environment .
The Local Consumer – Consumers who support • their local community and economy; taking advantage of what they perceive to be better quality produce and travelling fewer kilometres to reach them . These consumers are becoming increasingly conscious of where and how products are produced, leading to a surge in country of origin products for the retail industry .
The Bored Consumer – Consumers who are • overwhelmed by choice and the ever increasing number of advertisements and promotions . These consumers have become de-sensitised with traditional retailing and advertising . To combat this desensitisation, consumers are searching for a greater connection with retailers and a more engaging shopping experience .
The Digital Consumer – Consumers who spend • considerable amounts of time interacting through various forms of social media . User generated content and online communities are revolutionising the way consumers communicate with retailers, as well as how and why they shop . These consumers are seeking more meaningful relationships with brands through personal and engaging digital experiences51 .
During consultation with SSA, representatives from the retail, wholesale and floristry industries were asked to identify emerging business and consumer trends and to describe the impacts they could potentially have upon workforce planning . It was noted that customers are increasingly knowledgeable about products, due to increased access to product information on the internet . Consumers expect staff to be able to be well-informed and able to answer questions about products . Sales employees are therefore required to be trained to develop better negotiation and product knowledge skills .
Also noted was the necessity for many businesses to extend their trading hours in order to meet the demands of consumers - especially in metropolitan areas - creating flexibility and staffing issues.
Industry representatives were also asked to comment on recent reports that suggest a decline in the quality of customer service in Australia52 . Feedback stated that the customer service capabilities of sales assistants have generally improved, but customer expectations have increased at a faster rate and there tends to be fewer sales assistants per customer as many retailers have tightened structures to remain profitable. In addition, some retailers are empowering sales assistants to make decisions regarding customer complaints in an attempt to placate more demanding customers . Industry representatives in the Northern Territory attributed declining standards of customer service to the low unemployment rate in the region, which has created complacency . However, it was also noted that retail employees in NT have excellent attendance records, which enables the shops to stay open .
Feedback from the floristry industry noted the need for more one-to-one, workplace training for employees in order to meet customer expectations about service levels .
18. service skills australia
Technology
Changes in technology impact upon the retail, wholesale and floristry industries . They represent major tools for increasing sales and generate ongoing training and skill development for employees .
Internet shopping is providing a borderless shopping environment and is affecting consumer habits . Changed arrangements for supermarket sale points that allow customers to scan their own purchases may affect employment and skills needs for checkout operators . All these changes are affecting skills and jobs in the retail and tourist industries53 .
The strength of the Australian dollar has also led to consumers accessing bigger and cheaper markets online . Research estimates that online retail sales in Australia will reach $28 billion in 2010, an increase of 17 .5% from 2009, with a quarter of those sales – worth an estimated $7 billion – going overseas, although this number has been reported to be as high as 43%54 .
Furthermore, the growing number of brands incorporating social media into their marketing mix is increasing pressure on retailers to find unique and innovative ways to engage customers who are actively seeking out digital content55 .
Industry feedback suggests that there is an increased customer expectation for retail businesses to utilise new technology, with consumers wanting to be kept up to date with the latest offers and opportunities . However, this is not the case for smaller retailers who rely on a local, face-to-face, customer base. Similarly, investment in e-commerce is often viewed as a financial burden in the floristry industry; with concern about the time management and additional training required to maintain websites .
Further comments from the retail and wholesale industry indicate an increase in online learning and point out that many jobs can only be accessed via online recruitment sites, meaning it is becoming increasingly hard to gain employment in the sector without some online skills . In-store technology also means there is a requirement for a trained member of staff to be on-site at all times to resolve breakdowns of registers and stock control systems .
Retail, Wholesale and Floristry Services environmental scan 2011 19.
identified Workforce develoPment needsPeople – customers and employees – are critical to the retail, wholesale and floristry industries. The industries firmly believe that building a highly skilled workforce will deliver a highly productive economy . Continuous lifelong learning is crucial for ongoing improvements in productivity and participation .
Work in the service industries dominates the economy, and working in these industries demands a range of different skills to those required in other industries, like traditional trades56 . Workforce development is about ensuring that Australian industry has access to appropriate numbers of skilled workers to address needs into the future . It aims to tackle the skill shortages that will come about as a result of trends, such as the ageing population, by increasing levels of workforce participation and developing the skills of the current workforce . Any course of action to solve skill shortages and increase workforce participation will depend on the sector specific labour market that is in imbalance – as each market may need a tailored solution57 . If a blanket approach to workforce development is adopted, the result will be an under representation of the development of service industries workers .
The reality is that the majority of jobs that will be available in the retail, wholesale and floristry industries will be at entry level – that is, Certificates II and III. These skill levels are suited to the majority of employer needs, with most employees commencing with basic skills in customer service and then, for some, gaining skills and experience in specialised fields. This skills gap needs to be addressed. It should be noted though that while the mismatch in supply and demand does represent a need for higher level skills for those who do not possess a qualification, it does not reflect a demand for training only at diploma, management or trade level .
To provide a more detailed view about the training needs for the service industries, in 2010, SSA engaged Monash University’s Centre for the Economics of Education and Training (CEET) to undertake a research project to forecast the labour and skills needs for the service industries for the next five years. The report provides baseline information on the minimum skill requirements to achieve a specific qualification profile for the service industries’ workforce in 2015 .
The report forecasts that employment in the service industries will grow relatively more slowly than other industries . In 2015, the service industries are forecast to employ 1 .94 million people – an increase of 3 .1 per cent from 200958 . Factors impacting growth include the effects of stimulus wearing off; the high value of the Australian dollar and weakness of the global economy; government spending tightening and the draw of labour to the mining sector .
Of interest to the Wholesale, Retail and Personal Services sector is that overall employment in the sector is forecast to rise by 15,000 by 2015 . Furthermore, 73,000 more people will hold qualifications than they did in 2009 and over the same period the number of people without any qualifications is forecast to drop by 58,000. The proportion of people with qualifications will increase from 39% in 2008 to 45% in 2015.
The report estimates that by 2015 the qualification requirements for the WRAPS sector will be 231,000, or 38,000 per year. Around one in every five qualifications will be at degree or higher level and the rest will be at the VET level (62,000 Advanced Diploma / Diploma, 97,000 Certificate III/IV, and 23,000 Certificate I/II).

20. service skills australia
Qualifications
Entry point to the retail and wholesale sectors is generally at Certificate II, with the ‘trade level’ qualifications (which include skills in supervising and coaching staff) sitting at Certificate III. The entry point for Floristry is really at Certificate III level, which reflects the trade based nature of the occupation. Australian Qualifications Framework (AQF) level 2 and 3 qualifications represent the bulk of the retail, wholesale and floristry workforce, with the remainder made up to a significantly lesser extent of the higher AQF levels . The industry qualification structure and framework reflect this fact, and so the opportunity to develop a more highly skilled workforce lies in skilling the workforce to AQF level 3 .
Moreover, recognition of skills is critical when one considers that public funding data describes that 40 .9% of the retail workforce59 and 50 .2% of the wholesale workforce hold non-school qualifications60 . With this in mind, notions of developing a highly skilled workforce must also be tied to building first on recognised skills.
Institutional delivery
SSA understands that a significant number of students in fee-paying colleges undertake a number of service industry qualifications through an institutional pathway, often with minimal exposure to a real workplace context .
Employers are concerned that graduates of institute or wholly classroom-based programs have the equivalent skill depth and breadth as graduates from workplace-based programs (for instance, from apprenticeships) .
It would appear that a number of providers are not meeting the requirements specified in the training package . It has been reported that training facilities often do not meet the recommended standard and that some RTOs are failing to provide sufficient exposure to authentic workplace simulations, as a result students graduate without getting adequate access to industry application at work or in training .
Assessment practice
There is a perception that there is widespread inconsistency and poor practice in relation to assessment, resulting in the awarding of qualifications which industry views as lacking value. Examples of this include:
lack of rigor in the interpretation and application • of competency standards
poor attention to industry expectations and • requirements in the context of assessment
lack of industry experience among assessors .•
“some rtos are failing to Provide sufficient exPosure to authentic WorkPlace simulations, as a result students graduate Without getting adeQuate access to industry aPPlication at Work or in training.”

Retail, Wholesale and Floristry Services environmental scan 2011 21.
Quality delivery – industry’s contribution
Industry representatives are keen to become more involved in implementation to support the national training system and build the nation’s productivity .
In response to ongoing industry concern, SSA has already made improvements to the quality of its training packages. This has resulted in more specific units of competency, tighter assessment guidelines, and more detailed requirements for assessors . Future changes will also result in a more helpful/detailed resource checklist available as part of the non-endorsed training package support material .
Further, SSA has implemented two initiatives to provide more guidance and input into provider recognition processes, which have been very well received .
In the development of the most recent Training Packages, SSA has produced a User Guide which specifies:
minimum assessment and learning requirements to achieve qualifications•
required assessor/trainer qualifications and experiences above and beyond • those required by regulation
professional development requirements for trainers and assessors•
requirements around work placement and/or experience•
guidelines for selecting and recruiting students•
minimum equipment and facility requirements for delivery•
minimum recommended duration for delivery of units and/or qualifications.•
SSA recommends that auditing and quality processes be made more effective through a more active industry role, including the use of industry advisers .
The service industries are ready, willing and able to be more supportive of the national training system . SSA’s commitment to ensuring that the skilling system is able to support productivity growth has been reiterated in a range of projects collectively known as the Right Way .
Effective outcomes of training and assessment are inextricably linked to the quality of these core components of the VET system . Through the Right Way, SSA provides industry recognition of facilities, trainers, assessors and learning resources . Participants in this industry recognition system must adhere to standards and provide evidence of quality through an application and assessment process operated by SSA and its network of agencies . Through this program, SSA aims to:
Ensure and recognise the provision of quality training and assessment by • registered training organisations (RTOs)
Build the capability of trainers and assessors who work in the • service industries
Promote the development of, and recognise, effective learning resources • which align to training package content
Achieve quality skills outcomes throughout the service industries• 61 .
22. service skills australia
Completion rates
Completion rates as an exclusive measure of effectiveness continue to be a critical concern to the service industries . Industry overall, and the service industries in particular, believe that they have been unnecessarily disadvantaged by use of completion rates as a measure of success of industry training . This situation remains a concern as there is a strong need for the development of nationally-consistent data collection tools that more accurately measure and evaluate course completion and non-completion rates .
In response to these concerns, SSA has commissioned JMA Analytics to undertake a research project to determine if the current assumptions about the reasons for non-completions are correct and to mount a case for a more consistent and accurate national measurement system . The project considers what non-completion data is currently being collected in VET, what non-completion data isn’t being collected that should be, and aims to find out what is the preferred structure, frequency and collection methodology for data on non-completions . A broad range of reasons why students do not complete programs is being collected including: relationship with employer, personal barriers, quality of provider and interest in the job role .
Early findings from this research project indicate that the two primary categories of issues in relation to the current data collection tool for completion rates (The Australian Vocational Education and Training Management Information Statistical Standard, or AVETMISS) are:
the potential for significant inaccuracies in the statistics reported 1 . (e.g. no universal student identifier), and
the need for some alternative future approaches that do not 2 . automatically interpret qualification non-completion as a negative outcome (e .g . some students may never intend to complete a program, rather only certain aspects) .
Importantly, this project does not set out to argue that completion rates shouldn’t be measured, nor is it arguing that low completion rates are okay, nor is it trying to avoid the issue of improving quality delivery . What it is trying to do is argue for a better understanding of the issue and a better way of measuring the effectiveness of the system. Qualifications are an important outcome for education systems and our investigation into this issue is driven by an appreciation that ‘life is not linear’ and that contemporary measurement systems should accommodate this reality .
The complete findings of this research project, Evaluation Frameworks for VET, are due to be published in March 2011 .
Retail, Wholesale and Floristry Services environmental scan 2011 23.
Core skills
Apart from vocational education, the development of core skills (language, literacy and numeracy skills) helps individuals effectively and safely operate at work and in their personal lives and so is important for the productivity and efficiency of businesses. Sometimes employers and managers focus their training on vocational skills, neglecting the literacy and numeracy that underpin those skills . When the development of language, literacy and numeracy skills is handled constructively and sensitively, one could expect this to positively impact upon retention rates .
The results of the 2006 Adult Literacy and Life Skills Survey (ALLS)62 provide information on whether Australians’ literacy skills are adequate for the challenges they face in daily work and life . The ALLS gives information on skills and knowledge of 15 to 74 year olds in the following four domains: prose literacy, document literacy, numeracy and problem solving . ALLS measures literacy and numeracy by using a 5 point scale where 1 is the lowest level and 5 the highest (except problem solving, where the highest is level 4) . To assist with interpreting the results, level 3 is regarded by the survey developers as the minimum required for individuals to meet the complex demands of everyday life and work in the emerging knowledge-based economy .
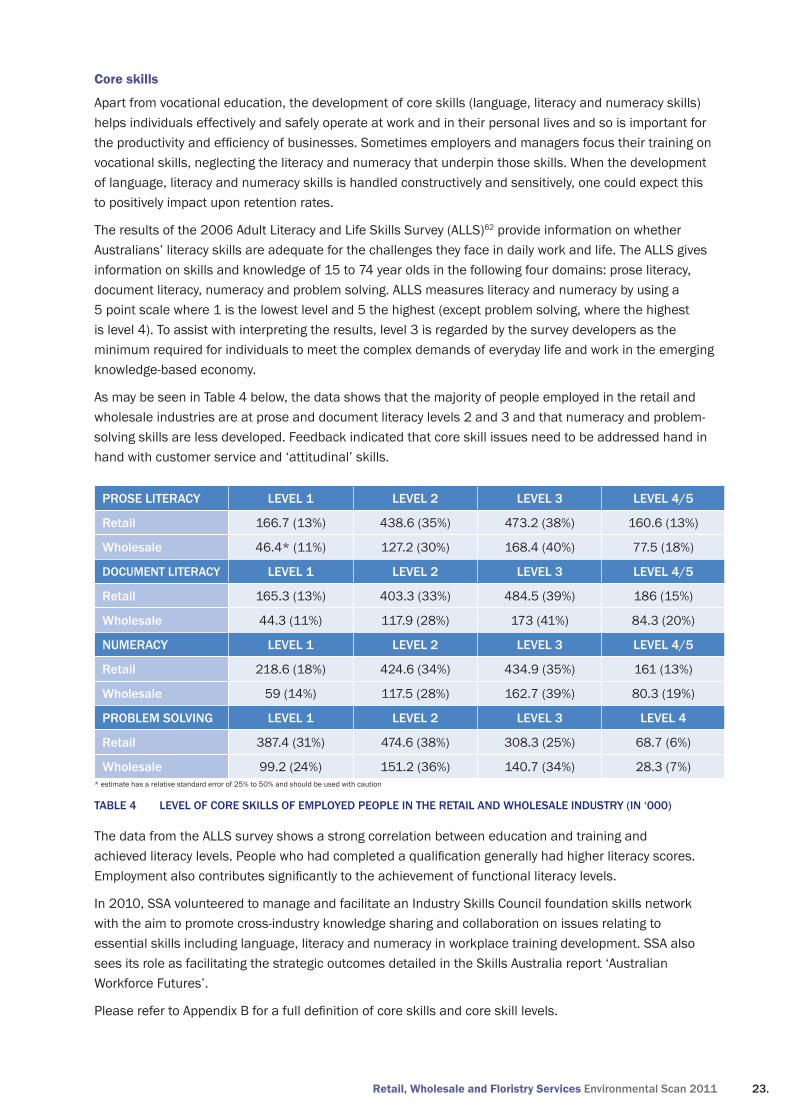
As may be seen in Table 4 below, the data shows that the majority of people employed in the retail and wholesale industries are at prose and document literacy levels 2 and 3 and that numeracy and problem-solving skills are less developed . Feedback indicated that core skill issues need to be addressed hand in hand with customer service and ‘attitudinal’ skills .
Prose literacy level 1 level 2 level 3 level 4/5
retail 166 .7 (13%) 438 .6 (35%) 473 .2 (38%) 160 .6 (13%)
Wholesale 46 .4* (11%) 127 .2 (30%) 168 .4 (40%) 77 .5 (18%)
document literacy level 1 level 2 level 3 level 4/5
retail 165 .3 (13%) 403 .3 (33%) 484 .5 (39%) 186 (15%)
Wholesale 44 .3 (11%) 117 .9 (28%) 173 (41%) 84 .3 (20%)
numeracy level 1 level 2 level 3 level 4/5
retail 218 .6 (18%) 424 .6 (34%) 434 .9 (35%) 161 (13%)
Wholesale 59 (14%) 117 .5 (28%) 162 .7 (39%) 80 .3 (19%)
Problem solving level 1 level 2 level 3 level 4
retail 387 .4 (31%) 474 .6 (38%) 308 .3 (25%) 68 .7 (6%)
Wholesale 99 .2 (24%) 151 .2 (36%) 140 .7 (34%) 28 .3 (7%)* estimate has a relative standard error of 25% to 50% and should be used with caution
level of core skills of emPloyed PeoPle in the retail and Wholesale industry (in ‘000)table 4
The data from the ALLS survey shows a strong correlation between education and training and achieved literacy levels. People who had completed a qualification generally had higher literacy scores. Employment also contributes significantly to the achievement of functional literacy levels.
In 2010, SSA volunteered to manage and facilitate an Industry Skills Council foundation skills network with the aim to promote cross-industry knowledge sharing and collaboration on issues relating to essential skills including language, literacy and numeracy in workplace training development . SSA also sees its role as facilitating the strategic outcomes detailed in the Skills Australia report ‘Australian Workforce Futures’ .
Please refer to Appendix B for a full definition of core skills and core skill levels.
24. service skills australia
suggested aPProaches to Workforce develoPment
Discuss, Display, Do – a new model for the recognition of prior learning
During 2009, SSA worked with industry to develop a new model for the recognition of prior learning (RPL), as feedback had indicated that employees in the service industries found the existing RPL processes and procedures too demanding, requiring a considerable investment in time and effort in an industry where time is crucial .
These concerns were confirmed through the results of a survey of registered training organisations about the ease of access to RPL which identified the critical barriers being: Lack of understanding / resources of assessors; inequitable funding mechanisms and Australian Qualification Framework requirements / inconsistencies with audit practices .
SSA therefore proposes a skill recognition approach that is specifically tailored to respond to the needs of industry . A process is required that (from the candidate and employer’s perspective) is simple, quick and appropriate whilst still retaining
the necessary rigour to enable a qualification to be awarded with confidence. The shortened timeframes in this process also make it cost effective .
‘Discuss, Display, Do’ is a project that aims to develop and pilot an RPL model suitable to the needs workers in the service industries . The project intends to investigate and identify how the national training system can respond to meet the needs of the service industries . In doing so the project addresses the following Australian Government Priorities:
A new national approach to Apprenticeships, • Training and Skills Recognition
Supporting the development of the National • Volunteer Strategy
The National Reform Agenda •
The Social Inclusion Agenda•
Retail, Wholesale and Floristry Services environmental scan 2011 25.
VET in schools
Industry feedback to SSA indicated problems around the delivery of vocational education and training in schools (VETiS) . The feedback suggested that typical delivery of VETiS does not achieve required industry outcomes and, often in school environments, VET training requirements are in competition with a fundamentally different pedagogical approach than that required by VET . Furthermore, inconsistency of VETiS practice and delivery across the states and territories makes delivery difficult for those providers and employers who employ across state borders .
Vocational Education and Training in Schools (VETiS) is seen as critical area for action due to the involvement of a significant number of Australian students and the recent rapid growth of VETiS programs . While there has been huge growth in the participation numbers, there is increasing concern about the quality of VETiS delivery and particularly, lack of employment outcomes .
Demographics, economic growth, competitiveness and increased skill requirements are creating even greater demand for skilled youth in Australia . Today’s younger generations have more opportunities and therefore have become ‘cherry pickers’, which has consequences for the service industries as they are often seen as a short term, second-rate career choice .
Working with industry, SSA worked to address these issues through its VETiS project in 2010, which included the development of an industry position paper and ‘rules of engagement’ for the service industries . Further it aimed to develop ‘resource ready’ tools to assist VETiS delivery, as well as case studies that reflect what is occurring in industry.
A literature search and review highlighted the variety of interpretations of the term VETiS; each state or territory system locates VET in a different curricular context . The major concern is the inconsistency between VETiS, both within a jurisdiction as well as across Australia . Currently there are no common standards around approval, regulation, resourcing, administration, delivery and monitoring of VETiS .
Consultations occurred across the country over a period of four months to gather critical information on industry position and best practice example of VETiS .
The industry consultation process found:
Key stakeholders in VETiS have such fundamental differences in what they consider is the • purpose and expected outcomes that some wish to walk away or ignore this nationally critical skilling opportunity .
Quality issues (not just limited to VETiS) were a key component of consultations . There is • massive variability (excellent to indefensible) in VETiS modules across Australia .
Many stakeholders expressed a desire for clear and explicit guidelines . •
The diversity across the services industries requires different VETiS pathways, industry • engagement, links to regulation, award conditions considerations and workplace engagement, such that VETiS must be considered on an individual industry sector (training package) basis .
There was a consistent strong industry message about VETiS focused on job skills . •
Given the imperatives and importance of VETiS, the services industries need to take a strategic, pragmatic and holistic approach to VETiS in order to maintain their share of youth employees recruited via VETiS pathways and ensure they can meet future workforce needs63 .
26. service skills australia
Integrating higher education and VET into the retail sector
The retail industry has identified that retention of quality employees is a key sustainability issue . In addition, promoting retail as a worthwhile career and profession is a strategy that many employers believe is crucial to retaining quality skilled labour. Industry stakeholders have reported that VET qualifications and higher education degrees are useful for a variety of reasons, including providing skills for the workplace, developing frameworks for thinking for the future, expanding employee horizons, demonstrating the professionalism of the industry, affirming self-worth, and as an opportunity for employers to value add to employees’ workplace experience .
Employees in the retail sector have low levels of tertiary qualifications64 . As there is a high correlation between tertiary education and effective performance, there is a clear need to professionalise the retail industry through higher levels of qualifications. Furthermore, industry is keen to see relevant outcomes in terms of employability and qualifications that improve productivity.
During 2009 and 2010 SSA worked with the University of Western Sydney (UWS) and its associated training organisation, the University of Western Sydney College (UWS College), on a qualification that will provide candidates with a degree with an integrated VET major in retail. Through this elevated qualification, retail employees will be able to take advantage of career opportunities in industry at managerial levels .
This qualification – the Bachelor of Business & Commerce (Retail Management) – integrates a bachelor’s degree in Business with a traineeship which covers both Certificate III in Retail and Certificate IV in Retail Management. The student will experience a seamless, integrated approach to learning across the higher education and VET sectors and working within the retail industry. The first students will commence in March 2011 .
Strengthening the relationship between the VET and higher education sectors is critical to each sector . Equally critical is addressing issues around workforce development in retail, as well as quality issues that are relevant to both sectors; issues such as questions of trainer capability, relevance of pedagogy and appropriateness of programs . The partnership between education sectors is proving that positive, productive and effective relationships, built on the needs of industry as well as mutual trust and understanding of the role that each can bring to industry, will provide a powerful foundation for a strong retail workforce .
Retail, Wholesale and Floristry Services environmental scan 2011 27.
current imPact of training Packages
0
100
200
300
400
500
600
700
800
900
1000
Certificate IIin Floristry
Certificate IIIin Floristry
Certificate IVin Floristry
0
50
100
150
200
250
300
350
400
450
Certificate IIin Floristry
Certificate IIIin Floristry
Certificate IVin Floristry
2006
2007
2008
2009
Course enrollments and completion rates FLORISTRY
2006
2007
2008
2009
Vocational course enrolments by floristry qualification (2006―2009)figure 2
The majority of enrolments in WRF04 Floristry Training Package over the last four years have been at the entry-level qualification Certificate II. This is a major concern to SSA, as we have always advised that there are very limited job opportunities at this level . The rising number in enrolments seen in Figure 2 above for Certificate IV can be attributed to the growing acceptance and uptake of the VET pathway by the industry65 .
0
100
200
300
400
500
600
700
800
900
1000
Certificate IIin Floristry
Certificate IIIin Floristry
Certificate IVin Floristry
0
50
100
150
200
250
300
350
400
450
Certificate IIin Floristry
Certificate IIIin Floristry
Certificate IVin Floristry
2006
2007
2008
2009
Course enrollments and completion rates FLORISTRY
2006
2007
2008
2009
vocational course comPletions by floristry Qualification (2006-2009)figure 3
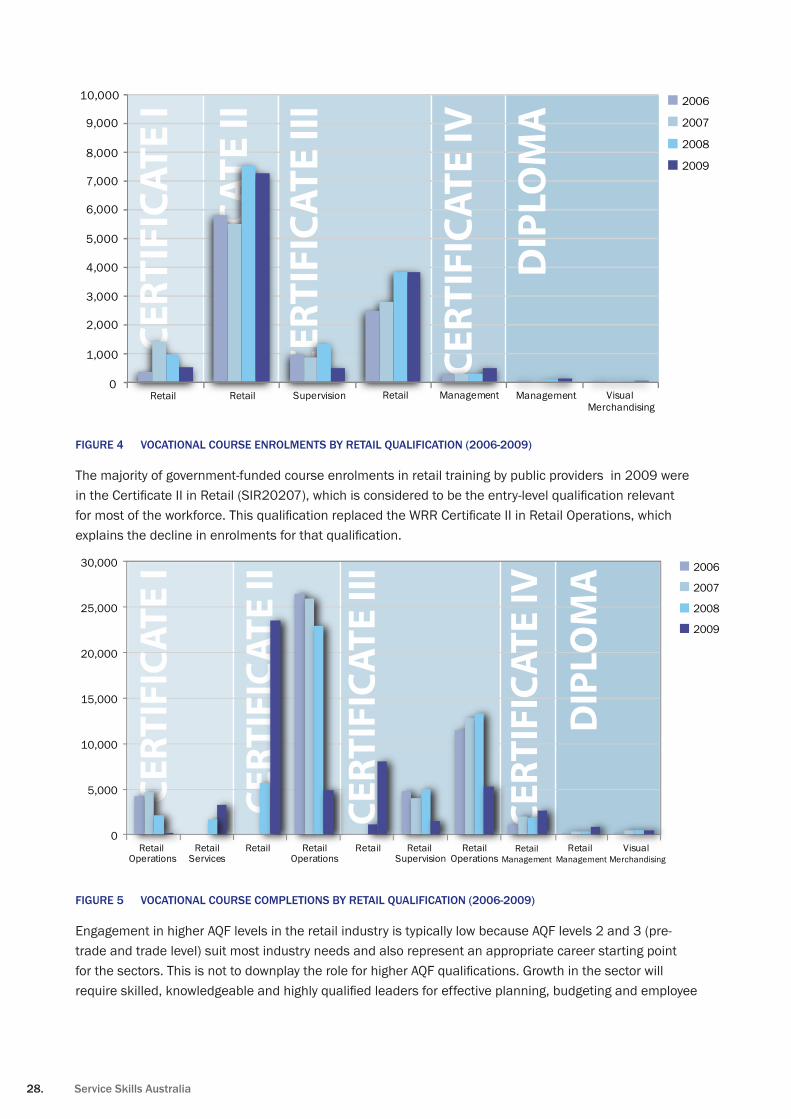
28. service skills australia
CERT
IFIC
ATE
I
CERT
IFIC
ATE
II
CERT
IFIC
ATE
III
CERT
IFIC
ATE
IV
DIP
LOM
A
CERT
IFIC
ATE
I
CERT
IFIC
ATE
III
CERT
IFIC
ATE
IV
DIP
LOM
A
CERT
IFIC
ATE
II
0
5,000
10,000
15,000
20,000
25,000
30,000
Retail Operations
RetailServices
Retail RetailOperations
Retail Retail Supervision
RetailOperations
RetailManagement
Retail Management
Visual Merchandising
2006
2007
2008
2009
0
1,000
2,000
3,000
4,000
5,000
6,000
7,000
8,000
9,000
10,000
Retail Retail Supervision Retail Management Management Visual Merchandising
2006
2007
2008
2009
vocational course enrolments by retail Qualification (2006-2009)figure 4
The majority of government-funded course enrolments in retail training by public providers in 2009 were in the Certificate II in Retail (SIR20207), which is considered to be the entry-level qualification relevant for most of the workforce. This qualification replaced the WRR Certificate II in Retail Operations, which explains the decline in enrolments for that qualification.
CERT
IFIC
ATE
I
CERT
IFIC
ATE
II
CERT
IFIC
ATE
III
CERT
IFIC
ATE
IV
DIP
LOM
A
CERT
IFIC
ATE
I
CERT
IFIC
ATE
III
CERT
IFIC
ATE
IV
DIP
LOM
A
CERT
IFIC
ATE
II
0
5,000
10,000
15,000
20,000
25,000
30,000
Retail Operations
RetailServices
Retail RetailOperations
Retail Retail Supervision
RetailOperations
RetailManagement
Retail Management
Visual Merchandising
2006
2007
2008
2009
0
1,000
2,000
3,000
4,000
5,000
6,000
7,000
8,000
9,000
10,000
Retail Retail Supervision Retail Management Management Visual Merchandising
2006
2007
2008
2009
vocational course comPletions by retail Qualification (2006-2009)figure 5
Engagement in higher AQF levels in the retail industry is typically low because AQF levels 2 and 3 (pre-trade and trade level) suit most industry needs and also represent an appropriate career starting point for the sectors. This is not to downplay the role for higher AQF qualifications. Growth in the sector will require skilled, knowledgeable and highly qualified leaders for effective planning, budgeting and employee
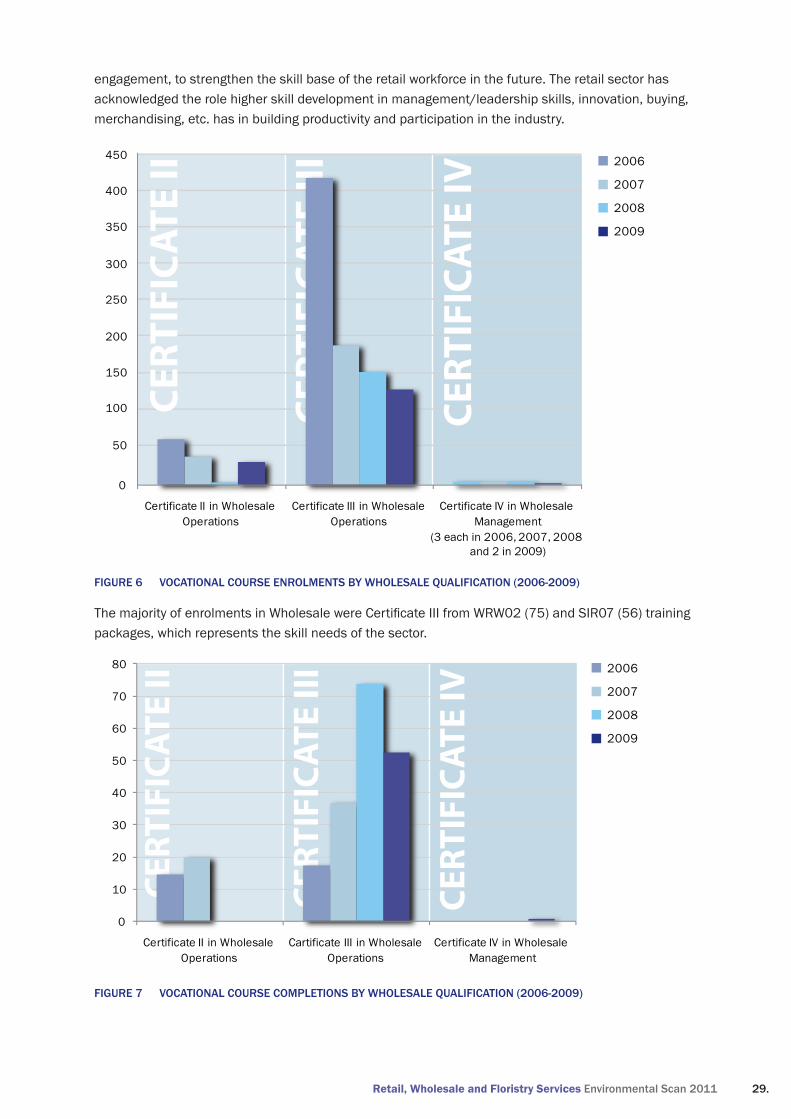
Retail, Wholesale and Floristry Services environmental scan 2011 29.
engagement, to strengthen the skill base of the retail workforce in the future . The retail sector has acknowledged the role higher skill development in management/leadership skills, innovation, buying, merchandising, etc . has in building productivity and participation in the industry .
CERT
IFIC
ATE
III
0
50
100
150
200
250
300
350
400
450
Certificate II in Wholesale Operations
Certificate III in Wholesale Operations
Certificate IV in Wholesale Management
(3 each in 2006, 2007, 2008 and 2 in 2009)
Enrollments and completion of wholesale qualsCE
RTIF
ICAT
E II
CERT
IFIC
ATE
IV
CERT
IFIC
ATE
III
0
10
20
30
40
50
60
70
80
Certificate II in Wholesale Operations
Cartificate III in Wholesale Operations
Certificate IV in Wholesale Management
CERT
IFIC
ATE
II
CERT
IFIC
ATE
IV
2006
2007
2008
2009
2006
2007
2008
2009
vocational course enrolments by Wholesale Qualification (2006-2009)figure 6
The majority of enrolments in Wholesale were Certificate III from WRW02 (75) and SIR07 (56) training packages, which represents the skill needs of the sector .
CERT
IFIC
ATE
III0
50
100
150
200
250
300
350
400
450
Certificate II in Wholesale Operations
Certificate III in Wholesale Operations
Certificate IV in Wholesale Management
(3 each in 2006, 2007, 2008 and 2 in 2009)
Enrollments and completion of wholesale quals
CERT
IFIC
ATE
II
CERT
IFIC
ATE
IV
CERT
IFIC
ATE
III
0
10
20
30
40
50
60
70
80
Certificate II in Wholesale Operations
Cartificate III in Wholesale Operations
Certificate IV in Wholesale Management
CERT
IFIC
ATE
II
CERT
IFIC
ATE
IV
2006
2007
2008
2009
2006
2007
2008
2009
vocational course comPletions by Wholesale Qualification (2006-2009)figure 7
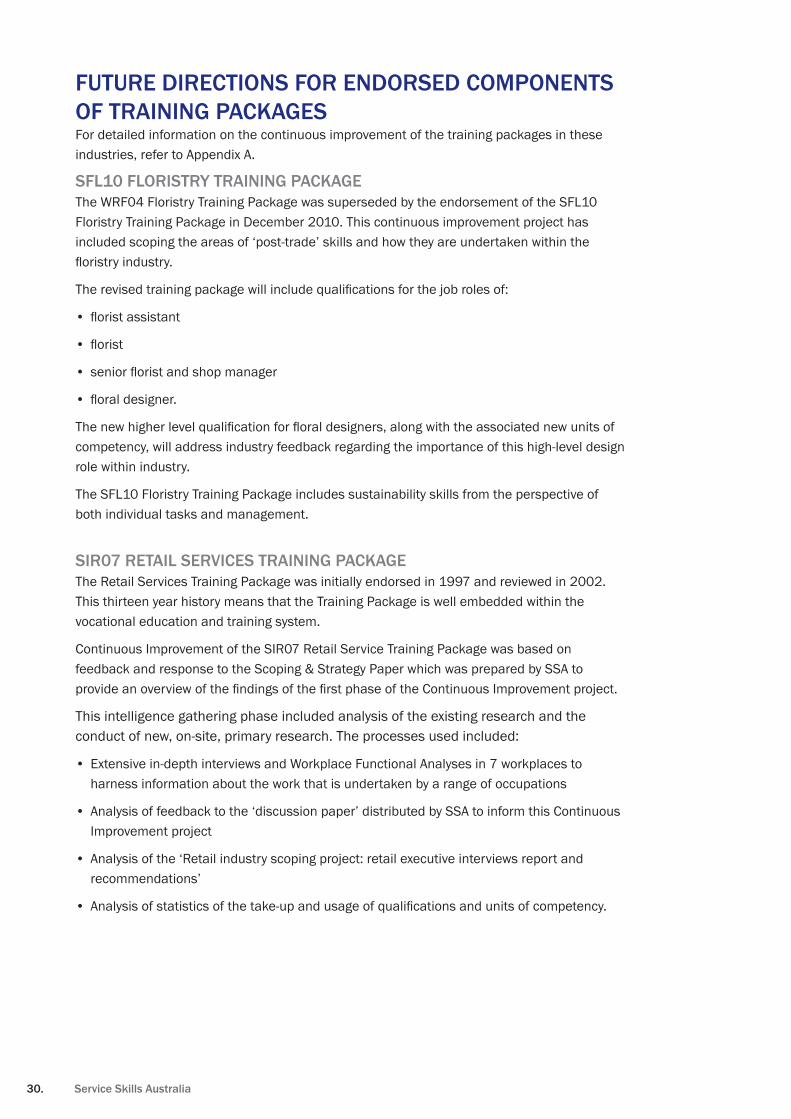
30. service skills australia
future directions for endorsed comPonents of training PackagesFor detailed information on the continuous improvement of the training packages in these industries, refer to Appendix A .
sfl10 floristry training PackageThe WRF04 Floristry Training Package was superseded by the endorsement of the SFL10 Floristry Training Package in December 2010 . This continuous improvement project has included scoping the areas of ‘post-trade’ skills and how they are undertaken within the floristry industry.
The revised training package will include qualifications for the job roles of:
florist assistant•
florist•
senior florist and shop manager•
floral designer.•
The new higher level qualification for floral designers, along with the associated new units of competency, will address industry feedback regarding the importance of this high-level design role within industry .
The SFL10 Floristry Training Package includes sustainability skills from the perspective of both individual tasks and management .
sir07 retail services training PackageThe Retail Services Training Package was initially endorsed in 1997 and reviewed in 2002 . This thirteen year history means that the Training Package is well embedded within the vocational education and training system .
Continuous Improvement of the SIR07 Retail Service Training Package was based on feedback and response to the Scoping & Strategy Paper which was prepared by SSA to provide an overview of the findings of the first phase of the Continuous Improvement project.
This intelligence gathering phase included analysis of the existing research and the conduct of new, on-site, primary research. The processes used included:
Extensive in-depth interviews and Workplace Functional Analyses in 7 workplaces to • harness information about the work that is undertaken by a range of occupations
Analysis of feedback to the ‘discussion paper’ distributed by SSA to inform this Continuous • Improvement project
Analysis of the ‘Retail industry scoping project: retail executive interviews report and • recommendations’
Analysis of statistics of the take-up and usage of qualifications and units of competency. •
Retail, Wholesale and Floristry Services environmental scan 2011 31.
The Scoping & Strategy Report was developed to:
Identify existing retail or wholesale specific units of competency that required review or potential • merging or deletion
Identify new units of competency and qualifications that are required to meet contemporary and • emerging industry needs
Identify existing units that are of a more generic nature (for example, in administration or HR) and • which could be readily replaced by other imported units
The suite of qualifications in SIR07 has evolved over a number of years and, in large part, meets the needs of front line retail staff .
In general, the broad review approaches for existing and new qualifications were:
certificate i in retail Review of qualification location and position
certificate ii in retail Minor review of packaging rules to conform with NQC requirements
certificate iii in retail Minor review of packaging rules to conform with NQC requirements
certificate iV in retail management
Review of packaging rules focused on retailing and elective groups
diploma of visual merchandising Review to clarify intended audience for the qualification
diploma of retail management Review of packaging rules focused on retailing and elective groups
Vocational Graduate certificate in retail manager
New qualification to provide ‘narrow but deep’ skills that contain a blend of sophisticated management skills coupled with selection of elective groups in visual merchandising, buying or regional/area management
certificate ii in Wholesale To be replaced by new qualification – Certificate III Business to Business
certificate iii in Wholesale To be replaced by new qualification – Certificate III Business to Business
Appendix C provides information on occupations in demand in the retail, wholesale and floristry industries .
32. service skills australia
aPPendix a – rePort of continuous imProvement training Package sir11 retail training Package
brief summary of change industry imPeratives/rationale for change
date submitted to nQc secretariat
date endorsed by nQc/or isc uPgrade
date made Public through ntis
Service Skills Australia commenced the continuous improvement of SIR07 Retail Services Training Package in June 2010 .A Scoping & Strategy paper was prepared to provide an overview of the findings of the first phase of the Continuous Improvement project to update and enhance key components of the SIR07 Retail Training Package .The Retail Services Training Package was initially endorsed in 1997 and reviewed in 2002 . This thirteen year history means that the Training Package is well embedded within the vocational education and training system . During 2008 approximately 18,000 qualifications in retailing and wholesale operations were awarded . Understandably, more qualifications were awarded at the lower AQF levels with a peak occurring at the Certificate II level where almost 10,000 qualifications were completed in 2008 .The Scoping & Strategy Report has been developed to:Identify existing retail or wholesale specific units of competency that require review or potential merging or deletionIdentify new units of competency and qualifications that are required to meet contemporary and emerging industry needs
SIR07 Retail Services Training Package was last reviewed and endorsed in 2002The current suite of qualifications has evolved over a number of years and, in large part, meets the needs of front line retail staff .While the review of packaging rules, largely required by the NQC, will provide some added flexibility there is no particular evidence that would indicate the overarching size or structure of the majority of qualifications are significantly deficient. It is proposed to develop a suite of new units of competency to ‘round out’ the existing qualifications and support the development of the new Vocational Graduate Certificate. The new unit titles provide an indicator of their direction and content . Further work during the development phase will be undertaken to ensure relevance of content .
Expected March 2011
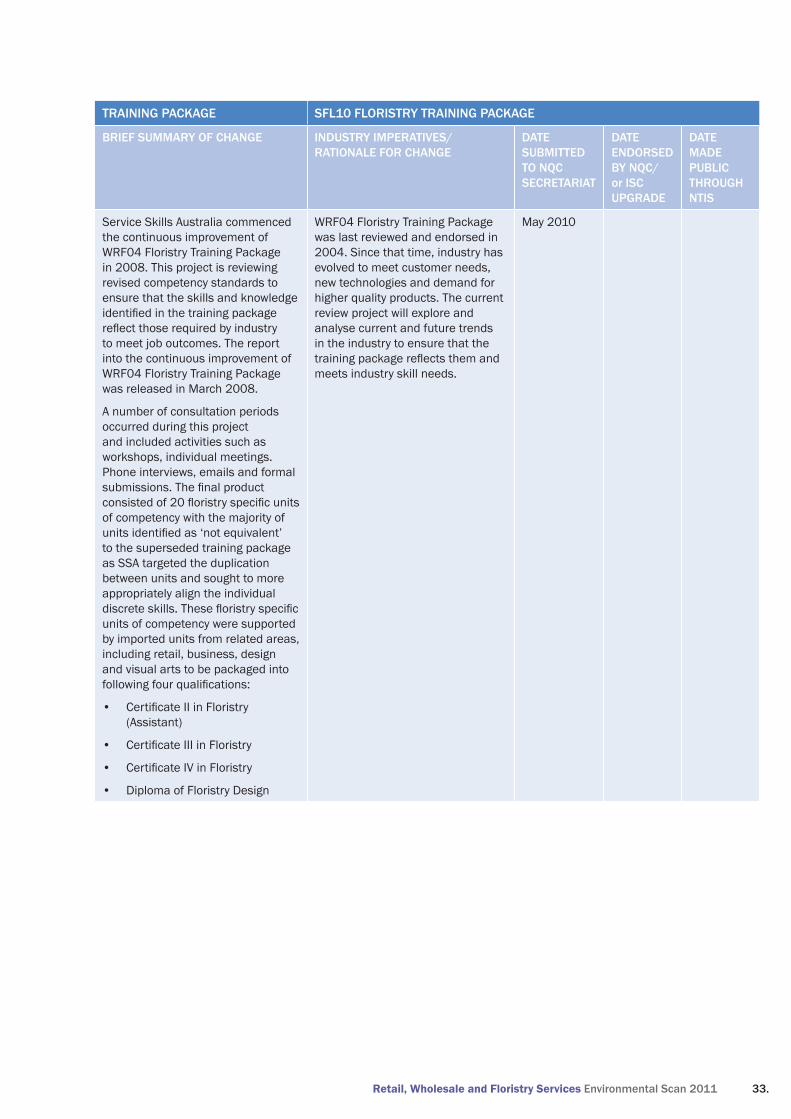
Retail, Wholesale and Floristry Services environmental scan 2011 33.
training Package sfl10 floristry training Package
brief summary of change industry imPeratives/rationale for change
date submitted to nQc secretariat
date endorsed by nQc/or isc uPgrade
date made Public through ntis
Service Skills Australia commenced the continuous improvement of WRF04 Floristry Training Package in 2008 . This project is reviewing revised competency standards to ensure that the skills and knowledge identified in the training package reflect those required by industry to meet job outcomes . The report into the continuous improvement of WRF04 Floristry Training Package was released in March 2008 .
A number of consultation periods occurred during this project and included activities such as workshops, individual meetings . Phone interviews, emails and formal submissions. The final product consisted of 20 floristry specific units of competency with the majority of units identified as ‘not equivalent’ to the superseded training package as SSA targeted the duplication between units and sought to more appropriately align the individual discrete skills. These floristry specific units of competency were supported by imported units from related areas, including retail, business, design and visual arts to be packaged into following four qualifications:
Certificate II in Floristry • (Assistant)
Certificate III in Floristry•
Certificate IV in Floristry •
Diploma of Floristry Design •
WRF04 Floristry Training Package was last reviewed and endorsed in 2004 . Since that time, industry has evolved to meet customer needs, new technologies and demand for higher quality products . The current review project will explore and analyse current and future trends in the industry to ensure that the training package reflects them and meets industry skill needs .
May 2010
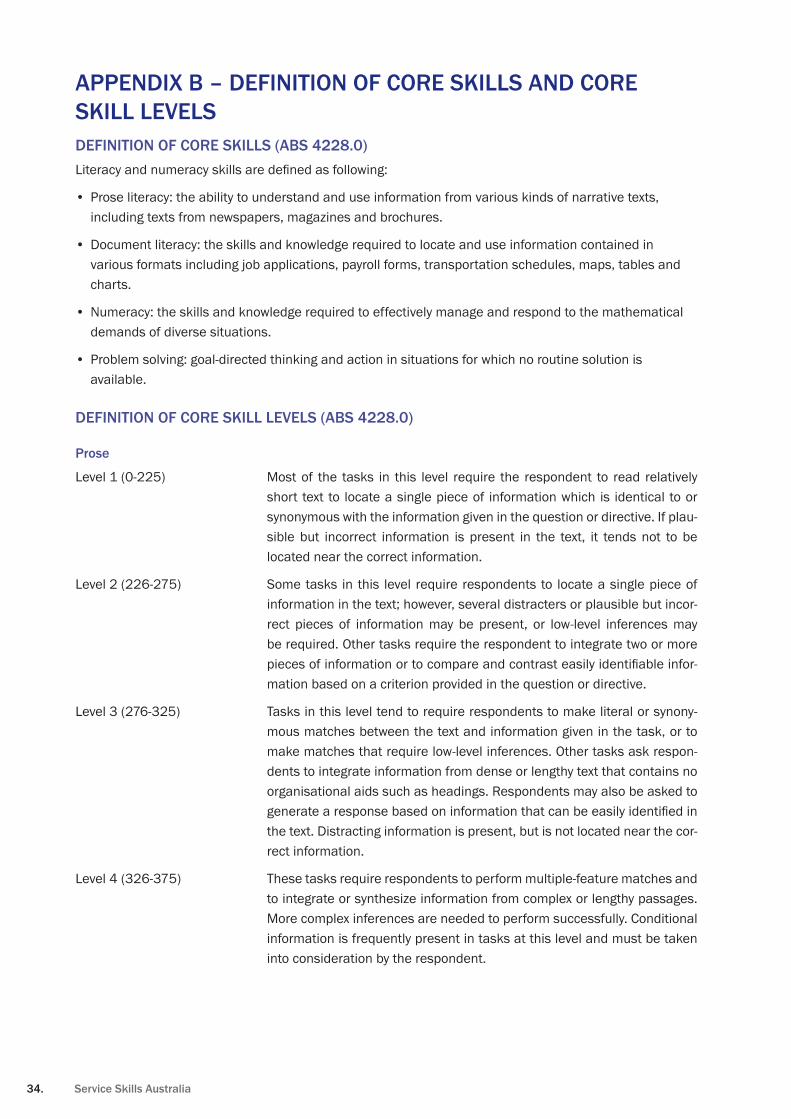
34. service skills australia
aPPendix b – definition of core skills and core skill levelsdefinition of core skills (abs 4228.0)Literacy and numeracy skills are defined as following:
Prose literacy: the ability to understand and use information from various kinds of narrative texts, • including texts from newspapers, magazines and brochures .
Document literacy: the skills and knowledge required to locate and use information contained in • various formats including job applications, payroll forms, transportation schedules, maps, tables and charts .
Numeracy: the skills and knowledge required to effectively manage and respond to the mathematical • demands of diverse situations .
Problem solving: goal-directed thinking and action in situations for which no routine solution is • available .
definition of core skill levels (abs 4228.0)
Prose
Level 1 (0-225) Most of the tasks in this level require the respondent to read relatively short text to locate a single piece of information which is identical to or synonymous with the information given in the question or directive . If plau-sible but incorrect information is present in the text, it tends not to be located near the correct information .
Level 2 (226-275) Some tasks in this level require respondents to locate a single piece of information in the text; however, several distracters or plausible but incor-rect pieces of information may be present, or low-level inferences may be required . Other tasks require the respondent to integrate two or more pieces of information or to compare and contrast easily identifiable infor-mation based on a criterion provided in the question or directive .
Level 3 (276-325) Tasks in this level tend to require respondents to make literal or synony-mous matches between the text and information given in the task, or to make matches that require low-level inferences . Other tasks ask respon-dents to integrate information from dense or lengthy text that contains no organisational aids such as headings . Respondents may also be asked to generate a response based on information that can be easily identified in the text . Distracting information is present, but is not located near the cor-rect information .
Level 4 (326-375) These tasks require respondents to perform multiple-feature matches and to integrate or synthesize information from complex or lengthy passages . More complex inferences are needed to perform successfully . Conditional information is frequently present in tasks at this level and must be taken into consideration by the respondent .
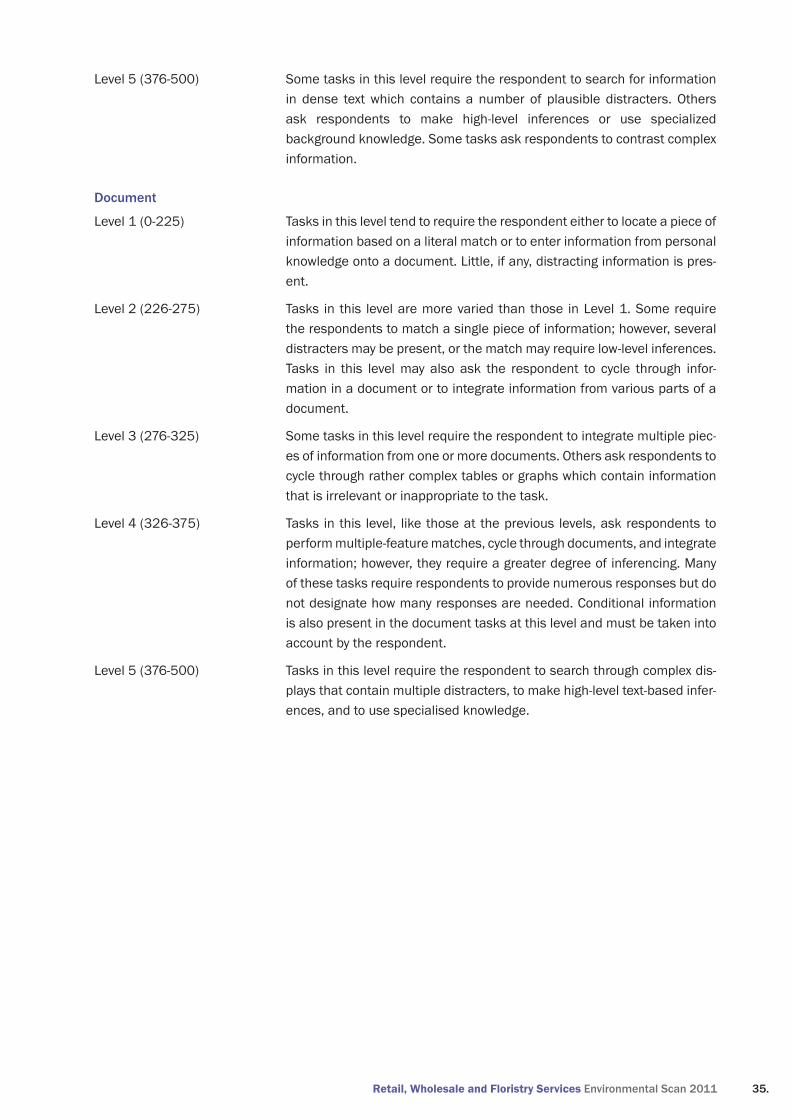
Retail, Wholesale and Floristry Services environmental scan 2011 35.
Level 5 (376-500) Some tasks in this level require the respondent to search for information in dense text which contains a number of plausible distracters . Others ask respondents to make high-level inferences or use specialized background knowledge . Some tasks ask respondents to contrast complex information .
document
Level 1 (0-225) Tasks in this level tend to require the respondent either to locate a piece of information based on a literal match or to enter information from personal knowledge onto a document . Little, if any, distracting information is pres-ent .
Level 2 (226-275) Tasks in this level are more varied than those in Level 1 . Some require the respondents to match a single piece of information; however, several distracters may be present, or the match may require low-level inferences . Tasks in this level may also ask the respondent to cycle through infor-mation in a document or to integrate information from various parts of a document .
Level 3 (276-325) Some tasks in this level require the respondent to integrate multiple piec-es of information from one or more documents . Others ask respondents to cycle through rather complex tables or graphs which contain information that is irrelevant or inappropriate to the task .
Level 4 (326-375) Tasks in this level, like those at the previous levels, ask respondents to perform multiple-feature matches, cycle through documents, and integrate information; however, they require a greater degree of inferencing . Many of these tasks require respondents to provide numerous responses but do not designate how many responses are needed . Conditional information is also present in the document tasks at this level and must be taken into account by the respondent .
Level 5 (376-500) Tasks in this level require the respondent to search through complex dis-plays that contain multiple distracters, to make high-level text-based infer-ences, and to use specialised knowledge .
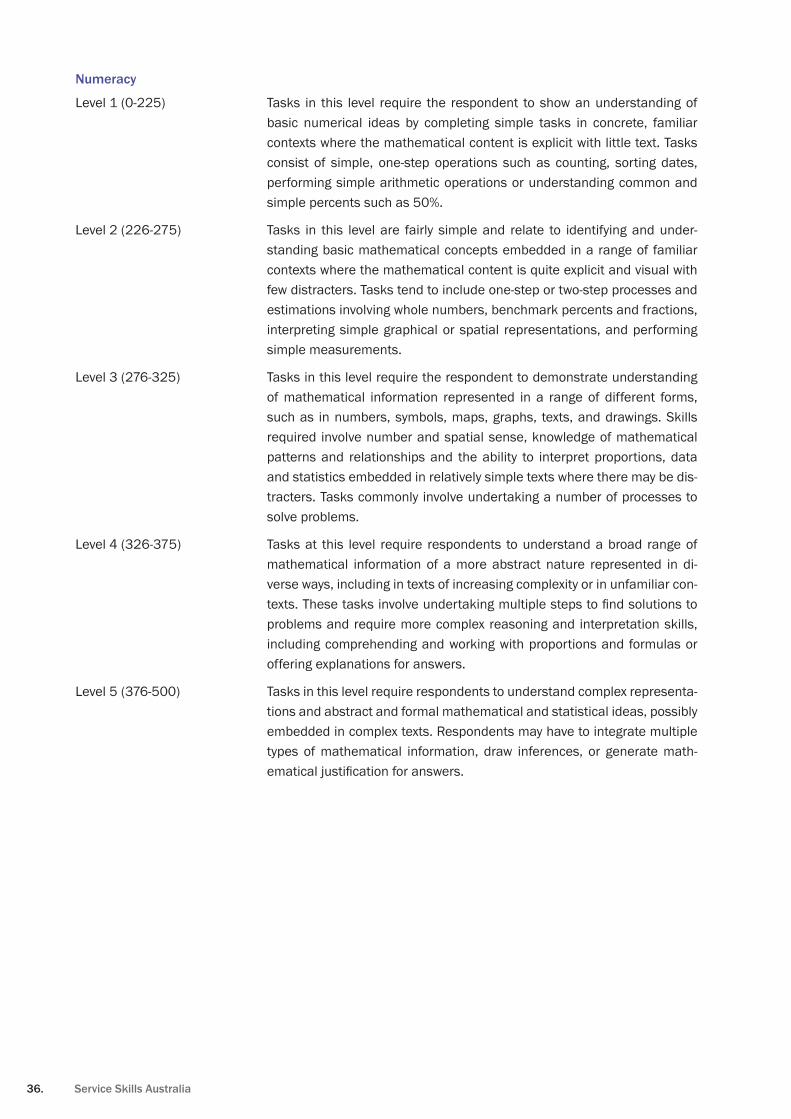
36. service skills australia
numeracy
Level 1 (0-225) Tasks in this level require the respondent to show an understanding of basic numerical ideas by completing simple tasks in concrete, familiar contexts where the mathematical content is explicit with little text . Tasks consist of simple, one-step operations such as counting, sorting dates, performing simple arithmetic operations or understanding common and simple percents such as 50% .
Level 2 (226-275) Tasks in this level are fairly simple and relate to identifying and under-standing basic mathematical concepts embedded in a range of familiar contexts where the mathematical content is quite explicit and visual with few distracters . Tasks tend to include one-step or two-step processes and estimations involving whole numbers, benchmark percents and fractions, interpreting simple graphical or spatial representations, and performing simple measurements .
Level 3 (276-325) Tasks in this level require the respondent to demonstrate understanding of mathematical information represented in a range of different forms, such as in numbers, symbols, maps, graphs, texts, and drawings . Skills required involve number and spatial sense, knowledge of mathematical patterns and relationships and the ability to interpret proportions, data and statistics embedded in relatively simple texts where there may be dis-tracters . Tasks commonly involve undertaking a number of processes to solve problems .
Level 4 (326-375) Tasks at this level require respondents to understand a broad range of mathematical information of a more abstract nature represented in di-verse ways, including in texts of increasing complexity or in unfamiliar con-texts. These tasks involve undertaking multiple steps to find solutions to problems and require more complex reasoning and interpretation skills, including comprehending and working with proportions and formulas or offering explanations for answers .
Level 5 (376-500) Tasks in this level require respondents to understand complex representa-tions and abstract and formal mathematical and statistical ideas, possibly embedded in complex texts . Respondents may have to integrate multiple types of mathematical information, draw inferences, or generate math-ematical justification for answers.
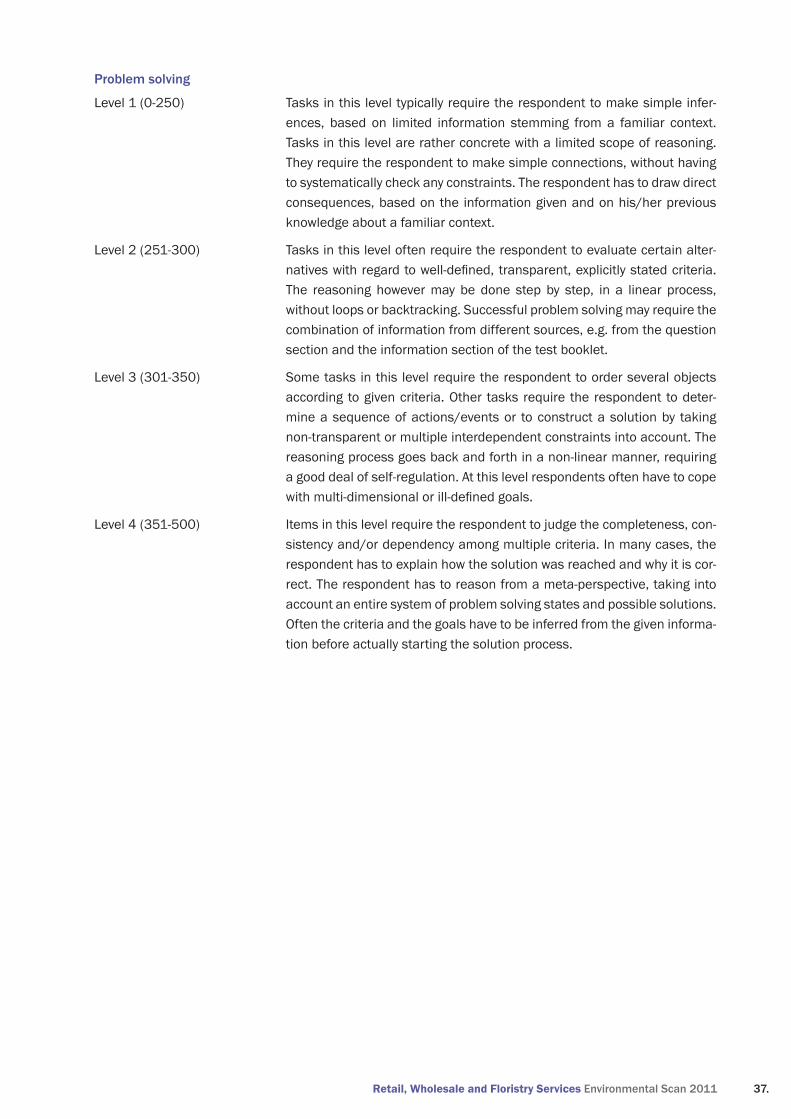
Retail, Wholesale and Floristry Services environmental scan 2011 37.
Problem solving
Level 1 (0-250) Tasks in this level typically require the respondent to make simple infer-ences, based on limited information stemming from a familiar context . Tasks in this level are rather concrete with a limited scope of reasoning . They require the respondent to make simple connections, without having to systematically check any constraints . The respondent has to draw direct consequences, based on the information given and on his/her previous knowledge about a familiar context .
Level 2 (251-300) Tasks in this level often require the respondent to evaluate certain alter-natives with regard to well-defined, transparent, explicitly stated criteria. The reasoning however may be done step by step, in a linear process, without loops or backtracking . Successful problem solving may require the combination of information from different sources, e .g . from the question section and the information section of the test booklet .
Level 3 (301-350) Some tasks in this level require the respondent to order several objects according to given criteria . Other tasks require the respondent to deter-mine a sequence of actions/events or to construct a solution by taking non-transparent or multiple interdependent constraints into account . The reasoning process goes back and forth in a non-linear manner, requiring a good deal of self-regulation . At this level respondents often have to cope with multi-dimensional or ill-defined goals.
Level 4 (351-500) Items in this level require the respondent to judge the completeness, con-sistency and/or dependency among multiple criteria . In many cases, the respondent has to explain how the solution was reached and why it is cor-rect . The respondent has to reason from a meta-perspective, taking into account an entire system of problem solving states and possible solutions . Often the criteria and the goals have to be inferred from the given informa-tion before actually starting the solution process .
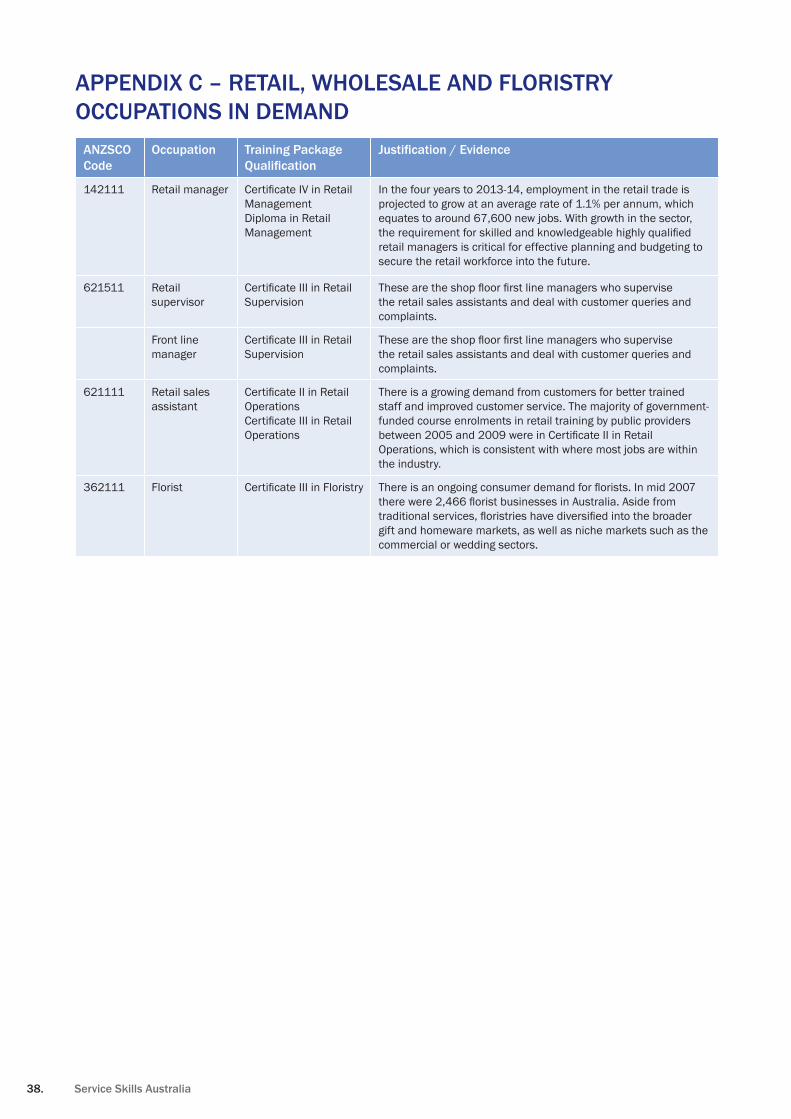
38. service skills australia
aPPendix c – retail, Wholesale and floristry occuPations in demand
anZsco code
occupation training Package qualification
Justification / evidence
142111 Retail manager Certificate IV in Retail ManagementDiploma in Retail Management
In the four years to 2013-14, employment in the retail trade is projected to grow at an average rate of 1 .1% per annum, which equates to around 67,600 new jobs . With growth in the sector, the requirement for skilled and knowledgeable highly qualified retail managers is critical for effective planning and budgeting to secure the retail workforce into the future .
621511 Retail supervisor
Certificate III in Retail Supervision
These are the shop floor first line managers who supervise the retail sales assistants and deal with customer queries and complaints .
Front line manager
Certificate III in Retail Supervision
These are the shop floor first line managers who supervise the retail sales assistants and deal with customer queries and complaints .
621111 Retail sales assistant
Certificate II in Retail OperationsCertificate III in Retail Operations
There is a growing demand from customers for better trained staff and improved customer service . The majority of government-funded course enrolments in retail training by public providers between 2005 and 2009 were in Certificate II in Retail Operations, which is consistent with where most jobs are within the industry .
362111 Florist Certificate III in Floristry There is an ongoing consumer demand for florists. In mid 2007 there were 2,466 florist businesses in Australia. Aside from traditional services, floristries have diversified into the broader gift and homeware markets, as well as niche markets such as the commercial or wedding sectors .
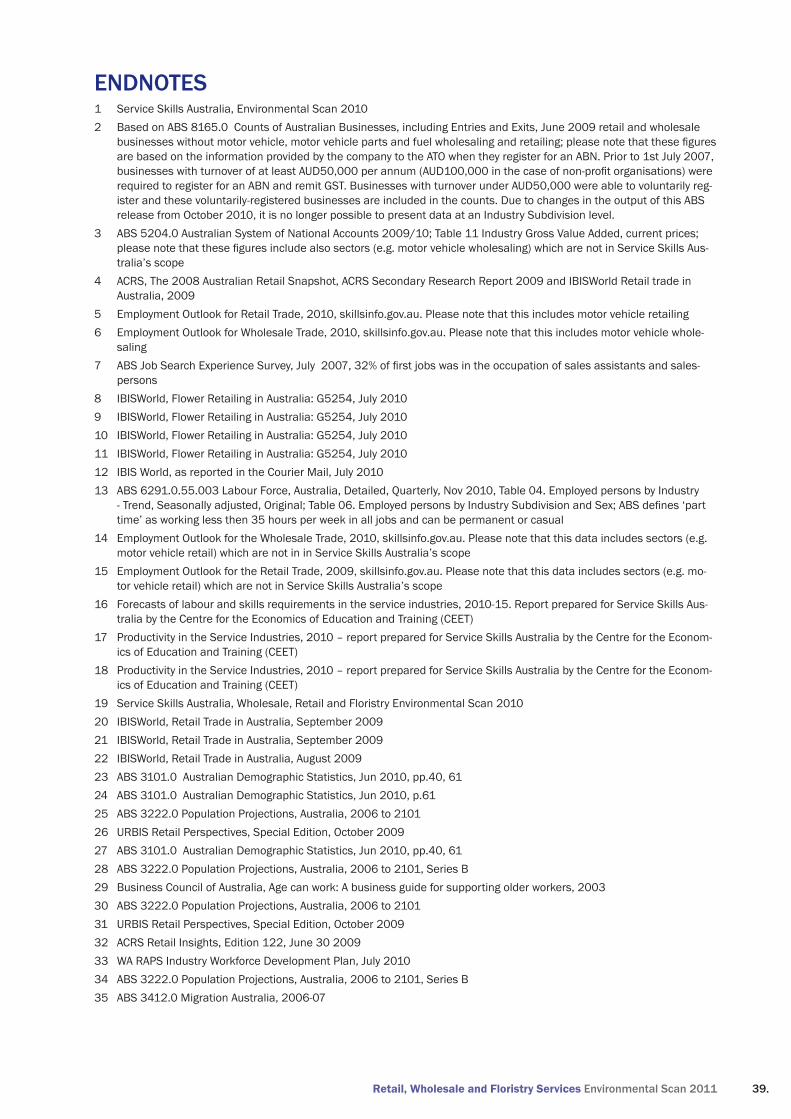
Retail, Wholesale and Floristry Services environmental scan 2011 39.
endnotes1 Service Skills Australia, Environmental Scan 20102 Based on ABS 8165 .0 Counts of Australian Businesses, including Entries and Exits, June 2009 retail and wholesale
businesses without motor vehicle, motor vehicle parts and fuel wholesaling and retailing; please note that these figures are based on the information provided by the company to the ATO when they register for an ABN . Prior to 1st July 2007, businesses with turnover of at least AUD50,000 per annum (AUD100,000 in the case of non-profit organisations) were required to register for an ABN and remit GST . Businesses with turnover under AUD50,000 were able to voluntarily reg-ister and these voluntarily-registered businesses are included in the counts . Due to changes in the output of this ABS release from October 2010, it is no longer possible to present data at an Industry Subdivision level .
3 ABS 5204 .0 Australian System of National Accounts 2009/10; Table 11 Industry Gross Value Added, current prices; please note that these figures include also sectors (e.g. motor vehicle wholesaling) which are not in Service Skills Aus-tralia’s scope
4 ACRS, The 2008 Australian Retail Snapshot, ACRS Secondary Research Report 2009 and IBISWorld Retail trade in Australia, 2009
5 Employment Outlook for Retail Trade, 2010, skillsinfo .gov .au . Please note that this includes motor vehicle retailing6 Employment Outlook for Wholesale Trade, 2010, skillsinfo .gov .au . Please note that this includes motor vehicle whole-
saling7 ABS Job Search Experience Survey, July 2007, 32% of first jobs was in the occupation of sales assistants and sales-
persons8 IBISWorld, Flower Retailing in Australia: G5254, July 20109 IBISWorld, Flower Retailing in Australia: G5254, July 201010 IBISWorld, Flower Retailing in Australia: G5254, July 201011 IBISWorld, Flower Retailing in Australia: G5254, July 201012 IBIS World, as reported in the Courier Mail, July 201013 ABS 6291 .0 .55 .003 Labour Force, Australia, Detailed, Quarterly, Nov 2010, Table 04 . Employed persons by Industry
- Trend, Seasonally adjusted, Original; Table 06. Employed persons by Industry Subdivision and Sex; ABS defines ‘part time’ as working less then 35 hours per week in all jobs and can be permanent or casual
14 Employment Outlook for the Wholesale Trade, 2010, skillsinfo .gov .au . Please note that this data includes sectors (e .g . motor vehicle retail) which are not in in Service Skills Australia’s scope
15 Employment Outlook for the Retail Trade, 2009, skillsinfo .gov .au . Please note that this data includes sectors (e .g . mo-tor vehicle retail) which are not in Service Skills Australia’s scope
16 Forecasts of labour and skills requirements in the service industries, 2010-15 . Report prepared for Service Skills Aus-tralia by the Centre for the Economics of Education and Training (CEET)
17 Productivity in the Service Industries, 2010 – report prepared for Service Skills Australia by the Centre for the Econom-ics of Education and Training (CEET)
18 Productivity in the Service Industries, 2010 – report prepared for Service Skills Australia by the Centre for the Econom-ics of Education and Training (CEET)
19 Service Skills Australia, Wholesale, Retail and Floristry Environmental Scan 201020 IBISWorld, Retail Trade in Australia, September 200921 IBISWorld, Retail Trade in Australia, September 200922 IBISWorld, Retail Trade in Australia, August 200923 ABS 3101 .0 Australian Demographic Statistics, Jun 2010, pp .40, 61 24 ABS 3101 .0 Australian Demographic Statistics, Jun 2010, p .61 25 ABS 3222 .0 Population Projections, Australia, 2006 to 210126 URBIS Retail Perspectives, Special Edition, October 200927 ABS 3101 .0 Australian Demographic Statistics, Jun 2010, pp .40, 61 28 ABS 3222 .0 Population Projections, Australia, 2006 to 2101, Series B29 Business Council of Australia, Age can work: A business guide for supporting older workers, 200330 ABS 3222 .0 Population Projections, Australia, 2006 to 2101 31 URBIS Retail Perspectives, Special Edition, October 200932 ACRS Retail Insights, Edition 122, June 30 200933 WA RAPS Industry Workforce Development Plan, July 201034 ABS 3222 .0 Population Projections, Australia, 2006 to 2101, Series B35 ABS 3412 .0 Migration Australia, 2006-07
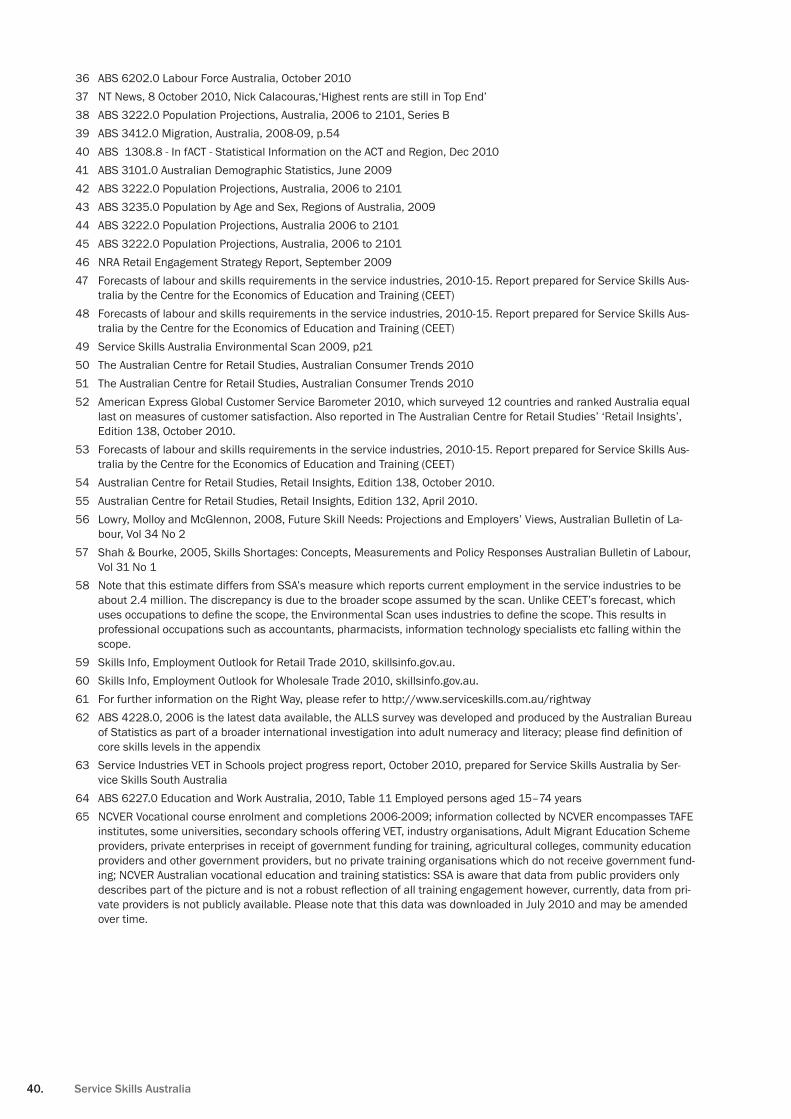
40. service skills australia
36 ABS 6202 .0 Labour Force Australia, October 201037 NT News, 8 October 2010, Nick Calacouras,‘Highest rents are still in Top End’38 ABS 3222 .0 Population Projections, Australia, 2006 to 2101, Series B39 ABS 3412 .0 Migration, Australia, 2008-09, p .5440 ABS 1308 .8 - In fACT - Statistical Information on the ACT and Region, Dec 201041 ABS 3101 .0 Australian Demographic Statistics, June 200942 ABS 3222 .0 Population Projections, Australia, 2006 to 2101 43 ABS 3235 .0 Population by Age and Sex, Regions of Australia, 200944 ABS 3222 .0 Population Projections, Australia 2006 to 210145 ABS 3222 .0 Population Projections, Australia, 2006 to 2101 46 NRA Retail Engagement Strategy Report, September 200947 Forecasts of labour and skills requirements in the service industries, 2010-15 . Report prepared for Service Skills Aus-
tralia by the Centre for the Economics of Education and Training (CEET)48 Forecasts of labour and skills requirements in the service industries, 2010-15 . Report prepared for Service Skills Aus-
tralia by the Centre for the Economics of Education and Training (CEET)49 Service Skills Australia Environmental Scan 2009, p2150 The Australian Centre for Retail Studies, Australian Consumer Trends 201051 The Australian Centre for Retail Studies, Australian Consumer Trends 201052 American Express Global Customer Service Barometer 2010, which surveyed 12 countries and ranked Australia equal
last on measures of customer satisfaction . Also reported in The Australian Centre for Retail Studies’ ‘Retail Insights’, Edition 138, October 2010 .
53 Forecasts of labour and skills requirements in the service industries, 2010-15 . Report prepared for Service Skills Aus-tralia by the Centre for the Economics of Education and Training (CEET)
54 Australian Centre for Retail Studies, Retail Insights, Edition 138, October 2010 .55 Australian Centre for Retail Studies, Retail Insights, Edition 132, April 2010 .56 Lowry, Molloy and McGlennon, 2008, Future Skill Needs: Projections and Employers’ Views, Australian Bulletin of La-
bour, Vol 34 No 257 Shah & Bourke, 2005, Skills Shortages: Concepts, Measurements and Policy Responses Australian Bulletin of Labour,
Vol 31 No 158 Note that this estimate differs from SSA’s measure which reports current employment in the service industries to be
about 2 .4 million . The discrepancy is due to the broader scope assumed by the scan . Unlike CEET’s forecast, which uses occupations to define the scope, the Environmental Scan uses industries to define the scope. This results in professional occupations such as accountants, pharmacists, information technology specialists etc falling within the scope .
59 Skills Info, Employment Outlook for Retail Trade 2010, skillsinfo .gov .au .60 Skills Info, Employment Outlook for Wholesale Trade 2010, skillsinfo .gov .au .61 For further information on the Right Way, please refer to http://www.serviceskills.com.au/rightway62 ABS 4228 .0, 2006 is the latest data available, the ALLS survey was developed and produced by the Australian Bureau
of Statistics as part of a broader international investigation into adult numeracy and literacy; please find definition of core skills levels in the appendix
63 Service Industries VET in Schools project progress report, October 2010, prepared for Service Skills Australia by Ser-vice Skills South Australia
64 ABS 6227 .0 Education and Work Australia, 2010, Table 11 Employed persons aged 15–74 years65 NCVER Vocational course enrolment and completions 2006-2009; information collected by NCVER encompasses TAFE
institutes, some universities, secondary schools offering VET, industry organisations, Adult Migrant Education Scheme providers, private enterprises in receipt of government funding for training, agricultural colleges, community education providers and other government providers, but no private training organisations which do not receive government fund-ing; NCVER Australian vocational education and training statistics: SSA is aware that data from public providers only describes part of the picture and is not a robust reflection of all training engagement however, currently, data from pri-vate providers is not publicly available . Please note that this data was downloaded in July 2010 and may be amended over time .


published by Service Skills Australia
2011