environmental policy analysis, peer reviewed: cost–benefit and uncertainty issues in using organic...
TRANSCRIPT
ENVIRONMENTAL POLICY ANALYSIS
AIR QUALITY
Cost-Benefit and Uncertainty Issues in Using Organic Reactivity to Regulate Urban Ozone SANDRA J. MCBRIDE Department of Statistics Stanford University Stanford, CA 94305
MATTHEW A. ORAVETZ Department of Engineering and Public Policy Carnegie Mellon University Pittsburgh, PA 15213
ARMISTEAD G. RUSSELL School of Civil aad Environmental Engineering Georgia Institute of Technology Atlanta, GA A0332-0512
The costs and benefits of urban ozone control strategies based on regulation of ozone-forming potential, or reactivity, of volatile organic carbon (VOC) emissions are quantified using a mixed-integer linear programming model. Optimal regulatory strategies are chosen on the basis of calculated reactivity of source emissions as well as cost and technology constraints. Model results depict the impacts of reactivity-based regulation on overall cost-effectiveness of controls and on prioritization of control technology implementation. The results are robust to uncertainties in reactivity and emission levels. This study suggests how reactivity information can be used to determine the most appropriate, cost-effective control strategies for emission reductions.
Despite considerable federal and state investment in urban ozone control strategies, efforts to attain the National Ambient Air Quality Standard for ozone have been less successful than anticipated (i). Urban ozone is produced by nonlinear reactions between volatile organic compounds (VOCs) and nitrogen oxides (NO.,.). NOx control appears to be effective in rural areas and some cities, but VOC control is effective in large urban areas such as the Los Angeles South Coast Air Basin (SoCAB) and Chicago, which have severe ozone problems. Current federal VOC regulations categorize fill VOC emissions 3.s either re<ic-tive or unreactive relative to ethane However, ozone-forming potentials of VOCs differ significantly. Of the almost 300 organic species identified in the urban atmosphere, some species—such as alkenes, most aromatic VOCs, and aldehydes—can lead to ozone formation of an order of magnitude greater than that of other VOCs, such as alkanes, benzene, alcohols, and ethers (2). Such disparities in emissions have tremendous implications as regulators consider strategies to tighten existing VOC controls.
Estimating ozone-forming potential Organic or photochemical reactivity is the potential of an organic compound to promote formation of products such as ozone. In this study, reactivity is defined as the increased ozone yield caused by an incremental change in VOC concentration from an assumed mixture of compounds in an ambient air analysis. For a given organic compound i, Rt is defined as the ratio of the change in ozone formation to the change in VOC emissions, as in Equation 1.
"•=m Because of its dependence on environmental con
ditions, organic reactivity cannot be measured directly. To derive incremental reactivity scales for the SoCAB, Carter (3) used a single-cell box model to simulate changes in ozone formation in one-day episodes due to a small increase in emissions of a particular VOC. Because reactivity scales are sensitive to the level of NO.,., and because that level may vary significantly, rates of NO .̂ input and removal must be carefully represented. VOC/NOx ratios are insufficient for characterizing this level of NO .̂ detail. Thus, reactivity scales are defined with respect to NO^ inputs. The maximum incremental reactivity (MIR) scale is defined at the NOx level at which the VOC produces the maximum change in ozone:
MIRj = Max—-2- {Z> NOX oE,
Under these NO, conditions, ozone formation is
0013-936X/97/0931-238AS14.00/0 © 1997 American Chemical Society 2 3 8 A • VOL. 31, NO. 5, 1997 / ENVIRONMENTAL SCIENCE & TECHNOLOGY / NEWS
determined by the amount and reactivity of VOC compounds available. The MIR scale has been examined in studies of Los Angeles, which has a low VOC/NO .̂ ratio (4, 5). Other scales can also be defined on the basis of NO,,. availability (3).
It has been recognized, primarily through alternative fuel studies, that changing the reactivity of emissions could improve air quality. For example, methanol-fueled vehicle emissions are potentially less reactive than those from conventionally fueled vehicles (6,7). Even as policymakers consider possible pollution prevention associated with tighter mobile and stationary source controls and VOC emission trading programs, there has been growing interest in regulatory strategies that account for the differing atmospheric impacts of organic emissions.
By assigning each source a reactivity based on its emission profile, sources can be compared with respect to their atmospheric impacts per ton of emissions. To measure the effect of a source's emissions relative to ozone, a linear combination of reactivities and mass emission rates is calculated for a given emission composition profile. To determine the ozone formed per unit mass of VOC emissions from an anthropogenic source i, Rt, the MIR of each compound it in the emission profile is multiplied by the mass fraction of compound k in the emissions, fki, and the weighted emission fractions are summed.
Rt = ^ (fki x MIRk), k = 1 , . . . , m compounds (3) k
Reactivity, mass emission rates, and emission composition profiles are uncertain quantities, however, and their effects are examined below.
Although EPA has studied regulations explicitly accounting for individual VOC reactivity (8), they have not been implemented. EPA regulates VOCs based on mass of reactive emissions. Reactivity is determined according to a two-tiered reactivity scale, based on OH rate constants, whereby compounds less reactive than ethane are classified as negligibly reactive and all others are classified as reactive. The Clean Air Act Amendments of 1990, Section 183(3), direct EPA to account for reactivity in developing VOC control strategies for consumer and commercial products. A complete review of EPA's current research in response to Section 183(e) is given in Dimitriades (9). Areas of concern to EPA include uncertainties in chemical mechanisms and in composition and reactivity data which do not allow for precise quan-utication of absolute reactivities.
California air regulators have led efforts to promulgate reactivity-based regulations. The California Air Resources Board (CARB) was the first to use a detailed reactivity scale when it created low-emission vehicle regulations. CARB mandated the use
of "reactivity adjustment factors" (RAFs), which compared the reactivity of emissions to those of gasoline, to regulate emissions from alternative fuels. RAF regulations were designed to put alternative fuels on an equal regulatory playing field with gasoline to determine the relative impact of their emissions on ozone formation. CARB also has been investigating reactivity-based regulations for stationary sources (10). Currently, CARB uses s swo-tiered rractivity scale, designating all compounds less reactive than methane as unreactive. The board is also considering exemption of ethane and acetone from VOC definitions in consumer product regulations. Regulators at CARB and the South Coast Air Quality Management District (SCAQMD) have not yet implemented reactivity-based regulations for all station-
Reformulation strategies for mobile and stationary sources should account for the changes in reactivity of the reformulated product; otherwise, air quality may be degraded. Under its reformulated gasoline program, CARB notes that replacement of aromatic VOCs with less reactive alkanes in reformulated gas could increase reactivity because alkanes are combustion precursors of highly reactive alkenes (11). In the surface coatings industry, regulations to reduce VOC mass emissions have produced a shift from petroleum VOC solvent-borne coatings to low-volatility organic compound waterborne coatings. Organic co-solvents such as ethylene glycol, propylene glycol, and glycol ethers are still present in waterborne paints at low total VOC levels. Whether some of these newer organic cosolvents are more or less reactive than the petroleum distillates used in solvent-borne paints remains an ODen question (12)
To address some of these issues, a mixed-integer linear programming formulation was used to model the cost differences between a comprehensive reactivity-based regulatory strategy and a mass-based strategy. This work builds on previous research (13-16) that examined air quality-based standards within an optimization framework. Atkinson and Lewis (13) compared least-cost strategies for meeting air quality standards with those for reducing emissions and concluded that ambient least-cost strategies should be used in cost-benefit analyses to establish regulatory standards. Trijonis (14) developed a linear programming model to determine the relationship between cost and emissions and combined it with a nonlinear model describing air quality and emissions for the Los Angeles basin Our study will revisit many of the questions posed bv these papers using a reactivity scale verified bv advanced photochemical modeling tech-niques (5) as well as improved data on emissions and costs,
VOL.31, NO. 5, 1997/ENVIRONMENTAL SCIENCE & TECHNOLOGY / NEWS • 2 3 9 A
Modeling ozone reductions To quantify the cost advantages of reactivity-based regulations, a static optimization model was developed and optimal control strategies of each regulatory scenario were compared. Computations were performed in the GAMS programming language (GAMS Development Corp., Washington, D.C.).
The problem is to maximize ozone reductions, expressed as mass emissions multiplied by reactivity, under the constraints of budget, available time, and each technology's abatement potential. The problem is formulated as a long-term mixed-integer linear programming model {17). There are N controllable emission sources, each with P different types of control methods. Each source i emits a volume of VOCs, Et, in tons per day. Each source's emission composition is assigned a reactivity, Rp in terms of tons of ozone per ton of VOC emitted. For a given source i and control method /, an associated cost in dollars per ton, C-, ts assigned. Each control method is capable of reducing a certain fraction of emissions, F A fixed abatement budget is assumed represented in. dollfirs per dsv cis total cost (TC). The goal of this model is to select VOC emission reductions M for a given source i and control method ; Model output is a matrix of emission reductions bv source and control metiiods
Air quality management plans are based on regulatory assumptions about technologies that will be developed during the next decade. It is expected that different controls will be applied successively to each source as technologies become feasible. For example, an emission abatement plan for an automotive assembly line surface coating might call for reformulation and improved control equipment by 1990, followed by the use of an add-on catalytic oxidizer by 1995. To ensure that the model accounts for the time sequence of controls, a binary variable is introduced into the problem formulation; each source must meet the emission reductions predicted by ear
lier technologies before newer technologies can be used, regardless of cost. The binary variable, Yt, can be viewed as an "on-off" switch that indicates whether a technology j has been applied to source i.
The problem can be expressed as follows:
Mtj and Yijt i = 1 N,j = 1 Pt (4)
that maximizes
£(Mo.xi?,0 (5) tj
subject to
X(M0xC,7)=TC (6)
MirrJ Fy \E, ( l - £ Fik\ 11 < 0 for all i,j (7)
YtJ < Ytj + p for Yy integral (8)
The model selects values of My, the VOC emission reductions in tons per day by source and control method, as well as the binary variables, Yy, which indicate application of a technology. The product of mass reduced and reactivity in Equation 5 represents ozone reduction in tons per day, and this quantity is maximized over all sources in the inventory. Equation 6 represents the budgetary constraint of the air quality manager; the product of VOC reductions in tons per day and abatement costs in dollars per ton cannot exceed TC, a fixed constant. Equation 7 represents a set of technology constraints for each source. Essentially, no value of M- • can excced the product of current emissions and the fraction of emissions that a technology can abate This constraint holds as each of j different control strategies is applied to the emissions that remain at a given time. Equation 8 preserves the time sequencing of application of controls
The formulation presented here incorporates the results of air quality modeling through the MIR scale
TABLE 1
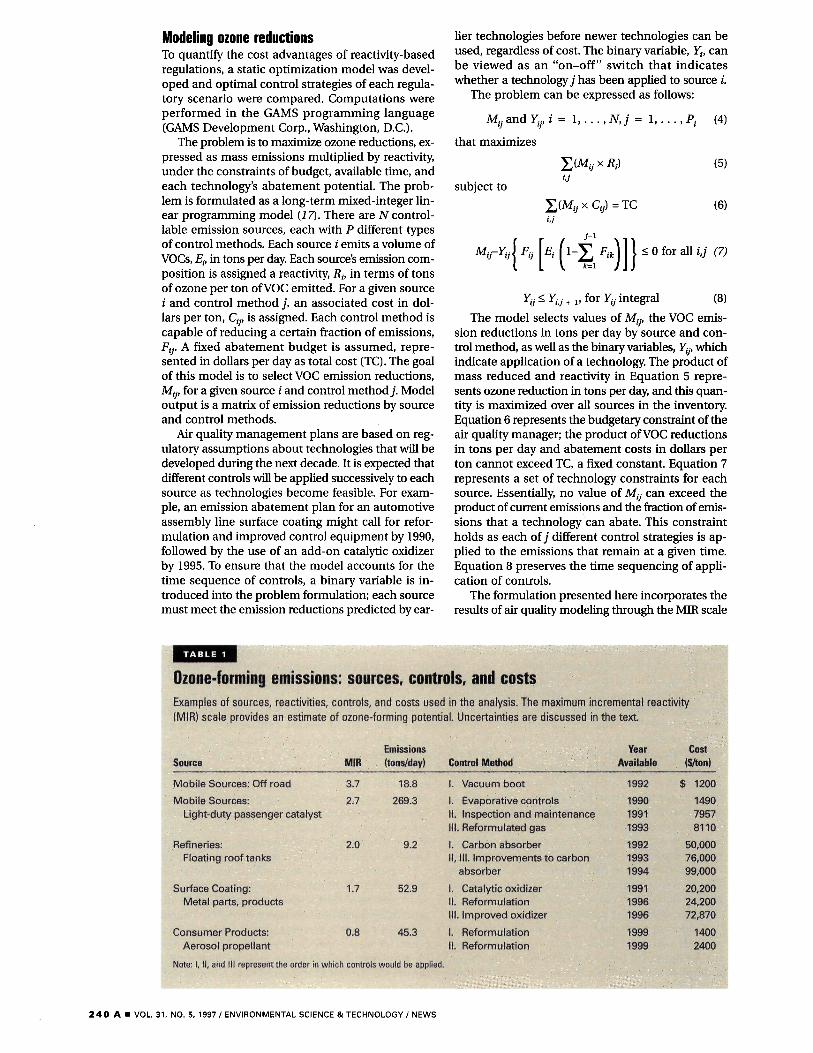
Ozone-forming emissions: sources, controls, and costs
Examples of sources, reactivities, controls, and costs used in the analysis. The maximum incremental reactivity (MIR) scale provides an estimate of ozone-forming potential. Uncertainties are discussed in the text.
Emissions Year Cost Source MIR (tons/day) Control Method Available (S/ton)
Mobile Sources: Off road 3.7 18.8 I. Vacuum boot 1992 $ 1200
Mobile Sources: 2.7 269.3 I. Evaporative controls 1990 1490 Light-duty passenger catalyst II. Inspection and maintenance 1991 7957
III. Reformulated gas 1993 8110
Refineries: 2.0 9.2 I. Carbon absorber 1992 50,000 Floating roof tanks II, III, Improvements to carbon 1993 76,000
absorber 1994 99,000
Surface Coating: 1.7 52.9 I. Catalytic oxidizer 1991 20,200 Metal parts, products II. Reformulation 1996 24,200
III. Improved oxidizer 1996 72,870
Consumer Products: 0.8 45.3 I. Reformulation 1999 1400 Aerosol propellant II. Reformulation 1999 2400
Note:!, ,I, and 111 Iepresenn the order in whicc controls would db epplied.
2 4 0 A • VOL. 31, NO. 5, 1997 / ENVIRONMENTAL SCIENCE & TECHNOLOGY / NEWS

into an optimization format. Ozone reductions are maximized, subject to cost and technology constraints, to estimate the benefits of reactivity-based control regulations in severe areas such as SoCAB. The optimization problem is solved under two assumptions about the use of reactivity, with the goal of characterizing the impact of reactivity-based regulations on the cost structure and prioritization of control strategies for VOCs. A mass-based system, which ignores relative reactivity of emissions, is simulated by running the model by holding Rt constant at the inventory average reactivity for all sources. To test the reactivity-based strategy optimization, R- is specified for each source The mass- and reactivity-based systems are then compared by running the model at different levels of total cost under each reactivity assumption The ozone reduction is then found as in Equation 5 assuming that the MIR weighting is accurate Because the same formula is used in both approaches the model results may be biased If another reactivity scale were found to be more appropriate the optimal set of controls could change However studies suggest that the sensitiv-j ^ _r the relative r'eactivity of source emissions to different reactivity scales is fairly low (9 4 18) Rvsnlv ing for rlifferent values nf total cost a function ran be annrn imated that Hpscrihps ozone rpHu d dollar spent on controls under each regulatory plan. The shape and position of the reactivity-based total
4.U J -4.U 4-U 4, \ 1
cost curve are then compared with the total cost curve u n H p r tVip m a c e HacpH s trntpmr
Los Angeles' problem The inventory for the SoCAB mobile and stationary source emissions, control measures, and costs was assembled, and reactivities were calculated for each source on the basis of a 1987 emission inventory (19, 20). Stationary source control data and speciation profiles consisted of 52 stationary source categories. Mobile source control data are based on the 1987 CARB inventory. Reactivities were calculated for each source in a two-step process. Using VOC speciation profiles provided by CARB and the MIR scale (2), Carter (21) calculated reactivities for different sources. Mass-weighted averages of these reactivities were used to approximate reactivities of a variety of controllable sources in the inventory
SCAQMD provided control costs for each stationary source (22), and CARB provided those for mobile source control (11,23-25). Sources had up to three levels of controls to be applied through 1999. Costs were calculated on the basis of discounted cash flow; total costs, aggregated and discounted over 10 years, are divided by total emission reductions over 10 years to arrive at an average cost. The Producer Price Index (26) was used to normalize all costs to 1991 dollars.
Table 1 gives a sample of some of the data used in the optimization problem. (The full data set used in the model is available as Supporting Information to this paper. See note on p. 244A.) Thirty sources were chosen, comprising 80% of the total "controllable" emissions in the SoCAB. ("Controllable" here refers to those emissions for which a control technology and cost could be identified.) As an indication of how the optimization model might select emission reductions based on reactivity, each source's
MIR was plotted against the logarithm of mass emissions in tons per day (Figure 1). The locations of dffferent sources indicate their relative ozone-forming potentials. Mobile sources are more reactive and have higher mass emissions than most stationary sources. Aerosol consumer products also have relatively higl mass emissions, but their emissions reactivity is fa; below the inventory average.
FIGURE 1
Mobile sources create the most ozone Maximum incremental reactivity (MIR) for each source versus natural logarithm of emissions in tons per day.
Source: (a) Light-duty vehicles; (b| Boat refueling; (c) Refineries: floating roof tanks; (d) Surface coating: metal parts; (e| Aerosol propellant; (f) Degreasing: synthetic; (g) Trucks: catalyst, noncatalyst; (h) Small engine refueling
Optimizing control strategies The optimization model compares a mass-based system with a reactivity-based system and uses detailed information on the reactivity of each source. We expect the reactivity-based system to reduce more ozone at all cost levels than the mass-based system. Of interest, however, is the degree of ozone reduction at different budgetary levels and the selection of optimal strategies. It was assumed that relative reactivities did not change with application of controls. Distinctly different behaviors are seen under each scenario. For example, at an annual abatement budget of $10 million, both regulatory strate-£jies place controls on heavy-duty trucks, motorcycles small-engine refueling, wood furniture surface coatings and graphic arts processes. ^)nce these are applied however the mass-based system (driven primarily by cost) focuses on consumer products (aerosol solvents propellants spray cans and nonaero-sol solvents) whereas the reactivity-based system calls for greater reductions in more highly reactive mobile sources (light-duty catalyst and noncatalyst passenger vehicles light- and medium-duty catalyst
VOL.31, NO. 5, 1997 /ENVIRONMENTAL SCIENCE S TECHNOLOGY /NEWS " 2 4 1 A
trucks). The reactivity-based system does not target consumer products, which is an expected result, given the low reactivity of ethanol, propane, n-butane, and isobutane.
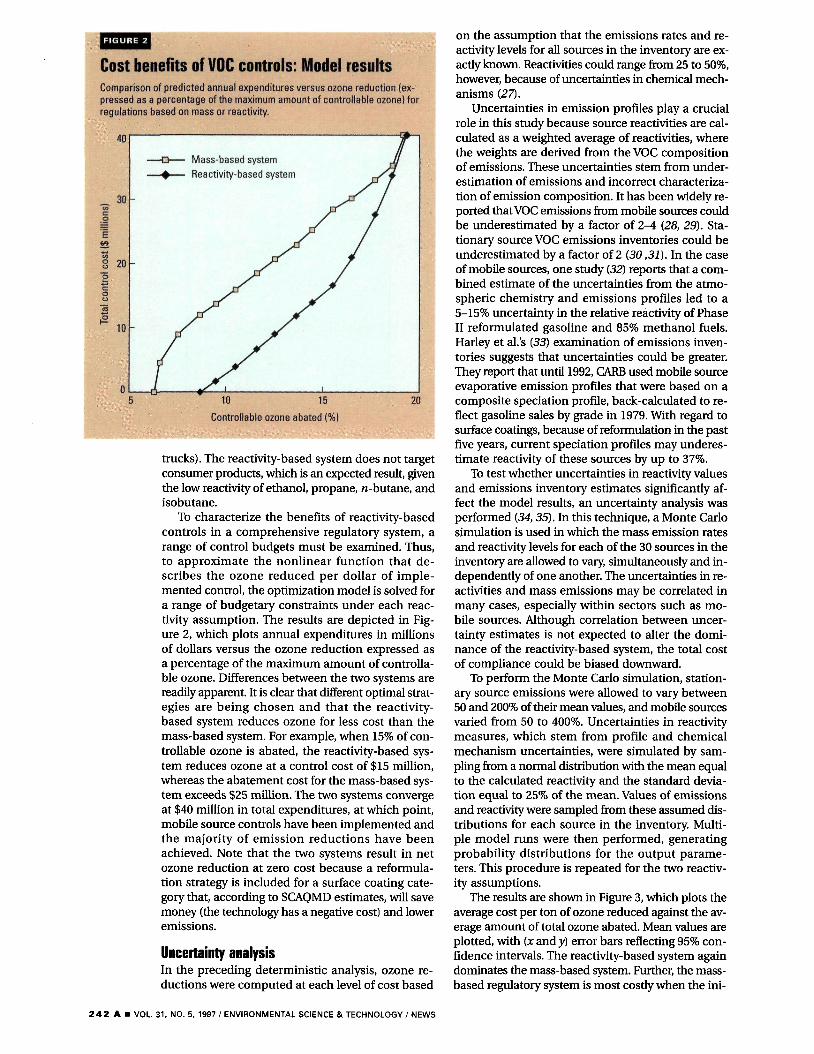
To characterize the benefits of reactivity-based controls in a comprehensive regulatory system, a range of control budgets must be examined. Thus, to approximate the nonlinear function that describes the ozone reduced per dollar of implemented control, the optimization model is solved for a range of budgetary constraints under each reactivity assumption. The results are depicted in Figure 2, which plots annual expenditures in millions of dollars versus the ozone reduction expressed as a percentage of the maximum amount of controllable GZOD6. Differences between the two systems are readily apparent. It is clear that different optimal strategies are being chosen and that the reactivity-based system reduces ozone for less cost tli3.ii the mass-based system For excimple when X5̂& of con-
trollable ozone is abated the reactivity-based system reduces ozone at a control cost of $15 million whereas the abatement cost for the mass-based svstem exceeds $25 million The two svstems converse at $40 million in total expenditures at which point mobile source controls have been implemented and the majority of emission reductions have been achieved Note that the two svstems result in net ozone reduction at zero cost Decause a retormuia-tion stratppv is inrliidprl for a surfarp mat ' pnrythat ar n di t SPAQMD t' t ll
money (the technology has a negative cost) and lower emissions.
FIGURE 2
Cost benefits of VOC controls: Model results Comparison of predicted annual expenditures versus ozone reduction (expressed as a percentage of the maximum amount of controllable ozone) for regulations based on mass or reactivity.
Controllable ozone abated (%)
Uncertainty analysis In the preceding deterministic analysis, ozone reductions were computed at each level of cost based
on the assumption that the emissions rates and reactivity levels for all sources in the inventory are ex-acdy known. Reactivities could range from 25 to 50%, however, because of uncertainties in chemical mechanisms {27).
Uncertainties in emission profiles play a crucial role in this study because source reactivities are calculated as a weighted average of reactivities, where the weights are derived from the VOC composition of emissions. These uncertainties stem from underestimation of emissions and incorrect characterization of emission composition. It has been widely reported that VOC emissions from mobile sources could be underestimated by a factor of 2-4 (28, 29). Stationary source VOC emissions inventories could be underestimated by 3- factor of 2 (30,3T) In the Cssc of mobile sources, one study {32) reports that a combined estimate of the uncertainties from the atmospheric chemistry and emissions profiles led to a 5-15% uncertainty in the relative reactivity of Phase II reformulated gasoline and 85% methanol fuels Harley et al 's (33) examination of emissions inventories suggests that uncertainties could be greater Thev report that until 1992 CARB used mobile source evaDorative emission Drofiles that were based on a convrjosite SDeciation Drofile back-calculated to reflect gasoline sales by erade in 1979 With regard to surface coatings because of reformulation in the past five years current SDeciation nrofiles may underestimate reactivity of these sources hv up to XI°?
To test whether uncertainties in reactivity values and emissions inventory estimates significantly affect the model results, an uncertainty analysis was performed (34,35). In this technique, a Monte Carlo simulation is used in which the mass emission rates and reactivity levels for each of the 30 sources in the inventory are allowed to vary, simultaneously and in-dependendy of one another. The uncertainties in reactivities and mass emissions may be correlated in many cases, especially within sectors such 3.S mobile sources. Although correlation between uncertainty estimates is not expected to alter the dominance of the reactivity-based system, the total cost of compliance could be biased downward.
To perform the Monte Carlo simulation, stationary source emissions were allowed to vary between 50 and 200% of their mean values, and mobile sources varied from 50 to 400%. Uncertainties in reactivity measures, which stem from profile and chemical mechanism uncertainties, were simulated by sampling from a normal distribution with the mean equal to the calculated reactivity and the standard deviation equal to 25% of the mean. Values of emissions and reactivity were sampled from these assumed distributions for each source in the inventory. Multiple model runs were then performed, generating probability distributions for the output parameters. This procedure is repeated for the two reactivity assumptions.
The results are shown in Figure 3, which plots the average cost per ton of ozone reduced against the average amount of total ozone abated. Mean values are plotted, witii (x and y) error bars reflecting 95% confidence intervals. The reactivity-based system again dominates the mass-based system. Further, the mass-based regulatory system is most cosdy when the ini-
2 4 2 A • VOL. 31, NO. 5, 1997 / ENVIRONMENTAL SCIENCE & TECHNOLOGY / NEWS
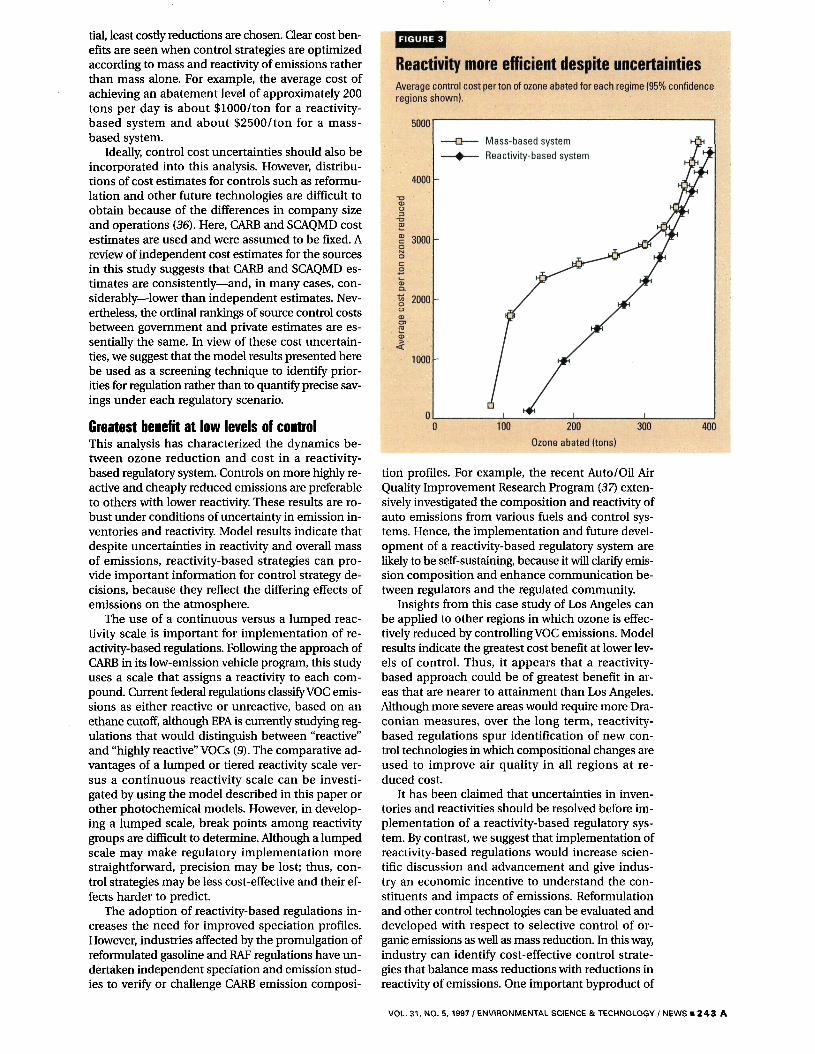
tial, least costly reductions are chosen. Clear cost benefits are seen when control strategies are optimized according to mass and reactivity of emissions rather than mass alone. For example, the average cost of achieving an abatement level of approximately 200 tons per day is about $1000/ton for a reactivity-based system and about $2500/ton for a mass-based system.
Ideally, control cost uncertainties should also be incorporated into this analysis. However, distributions of cost estimates for controls such as reformulation and other future technologies are difficult to obtain because of the differences in company size and operations (36). Here, CARB and SCAQMD cost estimates are used and were assumed to be fixed. A review of independent cost estimates for the sources in this study suggests that CARB and SCAQMD estimates are consistentiy—and, in many cases, considerably lower than independent estimates. Nevertheless, the ordinal rankings of source control costs between government and private estimates are essentially the same. In view of these cost uncertainties, we suggest that the model results presented here be used as a screening technique to identify priorities for regulation rather than to quantify precise savings under each regulatory scenario.
Greatest benefit at low levels of control This analysis has characterized the dynamics between ozone reduction and cost in a reactivity-based regulatory system. Controls on more highly reactive and cheaply reduced emissions are preferable to others with lower reactivity. These results are robust under conditions of uncertainty in emission inventories and reactivity. Model results indicate that despite uncertainties in reactivity and overall mass of emissions, reactivity-based strategies can provide important information for control strategy decisions, because they reflect the differing effects of emissions on the atmosphere.
The use of a continuous versus a lumped reactivity scale is important for implementation of reactivity-based regulations. Following the approach of CARB in its low-emission vehicle program, this study uses a scale that assigns a reactivity to each compound. Current federal regulations classify VOC emissions as either reactive or unreactive, based on an ethane cutoff, although EPA is currently studying regulations that would distinguish between "reactive" and "highly reactive" VOCs (9). The comparative advantages of a lumped or tiered reactivity scale versus a continuous reactivity scale can be investigated by using the model described in this paper or other photochemical models. However, in developing a lumped scale, break points among reactivity groups are difficult to determine. Although a lumped scale may make regulatory implementation more straightforward precision may be lost; thus con¬ trol strategies may be less cost-effective and their effects harder to predict
The adoption of reactivity-based regulations increases the need for improved speciation profiles. However, industries affected by the promulgation of reformulated gasoline and RAF regulations have undertaken independent speciation and emission studies to verify or challenge CARB emission composi
tion profiles. For example, the recent Auto/Oil Ait Quality Improvement Research Program (37) extensively investigated the composition and reactivity of auto emissions from various fuels and control systems. Hence, the implementation and future development of a reactivity-based regulatory system are likely to be self-sustaining, because it will clarify emission composition and enhance communication between regulators and the regulated community.
Insights from this case study of Los Angeles can be applied to other regions in which ozone is effectively reduced by controlling VOC emissions. Model results indicate the greatest cost benefit at lower levels of control. Thus, it appears that a reactivity-based approach could be of greatest benefit in areas that are nearer to attainment than Los Angeles. Although more severe areas would require more Draconian measures, over the long term, reactivity-based regulations spur identification of new control technologies in which compositional changes are used to improve air quality in all regions at reduced cost.
It has been claimed that uncertainties in inventories and reactivities should be resolved before implementation of a reactivity-based regulatory system. By contrast, we suggest that implementation of reactivity-based regulations would increase scientific discussion and advancement and give industry an economic incentive to understand the constituents and impacts of emissions. Reformulation and other control technologies can be evaluated and developed with respect to selective control of organic emissions as well as mass reduction. In this way industry can identify cost-effective control strategies that balance mass reductions with reductions in reactivity of emissions. One important byproduct of
FIGURE 3
Reactivity more efficient despite uncertainties Average control cost per ton of ozone abated for each regime (95% confidence regions shown).
Ozone abated (tons)
VOL. 31, NO. 5, 1997 / ENVIRONMENTAL SCIENCE & TECHNOLOGY / NEWS • 2 4 3 A

these regulations, then, is an improved understanding of the atmospheric impacts of emissions. Another byproduct is more accurate information mat can be used to develop improved emissions inventories. Over time, regulators and regulated industries would acquire information to reduce uncertainties in emission composition and reactivity, further refining choices for optimal regulatory strategies and improving the state of knowledge of urban photochemistry.
Acknowledgments This research was made possible through support from a National Science Foundation graduate fellowship, as well as support from EPA and the National Aerosol Association. The authors thank Urmila Diwekar, Hadi Dowla-tabadi, Bart Croes, Scott Johnson, and William Carter, and they appreciate the insightful comments of their reviewers.
Supporting Information available A complete listing of the emissions controls, emissions control costs, emissions levels, and VOC reactivities used in the optimization (five pages) will appear at the end of these pages in the microfilm edition of this volume of the journal. Supporting Information is available to subscribers electronically via the Worldwide Web at http://pubs.acs.org and via Gopher at pubs.acs.org. Photocopies of the Supporting Information from this paper or microfiche (105 x 148 mm, 24 x reduction, negatives) may be obtained from the Microforms Office, American Chemical Society, 1155 16th St., NW, Washington, D.C. 20036. Full bibliographic citation (journal, number, and issue number) and prepayment
check or money order—of $25.50 for photocopy ($27.50 foreign) or $12.00 for microfiche ($13.00 foreign) are required. Canadian residents should add 7% GST.
References (1) National Research Council. Rethinking the Ozone Prob
lem in Urban and Regional Air Pollution; National Academy Press: Washington, DC, 1991; p. 4.
(2) Carter, W.RL.; Atkinson, R. Environ. Set Technol. 1989,23, 864-80.
(3) Carter, W.EL. /. Air Waste Manage. Assoc. 1994,44, 881-89. (4) McNair, L. A.; Russell, A. G.; Odman, M. T. /. Air Waste
Manage. Assoc. 1994, 44(7), 900-07. (5) Bergin, M.; Russell, A. G.; Milford, J. B. Environ. Sci. Tech
nol. 1995, 29(12), 3029-37. (6) Chang, T. Y.; Rudy, S. J.; Kuntasal, G.; Gorse, R. A., Jr. At-
mos. Environ. 1989, 23(8), 1629-44. (7) Russell, A. G.; St. Pierre, D.; Milford, J. B. Science 1990,
247(4939), 201-05. (8) Trijonis, J. C; Arledge, K. W. Utility of Reactivity Criteria
in Organic Emission Control Strategies: Application to the Los Angeles Atmosphere; EPA/600/3-78/019; TRW/ Environmental Services: Redondo Beach, CA, 1976.
(9) Dimitriades, B. /. Air Waste Manage. Assoc. 1996,46,963-70.
(10) Venturini, E D. "Application of Reactivity Criteria to Non-Motor Vehicle Applications"; Presented at the California Air Resources Board and the South Coast Air Qual
ity Management District Conference on Reactivity-Based Hydrocarbon Controls: Scientific Issues and Potential Regulatory Applications: Irvine, CA, 1991.
(11) "Proposed Regulations for California Phase 2 Reformulated Gasoline: Technical Support Document"; California Air Resources Board: Sacramento, CA, 1991; p. 71.
(12) Harley, R. A. Department of Civil Engineering, University of California, Berkeley, personal communication, 1993.
(13) Atkinson, S. E.; Lewis, D. H./. Environ. Econ. Manage. 1976, 3(4), 363-80.
(14) Trijonis, J. C. Environ. Sci. Technol. 1974, 8(9), 811-26. (15) Cass, G. R. Atmos. Environ. 1981, 15(1), 1227-49. (16) "Mexico City Air Quality Research Initiative, Volume V:
Strategic Evaluation"; LA12699, UC-902; Los Alamos National Laboratory and Instituto Mexicano del Petroleo: Los Alamos, NM, 1994.
(17) Brooke, A.; Kendrick, D.; Meeraus, A. GAMS: A User's Guide, Release 2.25; Scientific Press: South San Francisco, CA, 1992.
(18) Russell, A. G. et al. Science 1995, 269, 491-95. (19) "Air Quality Management Plan for the South Coast Air
Basin"; South Coast Air Quality Management District: Diamond Bar, CA, 1991.
(20) "Predicted California Vehicle Emissions Ozone Planning Inventory"; California Air Resources Board: Sacramento, CA, 1993.
(21) Carter, W.PL., University of California, Riverside, personal communication, 1992.
(22) "Socioeconomic Impacts of Proposed Amendments to the 1991 Air Quality Management Plan"; South Coast Air Quality Management District: Diamond Bar, CA, 1992.
(23) "Notice of Public Meeting to Consider a Plan to Control Emissions for Off-Highway Vehicle Engines"; California Air Resources Board: Sacramento, CA, 1992.
(24) "California's Mobile Source Plan for Continued Progress Toward Attainment of the State and National Ambient Air Quality Standards, 1990 Update, Appendices"; California Air Resources Board: Sacramento, CA, 1990.
(25) "Notice of Public Hearing to Consider the Adoption of Amendments to Regulations Regarding Evaporative Emissions Standards"; California Air Resources Board: Sacramento, CA, 1990.
(26) "Economic Report of the President"; Council of Economic Advisors: Washington, DC, 1992.
(27) Carter, W.P.L., University of California, Riverside, personal communication, 1993.
(28) Fujita, E. M.; Croes, B. E.; Bennett, C. L. /. Air Waste Manage. Assoc. 1992, 42, 264-76.
(29) Pierson, W. R.; Gertler, A. W.; Bradow, R. L. /. Air Waste Manage. Assoc. 1990, 40, 1495-1504.
(30) Placet, M. et al. "Emissions Involved in the Acidic Deposition Processes, State-of-Science/Technology Report 1"; National Acid Precipitation Assessment Program: Washington, DC, 1990.
(31) Seinfeld, J. H. Science 1989, 243, 745-52. (32) Yang, Y.; Stockwell, W. R.; Milford, J. B. Environ. Sci. Tech
nol. 1996, 30, 1392-97. (33) Harley, R. A.; Hannigan, M. E; Cass, G. R. Environ. Sci.
Technol. 1992, 26, 2400. (34) Jaynes, E. T. Proc. IEEE 1982, 70(9), 939-53. (35) Morgan, M. G.; Henrion, M.; Small, M. Uncertainty: A
Guide to Dealing with Uncertainty in Quantitaiive Risk and Policy Analysis; Cambridge University Press: New York 1990.
(36) Merrow, E. W.; Phillips, K. E.; Myers, C. W. Understanding Cost Growth and Performance Shortfalls in Pioneer Process Plants; Rand Corporatton: Santa Monica, CA, ,9811
(37) Burns, V "Description of Auto/Oil Air Quality Improvement Research Program"; Presented at the Society of Automotive Engineers, Fuels, and Lubricants Meeting, Toronto, Canada, 1991; SAE Paper 912320.
2 4 4 A • VOL.31, NO. 5, 1997 / ENVIRONMENTAL SCIENCE & TECHNOLOGY/NEWS