environmental management accounting for an australian cogeneration
TRANSCRIPT

ENVIRONMENTAL MANAGEMENT ACCOUNTING FOR AN AUSTRALIAN
COGENERATION COMPANY
Damian Tien Foo Niap
School of Accounting and Law
Faculty of Business
December 2006
A thesis submitted in fulfilment of the requirements for the degree of Master of Business from
RMIT University

ii
Declaration
I certify that:
a) except where due acknowledgement has been made, the work is that of the author alone;
b) the work has not been submitted previously, in whole or in part, to qualify for any
other academic award;
c) the content of the thesis is the result of work which has been carried out since the official commencement date of the approved research program; and
d) any editorial work, paid or unpaid, carried out by a third party is acknowledged.
Damian Tien Foo Niap

iii
Acknowledgments
The completion of this Master of Business thesis within two years on a part-time basis was made possible with the reasonably prompt guidance from my senior supervisor Professor Robert Clift whom I would like to thank. I would also like to thank my supervisor Dr David Gowland for his guidance. Furthermore, I would like to thank the staff at the case study company for their support, patience and assistance in providing me with the information required in relation to this thesis. Their cooperation was crucial to the completion of this thesis. I would also like to thank RMIT University and especially the School of Accounting and Law for providing me with a Research Trainee Scheme place which exempts me from paying any tuition fees for this course. Most of all, I would like to thank my family especially Jason Niap for their encouragement in completing this postgraduate research. Damian Tien Foo Niap

iv
Table of Contents Page no. Abstract 2
Chapter 1 Introduction 1.1 Introduction 3 1.2 The role of accountants in sustainable development 5 1.3 The research objective 9 1.4 Research questions 10 1.5 Scope of research 12 1.6 Confidentiality 14 1.7 Significance of research 15 Chapter 2 Literature Review 2.1 Introduction 16 2.2 Definition of Environmental Accounting and Environmental
Management Accounting 17 2.3 Relationship between management accounting, financial accounting, EA
and EMA 18 2.4 The benefits and challenges of EMA 24 2.5 The EMA framework 33 2.5.1 The physical accounting side of EMA 33 2.5.1.1 Physical information and Environmental Performance Indicators 34 2.5.1.2 Types of physical information 37 2.5.1.3 Inputs 37 2.5.1.4 Product Outputs 38 2.5.1.5 Non-Product Outputs (waste and emissions) 38 2.5.2 The monetary accounting side of EMA 38 2.5.2.1 Environmental Cost Categories 40 2.5.2.2 Monetary Environmental Performance Indicators 47 2.5.2.3 Environment-related earnings, savings and less tangible benefits 48 2.5.3 Distribution of Costs by Environmental Domain 48 2.5.4 Application of EMA 49 2.5.4.1 Application at various organizational levels 49 2.5.4.2 Examples of application – energy and waste 49 2.6 Investment appraisal and capital budgeting 55 2.7 Information for managing resources and creating value: Other EA-related
and EMA-related techniques 61 2.8 Previous research on EMA 61 2.8.1 Types of industry 61 2.8.2 Findings and lessons learnt 62 2.9 The regulatory environment 63 2.9.1 Environment Protection Agency (EPA) Victoria 64 2.9.2 Generator efficiency standards 72 2.9.3 Gas 74 2.9.3.1 Regulation of gas supply including gas quality 74 2.9.3.2 Gas regulatory cost 75 2.9.4 Water 76

v
2.9.4.1 Regulation of water supply including water quality 76 2.9.4.2 Water regulatory cost 77 2.9.5 Electricity exported on to the grid 77 2.9.5.1 Regulation of electricity exported on to the grid including power (electricity)
quality 78 2.9.5.2 Electricity rates 79 2.9.6 Accounting standards and guidance 79 2.9.7 Government incentives for reducing GHG 82 2.9.8 Future legislation 82 Chapter 3 Research Methodology 3.1 Introduction 83 3.2 The case study approach 84 3.3 Case study design and the quality of the research 87 3.4 Data collection and sources of evidence 93 3.4.1 Introduction 93 3.4.2 Documentation, archival records and physical artifacts 94 3.4.3 Interviews 95 3.4.4 Direct observation and participant observation 98 3.4.5 Principles of data collection 99 3.5 Data analysis and drawing conclusions 101 3.6 Ethical considerations 109 3.7 Report writing 110 Chapter 4 Data Collection and Analysis 4.1 Introduction 111 4.2 Triangulation 111 4.3 Participant observation 113 4.3.1 The accounting system 113 4.3.2 Accounting information 114 4.4 Documentation, archival records and physical artifacts 118 4.4.1 Application for Works Approval to the Environment Protection Authority
for the Cogeneration Scheme report 118 4.4.2 Energy Audit report 119 4.4.3 EPA licence report 121 4.4.4 Emission Inventory Report: National Pollutant Inventory report 124 4.4.5 Cogeneration contract 124 4.4.5.1 Cogeneration contract - Project Manual (part of the construction
agreement under the cogeneration contract) 126 4.4.5.2 Cogeneration contract - Annexure A: Performance criteria, tests and
damages (part of the construction agreement) 127 4.4.6 Internal reporting - Generation Group Performance Report 128 4.4.7 External reporting - Annual Report for Victorian State Government
Department 129 4.4.8 Press releases 129 4.5 Interviews 130 4.5.1 Interview approach 130 4.5.2 Interview - data analysis 134 4.5.2.1 Plant performance and monitoring 136 4.5.2.2 Plant efficiency 138

vi
4.5.2.3 Quality of inputs into the cogeneration plant 139 4.5.2.4 Quality of outputs from the cogeneration plant 142 4.5.2.5 Wastes 142 4.5.2.6 Greenhouse gases emissions 143 4.5.2.7 Regulatory requirements and government incentives 144 4.5.2.8 Data recording and reporting 145 4.5.2.9 Other issues 147 4.6 Assessing the quality of the case study research 149 Chapter 5 Conclusion and Recommendations
5.1 Conclusion 152 5.2 Recommendations 154 5.3 Possible future research 155 Bibliography 156
Appendices 171
vii
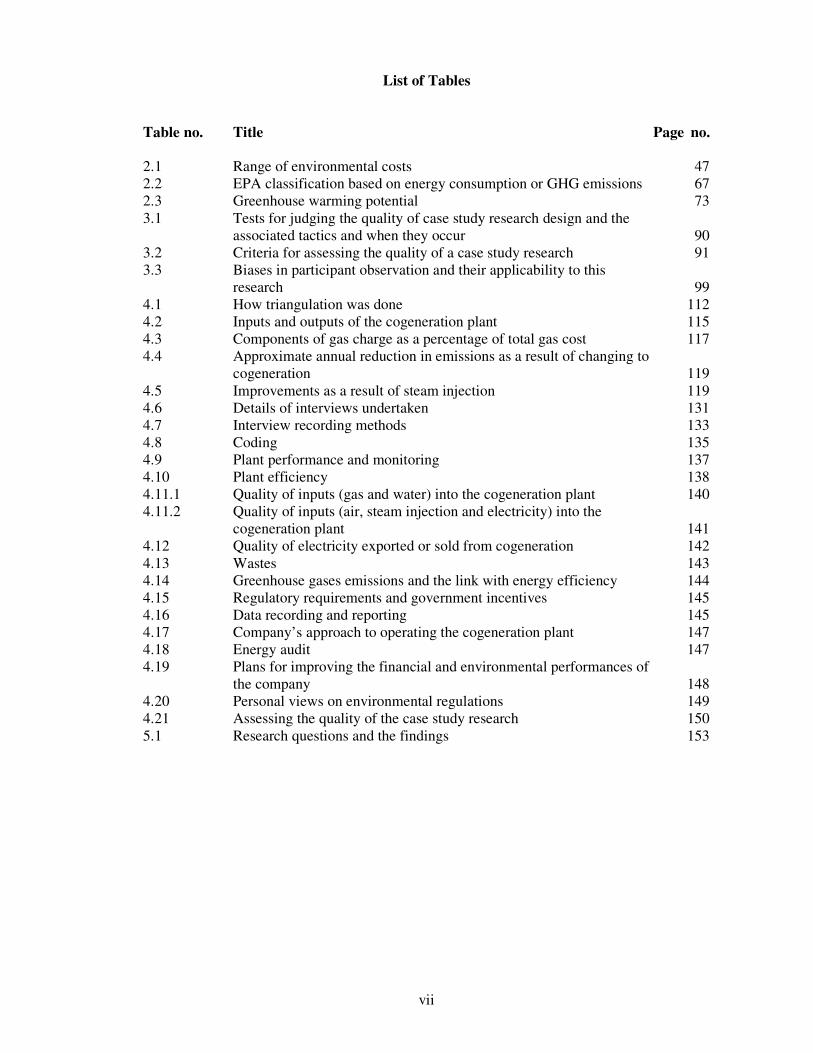
List of Tables Table no. Title Page no. 2.1 Range of environmental costs 47 2.2 EPA classification based on energy consumption or GHG emissions 67 2.3 Greenhouse warming potential 73 3.1 Tests for judging the quality of case study research design and the
associated tactics and when they occur 90 3.2 Criteria for assessing the quality of a case study research 91 3.3 Biases in participant observation and their applicability to this
research 99 4.1 How triangulation was done 112 4.2 Inputs and outputs of the cogeneration plant 115 4.3 Components of gas charge as a percentage of total gas cost 117 4.4 Approximate annual reduction in emissions as a result of changing to
cogeneration 119 4.5 Improvements as a result of steam injection 119 4.6 Details of interviews undertaken 131 4.7 Interview recording methods 133 4.8 Coding 135 4.9 Plant performance and monitoring 137 4.10 Plant efficiency 138 4.11.1 Quality of inputs (gas and water) into the cogeneration plant 140 4.11.2 Quality of inputs (air, steam injection and electricity) into the
cogeneration plant 141 4.12 Quality of electricity exported or sold from cogeneration 142 4.13 Wastes 143 4.14 Greenhouse gases emissions and the link with energy efficiency 144 4.15 Regulatory requirements and government incentives 145 4.16 Data recording and reporting 145 4.17 Company’s approach to operating the cogeneration plant 147 4.18 Energy audit 147 4.19 Plans for improving the financial and environmental performances of
the company 148 4.20 Personal views on environmental regulations 149 4.21 Assessing the quality of the case study research 150 5.1 Research questions and the findings 153

viii
List of Appendices Appendix no. Title Page no. 1 Glossary 171 2 The case study company’s cogeneration production process 176 3 Conceptual Cogeneration Flow Diagram 198 4 Cogeneration efficiency and greenhouse intensity formulas 200 5 Chart of Accounts – extract 203 6 Organizational Structure of the case study company 212 7.1 Questionnaire for Plant Operator 214 7.2 Questionnaire for Central Control Room Operator 216 7.3 Questionnaire for Plant Engineer, Electrical Engineer and
Operations Manager 218 8 Cheng Cycle Upstream Injection versus NOx and CO 222 9 Australian legal units of measurement 224 10 Gas – background information 226 11 Other EA-related and EMA-related techniques 228

ENVIRONMENTAL MANAGEMENT ACCOUNTING FOR AN
AUSTRALIAN COGENERATION COMPANY
2
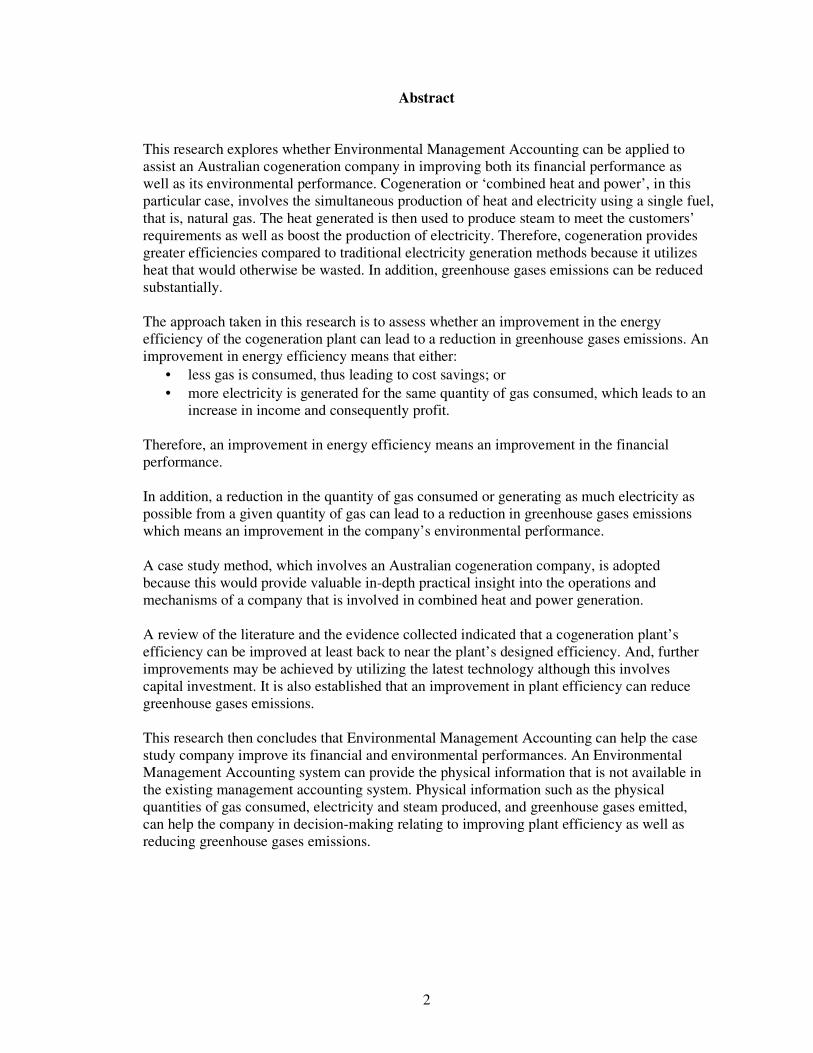
Abstract
This research explores whether Environmental Management Accounting can be applied to assist an Australian cogeneration company in improving both its financial performance as well as its environmental performance. Cogeneration or ‘combined heat and power’, in this particular case, involves the simultaneous production of heat and electricity using a single fuel, that is, natural gas. The heat generated is then used to produce steam to meet the customers’ requirements as well as boost the production of electricity. Therefore, cogeneration provides greater efficiencies compared to traditional electricity generation methods because it utilizes heat that would otherwise be wasted. In addition, greenhouse gases emissions can be reduced substantially. The approach taken in this research is to assess whether an improvement in the energy efficiency of the cogeneration plant can lead to a reduction in greenhouse gases emissions. An improvement in energy efficiency means that either:
• less gas is consumed, thus leading to cost savings; or
• more electricity is generated for the same quantity of gas consumed, which leads to an increase in income and consequently profit.
Therefore, an improvement in energy efficiency means an improvement in the financial performance. In addition, a reduction in the quantity of gas consumed or generating as much electricity as possible from a given quantity of gas can lead to a reduction in greenhouse gases emissions which means an improvement in the company’s environmental performance. A case study method, which involves an Australian cogeneration company, is adopted because this would provide valuable in-depth practical insight into the operations and mechanisms of a company that is involved in combined heat and power generation. A review of the literature and the evidence collected indicated that a cogeneration plant’s efficiency can be improved at least back to near the plant’s designed efficiency. And, further improvements may be achieved by utilizing the latest technology although this involves capital investment. It is also established that an improvement in plant efficiency can reduce greenhouse gases emissions. This research then concludes that Environmental Management Accounting can help the case study company improve its financial and environmental performances. An Environmental Management Accounting system can provide the physical information that is not available in the existing management accounting system. Physical information such as the physical quantities of gas consumed, electricity and steam produced, and greenhouse gases emitted, can help the company in decision-making relating to improving plant efficiency as well as reducing greenhouse gases emissions.

3
Chapter 1
INTRODUCTION
1.1 Introduction
Resources such as energy and water are the backbone of every economy. However, resources
are scarce and may be depleted. In addition, the use of these resources may cause serious
damage to the environment and hence the need for sustainable development. The World
Commission on Environment and Development, also known as the Brundtland Commission,
(1987, p.43) defines ‘sustainable development’ as ‘development which meets the needs of the
present without compromising the ability of future generations to meet their own need’. And,
the issue of sustainability is related to sustainable development. Howes (2002) sought to
improve on this definition by defining “sustainability’ as the capacity to continue into the
long-term future. ‘Sustainable development’ in contrast is the dynamic process in moving
towards sustainability which allows all people to realize their potential and improve their
quality of life in ways which at the same time protect and enhance the Earth’s life support
systems.
Gray and Bebbington (2001) argued that for sustainability to be achieved, the elements of
eco-efficiency (the notion of reducing energy and material inputs per unit of output) and eco-
effectiveness (the notion of reducing the overall ecological footprints) need to be met for both
present and future generations. Elkington (1997) adopted the Business Council for
Sustainable Development definition of eco-efficiency which involves the delivery of
competitively priced goods and services to satisfy human needs and bring about quality of life
while reducing ecological impacts and resource intensity progressively throughout the life
cycle to a level in line with the Earth’s estimated carrying capacity as a minimum. Eco-
efficiency tends to be scientific or technical in nature and relates to environmental protection
since it pertains to optimization of the use of a given quantity of resources while minimizing
the associated environmental implications (Deegan 1999).

4
The ecological footprint refers to the quantity of natural space that is required to sustain
existing consumption and production activities (Schaltegger and Burritt 2000). This is related
to the environmental footprint which refers to the damage caused by organizations’ activities
and operations (Howes 2002).Examples of environmental damage would be noise and air
pollution, and global warming arising from the emission of greenhouse gases (GHG). There
are six different GHG as follow (Environment Protection Authority (EPA) Victoria 2002;
Australian Greenhouse Office (AGO) 2001):
1. carbon dioxide (CO2);
2. methane (CH4);
3. nitrous oxide (N20);
4. hydrofluorocarbons (HFCs);
5. perfluorocarbons (PFCs); and
6. sulphurhexafluoride (SF6).
Human activities are causing an increase in the emission of GHG. This results in an enhanced
greenhouse effect which is often termed as global warming or climate change. The
Intergovernmental Panel on Climate Control (IPCC) found that the consequences of this
enhanced greenhouse effect included (EPA Victoria 2002):
• a rise in sea levels;
• an increase in global temperature which has already affected many natural biological
and physical systems, some of which are irreversibly damaged; and
• some animal and plant species, which are unable to migrate due to various reasons
such as topography, facing extinction.
Concern about the social, environmental and economic effects of global warming on the
world community and, recognition of the need for international cooperation; led to the United
Nations Framework Convention on Climate Change and subsequently to the Kyoto Protocol
(EPA Victoria 2002). Australia, however, despite having the world’s highest contribution to
the enhanced greenhouse effect, at 26.7 tonne of carbon dioxide equivalent (CO2-e) of GHG
emissions per person (EPA Victoria 2002), refused to ratify the Kyoto Protocol. EPA Victoria
(2002) also disclosed that the state of Victoria’s share of total Australian emissions was
approximately 21.3 percent in 1999. Of this, the energy sector was the largest contributor,
contributing approximately 64 percent of Victoria’s total emissions. Therefore, the role of the
energy sector in reducing GHG is vital.

5
One way to reduce GHG emissions while meeting Australia’s energy needs is by sustainable
energy generation (Australian Business Council for Sustainable Energy (ABCSE) 2005).
Sustainable energy generation includes the use of renewable energy such as wind,
photovoltaic or solar energy, landfill, hydro and agricultural waste (ABCSE 2006). It also
involves cogeneration and gas-powered electricity using natural gas and coal seam methane.
Other renewable energy sources include fuel cell technology, biofuel and tidal wave (Institute
of Chartered Accountants in England and Wales (ICAEW) 2004).
1.2 The role of accountants in sustainable development
In today’s world, it is increasingly considered bad business to have bad environmental
practice (Elkington, Knight and Hailes 1992), hence the increasing interest in identifying and
addressing the financial costs and benefits of environmental matters (Bennett and James,
1998). Poor environmental practice such as the mismanagement of waste exposes
organizations to the risk of prosecution and the related fines. It can also create bad publicity
which in turn can affect sales adversely. An example is the disastrous Exxon Valdez oil spill
in Alaska which then led to the development of the Valdez principles (Elkington et al., 1992).
The question then is, ‘How do accountants play a role in sustainable development or
sustainability?’ Accountants occupy important roles such as finance managers, auditors,
management accountants and risk management consultants in various facets of society from
the public and private sectors to not-for-profit organizations. Therefore, accountants are
involved in organizational decision-making and in both external and internal reporting which
places them in a position of influence (ICAEW 2004). Recognition of the importance of
environmental issues has led to professional accounting bodies such as the Association of
Chartered Certified Accountants (ACCA) placing environmental issues among their priorities
(Adams 1998). It can be argued that information about financial costs can lead to the
discovery of the most efficient way of achieving objectives, in this instance, sustainable
development.
Zadek, Raynard, Forstater and Oelschlaegel (2004) argued that the goal of sustainable
development is that organizations assume responsibility for their environmental and economic
impacts. This drive towards sustainable development would require consideration of the triple
bottom line (TBL) of economic prosperity, environmental quality and social justice
(Elkington 1997). Adams, Frost and Webber (2004) cited Elkington (1997) in stating that

6
corporations were accountable for sustainability through TBL and that accountants had a
significant role in measuring, reporting, benchmarking, risk-rating and auditing it.
Henriques (2004) was of the view that it is possible to relate sustainability and the TBL to
corporate social responsibility (CSR). A study conducted by Nikolai, Bazley and Brummet
(1976) reinforced the view that accountants can play a significant role in the evaluation of
environmental factors by organizations. However, the quantification of social and
environmental performance has not been without criticism. Zadek (2001) challenged this
‘sustainable business’ solution, stating that the economic, social and environmental gains and
losses from particular business processes cannot simply be added up. Therefore, there is a
need for useful information which is where accountants can play a significant role (ICAEW
2004).
The ICAEW identified eight mechanisms by which governments, organizations, investors and
(other) stakeholders can enhance economic, environmental and social performances. These
are (1) corporate policies, (2) supply chain pressure, (3) stakeholder engagement, (4)
voluntary codes, (5) rating and benchmarking, (6) taxes and subsidies, (7) tradable permits
and (8) requirements and prohibitions. Each of these mechanisms needs to be supported by
credible information flows if they are to operate effectively. There are two supporting
activities which can provide credible information flows namely (1) information and reporting,
and (2) assurance processes. Therefore, accountants can play a role in sustainable
development via these two supporting activities.
Currently, there appears to be a shift in corporate policies in regard to sustainable
development from public relations to one focusing on corporate governance and competitive
advantage (ICAEW 2004). The intention is to reduce reputation risk, increase employee
motivation and improve long-term shareholder value and align to both short-term and long-
term management incentives. Accountants can play a role here by helping to formulate
corporate policies; identifying, measuring and managing business risks, and providing
assurance that corporate policies are executed throughout the organization.
Managing the supply chain, which includes all activities related to the transformation and
flow of goods from the raw materials stage through to the consumer, is meant to control
product price and quality, and increasingly, social and environmental impacts (ICAEW 2004).
Added to this is the increasing pressure for companies to consider the life cycle of the

7
products that they produce. In this regard, reference can be made to guidelines such as the
Sustainability Reporting Guidelines as issued by the Global Reporting Initiative (GRI) (2002)
for managing upstream and downstream impacts. These include (1) outsourcing and other
supply management issues and (2) product initiatives such as improving product design to
minimize negative impacts from the manufacture, use and disposal of the products. This is
even more relevant where companies seek to obtain International Standardization
Organization (ISO) 14001 certification (ICAEW 2004). Accountants can assist in the
preparation and monitoring of purchasing policies and the design and operation of supply
chain management systems.
Stakeholders such as shareholders, governments, investors, customers, local communities and
the general public can affect or are affected by an organization (ICAEW 2004). Since
stakeholder concerns may have an effect on business policies and practices over time, there is
a need for stakeholder engagement to understand stakeholder concerns and explore acceptable
solutions. This involves a structured process of informing and making decisions with various
stakeholders. This requires reliable information which is where accountants including auditors
can contribute.
With the number of voluntary codes relating to sustainable development that has been
developed such as ISO Standards including ISO 14001, GRI, CERES (formerly Valdez)
principles, Sustainability Integrated Guidelines for Management (SIGMA) Project, and
OECD Guidelines for Multinational Enterprises, accountants may have a role to play in
helping to select the codes relevant to the needs of the respective organizations (ICAEW
2004).
The increasing profile of ratings and benchmarking systems is likely to influence corporate
policies, particularly in regard to sustainability (ICAEW 2004). This is due to the growth of
socially responsible investment (SRI) which has been the main impetus to such systems
including the Dow Jones Sustainability Group Index. Effective benchmarking requires
information that is timely, relevant, reliable and comparable. Accountants can play a role in
collecting and presenting relevant financial and non-financial data, and work with other
experts if necessary. They can also interpret the results of benchmarking which requires an
understanding of the different bases used so as to compare and analyze the results.

8
Taxes and subsidies have been used for years by governments to achieve economic,
environmental and social objectives. Taxes and subsidies-related measures such as carbon
taxes (Gray et al. 2001), landfill tax, climate change levy, and capital allowance schemes have
the effect of internalizing external environmental costs and motivate organizations towards
sustainable development (ICAEW 2004). Accountants have the expertise in dealing with
taxation matters such as the provision of tax advice and the preparation of tax returns.
Tradable permits and allowances, which include emissions trading (Gray et al. 2001) and
renewable energy schemes, is another mechanism by which governments can spur sustainable
development (ICAEW 2004). Emissions trading works on the concept that the damage caused
to the planet by GHG emissions is the same regardless of where they occur. Conversely, the
(environmental) benefit from reduced emissions is the same wherever they arise. Therefore,
the economic rationale underlying emissions trading is to ensure that the required reduction in
GHG emissions occurs where the cost of reduction is the lowest. Other permits which may be
tradable include water pollution, landfill and waste. Emissions trading is one of the
mechanisms adopted in the Kyoto Protocol, with a tradable unit of measure being one metric
tonne of carbon dioxide equivalent (ICAEW 2004). Participation in emission trading schemes
means that organizations may have to consider carbon risk management. Risks include:
• capital cost risks such as increased credit risk which may lead to stringent credit
conditions;
• cash flow risks such as increased expenditure for the purchase of allowances or on
measures to reduce emissions; and
• reputation risk which may affect market capitalization and financial ratings.
Reliable information will be required in making decisions concerning trading, compliance and
potential penalties in addition to market pricing of these permits and allowances (ICAEW
2004). Accountants can play a role in the recognition, measurement and reporting of
emissions and other wastes. In addition, accounting standards need to be developed with
regard to the trading of such permits and the associated assets and liabilities.
Requirements and prohibitions is another mechanism used by governments (and other
authorities) to enhance sustainable development (ICAEW 2004). Examples are UK
environmental legislation such as the Environmental Protection Act 1990 and the Pollution
Prevention and Control Act 1999. Accountants need to know of the relevant regulations due
to the necessity to comply with legal (regulatory) requirements and prohibitions and to be

9
aware of the financial effects such as environmental liabilities. Furthermore, accountants may
be involved in the recognition and measurement of information required to be furnished to
regulatory authorities or disclosed in the financial statements.
The International Federation of Accountants (IFAC) (2005) also recognizes the role that
accountants have due to the access that they have to monetary data and information systems.
In addition, accountants have the ability to enhance and verify the quality of such information
and to use such information for decision-making.
1.3 The research objective
This research focuses on environmental accounting for sustainable resources in the electric
power generation industry. It would be ironic if organizations involved in the generation of
sustainable energy only consider the financial performance in the decision-making process
whilst neglecting environmental and social issues. Therefore, this research explores whether
Environmental Management Accounting (EMA) can be applied to assist a cogeneration
company in improving its financial performance as well as its environmental performance. A
case study on the electricity industry, in particular a cogeneration company, is conducted
since the researcher has several years including current experience in the industry. Another
reason is that the energy sector is a major contributor of GHG emissions as discussed earlier
and therefore there may be commercial benefits in undertaking this research if the financial
performance of organizations can be improved by improving their environmental performance.
The definitions of environmental accounting and EMA are given in Chapter 2 of this thesis.
The United States Environmental Protection Agency (US EPA) (2001, p.2) defines a
‘cogeneration unit’ as a unit that has ‘equipment used to produce electric energy and forms of
useful thermal energy (such as heat or steam) for industrial, commercial, heating or cooling
purposes, through sequential use of energy’. As can be seen from the letter issued by the US
EPA (2001), meeting the definition of ‘cogeneration’ is not without its difficulty. Roarty
(1999) defined ‘cogeneration’ or ‘combined heat and power (CHP)’ as the simultaneous
production of heat and electricity using a single fuel such as natural gas (AGO 2001).
However, it was acknowledged that a variety of fuels may be used and not just natural gas.
The heat generated from the electricity generation process such as from the gas turbine
exhaust system can be utilized to produce high and low level steam as a heat source for

10
domestic and industrial purposes. In addition, it can be used in steam turbines to generate
additional electricity (combined cycle power).
It is recognized that cogeneration technology provides greater efficiencies compared to
traditional generation methods because it utilizes heat that would otherwise be wasted.
Furthermore, carbon dioxide emissions can be reduced substantially. In addition, cogeneration
systems predominantly use natural gas as their fuel source. This can reduce emission of
greenhouse gases by more than half per unit of energy produced, compared to the cleanest
available thermal power station. Another advantage of cogeneration is that the plant is usually
situated near the customer or end user (referred to as embedded or distributed generation) and
therefore reduces power transmission losses. This contrasts with power stations which are
located far from customers and hence require long distance, high voltage transmission
networks (termed centralized systems) (Roarty 1999).
The abovementioned definition of cogeneration is similar to that adopted by Boyce (2002)
and Hay (1988) and the Australian Business Council for Sustainable Energy (2005). Given
the abovementioned definition, there are various cogeneration systems since selected
cogeneration systems are modified to suit each particular customer’s needs. A description of
the cogeneration plant’s process is in Appendix 2.
1.4 Research questions
To achieve the abovementioned objective, the following factors need to be considered:
1. Does the existing management accounting system generate sufficient, if any,
information to assist the company in decision-making pertaining to environmental
factors?
2. What information is required to be generated from the management accounting system
to assist the company to comply with government regulations, and to obtain
government incentives, if any, in relation to the environment?
3. Does the existing management accounting system generate all or any of the
information required on a routine basis, say, monthly or half yearly?
4. Does the existing management accounting system generate sufficient information to
assist the company to determine the least-cost method(s) in achieving environmental-
related objectives?

11
5. Can the existing management accounting system be modified, if required, to generate
the information required and an analysis of the costs and benefits in doing such a
modification
Consideration of the abovementioned factors may assist in understanding the classification
and allocation of costs and, in particular, environmental costs. If the existing accounting
system does not match the physical flow of materials, this may hamper the company’s ability
to identify inefficiencies and waste. The inefficient use of resources will lead to a more rapid
depletion of scarce resources and affect the financial performance of the company. Not
identifying the types of waste and not monitoring them may lead to increased pollution such
as the emission of GHG. This, then, will obviously affect the company’s environmental
performance.
In addition, it may lead to lost opportunities such as finding alternative uses for these
“wastes” such as waste heat energy. Furthermore, from a risk management perspective, there
is a need to ensure compliance with regulatory bodies, especially where the consequences of
non-compliance can be severe.
While it is not necessarily proposed that current accounting reports be merged with
environmental accounting, that does not mean, however, that current accounting reports as a
whole should not be enlarged to reflect the new demands on information as required by the
company. An example may be to consider the inclusion of Key Performance Indicators (KPI)
quoted in physical quantities. This research explores the possibility of incorporating KPI,
measured in physical quantities, in the accounting reports.
In addition, the research aims to explore the application of Activity Based Costing (ABC) to
quantify (hidden) environmental costs in the company. This can be done by first identifying
environmental costs and the cost drivers.
In Australia, the accounting bodies such as the Australian Accounting Standards Board
(AASB) have decided to converge Australian accounting standards with the International
Financial Reporting Standards (IFRS). The adoption of IFRS may have an impact on
environmental accounting. To date, there has been no specific accounting standard in regard
to environmental accounting. However, with the adoption of IFRS, environmental accounting

12
may gain more prominence in areas such as contingent assets and liabilities, and the costing
of fixed assets such as the costs of dismantling, removal and restoration.
In Australia, the Federal Government has initiated the Greenhouse Gas Abatement Program
(Australian Greenhouse Office 2005) to reduce net GHG emissions. In other parts of the
world, emissions trading and the imposition of a carbon tax are emerging as new forms of
environmental regulation (ICAEW 2004). These may have an impact on Australian
organizations which trade with organizations in those parts of the world.
Therefore, this research aims to explore whether the accounting system may need to be
redesigned to take advantage of ‘green credits’ or any other government initiatives to protect
the environment and sustain resources. Not only would an evaluation be required as to
whether the accounting system needs to be redesigned, but also of the most cost-effective and
practical way of doing so.
1.5 Scope of research
The company to be used as the basis of the case study has cogeneration plants at multiple sites.
However, only one of the cogeneration plants was researched as the operations and set-ups are
similar at all of the plants. This was confirmed by the Operations Manager when approval was
sought from the company to conduct a case study research. In addition, the plant only operates
as a cogeneration facility during peak hours which is from Mondays to Fridays during
daytime hours. For the rest of the time, which is referred to as off peak hours, only steam (and
not electricity) is produced for the customer. Accordingly, this does not meet the definition of
cogeneration. Therefore, off peak operations and associated matters such as the operation of
the packaged boilers are outside the scope of this research.
This research was limited to the research questions mentioned in Section 1.4 which includes
an examination of the existing management accounting system of the company to explore
whether it can be modified to function as an EMA system also. The only wastes that were
considered in this research were GHG emissions and waste heat. Other wastes such as
chemical discharges were not the focus of this research and are described briefly just for
completeness as part of the cogeneration process. The research is meant to explore, and not to
determine conclusively, whether an improvement of the environmental performance of the
company, by reducing GHG emissions, will lead to an improvement in the financial

13
performance (that is, increase the company’s profit) via an improvement in the plant’s energy
efficiency; or vice versa. Accordingly, an experiment was not conducted. This was due to a
limitation of time including the fact that the cogeneration contract will expire shortly.
Therefore, it was difficult to justify incurring the costs, such as those related to the data
collection and analysis which would have required involvement by the company’s employees
and perhaps consultants, when the quantum of the benefit to be gained is uncertain.
Australian auditing standard AUS 806 Performance Auditing (p. 417) defines efficiency as
‘the use of financial, human, physical and information resources such that output is
maximized for any given set of resource inputs, or input is minimized for any given quantity
and quality of output’. Expressing efficiency as a ratio between output and input means that it
is not bound to just a financial or technical dimension but can be cross-dimensional (Burritt
and Saka 2006). Therefore, efficiency for the purpose of this research is generally in the
context of identifying ways of maximizing energy output, whether electricity or thermal such
as steam or both, from a given quantity of energy input, that is, natural gas. Or, alternatively,
for a given amount of energy output, to minimize the quantity of energy input, that is, natural
gas used.
Given the need to work with the operations and maintenance staff including the engineers for
the purpose of this research, the terminology that they used had to be adopted in this research.
A glossary of certain terms used (that is, not exhaustive) is provided in Appendix 1 to make
the reading easier for readers of this thesis. What is important is that the flows and stocks of
inputs, such as gas, and outputs, including waste, from the cogeneration plant can be
measured. Therefore, definition of the scientific and technical terminology used is not that
important. Obviously, it would be unreasonable to expect accountants to be engineers too.
Rather, accountants need a basic understanding of the plant’s operations, and are able to speak
the ‘language’ that engineers use.
Furthermore, in this research only the environmental costs being incurred within the
boundaries of this company were considered. Therefore, life cycle analysis and the related
costs, and other initiatives are not considered. However, these initiatives are discussed briefly
in the literature review for awareness.

14
In addition, the focus is on private costs rather than externalities. However, externalities were
considered briefly because externalities can be ‘internalized’ due to government regulations
(ICAEW 2004).
Given that the research is based on a single case study, an EMA framework for the
cogeneration industry is not developed.
1.6 Confidentiality
The identity of the company to be used as a case study for this research cannot be disclosed
since the company has requested anonymity.
Consideration was given to an example given by Miles and Huberman (1994) pertaining to a
study they did in which anonymity was assured. However, this was compromised because the
gender of a particular principal was stated in the report and there was only one female
principal out of 111 high schools in that city. The female principal’s concern about anonymity
was understandable because the report revealed negative aspects about that school and she did
not want the school’s genuine improvement efforts to be jeopardized as a result. Therefore,
the authors had to ‘change’ the principal’s gender and ‘moved’ the school to another city.
While admitting that the truth was distorted, they justified their action by arguing that the
basic lessons of the case were preserved.
Therefore, to ensure anonymity of the company, the following were also not disclosed:
• the specific location of the plant site other than that it is located within the state of
Victoria, Australia;
• the identities of the customers and the industry they are in;
• the parties involved in the cogeneration project. This included non-disclosure of
the exact titles of the set of agreements within the cogeneration contract; and
• part of the dates and parties involved were intentionally omitted due to
confidentiality and instead substituted with ‘…’.
Furthermore, specific information such as exact quantities will not be stated wherever
possible. For example, stating the rated power of the plant may allow a reader to determine
the identity of the company.

15
1.7 Significance of the research
The possible benefits of undertaking this research are as follow:
1. gain an understanding of the operations, and the capability of the existing
accounting system, of a cogeneration company to measure its financial and
environmental performances;
2. understand how EMA can assist the company in improving efficiency and
minimizing waste by understanding environmental costs and their cost drivers;
3. understanding cogeneration may better assist in the undertaking of a feasibility
study of cogeneration for companies which are considering cogeneration to
minimize environmental costs. This may have significant commercial value since
companies across industries such as manufacturing and health have or are looking
towards cogeneration to supply their energy needs; and
4. understand the practical application of conceptual theories in EMA to a real-life
scenario and any associated difficulties in implementation.

16
Chapter 2
LITERATURE REVIEW
2.1 Introduction
The literature review commences with a definition of the key terms, ‘environmental
accounting’ (EA) and ‘environmental management accounting’ (EMA). The definitions are
important in drawing the boundaries of this research (Deegan 2003). The literature review
then leads to a discussion on conventional and contemporary management accounting, and
financial accounting, and the link to EA and EMA. This is important in answering the
research questions pertaining to whether the existing management accounting system can
generate the information required, and if not, whether the existing system can be modified to
serve as an EMA system, too. The uses, benefits and challenges of EMA are discussed, too.
This is particularly important when conducting a case study since this would help guide the
research; and assist in identifying any (commercial) benefits which may be applicable to
interested parties.
Awareness of the challenges faced in regard to EMA would be useful in ensuring that pitfalls
are avoided when conducting the research. A review of the EMA framework is then done,
followed by a discussion of the other EA-related and EMA-related techniques that have been
proposed in obtaining information for managing resources and creating value. This
background information is useful in gaining an awareness of peripheral issues relating to and
surrounding EMA. Furthermore, a review of American and European literature, and not just
Australian literature, was conducted since that literature covered certain EMA-related topics
well. Besides, it is good to have an idea of whether there are differing views on EMA. A
broader understanding of the literature review would assist better in the research. In addition,
previous research that has been undertaken in relation to EMA is discussed. The purpose of
this is twofold:
• to discover whether any research on this topic has been conducted in the past; and
• to consider the implications of previous research on related topics.
17
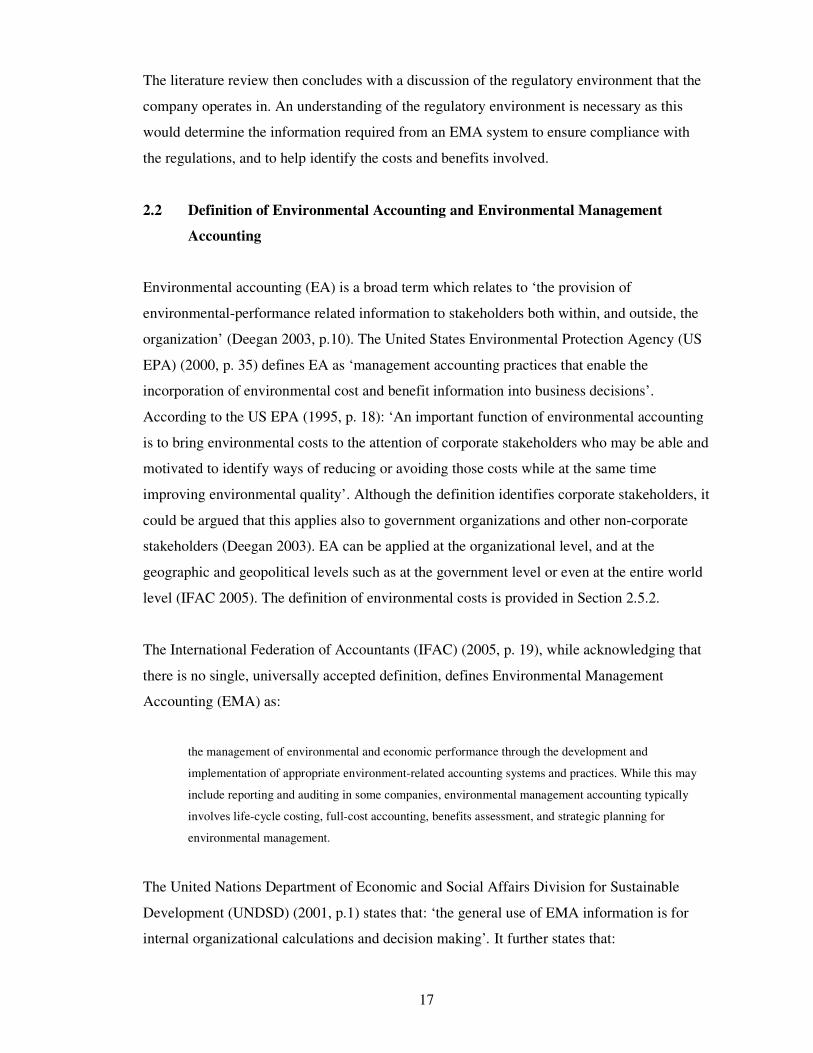
The literature review then concludes with a discussion of the regulatory environment that the
company operates in. An understanding of the regulatory environment is necessary as this
would determine the information required from an EMA system to ensure compliance with
the regulations, and to help identify the costs and benefits involved.
2.2 Definition of Environmental Accounting and Environmental Management
Accounting
Environmental accounting (EA) is a broad term which relates to ‘the provision of
environmental-performance related information to stakeholders both within, and outside, the
organization’ (Deegan 2003, p.10). The United States Environmental Protection Agency (US
EPA) (2000, p. 35) defines EA as ‘management accounting practices that enable the
incorporation of environmental cost and benefit information into business decisions’.
According to the US EPA (1995, p. 18): ‘An important function of environmental accounting
is to bring environmental costs to the attention of corporate stakeholders who may be able and
motivated to identify ways of reducing or avoiding those costs while at the same time
improving environmental quality’. Although the definition identifies corporate stakeholders, it
could be argued that this applies also to government organizations and other non-corporate
stakeholders (Deegan 2003). EA can be applied at the organizational level, and at the
geographic and geopolitical levels such as at the government level or even at the entire world
level (IFAC 2005). The definition of environmental costs is provided in Section 2.5.2.
The International Federation of Accountants (IFAC) (2005, p. 19), while acknowledging that
there is no single, universally accepted definition, defines Environmental Management
Accounting (EMA) as:
the management of environmental and economic performance through the development and
implementation of appropriate environment-related accounting systems and practices. While this may
include reporting and auditing in some companies, environmental management accounting typically
involves life-cycle costing, full-cost accounting, benefits assessment, and strategic planning for
environmental management.
The United Nations Department of Economic and Social Affairs Division for Sustainable
Development (UNDSD) (2001, p.1) states that: ‘the general use of EMA information is for
internal organizational calculations and decision making’. It further states that:

18
the general use of EMA information is for internal organizational calculations and decision-making.
EMA procedures for internal decision-making include both: physical procedures for material and
energy consumption, flows and final disposal, and monetarized procedures for costs, savings and
revenues related to activities with a potential environmental impact.
This definition recognizes that the information generated by EMA systems for internal
decision making can be in both monetary and physical, or financial and non-financial
measures. Other authors, for example, Bennett and James (1998) also recognized that EMA
should encompass the generation, analysis and use of both financial and non-financial
information. Deegan (2003) pointed out that there is a need for environmental performance
indicators to comprise a mix of both financial and non-financial indicators. For example, a
financial indicator could be in relation to the monetary savings in waste costs reduction
whereas a non-financial measure could be in relation to the reduction in spillage rates.
Regardless of the type of information provided, an important characteristic is that the
information can be measured. As the maxim goes, ‘if you can’t measure it, then you can’t
manage it!’ (Gray et al. 2001, p. 47).
2.3 Relationship between management accounting, financial accounting, EA and
EMA
There is a link between financial accounting and management accounting (IFAC 2005;
Langfield-Smith, Thorne and Hilton 2003). Financial accounting is restricted to the
preparation and reporting of accounting information to external parties, that is, outside the
organization. Management accounting, on the other hand, refers to the techniques and
processes which focus on the effective use of organizational resources to support management
in enhancing shareholder and customer values (Langfield-Smith et al. 2003). It is concerned
with the measurement, analysis, and reporting of financial and non financial information
which helps in management decision-making so that the organization’s goals can be achieved
(Horngren, Datar and Foster 2005). It is used to choose, communicate and implement strategy.
This information is also used to coordinate product design, production and marketing
decisions. Burritt (1998) pointed out that the purpose of management accounting may be to
influence management behaviour at the expense of accuracy of information. However, both
financial and management accounting extract data from an organization’s accounting system
including the costing system (Langfield-Smith et al. 2003). For example, the total costs and

19
revenues which may be required for management accounting are related to the organization-
wide expenditures and revenues which are required under financial accounting (IFAC 2005).
The field of management accounting has evolved over the years with a change in focus as
listed in the following chronological order (IFAC 2005):
• focus on cost via cost determination and financial control;
• focus on profitability via the provision of information for planning and control
purposes (Langfield-Smith, Thorne, Hilton 2003);
• focus on waste reduction (to reduce resource loss); and
• focus on effective resource management (so as to use resources effectively) for the
creation of value.
The evolution of management accounting has lead to new concepts and techniques being
developed such as activity-based costing (ABC), life-cycle costing (Langfield-Smith et al.
2003), target costing (Cooper and Slagmulder 1997), kaizen costing (Cooper et al. 1997), the
balanced scorecard (Kaplan and Norton 1996) and total quality management (TQM)
(Langfield-Smith et al. 2003; Deming 1982).
However, conventional and contemporary management accounting do not give separate
recognition to environment-related impact or costs but, rather, focus on the economic or
financial performance (Gray et al. 2001; IFAC 2005; Frost and Wilmshurst 2000; Burritt et al.
2006). Profitability, a measure of financial performance, was identified by Drucker (1968, p.
99) as ‘the ultimate test of business performance’. It is a measure of the net effectiveness of
an organization’s efforts. In addition, financial performance management is crucial for long-
term survival (Kloot et al. 2000). However, environmental issues and the associated costs,
revenues and benefits are also becoming of increasing concern in many countries around the
world (IFAC 2005). The evidence from case studies research by Ditz, Ranganathan and Banks
(1995) showed that environmental costs can be substantial and may account for 20 percent of
total costs for certain products and facilities. But there is also growing recognition that
conventional accounting practices do not provide adequate information for environmental
management purposes (Ditz et al. 1995) and hence, the emergence of EA, including EMA, to
fill in this information gap. Porter (Epstein 1996) stated that all companies can either choose
to:
• consider good environmental performance as a cost and continue to struggle with
environmental regulations; or

20
• seek competitive advantage in quality and cost by looking for innovative solutions to
minimize adverse environmental impacts.
He further added that lack of information, or what he termed “the information gap” (Epstein,
1996, p. iv), was a barrier to performing well from an environmental perspective. Therefore, a
well-designed measurement and control system, along with innovation, is important since this
can help companies understand environmental impacts and their associated costs (including
the opportunity cost of utilizing company resources poorly), evaluate environmentally related
capital expenditure and measure environmental performance.
Burritt, Hahn and Schaltegger (2002) pointed out that the main difference between
conventional and EA systems is that the latter specifically identify, measure, analyze and
interpret information about the environmental aspects of organizational activities.
Conventional accounting systems, on the other hand, provide separate information about the
monetary and physical aspects of an organization’s activities and include:
• management accounting which provides information pertaining to short-term cost
and revenue, long-term investment and internal accountability;
• financial accounting, which provides external stakeholders with information about
the organization’s financial position and performance on a regular basis over
specified periods; and
• other accounting systems which are mainly for regulatory purposes such as tax or
bank regulatory accounting.
Conventional accounting systems also provide information expressed in physical units for the
purposes of production planning; inventory and materials management and quality control.
However, they do not normally give explicit, separate recognition to organizational
environmental impacts (Schaltegger et al. 2000). Hence, Schaltegger et al. (2000) define EA
as a subset of accounting which involves activities, methods and systems; and deals with the
recording, analysis and reporting of environmentally induced financial impacts and the
ecological impacts of a defined economic system such as an organization, a country or region.
From this definition, it can be seen that EA covers both environmentally differentiated
accounting (which measures the environmental impacts in financial terms such as dollars) and
ecological accounting (which measures in physical terms such as joules or kilograms).
EA is a broad term which can be used in various contexts such as (IFAC 2005):

21
• the evaluation and disclosure of environment-related financial information for
financial accounting and reporting purposes;
• the evaluation and use of environment-related monetary and physical information, that
is, EMA;
• in Full Cost Accounting (FCA) which involves the estimation of external
environmental impacts;
• in Natural Resource Accounting (NRA) which is accounting for the monetary and
physical flows and stocks of natural resources;
• the aggregation and reporting of accounting information, including natural resource
accounting and other information, at the organization-level for natural accounting
purposes; and
• in the broader context of sustainability accounting which requires consideration of
environment-related monetary and physical information.
Therefore, EA can be applied in the context of both management accounting (such as EMA)
and financial accounting at the organizational level (IFAC 2005). From a management
accounting perspective, this includes an evaluation of an organization’s expenditures on
pollution control equipment, monetary savings from new energy-efficient equipment and
revenues from recycled materials; while from the financial accounting perspective, this can
include the assessment and reporting of an organization’s current environment-related
liabilities. Analogous to the many links between financial accounting and management
accounting within an organization are the potential links between EMA and the inclusion of
environment-related information in financial reports. For example, when requirements for
environment-related information in financial reports increase, organizations can rely on the
information initially required for internal EMA purposes to assist in meeting their external
reporting requirements (IFAC 2005).
Bennett et al. (1998) identified six different domains of environmental accounting at the firm-
level, based on the boundaries of the individual organization, the supply chain to which it
belongs, and society as a whole, as follow:
• Energy and materials accounting – involves tracking and analysing all energy and
substances flowing into, through and out of the organization;
• Environment-related financial management – the generation and use of financial
information to improve economic and environmental performance;

22
• Life-cycle assessment – a holistic way of identifying a product or service’s
environmental consequences and opportunities for environmental improvements
throughout its entire life-cycle;
• Life-cycle cost assessment - a process that systematically assesses the life-cycle costs
of a product or service by identifying and monetizing the environmental consequences;
• Environmental impact assessment – a process which systematically identifies all the
environmental consequences from the activities of a project, site or the entire
organization (Elkington et al. 1992); and
• Environmental externalities costing – the generation and use of estimated
environmental costs and benefits caused by the activities of a project, site or the
organization itself. The estimates are measured in monetary terms.
In theory, firm-level environmental accounting can encompass all six domains (Bennett et al.
1998).
Gray et al. (2001) provided specific examples of what EA, within an environmental
management context, could cover:
• cost analysis in areas such as energy, waste minimization and treatment and disposal,
site clean-up or remediation, and environmental protection and environmental impact
assessment (of contaminated land, for example);
• accounting for asset revaluations and capital budgeting;
• accounting for liabilities including contingent liabilities;
• consideration of environmental issues in investment appraisals;
• life cycle assessment, that is, a cradle-to-grave approach which includes supplier
activities to materials and end-of-life disposal, in areas such as investing in cleaner
technologies and any associated research and development;
• cost-benefit assessment of environmental improvement and pollution prevention
programs;
• development of new or modifications to existing information systems to cover all
aspects of environmental performance and reporting;
• development of accounting techniques that measure assets, liabilities and costs in
ecological (non-financial) terms;
• environmental performance and issues reporting;
• regulatory compliance (for example, with licences);

23
• environmental auditing;
• the setting up of environmental management systems (EMS) to international standards
such as ISO 14001;
• eco-labelling which states how “green” a product is (Emblemsvag and Bras 2001); and
• assessment of ways whereby sustainability may be incorporated into the
organizational culture.
Gray et al. (2001) and Epstein (1996) referred to the 3 R’s of environmental management
culture as Reduce (decrease waste production), Reuse (reuse what is still useful) and Recycle
(recycle what cannot be reused). An example of this application is Dow Chemical’s waste
management program, Waste Reduction Always Pays (WRAP) which led to savings in raw
materials, fuel and environmental control costs as well as improved product quality and
productivity (Epstein 1996).
From the abovementioned definitions, it can be seen that EMA is a subset of environmental
accounting (Deegan 2003). Generally, its purpose is to provide information for decision
making for internal use. However, the information generated could be utilised for other
purposes such as external reporting. EMA can also be regarded as a subset of management
accounting. As the UNDSD (2001, p.3) notes, doing EMA ‘is simply doing better, more
comprehensive management accounting, while wearing an “environmental” hat that opens the
eyes for hidden costs’.
Bennett et al. (1998) argued that EMA enhances what already exists rather than creates
something completely new. Broadly speaking, this involves:
• using existing sources of data better, or modifying them to generate new sources; and /
or
• using existing management accounting techniques better, or modifying them.
It follows that EMA should be an integral part of management accounting rather than a
parallel system (Jasch 2006).
Bennett et al. (1998) further argued that EMA is, in many ways, an application of the various
advanced management accounting concepts but with an environmental focus, for example:
• it can form one element of the balanced scorecard (Kaplan et al. 1996) or any other
environmental performance and management system (Jasch 2006);

24
• it can be viewed as a specific application of ABC, with the environment regarded as
an important cost driver;
• its inclusion of costs that are upstream and downstream from the organization itself
such as end-of-life costs, related to product-life costing;
• criticism that conventional capital appraisal techniques deal inadequately with long
term strategic benefits and uncertainty, links in with EMA; and
• its emphasis on future costs and benefits is an attempt to address the argument that
management accounting in general needs to focus less on short-term reporting and
controlling, and become more strategy-focused (Johnson and Kaplan 1987).
However, the authors concluded that regardless of how the relationship is viewed, the ultimate
aim is to recognize the importance of environmental performance.
2.4 The benefits and challenges of EMA
EMA is becoming more important because it can be used for internal management initiatives
with an environmental focus such as “green” product or service design, supply chain
management and environmentally preferable purchasing, cleaner production and
environmental management systems (IFAC 2005). In addition, EMA can be used for external
reporting purposes. Bennett and James (1998) believed that one important objective of EMA
is to assist in achieving sustainable development. In this aspect, the communication of
information about the financial benefits and costs of environmental action to external
stakeholders is important. However, they warned that there is a danger of reporting
misleading or erroneous information unless some of the internal accounting issues associated
with the generation and analysis of environment-related financial data are better characterized
and resolved.
The benefits of EMA can be categorized into three broad categories as follow (IFAC 2005):
• compliance;
• eco-efficiency (Jasch 2006); and
• strategic position.
‘Compliance’ entails using EMA to support environmental protection through cost-efficient
compliance with environmental regulations and voluntarily imposed environmental policies
(IFAC 2005). Examples of how to achieve this are by considering pollution control

25
investments, and using cost-effective substitutes for toxic materials. ‘Eco-efficiency’ involves
the use of EMA to help reduce costs and environmental impact simultaneously via more
efficient use of water, energy and materials. For example, this can be done by more accurate
tracking of the flow of water, energy, materials and wastes. ‘Strategic position’ relates to how
EMA can support the assessment and implementation of environmentally sensitive and cost-
effective programs to enhance an organization’s long-term strategic position. Examples of
how this can be done are by liaising with suppliers to design products and services targeted at
‘green’ markets; and internalizing the costs of likely future regulations. The three categories
can be inter-related. For example, a company may implement eco-efficiency projects to
reduce water usage and thus waste water generation. This may also reduce the load to an in-
house waste water treatment plant installed for compliance with regulations as well as
decrease the associated costs (IFAC 2005).
Bennett et al. (1998) identified specific reasons for undertaking EMA. These include showing
the environmental impact on the income statement and the balance sheet; identifying
improvement opportunities such as cost reduction; helping in product pricing, product mixing
and development decisions, improving customer value; helping in making investment and
other long-term decisions; and in prioritizing environmental actions; with one of the
objectives being to achieve sustainable development.
The increasing interest in environmental issues is due to a few factors. One factor is the
growing interest of stakeholders in the environmental performance of organizations (ICAEW,
2004). The environmental pressure is forcing organizations to explore innovative and cost-
efficient ways of managing and minimizing environmental impacts. Gray et al. (2001)
classified environmental pressures under two broad categories: legislative (which could be at
the local, national or regional level) and market-based. Environmental pressure includes
(IFAC 2005):
• disclosure pressures from stakeholders for companies to publicly report their
environmental performance in annual financial reports, or in voluntary environmental
performance reports following guidelines, for example, from the Global Reporting
Initiative (2002);
• supply chain pressures such as large organizations making compliance with the
Environmental Management System (EMS) standard of the ISO compulsory for their
suppliers (Emblemsvag et al. 2001);

26
• regulatory control and environmental tax pressures, for example, government-imposed
carbon taxes, energy use taxes and other emissions fees;
• financing pressures such as socially responsible investment (SRI) funds and
investment policy disclosure requirements; and
• cap and trade pressures such as the emissions cap of the Kyoto Protocol.
With the increase in environmental pressure come increased environment-related costs. These
costs include environmental compliance costs such as costs for required pollution control
equipment, pollution emission and monitoring fees, and regulatory-related paperwork and
reporting. Other costs include liability costs for site restoration and liability-related insurance
costs due to pollution clean-up regulations.
However, organizations are also realizing that there are potential monetary rewards in
improving their environmental performance. Improving efficiency in the use of resources
such as energy, water and other raw materials not only improve the environmental
performance (as a result of reduced usage of resources and reduced waste and emissions) but
also the financial performance due to savings obtained from the decrease in purchases of
materials and waste treatment (IFAC 2005).
There are numerous real-life case study examples where it has been demonstrated that
improving the environmental performance can also improve the financial performance, for
example, by inducing cost savings and increased sales (Deegan 2003; Ditz et al. 1995;
Emblemsvag et al. 2001; Weizsacker, Lovins and Lovins 1997). Organizations are realising
that fostering sustainability actually improves productivity and profits (Dunphy and
Benveniste 2000). Dunphy et al. (2000) gave an Australian example, Pacific Power, which
sought to reduce water usage. It ended up taking sewage from the area's water treatment plant
and filtering it through a filtration plant and a reverse osmosis plant. The filtered water is used
in the generation of electricity at the power station. As a result of this action, plans to
construct an expensive ocean outfall for the area were cancelled. This resulted in savings to
the company, the government and the environment, a win-win situation. Of course, there is
another view that improving environmental performance causes extra costs and consequently
reduces profitability (Schaltegger and Synnestvedt 2002; Filbeck and Gorman 2004).
Schaltegger et al. (2002) suggested that this difference in the results of empirical studies could
be due to the following:

27
• the use of different data sets caused by different countries’ regulatory regimes, the
cultural setting and the type of industries; and
• the lack of a clear theoretical framework for investigating the relationship between
environmental and financial performance. The question is not just whether it pays to
be green but rather when it pays to be green.
Schaltegger et al. (2002) then argued that it is good environmental management (and
managerial qualities) which determines a positive relationship between environmental and
financial performance. This can be done, for example, by improving eco-efficiency through
(Schaltegger et al. 2002):
• optimising production processes to reduce costs; or
• assessing various technological alternatives on clean production.
Limitations in the effective collection and evaluation of environment-related data can lead to
management making decisions based on inaccurate, misinterpreted or inadequate information
(IFAC 2005). As a consequence, management may misunderstand the negative consequences
of poor environmental performance as well as the (potential) costs and benefits of improved
environmental performance. These limitations arise due to certain factors. Firstly, the
communication and links between accounting and other departments are usually not well-
developed. Accountants usually have the accounting information but little knowledge of
environmental issues or the flow of physical resources; and vice versa for the technical and
environmental staff. In addition, different departments may have different perspectives in
regard to EMA-related activities. For example, the production department may produce waste
but not be held accountable for the costs of waste disposal.
Furthermore, accounting, technical and environmental staff may use different information
systems. Checking for consistency may be difficult because different information systems
may use different boundaries for material flow tracking, different terminology et cetera (IFAC
2005). A study by Jasch (2006) revealed that managers who have a technical background may
frequently work with technical data instead of with the accounting data and the
inconsistencies with the accounting figures were substantially significant. Johnson et al. (1987)
recognized that management accountants should work with operating managers and engineers
to develop a system which is consistent with the organization’s strategy, technology and its
organizational structure. Such a system should be able to provide information to management
to assist them to make decisions regarding capital investments, coordinate operations, provide
28
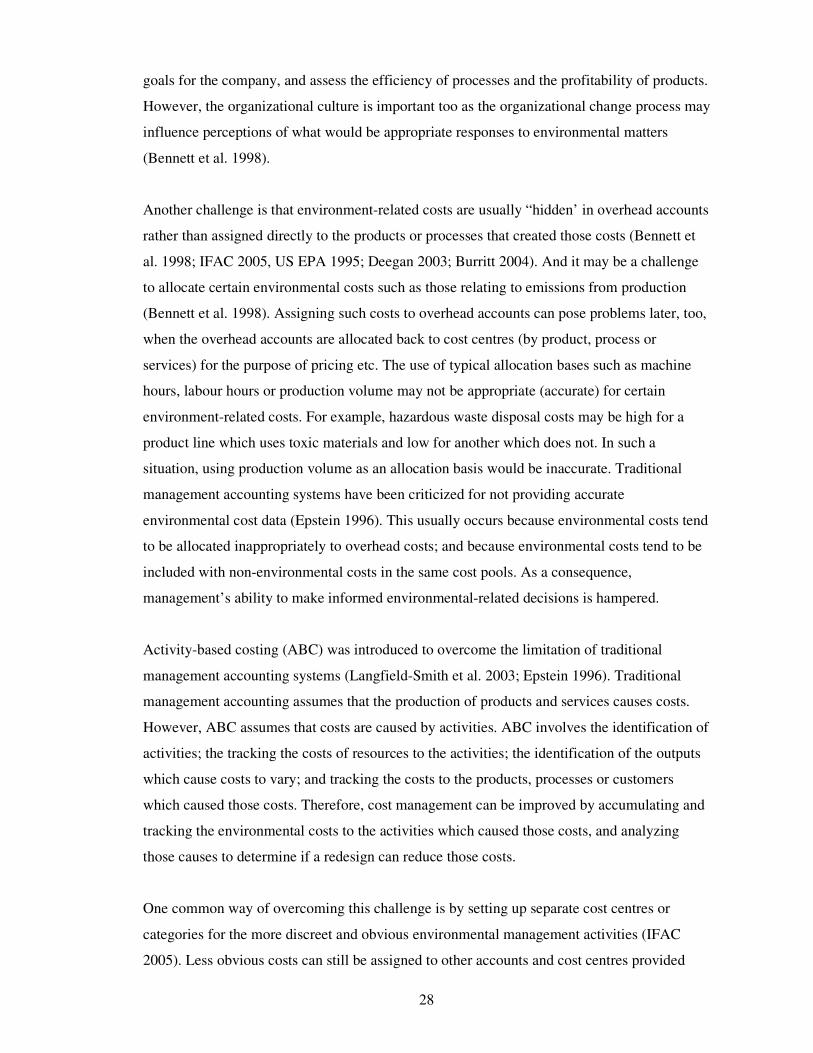
goals for the company, and assess the efficiency of processes and the profitability of products.
However, the organizational culture is important too as the organizational change process may
influence perceptions of what would be appropriate responses to environmental matters
(Bennett et al. 1998).
Another challenge is that environment-related costs are usually “hidden’ in overhead accounts
rather than assigned directly to the products or processes that created those costs (Bennett et
al. 1998; IFAC 2005, US EPA 1995; Deegan 2003; Burritt 2004). And it may be a challenge
to allocate certain environmental costs such as those relating to emissions from production
(Bennett et al. 1998). Assigning such costs to overhead accounts can pose problems later, too,
when the overhead accounts are allocated back to cost centres (by product, process or
services) for the purpose of pricing etc. The use of typical allocation bases such as machine
hours, labour hours or production volume may not be appropriate (accurate) for certain
environment-related costs. For example, hazardous waste disposal costs may be high for a
product line which uses toxic materials and low for another which does not. In such a
situation, using production volume as an allocation basis would be inaccurate. Traditional
management accounting systems have been criticized for not providing accurate
environmental cost data (Epstein 1996). This usually occurs because environmental costs tend
to be allocated inappropriately to overhead costs; and because environmental costs tend to be
included with non-environmental costs in the same cost pools. As a consequence,
management’s ability to make informed environmental-related decisions is hampered.
Activity-based costing (ABC) was introduced to overcome the limitation of traditional
management accounting systems (Langfield-Smith et al. 2003; Epstein 1996). Traditional
management accounting assumes that the production of products and services causes costs.
However, ABC assumes that costs are caused by activities. ABC involves the identification of
activities; the tracking the costs of resources to the activities; the identification of the outputs
which cause costs to vary; and tracking the costs to the products, processes or customers
which caused those costs. Therefore, cost management can be improved by accumulating and
tracking the environmental costs to the activities which caused those costs, and analyzing
those causes to determine if a redesign can reduce those costs.
One common way of overcoming this challenge is by setting up separate cost centres or
categories for the more discreet and obvious environmental management activities (IFAC
2005). Less obvious costs can still be assigned to other accounts and cost centres provided

29
that they can be more easily traced by labelling those costs clearly as environment-related. In
addition, determination of the appropriateness of the cost allocation bases used for those
environment-related costs can be done by assessing the relative importance of those costs and
the associated cost drivers between the different product and process lines (IFAC 2005).
Bennett et al. (1998) stated that there is a view that the costs of changing current accounting
systems solely to reflect environmental matters may outweigh the benefits. However, major
opportunities may present themselves if the change is due to other reasons such as to
implement ABC.
Thirdly, information pertaining to materials use, flow and cost is often not tracked adequately,
that is, not sufficiently accurate or detailed, despite the use of Enterprise Resource Planning
(ERP) and other software systems (IFAC 2005). Bennett et al. (1998) highlighted that there
may be difficulties with data availability and reliability. For example, in some accounting
systems, all materials purchase information is posted into one account, but the detailed
breakdown of each type of material and the associated quantity and amount are only kept in
the stock management records (IFAC 2005). As a result, it is rather difficult to aggregate the
data from the stock management records by materials category or trace the actual
consumption of the different categories of materials. To do such data reorganization and
comparison may be costly and time-consuming. Another example is the practice whereby
materials purchase costs and materials processing costs such as labour are aggregated into one
single cost item (IFAC 2005). Where several stages are required to manufacture a final
product, the sum of all materials purchase and processing costs incorporated into the semi-
finished product entering the final manufacturing stage should be the value of that semi-
finished product. However, if this cost information is posted in the accounting records as one
lump sum amount, disaggregation of these costs for later decision-making may prove time-
consuming and complicated (IFAC 2005).
Another challenge is that the accounting records may not contain certain types of
environment-related cost information (IFAC 2005, US EPA 1995). Gray et al. (2001) argued
that accounting and financial systems play a crucial role in the operations of all organizations.
These systems provide:
• records and measures of the success and failures of past activities;
• constraints on actions, and estimates of and constraints on resources required for those
actions;
• targets, and measure and reward performance against those targets; and

30
• a significant part of the analytical framework within which new activities are
evaluated and planned.
Accounting systems have traditionally looked towards the past (IFAC 2005). Therefore, they
typically do not have much information on future environment-related costs which may be
quite significant. In addition, accounting records often lack other less tangible environmental-
related costs such as lost access to markets with environment-related restrictions on products,
and costs incurred due to poor environmental performance which leads to lost sales to
environmentally-conscious consumers. Although these costs may be difficult to estimate, they
can have a real and significant impact on an organization’s financial performance (IFAC
2005).
Therefore, if environmental considerations are not embedded into the accounting and
financial systems, these systems may not only be unsupportive of organizational change
towards enhancing environmental performance, but may actually prevent it (Gray et al. 2001).
Without the integration of environmental issues with the traditional accounting systems, the
traditional performance criteria, being accounting–related measures, can be expected to
dominate (Gray et al. 2001). A survey by Deegan, Geddes and Staunton (1996) revealed that
if environmental reporting were to remain voluntary and this issue left to the accountants, any
future disclosures may be minimal. This finding reaffirmed the earlier findings by Bebbington,
Gray, Thomson and Walters (1994) that accountants and accounting do not appear to be
involved in responding to the environmental agenda.
Furthermore, if the accounting system only emphasizes the costs associated with
environmental matters without any corresponding emphasis of the benefits (financial,
environmental or otherwise) obtained, this would have the effect of discouraging rather than
encouraging any attempts to improve environmental performance (Gray et al. 2001; Nikolai,
Bazley and Brummet 1976). However, quantifying the benefits may prove difficult especially
if the benefits are intangible (Elkington et al. 1992). For example, what is the value of a good
environmental image? They argued that after all the calculations have been done and there is
still no clear decision, it is the corporate culture which provides the ultimate direction. Nikolai
et al. (1976) discovered that environmental costs and benefits are measured in monetary terms
by organizations so as to comply with regulations, for external reporting purpose, to obtain
tax incentives relating to pollution control, for decision-making relating to self-imposed social
responsibilities and for decision-making relating to externally induced social responsibilities.

31
On the other hand, environmental costs and benefits are not measured because it is not
required by legislation, not worth the use of monetary resources, not worth the use of
personnel resources, and or there are no monetary and personnel resources available or
techniques to do so (Nikolai et al. 1976).
Identifying internal environmental costs is relatively easy if the costs were incurred solely for
environmental protection such as with ‘end-of-pipe’ technologies (Schaltegger and Muller
1998). ‘End-of-pipe’ costs are those incurred upon completion and, as a consequence of,
production and other processes which have negative environmental impacts. Such costs
include decommissioning and restoration costs and penalties imposed by regulators. However,
end-of-pipe technologies in general, by definition, capture the emissions before they are
released. In contrast, ‘front-of-pipe’ costs are those incurred, in general, in the preventive
management of negative environmental impacts that arise from the organization’s activities
(Parker 2000). By definition, they are usually incurred in the early stages of processing and
therefore reduce or prevent pollution and or other negative impacts.
On the other hand, identifying and measuring environmental costs relating to ‘integrated
technologies’ (or ‘clean technologies’) are more difficult (Schaltegger et al. 1998). Such
technologies (for example, new equipment which uses less energy and creates less toxic
effluents than the old equipment) are more production-efficient and reduce negative
environmental impacts at the source before they occur. Therefore, a cogeneration plant could
be categorized as an ‘integrated technology’. Since environmental impacts were already
integrated when the equipment was designed, the question then is which part of the equipment
and what portion of the maintenance expenditure are environment-related? Schaltegger et al.
(1998) argued that it should be the cost differential in regard to the next (less)
environmentally favourable solution. They gave the following examples:
• if the capital costs to install the integrated technology were 20 percent more relative to
a comparable equipment, then that extra 20 percent may be traced as environmental;
• if the integrated technology was installed two years earlier so as to comply with
environmental regulations rather than due to economic justification, the depreciation
expense of the old technology over those two years may be traced as environmental
costs
They cautioned that if the integrated technology is state of the art technology and was simply
a routine replacement of the old equipment, the related costs therefore should not be treated as
environmental costs.

32
Last but not least, there is a risk of inappropriate investment decisions being made when
consistent and comprehensive environment-related information is not provided in a timely
manner (IFAC 2005). A lack of reasonable estimates of environment-related costs (such as
likely future costs if action is not taken now) and benefits (such as likely future benefits if
action is taken now) adds to the inherent uncertainty of investment decision-making.
However, Epstein (1996) argued that an estimate is better than no estimate at all. It forces
companies to be more careful when designing products and processes so as to reduce future
environmental impacts. In addition, it helps companies to better understand the possible
impacts of changing technology, changing cost of technology and changing regulations
(Epstein 1996). Bennett et al. (1998) argued that it is important to identify hidden
environmental costs and benefits (savings) which may be substantial otherwise this may lead
to a bias against pollution prevention especially if the hidden potential benefits are more
significant.
The IFAC (2005) argued that organizations should take into consideration all potentially
significant environment-related costs which may impact on investment returns. Examples of
such costs are site recovery costs, materials flow costs and any costs related to likely or
certain future regulations. However, Epstein et al. (1998) recognized that one of the
challenges with capital investment appraisals is the monetizing of environmental externalities.
The pricing of options for uncertainties in capital investment appraisal is another challenge
which was identified by Schaltegger et al. (1998) as cited in Bennett et al. (1998). An example
of an option value would be the capability to adapt quickly to new circumstances such as
changes in environmental regulations or new scientific evidence in regard to environmental
issues. In addition, organizations should ensure that technical and environmental staff and
accountants work together so that a full picture of environmental issues and the associated
costs and benefits can be obtained which would then be relevant for investment decision
making (IFAC 2005). However, there may then be other organizational issues to address such
as employees’ acceptability of the economic evaluation of environmental matters, and
employees’ interest in environmental costs (Bennett et al. cited in Adams et al., 2004). The
IFAC (2005) also emphasised the importance in investment decision making of differentiating
between variable and fixed environment-related costs. Fixed costs by definition are difficult to
reduce. In comparison, variable costs are easier to reduce with some reduction requiring no or
a short payback period (IFAC 2005).

33
2.5 The EMA framework
For the purpose of this research, the EMA framework is based on the IFAC framework, with
additional input from other works. This is due to the IFAC being the worldwide organization
for the accountancy profession, comprising over 160 professional accountancy bodies in 119
countries including Australia. It is also due to this guidance document (IFAC 2005, p. 3):
providing a general framework and set of definitions for EMA that is fairly comprehensive and as
consistent as possible with other existing, widely used environmental accounting frameworks with
which EMA must coexist.
However, it is also worthwhile considering the comprehensive EMA framework proposed by
Burritt et al. (2002) which is based on the types of information drawn up by five dimensions
as follow:
• the requirements of internal versus external stakeholders. For example, the
environmental manager versus the Accounting Manager versus the supplier’s
information requirements;
• physical versus monetary information;
• the time frame that is past versus future oriented such as costs actually incurred in the
past versus budgets for future costs;
• the period of time which is a short term versus a long term focus. An example could
be information for an assessment of relevant environmental costing decisions versus
environmental life cycle (and target) costing; and
• routine versus ad hoc information gathering. For example, energy flow information
versus environmental investment appraisal.
2.5.1 The physical accounting side of EMA
EMA emphasizes materials and materials-driven costs because the use of energy, water and
materials, and the generation of waste and emissions by organizations tend to have a direct
impact on the environment (IFAC, 2005). Furthermore, materials purchase costs are a major
cost driver in many organizations.
Waste is produced because materials that were intended to go into final product became waste
instead due to product design issues, operating inefficiencies, quality issues etc (IFAC 2005).

34
Energy, water and other materials are also used which may not be intended to go into the final
product but are necessary to produce the product, or to help run the operations of an
organization. Such consumption can lead to the generation of waste and emissions which
impact on the environment. Another materials-related environmental impact is the potential
impact from physical (final) products including the by-products and packaging produced by
manufacturers when they leave the manufacturers. An example is when a product reaches the
end of its useful life and ends up in a landfill. Some of the potential environmental impact can
be reduced by changing the product design such as reducing the volume of paper required for
packaging. Tracking and decreasing the amount of energy, water and other materials used by
organizations can also have indirect environmental benefits upstream. This is because the
extraction of most raw materials such as forestry and mining has environmental impacts. To
effectively manage and minimize the potential environmental impacts, organizations need
accurate information regarding which and how much energy, water and other materials are
brought in, what end up as physical products and what become waste and emissions. This
physical information, which is essential for effectively managing the potential environmental
impacts, can be provided by the accounting function, in particular the physical accounting
side of EMA (IFAC 2005).
2.5.1.1 Physical information and Environmental Performance Indicators
Organizations should attempt to track all physical inputs and outputs (refer Sections 2.5.1.3 to
2.5.1.5) and ensure that all significant amounts of energy, waste and other materials are
accounted for (IFAC 2005). A common unit of measurement is necessary to measure those
physical quantities (Gray et al. 2001). The accounting for all physical inputs and outputs is
known as the mass balance (Gray et al. 2001), eco-balance (Deegan 2006), materials balance
(IFAC 2005) or material flow balance (UNDSD 2001). The underlying assumption is that the
inputs and outputs must balance because all physical inputs theoretically eventually become
outputs. Therefore, any imbalance will indicate losses. The quality and availability of data,
and the purposes of the information collection all influence the level of precision of the
materials balance (IFAC 2005). Jasch (2006) suggested that it is sufficient to be able to trace
approximately 70 percent of all materials in the material flow balance in the first year of
material flow analysis. This percentage can then be increased in following years. However, it
is highly unlikely that an organization will know exactly everything that comes into the
organization and where all those inputs end up (Gray et al. 2001). It is impossible to capture
the total environmental impacts of any organization because (Gray et al. 2001):
35
• every interaction within a complex ecology can produce potentially infinite
consequences. For example, water pollution changes the nature of the environment
and the organisms within. This then changes the water habitats and affects the
creatures which depend on those organisms, which affects the course of the water and
so on; and
• it is extremely difficult to know either where the interaction will end up (for example,
will the pollution of land end up in the water course?) or, what other ecological
manifestations can occur when the interactions meet (for example, the emissions of
two relatively harmless substances from two organizations might interact to produce a
malign substance). Jasch (2006) stated that as production patterns change, emissions
patterns may change too.
Materials flow accounting can be used to obtain a complete and integrated picture of material
usage (IFAC 2005). This involves tracing materials flows through the entire materials
management system such as the procurement of materials, delivery, storage (inventory),
internal distribution, use and shipment of products. It also includes recycling, waste collection,
treatment and disposal. The boundaries may be extended beyond the organization’s operations
to encompass physical information from customers, suppliers and other components of the
supply chain as part of Supply Chain Environmental Management. Alternatively, it can
encompass the product or service life cycle as part of Life-cycle Assessment (IFAC 2005).
Related to this concept is flow cost accounting which links quantitative monetary and physical
to the materials flow and where material flows are treated as cost drivers (UNDSD 2001).
This then creates a database of quantities in physical units such as kWh and kg, costs related
directly to the material flow and other costs incurred in maintaining the material flow system,
and the values such as physical quantity multiplied by the input price. Usually, the
organization’s existing database, and its material management, production planning and
control system; would contain the bulk of the data required. Flow cost accounting can lead to
cost reduction via improved material efficiency (that is, a reduction in materials and energy
used), thus resulting in environmental benefits such as a reduction in emissions, effluent and
(other) waste (UNDSD 2001). Jasch (2006) suggested that companies should constantly refine
the material flow balance on a monthly basis in conjunction with financial accounting data.
The physical accounting data collected can be used to assist with the cost accounting side of
EMA. In addition, the data can help identify which environmental aspects to focus on, and to
identify environmental performance indicators (EPI) (IFAC 2005). This then allows the

36
organization to focus on the eco-efficiency of its operations (Gray et al. 2001). However, eco-
efficiency does not capture “eco-effectiveness” that is, the total environmental interaction.
Focusing on efficiency alone poses the risk of doing efficiently that which should not have
been done in the first place (Gray et al. 2001). Pears (2000) argued that a limitation in
implementing systematized approaches to improving environmental performance such as
compliance with ISO 14000 is the lack of emphasis on prioritization and benchmarking of
performance against best (feasible) practice. And, although continuous improvement is not
necessarily a bad thing, it may obscure the potential for radical improvement since an
organization may focus on fine-tuning existing systems and equipment due to its target of
achieving continuous improvement of say two percent every year (Pears 2000). In a study
sponsored by the Environment Agency of England and Wales in 2002 into whether ISO
14001-certified sites had better environmental performance compared to those without the
standard, it was discovered that although the standard was associated with better procedures,
these procedures were not linked with better environmental performance in terms of fewer
incidents, complaints or non-compliance events (Oakley and Buckland 2004).
A fundamental component of good environmental management is the ability to assess
performance (Elkington et al. 1992). Performance measures can include the number of times
in not complying with emission or effluent limits and the number of law suits or liability
claims.
There are two types of indicators (IFAC 2005). Absolute indicators show the consumption of
resources and the generation of waste. Relative (normalized) indicators such as amount of
wastewater produced per unit of product, on the other hand, enable an organization to assess:
• changes in environmental performance due to changes in production output or size;
and
• changes in performance resulting from environmental management efforts.
Relative indicators can also link monetary and physical terms, and can be calculated at
different levels such as at the organizational or product level (IFAC 2005).
In a case study conducted by Shields, Beloff and Heller (1997), it was discovered that non-
financial indictors are essential at the plant level. A possible reason for this is that decisions
made at the operational level tend to be technical, prompt and relatively straightforward.
However, the higher the management, the more important financial indicators become. This

37
may be due to management performance being based on financial measures. Furthermore,
financial information can be viewed as a way of assessing the overall economic effects of the
(operational) methods adopted and alternatives to be considered (Shields et al. 1997).
2.5.1.2 Types of physical information
Inputs are water, energy and other materials which enter an organization whereas outputs
encompass all products, waste and other materials which exit an organization (IFAC 2005.
The terms Inputs and Outputs exclude capital items such as buildings and equipment.
Although some of these items may become waste eventually, they are typically excluded from
materials balance or materials flow accounting, and hence not tracked in the same information
systems, because of the different frequency and volume in which they enter and exit the
organization compared to other physical materials. The IFAC (2005) suggests that those
capital items, other than the associated depreciation costs, may be tracked separately from
other physical materials for environmental management purposes.
2.5.1.3 Inputs
Inputs comprise water, energy and other materials which enter an organization (IFAC 2005;
UNDSD 2001). Inputs can be classified into six categories as follow (IFAC 2005):
• raw and auxiliary materials are inputs which become part of an organization’s product
or by-product. Raw materials form major components of products whereas auxiliary
materials form the more minor components (UNDSD 2001;
• packaging materials are used in transporting the products and can either be purchased
or processed internally;
• items which are purchased and then sold again as products without additional, or little,
processing; are termed as merchandise. In general, the environmental impacts and
costs associated with merchandise, such as those associated with handling and storing
the merchandise, tend to be insignificant compared to other inputs;
• operating materials are inputs such as chemical catalysts, office supplies and
equipment cleaning solvents. They are purchased for internal use and do not form part
of the product and, hence, automatically become non-product output when they exit
the organization;

38
• water may be used for internal purposes such as cleaning or cooling, similar to
operating materials; and may exit as part of a product and or as waste. Water is
categorized separately because:
o water flow information is usually tracked by accounting systems differently
from other materials flow information; and
o it is important from an environmental perspective;
• energy encompasses all types of energy that can be used such as gas, electricity and
solar. Like water, it can be used for internal purposes or form part of the product (via,
for example, a chemical reaction). And it is categorized separately for the same
reasons as water.
2.5.1.4 Product Outputs
Product outputs cover products, by-products which are minor products produced incidental to
the production of the primary products (UNDSD 2001), and the associated packaging (IFAC
2005).
2.5.1.5 Non-Product Outputs (waste and emissions)
By definition, any output which is not a product output is a Non-Product Output (IFAC 2005).
These include (IFAC 2005):
• solid waste which is solid and relatively non-hazardous waste;
• hazardous waste which can be in solid, liquid or mixed forms. Hazardous, depending
on the context, can be defined as toxic, carcinogenic, flammable or infectious;
• waste water which relates to any waste stream which comprise water as the main
component and contaminants such as total suspended solids and excess heat; and
• air emissions which are contaminated air streams with excessive levels of pollutants.
Pollutants include by-products from energy combustion such as nitrogen oxides,
carbon monoxide and volatile organic compounds. Heat, radiant and noise are also
categorized as air emissions.
2.5.2 The monetary accounting side of EMA
Monetary data, similar to physical data, can be collected under EMA for particular sites,
process or product lines, waste streams or for the organization as a whole (IFAC 2005). This

39
depends on whether the information collected is for investment appraisal or for some other
purpose. Also, as with physical data, the system boundaries can be extended beyond the
organization’s operations for the purpose of Life-cycle Assessment or Supply Chain
Environmental Management.
When environmental accounting and EMA are involved, reference to environmental costs is
pertinent. This is a term that can be defined in several ways (Deegan 2003; IFAC 2005;
Howes 2004), depending on how organizations intend to use the information (for example, for
cost allocation, process or product design, or for capital budgeting), their views of what is
‘environmental’, and their economic and environmental goals (IFAC 2005). Traditionally,
environmental costs were deemed to be ‘end-of-pipe’ costs such as waste-water treatment
costs or the costs related to cleaning up sites after production. Focusing on these end-of-pipe
costs and technologies as part of environmental management policies may generate returns in
the short term, but could be costly in the long term as this ignores the consumption of
resources within the organization.
A broader term would be to include the costs of material and energy used to produce goods
and services, the input costs associated with waste being generated (including the capital costs,
labour costs, materials and energy costs used to produce the waste) and any associated
disposal costs, storage costs for certain materials, insurance for environmental-related
liabilities and environmental regulatory costs including compliance costs and licensing fees,
inclusive of any fines (Deegan 2003) and costs of monitoring emissions, and in operating an
environmental department (Howes 2004).
Deegan (2003, p.11) added that instead of ‘arguing about the semantics of what should be
included in environmental costs’, the focus should be on ensuring that:
• the processes relating to the classification and measurement of environmental costs are
logical and appropriately communicated; and
• significant and relevant (environmental) costs are considered in decision-making.
The definition adopted should clearly delineate the scope of costs that is included so as to
minimize potential ambiguity. In addition, there needs to be consistency in how
environmental costs are defined from period to period to facilitate inter-period comparisons
(Deegan 2003).

40
The environmental costs might also include the environmental and social costs caused to other
entities by the organization’s operations (Deegan 2003). These external costs are usually
referred to as “societal costs” for which the organization is not directly held accountable.
Most organizations would restrict their focus to “private costs” being those costs for which
the entity is held accountable and which would affect the organization’s financial
performance (Deegan 2003).
2.5.2.1 Environmental Cost Categories
The IFAC (2005) categorized environment-related costs into four types as follows, claiming
that this categorization is based on widely accepted international practice and best practice:
1. environmental activity type costs such as waste prevention and control;
2. costs that represent traditional accounting such as labour and materials;
3. environmental domain type costs such as land, air or water; and
4. costs which reflect data visibility in the accounting records such as hidden and obvious
costs.
Because data visibility or availability can differ significantly between organizations, this
category was not considered any further by the IFAC (2005).
The first three cost categories mentioned above can be categorized further as follow (IFAC
2005):
1. materials costs of product outputs;
2. materials costs of non-product outputs
3. waste and emission control costs;
4. prevention and other environmental management costs;
5. research and development costs; and
6. less tangible costs.
1) Materials costs of product outputs include the purchase costs of materials inputs which are
processed into products and by-products and the associated packaging (IFAC 2005). Such
costs include the purchase costs of raw and auxiliary materials, packaging materials and water.
It is possible that the overall materials-related environmental impacts of a (manufacturer’s)
product; throughout its life-cycle from the extraction of materials, manufacturing,

41
consumption by the customers, to its final disposal; may outweigh the environmental impacts
from the materials which convert into waste during production (IFAC 2005). An organization
can more cost-effectively manage the environmental impacts of its products pertaining to
materials with the help of these cost data. An example is when considering the use of a less
toxic, more cost-effective substitute as input material. The information from the physical
accounting side of EMA on the quantity and flows of relevant materials and products can be
used to help evaluate such costs (IFAC 2005).
2) Materials costs of non-product outputs include the purchase costs of materials inputs which
are converted into non-product outputs, namely, waste and emissions (IFAC 2005). This
conversion usually happens during the manufacturing process. By definition, input materials
either become product outputs or exit the organization as non-product outputs. Therefore,
where there is no product output, it follows that all input materials will exit the organization
as non-product outputs. Such materials inputs include raw and auxiliary materials, packaging
and operating materials, and water and energy. Estimates of loss and scrap percentages can be
used in calculating the purchase costs of such materials if actual measures of losses are not
available (IFAC 2005).
For manufacturing operations, the processing costs of raw and auxiliary materials up to the
point of conversion into waste and emissions fall into this cost category also (IFAC 2005).
Such costs include the proportion of equipment depreciation and labour costs incurred when
waste and emissions were generated instead of a final product. An estimate, based on a
percentage of the (related) standard production costs can be used. However, precaution should
be taken to avoid double counting since standard production costs may include costs in other
categories in addition to equipment deprecation and labour costs (IFAC 2005).
These costs may be regarded as related to efficiency or quality (IFAC 2005). However, they
are also environment-related since they assist in the cost-effective management of the
environmental impacts of an organization’s waste and emission. For example, they can help in
deciding whether to acquire more efficient equipment which generates less waste per unit of
product output. Although some (types of) waste and emissions cannot be reduced, proactive
and preventive environmental management, which reduces the quantity of waste generated
instead of just treating waste which has been generated, may reduce the purchase costs of
materials lost as wastes as well as subsequent waste treatment and control costs. Information

42
on the quantity and flows of materials and wastes required to evaluate these costs can be
provided by the physical accounting side of EMA.
3) Waste and emission control costs cover costs relating to the control and treatment of waste
and emissions after they have been generated (IFAC 2005). These include costs for:
• operating materials;
• energy and water;
• equipment depreciation;
• internal labour;
• external services;
• fines, fees, permits, taxes. Examples include the cost of tradable permits of GHG
emissions, wastewater discharge fees, carbon dioxide emission fees, eco-taxes relating
to packaging and fines and penalties imposed by governments for non compliance
with regulations;
• insurance to cover potential liability relating to waste and emission control such as
insurance for the non-intentional release of toxic materials (IFAC 2005) and other
insurance for environmental liability (UNDSD 2001); and
• compensation and remediation such as for cleaning up contaminated sites and
compensation to third parties.
Control activities include off-site recycling and equipment maintenance. Depreciation on
waste and emission control equipment such as the following are included in this category as
well as annual equipment leasing costs (IFAC 2005):
• waste handling equipment such as water transportation equipment;
• waste and emissions treatment equipment. For example, air scrubbers and wastewater
treatment systems; and
• waste disposal equipment.
Waste and emissions control systems may include control equipment which may be integrated
into actual production equipment (IFAC 2005). Where the equipment is large such as waste
water treatment plants, the associated costs tend to be recorded in separate cost centres within
the accounting system. On the other hand, there are control systems which have stand-alone,
‘end-of-pipe’ control equipment where the only purpose is to control waste and emissions
(IFAC 2005).

43
Operating materials, as defined in Section 2.5.1.3, used specifically for controlling waste and
emissions include costs relating to (IFAC 2005):
• any related regulatory compliance associated with waste and emission control such as
for personal protective equipment and training materials;
• waste and emission handling such as for containers;
• waste treatment such as for wastewater treatment chemicals;
• waste disposal such as for the on-site landfill; and
• the maintenance of waste and control equipment such as for equipment cleaning
materials.
Energy and water used specifically for controlling waste and emissions can be included in this
category if they can be estimated or if the data are captured under relevant cost centres (IFAC
2005). Such costs include the purchase costs relating to waste and emissions handling,
treatment and disposal such as energy for waste transport equipment and water for scrubbers.
Internal labour costs cover activities relating to (IFAC 2005):
• waste handling such as waste collection, testing and internal transport;
• waste treatment such as operating the wastewater treatment plant;
• waste disposal;
• maintenance such as maintenance of the wastewater treatment plant; and
• regulatory compliance such as record keeping, inspections and training.
This category also includes costs of all external services relating to waste and emissions
control. External service providers include contractors, consultants, law firms and certification
bodies (IFAC 2005).
4) Prevention and other environmental management costs relate to costs incurred in the
prevention of waste and emission generation, and the implementation of other environmental
management activities not directly related to waste and emission control (IFAC 2005).
Preventive environmental management activities include on-site recycling, cleaner production,
supply chain environmental management, proactive eco-system management, green
purchasing and extended producer responsibility. More general environmental management
activities include:
• environmental planning and associated systems such as environmental financial
accounting, EMA and environmental management systems (EMS);

44
• environmental measurement such as monitoring, performance evaluation and
performance auditing;
• environmental communication such as government lobbying and performance
reporting; and
• other related activities such as providing financial support for community-based
environmental projects.
The IFAC (2005) noted that preventive environmental management activities can improve
environmental performance as well as financial performance through waste reduction, more
efficient use of materials and enhanced product quality.
This category also includes costs pertaining to equipment depreciation, operating materials,
water and energy, internal labour, external services and other costs (IFAC 2005). The
depreciation costs for equipment used for preventive and other environmental management
activities, as discussed above, can be included in this category. Furthermore, a percentage of
the depreciation of certain equipment may be included under this category simply because
these equipments inherently use materials or energy more efficiently and or produce less
waste compared to alternative equipment. The percentage that is environment-related, if any,
can be estimated based on whether the equipments were purchased for efficiency and or
environmental purpose(s). Costs for operating materials, energy and water are generally
included under the materials costs of non-product outputs since the data available are not
sufficiently disaggregated to be accounted for separately. However, the IFAC (2005) states
that they can be estimated separately under this category if they are regarded as (potentially)
significant for a particular purpose such as when appraising a capital project in terms of
materials-efficiency. Internal labour costs relate to employees’ time spent on the
abovementioned environmental management activities such as the operation of on-site
recycling equipment, implementation and management of the EMS, internal environmental
auditing, and compilation and publication of an environmental performance report. The costs
of external services provided by consultants and other outside parties that relate to
environmental management are included in this category (UNDSD 2001). Other costs include
donations to environmental projects which may also form part of the organization’s corporate
social responsibility as well as compensation for environmental damage caused in other
countries which have less stringent environmental regulations.
5) Research and development costs which relate to environment-related matters are included
in this cost category (IFAC 2005). Such research and development activities include the

45
testing of new equipment designs to improve materials use efficiency, designing of energy-
efficient products, and researching the toxicity of materials. This category covers costs
relating to equipment depreciation, operating materials, energy and water, internal labour and
external services.
6) Less tangible costs include current real internal costs and externalities of which there is no
current obligation to pay (IFAC 2005). An example is the costs of reduced productivity in an
operation with high waste generation. Costs which are currently external may be internalized
in the future due to changes in environmental regulations and the increasing emphasis on
corporate social responsibility. Less tangible costs can significantly impact an organization’s
financial performance in addition to its environmental performance even though they may be
difficult to predict or quantify. The IFAC (2005) believes that it is good risk and financial
management to have approximate estimates of costs than to not identify and estimate the costs
at all since this then enables organizations to take corrective actions earlier, a view shared by
the US EPA (1996b). Less tangible costs encompass liabilities for environmental issues,
future regulations, productivity, image and stakeholder relations, and externalities. Liability
costs for environmental issues can be categorized as:
• liabilities for non-compliance with environmental regulations such as non-
compliance fines for compulsory site clean-up; and
• liability awarded by the court for personal injury, or property and natural resource
damages such as restoration and compensation costs.
Under financial accounting, certain items may have to be recognized as liabilities in the
balance sheet (IFAC 2005). An example is a legally imposed obligation to clean up the site
(UNDSD 2001, Deegan 2006). Therefore, it is important that liabilities can be identified
under EMA also. Less tangible environmental liabilities can be estimated using approaches
such as engineering cost estimation, actuarial techniques, decision analysis techniques and
professional judgment (IFAC 2005). A survey conducted by Surma and Vondra (1992)
indicated that measurability (the ability to make a reasonable estimate) rather than probability
was usually the key factor in deciding when to recognize a liability. They believed that
making a reasonable estimate requires management judgment in evaluating (evolving or
changing) technological and regulatory factors.
It is also important that EMA can consider future regulation. External costs may become
internalized because of environmental regulations. An example is asbestos-related liabilities

46
which were external costs that became internalized and therefore impacted on the balance
sheet (IFAC 2005). As Ditz et al. (1995 p. 42) put it: ‘simply tracking historical costs is not
good enough – it is blind to future changes in the rules of the game’.
When attempting to identify less tangible costs, it is worthwhile considering the relationship
between an organization’s productivity and environmental performance (IFAC 2005). An
example is the negative impact which inefficient equipment has on both productivity (a
reduction in production volume) and environmental performance (increase in waste
generation). Problems with product quality can also have a negative impact on environmental
performance due to increased waste generation. Conversely, there may be a negative
relationship between productivity and environmental performance. For example, the use of
chemicals which may improve productivity but impact adversely on the environment.
Therefore, EMA should consider the relationship between productivity and environmental
performance.
The survival of an organization may depend on its image since this can affect the relationship
with stakeholders (IFAC 2005). For example, access to ‘green markets’ can be affected by the
image that consumers who care about the environment have of the organization. Also,
insurers may be reluctant to provide insurance to an organization which may be susceptible to
relatively high environmental risk.
Externalities usually arise due to the negative environmental impacts on society caused by
waste and emissions (IFAC 2005). However, they can also be a result of upstream activities
such as resource extraction and downstream activities such as product use and disposal.
Externalities can be estimated using techniques such as (IFAC 2005):
• avoidance cost approach whereby the cost to install and operate pollution control
technologies which can prevent actual environmental damage is used as a proxy to
monetize the damage;
• damage cost approach in which the costs of environmental damage are estimated
using scientific and economic valuation methods;
• restoration cost approach whereby the restoration costs for a damaged site are
estimated; and
• direct monetization of emissions using a cost per unit of emissions basis. An
estimated trading price, by using for example prices from more regulated countries, or

47
the fees charged by a treatment facility using the most advanced technology, can be
used.
The cost categories identified by the IFAC (2005) as mentioned above can be contrasted with
the approach identified by the US EPA (1995), and adopted by Deegan (2003), whereby
environmental costs were categorized ranging from the easiest to measure to the most difficult
to measure as detailed in Table 2.1:
Table 2.1: Range of environmental costs
Tier Description
Tier 1 Conventional costs include the costs of raw materials, utilities, supplies, labour, and capital equipment and associated depreciation
Tier 2 Hidden costs include:
• up front costs which are incurred before operation of the process, facility or system commences such as site studies and preparation costs;
• regulatory costs (for example, testing and monitoring costs) and voluntary costs (such as recycling costs) incurred during operation of the process, facility or system
• back-end costs which are prospective costs that may be incurred as a result of current operations. An example is closure and decommissioning costs.
Tier 3 Contingent costs are also known as contingent liability costs. These are probable future costs. Examples are remediation and compensation costs for future accidental environmental damage and fines for future regulatory breaches.
Tier 4 Image and relationship costs, referred to as less tangible or intangible costs, are measurable even though they are incurred to affect stakeholders’ perceptions which can be subjective. For example, costs incurred voluntarily in regard to environmental activities such as tree planting to improve the company’s image. While the costs may not be intangible, the benefits may be.
Tier 5 Societal costs, also known as ‘externalities’ or ‘external costs’, are costs (impacts) imposed on the environment and / or society due to the organization’s operations but for which the organization is not legally accountable. The boundary between private and societal costs can vary due to different regulatory environments. Measuring such costs can be difficult and controversial which is why most organizations tend to ignore them.
2.5.2.2 Monetary Environmental Performance Indicators
Management may prefer monetary rather than physical environmental performance indicators
(IFAC 2005). This is because management may not appreciate or react to physical accounting
data compared to cost data. The inclusion of cost data ‘can help translate environmental
performance into the “cost and savings” language’ which management understands (IFAC
2005, p. 41). Data from the physical and monetary EMA can be linked by using eco-
efficiency indicators. An eco-efficiency indicator is defined by the World Business Council

48
for Sustainable Development (WBCSD) as an indicator which links product or service value
in terms of profit or turnover; to the environmental impact in terms of water, energy and
materials consumption, and waste and emissions as measured in volumes (IFAC 2005;
UNDSD 2001). When analyzing these indicators, consideration should be given to non-
environment related factors which may affect the monetary part of the indicators. For example,
changes in the global market prices for materials may affect eco-efficiency indicators even
though there is no relation to environmental issues (IFAC 2005).
2.5.2.3 Environment-related earnings, savings and less tangible benefits
Environment-related earnings can come from the sale of waste or scrap for reuse by another
organization, insurance reimbursements for environment-related claims, and the sale of excess
capacity in waste treatment facilities (IFAC 2005). Environment-related savings, on the other
hand, are derived only when an existing system is changed in a particular way. An example is
by improving efficiency which reduces materials use and waste generation. The resulting
monetary saving is obviously the difference between the previous higher costs and the
reduced costs. These savings are usually obtained through the implementation of
environmental management activities such as on-site recycling and EMA (IFAC 2005). There
are also less tangible benefits which may be real, current internal benefits which are difficult
to estimate. For example, a general increase in sales revenue attributable to the positive
environmental image which consumers have of an organization (IFAC 2005).
2.5.3 Distribution of Costs by Environmental Domain
The IFAC (2005) identified several environmental domains to which the environment-related
costs (as discussed in Section 2.5.2.1) can be assigned. These environmental domains, which
are different from the domains identified by Bennett et al. (1998), include air and climate,
waste, waste water, biodiversity and landscape, radiation, and noise and vibration. These
domains may be useful for meeting external reporting requirements. In addition, they can be
used to compare and analyze environmental costs from year to year for internal management
purposes such as for benchmarking and trend analysis. Organizations may choose not to use
environmental domains or to focus only on certain domains. Transport companies, for
example, may decide to place emphasis on the ‘air and climate’ domain.

49
The IFAC (2005) clarified that an organization’s environmental performance need not
necessarily be reflected by the total amount of its environment-related costs. Likewise, the
organization’s environmental performance within a particular domain need not necessarily be
reflected by the amount of environment-related costs attributed to that domain.
2.5.4 Application of EMA
2.5.4.1 Application at various organizational levels
EMA can be applied at various organizational levels such as (IFAC 2005):
• by material;
• by process or equipment line;
• by product or product line;
• by site or facility;
• by division; or
• at the entire organization level.
In applying EMA, probably the best starting point from an accountant’s perspective is the
chart or list of accounts since this is a typical source of cost information for organizations
(IFAC 2005). An assessment of the environment-related costs at the site or entire organization
level can be done from this chart of accounts. This assessment alone may highlight problems
such as missing information and inconsistencies in the posting to accounts which may then
lead to improvements in the accounting information system. From an environmental
manager’s perspective, the most likely starting point in applying EMA is an analysis of waste
streams. Production managers, meanwhile, may be more interested in applying EMA to obtain
statistics on poor quality products and scrap, calculations of production costs, cost centre
reports, waste reports, and materials, water and energy balances (IFAC 2005).
2.5.4.2 Examples of application – energy and waste
Although the IFAC (2005) had provided guidance on what physical and monetary information
are, it would also be helpful to have some guidance on how to account for that information.
Therefore, a literature review using energy and waste as an example is done because the
management and control of waste, and energy usage are two main areas where improving
environmental performance can often improve the financial or economic performance also
50
(Emblemsvag et al. 2001; Gray et al. 2001). Besides, every activity has inputs, which are
materials (natural resources) and energy, and outputs which are either useful (being products,
co products and recyclables) or waste. Furthermore, there are valid measures of
environmental impact such as ozone depletion or global warming potential.
Energy consumption needs to be managed well because energy, which reflects energy
conversion efficiencies, is one of the factors which drives socioeconomic development
(Olsson 1994) and there is a strong correlation between energy consumption and greenhouse
gases emissions (Fowler 1990). CO2 emissions are regarded as a proxy for energy
consumption (Burritt et al. 2006). Waste reflects material conversion efficiencies and there
are two aspects to waste management being: to reduce the amount of waste produced; and / or
to reduce pollution which can be detrimental to the environment. From a materials perspective,
the focus is on waste generation rather than materials consumption because not all materials
consumed may have an impact on the environment whereas waste by definition is unwanted
and is discarded into the environment where it may cause damage.
Energy can include distribution and transmission costs. In addition, it is important to
recognize that every material, process, action and element of waste may contain energy, and
that heat (and other forms of energy) may be carried away via water and other discharges such
as emissions. A good management practice is to seek the minimum energy cost options which
is to minimize waste of all kinds and reduce the unit costs. Energy may be obtained from
renewable (such as wind, solar and hydro) and non-renewable (examples include coal oil, gas,
geothermal and nuclear) sources. The extraction and even the creation of energy itself use
energy. The processing and use of energy produce waste heat, by products and emissions of
GHG.
To minimize energy costs and energy usage, organizations can adopt energy management
plans such as insulating boilers, installing and upgrading heat recovery and heat exchange
equipment, check for leaks in heating pipes, and turning off lighting when not in use. Other
possibilities include seeking alternative energy or energy efficiency options. Having a well-
managed energy policy, which may include the use of energy performance indicators such as
the energy used per tonne of output, can lead to savings in energy costs and materials (Winter
1988). And, the higher the energy content of the activity, the higher the savings. Where
energy costs comprise a major portion of the overall costs, addressing fundamental issues
such as alterations in design and production scheduling may lead to enhanced financial
51
performance. Furthermore, the savings in energy, especially in manufacturing companies,
may lead to further savings elsewhere through, for example, reductions in waste and
emissions (Gray et al., 2001).
Having an energy management policy within the organization may also assist in the
assessment of energy-saving investments since the payback period may actually decrease if it
is forecast that energy costs will rise in the future.
One way in which accountants can contribute to improving the environmental performance of
organizations is by accounting for energy. In general, the steps in accounting for energy costs
are as follow (Gray et al., 2001):
• establish separate accounts codes within the chart of accounts for each source of fuel
(energy);
• invoices relating to the different types of fuel (energy) such as mains gas, are then
posted to the relevant accounts;
• adopt appropriate cost allocation basis, such as ABC or the organization’s existing
cost allocation basis, to allocate traceable and non-traceable costs to the cause for
incurring these costs;
• trend analysis of energy costs;
• separate identification of the different energy costs in management accounting and
other reports such as budgets, cost and performance reports;
• the abovementioned reports should be able to identify users of the different fuels or
energy within the organization for management purposes;
• consideration of intra-organizational transfers of heat, such as recycled heat, and
accounting for it;
• a cost-benefit analysis, that is, whether the additional effort in accounting (compared
to existing accounting practices within the organization) is beneficial from a financial
and / or environmental perspective. Is there a potential to change behaviour? and
• means should be established to ensure that energy is taken into consideration when
doing capital budgets or investment appraisals.
Gray et al. (2001) stated that accounting for energy should be in both costs and energy units
which can be measured in joule, kWh, calorie et cetera since energy comes in different forms
such as chemical energy, electric energy and kinetic energy (Emblemsvag et al. 2001).
Minimizing energy cost (cost reduction) is not necessarily the same as minimizing energy
usage (efficiency). Energy costs may decrease due to changes in the nature of the business,

52
changes in the organizational processes, changing to other fuels or energy, or as a result of a
decrease in the unit costs of energy. Therefore, a decrease in energy costs does not necessarily
mean that energy efficiency has improved but may be due to a decrease in the unit cost of
energy. Besides, as with any useful costing system, units should also be recorded so that
volume variances and energy targets can be assessed. Furthermore, by allocating energy costs
to activities, organizations can identify where their energy costs are going via identification of
their waste heat. As part of energy management, organizations may also wish to undertake an
energy audit to identify where and how, and how much, energy is being used in the
organization.
Waste (whether wastefulness or pollution) can arise throughout the entire production and
distribution process, and also in the use of the products (Gray et al., 2001). The environmental
aim is to minimize the use of resources, and waste, throughout that process. This, in turn, can
have economic or financial benefits. Examples include the Dow Chemicals WRAP (Waste
Reduction Always Pays) and 3M’s 3Ps (Pollution Prevention Pays) projects (Gray et al.,
2001), both of which were linked to a TQM culture and directly to their financial systems.
The benefits of minimizing waste include the following (Gray et al. 2001):
• reduce
o raw material costs;
o energy and water costs;
o production costs;
o waste monitoring, treatment, handling and disposal costs;
o environmental liability and insurance costs;
o the risks of accidents including spills;
• and improve
o operating efficiency; and
o revenue via the sale of reusable or recyclable waste.
Waste management in general, which is known as the hierarchy of waste management,
involves the following (Gray et al., 2001):
• reduction in the production of waste by using cleaner technology, better management
techniques, and product and process redesign;
• reuse materials where possible;
• recovery whereby economically viable elements are extracted from the waste
produced for further use via recycling, energy production and composting; and

53
• disposal of waste (last resort) in an environmentally-friendly way.
Waste to one organization may not be waste to another. An example given in Gray et al.
(2001) is the Pilkington case. When Pilkington tried to dispose of its waste spoil heaps for
economic and legal reasons, it faced opposition from environmentalists because the spoil
heaps had over time developed a local ecology which now supported wild orchids. What was
originally deemed as ‘waste’ was now part of the ‘biosphere’.
In managing waste, factors relating to quality in the process of waste production ought to be
considered such as the following (Gray et al. 2001):
• quality of inputs
o appropriate specifications of materials and other inputs;
o the technical quality;
o delivery;
o inventory management such as Just-In-Time (JIT);
o quality decay;
• quality of processing
o process (including conversion) efficiency;
o hazards from use;
o heat, emissions and any other discharges from the process;
o quality failures from the process;
o by-products or waste generated;
• quality of output
o the overall quality of the product (including reliability in use);
o repairability;
o disposability; and
o distribution to the users.
The steps in accounting for waste, in general, are as follow (Gray et al., 2001):
• identify waste management (including disposal) costs under separate cost headings;
• consider other waste-related matters such as spillages, insurance and contingencies;
• develop a non-financial accounting system that can track wastes (and establish a waste
inventory of the types and quantities of waste);
• relate the associated costs to the waste identification and tracking systems;
54
• charge back the cost to the process creating the waste based on advice from
appropriate technical staff;
• consider ABC;
• build waste-related costs into the budget;
• consider the implications of wastes to the organization’s strategies and investment
appraisals;
• consider (an internal) taxation of waste;
• build in waste management into the performance appraisal system; and
• forecasts should take into consideration changes to the business world and the
regulatory regime relating to waste management.
In accounting for waste, both quantity and financial units need to be accounted for (Gray et al.
2001). Waste can be measured in mass units such as kg. However, a kilogram of plutonium
waste is obviously not the same as a kilogram of steel waste. Therefore, it is preferable to use
a measure which reflects the environmental impact of waste (Emblemsvag et al. 2001). Costs
relating to waste need to be minimized as well as the waste quantity and the effects of that
waste. Ultimately, total resource use, and not just that which has been identified as waste,
needs to be minimized (Gray et al. 2001).
A specific issue relating to waste is recycling and reuse (Gray et al., 2001). Costs (and
revenues) relating to recycling and reuse need to be captured in the accounting system. To
account for such costs, some understanding of recycling and reuse is required. Recycling is
not a self-contained activity; it may require raw material input and or further energy although
the recycling of certain materials such as aluminium can actually generate energy savings.
Recycling can be at three different levels as follow (Gray et al. 2001):
• recycling and or reuse to the quality as the initial material;
• recycling and reuse of material to a lower grade than the initial material; and
• recycling the material into a fuel form.
Government regulations also can have an impact on the recycling and reuse of materials.
Examples include recycling levies, recycling credits and landfill tax (Gray et al., 2001).

55
2.6 Investment appraisal and capital budgeting
An awareness of investment appraisal and capital budgeting would assist in understanding the
cost benefit of capital expenditure and its impact on the environment. Only by identifying and
measuring all environmental costs and benefits can a decision to choose between alternative
product improvements, process improvements and capital improvements be made properly
(Epstein 1996). Deciding whether to invest in environment-related capital projects requires a
projection of future revenues and costs; and possible changes to environmental regulations,
and technology including the cost of technology. Such projections should provide some
information for decision-making even though they are difficult to make and will not be
accurate. There will be substantial uncertainties and risks and long time horizons involved due
to competition, changing market forces, changing international politics, changing regulations,
et cetera. Epstein (1996) argued that capital appraisals which are inadequate only considered
current costs, and excluded current benefits and future costs and benefits.
There are various methods which organizations can use to aid in environmental capital
investment decision-making such as the discounted cash flow technique (DCF), the payback
method, Monte Carlo analysis, scenario forecasting, decision trees, option screening and
option assessments (Epstein, 1996). Gray et al. (2001) contended that since there is no single
investment evaluation method to work out returns on capital investment, therefore, there can
be no single method of incorporating environmental considerations into investment decisions.
Nikolai, Bazley and Brummet (1976) identified four ways of evaluating environmental capital
investments. Two of the methods, however, are variations to the DCF technique. They are the
net present value (NPV) method and the internal rate of return (IRR) method. The DCF
technique considers the time value of money and is generally considered to be the best
technique for assessing capital investments (Nikolai et al. 1976). With the DCF technique, the
discount rate used is usually the organization’s cost of capital (Epstein 1996). With the NPV
method, the required rate of return is used to discount to the present all cash flows over the
economic life of the project. The amounts and timing of the initial and subsequent
investments and of the operating cash flows, the economic life, the salvage value at the end of
the project, and the required rate of return all need to be estimated. Generally, the project will
be approved if the NPV is positive and rejected if it is negative. The internal rate of return is
the same as the NPV method with the only difference being that an internal rate of return is
calculated. This is the rate that would make the NPV equal to zero. A project will be accepted

56
if the internal rate of return exceeds the required rate of return, and vice versa. These methods
can be applied to environmental capital investment decision-making with some modification,
where applicable, as follow (Nikolai et al. 1976):
• accelerated depreciation for pollution control facilities and the associated tax-effect;
• interest opportunity savings due to using a specific type of financing, ’pollution
control’ bonds. In general, the financing of capital investment is not considered in
deciding whether to accept or reject a capital investment. Therefore, annual cash
outflows due to interest charges are ignored in the DCF technique. However, the lower
interest applicable with ’pollution control’ bonds might be treated as cash inflows in
the DCF technique. The alternative is to continue excluding interest charges from the
DCF technique but take the lower interest charges into consideration by lowering the
required rate of return; and
• where not all the environmental benefits are measured, a lower required rate of return
for environmental investments compared to that required for economic investments
may be acceptable. This is to implicitly include the benefits that are not measured in
monetary terms. However, where all the environmental benefits are measured in
monetary terms, a lower required rate of return is not acceptable because this would
mean double-counting the benefits.
A third method of evaluating capital investments is the accounting rate of return (Nikolai et
al., 1976). This involves dividing the estimated increase in future annual income by the
estimated increase in capital investment required to calculate the accounting rate of return.
This method can be modified by using the average income and investment, calculating on a
before and after tax basis, and allocating the working capital to the investment base. In
addition, any differences between the tax depreciation and the accounting depreciation should
be adjusted for.
The fourth method, which was also identified by others such as Epstein (1996) and Gray et al.
(2001), is the payback method which is the time required to recoup the initial investment. This
is done by dividing the initial cash outflows by the expected annual cash inflow increments
from the project. Although this method does not measure profitability, it does give an
indication of the liquidity of the project (Nikolai et al., 1976). Epstein (1996) was of the view
that using the payback method instead of discounted cash flow is inadequate because it
ignores the time value of money. In addition, a study has found that it is often based on very
short payback periods (Bartolomeo, Bennett, Bouma, Heydkamp, James and Wolters 2000).

57
However, the study also indicated that the payback method was the most popular assessment
technique for European companies whereas US companies favoured the return on investment
technique. Inappropriate investment decision-making includes (Epstein 1996):
• investing in projects which have a short payback period and which maximizes short-
term profitability without considering longer-term impacts which may significantly
increase long-term costs and ultimately lead to a negative net present value; or
• investing in projects which minimize current capital costs and ignoring the
possibility of regulations changing which may require rapid capital modification or
replacement.
The abovementioned investment appraisal techniques such as DCF and payback, as well as
other more recent techniques such as earnings per share (EPS) or contribution to profit
techniques have been criticized for having a tendency to narrow the range of issues
considered and encourage lower risk short term options (Gray et al. 2001). This is true even
for DCF which should encourage a longer term perspective but somehow tends to discourage
large projects with an expected life of more than ten years (Elkington et al 1992). Elkington et
al. (1992) were of the view that the DCF technique is inadequate for assessing capital
investment, especially plant equipment, since even ten years may not be long enough to
expect an acceptable return on the capital investment. This inevitably leads to less emphasis
being placed on events later in a project’s life which is not good from an environmental
perspective. However, Burrows, Anderton and Chung (2006) argued that operators of ageing
coal fired power stations actually have a unique opportunity to increase plant efficiency by
relatively simple upgrades of equipment through to a complete cycle change. Improving
efficiency can then increase revenue as well as substantially reduce GHG emissions, thereby
improving both financial and environmental performances.
In deciding which option to choose, they argued that careful estimation of future wholesale
electricity prices is important since that can have a significant impact on the DCF analysis.
Gray et al. (2001) were critical of conventional DCF calculations which take little
consideration of the effect from a plant’s reduced efficiency towards the end of its life (and
the associated potential increases in emissions and waste) and which discounts abandonment
and decommissioning costs, and any other environmental-related problems such as land
contamination. Therefore, investment appraisals in general need to have a longer-term and
more environmentally sensitive perspective. However, there is a conflict here because
management needs to seek the shortest possible returns in order to maintain flexibility in a
58
business climate which is changing rapidly due to environmental pressures (from regulations,
technology, attitudes etc); and to avoid the risk of being burdened with obsolete technology
and processes which are not environmentally-friendly (Gray et al. 2001).
One problem in applying these methods to the appraisal of environment-related investments is
that these methods only involve monetary measurements. Besides, one should be aware of the
difficulties with making estimations such as the estimation of environmental costs. The
presence of non-monetary benefits, especially since they may not be additive to the monetary
benefits and even among themselves, makes an overall evaluation difficult (Nikolai et al.
1976). One way to address this problem, as suggested by Nikolai et al. (1976), is to consider
the trade-offs between the various benefits. For example, a company has to decide between
the following two discretionary investments:
• reduce air effluents by 10 tons per day at a total cost of $10,000; or
• reduce water effluents by five tons per day at a total cost of $6,000
Taking the former option implies that spending $1,000 per ton per day to reduce air pollution
is preferable to spending $1,200 per ton per day to reduce water pollution.
The appraisal of environmental-related investments involves two types of uncertainty as
follow (Nikolai et al. 1976):
• uncertainty at the physical level due to the newness of the technology (of pollution
control); and
• uncertainty in quantifying the physical activities for the purpose of comparison.
The difficulty in measuring the various factors (such as cost of capital, costs and benefits)
included in the evaluation of environmental activity suggests that ranking the factors may
assist in the decision making process (Nikolai et al. 1976). They then suggested that the
criteria for ranking these factors are as follow:
• the degree of uncertainty in estimating the factor (for example, is it high, medium or
low?);
• the extent of the complementary interaction of the factor with the other factors; and
• the relative magnitude of the value of this factor in comparison with the other factors
Elkington et al. (1992) categorized environmental costs for decision making at the initial stage
into three levels as follow:

59
• little initial cost with a quick return on investment. For example, some energy-
efficiency schemes and paper conservation / recycling schemes;
• high initial cost and long term payback. Examples are capital expenditure on plant in
general, and improvements to logistical efficiencies such as distribution systems; and
• straight costs. These include better chemical and effluent management, the cost of
managing environmental change and improved waste disposal methods.
The presence of non-quantifiable factors means that the value judgments of decision makers
become more important in the decision making process (Nikolai et al. 1976). Only when
acceptable, reliable and comparable measures of all the benefits have been developed that the
importance of value judgments in the evaluation of environment-related investments can be
minimized.
A way of assessing which projects are the most cost effective and most beneficial to a
company is the 80/20 analysis as developed by DuPont (Epstein 1996; Martin 1994). The
80/20 analysis states that 80 percent of the environmental benefits come from 20 percent of
the costs. This analysis is part of Du Pont’s Corporate Environment Plan (CEP), which is a
company-wide information-collection and resource-allocation process. Projects are ranked on
the net of current implementation costs (being the costs) less the lifetime reductions in
emissions (being the benefits) for all projects, measured in pounds. Only projects which
scored the highest are approved. This was in line with DuPont’s environmental strategy that
pollution prevention is more cost effective compared to remediation.
Another investment appraisal technique is option screening and option assessments (Epstein,
1996). An option assessment (or option screening) method which has been designed to
generate and assess environmental options with respect to substance (for example products)
life cycle management is the three-phased Environmental Option Assessment (EOA) method
(Winsemius and Hahn 1992). The first phase is to generate options targeted at the most
significant environmental problems. This phase involves four steps as follow:
• drawing the volume flow diagram of a substance as it passes through its life cycle
including the raw materials inflow and outflows associated with wastes. Accuracy of
the aggregated volume flows within a +/- 20 percent range is considered sufficient for
initial decision-making involving judgment;
• identification of the major environmental issues in the substance (product) life cycle;

60
• definition of the options such as product redesign, raw materials substitution,
production process improvements (for example, switching to processes which
produce less emissions), improvement of maintenance practices, making minor
modifications to existing equipment and installation of recycling systems; and
• selection of the most promising options for further evaluation based on the three
criteria of cost effectiveness, environmental impact and relevance to decision making.
Options which are beyond the influence of the organization (for example, because of
a government regulation) should be excluded.
The second phase prioritizes the options according to their environmental and economic
effects. These effects are quantified wherever possible. For example, the environmental effect
such as the reduction in emissions can be measured in ‘tons of CO2-equivalent’. The
economic effects can be quantified in monetary terms and usually include net changes in
operating and capital costs. The options (such as whether to ‘do nothing’, recycle or the use of
substitutes) are then weighted based on the relative importance attached to, and the costs and
benefits of each option and positioned accordingly on an option map. The final phase involves
the development of action plans to establish targets, the resources to be committed and
responsibility for implementation.
One company which used option screening to compare numerous potential environmental
scenarios and report on environmental externalities was the Niagara Mohawk Power
Company (NMPC), whereby the option which had the highest benefit to cost ratio was
deemed the best option (Epstein 1996) (refer to Appendix 11.10).
Scenario forecasting techniques is another way of assessing the likely environmental impacts
due to changing technologies and cost of technologies, and changing regulations (Epstein
1996). These techniques may be useful in situations where change is inevitable and there is a
diversity of opinions.
In addition, the Monte Carlo simulation and decision trees can be used to aid in environmental
capital investment decision-making (Epstein 1996). The decision tree is a visual diagram of a
decision problem, all the alternative courses of action (events) and possible outcomes, and the
probability values attached to each decision. The Monte Carlo simulation will then determine
the probability distribution associated with the environmental risk. The possible costs of
alternative environmental (for example, environmental remediation) measures are then

61
calculated and the least costly option chosen. A sensitivity analysis also can be done to assess
the quantum of change in probability values that is required for a different alternative to be
selected (Epstein 1996).
2.7 Information for managing resources and creating value: Other EA-related and
EMA-related techniques
A brief review of the various EA-related and EMA-related techniques, as listed in Appendix
11 but not necessarily in any order, is done to gain further awareness of how EMA could be
modified and applied to the case study.
2.8 Previous research on EMA
A review of the literature was conducted to determine whether any research, especially using
case study, had been done in regard to the application of EMA to an Australian cogeneration
company.
2.8.1 Types of industry
There have been numerous EMA-related studies conducted on various organizations in
different industries (Burritt 2004; Burritt et al. 2006). These include:
• Dow Chemical, a chemical company, and Amoco in the oil and petrochemicals
industry, USA (Ditz et al. 1995);
• Xerox, a photocopier manufacturer, UK (Bennett et al. 1998);
• chemical and oil companies, USA (Shields et al. 1997);
• FCA at Ontario Hydro which is a Canadian government-owned utility in the electricity
industry (US EPA 1996);
• an American carpet manufacturer (Emblemsvag et al. 2001);
• an Australian water authority (Moore, 2002);
• Niagara Mohawk Power, an electric and gas utility, and DuPont in the chemical
industry, USA (Epstein 1996);
• SCA in the pulp and paper production industry, and the Verbund group in the
electricity industry, Austria (IFAC 2005); and
• A financial services organization, a plastic injection moulding company and a school,
Australia (Deegan 2003).

62
In addition, Gago (2002) conducted a case study on whether ecological implications
motivated eleven Spanish companies to generate their own energy using a co generation
system instead of purchasing the energy.
2.8.2 Findings and lessons learnt
The experience gained from case studies provided a broad overview of how EMA can be
implemented in an organization, which is as follows (Deegan 2003):
1. obtain senior management support (Ditz et al. 1995);
2. define the proposed system’s boundaries. This includes the scope of the costs to be
considered such as whether to exclude societal costs, and whether to consider the
entire organization or a division or a product (Ditz et al. 1995);
3. determine the organization’s significant environmental impacts and whether they can
be monetized;
4. determine how environmental impacts are currently being accounted for, if applicable.
The information may be qualitative and or quantitative;
5. define environmental costs to minimize any potential ambiguity;
6. determine the mix of expertise required (Ditz et al. 1995). These should include
individuals with accounting expertise, environmental expertise, technical expertise,
information technology expertise, and at least one individual from senior management;
7. review existing accounting systems. This includes determining what environmental
costs are currently being accounted for and the bases of cost allocation;
8. identify possible environment-related revenue or cost cutting opportunities;
9. suggest (practical) changes to existing accounting systems. This requires
documentation of the changes and the associated implications, and input from users;
and
10. test the system before implementing it.
Broadly speaking, the findings by Deegan (2003) confirmed the challenges discussed in
Section 2.4. In addition, EMA should initially be integrated into the existing management
accounting systems wherever possible. The changes required to existing accounting systems
tend to be relatively minor and cost less (compared to a drastic revamp of the accounting
systems) but the improvements obtained can be significant. This may include adding a data
field to provide non-financial information so as to monitor resource consumption or material
63
tracking (Deegan 2003). The US EPA (2000) suggested that such information sources can
include:
• utility bills for energy and water usage and costs;
• production records showing the rate of materials usage;
• maintenance logs of the length and frequency of production shutdowns; and
• facility blueprints.
Ditz et al. (1995) recommended incorporating EA into existing business processes rather than
have a stand-alone EA system because essential information and expertise for EA can be
acquired or tapped at little extra cost. More importantly, integrating EA into existing business
processes helps infuse environmental considerations into decision-making. Another lesson
learnt from the case studies is that it is unrealistic for any company to expect to identify all its
environmental costs within a short period of time (Ditz el al. 1995). Sifting and analyzing
accounting data and linking the data to environmental issues take time. So does gaining an
understanding of information flows through the organization and how this may affect
behaviour, as well as whether and how change should be implemented.
A study by Bartolomeo et al. (2000) revealed that European companies tend to use operational
management systems (such as operational data from manufacturing process records) as their
main source of data compared to US companies which relied on their accounting systems.
Furthermore, very few companies considered externalities. Rather, the focus was on Tier 1
and 2 costs as classified by the US EPA (1995) (Deegan 2003). Data reliability was another
challenge and this was because the measurement of many environmental parameters was
either impossible or costly (Bartolomeo et al. 2000). Examples include measurement of the
carbon dioxide emissions of fuels even with the use of a conversion formula; and
measurement of inputs and outputs to estimate losses.
2.9 The regulatory environment
Gray et al. (2001) argued that although voluntary initiatives by organizations to improve the
environmental performance have shown significant results, it is still not sufficient to reduce
the threats to the environment such as global warming. As a consequence, the regulatory
regime under which these organizations operate is continuously changing.

64
Generally, the utilities industry in Australia, which includes gas, water and electricity, is
controlled by government bodies (Frost et al. 2000). This is particularly true for the case study
company which operates in Victoria, Australia. This means that there is limited scope for the
company to affect the quality of its inputs, which are gas and water, to improve efficiency and
reduce costs. Although electricity is both an input and output for the case study company,
electricity input is generally generated by the cogeneration plant for its own consumption
during peak hours. Output electricity which is generated for sale to customers via the grid is
regulated, too, which means that the quality of that electricity has to be maintained before it
can be exported on to the grid.
Although the utilities industry in Australia is regulated, there is a general absence of
legislation which requires companies to report on their environmental performance (Deegan
and Rankin 1996). An improvement in this regard is the introduction of Section 299(1)(f) of
the Corporations Law which requires entities including companies to disclose within their
annual directors’ report details of the entities’ environmental performance in regard to
environmental regulation where the entities’ operations are subject to any particular and
significant federal, state or territory regulations (Deegan 2000). Practice Note 68, as issued by
the Australian Securities and Investments Commission (ASIC), provided certain general
guidelines in regard to the environmental reporting requirements, as follows (Deegan 2000):
• the environmental reporting requirements apply where an entity is licensed under
environmental legislation or regulation;
• accounting concepts of materiality in financial statements are not applicable because
the requirements are not related specifically to financial disclosures such as capital
commitments and contingent liabilities but relate to environmental performance in
regard to environmental regulation; and
• the information provided in the directors’ report would be less technical and more
general compared to that in a compliance report to environmental regulators.
Section 299(1) (f) still applies under the Corporations Act 2001 which replaced the
Corporations Law.
2.9.1 Environment Protection Agency (EPA) Victoria
The Environment Protection Act 1970 (Act) was established by the Victorian state
government to protect the environment (EPA 2006). Section 1A of the Act explicitly states

65
the purpose of this Act which is to create a legislative framework to protect the environment
in Victoria, taking into consideration the principles of environment protection. Sections 5 and
13 of the Act give this authority to protect the environment to the EPA.
A company is required, under Section 20 of the Environment Protection Act, to have an EPA
licence for each operating site that discharges waste to the atmosphere (EPA 2006). There are
penalties under Section 27 for operating a site without a licence or for breaching the licence
conditions. Section 27(2) states the amount of penalty that may be imposed. Under Section
20(9) (a), the EPA may suspend or revoke the licence if the licence holder has not complied
with the conditions set out in the licence or failed to pay the annual licence fee. The EPA can
amend or revoke existing licence conditions under Section 20(9) (b), and attach new
conditions to the licence under Section 20(9) (c) by serving notice in writing. This licence sets
operational and waste discharge limits as well as conditions regarding monitoring
requirements and the reporting of monitoring data and incidents (EPA 2006) (refer Chapter 4
for the conditions attached to a gas-powered cogeneration company’s licence). There is an
annual licence fee payable under Section 24, and the amount is determined under Regulation
9 of the Environment Protection (Fees) Regulations 2001. The fee is stated in ‘fee unit’ which
is defined under Section 4 and the monetary value of a ‘fee unit’ is given under Section 5(3)
the Monetary Units Act 2004. The fee is structured to recover the costs incurred by EPA for
administering the licensing and works approval systems, and is based on the volume and type
of emissions (EPA 2006). The volume of emissions to the atmosphere is generally calculated
using the maximum amounts for each compound or substance specified in the licence. The
use of EPA-approved emission estimation techniques is allowed for the calculation of those
emissions. Higher fees are levied for the emission of more environmentally harmful
substances (EPA 2006). Under Regulation 14 of the Environment Protection (Fees)
Regulations 2001, a 25 percent discount off the annual licence fee is given to a licensee who
achieves ‘accredited licensee’ status under Sections 26 B and 26D. A licensee can attain this
status if it has an environment management system accredited by an independent third party
(for example, ISO 14001), an environment audit program which involves an EPA-appointed
auditor, and an environment improvement plan; as stipulated under Section 26B. The
definition of an EMS under Section 4 is similar to the definition given by the British
Standards Institution (refer Section 2.7.8) although Section 4 adds that an EMS includes
systems which designate responsibility for, and allocate resources to, environmental
management.

66
As an EPA licence holder, a company is also required to comply with the EPA Greenhouse
Program’s statutory requirements which were enacted through the State Environment
Protection Policy (Air Quality Management) (SEPP AQM) and the Protocol for
Environmental Management (Greenhouse Gas Emissions and Energy Efficiency in Industry)
(PEM) by virtue of Section 16 (EPA 2006). SEPP AQM was gazetted as S 240 21 December
2001 and Clause 15 of this gazette incorporated the PEM. The Energy and Greenhouse
Management Toolkit (toolkit) was prepared to assist in complying with these requirements
(EPA 2002). The EPA introduced such measures because it believes that improving energy
efficiency can lead to substantial cost savings. In addition, it believes that the use of cleaner
production techniques can decrease environmental risks and waste disposal costs, as well as
improve production efficiency. The toolkit sets out the key steps required to comply with this
policy, as follows (EPA 2002):
• estimate energy consumption and GHG emissions;
• conduct an energy audit;
• assess options for minimizing energy use and emissions;
• prioritize and select measures for compliance;
• prepare an action plan;
• execute the action plan;
• report to EPA on an annual basis; and
• review and improve performance.
In estimating the energy use and the corresponding GHG emissions for each type or source of
energy, a boundary needs to be drawn (EPA 2002). The boundary may include downstream
and upstream impacts in the supply chain or product lifecycle. Energy use must be estimated
in gigajoules (GJ) and GHG emissions in carbon-dioxide equivalent (Co2-e). Using carbon
dioxide equivalent, which refers to the amount of carbon dioxide that has an equivalent global
warming potential, as a measuring unit allows a comparison of the global warming potential
of different amounts of different GHG. Emissions of GHG can be estimated using the
emission methodologies and conversion factors in the Australian Greenhouse Office (AGO)
Factors and Methods Workbook (AGO 2005), rather than be measured physically. The
estimation of energy use and GHG emissions may require actual data pertaining to electricity
and natural gas consumption, the operation of waste water treatment facilities as well as
electricity generation. The data can be obtained from fuel usage records and power bills, et
cetera.

67
Licence holders must conduct an energy audit if they are classified under Category B or C, as
set out in Table 2.2 as follows (EPA 2002, Module 2 p. 9). The case study company is
classified under Category C.
Table 2.2: EPA classification based on energy consumption or GHG emissions
Typical annual energy bills in category
Facility Category
Criteria – energy consumption or GHG emissions
Electricity Gas
A <500 GJ/yr <100 t CO2-e/yr <$10,000 <$3,000
B 500-7,000 GJ/yr 100-1,400 t CO2-e/yr >$10,000 >$3,000
C .7,000 GJ/yr >1,400 t CO2-e/yr >$100,000 >$42,000
A company or facility is classified under Category A if either its estimated energy use or
GHG emissions is below the relevant thresholds. When determining the categorization, GHG
emissions that are not related to energy use are excluded. Under PEM Clause 1.4.4, energy
audits need to be conducted in accordance with Australian Standard AS/NZS 3598:2000
which describes three levels of audit. Comparison with (external) standards is important. This
is because standards are defined as a measure of quality, a mark of integrity, and an approved
model or example for imitation (Oakley et al. 2004). A level 1 audit indicates whether energy
consumption is excessive based on an overview of energy use for the last 24 months. In
addition, it provides benchmark data for determining if additional auditing is required. A level
2 audit involves conducting an energy use survey which estimates energy use for different
types and sources of energy to an accuracy of 20 percent. It also identifies and recommends
potential energy savings (and cost savings) measures through improved energy efficiency or
reduced energy usage as well as an implementation plan. A level 3 audit is similar to a level 2
audit but with an increased accuracy of 10 percent. Category A facilities are not required to
undertake an energy audit although a level 1 audit is recommended. A level 1 audit, however,
is compulsory for Category B facilities whereas Category C facilities can opt for a level 2 or 3
audit.
The next step is to investigate the options for minimizing energy consumption and GHG
emissions based on best practice. Best practice means the best combination of eco-efficient
methods, processes, techniques or technology should be adopted. Eco-efficiency means the
use of less energy and other natural resources to produce more goods which then results in
less pollution and waste (EPA 2002). An integrated approach to environmental management,
with a focus on sustainability, is required by the Act when assessing the options. That is, all

68
the economic, environmental and social factors need to be considered as required under
Section 1B. For example, a proposal to reduce energy use may result in increased water
consumption. Therefore, a balanced assessment of the overall impact is required also. When
assessing options, the primary criterion is the investment’s payback period. For energy-related
GHG emissions, the EPA expects that any investment with a payback period of less than three
years has to be implemented. Where alternative investment appraisal methods such as the
Internal Rate of Return (IRR) or the Net Present Value (NPV) methods are used, these need to
be converted to the payback period using the current bank bill rate. The EPA indicates that an
IRR of 31 percent, assuming a project lifespan of ten years, typically corresponds to a three-
year payback period. Where investments have an expected lifetime that exceeds ten years
(that corresponds to a payback period exceeding three years), a detailed cost analysis of the
investments is required using IRR or NPV. The decision to implement the investments will
then be decided on a case-by-case basis based on negotiation between the EPA and the
company.
Options for minimizing energy use and GHG emissions must be prioritized since the focus
should be on maximizing benefits using the implementation of cost-effective approaches and
measures that will not be pose too much of a technical or economic burden. Using the
principle of diminishing returns, which states that the effort required to develop and
implement measures may not justify the benefits to be gained, options which result in very
small reduction of energy consumption or GHG emissions may not be viable. However, the
decision not to select those options should be justified and documented. The EPA realizes that
there may be energy use and GHG emissions minimization policies and measures that have
already been adopted by licence holders under other programs such as the AGO Greenhouse
Challenge. Therefore, to minimize duplication of such effort, as well as the associated
assessment and reporting requirements, the EPA recommends integrating the requirements of
the EPA’s Greenhouse Program with existing systems, procedures and standards such as
environment improvement plans or ISO 9001 or ISO 14001 wherever possible. Another
example is to integrate the reporting requirements of the Greenhouse Program with the
reporting of annual energy usage under the National Pollutant Inventory (NPI).
An action plan to manage energy and GHG emissions then had to be approved by the EPA by
December 2003. An action plan was not required for Category A facilities whereas Category
B facilities in general had to:
• assess the causes of excessive energy consumption;
69
• identify options to eliminate or minimize this excessive use;
• assess and prioritize the options in terms of sustainability, feasibility (based on cost-
effectiveness and using the payback period method) and compliance with policy; and
• select appropriate measures and document in the action plan.
Category C facilities had to take the following steps:
• investigate and compare current equipment, operations and processes; with current
industry best practice in energy and GHG emissions management including
benchmarks for key processes;
• identify options to achieve best practice as identified above;
• assess recommendations from the energy audit;
• identify, assess and prioritize options for reducing energy use and related GHG
emissions in terms of sustainability, feasibility (based on cost-effectiveness and using
the payback period method) and compliance with policy; and
• select appropriate measures and document in the action plan.
Where licence holders generate other GHG emissions (which are not energy use-related),
measures are required to reduce those emissions, too. Once the action plan has been approved
by the EPA, companies are required to report annually to the EPA on current estimates of
energy use and GHG emissions. In addition, the report should include measures to reduce
energy consumption and GHG emissions that were taken in the previous year, and those
proposed for the next year including any proposed changes to the action plan. This report can
be integrated into the existing annual report to the EPA on other matters. The action plan has
to be implemented by December 2006. This deadline can be extended through negotiation
with the EPA if the measures involve a planned major upgrade or restructure of the facility or
plant. The implementation should maximize cost-effectiveness, efficiency and convenience.
Once the action plan has been implemented, the management of energy consumption and
GHG emissions still needs to be reviewed on a periodic basis. The review is meant to enhance
business sustainability and to strive for continuous improvement. Business sustainability
involves the following:
• consideration of economic, environmental and social matters (which relate to the
TBL);
70
• lifecycle assessment and product stewardship (which involves determining the stages
of the lifecycle of the product that can be influenced or managed by the facility
operator);
• waste minimization via adoption of the wastes hierarchy and cleaner production; and
• the efficient use of energy and other resources.
Section 1I defines the principle of wastes hierarchy whereby waste should be managed in the
following order starting with: avoidance, re-use, recycling, recovery of energy, treatment,
containment and disposal (refer also to Section 2.5.4.2). Striving for continuous improvement
in this context refers to the identification and exploitation of opportunities for improving
energy use and GHG emissions management.
The EPA recommends the use of an energy management system to manage energy use and
GHG emissions. Energy management can be incorporated into existing systems such as
quality management systems, for example ISO 9000, and EMS including ISO 14001. An
energy management system should encompass:
• energy conservation and efficiency strategies;
• a responsibility matrix for strategy implementation;
• a reporting system for tracking and monitoring energy use, and maintaining records;
and
• reporting requirements.
Under section 19AA, the EPA may provide an economic incentive, via economic measures
such as tradeable emission permit schemes and environmental offsets, to avoid or minimize
environmental damage caused by a particular activity. Such economic measures may be a way
of achieving cost effective environmental protection. However, there are no such schemes
available currently which are applicable to the case study company.
The National Pollutant Inventory (NPI) program was developed by the National Environment
Protection Council (NEPC) as a National Environment Protection Measure (NEPM) (EPA
2006). The NEPC is a statutory body comprising of Commonwealth, territory and state
environment ministers as established under Sections 1 and 8 of the National Environment
Protection Council (Victoria) Act 1995 (NEPC Victoria Act) and Section 8 of the National
Environment Protection Council Act 1994. The NPI program is coordinated Australia-wide
by the Australian Government Department of the Environment and Heritage (DEH).

71
Responsibility for implementing the NPI program in Victoria lies with the EPA. The EPA can
incorporate NEPM under Section 17A of the Act and Sections 7 and 14 of the NEPC Victoria
Act, and has enacted the NEPM (NPI) within the State of Victoria under Sections 16A and
17A as an industrial waste management policy (NPI) by virtue of Clause 4 of the Victorian
government gazette S 107 (EPA 1998). The NPI is a public internet database of emissions,
whether in solid, liquid or gaseous form, from industry facilities (as reported by industry) and
non-industry sources (as estimated by the EPA) of 90 different substances to the environment;
namely, land, air and water. Included in the 90 substances are carbon monoxide and oxides of
nitrogen. The objectives of the NPI program are threefold as set out in Clause 7 of the
National Environment Protection (National Pollutant Inventory) Measure as varied at 20 June
2000 (DEH 2004):
• provide information to the community about pollutants emitted to the environment;
• assist government and industry with environmental planning and management; and
• promote resource efficiency, cleaner production and waste minimization.
DEH (2004) issued a ‘National Pollutant Inventory Guide’ (guide) to assist industries in
determining whether they need to report to the NPI and if so, how. Industry facilities need to
report annually to the NPI where there is an industry handbook applicable to their facilities
such as electricity supply (Clause 8 of Victoria Government Gazette S 107), and they meet
any one of the following conditions (DEH 2004):
• the facility uses 10 or more tonnes of NPI Category 1 substances or 25 or more
tonnes of Category 1(a) substances (Clause 10 of Victoria Government Gazette S
107); or
• the facility consumes 400 or more tonnes of fuel or waste, or burn 1 tonne or more of
fuel or waste within an hour at any time in the year. These are Category 2(a)
substances reporting threshold (Clause 11 of Victoria Government Gazette S 107); or
• the facility burns 2,000 tonnes or more of fuel or waste in a year, or consumes 60,000
megawatts or more of electricity annually, or the facility’s maximum potential power
usage potential is rated at 20 megawatts or more. These are Category 2(b) substances
reporting threshold (Clause 12 of Victoria Government Gazette S 107); or
• emits to water an amount which equals or exceeds the amounts scheduled in
Schedule A of Victoria Government Gazette S 107 annually. This excludes emissions
to groundwater (Clause 13 of Victoria Government Gazette S 107) The substances
listed in Schedule A do not include GHG.

72
Category 1 substances are typically found in production materials whereas Category 1(a) only
comprises total volatile organic compounds (DEH 2004). Both categories do not include GHG
relevant to the case study company. Those GHG are classified under Category 2(a) and 2(b)
which are applicable to the fuel or waste burning thresholds as discussed above which are
relevant to the case study company. For NPI calculation purposes (DEH 2004):
• natural gas burnt is measured in energy (mega joules) and then converted to mass
(tonnes); and
• GHG emissions are measured in tonnes per year.
These estimates are calculated according to the following emission estimation techniques, of
which there are four types, as stated in the guide (DEH 2004):
• mass balance whereby emissions can be calculated as the difference between the input
and output of each (relevant) substance;
• fuel analysis or engineering calculations in which the physical and chemical properties
of the substance such as vapour pressure and the mathematical relationships, for
example the ideal gas law, are used;
• sampling or direct measurement which involves periodic sampling and continuous
monitoring of measured concentrations of the substance in a waste stream, and the
flow rate and volume of that stream; and
• emission factors which are based on the average measured emissions from similar
facilities or processes. These factors tend to be equations that link process or
equipment throughput with the emissions.
Therefore, the emissions of GHG for NPI reporting may not necessarily be actual physical
measurements but just estimates.
2.9.2 Generator efficiency standards
The Generator Efficiency Standards technical guidelines (GES) were issued by the Australian
Greenhouse Office (AGO) (2001) with the objectives of encouraging best practice in
generating power from fossil fuels such as natural gas and reducing GHG emissions (AGO
2000). However, the GES acknowledges the inherent difficulties in determining plant-specific
greenhouse efficiency standards due to technological and commercial factors. The GES
recommends the reporting of greenhouse intensity on an annual basis based on data obtained
on a monthly or quarterly basis. In determining greenhouse intensity, the expected maximum

73
error or uncertainty allowed for a cogeneration plant is three percent. In addition, it is
recommended that plant performance be measured against the GES every quarter or more
frequently.
The relevant GHG that are produced from fossil fuel burning are carbon dioxide, methane and
nitrous oxide (AGO 2001). The greenhouse warming potential (GWP) for these gases is listed
in table 2.3 with nitrous oxide having the highest GWP among the three GHG. Carbon
monoxide (CO) was not listed as a GHG.
Table 2.3: Greenhouse warming potential
GHG GWP
Carbon dioxide 1
Methane 21
Nitrous oxide 310
Therefore, the equivalent CO2 in mass (m) from fuel burning is (AGO 2001):
mCO2equiv. = mCO2 + (21 x mCH4) + (310 x mN20)
One measure of efficiency is the conversion from one form of energy to another such as the
fuel energy used to generate electric energy, measured in a common measurement unit such as
petajoules (PJ) (Jones 1989). Clause 9.1 of the GES, (AGO 2001) shows how cogeneration
efficiency can be measured (refer Appendix 4). Energy losses may comprise unburnt fuel, flue
gas exit temperature, surface radiation losses, start-up fuel (although fuel is being burnt, no
energy is generated at this stage), boiler blowdown losses, cooling water temperature and
generator transformer losses (AGO 2001). Greenhouse intensity for the cogeneration plant
can then be calculated under Clause 9.2 of the GES (AGO 2001) (refer Appendix 4).
The GES also indicates the options available for existing plants to reduce GHG which can be
classified under three categories, as follows (AGO 2001):
• restoration of the plant to design conditions which includes maintenance work;
• change of operational settings such as increased boiler cleaning; and
• retrofit improvements such as installing an economiser or new high efficiency turbine
blades.
The formula for costing the options is also stated in the GES (AGO 2001) (refer Appendix 4).

74
2.9.3 Gas
2.9.3.1 Regulation of gas supply including gas quality
The gas industry in Victoria, Australia is regulated under the Gas Industry Act 2001 and the
Gas Industry (Residual Provisions) Act 1994 as stipulated under Sections 1 and 6 of the Gas
Industry Act 2001. The purpose of the Gas Safety Act 1997, as stipulated under Section 1, is
to provide regulations for the safe supply and use of gas including the Gas Safety (Gas
Quality) Regulations 1999. Regulation 1 states that the objective of the Gas Safety (Gas
Quality) Regulations 1999 is to provide standards for gas quality such as odorant
requirements and composition limits. In addition, Regulation 2 states that this authority comes
from Sections 33 and 118 of the Gas Safety Act 1997. Energy Safe Victoria (ESV) is
responsible for the effective operation of Victoria’s gas safety regime as dictated by Sections
9 and 10 of the Gas Safety Act which includes the natural gas supply chain from injection to
the gas transmission system up to and including the gas meter. ESV is the newly established
safety regulator responsible for gas and electrical safety in Victoria and was established
through the merger of the Office of the Chief Electrical Inspector and the Office of Gas Safety
(ESV 2005). It took over some of the functions of the former Gas and Fuel Corporation.
A state government-owned entity, the Victorian Energy Networks Corporation (VENCorp)
was established in 1997 to play key roles in both gas and electricity (VENCorp 2005). Under
Section 160 of the Gas Industry Act 2001, it is the system operator for the Victorian gas
transmission network, and the manager and developer of the Victorian wholesale gas market.
VENCorp also issues Gas Quality Guidelines under Clause 4.3.1 of the Market and System
Operating Rules (MSOR), which are consistent with the prescribed standards of quality as set
out in Regulation 5 and Schedules 1 and 2 of the Gas Safety (Gas Quality) Regulations 1999;
as well as carry out activities required under the Third Party Access Code for Natural Gas
Pipeline Systems (VENCorp 2005). VENCorp may amend the MSOR under Section 52 of the
Gas Industry Act 2001.
The quality of gas, as defined under Section 3 of the Gas Safety Act 1997, includes
consideration of the molecular composition including non-combustibles such as water and
inerts of natural gas such as carbon dioxide and nitrogen (AGO 2001), as well as purity,
temperature, pressure and odorisation. These quality limits are consistent with Standards
Australia AS4564 2003: ‘Specification for general purpose natural gas’ (Qest Consulting Pty
75
Ltd 2004). Standards Australia is Australia’s representative on the International Organization
for Standardization (ISO) (Standards Australia 2005). In addition, natural gas which does not
have any odour at low concentrations is required under Regulation 6 of the Gas Safety (Gas
Quality) Regulations 1999 to be odorized as a means of leakage detection (AGL 1996). The
addition of this odorant to natural gas increases the sulphur content of the gas slightly which
helps to minimize both corrosion and air pollution, and reduce maintenance requirements.
Furthermore, a memorandum of understanding was signed between VENCorp and the
Essential Services Commission (ESC) on 16 December 2003 to ensure integration and
coordination of their regulatory and other activities in accordance with Sections 15 and 16 of
the Essential Services Commission Act 2001. The ESC functions relate to the economic
regulation of regulated industries such as electricity, gas and water; and to conduct inquiries
into the reliability of supply systems of these regulated industries if requested to do so by the
Victorian State Government as stipulated under Sections 1 and 10 of the Essential Services
Commission Act 2001.
2.9.3.2 Gas regulatory cost
VENCorp funds its statutory gas functions by charging fees to market participants under
Section 69 of the Gas Industry Act 2001 and these fees are regulated by the Australian
Competition and Consumer Commission (ACCC) as conferred by Section 19 of the Gas
Industry Act 2001 and Clause 2.6 of the MSOR. Under Clause 2.6 of the MSOR, these fees
include commodity, distribution and transmission meter data management, security and
registration tariffs (the initial tariffs are set out in Clause 5 of VENCorp’s Access
Arrangements). In addition, VENCorp is required under Section 62 of the Gas Industry Act
2001 to develop retail gas market rules with the approval of the ESC, and may recoup these
costs such as Full Retail Contestability (FRC) retail fees including FRC supply point fee and
service fee under Clause 1.3A of the Gas Market Retail Rules. FRC refers to the ability of
consumers to choose their gas suppliers (VENCorp 2001).
Gas distribution tariffs or charges are regulated by the ESC under Section 32 of the Essential
Services Commission Act 2001. In addition, the Gas Pipelines Access Law, which refers to
Schedule 1 (Third party access to natural gas pipelines) and Schedule 2 (National Third Party
Access Code for Natural Gas Pipeline Systems) to the Gas Pipelines Access (South Australia)
Act 1997, becomes Victorian law by virtue of Sections 3 and 7 of the Gas Pipelines Access

76
(Victoria) Act 1998. Section 21 of the Gas Pipelines Access (Victoria) Act 1998 confers the
authority to regulate gas distribution prices to the ESC as the local regulator, being the
relevant regulator under the abovementioned Schedule 1 (Third party access to natural gas
pipelines).
Gas transmission charges, meanwhile, are regulated by the Australian Competition and
Consumer Commission (ACCC), being the relevant regulator under the abovementioned
Schedule 1 (Third party access to natural gas pipelines), by virtue of Section 10 of the Gas
Pipelines Access (Victoria) Act 1998. However, this responsibility will subsequently be
transferred to the Australian Energy Regulator (AER) which forms part of the ACCC (ESC
2006).
2.9.4 Water
2.9.4.1 Regulation of water supply including water quality
Although water is not an energy input, sufficiently heated water forms into steam which
contains thermal energy. Therefore, the quality of water affects the efficiency of the
cogeneration process to a certain extent. The quality of steam required for the cogeneration is
discussed in Chapter 4.
The cogeneration plant obtains its water from City West Water Limited (CWW). CWW is a
water supplier as defined under Section 3 of the Safe Drinking Water Act 2003 by virtue of
being issued a water and sewerage licence under Division 1 of Part 2 of the Water Industry
Act 1994. CWW’s boundaries are specified in the licence. It is required to have a risk
management plan under Section 7 and comply with drinking water quality standards under
Section 17 of the Safe Drinking Water Act 2003. In addition, CWW is required to comply
with the Statement of Obligations issued by the Minister for Water pursuant to Section 8 of
the Water Industry Act 1994 which dictates how CWW should perform its functions and
exercise its powers.
The drinking water quality standards are set out in Schedule 2 of the Safe Drinking Water
Regulations 2005. These regulations are issued under Section 56 of the Safe Drinking Water
Act 2003. The water quality parameters are specified under the categories of microbiological
organisms (measured by quantity per millilitres of water), chemicals (measured in milligrams

77
per litre of water) and physical characteristics, in particular, turbidity (the clarity of the water,
measured in Nephelometric Turbidity Units). In addition, CWW refers to the water quality
guidelines in the Australian Drinking Water Guidelines 2004 (ADWG) as issued by the
Australian Government National Health and Medical Research Council and Natural Resource
Management Ministerial Council (2004) which are based on the World Health Organization
(WHO) Guidelines for Drinking Water Quality. This assessment is listed in CWW’s Drinking
Water Quality Report 2005.
Furthermore, although there is no regulatory requirement to measure water hardness
(measured in mg/L) and pH (which measures the alkaline, acidic or neutral condition of the
water) since they are not included under the water quality standards, CWW measures and
compares them against the ADWG also. For example, the water hardness and pH of the water
supply were reported in CWW’s Drinking Water Quality Report 2005. Generally, the water
hardness in Melbourne is quite low. In other words, the water is quite soft (CWW 2006).
Water hardness relates to the amount of calcium and magnesium in the water which are due to
the geological characteristics at the water’s source. Hard water causes scale or crusty deposits
to form in appliances and equipment which reduces their efficiency (CWW 2006).
2.9.4.2 Water regulatory cost
Under Section 22 of the Water Industry Act 1994, CWW as a licensee may impose a service
charge and a water usage charge. However, the water charges (or prices) imposed by CWW
need to be approved by the ESC. The ESC is given this authority under Sections 32 and 33 of
the Essential Services Act 2001. Clause 8 of the Water Industry Regulatory Order 2003
requires the ESC to either approve the prices as set out in CWW’s Water Plan, or specify the
prices itself by issuing a determination (ESC 2005). This order was made under section 4D of
the Water Industry Act 1994.
2.9.5 Electricity exported on to the grid
Since electricity required for operating a cogeneration plant is sourced from the cogeneration
plant when it is operating, electricity imported from the grid is not discussed for the purpose
of this research. Especially since there are only few instances when the cogeneration plant is
not operating due to reasons such as a plant outage and the subsequent maintenance required.

78
The electricity supply industry in Victoria is regulated as stipulated under Section 1 of the
Electricity Industry Act 2000. In addition, the National Electricity (South Australia) (New
National Electricity Law) Amendment Act 2005 (National Electricity Law), which was an
amendment to the National Electricity (South Australia) Act 1996, applies to Victoria by
virtue of Sections 6 and 7 of the National Electricity (Victoria) Act 2005. Furthermore,
Section 12 of the National Electricity Law stipulates that the ESC is the jurisdictional
regulator for Victoria. Under Section 49 of the National Electricity Law, the National
Electricity Market Management Company Limited (NEMMCO) was conferred the authority
to administer and manage the National Electricity Market (NEM), of which Victoria is a
member (NEMMCO 2005). NEMMCO’s highest priority is power system security
management which relates to the capability of the power system to continue operating within
defined technical limits regardless of any major power system (for example a generator)
disconnection. Maintenance of the power system security ensures that electricity supply is on-
going and reliable.
2.9.5.1 Regulation of electricity exported on to the grid including power (electricity)
quality
Clauses 5.2.5 of the National Electricity Rules (Rules) as issued by the Australian Energy
Market Commission (AEMC) under Section 29 of the National Electricity (South Australia)
(New National Electricity Law) Amendment Act 2005 requires power generators to plan,
design and operate their facilities so that they comply with all applicable performance and
system standards which are set out in Clauses S5.2.5.1 to S5.2.5.13 such as reactive power
capability, frequency control and the quality of electricity that needs to be generated. The
primary quality parameters are voltage fluctuation, harmonic voltage distortion and voltage
unbalance. The Rules refer to Australian Standards AS/NZS 61000.3.7:2001 and AS/NZS
61000.3.6:2001 for guidance in setting limits relating to voltage fluctuation and harmonic
voltage distortion respectively. There is no reference to an Australian Standard in determining
the limits for voltage unbalance. Sections 58 to 69 state that the Australian Energy Regulator
(AER) may institute proceedings for any breach of the National Electricity Law and the
related Regulations and Rules as well as set out the monetary penalties that may be applicable,
and circumstances under which disconnection from the grid are permissible.
One aspect or characteristic of electricity that can be controlled is the power factor which
affects power system costs (Square D Company - Schneider Electric 1995). The power factor

79
is the difference between the total power that the plant delivers to the customer and that
portion of total power which does useful work (that is, real power measured in kilowatts). A
power factor load of less than unity requires two different kinds of current: the part which
supplies real power and the balance which provides reactive power (Square D Company -
Schneider Electric 1995). Reactive power is measured in kilovars (volt-ampere reactive)
(Boylestad 1994). It is necessary to have reactive power although this can be provided by
power factor correction capacitors instead of by the same source as that for real power
(Square D Company - Schneider Electric 1995). Power factor correction refers to the process
of introducing this reactive power to bring the power factor closer to unity (Boylestad 1994).
The power factor needs to be brought as close to unity as possible to minimize energy losses
due to excessive currents. In other words, reactive power needs to be minimized (Square D
Company - Schneider Electric 1995). This then improves the plant’s operating efficiency
since more real power is being produced. However, because power is being produced every
instant of time, the time that it takes to bring the power factor back to unity means that there
will be some energy loss (Boylestad 1994).
2.9.5.2 Electricity rates
The ESC has the authority under Section 12 of the Electricity Industry Act 2000 to regulate
prices, in particular tariffs for the sale of electricity in addition to charges for connection to, as
well as the use of any distribution system. However, the prices that the case study company
charges to its customers for the sale of its electricity are stipulated in the cogeneration contract.
2.9.6 Accounting standards and guidance
Up to June 2006 (which was when data collection pertaining to the case study company’s
accounting system concluded), there were no specific Australian accounting standard in
regard to accounting for the environment, particularly in relation to the emissions of GHG.
Paragraphs 16 and 18 of Australian accounting standard AASB 116 as issued by the
Australian Accounting Standards Board (ICAA 2006) require that the initial estimate of the
costs of dismantling and removing the asset and restoring the site where it is located be
included in the cost of an item of property, plant and equipment (Deegan 2006). Paragraphs
45 and 47 of AASB 137 then requires the resulting liability, a provision, to be measured using
a current market-based discount rate (ICAA 2006). Urgent Issues Group UIG Interpretation 1
provides guidance on changes in existing decommissioning, restoration and similar liability;

80
while UIG Interpretation 3 provides the first specific guidance on accounting for ‘cap and
trade’ emission rights schemes in Australia (ICAA 2006). However, these UIG are not
applicable to the case study company.
Guidance from an Australian perspective can be obtained from Auditing Guidance Statement
AGS 1036 on ‘The consideration of environmental matters in the audit of a financial report’
(2002). Paragraphs 1 and 16 of AGS 1036 recognize the increasing significance of
environmental matters to more and more entities as these entities may be subject to
environmental laws and regulations, own sites contaminated by the previous owners (which
may expose them to vicarious liability) and or have business processes which:
• generate, use or process hazardous waste;
• may cause contamination of the air, water and earth; and
• may have a detrimental impact on the employees, customers or people living in the
areas surrounding the entities’ sites.
According to Paragraph 10 of AGS 1036 (2002), environmental matters relate to:
• initiatives taken to prevent, reduce or remedy damage to the environment, or to
conserve renewable and non-renewable resources. Such initiatives may be required by
law or by contract, or undertaken voluntarily;
• the consequences of non-compliance with environmental laws and regulations;
• the consequences of environmental damage done to natural resources or to other
people or entities; and
• the consequences of vicarious liability as imposed by law. An example would be
liability for damages caused by the previous owners.
These environmental matters may affect the financial performance and position of the entities
which will affect the financial report (AGS 1036 2002). Several examples are given in
Paragraph 11 of AGS 1036, as follow:
• assets may be impaired due to the introduction of environmental laws, thus requiring
their carrying values to be written down;
• legal, compliance, remediation, compensation or insurance costs may be incurred;
• a contingent liability may arise which subsequently needs to be disclosed in the notes
to the accounts;
• penalties may be imposed for non-compliance with environmental laws; and

81
• in extreme situations, an entity may face a going concern problem due to non
compliance with certain environmental legislation. This may subsequently affect the
basis of preparation of the financial report and disclosure requirements.
Paragraph 22 of AGS 1036 states that there are different approaches which entities may adopt
to achieve control over environmental matters. An approach that is suitable for smaller
entities is by controlling and monitoring their environmental matters within their normal
accounting and internal control systems. Entities may also design and operate a separate
internal control sub-system which conforms to the standards for Environmental Management
Systems (EMS) as issued by the International Organization for Standardization under
ISO14001: Environmental management systems. ISO14001 requires the development and
implementation of a systematic approach to managing significant environmental matters and a
commitment to continuous improvement. Other standards for an EMS such as the Eco-
Management and Audit Scheme (EMAS) as issued by the European Commission can be used
as benchmarks also. Another approach is to design and operate an integrated control system
which covers policies and procedures pertaining to accounting, environmental and other
matters such as health and safety, and quality (AGS 1036 2002).
Paragraph 26 of AGS 1036 provides examples of environmental controls which are policies
and procedures to:
• monitor compliance with the relevant environmental laws and the entity’s own
environmental policy. For example, environmental licences may specify the entity’s
operating conditions within an environmental context such as the maximum
permissible levels of emissions;
• maintain an appropriate environmental information system that can record, for
example, the environmental characteristics of products, the physical quantities of
hazardous wastes and emissions, occurrence and impact of incidents, results of
inspections by enforcement agencies, and complaints from the public;
• reconcile the environmental information with the relevant financial data, for example,
the physical quantities of waste produced and the related cost of waste disposal; and
• identify potential environmental matters and the related contingencies.

82
2.9.7 Government incentives for reducing GHG
The government incentives available to the case study company are limited. EPA incentives
such as the EPA licence fee discount have been discussed under Section 2.9.1. Another
possible government incentive is offered through the Resource Smart Business Program, part
of the Victorian State Government Environmental Sustainability Action Statement, which was
announced via a media release by the Minister for the Environment and the Minister for
Energy Industries and Resources on 31 August 2006. To obtain support for projects
nominated under this program, companies need to demonstrate that those projects would
(Sustainability Victoria 2006):
• result in benefits being derived from innovative improvements in resource efficiency
by means of addressing an industry barrier to attaining such efficiency;
• enhance productivity;
• be commercially viable; and
• have the potential to be used as examples to the Victorian business community.
A Federal Government incentive is the Low Emissions Technology Demonstration Fund
(LETDF) (Myer 2006). Funding is available for the commercial development of technologies
in the energy sector which can reduce GHG emissions without damaging the competitiveness
of Australia’s energy and energy-dependent industries (AGO 2006). However, this
technology must be available by 2020 to 2030.
2.9.8 Future legislation
Under Section 3 of the Energy Efficiency Opportunities Act 2006 (Parliament of Australia
2006), large energy using businesses are required to assess their energy efficiency
opportunities to a minimum standard and to report publicly on the outcomes. However, some
companies are exempted under Section 7 of this Act and Regulation 2.1 of the Energy
Efficiency Opportunities Regulations 2006 for three years from the trigger year, 2005/06, that
is up to 30 June 2009, as its activities relate mainly to electricity generation (Australian
Government Department of Industry, Tourism and Resources 2006). The rationale for this is
that the requirements stipulated under this Energy Efficiency Opportunities Act are similar to
the statutory requirements under the EPA Greenhouse Program (refer to Section 2.9.1).
83
Chapter 3
RESEARCH METHODOLOGY
3.1 Introduction
This chapter describes how the research would be conducted as well as background
information that would assist in understanding and creating an awareness of the ‘finer’
techniques of case study research and the ‘pitfalls’ to be avoided.
The research was based on a case study of a cogeneration company, which is a
phenomenological methodology (Collis and Hussey 2003). A phenomenon is ‘a fact or
occurrence that appears or is perceived, especially one of which the cause is in question’
(Allen 1990, p. 893). Case study is a type of qualitative research although both qualitative
data (words) and quantitative data (numbers) can be used (Miles et al. 1994; Patton 2002;
Bogdan and Biklen 2003).
A case study is defined as:
• ‘an empirical inquiry that investigates a contemporary phenomenon within its real-life
context, especially when the boundaries between phenomenon and context are not
clearly evident’ (Yin 2003, p. 13); and
• ‘an extensive examination of a single instance of a phenomenon of interest’ (Collis et
al. 2003, p. 68).
Case studies are often in the form of exploratory research (Collis et al. 2003). However, there
are other types including (Scapens 1990):
• explanatory case studies where existing theory is applied to understand and explain
the phenomenon within the context;
• descriptive case studies which describe current practice; and
• experimental case studies where the difficulties in implementing new techniques and
procedures in an organization are examined and the benefits evaluated.

84
Case studies can be used to provide description, to test theories or to generate theories
(Eisenhardt 1989). In addition, Yin (2003) recognized that there are variations within case
studies such as single and multiple-case studies.
3.2 The case study approach
Case study is the preferred strategy when a ‘how’ or ‘why’ question is posed, the researcher
has little control over events, and the focus is on a contemporary, as opposed to historical,
phenomenon within a real-life context (Yin 2003). The objective of this research was to
explore if EMA could be applied in assisting a cogeneration company achieve its financial
objectives without neglecting its environmental performance. In addition, the researcher had
little, if any, ability to manipulate events directly, precisely and systematically; in contrast to
an experiment in a laboratory environment. Furthermore, this research focused on a
contemporary phenomenon which sought to explore whether EMA could be applied in a real-
life context being the cogeneration company; as opposed to a historical event.
A case study method would provide valuable in-depth practical insight into the operations and
mechanisms of an organization involved in combined heat and power generation. Fieldwork
research is best at addressing the need for specific understanding of concrete details of
practice using documentation (Erickson 1986). For example, giving a general answer such as
‘the teacher is using behaviour modification techniques effectively’ to the question ‘What is
happening?’ is not useful. It does not indicate how the teacher used which techniques with
which students, or the criterion for effectiveness.
Another advantage of using qualitative data is that the researcher can preserve the
chronological order, see exactly which events led to which consequences, and derive
explanations (Miles et al. 1994). Well-collected qualitative data focus on ordinary events
which occur naturally in natural settings and reflect real life. The focus is on a specific case, a
bounded phenomenon which is embedded in its local context. The influences of the context
are taken into consideration and therefore the possibility for understanding latent underlying
issues is high. Qualitative data, which are usually gathered over a sustained period of time,
allows a study of why and how things happen as they do, and an assessment of causality. In
addition, the inherent flexibility of qualitative research (data collection methods and times can
be varied as the research proceeds) gives greater confidence that the researcher has really
understood what has been going on. In qualitative research, there is usually a second chance
in that people and settings can be observed more than once (Miles et al. 1994). The frequent

85
overlap of data analysis with data collection gives researchers flexibility in making
adjustments during the data collection process (Eisenhardt 1989). For example, additional
questions can be included in the interview protocol, or interviews extended to individuals
whose importance became clear during the data collection. The question then arises whether it
is legitimate to alter or add data collection methods during a theory-building research. The
answer is ‘yes’ because the purpose is to gain an in-depth understanding of the phenomenon
being researched. The purpose is not to produce statistics about the phenomenon being
studied. Therefore, if an opportunity arises to better improve understanding of the
phenomenon, it makes sense to seize the opportunity by adjusting the data collection
method(s). This flexibility does not mean that the research is being conducted in an
unsystematic manner. Rather, it is controlled opportunism whereby researchers take
advantage of the uniqueness of case study research and the emergence of new themes to
improve the outcome of the research (Eisenhardt 1989).
Qualitative research has been advocated as the best approach for exploring new areas, for
discovering and developing hypotheses, for testing hypotheses to evaluate whether or not
specific predictions hold true, and for validating, explaining, supplementing and or
reinterpreting quantitative data collected from the same setting. However, the strengths of
qualitative data depend on how competent the analysis has been ((Miles et al. 1994).
Shields (1997, p. 11) stated that ‘a comparative advantage of case / field research is to
investigate the presence and absence of management accounting’. For example, researchers
can investigate settings in which management accounting is not present but is theoretically
predicted to be present (examples include some government settings, certain non-
manufacturing activities in manufacturing firms, service firms) and investigate why it is not
present and what are the consequences, if any.
However, qualitative research is not without its problems (Miles et al. 1994). Data collection
in qualitative research tends to be labour-intensive and there may be issues such as data
overload, the possibility of researcher bias, the adequacy of sampling since usually only a few
cases can be managed at a time, the generalizability of findings, the reliability and validity of
findings, and the quality of conclusions. And, perhaps the most serious issue in the past was
the lack of well-formulated methods of analysis. However, since then there has been
improvement in the development of systematic and explicit methods for qualitative research

86
by authors such as Yin (2003), Miles et al. (1994), Patton (2002), and Bogdan et al. (2003);
which can overcome the shortcomings mentioned above.
How does qualitative research compare with quantitative research such as a survey? Denzin
(1978) argued that surveys, which generally use variable analysis, move quickly from
measurement to analysis without focusing on the problems relating to data collection.
Furthermore, variable analysis may not be appropriate in situations where the variables are
not easily quantifiable. He further argued that using large samples does not necessarily mean
that the inherent problems of interviewer bias, lack of question comparability for sub-samples
and other issues pertaining to data collection would be overcome. He also cited Deming (1944)
who listed factors including imperfections in the design of the questionnaire such as lack of
clarity in definitions, and bias due to non response and omissions which may affect the
ultimate usefulness of the surveys.
Kirk and Miller (1986) argued that even when the quantitative reliability of the survey method
is essential to the research; it is useful to have the additional perspective of qualitative
research to assure validity. Reliability relates to being able to obtain the same results if any
researcher were to repeat that research, whereas validity relates to ‘the extent to which the
research findings accurately represent what is happening in the situation’ (Collis et al. 2003, p.
186). Leach (1967) stated that survey researchers risk making invalid inferences because
when they encounter an unexpected discrepancy, they accept the validity of their
questionnaire data and instead simply analyze the figures to discover their statistical
significance.
On the other hand, qualitative researchers may suspect the validity of the original data and
look for a source of error. As stated by Kirk et al. (1986), mistakenly rejecting the null
hypothesis (that is: believing a principle to be true when it is not) is called a ‘type one error’.
Rejecting a principle when it is true is a ‘type two error’. And, a ‘type three error’ is asking
the wrong question which is the source of most validity errors. Therefore, it is crucial to have
safeguards against asking the wrong questions. Qualitative research involves fieldwork where
the researcher has continuous face-to-face routine contact with people throughout the period
of the fieldwork. Therefore, it allows the researcher to continually test emerging hypotheses in
the pragmatic routine of everyday life unless, of course, the researcher is unusually
complacent or craven. Therefore, qualitative research, which involves fieldwork, possesses
certain validity safeguards which non qualitative methods do not ordinarily have.

87
The choice of qualitative (such as case study) or quantitative (for example, a survey) research
depends on what is being researched (Patton 2002). In a way, this involves a trade-off
between breadth and depth. A much larger number of cases can be used in quantitative
research, hence facilitating statistical aggregation and comparison of the data. This allows for
generalization of the findings. Qualitative research, on the other hand, facilitates the study of
issues in detail and in great depth since data is collected without the constraint of
predetermined categories of analysis, thus contributing to the potential breadth of qualitative
research. Qualitative research typically produces a wealth of detailed information about a
much smaller number of cases compared to quantitative research. This reduces
generalizability. Because quantitative and qualitative researches have different strengths and
weaknesses, they are considered as alternative but not mutually exclusive research strategies
(Patton 2002).
3.3 Case study design and the quality of the research
Research design is defined as the ‘science (and art) of planning procedures for conducting
studies so as to get the most valid findings’ (Vogt 1993, p. 196). Determining the research
design is crucial in preparing a detailed plan to guide and focus the research (Collis et al
2003). Research design decisions can involve analysis because they can be likened to
anticipatory data reduction whereby they constrain later analysis by accepting certain
variables and relationships and ruling out others (Miles et al. 1994).
Yin (2003) sets out the five components of a case study design as follow:
• research study questions;
• the propositions, if any;
• unit of analysis;
• the logic linking the data to the propositions; and
• the criteria for interpreting the findings.
The first three components mentioned above relate to data collection while the last two
components relate to what is to be done after the data have been collected.
The most relevant research strategy would depend on the nature of the research study
questions or research problem (Yin 2003). Eisenhardt (1989) argued that while it is important
to have a clearly-defined research question at the start of the research since this will assist in

88
the systematic collection of data, it is also important to recognize that the research question
may shift during the research. Research questions further focus and bound the collection of
data (Miles et al. 1994). Therefore, Miles et al. (1994) viewed research questions as the best
defence against information overload. Formulating research questions is an iterative process;
the questions become more focused after being refined each time over a period of time. In
addition, it is not necessary or even preferable to choose the cases at random (Eisenhardt
1989). Qualitative research tends to involve small samples of people and studied in-depth
within the context unlike quantitative research which requires larger samples stripped of
context for statistical significance (Miles et al. 1994; Patton 2002). Therefore, random
sampling is not applicable in qualitative research because this may lead to bias (Miles et al.
1994). Rather, conceptually-driven sequential sampling (or purposeful sampling or judgment
sampling) is more applicable because initial choices of informants may lead to additional
informants who may be similar or different, observing one category of events may lead to
comparison with others, or understanding one key relationship may reveal facets to be studied
in others. In qualitative research, sampling involves two actions that at times may pull in
opposite directions. Sampling is crucial in bounding the collection of data (Miles et al. 1994).
Boundaries need to be set which limits the study to aspects of the case that relate directly to
the research questions. However, there is a danger of sampling too narrowly in qualitative
research, as in survey research. Therefore, it is important to do peripheral sampling to a
certain extent and look for negative and exceptional instances which may force the researcher
to clarify concepts and may indicate whether the sampling was too narrow (Miles et al. 1994).
The propositions are reflected in the research questions listed in Section 1.4. Propositions are
important since each proposition directs focus on a particular aspect or area within the scope
of the research (Yin 2003).
Choosing the appropriate unit of analysis is fundamental to the research because this will
determine the limits of the data collection and analysis for example the specific time
boundaries to define the beginning and end of the case (Yin 2003). A unit of analysis is
defined as ‘the kind of case to which the variables or phenomena under study and the research
problem refer, and about which data is collected and analyzed’ (Collis et al. 2003, p. 121). In
addition, the unit of analysis must be appropriate to the research problem. A unit of analysis,
or case, can be an individual, an event, an organization or a nation (Miles et al. 1994). It is
suggested that the best practice is to select the unit of analysis at the lowest possible level
where decisions are made (Kervin 1992). Taking all these into consideration, the appropriate

89
unit of analysis as adopted in this research is a particular cogeneration plant in the case study
company itself.
Both the logic linking the data to the propositions or the research aims, and the criteria for
interpreting the findings, relate to analysis of the data collected (Yin 2003).
Conducting a case study research would allow, among others, for a walk-through of the
company’s accounting system and its physical cogeneration production process flow,
therefore ensuring that a sequential flow is recorded. This, undoubtedly, would enhance any
analysis and evaluation of the company’s financial and environmental performances.
Furthermore, researchers need to describe their research procedures, and not just explain why
they did not deploy certain methods, as this will allow others to judge the quality of the
research work and gain from the research (Huberman and Miles 2002).
Yin (2003) and Atkinson and Shaffir (1998) identified four tests that can be used to judge the
quality of case study research as follow. These tests tend to overlap with the criteria identified
by Lincoln and Guba (1985) as mentioned below:
• construct validity which queries whether the researcher is measuring what the
researcher wants to measure;
• internal validity which asks whether the researcher has taken all steps to ensure that
all the evidence required to infer a causal relationship have been obtained;
• external validity which relates to the clear identification of the population to apply the
results of the research to. This is to enable generalization of any theory developed;
and
• reliability which relates to whether the research can be replicated by other researchers
with the same results.
Yin (2003) of COSMOS Corporation sets out those tests, the tactics and when they occur in
the following table:

90
Table 3.1: Tests for judging the quality of case study research design and the associated
tactics and when they occur
Tests Case study tactic Phase of research in which tactic occurs
Construct validity
• use multiple sources of evidence;
• establish chain of evidence; and
• have key informants review draft case study report.
Data collection
Internal validity
• do pattern-matching;
• do explanation-building;
• address rival explanations; and
• use logic models. The logic model sets out a chain of events over time in repeated cause-effect patterns where an event (a dependent variable) becomes the causal event (independent variable) at the next stage (Rog and Huebner 1992). The logic model traces events where an intervention produced an outcome or sequence of outcomes (Wholey 1979).
Data analysis
External validity
• use theory in single-case studies; and
• use replication logic in multiple-case studies.
Research design
Reliability • use case study protocol which generally should have the following sections:
o an overview of the case study project including the project objective and case study issues;
o filed procedures such as general sources of information;
o case study questions and the potential sources of information to answer each question;
o a guide for the case study report such as the outline and a bibliography; and
• develop a case study database.
Data collection
Collis et al. (2003) suggested that various criteria which can be used to evaluate a
phenomenological study in its entirety can be used to assess the quality of the data analysis (a
more detailed review of the literature on data collection and analysis is done in section 3.5).
Lincoln et al. (1985) suggested four such criteria that should be used, and their applicability to
this research as follow:

91
Table 3.2: Criteria for assessing the quality of a case study research
Criterion Definition Techniques for establishing criterion
Credibility (in lieu of internal validity).
The research was conducted in a way which enabled the correct identification and description of the subject of the research enquiry.
Prolonged and persistent observation to obtain depth of understanding. However, the researcher needs to be aware of the danger of ‘going native’ which may happen when the researcher becomes too assimilated into the case study and loses his or her research perspective. The researcher may be over-influenced by the informants. There is no technique that can provide a guarantee against such influence, although awareness is an important step towards prevention. Did triangulation produce converging conclusions and if not, is there an explanation for this (Mathison 1988)? Negative case analysis which involves the process of continuously revising hypotheses with hindsight until all known cases have been accounted for without exception. Member checks whereby data and interpretations are checked with the informants. Was there consensus (Miles et al. 1994)? Member checking gives the informants the opportunity to correct errors of fact and wrong interpretations. In addition, it may stimulate the informants to recall additional information that may not have been mentioned the first time around. Furthermore, it helps to protect the researcher against the possibility of the informants claiming misunderstanding or researcher error later on (Lincoln et al. 1985).
Transferability (in lieu of external validity).
The applicability of findings to another similar situation to permit generalization.
The data provided is sufficient to allow other people to judge whether the findings are transferable to another similar setting (Lincoln et al. 1985) and how far they can be generalized (Miles et al. 1994).
Dependability (in lieu of reliability).
The research processes are rigorous, systematic, well-documented (Lincoln et al. 1985) and consistent (Miles et al. 1994).
Inquiry auditing. Lincoln et al. (1985) compared the task of the inquiry auditor metaphorically to the financial statements auditor. The first task involves examining the process of the research inquiry and attesting to the dependability of the inquiry when acceptability is determined. The second task involves examining the product, which comprises the findings, interpretations and recommendations, and then attesting that it is supported by data and is internally coherent. This task establishes the confirmability of the research inquiry.
Confirmability (in lieu of objectivity construct validity).
It is possible to assess whether the findings were based on the data collected.
Confirmability auditing as discussed above (Lincoln et al. 1985). In addition, the research methods and procedures are specified clearly and in detail so that they give a complete picture (Miles et al. 1994).
Protective steps taken to safeguard the quality of this research based on the abovementioned
tests are detailed in Table 4.21.
92
Collis et al. (2003) argued that reliability and validity are crucial in assessing the quality of
the case study research. Miles et al. (1994) suggested another criterion for assessing the
quality of the case study research which is utilization or application or action orientation. This
refers to the impact of the research on the researcher(s), the researched and other users of the
research such as whether it led to more intelligent action or not, and who benefited from the
research. One way to assess this criterion is to determine if new capacities have been
developed or learned by users of the research. Another way is to evaluate the level of usable
knowledge gained from the research (Miles et al. 1994). In this regard, Patton (2002) argued
that it is impossible to find nothing in qualitative research, particularly with case study.
Although the case study research may not have lead to new insights or confirmed the
researcher’s predictions, there is the description of that case at that time and place, as well as
the observations and the interview responses.
Yin (2003) identified five general characteristics of an exemplary case study. Firstly, the case
study should be significant. For example, it may reveal a real-life situation which had not
been studied in the past. Secondly, the case study should be complete in that exhaustive effort
was expended in collecting all critical and relevant evidence, as opposed to literally collecting
all available evidence which is impossible. For example, critical evidence representing rival
propositions should be collected. In addition, the presentation of the evidence and or analysis
should show the boundaries of the case study in that as the analytic peripheral is reached, the
information decreases in relevance. Furthermore, the research should not be ended just
because of non research constraints such as running out of time. Thirdly, the case study must
consider alternative perspectives and not just present a one-sided view. Fourth, the case study
must show that sufficient evidence was collected. The evidence ought to be presented
neutrally, with both supporting and contradictory data. There should be enough evidence
presented to prove that an in-depth and thorough study had been made. Finally, there should
be some indication that the validity of the evidence had been addressed. For example, the
source of evidence presented in a table should be disclosed. Last but not least, the case study
must be written in an engaging manner that can capture the reader’s attention. Yin (2003)
argued that rewriting can increase the clarity of the case study report, and that the enthusiasm
of the researcher be conveyed in the report.

93
3.4 Data collection and sources of evidence
3.4.1 Introduction
Yin (2003) identified the following as desired skills of a researcher when preparing for data
collection:
• question asking;
• listening;
• adaptiveness and flexibility;
• grasp of the issues being identified; and
• lack of bias.
An inquiring mind is required during data collection and not just before or after the activity
(Yin 2003). It is important to recognize that specific information that may become relevant to
the case study is not always readily predictable. Data that is collected needs to be reviewed
quickly and the researcher needs to continually ask why events or facts appear as they do. The
researcher’s judgments may lead to the need to search for additional data or evidence. Good
listening involves receiving information without bias through multiple modalities, for
example by making observations and sensing what might be going on, rather than just using
the aural modality. Yin (2003) went on to expand ‘listening’ to include its application to the
inspection of documents, in the form of reading between the lines for any inferences or
insights. Being adaptable and flexible means being able to adapt procedures or plans should
unanticipated events occur. This could include having to repeat and re-document the initial
design of the research. A firm grasp of the issues being studied is important too. An
understanding of the purpose of the research is crucial since case study data collection is not
just a matter of recording data in a mechanical fashion. The data being collected needs to be
interpreted for relevance to the research and evaluated as to whether different sources of data
contradict one another which leads to the need to collect additional data. Last but not least,
lack of bias is also important. Bias will be introduced into the research if the researcher seeks
to substantiate a preconceived position. Therefore, it is vital that the researcher is open to
contrary findings and this openness can be achieved to some extent by discussions with the
researcher’s supervisor.
There are six sources of evidence as follow (Yin 2003):
• documentation;
94
• archival records;
• interviews;
• direct observations;
• participant observation. Also known as field observation or direct observation
(Lofland & Lofland 1984); and
• physical artifacts.
3.4.2 Documentation, archival records and physical artifacts
Documentation include memoranda, minutes of meetings, administrative documents such as
proposals, site evaluation reports, and newspaper clippings (Yin 2003) as well as other
publications (Patton 2002) whereas archival records may be in computerized form and
includes service records, organizational charts, budgets, personal records and operations
reports (Yin 2003). Physical artifacts, meanwhile, may include technological devices, tools or
instruments or some other physical evidence (Yin 2003).
Yin (2003) was of the view that documentary information is likely to be relevant to every case
study and that it should be the object of explicit data collection. The most important use of
documents is to corroborate and augment evidence from other sources. Inferences made or
leads obtained from documents can form the basis of issues for further investigation (Yin
2003). For example, document analysis allows for greater understanding of the program files
which may not be directly observable and which interviews may not reveal due to
inappropriate questions being asked without the leads provided from documentation (Patton
2002). The strengths of documentary evidence include the fact that it can be reviewed
repeatedly, is unobtrusive since the documents were not created as a result of the case study,
contain exact information such as details of an event, and provides broad coverage of events,
settings and over a long span of time (Yin 2003). Weaknesses include the possibility of
reporting bias resulting from the (unknown) bias of the researcher, access may be deliberately
blocked, and biased selectivity if the collection of documents is incomplete (Yin 2003). In
addition, the data may be inaccurate or incomplete (Patton 2002). Archival records evidence
has the abovementioned strengths and weaknesses as for documentary evidence, but with the
(relative) added advantage of being precise and quantitative and the added drawback of
restricted accessibility due to confidential and privacy reasons. As a source of evidence,
physical artifacts provide insights into technical operations and cultural aspects although they
also suffer from selectivity bias and lack of availability (Yin 2003).

95
3.4.3 Interviews
Collis et al. (2003) stated that interviews are a method of collecting data whereby questions
would be asked of selected participants to find out what they do, think or feel. The data
obtained from interviews comprise of verbatim quotations about the respondents’ experiences,
feelings, opinions, perceptions and knowledge (Patton 2002).
Generally, there are three types of interviews as follow (Minichiello, Aroni, Timewell and
Alexander 1995; Patton 2002):
• unstructured interviews;
• focused or semi-structured interviews; and
• structured interviews.
Unstructured interviews are interviews which do not rely on formal interview schedules and
ordering of questions but rather on the social interaction between the interviewer and the
interviewee to elicit information. These interviews may appear to be normal daily
conversations but they are controlled to obtain information such as experiences and attitudes
that are relevant to the research.
The focused or semi-structured interviews are ‘used as either part of the more quantitatively-
oriented structured interview model, or of the qualitatively-oriented in-depth interviewing
model’ (Minichiello et al. 1995). The research topic guides the questions asked although the
mode of asking follows the unstructured interview process to allow for an in-depth
examination of the research topic (Minichiello et al. 1995). Therefore, there is essentially a
basic checklist to ensure that all relevant topics are covered with each respondent or
interviewee (Patton 2002).
Structured interviews are predominantly used in surveys or opinions polls where each
research subject is asked exactly the same question and in the same order from a detailed
interview schedule (Minichiello et al. 1995). The schedule tends to comprise of
predominantly closed-ended questions which are questions whereby the interviewees are
asked to choose between several predetermined answers such as ‘Yes/ No/ Do not know’.
However, open-ended questions are sometimes used. These are free-answer questions where
the interviewer usually asks the interviewee how he or she feels or thinks and the responses

96
may lead to further questions (Minichiello et al. 1995). According to Yin (2003), such a
survey could be used to produce quantitative data as part of the case study evidence.
Bogdan & Biklen (2003) stated that different types of interviews can be adopted at different
stages of the same research. For example, it might be preferable to use the more free-flowing,
exploratory, unstructured interview because the purpose at that stage is to obtain a general
understanding of the topics. After the investigatory work has been done, the interviews may
need to be more structured to get comparable data across a larger sample or to focus on
specific topics which emerged during the preliminary interviews. Good interviews are where
the interviewees talk freely about their perspectives. Good researchers may ask for
clarification, using questions such as ‘What do you mean?’ or ‘Could you explain that?’,
when the interviewees mention things which are unfamiliar. Good interviewers also know
how to probe the interviewees to be specific, asking for examples when points are given.
Some interviewees may need encouragement to elaborate.
A key strategy for the qualitative researcher is to avoid questions which can be answered with
a ‘yes’ or ‘no’ as much as possible because details and particulars tend to come from probing
questions which require exploration. Bogdan et al. (2003) argued that reading the same
question to each interviewee does not assure anything about the response. Each interviewee
may need to be approached somewhat differently, exploring different meanings of words and
questions, to get them to open up and talk about the topics in a meaningful way. The
qualitative researcher needs to be flexible by responding to the immediate situation. An
indication of a good interview is by looking at the transcript (that is, typed interviews)
whereby parts of the interview contributed by the interviewees are long while those from the
interviewer are short. This indicates that a lot of data was collected (Bogdan et al. 2003).
Interviews in a case study tend to be guided conversations, as opposed to interviews in a
survey which tend to be structured queries (Yin 2003). For example, Kloot and Martin (2000)
adopted the semi-structured approach in their qualitative research. This means that although a
consistent line of inquiry is pursued, the actual stream of questions in a case study tend to be
fluid rather than rigid (Rubin & Rubin 1995). A list of questions is prepared before the
interviews, but the researcher may ask additional questions depending on the response from
the interviewees. Becker (1998) discussed the difference in posing a ‘why’ question (which in
his view creates defensiveness on the interviewee’s part) and a ‘how’ question which is his
preferred way of asking any ‘why’ questions in an interview. This approach will satisfy the

97
researcher’s needs from his or her line of inquiry while simultaneously posing ‘non-
threatening’ questions in an open-ended interview.
Case study interviews are usually of an open-ended nature whereby interviewees are asked
about the facts of a matter and their opinions about events (Yin 2003). Well-informed
interviewees can provide useful insights into certain matters and may even be able to suggest
other persons to interview or other sources of corroboratory or contrary evidence. The more
that an interviewee assists in this manner, the more the interviewee is considered as an
‘informant’ rather than as a respondent. Guba and Lincoln (1981) also suggested that the
researcher check the data obtained from interviews and the subsequent interpretations with the
informants themselves.
However, Yin (2003) also pointed out the weaknesses of interviews which relate to the fact
that interviews should only be considered as verbal reports. These include possible bias due to
poorly constructed questions and or response (reactivity) bias such as the interviewees giving
responses which the interviewer wants to hear and, inaccuracies due to poor recall, poor or
inaccurate articulation (Yin 2003), self-interest, politics, anger and lack of awareness (Patton
2002). According to Douglas (1976), conflicts of interest pervade social life. Many, if not all,
people to some extent have reasons to hide what they are doing from others and may even lie
to them. Therefore, a researcher who is seeking to understand what is going on and why need
to investigate and be aware of the problems that may exist. Douglas (1976) listed these
problems as follow:
• misinformation. These unintended falsehoods are due to the researcher assuming that
the participants knows a lot when in actual fact they do not, or the participants to
assume that they know when they do not really know;
• evasions which are intentional acts of hiding by not saying or revealing, rather than
unintended misinformation. An example is when the participant keeps silent when the
researcher makes an obvious mistake;
• lies which are intended to mislead the researcher for example to give a false picture of
what is happening; and
• fronts which are socially shared and learned lies about the settings themselves. For
example, couples who live together but are not married may portray themselves as
married to society in general.

98
The researcher should also be aware of ethnography which involves the ethnographer
participating in people’s daily lives for an extended period of time to observe what occurs,
listening to what is said and asking questions for the purpose of collecting data relevant to the
research (Hammersley and Atkinson 1995). The ethnographer needs to be aware of how his or
her presence may affect the data. Different things may be said and done in private or in public.
What is said at the interview may be affected by the interviewee’s interpretation of what has
been said earlier and what may be discussed later, and also by what has happened to that
interviewee before the interview and what may happen after the interview.
Therefore, it is advisable to corroborate interview data with evidence from other sources (Yin
2003).
All the abovementioned points were taken into consideration when interviews were conducted
and protective steps taken, for example, by interviewing different people, seeking
clarifications from the interviewees after the (formal) interviews where necessary, and by
participant observation and other means of triangulation such as referring to the case study
company’s documents (refer to Chapter 4).
3.4.4 Direct observation and participant observation
Making a visit to the case study site creates an opportunity for direct observations. Assuming
that the phenomena of interest have not been purely historical, some relevant behaviours or
environmental conditions will be available for observation. For example, a casual observation
can be made through a visit to the plant site (Yin 2003). Participant observation, meanwhile,
is a special mode of observation in which the researcher is not merely a passive observer but
may assume a variety of roles within a case study situation and may actually participate in the
events being studied. For example, by being a key decision maker in an organizational setting.
Kirk et al. (1986) were of the view that participant observation is the most venerable tradition
among qualitative methods as the researcher moves in, through, and out of the field.
Observations can include observable human experience such as interpersonal interactions and
activities (Patton 2002).
In this research, the researcher is the Accounting Manager for the case study company and is
responsible for the accounting functions and therefore has a broad understanding of the
operations (refer to 4.3). Participant-observation provides distinctive and unusual

99
opportunities for collecting data (Yin 2003). It enables access to data and events that are
otherwise inaccessible to research. In addition, it provides ‘the ability to perceive reality from
the viewpoint of someone “inside” the case study rather than external to it. Many have argued
that such a perspective is invaluable in producing an “accurate” portrayal of a case study
phenomenon’ (Yin 2003, p.94). Furthermore, it allows the researcher to manipulate minor
events such as convening a meeting for the purpose of the research. The weakness with
participant observation is that potential biases may arise. These biases and their applicability
to this research are summarized in Table 3.3 below:
Table 3.3: Biases in participant observation and their applicability to this research
Bias resulting from: Applicability to the research:
Researcher assuming advocacy roles or positions contrary to the interests of good research practice.
Not applicable due to the nature of the research which is to explore whether EMA can be applied to the case study company or not.
Participant observer may follow a commonly-known phenomenon and become a supporter of the group or organization being studied.
There is no political or otherwise stance required in determining whether EMA can be applied since the case study company presently does not have any formal environmental policy.
The participant role may require too much attention relative to the observer role.
The accounting system is the direct responsibility of the researcher in his role as the Accounting Manager. Both roles are related.
If the organization being studied is physically dispersed, this may create difficulty for the participant-observer to be at the right place at the right time.
Not applicable since the researcher is based in the office and does visit the plant, all of which are in Victoria.
3.4.5 Principles of data collection
The benefits of these sources of evidence, particularly in regard to case study research, can be
maximized by following three principles (Yin 2003). The first is to use multiple sources of
evidence through triangulation. The opportunity to use many different sources of evidence is a
major strength of case study (Yin 2003). Using different sources strengthens validity as the
strengths of one source or approach may minimize the weaknesses of another approach
(Patton 2002). Using only one method leaves the research more vulnerable to errors related to
using that particular approach as opposed to using multiple methods whereby different types
of data allows for cross-data validity checks (Patton 2002). As stated by Patton (2002, p. 307):
‘….the documentation would not have made sense without the interviews, and the focus of

100
the interviews came from the field observations’. Miles et al. (1994) stated that triangulation
can be by method (observations, interviews and documentation), by data source (sources such
as people, times, places), by theory, by researcher (Denzin 1978), and by data type
(qualitative or quantitative). Lincoln et al. (1985), in referring to Denzin (1978), argued that
multiple sources may imply multiple copies of the same type of source (such as different
interviewees), and that an example of different sources of the same information would be
verifying an interview respondent’s recollection of what happened in a meeting with the
minutes of the meeting. However, if the respondent’s recollections cannot be corroborated
with the minutes of the meeting, this would suggest that one of the sources is erroneous.
Therefore, triangulation is a useful tool for corroboration (Miles et al. 1994). Even if there
were inconsistencies or direct contradictions, this may help initiate a new line of thinking or
elaborate the findings (Rossman & Wilson 1985). According to Patton (2002), triangulation
can be considered as a form of comparative analysis. Having areas of convergence
strengthens confidence in the findings and conclusions whereas areas of divergence provide
diverse views and opportunities for better understanding of the complex nature of a
phenomenon. The key therefore is to focus on the degree of convergence rather than making a
dichotomous decision on whether the different kinds of data do or do not converge. In
addition, triangulation helps to reduce the bias from having a sole researcher doing all the data
collection and analyst.
The second principle is to create a case study database. Case study documentation normally
comprises of two separate collections, being the data or evidentiary base and the report of the
researcher such as the thesis. Having a case study database allows the reader to inspect the
raw data that led to the case study’s conclusions. This would then increase the reliability of
the entire case study. A case study database would have four components. Those four
components are as follow:
• notes such as audiotapes from interviews or handwritten observations;
• documents;
• tabular materials which may include quantitative data stored in computer files;
and
• narratives.
The case study database, which includes analyses of documents and salient points from
interviews, is presented in Chapter 4.

101
The third principle is to maintain a chain of evidence. Doing so would increase the reliability
of the information in the case study. This allows an external observer, in this situation, the
reader of the case study, to follow the derivation of any evidence, ranging from initial
research questions to ultimate case study conclusions. Furthermore, the reader should be able
to trace the steps in either direction that is from conclusions back to initial questions and from
initial questions to conclusions.
3.5 Data analysis and drawing conclusions
Qualitative data analysis comprises three concurrent flows of activity, as follow (Miles et al.
1994). The first flow is data reduction which is a form of analysis that involves the process of
selecting, focusing, sorting, discarding and transforming data so that conclusions can be
drawn and verified. Data reduction is part of analysis rather than separate from analysis
because the researcher is required to make analytic choices when deciding which data to
select, code and discard. Data reduction occurs continuously throughout the research until the
final report is completed, even before the data are actually collected as the researcher decides
which research questions and which data collection methods to choose.
The next flow is data display. A display, broadly speaking, is an organized and compressed
assembly of information which allows for conclusion drawing or moving on to the next step
of analysis or action. The design and use of displays is part of analysis. For example, when
designing a display, deciding on the columns and rows of a matrix, and deciding which data
should be entered in what form, are analytic activities. Designing displays can also have data
reduction ramifications. Displays can include not just text (say in the form of pages of field
notes) but also graphs, charts and matrices. However, displays in the form of text can be
cumbersome because text tends to be dispersed, poorly structured, sequential rather than
simultaneous, and bulky. Humans are not very capable at processing large amounts of
information and tend to look for simplifying patterns to complex information.
The last flow is conclusion drawing and verification. Patterns, explanations, causal flows,
possible configurations and propositions are noted from the commencement of data collection.
However, a competent researcher would maintain an open and sceptical mind in regard to the
initial conclusions drawn, and only draw final conclusions towards the end of the study.
Conclusions also need to be verified as the research proceeds. Verification may be as brief as
a fleeting thought with a quick review of the field notes; or it may be thorough and elaborate

102
with lengthy debates with, and reviews by, other researchers to obtain consensus. Or, it may
involve extensive efforts to replicate the findings using another data set. The findings from the
data also need to be tested for their validity (Miles et al. 1994).
The three types of analysis activity as mentioned above and the data collection activity itself
form a cyclical, continuous and interactive process (Miles et al. 1994). For example, the
coding of data (part of data reduction) leads to new ideas on what should be entered into a
matrix (a form of data display). Entering the data may require further data reduction. As the
matrix is being built, preliminary conclusions are drawn which may in turn lead to the
decision to add an extra column to the matrix to test those conclusions (Miles et al. 1994).
Data analysis is similar to content analysis. Content analysis generally refers to any effort to
reduce and make sense of qualitative data whereby a volume of qualitative material is taken
and attempts made to identify core consistencies and meanings (Patton 2002). Content
analysis involves identifying, coding and labelling the patterns in the data. The core meanings
discovered through content analysis are usually called themes or patterns. The process of
searching for themes or patterns may be referred to alternatively as theme analysis or pattern
analysis respectively (Patton 2002).
Miles et al. (1994) recommended that (inductive) analysis be done early while data collection
is going on because it helps the researcher think about the existing data and how to collect
new and often better data. Data collection is a selective process; it is not possible to capture
everything. For example, interview transcripts can be done at different levels of detail, from
the pauses and incomplete sentences of an incoherent interviewee (whose body language and
tone of voice cannot be typed up) to just the words spoken by an interviewee. There are two
problems associated with analysis of qualitative research. First, data overload arises because
qualitative research is usually done with words rather than numbers. Words can be unwieldy
and may have many meanings. For example, ‘board’ may refer to a piece of wood or a
decision-making body. Numbers are often less ambiguous and more economical to process.
However, Miles et al. (1994) argued that words render more meaning than numbers alone.
The solution therefore is to keep words and any related numbers together during the analysis.
Miles et al. (1994) cited Rossman et al. (1985) when giving three reasons for linking
qualitative and quantitative data as follow:
• to confirm or corroborate each other (provide convergence in findings) via
triangulation;

103
• to develop or elaborate analysis; and
• to initiate new ideas by providing fresh insight, or paradoxes.
The second problem is data retrieval (Miles et al. 1994). Within that mass of data may be
useful information that might have been overlooked. Therefore, the researcher needs to be
open to unexpected findings or new ideas, hence one of the reasons for reviewing American
and European literature in addition to Australian literature so as to broaden knowledge and
awareness. While being mindful of data overload, this should not come at the expense of not
being thorough and detailed enough. One way of overcoming these problems is by coding
which is part of analysis (Miles et al. 1994).
Coding involves differentiating and combining the data retrieved and reflecting on this
information (Miles et al. 1994). Codes are labels or tags assigned to meaningful units of
descriptive or inferential information compiled during the research. Codes are usually
attached to chunks of various sizes such as words or sentences. For example, ‘motivation’ can
be coded as ‘MOT’. It is not the words but their meaning or significance that is important.
Using codes to retrieve and organize the chunks of information enables the researcher to
quickly find, pull out and cluster the segments pertaining to a particular research question,
construct or hypothesis. Clustering, which involves grouping objects with similar patterns or
characteristics to understand a phenomenon better, and display of focused information lead to
conclusion drawing (Miles et al. 1994).
One method of creating codes is the inductive coding technique (Strauss & Corbin 1990).
Data are collected initially, written up and reviewed line by line usually within the paragraph.
Examples of how codes can be divided to deal with various phenomena were given by
Bogdan et al. (2003) as follow:
• setting or context: general information regarding the surroundings which allows for
study in a larger context;
• definition of the situation: how people define, perceive or understand the topics or
settings relating to the research;
• perspectives: informants’ way of thinking about their setting on how things are done
there;
• ways of thinking about people and objects: comprehension of each other, of outsiders
and of objects;
• process: sequence of events, changes over time, transitions and turning points;

104
• activities: kinds of behaviour which occur regularly;
• events: specific activities, in particular those which occur infrequently; and
• methods.
Not all the categories mentioned above may necessarily be used in a research (Miles et al.,
1994). Furthermore, codes may have to be revised (changed, sub coded or deleted) as the
research progresses especially if new theories or concepts are discovered or the initial codes
are inapplicable. The revised codes will be better grounded empirically. Ongoing coding
unveils actual or potential sources of bias, and equivocal or incomplete data that can be
clarified later (Miles et al. 1994).
When codes are created and revised is less important than having the codes in some structural
order, although it is advisable to code as part of early and continuing analysis rather than at
the end of the data collection as it drives ongoing data collection and may lead to a reshaping
of the researcher’s perspective (Miles et al. 1994). A well-structured code list should have
codes that relate coherently or are distinct to one another and pertain to the research. Codes
should be named as close as possible to the concept it is describing. Numbers should not be
used as codes. How detailed the coding should be varies depending on the particular research.
It should be noted that not every piece of data need to be coded. Some data may be trivial or
useless. Codes are category labels, not a filing system.
When generating pattern codes, the researcher needs to look for common or recurring patterns
that link the data (convergence), or alternatively for differences or deviations from the
patterns (divergence) (Miles et al. 1994; Patton 2002). The initial pattern coding may be a
poor fit for the data because the researcher may not be aware of what is occurring, or may be
influenced by preconceptions and hence selectively seeking out new data to verify the pattern.
Therefore, it helps to review the data a second time to further refine the pattern codes.
The abovementioned points on coding were adopted when interview transcripts were coded
(refer 4.5.2).
Miles et al. (1994) emphasized the importance of data display in qualitative research. Display
refers to a visual format in which information is presented systematically to enable the user to
draw valid conclusions and take appropriate action. Extended, unreduced text alone is not
easy to see as a whole as it is dispersed over many pages. It is sequential, not simultaneous. In

105
addition, it is difficult to look at more than one variable at a time, hence making it difficult to
make comparisons. Displays, in contrast to extended text, improves the chances of drawing
and verifying valid conclusions as the display is arranged coherently to facilitate careful
comparisons; noting of patterns, themes and trends; and detection of differences. The
importance of coherence can be seen when compared analogically to statistical packages such
as SPSS and BMD which display the information that shows the data and analysis in one
place, permits the researcher to see where further analysis may be required, permits easier
comparison of different data sets and allows direct use of the results in a report which
subsequently improves the credibility of the conclusions drawn. Looking at displays helps the
researcher to see patterns and themes. Analytic text is then written up which clarifies and
formalizes these initial findings, helps explain the display, and may lead to additional
comparisons that can be made via the display. These new comparisons may then lead to the
discovery of new relationships and possible explanations. The subsequent analytic text, which
is essentially a reanalysis, helps deepen the earlier explanations.
One category of display formats is matrices which are essentially the crossing of two or more
main dimensions or variables with defined columns and rows to see how they interact (Miles
et al. 1994). There are no fixed rules for building a matrix although Miles et al. (1994)
provided some guidelines. For example, limit the number of variables in the rows or columns
to about five or six, and strive for a one-page display otherwise there will be too many data to
see at one time. The data entries can be in different forms such as quotes, phrases,
abbreviations or short blocks of text. The appropriate display format will be driven by the
research questions involved and the concepts developed by the researcher which are usually in
the form of codes. The formats may have to be revised and improved on as the research
progresses. Displays can be adapted to suit the research. For example, a matrix can have its
columns and rows arranged to draw together items which relate to each other. This can be
done in two ways: either conceptually where the items derive from the same theory or relate
to the same theme, or empirically where informants give similar answers to different
questions. However, the underlying principle is conceptual coherence. There are many
possible types of columns and rows. Miles et al. (1994) provided examples adapted from
Lofland et al. (1984) and Bogdan et al. (2003) such as the size of the social unit:
• roles – doctors, nurses, administrators, patients;
• settings – emergency room, cafeteria, operating theatre; and
• sites as wholes – Good Samaritan Hospital.

106
Where there are several conceptually or empirically related research questions, a simple
conceptually clustered matrix that can be built is an informant-by-variable matrix (Miles et al.
1994). A matrix can also allow for comparisons between different types of informants so that
it is conceptually ordered as well as role-ordered (Miles et al. 1994). This matrix can then be
used to assist in drawing conclusions. Reading across the rows provides a profile of each
informant and an initial test of the relationship between the different questions and the
corresponding responses. This is an example of using the tactic ‘noting relations between
variables’. Reading down the columns involves the tactic of ‘making comparisons’ between
responses to the different research questions of different individual informants. This was done
in 4.5.2 where responses from interviewees to similar questions were presented side-by-side
in the same matrices.
Miles et al. (1994) argued that it is important when seeking explanations or causality to be
aware of whether the explanations are plausible (do they make sense or not), and of the
fallibility involved. This applies, for example, when exploring whether improving
environmental performance can lead to improved financial performance (or vice versa).
Awareness of the concept of causality and / or explanation helps in understanding whether an
improvement in plant efficiency can lead to a reduction in GHG emissions as well as increase
the case study company’s profit. Gilovich (1991) argued that people tend to read too much
into ambiguous data, misperceive and misunderstand data, and usually end up with biased
interpretations because they see only what they want to see. Explanation is defined in the
Cambridge University Press dictionary (2006) as the details or reasons given to make
something clear or easy to understand. Causality relates to the principle that there is a cause
(or reason) for everything that happened, that there is a link or relationship between two
things whereby one causes another (Miles et al. 1994). In determining causality, Miles et al.
(1994) referred to Sir Austin Bradford Hill (1965) for ideas on how to evaluate whether there
is a causal link represented in an observed association:
• strength of the association;
• consistency;
• specificity (for example, is there a specific link between improving plant efficiency
and reducing GHG emissions?);
• temporality (A comes before B, and not the other way around);
• plausibility; and
• experiment (change A and observe what happens to B).

107
The causes of events are generally multiple (Abbott 1992) and conjunctural (Ragin 1987) in
that they combine and affect each other in addition to the effects. Furthermore, different
combinations of causes may have similar effects, and the effects of multiple causes may not
be the same in all contexts. Therefore, the researcher needs to consider the causes as well as
the effects. Time is a crucial consideration when viewing causality. As stated by Abbott
(1992), events tend to be arranged in a causal order whereby every event may have several
narrative antecedents as well as consequences. In addition, Miles et al. (1994) argued that
assessing causality requires retrospection because the effects can only be known afterwards.
Understanding causality involves the identification of concepts and observing their interaction
including the flow of connected events in context.
Miles et al. (1994) believed that getting feedback from informants is a logical source of
corroboration. Blumer (1969) argued that an observant and alert actor (informant) in the
setting is bound to know more about the realities being researched than the researcher ever
will. Denzin (1978) argued that it follows that informants can act as judges in evaluating the
findings of the research. However, Guba et al. (1981), as cited in Miles et al. (1994), provided
some possible reasons why informants may disagree with the interpretations or conclusions of
the researcher as follow:
• informants are humans too and therefore make mistakes and may be incapable of
detecting them in later reviews;
• the informant is unfamiliar with or does not understand the information (for example
due to the jargon used);
• the informant thinks the information is biased or it is not the way the informant
would have construed the same information;
• the information conflicts with the informant’s beliefs or values; or threatens the
informant’s self-interests.
Therefore, it is important to triangulate (Miles et al. 1994) and this was done (refer Table 4.1).
In addition, Miles et al. (1994) cited Miles, Calder, Hornstein, Callahan and Schiavo (1966)
on the importance of suggesting problem-solving ways when feeding back to the informants
and this may help overcome the problems highlighted above. Taking this into consideration,
the researcher ensured that the interviewees were assured at the start of the interviews that the
purpose of the research is to explore ways of improving the accounting system rather than to
find fault with anyone.

108
Yin (2003) identified four principles for ensuring a high quality analysis. Firstly, the analysis
should demonstrate that as much relevant evidence as available was collected and that all that
evidence had been attended to including the development of rival hypotheses or alternative
interpretations. Miles et al. (1994) argued that the researcher should also look for outliers,
negative evidence and weigh the evidence. Since there are usually exceptions in any given
findings, looking for outliers and finding the reasons for the exceptions can test and
strengthen the findings, protect against self-selecting bias and may help build a better
explanation (Miles et al. 1994). Outliers can be people, discrepant cases, unusual events,
atypical settings or unique treatments (Miles et al. 1994). Looking for negative evidence
involves the researcher checking whether any data oppose or are inconsistent with the
preliminary conclusion. Reconsideration of the preliminary conclusion would depend to an
extent on the proportion of negative to positive evidence. This tactic is different from looking
for outliers which merely refines rather than refutes what the researcher believes to be true.
In weighting the evidence, there are three factors to consider (Miles et al. 1994). Data from
certain informants tend to be better because that informant may be knowledgeable in the areas
of concern to the researcher, or is articulate and reflective. Another factor is that the quality of
the data may have been strengthened or weakened due to the circumstances in which the data
were collected (Becker 1970). Data that would be considered to have stronger quality tend to
have been collected later or after several attempts, reported or seen firsthand, collected in
informal settings, and when the informant was alone with the researcher.
The last factor to consider is the researcher’s validation efforts such as checking for
researcher’s effects (Miles et al. 1994). The researcher effect arises because the presence of
the researcher, being an ‘outsider’, may create social behaviour in the people in the case (the
‘insiders’ or ‘locals’) which would otherwise not have occurred ordinarily and may lead to the
researcher making biased observations and inferences. There is the risk that informants may
craft their responses so that they are amenable to the researcher to protect their self-interests,
for fear that the researcher may find out too much et cetera. Or, because the researcher tends
to spend enough time on the case such that they become part of the local landscape, the
researcher may accept the taken-for-granted or agreed-upon version of the locals. To avoid
the researcher effect, the following measures can be taken (Miles et al. 1994):
• make the intentions of the research unequivocal to the informants: what the purpose
of the research is, why the researcher is there and how data will be collected and what
will be done with the data;

109
• triangulate;
• include people at lower levels or at the peripheral of the research as informants;
• where possible, include people who have different viewpoints from the mainstream
such as dissidents;
• if there is a sense of being mislead, try to find out why an informant would want to
mislead; and
• stay focused on the research questions and not be too sentimental or emotional.
Secondly, the analysis should address all major rival interpretations if possible (Yin 2003). Is
there any evidence to support an alternative or rival explanation? If not, should this be
investigated in future research (Yin 2003)? Where there are several possible rival
explanations, the most plausible and empirically-grounded explanation should be selected
(Miles et al. 1994)
Thirdly, the analysis should focus on the most important aspect of the case study which
should preferably have been defined at the start of the research (Yin 2003). Avoiding the most
significant issue may give the impression that this avoidance was because of negative findings.
Fourthly, the researcher should use his or her own previous expert knowledge in the case
study, in addition to demonstrating awareness of current thinking (Yin 2003).
3.6 Ethical considerations
Written approval was obtained from the RMIT University Business Human Research Ethics
Sub-Committee before the research was undertaken. The next step was to request for access to
information from the cogeneration (case study) company. A letter with RMIT University
letterhead was sent to the case study company, outlining the nature and scope of the research.
Written approval, on condition that the identity of the company is kept anonymous, was
subsequently granted by the cogeneration company, signed by the Operations Manager.
Prior to conducting the interviews, consent to be interviewed was obtained from the
interviewees using the consent form prescribed by the RMIT University Business Human
Research Ethics Sub-Committee. In addition, interviewees were given the options to have
their interviews audio taped, and to remain anonymous.

110
3.7 Report writing
According to Miles et al. (1994), designing and writing reports is analysis and hence should
not be separated from analysis. A conventional reporting format may include, in general, a
statement of the problem, the research questions, a discussion of the conceptual framework to
be designed or involved where applicable, the research methodology, data analysis and
conclusions. Proper documentation of what was done and how is essential since it provides an
audit trail (Miles et al. 1994).
In writing a report, Lofland et al. (1984) suggested explaining the research from inception,
relations with informants, data collection and data analysis, through to retrospective learning.
Miles et al. (1994) suggested documenting the research questions or hypotheses, the methods
adopted, data types, and how the questions or hypotheses were confirmed. Pitman and
Maxwell (1992) suggested that a description of the data collection and data management
system (database) and how it was produced be documented, together with the coding system
as well as data displays. These were done in Chapter 4.

111
Chapter 4
DATA COLLECTION AND ANALYSIS
4.1 Introduction
The data collected were predominantly through participant observation, documentation and
interviews as discussed in Chapter 3. Participant-observation rather than direct observation
was an applicable source of evidence since the researcher is the Accounting Manager. The
three sources of evidence, namely, documentation, archival records and physical artifacts,
were placed under one category for the purpose of this research. In this chapter, it is shown
what data were collected, as well as why and where and when data were collected wherever
possible. Data collection and analysis were done concurrently as recommended by Miles et al.
(1994).
4.2 Triangulation
Triangulation was an important aspect in the collection of data as the data had to be
corroborated. A summary of how data were triangulated is set out in Table 4.1.

112
Table 4.1: How the triangulation was done
Source of evidence Data collected
Documentation, archival records and physical artifacts
Participant observation
Interviews
The cogeneration process including plant operating parameters.
The cogeneration contract including the project manuals. Training manual. Energy audit report. Cogeneration handbook etc.
Obtained during course of work including discussions with operations and maintenance staff. Tour of the cogeneration plant.
Obtained from interviewees including the plant operator.
The accounting system including the recording of monetary (financial) information.
Budgets, monthly management accounts and annual financial accounts.
The researcher in his role as the Accounting Manager for the case study company.
Not applicable since the researcher is the Accounting Manager.
Recording of physical quantities of the commodities which are gas, water, steam, and electricity.
Spreadsheet of actual physical quantities of commodities as prepared by the Plant Engineer for input into the annual budget by the Accounting Manager (researcher). Meter readings attached to invoices.
Physical quantities multiplied by the rates to calculate the monetary amounts owed to or owing by the company.
Obtained from interviewees including the Plant Engineer and the Operations Manager.
The link between plant efficiency and GHG emissions.
Energy audit report. Cogeneration handbook etc.
Obtained through informal discussions with the Plant Engineer and the Operations Manager pursuant to the formal interviews so as to improve understanding.
Obtained from interviewees specifically the Plant Engineer and the Operations Manager
Quality of commodities – gas, water, condensate, steam and electricity.
The cogeneration contract including the project manuals. Training manual etc.
As above. As above.
Existing and future regulatory requirements (including legislative requirements).
EPA licence report. Emission Inventory Report: National Pollutant Inventory. Websites of regulatory bodies for water, gas, electricity and the EPA. EcoGeneration magazine The Age newspaper
As above Through informal discussions and correspondence with EPA officers.
As above.

113
4.3 Participant observation
The researcher is an Australian chartered accountant and the Accounting Manager for the case
study company and has been in this full-time position since 2003. As the Accounting Manager,
the researcher is responsible for the entire accounting function of the company. This includes
preparation of the monthly management accounts, and the financial statements, in particular
the income statement (the profit and loss statement) and the balance sheet, for the fiscal
periods. Reporting to the head office of the parent entity is done monthly whereby the year-to-
date accounts are emailed to the relevant personnel, discussed via teleconference and the final
accounts emailed with any adjustments where applicable. In addition, he is responsible for
preparation of the annual budget and five-year forecast, with inputs from the operations and
maintenance staff especially the Operations Manager and the Plant Engineer such as the
physical quantities of steam and electricity produced, and the quantity of gas consumed. He is
also responsible for liaising with the auditors and ensuring that there are adequate internal
controls in place and acting on the auditors’ recommendations such as sighting fixed assets at
the plants. Furthermore, he is involved in the risk management review of the company
together with the Operations Manager and other relevant staff. He reports directly to the
Operations Manager of the company who is responsible for the overall operations of the
company and, indirectly, to the Commercial Manager of the parent entity.
Prior to this role, the researcher worked for approximately 10 years in various accounting
roles in other organizations including as an auditor in one of the ‘Big 4’ global accounting
firms. This experience as an auditor proved useful in collecting evidence for this research. As
stated in Auditing Standard AUS 108 ‘Framework for assurance engagements’, evidence
needs to be sufficient (the measure of the quantity of evidence) and appropriate (the measure
of the quality of evidence that is its reliability and relevance). The reliability of evidence
depends on its source and its nature. For example, evidence obtained directly by the auditor
through observation is more reliable than evidence obtained indirectly through inference; and
evidence in documentary form is more reliable than oral representation. Hence, triangulation
was used wherever possible to corroborate the evidence.
4.3.1 The accounting system
An off-the-shelf accounting software package is used in the preparation of the accounts. It is
not a fully-integrated ERP system. The accounting software package comprises the general

114
ledger, purchase orders and accounts payable, order entry and accounts receivable and
inventory modules. In addition, it has been modified so that there is a jobs costing module.
Specific operations and maintenance jobs are assigned specific job descriptions and sequential
job numbers. For example, the costs of repairing a leaking deaerator pump are captured under
job number 4123 and linked to a general ledger expense code ‘7750-003’ although one ‘0’
will be deleted. That is, ‘7750-003’ will be shown as ‘775003’. Costs comprise of:
• material costs, being materials purchased from suppliers and consumed immediately,
or inventory withdrawn from the store;
• overheads; and
• labour costs, being internal labour costs such as operations and maintenance
technicians’ time incurred on the job, and external labour costs such as subcontractors’
costs.
However, the accounting software does not have a fixed assets module or an operations and
maintenance module. Therefore, non financial information such as the physical quantities of
gas consumed and electricity generated are not captured in the accounting software. The fixed
assets register is maintained on an Excel spreadsheet. The chart of accounts (refer Appendix 5
for an extract) is configured according to assets, liabilities, revenues, expenses and (other)
equity such as share capital. Expenses are given specific general ledger codes based on the
nature of the expenses, especially in relation to operating and maintenance work. For example,
‘7305’ is for ‘water treatment – chemicals’ and ‘7507’ is for ‘gas compressor – annual
service’ (scheduled maintenance on the gas compressor). There are specific general ledger
codes for expenses incurred in complying with environmental regulations such as ‘7602’ for
EPA licence-related work, and ‘7607’ for ‘EPA testing’. However, the chart of accounts was
not set up specifically with an environmental focus. Furthermore, the company does not use
Activity Based Costing (ABC) and therefore cost drivers have not been identified.
4.3.2 Accounting information
A set of management accounts, which comprise the income (profit or loss) statement and the
balance sheet, is prepared monthly. Before these management accounts are submitted to the
parent company, an analytical review of the income (including electricity and steam revenue)
and expenses (such as cost of goods sold including gas cost) is done. This entails comparison
of the movement from the previous month and against the budget which is set at a plant
availability of 94 percent. The predominant Key Performance Indicator (KPI) used in the

115
accounts is plant availability for the month which is expressed as a percentage of the time that
the cogeneration plant was actually able to operate compared to the total peak operating hours
that the cogeneration plant should be able to operate for the month. In addition, the financial
statements are prepared annually and these are audited by the external auditor.
The budgeted income statement, which shows the budgeted income (profit or loss) statement
for the next financial year, is prepared on an annual basis together with a five-year forecast.
The budget is prepared based on actual physical quantities of the following inputs and outputs
to the cogeneration system over the previous two years, multiplied by the applicable rates.
The five-year forecast is an escalation of the annual budget based on the forecast inflation rate.
This rate is provided by the parent company.
Table 4.2: Inputs and outputs of the cogeneration plant
Inputs into the cogeneration system Outputs from the cogeneration system Inputs Measurement
unit Rate charged by / according to
Outputs Measurement unit
Rate charged by / according to
Natural gas
GJ Energy services agreement (ESA) – cogeneration contract, and gas utility company’s gas sale deed.
Electricity (export)
kWh Cogeneration contract
Electricity (import)
kWh Electric utility companies.
Steam Tonnes Cogeneration contract
Water Tonnes Water utility companies.
Condensate Tonnes Cogeneration contract
Condensate is essentially water from the steam sold to the customers that has condensate and
been returned by the customers to the company to be recycled for the production of steam.
The cost per tonne is calculated based on a formula as specified in the cogeneration contract.
This formula takes into consideration the costs of raw water, sewerage and treatment
chemicals; and the energy lost in the return and extra energy required to reheat the water. The
workings relating to the calculation are shown in the invoice that is issued to the customers
together with the amount of steam sold to them (case study company 2005). The monthly
physical quantities of the abovementioned inputs and outputs are recorded by the Plant
Engineer on a spreadsheet file. The abovementioned inputs and outputs in actual physical
quantities can be obtained from the meter readings.

116
The physical quantities of the inputs (gas and water) and outputs (steam and electricity) are
multiplied by the rates to calculate the financial amounts. The rates for the gas purchased, and
the steam and electricity sold, are escalated annually by the researcher in his role as the
Accounting Manager based on the Consumer Price Index (CPI) as published by the Australian
Bureau of Statistics. Gas rates are calculated according to Clause 3 of the gas supply
agreement, steam rates according to Clause 7.3.4 of the Energy Services Agreement (ESA)
within the cogeneration contract, and electricity rates according to Clauses 7.4.2 and 10 of the
ESA. Water is obtained from water utility companies such as CWW through the customers
and the customers are reimbursed by the company for the water costs. This water is required
to make up for any shortfall in the water (condensate) returned by the customers under Clause
7.3.3 of the ESA. The meter readings of the physical quantities are checked by the Plant
Engineer for reasonableness (within a certain error or deviation range according to the Plant
Engineer).
Steam injection is both an output and input within the cogeneration process (refer Appendix
2). Superheated steam that is produced is injected (back) into the cogeneration process
whereas saturated steam is sold to the customers.
Under the gas sale deed (2003), the supplier of gas, which is related to the case study
company by virtue of it being a subsidiary of the same parent company, does not guarantee
the quality of the gas sold to the company because the quality of gas is affected by many
factors. The quality of gas in Victoria is regulated by VENCorp as discussed in Chapter 2 and
therefore is on a take-as-is basis. As stated in the project manual and as advised by the Plant
Engineer, the only characteristic of the gas that is changed by the company is the gas pressure,
using a gas compressor. There are five components of the gas cost as set out in the gas invoice
(and which are similar to those in the gas sale deed). Energy charges comprise of the
commodity charge, the ‘unaccounted for gas’ (UAFG) charge and any overrun charges.
UAFG is defined as the difference between the quantity of gas injected from the transmission
system via all transfer points and the quantity withdrawn from all distribution supply points in
the distribution system (ESC 2002). This difference could be due to leakage, and
discrepancies arising from metering inaccuracies and variations in temperature and other
parameters. The UAFG benchmark is set by the ESC (2002). Over run charges are incurred
when the gas taken by the company exceeds the maximum daily quantity (MDQ). The MDQ,
as advised by the supplier, is determined in negotiations between the supplier and the
company based on the company’s gas consumption history. Gas distribution charges or tariffs

117
are regulated as are transmission charges and VENCorp fees and charges (refer Chapter 2).
Other charges refer to the operating and maintenance service charge as determined by the gas
distributor(s) such as Envestra Victoria which are regulated by the ESC.
An analysis of the gas cost over two years (for the years ended June 2004 and June 2005),
based on gas invoices issued by the supplier, revealed the approximate average over those two
years of each component charges as a percentage of total gas cost as set out in Table 4.3.
Table 4.3: Components of gas charge as a percentage of total gas cost
Component of gas charge Percentage of total gas cost
Energy charges
• commodity charge;
• unaccounted for gas charge; and
• over run charge.
• over 88 percent
• less than 1 percent
• less than 1 percent Distribution charges Less than 3 percent
Transmission charges
Less than 8 percent
VENCorp fees and charges Less than 2 percent
Other charges which is the operating and maintenance service charge
Less than 1 percent
Therefore, the only significant component is the commodity charge as the other charges are
immaterial, based on a materiality limit of 10 percent of total gas cost. Focus should therefore
be directed initially on whether it is possible to reduce the commodity cost. For the purpose of
this research, any component which comprises less than 10 percent of the total gas cost is not
considered in-depth. Under the cogeneration contract, the initial rate in $/GJ for the gas is set
and then escalated annually based on the CPI movement for the particular year. Clause 8.4.1.2
of the ESA within the cogeneration contract states that the company can source for gas from a
supplier which offers a lower rate than the rate calculated in accordance with the cogeneration
contract and the resultant gas cost savings are then shared equally between the company and
the customers. The rate offered under the current gas sale deed is lower than the rate
calculated in accordance with Clause 3(4) of the gas supply agreement in the cogeneration
contract. Furthermore, the term of that existing gas sale deed expires on the same day that the
cogeneration contract expires. In addition, the quality of gas is determined by VENCorp.
Therefore, the only way to reduce the gas cost is to maximize efficiency by either generating
the same quantity of steam and electricity using less gas (measured in GJ), or by generating
more steam and electricity from using the same quantity of gas.

118
Although air intake is a necessary input into the cogeneration system for combustion to occur,
there is no ‘financial cost’ attributable to it. An attempt was made to quantify and cost the
‘free’ air intake, in particular the oxygen required for combustion, into power generation
systems under a concept termed ‘emergy’ (Brown and Ulgiati 2002). Emergy is measured in
solar emergy joules or solar emjoules since it is assumed that everything originates from the
sun (Odum 1996). However, it has not been widely accepted as is evident from interviews
with the Operations Manager and the Plant Engineer who indicated that they had never heard
of such a concept. It is dubious how various inputs such as materials and energy inputs (for
example, gas) and environmental inputs such as air, all with different characteristics, can be
converted into equivalents of one form of energy expressed in solar emjoules. Emblemsvag et
al. (2001) considered the emergy approach misleading from a performance measurement
perspective although it appears to measure sustainability. This is because nature
(environmental systems) is complex with many peculiar but vital relationships. Therefore,
performance measurement models may need to be grossly simplified so that the required
information for computations can be collected. This simplification may create a lot of
uncertainty (for example, subtle aspects of the ecosystems may either be ignored or not
identified) which can lead to wrong decision making.
4.4 Documentation, archival records and physical artifacts
4.4.1 Application for Works Approval to the Environment Protection Authority for
the Cogeneration Scheme report
The ‘Application for Works Approval to the Environment Protection Authority for the
Cogeneration Scheme’ report (Ewbank Preece Sinclair Knight 19…) gave a description of the:
• cogeneration system;
• operating regimes such as the operating hours for the gas turbine to be during
specified times from Mondays to Fridays, and start up and shut down of the
cogeneration system;
• air emissions;
• noise emissions;
• water discharges; and
• risk assessment of possible plant failures which may pose an environmental hazard
(possible reasons being gas leak and fire).
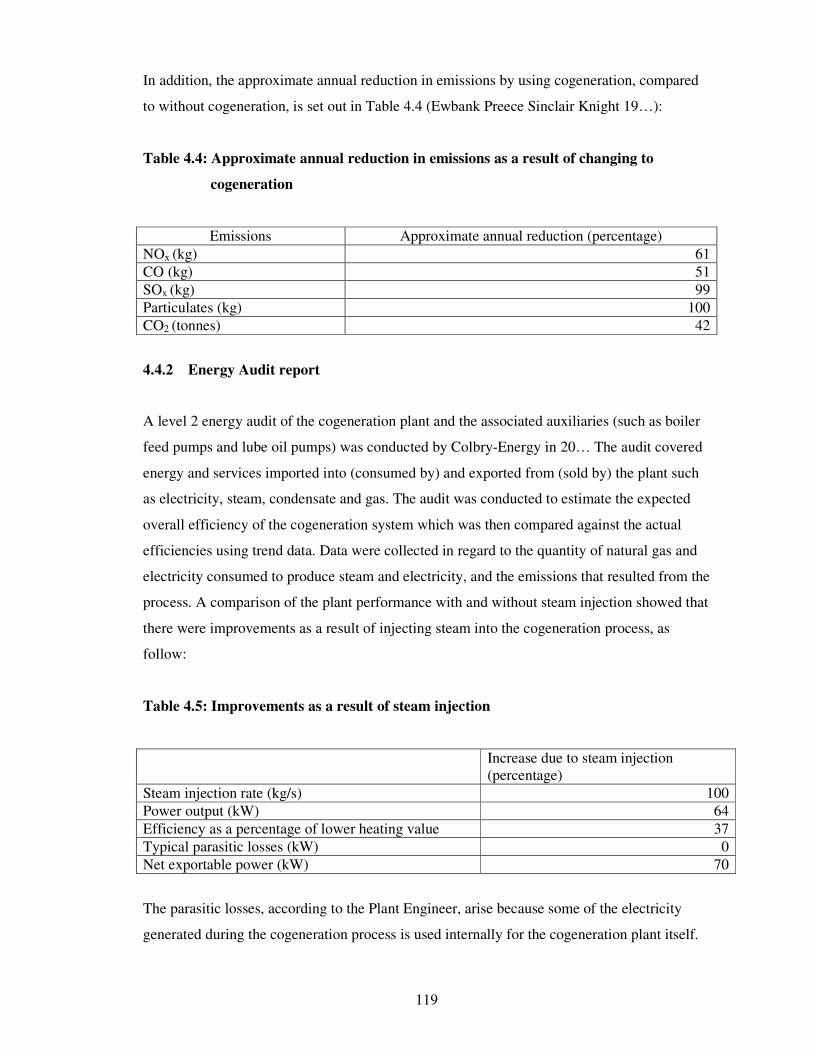
119
In addition, the approximate annual reduction in emissions by using cogeneration, compared
to without cogeneration, is set out in Table 4.4 (Ewbank Preece Sinclair Knight 19…):
Table 4.4: Approximate annual reduction in emissions as a result of changing to
cogeneration
Emissions Approximate annual reduction (percentage)
NOx (kg) 61
CO (kg) 51
SOx (kg) 99
Particulates (kg) 100
CO2 (tonnes) 42
4.4.2 Energy Audit report
A level 2 energy audit of the cogeneration plant and the associated auxiliaries (such as boiler
feed pumps and lube oil pumps) was conducted by Colbry-Energy in 20… The audit covered
energy and services imported into (consumed by) and exported from (sold by) the plant such
as electricity, steam, condensate and gas. The audit was conducted to estimate the expected
overall efficiency of the cogeneration system which was then compared against the actual
efficiencies using trend data. Data were collected in regard to the quantity of natural gas and
electricity consumed to produce steam and electricity, and the emissions that resulted from the
process. A comparison of the plant performance with and without steam injection showed that
there were improvements as a result of injecting steam into the cogeneration process, as
follow:
Table 4.5: Improvements as a result of steam injection
Increase due to steam injection (percentage)
Steam injection rate (kg/s) 100
Power output (kW) 64
Efficiency as a percentage of lower heating value 37
Typical parasitic losses (kW) 0
Net exportable power (kW) 70
The parasitic losses, according to the Plant Engineer, arise because some of the electricity
generated during the cogeneration process is used internally for the cogeneration plant itself.

120
The audit report indicated that the operation of the plant was based on maximizing revenue
and meeting the customers’ steam requirements. This was confirmed by the Plant Engineer
during the interview. In operating the boilers, reliability in meeting contractual requirements
was prioritized at the expense of efficiency because of the financial penalties that would apply
under the cogeneration contractual agreement. In other words, the company chose the best
commercial option for operating and there was no mention of environmental considerations. It
further stated that financial modelling and field tests conducted by the case study company
showed that the most cost effective mode of operation was to operate at the required level of
steam injection and the maximum Calculated Turbine Inlet Temperature (CTIT) to achieve
maximum electricity output. During the audit, it was discovered that overall efficiency
declined when the waste heat boiler (WHB) operated below maximum output. The GJ of
energy exported from the plant in the form of steam and electricity was identified as the
appropriate unit of production. And, the most relevant energy performance indicators for the
plant are:
• the gas turbine heat rate or specific fuel consumption measured in kJ / kWh which is
the energy consumed by the turbine to generate electricity (this was confirmed by the
Plant Engineer); and
• the thermal efficiency for the packaged boilers. However, since the packaged boilers
are generally operated during off peak hours to produce steam only, this does not
meet the definition of cogeneration, strictly speaking. It follows that the thermal
efficiency of the packaged boilers is outside the scope of this research.
The gas turbine performance varies depending on where the turbine is in its maintenance
schedule cycle. This is consistent with the statements by the Operations Manager and Plant
Engineer during the interviews that the efficiency of the plant can be increased with
appropriate and timely maintenance.
Determining the overall efficiency of the cogeneration plant is complicated because the
operating conditions can vary and are interrelated. The expected overall efficiency of the plant
was calculated under various operating conditions, as follow:
• under design conditions such as steam injection at the specified rate (kg/s);
• corrected for actual parasitic losses;
• adjusted for actual condensate return and temperature;
• corrected for steam injection rate (kg/s);
• corrected for steam flow to deaerator and boiler blow down; and

121
• adjusted for deaerator steam flow at the upper range.
However, it was found that the plant’s efficiency was particularly sensitive to the steam
injection rate and steam flow. The energy audit found that the actual overall efficiency of the
case study company’s cogeneration system, which was less then 50 percent, approximated the
estimated efficiency with a variance of less than one percent.
A comparison of the cogeneration plant performance with best practice revealed that the
cogeneration plant is a Cheng cycle cogeneration system which operates in full steam
injection mode for the purpose of generating maximum power output. It was found that the
501-KH gas turbine had the highest performance in the kW range of turbines applicable to the
case study company in terms of the lowest heat rate. Furthermore, site testing confirmed that
the most energy efficient operating mode was by controlling the induct burner firing rate to
maintain the WHB at its rated output when the cogeneration plant was operating. This would
result in minimum steam production by the package boilers.
The energy auditor recommended that where the overall efficiency of the cogeneration plant
was found to be poor, the reason for this be identified. Another recommendation was that a
variable speed control be installed in the water feed pumps to decrease the recirculation flow
when the cogeneration plant is not operating. The payback period is approximately 11 years
based on the estimated annual savings and implementation costs. It should be noted, however,
that this payback period extended past the life of the cogeneration contractual agreement
which will expire in less than five years’ time, thus making it not financially viable. The
replacement of existing motors with high efficiency motors was also considered and deemed
not cost effective based on the payback approach. Therefore, the recommendation was for the
company to continue with its current policy of replacing failed motors beyond economic
repair with motors which complied with AS/NZS 1359.5:2000 (2000). The discounted cash
flow method was not considered appropriate for the company since the cogeneration contract
will expire in less than five years’ time.
4.4.3 EPA licence report
A waste discharge licence, which is applicable to premises where electricity is produced by
turbines with waste heat recovery boilers, was issued to the company by the EPA in 19…
(amended in 2001 and 2004). It allows the licence holder, being the company in this case, to

122
discharge waste to the environment subject to certain conditions as stated in the attachment to
the licence. The company is required to adhere to the following objectives on environmental
protection:
• comply with environmental quality requirements such as:
o the Environment Protection Act (1970);
o state environment protection policies pertaining to:
§ air quality management;
§ waters of Victoria;
§ ground waters of Victoria;
§ noise from commerce, industry and trade; and
o industrial waste management policies. In particular, Industrial waste
management policy (Waste Minimization);
• operate according to good environmental practice; and
• continuously improve environmental performance including minimizing waste
whenever the opportunity arises.
The licence is structured as follows:
• waste management – states the general conditions in which wastes may be discharged
to the environment;
• operational controls – specifies the requirements for good environmental protection
and waste management under both normal and plant disruption scenarios;
• monitoring and reporting – lists the requirements for monitoring and reporting; and
• plan of premises – an outline of the premises including discharge points.
The discharge requirements, measured as minimum velocity in m/sec; and the emission limits,
which are measured as maximum rate (g/min) and maximum concentration (mg/m3) for the
company are specified in the licence. The relevant compounds are NOx and carbon monoxide.
The company is not permitted to discharge more than a specified quantity of NOx and carbon
monoxide (measured in tonnes) to the environment annually.
The EPA can request the company to test the wastes discharged in accordance with EPA
Publication No 440 ‘A Guide to the Sampling and Analysis of Air Emissions’ (replaced since
then with 440.1 ‘A Guide to the Sampling and Analysis of Air Emissions and Air Quality)’ at

123
an adequate frequency. This is to determine compliance with the licence. Information that
must be collected for all tests is, as follows:
• nitrogen oxides concentration and mass flow rates;
• carbon monoxide concentration and mass flow rates;
• gas velocity and volume flow rate;
• temperature;
• water vapour and oxygen concentrations;
• natural gas consumption rates for each of the turbine, boiler and supplementary burner;
• steam injection rate; and
• turbine power output.
Furthermore, a written report is required to be submitted by the company by 1 October each
year. The report should detail:
• the turbine’s total actual operating hours;
• the turbine’s estimated operating hours for the next one to two years; and
• a request for the licence fee to be reviewed should the hours vary by more than 10
percent.
Contravention of the requirements of the licence may result in the imposition of a fine or
penalty of up to $240,000 under section 27(2) of the Environment Protection Act.
A copy of the report submitted to the EPA dated September 2005 was obtained and it was
noted that the report comprised of a cover letter from the company stating that the discharge
requirements and emission limits have been complied with, and that all the information
pertaining to the testing have been furnished in the attachments. The attachments are as follow:
• a ‘Summary of Performance Monitoring – Air Emissions’ and
• a report from a National Association of Testing Authorities (NATA) accredited
consultant regarding the tests performed to determine NOx and carbon monoxides
emissions to air. The report sets out the plant operating conditions, sampling plane
requirements and observations, test methods, deviations from the test methods of
which there were none, and the results of the tests.
A review of the invoice dated September 2005 from the consultant for emission testing at the
plant showed that the cost of conducting the test was less than $2,000.

124
Package boilers were not subjected to emissions testing under this licence although there are
licence limits set by the EPA specifically for package boilers. However, the Operations
Manager advised that package boilers are generally used during off peak hours when the
cogeneration plant is not operating unless the WHB is not operating due to failure or
maintenance. Therefore, in general, it does not fall within the scope of this research.
4.4.4 Emission Inventory Report: National Pollutant Inventory report
The annual Emission Inventory Report: National Pollutant Inventory (2005) showed the total
quantity of gas consumed in PJ and the plant availability in percentage. It also showed the
emission factors for each substance emissions such as carbon monoxide and oxides of
nitrogen and the calculated emissions, measured in tonnes. The Operations Manager advised
on 11 July 2006 that the emissions for the listed substances were calculated by the Plant
Engineer based on the emission factors provided by the EPA. This advice was verified against
the company’s NPI reports for the years ended 30 June 2004 and 2005 which showed that the
emission estimation technique used was emission factors.
4.4.5 Cogeneration contract
The cogeneration contract is a comprehensive set of agreements relating to the cogeneration
project. These include the Energy Services Agreement (ESA), the construction agreement,
cogeneration site leases, the electricity supply and purchase agreements, the gas supply
agreements, and amendments. Cogeneration plant as defined expressly excludes the packaged
boilers.
Cogeneration is defined in the Conditions of Contract under the electricity supply and
purchase agreements within the cogeneration contract as the combined production of
mechanical or electrical power and useful heat from the same primary fuel source.
Under Clause 4 of the ESA within the cogeneration contract, the company is required to
comply with all government regulations during the term of the cogeneration contract whether
at the federal, state or local government level. This responsibility includes obtaining permits,
licences, exemptions and other governmental approvals where necessary. Where a carbon tax
or a similar tax is introduced pertaining to the emission of GHG caused by the usage of fossil
fuel such as gas, that proportion of any increased operating cost which would have been

125
incurred by the customers if not for the cogeneration plant can be passed on by the company
to the customers.
Clause 7.3 of the ESA within the cogeneration contract states that the steam to be supplied to
the customer and the condensate from the steam to be returned by the customer should be in
the condition specified in the project manuals.
Broadly speaking, Clause 14 of the ESA within the cogeneration contract allows the customer
to terminate the cogeneration project should the company continually fail to deliver electricity
and steam as required under the cogeneration contract and the company has not rectified this
failure.
Under Clause C of the electricity supply and purchase agreement, the customers are required
to purchase all the electricity generated by the cogeneration plant. Clause 3 states that the
electricity should be at a frequency of 50 hertz in the alternating current form. In addition, the
calculation of distortion limits such as voltage fluctuations, harmonic distortion and voltage
unbalance are stated in the agreement. The power factor limits are also set out in this
agreement as between 0.95 lagging and 0.95 leading when the cogeneration plant is connected
to the grid, and between 0.8 lagging and unity when disconnected. Failure to meet the
abovementioned power factor and distortion limits may result in the cogeneration plant being
disconnected from the grid until the fault has been rectified.
Clause 12 of the electricity supply and purchase agreement spells out the minimum
performance requirements and data required by the (former) State Electricity Commission of
Victoria (SECV), which has since been privatized, for the cogeneration project, as follows:
• a minimum efficiency of 25 percent. This means that at least 25 per centum of the
energy content of gas (the primary fuel source) should be recovered as useful heat.
The energy content of the fuel shall be calculated as the fuel quantity multiplied by its
lower calorific value. Waste heat from the cogeneration plant which is re-injected into
the cogeneration plant to control the emission of NOX shall be regarded as recovery of
useful heat;
• reporting of energy usage includes:
o the amount (MJ) and type of energy consumed for generation;
o the quantity of useful heat produced which may be estimated if it is not easily
measured. This should exclude any discarded heat;

126
o the total quantity of electricity generated by the plant (in kWh) both for plant
use and exported (or sold) to customers; and
o the peak period availability.
Clause 17 of the cogeneration site lease within the cogeneration contract spells out the
company’s responsibilities in regard to demolition, removal and restoration. Essentially, it
states that the company is required to remove the cogeneration plant and restore the
customers’ premises to a safe and clean condition upon termination of the contract. An
external consultant was engaged to assist in the valuation of the provision for removal of the
cogeneration plants from the sites and a report issued by that consultant dated 2005 which was
sighted by the researcher.
The customer has the right to terminate the cogeneration contract under Clauses 13.1 and
14.1.1 of the ESA should the company default in the provision of electricity and steam in
accordance with the requirements of the cogeneration contract.
4.4.5.1 Cogeneration contract - Project Manual (part of the construction agreement
under the cogeneration contract)
Clauses 7.3.1 and 7.3.2 of the cogeneration contract refer to the project manuals in regard to
the quality of steam and condensate. Clause 8.7 of the project manuals states that the quality
of steam provided to the customer is affected by the steam pressure (bar), temperature (oC),
wetness (in percentage), and the level of contaminants which comprise total dissolved solids,
suspended solids, silica, alkalinity, sulphite and phosphate (extremely small amounts, though,
since the unit of measurement is in parts per million). In addition, the minimum and
maximum instantaneous steam demands limits are set (measured in kg/hr), at specified
enthalpy (h) (measured in kJ/kg) at all times.
Clause 4.1 of the project manuals states that the steam should be re-injected at a specified rate
(measured in kg/s).
Under Clause 8.2 of the project manuals, the condensate that the customer is required to
return to the company should possess certain quality characteristics such as the minimum and
maximum temperature, the maximum conductivity and water hardness levels, and a maximum
amount of contaminants such as silica.

127
Clauses 4 and 12 state that the performance of the plant at 15oC and ISO3977 should be as
follows:
• maximum generator power able to be produced by the cogeneration plant (measured in
kW);
• WHB power output in MW;
• gas compressor flow rate in kg/sec; and
• water treatment plant flow rate at a certain flow rate in m3 per hour.
Therefore, this implies that the performance of the existing cogeneration plant cannot be
improved unless there are additional capital works to install newer improved technology.
Furthermore, Clause 8.6 states that the electrical substation capacity should be within the
limits allowed by the Rules (refer to Chapter 2) which are as follows:
• capacity (MVA);
• nominal voltage (V); and
• nominal frequency (Hz).
Under Clause 4, the natural gas pressure from the mains would need to be compressed to a
certain pressure, measured in kPa (g), before combustion in the cogeneration plant.
Under Clause 8.5, the discharge of water from the boiler in the cogeneration plant to the
sewer should be at five percent. Effluents would contain treatment chemicals used in the
cooling towers, boiler etc.
Clause 10 states that emissions of CO are not generally a concern for this particular gas
turbine.
4.4.5.2 Cogeneration contract - Annexure A: Performance criteria, tests and damages
(part of the construction agreement)
Under Clause C of the construction agreement within the cogeneration contract, the turnkey
project manager was responsible for the satisfactory performance of the cogeneration plant to
supply thermal and electrical energy to the customer. The satisfactory performance criteria are
set out in ‘Annexure A: Performance criteria, tests and damages’ of the construction
agreement within the cogeneration contract as follows:

128
• the net electricity power (that is, less parasitic loads) available for export to the
customer or to the electricity gird measured in kW;
• gas consumption at the gas turbine and supplementary firing burner required to
generate the guaranteed net electricity power and output from the WHB in GJ/h
(based on higher heating value). The output from the WHB is calculated by
multiplying the specific enthalpy with the steam mass flow;
• efficiency of the package boilers as a percentage of the higher heating value;
• peak period availability (or reliability) in percentage;
• the maximum residual oxygen content in the boiler feed water leaving the deaerator;
• the minimum cooling effectiveness of the evaporative cooler measured in percentage;
• the steam injection quality and specifically the level of contamination of total
dissolved solids and sodium; and
• the performance of the water treatment plant based on the nominal quality of town
water supplied to that site. In particular, the quality in terms of water hardness and
suspended solids; and the average rate of output of treated water.
4.4.6 Internal reporting - Generation Group Performance Report
A “Generation Group Performance Report” is currently submitted monthly to the parent
company as advised by the Operations Manager. A review of the May 2006 report by the
researcher indicated that the report covered plant availability (percentage), plant downtime
(when the plant is not operating due to various reasons such as mechanical failure), steam
outages (when there is steam production failure), electricity outages (electric power failure),
other issues relating to plant operations and maintenance such as the purchase of major spare
parts, and plant safety performance. There was no specific section on environmental matters.
This contrasts with previous years’ monthly reporting to the parent company where a
cogeneration project monthly report was submitted which had a specific section on
environmental issues. The Operations Manager informed the researcher on 30 June 2006 that
this report was discontinued in mid-2005 with a change of management personnel in the
parent company and that the only monthly report currently submitted to the parent company is
the Generation Group Performance Report.

129
4.4.7 External reporting - Annual Report for Victorian State Government Department
The company also submits an annual report to a Victorian state government department. The
report covers plant performance, financial performance, industrial relations, occupational
health and safety, contractual or commercial, business development and customer-related
issues. In addition, historical and current operational data relating to the plant are included in
the report. The historical data include both physical and monetary information pertaining to
steam and electricity produced and gas consumed as required under Clause 5.6.2 of the ESA.
The physical quantities of steam, electricity and gas are quoted in tonnes, MWh and GJ,
respectively. Information in regard to the plant performance pertains to the plant’s
performance criteria as required under Clause 5.6.2 of the ESA, and specified under Clause 6
(and the schedule) of the amended agreement to the cogeneration contract. The performance
criteria relate to the following:
• plant availability every quarter;
• minimum steam pressure every quarter as prescribed in the relevant project manual;
• the number of unsuccessful annual plant demonstrations when requested by the
particular customer. Plant demonstration refers to the demonstration of the capability
of the cogeneration plant to supply steam and back-up electrical energy to the
customer pursuant to the complete failure of the grid;
• the number of unsuccessful change-over to island mode every quarter. Change-over to
island mode is required when it is not possible for the cogeneration plant to connect
with the electricity grid. Rather, it needs to operate in isolation from the grid to ensure
continuity of electric power to the customer when the external supply of electric power
from the grid to the customer is interrupted for whatever reason; and
• the time taken to restore the plant’s availability every quarter.
The schedule also lists the penalties that can be imposed on the company should it fail to meet
these criteria.
4.4.8 Press releases
In a media release issued on 31 August 2006 by the Minister for Energy, Industries and
Resources, and the Minister for the Environment, it was stated that a new cogeneration plant,
a joint venture between two companies, would reduce GHG emissions due to the more
efficient production of steam and electricity.

130
4.5 Interviews
4.5.1 Interview approach
Interviews were conducted with the relevant personnel to obtain an understanding of the case
study company’s operations including matters relating to efficiency and GHG emissions.
Table 4.6 summarises details of the interviews undertaken for this research.
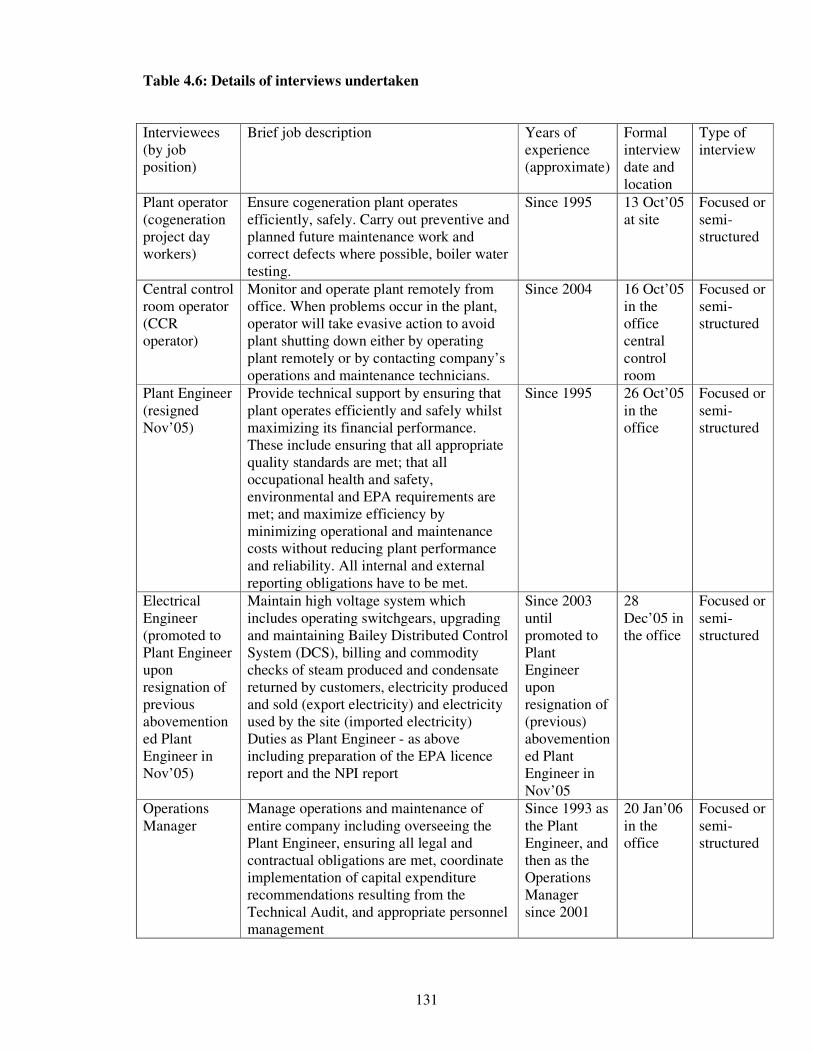
131
Table 4.6: Details of interviews undertaken
Interviewees (by job position)
Brief job description Years of experience (approximate)
Formal interview date and location
Type of interview
Plant operator (cogeneration project day workers)
Ensure cogeneration plant operates efficiently, safely. Carry out preventive and planned future maintenance work and correct defects where possible, boiler water testing.
Since 1995 13 Oct’05 at site
Focused or semi-structured
Central control room operator (CCR operator)
Monitor and operate plant remotely from office. When problems occur in the plant, operator will take evasive action to avoid plant shutting down either by operating plant remotely or by contacting company’s operations and maintenance technicians.
Since 2004 16 Oct’05 in the office central control room
Focused or semi-structured
Plant Engineer (resigned Nov’05)
Provide technical support by ensuring that plant operates efficiently and safely whilst maximizing its financial performance. These include ensuring that all appropriate quality standards are met; that all occupational health and safety, environmental and EPA requirements are met; and maximize efficiency by minimizing operational and maintenance costs without reducing plant performance and reliability. All internal and external reporting obligations have to be met.
Since 1995 26 Oct’05 in the office
Focused or semi-structured
Electrical Engineer (promoted to Plant Engineer upon resignation of previous abovementioned Plant Engineer in Nov’05)
Maintain high voltage system which includes operating switchgears, upgrading and maintaining Bailey Distributed Control System (DCS), billing and commodity checks of steam produced and condensate returned by customers, electricity produced and sold (export electricity) and electricity used by the site (imported electricity) Duties as Plant Engineer - as above including preparation of the EPA licence report and the NPI report
Since 2003 until promoted to Plant Engineer upon resignation of (previous) abovementioned Plant Engineer in Nov’05
28 Dec’05 in the office
Focused or semi-structured
Operations Manager
Manage operations and maintenance of entire company including overseeing the Plant Engineer, ensuring all legal and contractual obligations are met, coordinate implementation of capital expenditure recommendations resulting from the Technical Audit, and appropriate personnel management
Since 1993 as the Plant Engineer, and then as the Operations Manager since 2001
20 Jan’06 in the office
Focused or semi-structured

132
In selecting the employees of the case study company to interview, the researcher relied on
his knowledge and experience from working in the company, and from discussions with the
Operations Manager. Interviews were conducted with all levels of staff from the bottom of the
company hierarchy (plant operator and central control room operator) up to the engineers
(Plant Engineer and Electrical Engineer) and management (Operations Manager). A copy of
the organization chart is attached in Appendix 6. The reasons for this approach were as
follows:
• interviews with non-management staff were conducted to corroborate (or otherwise)
management’s representations to further strengthen the data obtained. For example, if
management, say the Operations Manager, states that emission tests are done at the
plant, the plant operator should be aware that the tests were conducted, or at least that
whoever did the tests was there. Another example would be if management requires
certain information pertaining to efficiency and emissions which may need to be
collected and prepared by the plant operator. Any differences would be investigated
as they may lead to new information;
• to obtain insights and opinions from different people. Diverse views may lead to new
information; and
• to get an idea of the corporate culture in regard to the environment, especially in
relation to EMA.
Data obtained from the engineers, being the Operations Manager, the Plant Engineer and the
Electrical Engineer, especially in regard to technical matters, were regarded as more reliable
than data obtained from the plant operator and the central control room operator due to their
technical qualifications and experience.
The operations and maintenance technicians were not interviewed as their duties were
predominantly related to carrying out physical maintenance work at the plant. The other
employees that were not interviewed were as follow:
• administration staff;
• operations and maintenance supervisor; and
• controls engineer.
The other employees were not interviewed as the data that could be collected from the
interviewees, who provided a good representation of the case study company, and from other
sources such as documentation and archival records, were deemed sufficient by the researcher

133
in his role as the Accounting Manager, and the Operations Manager. Besides, conducting too
many interviews may cause disruption to the company’s operations, in addition to the cost
incurred by the company and to those employees for taking up their time. Given that the
company’s total number of employees is 40, interviewing five of those employees as well as
the researcher being the Accounting Manager means that more than 15 percent of the
company’s workforce provided data for this research.
A focused or semi-structured interview style was adopted as suggested by Minichiello et al.
(1995). This type of interview ensured that the research questions were asked, where
applicable, and at the same time allowed for flexibility in following up on new information. A
questionnaire was designed for the interviews and a copy is attached in Appendix 7. The
questionnaire was drafted to ensure that the research questions were asked and was meant to
serve as a guide. Care was taken during the interviews to ensure that the interviewer’s
opinions were not given to avoid any possible influence on the interviewees. In addition,
interviewees were encouraged to speak for most of the time, by prompting them with
questions, as the purpose of the interviews was to collect data. How the interviews were
recorded is shown in Table 4.7.
Table 4.7: Interview recording methods
Interviewees (by job position) Data recording
Plant operator Recorded on tape, transcribed by a paid typist and then checked by researcher, reviewed by interviewee and amendments made accordingly.
Central control room operator Recorded on tape, transcribed by a paid typist and then checked by researcher, reviewed by interviewee and amendments made accordingly using copy of the transcript which interviewee wrote the amendments on.
Plant Engineer Recorded on tape, transcribed by a paid typist and checked by researcher. The interviewee did not check the transcription because he had resigned by then.
Electrical Engineer / Plant Engineer
Notes taken by hand and then typed by researcher, reviewed by interviewee and amendments made accordingly using copy of the transcript which the interviewee wrote the amendments on.
Operations Manager Notes taken by hand and then typed by researcher, reviewed by interviewee and amendments made accordingly using copy of the transcript which the interviewee wrote the amendments on.
Where possible, interviewees were asked to review transcripts of their interviews and to write
down any amendments on the transcripts. This ensured that the interviews were transcribed
correctly and gave interviewees a second chance to evaluate and, if necessary, modify what

134
they had said during the interviews. Their handwritten notes serve as (further) proof that the
interviews were bona fide, not fictitious.
Data obtained from the interviewees were triangulated with other sources of data where
possible. Their job positions and descriptions, and the dates they commenced employment
with the company, were verified against their individual ‘offer of employment’ letters, and
against the enterprise agreement (EBA) (applicable to the plant operator and the central
control room operator only).
In addition to the abovementioned interviews, advice was sought throughout the research
from the Operations Manager and the Plant Engineer in regard to technical (engineering et
cetera) details and also to gain a better understanding of the operations of a cogeneration plant.
Furthermore, verbal and written (in the form of emails) advice were obtained from an EPA
Greenhouse Project officer and an NPI project manager to clarify or confirm information on
the EPA website in regard to EPA regulations including the NPI.
As the Accounting Manager of the company, the researcher also relied on information
obtained during the course of his work such as advice from relevant personnel within the
parent company and its subsidiary including from the account manager of the subsidiary
which supplies the gas in regard to details on the components of the gas charge.
4.5.2 Interview - data analysis
Coding was used to analyze the data obtained from the interviews. The codes used were
shown in Table 4.8. Pattern coding which was based on recurring themes and technical issues
was adopted for this research. The codes were drafted initially prior to the interviews so as to
assist in the development of interview questionnaires, and then refined and finalised when the
interview transcripts were analysed.

135
Table 4.8: Coding
Codes Description Codes Description
ENVT Environmental accounting TEST Testing / tests conducted PERF Plant performance RECO Recording of data
EFFY Efficiency MEAS Measurement issues for example unable to measure
EMIS GHG emissions MONT Monitoring of plant’s parameters
WAST Waste excluding emissions of GHG
REPT Reporting requirements
RECY Recycle / reuse resources FREQ Frequency of reporting
QUAL Quality REGU Regulations
COSB Cost-benefit in relation to environmental issues such as penalties, and cost of obtaining data
LINK Link between financial performance (efficiency) and GHG emissions
CONT Contractual requirements and compliance with contracts
PLAN Plans for improving the environmental and financial performances
AUDI Energy audit APRO Approach to operating the plant
The interview transcripts were read, dated the day they were read and coded with a black pen
initially. The same transcripts were coded a second time and dated, this time with a blue pen,
to indicate that the transcripts had been analyzed twice by the researcher. The second analysis
was done because further insight may be gained after the researcher had become more
familiar with the data and had more time to think about them.
To assist in the analysis, the salient points pertaining to the data obtained from the interviews
are displayed in a combination of narrative and matrix form based on issues relating to the
research questions. To facilitate comparison (or otherwise), the matrices were designed so that
each matrix, representing issues relating to the research questions, fit on to one page,
wherever possible. Accordingly, the tables were written in note form to shorten the length.
Quotes from the interviewees were cited to retain the actual meaning of what they said and
the terminology that they used, and also to convince readers of the authenticity of this
research. Where the operators did not comment on any particular issue, they were not referred
to. Displaying the information in this way allowed the researcher to identify any gaps or
ambiguity in the information and, being a participant observer, was able to follow up with the
Electrical Engineer/ Plant Engineer and or the Operations Manager to obtain any additional
information, or triangulate with documentary evidence. While the focus of the research was

136
on energy efficiency and GHG emissions, the suggestion by Miles et al. (1994) in regard to
peripheral information was adopted to ensure that nothing was missed.
The plant operator gave the researcher a tour of the cogeneration plant, and a brief
explanation of the cogeneration process.
4.5.2.1 Plant performance and monitoring
According to the plant operator, the cogeneration plant performance is affected by the
ambient temperature and the CTIT. The plant’s operating performance, which includes the
steam injection, CTIT and power output, is monitored. Because gas is the only source of
energy input, the plant would not operate if there is any gas curtailment. The CCR operator
advised that the plant operating parameters are monitored by the CCR operators. He assumed
that these operating parameters were set within the DCS by the engineers. Extracts from the
other three interviewees regarding plant performance and monitoring are set out in Table 4.9
as follow:

137
Table 4.9: Plant performance and monitoring
INTERVIEWEES
Plant Engineer Electrical Engineer / Plant Engineer
Operations Manager
Ideal operating parameters set at design stage at initial stage of cogeneration project and have hardly been changed since then. Minimum and maximum limits set for certain parameters and if these are breached, the plant is shut down or an alarm raised. Actual performance is compared against expected performance as per the budget. Environmental issues such as reduction in GHG emissions were built into the design of the plant. Plant performance dependent on environmental conditions. Cogeneration plants designed to give ‘optimal outputs at what is known as ISO conditions which is 15oC temperature and 60 percent relative humidity and 101,325 Pascal air pressure or one bar ideal air pressure at the time’. An evaporative cooler is used ‘to manipulate the atmosphere’.
Ideal or optimal operating conditions, which relate to ambience or air temperature (oC), steam injection rate (kg/s) and CTIT (in oC within a specified range), have been specified. Ideal operating parameters tested before plant was commissioned; and again by previous Plant Engineer and controls engineer from turbine maintenance contractor. Optimal parameters set appeared to be correct from observations over the years that the plants have been operating.
Turbine combustion and air fuel ratio cannot be changed since these specifications were set by Original Equipment Manufacturer (OEM). Optimal operating conditions as specified by OEM were 15oC temperature at sea level (barometric) pressure and 60 percent relative humidity under isometric conditions based on a specified power rating (MW). Since barometric pressure (mPa) depends on plant’s location, and relative humidity is determined by weather and climate, controlling the temperature will have biggest effect on operating conditions Generally, an increase in temperature leads to a decrease in the power produced and vice versa. Reason being hot air expands which leads to a decrease in mass without any change in volume. As a result, an increase in temperature means less fuel is required while the power produced declines at the same time CTIT is maintained at a specified temperature (oC) for optimal performance; and monitored continuously by OEM governor which is part of fuel control loop and is not part of the Bailey system. Increasing the firing temperature increases turbine efficiency. However, increasing the firing temperature can affect the turbine’s life. Furthermore, firing temperature is constrained by coating material technology. Certain equipments were installed to help improve performance of the plant such as the heat exchanger which captures waste heat to heat the treated water that flows through the deaerator. Another example is economizer which helps to maintain exhaust temperature at a certain degree, and also helps to heat the feed water to the steam drum.
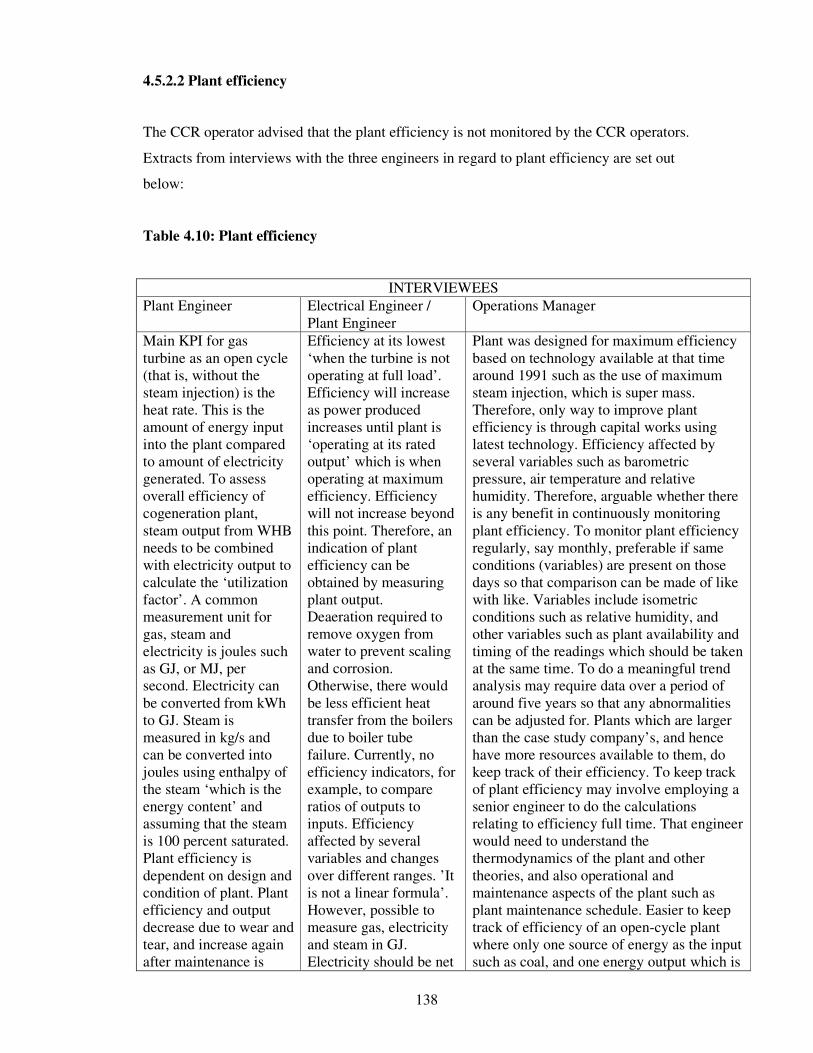
138
4.5.2.2 Plant efficiency
The CCR operator advised that the plant efficiency is not monitored by the CCR operators.
Extracts from interviews with the three engineers in regard to plant efficiency are set out
below:
Table 4.10: Plant efficiency
INTERVIEWEES
Plant Engineer Electrical Engineer / Plant Engineer
Operations Manager
Main KPI for gas turbine as an open cycle (that is, without the steam injection) is the heat rate. This is the amount of energy input into the plant compared to amount of electricity generated. To assess overall efficiency of cogeneration plant, steam output from WHB needs to be combined with electricity output to calculate the ‘utilization factor’. A common measurement unit for gas, steam and electricity is joules such as GJ, or MJ, per second. Electricity can be converted from kWh to GJ. Steam is measured in kg/s and can be converted into joules using enthalpy of the steam ‘which is the energy content’ and assuming that the steam is 100 percent saturated. Plant efficiency is dependent on design and condition of plant. Plant efficiency and output decrease due to wear and tear, and increase again after maintenance is
Efficiency at its lowest ‘when the turbine is not operating at full load’. Efficiency will increase as power produced increases until plant is ‘operating at its rated output’ which is when operating at maximum efficiency. Efficiency will not increase beyond this point. Therefore, an indication of plant efficiency can be obtained by measuring plant output. Deaeration required to remove oxygen from water to prevent scaling and corrosion. Otherwise, there would be less efficient heat transfer from the boilers due to boiler tube failure. Currently, no efficiency indicators, for example, to compare ratios of outputs to inputs. Efficiency affected by several variables and changes over different ranges. ’It is not a linear formula’. However, possible to measure gas, electricity and steam in GJ. Electricity should be net
Plant was designed for maximum efficiency based on technology available at that time around 1991 such as the use of maximum steam injection, which is super mass. Therefore, only way to improve plant efficiency is through capital works using latest technology. Efficiency affected by several variables such as barometric pressure, air temperature and relative humidity. Therefore, arguable whether there is any benefit in continuously monitoring plant efficiency. To monitor plant efficiency regularly, say monthly, preferable if same conditions (variables) are present on those days so that comparison can be made of like with like. Variables include isometric conditions such as relative humidity, and other variables such as plant availability and timing of the readings which should be taken at the same time. To do a meaningful trend analysis may require data over a period of around five years so that any abnormalities can be adjusted for. Plants which are larger than the case study company’s, and hence have more resources available to them, do keep track of their efficiency. To keep track of plant efficiency may involve employing a senior engineer to do the calculations relating to efficiency full time. That engineer would need to understand the thermodynamics of the plant and other theories, and also operational and maintenance aspects of the plant such as plant maintenance schedule. Easier to keep track of efficiency of an open-cycle plant where only one source of energy as the input such as coal, and one energy output which is

139
done. Therefore, best way of assessing efficiency is by monitoring output of electricity and steam. Boroscope inspection is done every 2,000 hours whereby turbines are visually inspected to assess whether any maintenance is required.
of parasitic losses since some electricity produced is used internally to operate the gas compressor, water pumps and air intake fans. Ratio of emissions to output energy not calculated currently as this is not required even by EPA. However, it can be calculated if need be.
electricity. However, gets more complicated for a cogeneration plant which uses waste heat to generate more electricity. Possible to calculate ratio of energy output to energy input by using a common unit of measurement. Gas and electricity can be converted into either MW or GJ. Steam can be converted into GJ by determining its enthalpy. Flow of steam is measured in kg/s, and enthalpy in kJ/kg. This then gives the kJ/s which equals watt. However, case study company currently does not calculate and keep track of this ratio.
4.5.2.3 Quality of inputs into the cogeneration plant
The plant operator stated that the gas from the supply pipes needs to be compressed to
increase the pressure before it flows to the turbine. As for water, it is filtered, softened with
chemicals and deaerated to remove the oxygen. Therefore, the harder the water, the more
chemicals are required to soften the water which means the more costs involved. The quality
of the water would determine the heat transfer to a certain extent. The water is then heated to
produce super mass steam with a certain injection flow rate (kg/s). Responses from the three
engineers who were interviewed in regard to the quality of inputs into the cogeneration plant
are as follow:

140
Table 4.11.1: Quality of inputs (gas and water) into the cogeneration plant
INTERVIEWEES QUALITY OF IINPUTS
Plant Engineer Electrical Engineer / Plant Engineer
Operations Manager
Gas Quality of gas is controlled by ‘one reticulation system’. Therefore, ‘it does not matter which retailer you go to, you will be getting the same gas’. However, calorific value of the gas may differ between different gas fields.
Certain gas quality standards are set by VENCorp. However, the gas which comes from the mains needs to be compressed to a certain pressure (kPA) by the case study company before discharged to the skids. Calorific value should be at certain value (MJ/m3).
Quality of gas is maintained by VENCorp and is on a take-as-is basis.
Water The ‘water supply in Melbourne by
world standards is very good’. Quality of
water depends on hardness of the water
which is caused by minerals in the water.
The water needs to be softened otherwise
deposits will form on the boiler and
damage it. Although there are other
systems in the world which use a
demineralization plant which can soften
the water more by removing silica, the
water softeners that are currently being
used ‘are good enough for us’. Quality of
water depends on water supplier. Quality
of water supplied outside Melbourne
region is poorer and therefore needs
more softening. However, physical
placement of the plant will determine
which supplier the water is obtained
from.
Town water is treated
with softeners and
other chemicals such as
caustic soda to prevent
build up of materials
(scaling) and corrosion.
Town water is on
a take-as-is basis.
However, the
water is then
softened with
chemicals by the
case study
company. In
addition, pH level
of water is
increased to
certain level using
caustic soda so as
to improve
resistance to
corrosion, and O2
removed with a
deaerator and an
oxygen scavenger.
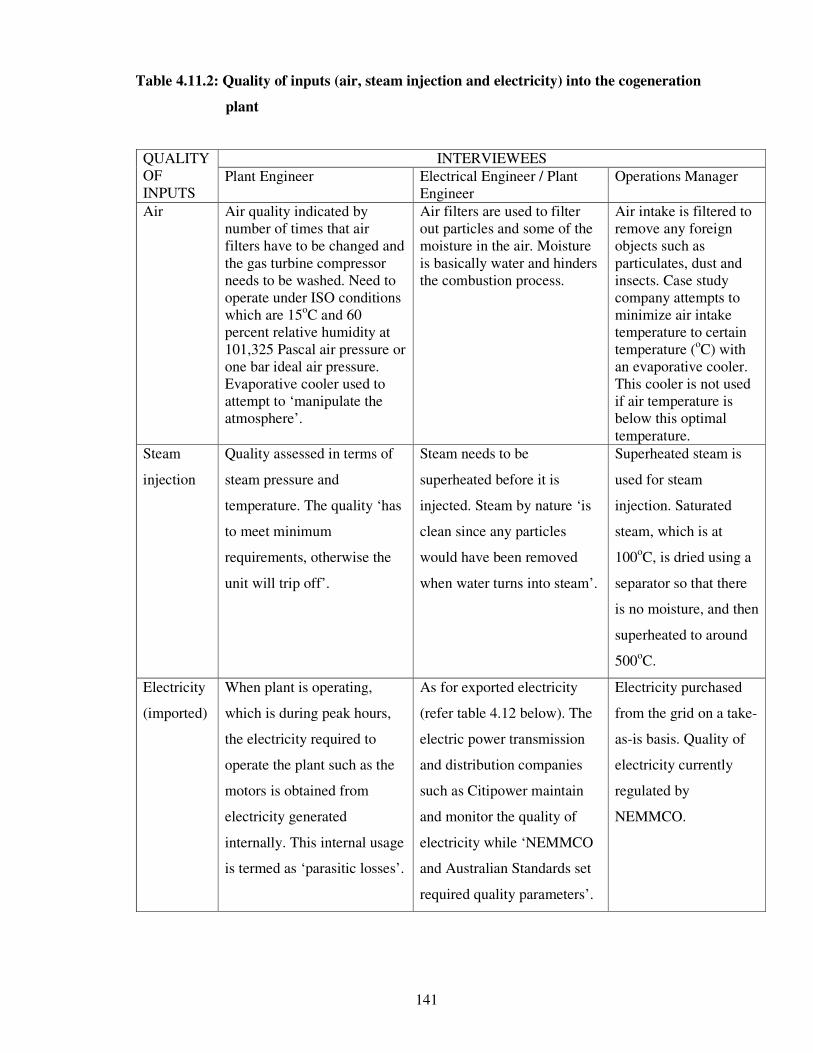
141
Table 4.11.2: Quality of inputs (air, steam injection and electricity) into the cogeneration
plant
INTERVIEWEES QUALITY OF INPUTS
Plant Engineer Electrical Engineer / Plant Engineer
Operations Manager
Air Air quality indicated by number of times that air filters have to be changed and the gas turbine compressor needs to be washed. Need to operate under ISO conditions which are 15oC and 60 percent relative humidity at 101,325 Pascal air pressure or one bar ideal air pressure. Evaporative cooler used to attempt to ‘manipulate the atmosphere’.
Air filters are used to filter out particles and some of the moisture in the air. Moisture is basically water and hinders the combustion process.
Air intake is filtered to remove any foreign objects such as particulates, dust and insects. Case study company attempts to minimize air intake temperature to certain temperature (oC) with an evaporative cooler. This cooler is not used if air temperature is below this optimal temperature.
Steam
injection
Quality assessed in terms of
steam pressure and
temperature. The quality ‘has
to meet minimum
requirements, otherwise the
unit will trip off’.
Steam needs to be
superheated before it is
injected. Steam by nature ‘is
clean since any particles
would have been removed
when water turns into steam’.
Superheated steam is
used for steam
injection. Saturated
steam, which is at
100oC, is dried using a
separator so that there
is no moisture, and then
superheated to around
500oC.
Electricity
(imported)
When plant is operating,
which is during peak hours,
the electricity required to
operate the plant such as the
motors is obtained from
electricity generated
internally. This internal usage
is termed as ‘parasitic losses’.
As for exported electricity
(refer table 4.12 below). The
electric power transmission
and distribution companies
such as Citipower maintain
and monitor the quality of
electricity while ‘NEMMCO
and Australian Standards set
required quality parameters’.
Electricity purchased
from the grid on a take-
as-is basis. Quality of
electricity currently
regulated by
NEMMCO.

142
4.5.2.4 Quality of outputs from the cogeneration plant
The Electrical Engineer / Plant Engineer stated that steam sold to the customers has to be
saturated steam which is lower in temperature than superheated steam. The Operations
Manager advised that the steam has to be saturated at 100oC at sea level atmospheric pressure.
The characteristics in regard to the quality of electricity that is required before it can be
exported or sold to customers are as follow:
Table 4.12: Quality of electricity exported or sold from cogeneration
INTERVIEWEES
Plant Engineer Electrical Engineer / Plant Engineer Operations Manager
The plant is on high voltage (11kV) site. However, customers require 415v which can then be converted to 240v. Transforming from high voltage to low voltage is done with a distribution transformer which involves some loss of power in the form of heat which is borne by case study company as per cogeneration contract.
Frequency (hertz) and voltage need to be at certain levels. Relays are used to control the frequency, and tap changers in the transformers to control the voltage. In addition, ‘the generator will trip if the voltage is too high’. Reactive power (as a result of poor power factor) is an indication of the quality of electricity. Power factor needs to be as close to unity or one as possible and the reactive power, although necessary, can and should be minimized. Current comprises the part for real power and the part relating to reactive power since power is a product of current (ampere) and voltage. As voltage is constant, an increase in current means an increase in power being produced which means more gas is consumed. Therefore, an increase in reactive power means more gas is consumed to produce power that is not useful. However, since plant was designed with a maximum current parameter, this means that for the same quantity of gas consumed, the portion of real power that can be sold to customer decreases if reactive power increases. Both power factor and reactive power (measured in kvars) are recorded continuously in the DCS and a feedback loop used where the system tries to adjust the power factor back to as close to unity as possible.
Electricity sent to the grid needs to conform to requirements as currently set by NEMMCO. Electricity should be at certain frequency (hertz or cycles), a power factor as close to unity as possible, and must be in a smooth rather than uneven wave form. The wave form only had to be tested when plant was commissioned. Frequency measured by the system as indicated on control panel meter.
4.5.2.5 Wastes
The Plant Engineer identified transmission losses as waste. Comments from the other
interviewees in regard to wastes are set out in the table below:

143
Table 4.13: Wastes
INTERVIEWEES
Plant Engineer Electrical Engineer / Plant Engineer
Operations Manager
Waste heat from turbine used to heat steam boiler. Temperature of waste water is decreased before it is discharged to the sewers to avoid damage to sewerage pipes. Costs of recycling the water (such as removing the contaminants) outweigh the benefits of recycling the water. Waste heat from waste water is not worth recouping as the temperature is not high enough for any recovery to be worthwhile. Process of compressing the gas generates unwanted heat. Gas compressor then cooled off with cooling tower and the heat escapes to the atmosphere. Not worth recouping this waste heat as there is ‘not really enough temperature to generate enough recovery’. Small amount of waste oil leakage which is disposed of by an EPA-approved company. Condensate returned by customers still contain some heat and therefore less energy is required to (re)heat the water again to steam. However, not possible to get back 100 percent condensate from customers. Therefore, some water still needs to be purchased to make up for the shortfall.
Chemical emissions such as mercury. Some of the water used in production of steam returned by customers as condensate and recycled by the case study company to produce steam again ‘after it has been treated with dosing chemicals such as caustic soda’. However, water which cannot be recycled is discharged by the case study company itself to drain the boilers; or disposed of by customers. Customers ‘are charged for the water which is not returned’. A bit of ‘radiant heat is lost to the atmosphere’. However, case study company tried to minimize the loss by insulating the metal parts (metallic parts by nature contain heat).
Blow downs from boilers which comprise of water and dissolved solids and water treatment chemicals. The heat in the water that is blown down is not recovered as there is already sufficient heat energy generated for internal needs. Negligible amount of oil vapour from the oil separator. Exhaust gases other than GHG as mentioned above as listed in NPI report. Heat loss from casing minimized by lagging and cladding the casing with thermal insulation material. There is trade-off between cost of insulating, and how much lagging is required to minimize heat loss.
4.5.2.6 Greenhouse gases emissions
Comments from the interviewees in regard to GHG emissions and the link between energy
efficiency and GHG emissions were as follow:

144
Table 4.14: Greenhouse gases emissions and the link with energy efficiency
INTERVIEWEES
Plant Engineer Electrical Engineer / Plant Engineer
Operations Manager
Emissions of NOx, CO and sulphur dioxides are measured as required by the EPA. Plant was designed to maximize efficiency (and reduce emissions) at time it was built. Financial performance is affected if environmental performance is not met. For example, if EPA licence limits are breached and penalties imposed as a result.
Gas analyzer is used to analyse chemical composition of exhaust flue gases which include NOx,
CO2 and CO. The gas analyzer includes a temperature probe and a gas measurement analyzer. Generating a certain amount of electricity without steam injection would emit more NOx compared to generating the same amount of electricity with steam injection. However, with cogeneration, there should be a certain quantity of NOx produced. Any increase beyond this quantity would indicate plant is operating at below maximum efficiency because too much gas fuel is being consumed. Does not believe that risk management in regard to efficiency and the environment is applicable unless in situations such as the generator blowing up due to ‘for example gas explosion or fire happening which can then be an environmental hazard’.
Exhaust gases include GHG such as CO and NOx. There is an optimal steam injection rate into the fuel flow. However, any increase in the rate beyond this point would decrease the NOx but increase the CO at the same time. Generally, improving the environmental performance can lead to improved financial performance. Plant was ‘originally designed to achieve high efficiencies whilst achieving the environmental licence requirements’. Therefore, any significant reductions in emissions would necessitate replacement of the gas turbine with the latest generation unit that utilizes low NOx technology. This would be uneconomic given the remaining period in the contract. In the initial stage of the cogeneration project, a works approval report was prepared by an external consultant for submission to EPA. The report included emissions data from trials conducted; and results comparing emissions per kilogram of steam produced and emissions per kW of electricity produced; versus the emissions that would be produced if a cogeneration plant was installed. Study proved fuel savings and reduction in emissions if a cogeneration plant was used instead of the existing plant.
4.5.2.7 Regulatory requirements and government incentives
According to the plant operator, a turbine reading sheet, which shows the amount of steam
injection and the power output of the plant, is printed out daily as part of an EPA requirement.
In addition, testing of emissions is done by a NATA certified company once every year.

145
Table 4.15: Regulatory requirements and government incentives
INTERVIEWEES
Plant Engineer Electrical Engineer / Plant Engineer
Operations Manager
‘Testing at the stack is done annually to meet EPA licence requirements. Under EPA’s NPI program, an inventory of ‘emissions for a number of different compounds and chemicals including CO’ is recorded annually. A one-off energy audit was done in 2004. Believes non compliance with EPA requirements would incur fines and licence being revoked in extreme cases.
EPA licence submission and Emission Inventory Report – NPI report need to be lodged. Costs involved would include relevant employees’ time and fee paid to external consultant for the testing Believes there are penalties for breaching limits set in EPA licence In regard to incentives offered by regulators, ‘know vaguely about green credits’ although this does not apply to the case study company since the ‘green credits’ are only available ‘for fully renewable energy sources such as landfill’.
NATA-approved laboratory tests GHG emissions annually to confirm compliance with EPA licence requirements. Both rate (g/min) and concentration (mg/m3) of CO and NOx need to be measured. EPA negotiated guidelines set out in the licence with case study company but the limits were ultimately determined by EPA. EPA licence report required to be submitted annually. Amount of gas consumed and emissions produced as a result are included in NPI report to EPA. Had a one-off energy audit by an external auditor in 2004. Aware of ‘green credits’ and Mandatory Renewable Energy Target (MRET) schemes but which case study company is not eligible for because those schemes were introduced after plant was commissioned.
4.5.2.8 Data recording and reporting
The plant operator advised that data on the plant performance are recorded continuously by
the system although there is a time lag of about two and a half seconds before the data are
recorded. Comments from the other interviewees were as follows:
Table 4.16: Data recording and reporting
INTERVIEWEES
CCR operator Plant Engineer Electrical Engineer / Plant Engineer
Operations Manager
Data on plant’s daily operations generated as daily and monthly reports. Customer Daily Bailey report is summary of total quantity of gas, electricity, steam, water, condensate and heat
Heat rate calculated monthly. Utilization factor not calculated because of the approach to production which is to maximize output. Parameters of the plant, and steam and
Flue gas analysis done annually by external consultant who then issues report. Output parameters such as steam and electricity are measured. No attempt ever made
Portable combustion analyzer used to measure CO, O2 and NOx in package boilers. The information is used to set the burner so that the package boilers operate at their most efficient (however, the

146
rates for the 24-hour period, and is generated automatically by DCS. Customer Skid Daily Report, extracted from Bailey, shows total running hours of gas turbine, WHB and the generator. It also shows any downtime and any (extra) hours over the peak hours, and number of times the plant was started. Where there is downtime or extra running hours, which means that the skid operated for less than or more than 16 hours per weekday respectively, the CCR operator needs to document reason(s) for the downtime or extra time. In addition, Incident Report needs to be prepared by the CCR operator when there are ‘unscheduled outages or plant failures’. That is, when the plant (or part thereof) fails or shuts down unexpectedly. An outage refers to the situation whereby the plant, which was running normally, stops doing so, and therefore needs to be repaired. Furthermore, a monthly report is generated from the DCS. The CCR operator then passes this report to the engineers. In addition, reports are received from chemical and cooling tower water treatment companies in regard to Legionnaires disease risk management.
electricity output measured and recorded on real time 24 hours every day. These are done automatically by Bailey DCS and SCADA data acquisition system at the central control room. Manual readings can be done too. Trend analysis can be generated from system. Monthly reports of parameters and outputs generated for billing and monitoring purposes. Inputs of gas, water and electricity, and outputs of electricity are measured and checked against ‘local supply authorities’’ figures and any discrepancy of more than 0.2 percent investigated. Allowance made for transformer losses which are not measured by any meters. This requires ‘a bit of engineering detective work and understanding to be able to make these comparisons’. Steam output measured using vortex flow meters which are calibrated by independent NATA certified body. Customers then billed accordingly.
to measure amount of radiant heat lost to atmosphere. Data recorded in real-time and there are about 30 trend analyses. These include constant flow of steam (kg/s), pressure (kPa), and nominal cubic metres per hour for the gas flow. Weight of both steam and gas are measured in tonnes. Export electricity measured in kWh, amperes, kV and kvars. kvars is measure of ‘the reactive power that is whether it is at unity power factor’. Three types of load, resistance which is normal power; and inductive and capacitive, both of which are reactive power. ‘With reactive loads, the more inductive or capacitive, the reactive power load decreases and therefore we get less apparent power’. Water flow measured in nominal cubic metres per hour and weight in tonnes. There are mechanical trends such as for vibrations. Trend analyses can be printed out from the system. Only reports that relate to the environment and efficiency are those required annually by EPA.
package boilers are generally operated during off peak hours which is when the cogeneration plant is not operating). Efficiency is not measured because efficiency level has been built into plant design and therefore cannot be changed. Implemented ISO 9002 in the past which helped in documenting case study company’s procedures but also created a lot of bureaucracy such as the requirement to have a Quality Assurance manager. Therefore, overall, it was found not to be useful. Prefer to have Quality Control rather than Quality Assurance. No internal reports on GHG other than the monthly operations and maintenance report whereby any environmental-related issues are reported to parent company on exception basis. These environmental issues tend to relate to failure to comply with EPA requirements or meet EPA’s standards such as the energy audit. The only environmental-related reports produced are for external reporting requirements, namely to EPA in regard to EPA licence and the NPI.

147
4.5.2.9 Other issues
The company’s approach to operating the cogeneration plant, from the perspectives of the
interviewees, is as follows:
Table 4.17: Company’s approach to operating the cogeneration plant
INTERVIEWEES
Plant operator
Plant Engineer Electrical Engineer / Plant Engineer
Operations Manager
Generate electricity to the maximum possible.
Maximize output of electricity. This involves keeping plant availability as high as possible (the maximum achievable is 100 percent which means plant was operating all the time during peak hours).
Approach is ‘not in terms of efficiency, but primarily to meet the continuous supply of steam and electricity’ to customers. Therefore, emphasis is on plant availability.
Plant is operated to generate maximum steam and electricity possible under cogeneration contract in order to maximize revenue, and comply with EPA licence requirements. This approach may not necessarily mean plant is operating at maximum efficiency.
In regard to the energy audit that was conducted in 2004, the Electrical Engineer / Plant
Engineer did not comment since he was not involved. The responses from the other two
engineers were as follow:
Table 4.18: Energy audit
INTERVIEWEES
Plant Engineer Operations Manager
Conducted as required by EPA to identify whether plant efficiency can be improved and emissions reduced. However, results revealed that plant had been designed to be as efficient as possible and to minimize emissions, and that only way to improve is by replacing parts with modern or improved technology. However, there was ‘nothing that we could change that would give us a three year payback or better at that point in time’.
An energy audit, as requested by the EPA, was carried out in 2004 to identify ways of improving the plant’s efficiency. The energy audit was a one-off exercise. A recommendation from the energy audit to install a variable speed control for the town water pump was considered not economic to implement because the payback period was over 10 years which would exceed the remaining life of the cogeneration contract.
The previous Plant Engineer advised that the company intends to improve its financial and
environmental performances by replacing SF6 switchgears with Rankine switchgears which

148
are more environmentally-friendly whenever the switchgears need to be replaced. The other
two engineers’ comments were as follow:
Table 4.19: Plans for improving the financial and environmental performances of the
company
INTERVIEWEES
Electrical Engineer / Plant Engineer
Operations Manager
Maintain current operations and environmental performances as required by EPA. Air vacuum breakers to replace SF6 switchgears for environmental and safety reasons. Likewise, dry-type transformers to replace oil-type transformers for environmental reasons and to minimize risk of fire. Both the switchgears and the transformers form part of the substation which is for power distribution from the plant. Believes that initial expenditure for using different types of switchgears and transformers would be higher but over the long term would be less because of lower maintenance required. However, formal assessment as to whether would cost less over the long term was not done. Basis for making this decision due to directive from parent company.
May be worthwhile investigating whether more gas is being consumed than it should be because output is at maximum but efficiency is decreasing. This is because plant’s efficiency tends to decline over time. This loss in efficiency may be recouped by adjusting the frequency of the plant maintenance so that maintenance is done earlier than scheduled. However, unlikely that plant efficiency could be brought back to previous level due to wear and tear on the plant. The efficiency can be measured and monitored so that if there is a, say, 2 percent drop in efficiency, maintenance can be done earlier to bring the efficiency back up. The study should assess whether gains in maintaining efficiency at the maximum possible such as lower consumption of gas outweigh the cost of (increased) maintenance. Data recording and analysis need to be done weekly, as opposed to monthly, so that the variables can be smoothed out when doing trend analysis. Electricity purchased from grid is ‘relatively little’ and generally occurs during off peak hours which is when the plant is not operating. During peak hours when the plant is operating, some of the electricity generated is used internally rather than purchased from the grid. Electricity required for internal consumption to run the auxiliaries such as the pumps. Approach is to use high efficiency motors whenever possible should replacement be required. The way to improve the company’s environmental and financial performances is through technological improvements. For example, when there is a ‘repair or replace’ decision to be made, try to replace with an upgrade if that will increase plant efficiency and is more environmentally-friendly. But, only if those benefits outweigh the costs.
The following table presents some insight into how the existing management views
environmental regulations:

149
Table 4.20: Personal views on environmental regulations
INTERVIEWEES
Electrical Engineer / Plant Engineer
Operations Manager
Believes that as a result of Australia’s decision not to ratify the Kyoto Protocol, there is no serious approach to addressing environmental issues. In addition, believes that it would be smarter to use cleaner and renewable forms of energy such as solar power.
Believes companies ‘are driven by profits’ and even companies which try to be environmentally-friendly do so because they believe that portraying such an image would increase their market share. However, their concern for environmental matters diminish when their financial performance decline. Therefore, relying on companies to undertake voluntary initiatives would not be very effective. Rather, ‘companies should be forced to be environmentally-conscious by the government’. Then only would all companies ‘face the same costs’ and have to compete ‘at the same level’.
4.6 Assessing the quality of the case study research
The four tests, as identified by Yin (2003), Atkinson et al. (1998) and Lincoln et al. (1985),
and their applicability to this research are set out in Table 4.21.

150
Table 4.21: Assessing the quality of the case study research
Test Applicability
Construct validity Multiple sources of evidence, including interviews, sighting company documentation and from the researcher’s own observations at the workplace (that is, the case study company), were used. Wherever possible, interviewees were asked to review their interview transcripts. A chain of evidence was established by conducting a walk-through of the company’s cogeneration process leading to the accounting system. Triangulation was done to look for any convergence or divergence.
Internal validity The theory that improving the energy efficiency of the cogeneration process would lead to better financial and environmental performances has been proven in scientific studies conducted by engineers and regulatory bodies (refer Chapters 1, 2 and 4 above).
External validity Not applicable since the scope of the research did not involve generalizing the study’s findings beyond the immediate case study.
Reliability The following methods were adopted with the objective that if another researcher were to conduct the same case study all over again by following the same procedures as described by the researcher, that other researcher should arrive at the same findings and conclusions.
• interviews were taped or notes taken, and transcribed (interview questionnaires contained in the appendices);
• publications such as engineering handbooks and regulatory publications are available in libraries or on the internet, and cited in the references; and
• case study company documents are available at its premises. The evidence mentioned above was made available to the supervisors, and this thesis reviewed by them prior to submission.
The data have been analysed for the purpose of answering the research questions. That is, to
determine whether or not:
• the existing management accounting system can generate sufficient, if any,
information to assist the company in decision-making pertaining to environmental
factors;
• the management accounting system can generate the information required to assist
the company in complying with government regulations, and to obtain government
incentives, if any, in relation to the environment, as well as the type of information
that can be generated;
• the existing management accounting system can generate all or any of the
information required on a routine basis, say, monthly or half yearly;

151
• the existing management accounting system can generate sufficient information to
assist the company to determine the least-cost method(s) in achieving environmental-
related objectives; and
• the existing management accounting system can be modified, if required, to generate
the information required and an analysis of the costs and benefits in doing such a
modification.

152
Chapter 5
CONCLUSION AND RECOMMENDATIONS
5.1 Conclusion
The research objective was to explore whether EMA can be applied to assist a cogeneration
company in improving its financial performance as well as its environmental performance.
The approach taken in this research was, first of all, to assess whether an improvement in the
energy efficiency of the cogeneration plant can lead to a reduction in GHG emissions. An
improvement in energy efficiency means that either:
• less gas is consumed, thus leading to cost savings (note that the quality of gas is
regulated and therefore the company cannot choose a supplier that can provide ‘better’
quality gas); or
• more electricity is generated for the same quantity of gas consumed, which leads to an
increase in income and consequently profit. The electricity generated should meet the
quality parameters and not be of poor quality and thus not saleable (for example
reactive power) which essentially means a waste of gas consumed.
A reduction in the quantity of gas consumed or generating as much electricity as possible
from a given quantity of gas can lead to a reduction in GHG emissions which means an
improvement in the company’s environmental performance. A review of the literature and the
evidence collected indicated that a cogeneration plant’s efficiency can be improved at least
back to near the plant’s designed efficiency. And, further improvements may be achieved by
utilizing the latest technology although this entails capital investment. It was also established
that an improvement in plant efficiency can reduce GHG emissions. Whether the relationship
is causal or correlated is a technical issue and beyond the scope of this research. The next step
then was to answer the research questions (refer Section 1.4) as follows:

153
Table 5.1: Research questions and the findings
Research Questions Research findings
Does the existing management accounting system generate sufficient, if any, information to assist the company in decision-making pertaining to environmental factors?
A major limitation of the existing management accounting system (MAS) is that it provides predominantly financial, or monetary, information. This assists the company in making decisions such as in identifying cost reduction measures (for example, changing consultants for measuring GHG emissions should an analytical review show that costs have increased significantly) and for capital investment appraisal. However, it will be useful to have physical, or non financial, information also especially in regard to GHG emissions. During the data collection and analysis stage of the research, it was discovered that there was no financial measure of GHG emissions. Furthermore, an analytical review of the electricity and steam revenue and the gas costs in monetary terms only gives a limited analysis. The changes may be due to changes to the gas, steam and electricity rates. In addition, the monetary values may be affected by plant availability. For example, if the current month indicates an increase in revenue in monetary terms, does that mean that the increase was due to efficiency improvements or because plant availability increased and or the number of peak days in the month increased (that is, the plant was operating longer)? Therefore, there is a need for an EMA system so that the company can also analyze the physical data.
What information is required to be generated from the management accounting system to assist the company comply with government regulations, and to obtain government incentives, if any, in relation to the environment?
At the time of the research, only physical information such as the quantity of GHG emitted (in tonnes, not dollars) was required by environmental regulators such as the EPA.
Does the existing management accounting system generate all or any of the information required on a routine basis say monthly or half yearly?
Management accounts are prepared on a monthly basis. The budget, five-year forecast and financial statements are prepared every financial year. These include the balance sheet and the income statement (profit or loss).
Does the existing management accounting system generate sufficient information to assist the company determine the least-cost method(s) in achieving environmental-related objectives?
The existing MAS focus is on operating and maintenance work and that includes complying with environmental regulations such as meeting the EPA licence conditions to ensure that the plant can continue to operate. Therefore, the answer is yes to the extent that the costs relate to compliance with environmental regulations.
Can the existing management accounting system be modified to generate the information
The existing MAS can be modified to capture the monetary or financial information required either by creating new general ledger codes or by setting up new job codes in the

154
required, and an analysis of the costs and benefits in doing such a modification
job costing module. To create a new general ledger code or a new job number will take approximately less than five minutes of the Accounting Manager’s time.
Therefore, based on the literature review and the research findings, it can be concluded that
EMA can be applied to a cogeneration company, and that adopting EMA can assist the
company to improve its financial and environmental performances. An EMA system can
provide the physical information that is not available in the MAS. As discussed, physical
information such as the physical quantities of gas consumed, electricity and steam produced,
and GHG emitted, can help the company in decision-making relating to improving plant
efficiency as well as reducing GHG emissions.
5.2 Recommendations
Should the company decide to adopt EMA, it is recommended that the company utilize its
existing MAS and other information systems especially since this is a small company with
less than 40 employees. The physical information can be obtained from existing operations
and maintenance information systems such as the DCS. Using this approach means that it is a
relatively simple matter of collecting and collating the required data in contrast to
constructing an elaborate EMA system and or an EMS. In addition, it is recommended that the
company commence with a relatively simple EMA system and build this up gradually over
the years. For example, in the first year of adopting EMA, the physical quantities of steam and
electricity produced can be expressed as a ratio to the physical quantity of gas consumed since
they all can be measured in a common unit of measurement for energy, GJ. This will give an
indication of the energy efficiency. The frequency in collecting the physical data may be on a
monthly basis initially together with the monthly management accounts. This frequency can
be increased later to, say, weekly, if the company needs to fine-tune its analysis so as to better
identify areas for efficiency improvement especially since the cogeneration process is subject
to various variables such as air pressure and temperature. To then assess the link with the
reduction in GHG emissions means that the physical quantities of GHG emitted need to be
measured on a monthly basis, too. Currently, the company is required to measure GHG
emissions on a yearly basis due to EPA licence requirements. Therefore, to measure GHG
emissions on a monthly basis will lead to the company incurring additional costs. These
additional costs may be in the form of fees if an external consultant takes the measurements;
or internal labour and costs relating to the acquisition and maintenance of a measuring
equipment. Starting on a monthly basis allows the company to analyze any changes in the

155
physical quantities of gas consumed, electricity and steam produced, and GHG emitted. This
can then be compared to the changes in the gas costs and electricity and steam revenue to
check for consistency in the data analysis although a limitation, as discussed earlier, is that
GHG emissions cannot be assigned a monetary value given that there does not exist any
emissions trading or similar schemes in Australia as yet. This analysis can help the company
identify any areas for improving efficiency which, in turn, should lead to a reduction in GHG
emissions.
In addition, it may be worthwhile to consider the implementation of Activity Based Costing
(ABC) together with EMA since the entire implementation process which includes the
identification of cost drivers should assist in identifying environmental costs.
However, given that the cogeneration contract will be expiring shortly, it is not recommended
that the company adopt EMA since the timeframe is too short to conduct a study in relation to
efficiency improvement and GHG emissions reduction, and the benefits to be derived from
the study.
5.3 Possible future research
The purpose of this research was to explore whether EMA can be applied to an Australian
cogeneration company. A case study approach was used which involved an in-depth study of
one peaking cogeneration company (that is, it only operates during peak hours). This leaves
opportunities to conduct future research. Research can be conducted which actually conducts
a trial to assess how EMA can improve efficiency, as well as evaluate the strength of the
relationship between energy efficiency and GHG emissions. In addition, research can be
conducted to design an EMA framework for cogeneration companies using multiple case
studies and / or a survey. The sample selected should include both base load cogeneration
companies (that is, cogeneration companies which operate continuously 24 hours everyday)
as well as peaking cogeneration companies. Furthermore, the role that ABC may be able to
play in EMA for cogeneration companies can be researched.

156
Bibliography Adams, C., Frost, G., Webber, W. (2004) Triple Bottom Line: A Review of the Literature in Henriques, A., Richardson, J. (ed.), The Triple Bottom Line: does it all add up? Assessing the
Sustainability of Business and CSR, London: Earthscan. Adams, R. 1998 [website] Taking the lead, Available: http://www.accaglobal.com/publications/accountingandbusiness/36303?session=fffffffeffffffff0a01213944a58127181ce92eeeb7fadcc0c24da47d383d30 (18 July 2006). AGL (1996) Natural Gas Technical Data Book, 4th edition, NSW: AGL Retail Energy (Contract Sales) Pty Ltd. Allen, R.E. (1990) (ed.) The Concise Oxford Dictionary of Current English, Oxford: Clarendon Press. Allison Gas Turbine (1992), 501-K Single Shaft Engine Training Manual, General Motor Corps. Atkinson, A.A., Shaffir, W. (1998) “Standards for Field Research in Management Accounting”, Journal of Management Accounting Research vol.10 pp. 41-68. Australian Accounting Research Foundation (2002) Auditing Guidance Statement AGS 1036:
The Consideration of Environmental Matters in the Audit of a Financial Report in CPA Australia (ed.) (2005) Accounting and Auditing Handbook 2006 volume 2: Auditing and
Assurance Handbook, Australia: Pearson. Australian Accounting Research Foundation (AARF) (2002) Auditing Standard AUS 108:
Framework for Assurance Engagements in CPA Australia (ed.) (2005) Accounting and
Auditing Handbook 2006 volume 2: Auditing and Assurance Handbook, Australia: Pearson. Australian Business Council for Sustainable Energy (2005), EcoGeneration: Magazine of the
Australian Business Council for Sustainable Energy, iss. 27 December 2004 / January 2005. Australian Business Council for Sustainable Energy (2006), EcoGeneration: Magazine of the
Australian Business Council for Sustainable Energy, iss. 34 May / June 2006. Australian Commonwealth Parliament 2006 [website], Corporations Act 2001, Available: http://www.austlii.edu.au/au/legis/cth/consol_act/ca2001172/ (18 September 2006). Australian Competition and Consumer Commission (ACCC) 2006 [website], Gas, Available: http://www.accc.gov.au/content/index.phtml/itemId/3879 (13 September 2006). Australasian Gas Turbine Specialists (2005) Report for case study company …contract
rehabilitation of facilities 2009, Melbourne. Australian Energy Market Commission (AEMC) 2006 [website], National Electricity Rules
version 9, Available: http://www.aemc.gov.au/pdfs/rules/rulesv9.pdf (30 August 2006). Australian Energy Regulator (AER) 2006 [website], Regulation, Available: http://www.aer.gov.au/content/index.phtml/itemId/656042 (13 September 2006).

157
Australian Government Attorney-General’s Department 2004 [website], National
Environment Protection Council Act 1994, Available: http://scaletext.law.gov.au/html/pasteact/2/1168/top.htm (21 August 2006). Australian Government Department of Industry, Tourism and Resources 2006 [website], Industry Guidelines: Energy Efficiency Opportunities, Available: http://www.energyefficiencyopportunities.gov.au/index.cfm?event=object.showContent&objectID=CB1C7C8B-D56D-2C65-AC775C322861CB18 (09 August 2006). Australian Government Department of Industry, Tourism and Resources: National Measurement Institute 2006 [website], Australian legal units of measurement – Schedules 1-3
of the National Measurement Regulations, Available: http://www.measurement.gov.au/index.cfm?event=object.showContent&objectID=B8CB6D48-E6BA-49DF-F00814D33D130AF0 (29 September 2006). Australian Government Department of Industry, Tourism and Resources: National Measurement Institute 2006 [website], Metric conversion, Available: http://www.measurement.gov.au/index.cfm?event=conversions (29 September 2006). Australian Government Department of the Environment and Heritage 2003 [website], National Pollutant Inventory: Emission Estimation Technique Manual for Combustion
Engines v. 2.3, Available: http://www.npi.gov.au/handbooks/approved_handbooks/eng.html (17 August 2006). Australian Government Department of the Environment and Heritage 2004 [website], National Pollutant Inventory Guide v. 3.1, Available: http://www.npi.gov.au/handbooks/guidetoreporting.html (17 August 2006). Australian Government National Health and Medical Research Council and Natural Resource Management Ministerial Council 2004 [website], National Water Quality Management
Strategy: Australian Drinking Water Guidelines 2004, Available: http://www.nhmrc.gov.au/publications/synopses/eh19syn.htm (25 August 2006). Australian Greenhouse Office (AGO), Department of the Environment and Heritage, Australian government 2005 [website], AGO Factors and Methods Workbook, Available: http://www.greenhouse.gov.au/workbook/index.html (15 August 2006). Australian Greenhouse Office, Department of the Environment and Heritage, Australian government 2005 [website], Greenhouse Gas Abatement Program, Available: http://www.greenhouse.gov.au/ (04 June 2005). Australian Greenhouse Office, Department of the Environment and Heritage, Australian government 2006 [website], Low Emissions Technology Demonstration Fund, Available: http://www.greenhouse.gov.au/demonstrationfund/index.html (21 September 2006). Australian Greenhouse Office 2000 [website], Program Guidelines: Generator Efficiency
Standards, Available: http://www.greenhouse.gov.au/ges/publications/program_guidelines.html (22 August 2006). Australian Greenhouse Office 2001 [website], Technical Guidelines - Generator Efficiency
Standards: version 1.2, Available: http://www.greenhouse.gov.au/ges/publications/guide_app2.html (11 October 2005).

158
Bartolomeo, M., Bennett, M., Bouma, J.J., Heydkamp, P., James, P., Wolters, T. (2000) “Environmental management accounting in Europe: current practice and future potential”, The European Accounting Review vol. 9(1) pp. 31-52. Baxter, T., Bebbington, J., Cutteridge, D. (2004) Sustainability Assessment Model: Modelling
Economic, Resource, Environmental and Social Flows of a Project in Henriques, A., Richardson, J. (ed.), The Triple Bottom Line: does it all add up? Assessing the Sustainability
of Business and CSR, London: Earthscan. Bebbington, J., Gray, R., Thomson, I., Walters, D. (1994) “Accountants’ attitudes and environmentally-sensitive accounting”, Accounting and Business Research vol. 24 (94) pp. 109-120. Becker, H.S. (1998) Tricks of the trade: How to think about your research while you’re doing
it, Chicago: University of Chicago Press. Bennett, M., James, P. (1998) The Green Bottom Line: Environmental Accounting for
Management Current Practice and Future Trends, Sheffield: Greenleaf Publishing. Boyce, M.P. (2002) Handbook for Cogeneration and Combined Cycle Power Plants, New York: The American Society of Mechanical Engineers. Boylestad, R.L. (1994) Introductory Circuit Analysis, 7th ed., New York: Macmillan Publishing. Brown, M.T., Ulgiati, S. (2002) “Emergy evaluations and environmental loading of electricity production systems”, Journal of Cleaner Production 10(4) pp. 321-334. Burritt, R.L. (1998) Cost Allocation: An Active Tool for Environmental Management
Accounting? in Bennett, M., James, P. (ed.), The Green Bottom Line: Environmental
Accounting for Management Current Practice and Future Trends, Sheffield: Greenleaf Publishing. Burritt, R.L. (2004) “Environmental Management Accounting: Roadblocks on the Way to the Green and Pleasant Land”, Business Strategy and the Environment vol.13 pp.13-32. Burritt, R.L., Hahn, T., Schaltegger, S. (2002) “Towards a comprehensive framework for environmental management accounting – links between business actors and environmental management accounting tools”, Australian Accounting Review vol. 12 pp. 39-50. Burritt, R.L., Saka, C. (2006) “Environmental management accounting applications and eco-efficiency: case studies from Japan”, Journal of Cleaner Production vol. 14 pp. 1262-1275. Burrows, T., Anderton, D., Chung, T.T. (2006) “Repowering: a viable option?” PEi magazine August 2006 pp. 46-48. Case study company (2004), Central Control Room Operator Training Course manual,
Melbourne. Case study company (2006) Generation Group Performance Report – May 2006, Melbourne.

159
Case study company (2005) … Cogeneration Project: Annual Report for … – Financial Year
2004/2005, Melbourne. Case study company (2005) … Cogeneration Project Monthly Report May 2005, Melbourne. Case study company (2005) Energy Account Tax Invoice to the … for the month of June 2005, Melbourne. Case study company (2005) Emission Inventory Report: National Pollutant Inventory, Melbourne. Case study company (20…) Enterprise Agreement 20XX-20XX, Melbourne. Case study company (2005) EPA Licence Submission: Licence No. EA XXXXX September
2005, Melbourne. … (2003) … Retail Gas Sale Deed, Victoria, between … and case study company. Cerin, P. (2002) “Characteristics of environmental reporters on the OM Stockholm exchange”, Business Strategy and the Environment vol. 11 pp. 298-311. Cheng, D.Y, Nelson, A.L.C 2002 [website], The chronological development of the Cheng
cycle steam injected gas turbine during the past 25 years, Proceedings of ASME Turbo Expo 2002 June 3-6, 2002, Amsterdam, The Netherlands, Available: http://www.aem.no/download/THE%20CHRONOLOGICAL%20DEVELOPMENT%20OF%20THE%20CHENG%20CYCLE%20STEAM%20.pdf (18 October 2005). Chua, W. F. (2005), Extended performance reporting: An overview of techniques, Institute of Chartered Accountants Australia. City West Water 2005 [website], Drinking water quality report 2005, Available: http://www.citywestwater.com.au/about/docs/CWWDrinkingWaterQualityReport2005.pdf (25 August 2006). City West Water 2005 [website], Water Hardness, Available: http://www.citywestwater.com.au/residential/water_hardness.htm (24 August 2006). Colbry-Energy (20...) Level 2 Energy Audit Report of Cogeneration Plant and Associated
Auxiliaries for … site, NSW. Collis, J., Hussey, R. (2003) Business research: A practical guide for undergraduates and
postgraduate students, 2nd ed., New York: Palgrave Macmillan. Cooper, R., Slagmulder, R. (1997) Target Costing and Value Engineering, Portland Oregon: The IMA Foundation for Applied Research, Productivity Inc. Deegan, C. (2006) Australian Financial Accounting, 4th edition, NSW: McGraw-Hill. Deegan, C. (2003) Environmental Management Accounting: An introduction and case studies
for Australia, Environment Australia, Environment Protection Authority Victoria, Institute of Chartered Accountants Australia.

160
Deegan, C. (2000) “Heading in the right direction”, Charter February 2000 edition pp. 67-70. Deegan, C. (1999) “Triple Bottom Line Reporting: a new reporting approach for the sustainable organization”, Charter April 1999 edition pp. 38-40. Deegan, C., Geddes, S., Staunton, J. (1996) “A survey of Australian accountants’ attitudes on environmental reporting”, Accounting Forum vol. 19(4) pp. 399-416. Deegan, C., Rankin, M. (1996) “Do Australian companies report environmental news objectively?”, Accounting, Auditing & Accountability Journal vol. 9(2) pp. 50-67. Deming, W.E. (1982) Out of the Crisis, Cambridge, MA: The MIT Press. Detroit Engine & Turbine Company (not dated), DETCO Operating and Maintenance
Manual for …, Melbourne. Detroit Engine & Turbine Company (not dated) Training Program manual: Allison 501KH
Co-gen Plant for…, Melbourne. Ditz, D., Ranganathan, J., Banks, R.D. (1995) Green Ledgers: Case Studies in Corporate
Environmental Accounting, Baltimore: World Resources Institute. Drucker, P.F. (1968) The Practice of Management, London: Pan Books Ltd. Dunphy, D., Benveniste, J. (2000) An introduction to the sustainable corporation in Dunphy, D., Benveniste, J., Griffiths, A., Sutton, P. (ed.), Sustainability: "The Corporate Challenge of
the 21st Century", NSW: Allen & Unwin. Eisenhardt, K.M. (1989) Building Theories from Case Study Research in Huberman, A.M., Miles, M.B. (ed.) (2002), The Qualitative Researcher’s Companion, Thousand Oaks, CA: Sage. Elkington, J. (1997 – reprinted 2002) Cannibals with Forks: The Triple Bottom Line of 21
st
Century Business, Oxford: Capstone Publishing. Elkington, J. (1999) “Triple bottom line revolution – reporting for the third millennium”, Australian CPA vol. 69 pp. 75-82. Elkington, J., Knight, P., Hailes, J. (1992) The Green Business Guide: How to take up – and
profit from – the environmental challenge, London: Victor Gollancz. Emblemsvag, J., Bras, B. (2001) Activity-Based Cost and Environmental Management A
Different Approach to the ISO 14000 Compliance, Massachusetts: Kluwer Academic Publishers. Energy Safe Victoria 2005 [website] Introduction, Available: http://www.esv.vic.gov.au/ (7 October 2005). Environment Protection Authority (EPA) Victoria 1998 [website], Accredited Licensee
System: Guidelines for Environmental Management System Certification, Available: http://epanote2.epa.vic.gov.au/EPA/Publications.nsf/PubDocsLU/619?OpenDocument (15 August 2006).

161
EPA Victoria 1970 [website], A Guide to the Sampling and Analysis of Air Emissions and Air
Quality, Available: http://epanote2.epa.vic.gov.au/EPA/publications.nsf/PubDocsLU/440.1?OpenDocument (25 May 2006). EPA Victoria (2002) Energy and Greenhouse Management
Toolkit, Victoria: Sustainable Energy Authority Victoria, State Government of Victoria. EPA Victoria 2005 [website], Environment Protection Act 1970, Available: http://www.dms.dpc.vic.gov.au/Domino/Web_Notes/LDMS/PubLawToday.nsf/a12f6f60fbd56800ca256de500201e54/1289504FD20A7756CA2570CF0022F47C/$FILE/70-8056a150.doc (24 May 2006). EPA Victoria 2005 [website], Environment Protection (Fees) Regulations 2001, Available: http://epanote2.epa.vic.gov.au/EPA/Publications.NSF/PubDocsLU/811.4?OpenDocument (15 August 2006). EPA Victoria 2006 [website], Environment Protection Fees in Victoria: An Overview, Available: http://www.epa.vic.gov.au/about_us/legislation/regulations.asp EPA Victoria 2006 [website], Greenhouse program: Improving energy efficiency for
Victorian business, Available: http://www.epa.vic.gov.au/greenhouse/program.asp (15 August 2006). EPA Victoria 2006 [website], Licences, Available: http://www.epa.vic.gov.au/bus/licences/licences.asp (15 August 2006). EPA Victoria (2001) Notice of amendment of licence: case study company. EPA Victoria 2006 [website], NPI in Victoria, Available: http://www.epa.vic.gov.au/bus/npi/default.asp (17 August 2006). EPA Victoria (2002) Protocol for Environmental Management: Greenhouse Gas Emissions
and Energy Efficiency in Industry, Southbank: EPA Victoria. EPA Victoria (1995) Waste Discharge Licence No EA… issued under section 20 of the
Environment Protection Act 1970: case study company. EPA Victoria (1998) Victorian Government Gazette No. S 107 6 October 1998, Victoria: The Craftsman Press. EPA Victoria (2001) Victorian Government Gazette No. S 240 21 December 2001, Victoria: The Craftsman Press. Epstein, M.J. (1996) Measuring Corporate Environmental Performance: Best Practices for
Costing and Managing an Effective Environmental Strategy, Montvale and Chicago: The IMA Foundation for Applied Research and Irwin. Epstein, M.J., Roy, M.J. (1998) Integrating Environmental Impacts into Capital Investment
Decisions in Bennett, M., James, P. (ed.), The Green Bottom Line: Environmental Accounting
for Management Current Practice and Future Trends, Sheffield: Greenleaf Publishing.

162
Erickson, F. Qualitative Methods in Research on Teaching in Wittrock, M.C. (ed.) (1986) Handbook of Research on Teaching, New York: Macmillan. Essential Services Commission (ESC) 2005 [website], City West Water: Water Price
Determination 1 July 2005 – 30 June 2008, Available: http://www.esc.vic.gov.au/NR/rdonlyres/8064990A-BCA4-4175-8AE4-BEDE96209DCB/0/DeterminationCWW_20050912.pdf (30 August 2006). Essential Services Commission 2002 [website], Gas Distribution System Code (version 8.0
effective from 1 January 2003), Available: http://www.esc.vic.gov.au/gas934.html (05 July 2006). Essential Services Commission 2006 [website], Welcome to Energy: Price Regulation, Available: http://www.esc.vic.gov.au/public/Energy/ (11 September 2006). Ewbank Preece Sinclair Knight (19…) Application for Works Approval to the Environment
Protection Authority for the Cogeneration Scheme for ..., Melbourne. Filbeck, G., Gorman, R.F. (2004) “The Relationship between the Environmental and Financial Performance of Public Utilities”, Environmental and Resource Economics 29 pp. 137-157. Fletcher Construction Australia (19…) … Cogeneration Project 19XX Transaction Documents vols. 1-10 between … and … Fowler, R.J. (1990) International Policy Responses to the Greenhouse Effect and their
Implications for Energy Policy in Australia, in Swaine, D.J. (ed.), Greenhouse and Energy, Melbourne: CSIRO. Frost, G.R., Wilmshurst, T.D. (2000) “The adoption of environment-related management accounting: an analysis of corporate environmental sensitivity”, Accounting Forum vol. 24(4) pp. 344-365. Gago, S. (2002) “Management information for ecologically-oriented decision-making. A case study of the introduction of co-generation in eleven Spanish companies”, Accounting Forum vol. 26(2) pp.191-218. Gas and Fuel Corporation of Victoria (1992) Natural Gas Reference Book, Victoria. Global Reporting Initiative (collaborating centre of the United Nations Environment Programme) (GRI) 2002 [website], Sustainability Reporting Guidelines, Available: http://www.globalreporting.org/guidelines/2002.asp (27 December 2005). Gray, R., Bebbington, J. (2001) Accounting for the Environment, 2nd edition, London: SAGE Publications. Hammersley, M., Atkinson, P. (1995) Ethnography: Principles in Practice, 2nd ed., London: Routledge. Hay, N.E. (ed.), Guide to Natural Gas Cogeneration, in Orlando, J.A. (1988) Appendix D
Glossary, Lilburn: The Fairmont Press, Inc.

163
Henriques, A. (2004) CSR, Sustainability and the Triple Bottom Line in Henriques, A., Richardson, J. (ed.), The Triple Bottom Line: does it all add up? Assessing the Sustainability
of Business and CSR, London: Earthscan. Horngren, C.T., Datar, S.M., Foster, G. (2006) Cost Accounting: A Managerial Emphasis, 12th ed., New Jersey: Pearson Education, Inc. Howes, R. (2002) Environmental Cost Accounting: an Introduction and Practical Guide, London: The Chartered Institute of Management Accountants. Howes, R. (2004) Environmental Cost Accounting: Coming of Age? Tracking Organizational
Performance towards Environmental Sustainability in Henriques, A., Richardson, J. (ed.), The Triple Bottom Line: does it all add up? Assessing the Sustainability of Business and CSR, London: Earthscan. Huberman, A.M., Miles, M.B. (2002) The Qualitative Researcher’s Companion, Thousand Oaks, CA: Sage. Institute of Chartered Accountants in Australia (ICAA) (2006) Financial Reporting
Handbook 2006: Volume 1, Queensland: John Wiley & Sons. Institute of Chartered Accountants in England and Wales (ICAEW) 2004 [website], Information for better markets: Sustainability: the role of accountants, Available: http://www.icaew.co.uk/index.cfm?AUB=TB2I_71159|MNXI_71159 (27 December 2005). International Federation of Accountants (IFAC) 2005 [website], Environmental Management
Accounting, Available: http://www.ifac.org/news/lastestreleases.tmpl?nid=1124902574170148 (20 December 2005). Jasch, C. (2006) “How to perform an environmental management cost assessment in one day”, Journal of Cleaner Production vol. 14 pp. 1194-1213. John Thompson Package Boilers (19…) Package Boiler Operating & Maintenance Manual,
Queensland. Johnson, H.T., Kaplan, R.S. (1987) Relevance Lost: The Rise and Fall of Management
Accounting, Boston, MA: Harvard Business School Press. Jones, B.P. (1989) Energy situation and outlook for Australia, in Swaine, D.J. (ed.), Greenhouse and Energy, Macquarie University, NSW: CSIRO. Kaplan, R.S., Norton, D.P. (1996) The Balanced Scorecard: Translating Strategy into Action, Massachusetts: Harvard Business School Press. Kervin, J.B. (1992) Methods for Business Research, New York: Harper Collins. Kirk, J., Miller, M.L. (1986) Reliability and Validity in Qualitative Research: Qualitative
Research Methods volume 1, Newbury Park: Sage. Kloot, L., Martin, J. (2000) “Strategic performance management: a balanced approach to performance management issues in local government”, Management Accounting Research vol. 11 pp. 231-251.
164
Langfield-Smith, K., Thorne, H., Hilton, R.W. (2003) Management Accounting: An
Australian Perspective, 3rd ed., New South Wales: McGraw Hill Australia Pty Ltd. Lincoln, Y.S. and Guba, E.G. (1985) Naturalistic Enquiry, Newbury Park: Sage. Martin, H.D. (1994) “Environmental management in a global economy - Environmental Planning: Balancing Environmental Commitments with Economic Realities”, GEMI
Conference Proceedings March 16 – 17, pp. 57–64. Maxwell, J.A. (1992) Understanding and Validity in Qualitative Research in Huberman, A.M., Miles, M.B. (ed.) (2002), The Qualitative Researcher’s Companion, Thousand Oaks, CA: Sage. Miles, M.B., Huberman, A.M. (1994) Qualitative data analysis, 2nd ed., Thousand Oaks: Sage. Minichiello, V., Aroni, R., Timewell, E., Alexander, L. (1995) In-depth Interviewing
Principles, Techniques, Analysis, 2nd edition, Malaysia: Addison Wesley Longman Australia Pty Ltd. Minister for Energy Industries and Resources, Minister for the Environment 2006 [website], Media release: Bracks Government cooperation leads to new cogeneration, Available: http://www.dpc.vic.gov.au/domino/Web_Notes/newmedia.nsf/955cbeae7df9460dca256c8c00152d2b/0659f308ac350fa9ca2571dc000655c4!OpenDocument (1 September 2006). Minister for Water 2004 [website], Water Industry Act 1994: Statement of Obligations, Available: http://www.citywestwater.com.au/about/docs/CWWStatement_of_Obligations.pdf (25 August 2006). Minister for Water 2004 [website], Water Industry Act 1994 - Water and Sewerage Licence:
City West Water Limited, Available: http://www.citywestwater.com.au/about/docs/CWW_Licence.pdf (25 August 2006). Minister for Water 2004 [website], Water Industry Act 1994 - Water Industry Regulatory
Order 2003, Available: http://www.esc.vic.gov.au/NR/rdonlyres/70B80EA3-BA25-45EC-AE5F-C74E528B2B3B/0/WIRO_20051025.pdf (30 August 2006). Moller, A., Schaltegger, S. (2005) “The Sustainability Balanced Scorecard as a Framework for Eco-efficiency Analysis”, Journal of Industrial Ecology vol. 9(4) pp. 73-83. Moore, D. (2002), Environmental Management Accounting and Effluent Treatment and
Disposal: An Investigation into the Classification and Allocation of Costs within a Water
Authority, RMIT University. Myer, R. (2006) “Power play for $100m grant: Target is emissions control”, The Age
newspaper – business section, 31 July 2006 p. 1. National Electricity Market Management Company Limited (NEMMCO) 2005 [website], An
Introduction to Australia’s National Electricity Market, Available: http://www.nemmco.com.au/nemgeneral/000-0187.pdf (28 June 2006).

165
National Environment Protection Council (NEPC) 2000 [website], National Environment
Protection (National Pollutant Inventory) Measure: As varied 20 June 2000, Available: http://www.ephc.gov.au/nepms/npi/npi_downloads.html (21 August 2006). Nikolai, L.A., Bazley, J.D., Brummet, R.L. (1976) The Measurement of Corporate
Environmental Activity, New York: National Association of Accountants. Oakley, R., Buckland, I. (2004) What if Business as Usual Won’t Work? in Henriques, A., Richardson, J. (ed.), The Triple Bottom Line: does it all add up? Assessing the Sustainability
of Business and CSR, London: Earthscan. Odum, H.T. (1996) Environmental Accounting: Emergy and environmental decision making, New York: John Wiley. Olsson, L.E. (1994) “Energy-Meteorology: A New Discipline”, Renewable Energy vol. 5 Part II pp. 1243-1246. Parker, L.D. (2000) “Environmental costing: A path to implementation”, Australian
Accounting Review vol. 10(3) pp. 43-51. Parliament of Australia 2006 [website], Energy Efficiency Opportunities Act 2006, Available: http://www.energyefficiencyopportunities.gov.au/index.cfm?event=object.showIndexPage&objectid=B14AD777-D56D-2C65-A823F5127DCFC23F (09 August 2006). Parliament of Australia 2006 [website], Energy Efficiency Opportunities Regulations 2006, Available: http://www.energyefficiencyopportunities.gov.au/index.cfm?event=object.showIndexPage&objectid=B14AD777-D56D-2C65-A823F5127DCFC23F (09 August 2006). Parliament of South Australia 2003 [website], Gas Pipelines Access (South Australia) Act
1997, Available: http://www.parliament.sa.gov.au/Catalog/legislation/Acts/g/1997.74.htm (13 September 2006). Parliament of South Australia 2005 [website], National Electricity (South Australia) (New
National Electricity Law) Amendment Act 2005, Available: http://www.aemc.gov.au/pdfs/NEL.pdf (30 August 2006). Parliament of Victoria 2006 [website], Electricity Industry Act 2000, Available: http://www.dms.dpc.vic.gov.au/Domino/Web_Notes/LDMS/PubLawToday.nsf/a12f6f60fbd56800ca256de500201e54/85C667044DACC2F4CA2571D90001E9C2/$FILE/00-68a038.doc (30 August 2006). Parliament of Victoria 2005 [website], Essential Services Commission Act 2001, Available: http://www.dms.dpc.vic.gov.au/Domino/Web_Notes/LDMS/PubLawToday.nsf/a12f6f60fbd56800ca256de500201e54/4A37953AD8603BBCCA256FD5001B36D9/$FILE/01-62a014.doc (24 August 2006). Parliament of Victoria 2006 [website], Gas Industry Act 2001, Available: http://www.dms.dpc.vic.gov.au/Domino/Web_Notes/LDMS/PubLawToday.nsf/a12f6f60fbd56800ca256de500201e54/E21BB826C212D657CA2571D90002615E/$FILE/01-31a029.doc (22 August 2006).

166
Parliament of Victoria 2004 [website], Gas Pipelines Access (Victoria) Act 1998, Available: http://www.dms.dpc.vic.gov.au/Domino/Web_Notes/LDMS/PubLawToday.nsf/a12f6f60fbd56800ca256de500201e54/440BBCFB940E0AE2CA256E9F00243278/$FILE/98-31a011doc.doc (13 September 2006). Parliament of Victoria 2006 [website], Gas Safety Act 1997, Available: http://www.dms.dpc.vic.gov.au/Domino/Web_Notes/LDMS/PubLawToday.nsf/a12f6f60fbd56800ca256de500201e54/28585497A57ACAF7CA25719C002225E5/$FILE/97-99a025.doc (24 August 2006). Parliament of Victoria 2000 [website], Gas Safety (Gas Quality) Regulations 1999: S.R. No.
4/99, Available: http://www.dms.dpc.vic.gov.au/Domino/Web_Notes/LDMS/PubLawToday.nsf/b12e276826f7c27fca256de50022686b/AED411DA15AD8F56CA256F0F0001DAF2/$FILE/99-4sr002doc.doc (24 August 2006). Parliament of Victoria 2005 [website], National Electricity (Victoria) Act 2005, Available: http://www.dms.dpc.vic.gov.au/Domino/Web_Notes/LDMS/PubLawToday.nsf/a12f6f60fbd56800ca256de500201e54/244CA2FA148F3DEFCA25702F001C848B/$FILE/05-8a001.doc (29 August 2006). Parliament of Victoria 2003 [website], National Environment Protection Council (Victoria)
Act 1995 version 2, Available: http://www.dms.dpc.vic.gov.au/Domino/Web_Notes/LDMS/PubLawToday.nsf/a12f6f60fbd56800ca256de500201e54/53CDCB0EC2ABEE62CA256E660008B515/$FILE/95-10a002doc.doc (21 August 2006). Parliament of Victoria 2005 [website], Safe Drinking Water Act 2003, Available: http://www.dms.dpc.vic.gov.au/Domino/Web_Notes/LDMS/PubLawToday.nsf/a12f6f60fbd56800ca256de500201e54/0E74BCB2AEF215ADCA256FD8007D737D/$FILE/03-46a002.doc (25 August 2006). Parliament of Victoria 2005 [website], Safe Drinking Water Regulations 2005, Available: http://www.dms.dpc.vic.gov.au/Domino/Web_Notes/LDMS/PubLawToday.nsf/8d7b8bff8129f677ca256da50082e1c7/A60F65A04EFA9899CA2570430025BD4C/$FILE/05-88sr001.doc (29 August 2006). Parliament of Victoria 2006 [website], Water Industry Act 1994, Available: http://www.dms.dpc.vic.gov.au/Domino/Web_Notes/LDMS/PubLawToday.nsf/a12f6f60fbd56800ca256de500201e54/325ABCB3FF427F0ECA2571B800097413/$FILE/94-121a052.doc (25 August 2006). Patton, M.Q. (2002) Qualitative research and evaluation methods, 3rd edition, Thousand Oaks: Sage. Pears, A. (2000) Technologies and processes for ecological sustainability in Dunphy, D., Benveniste, J., Griffiths, A., Sutton, P. (ed.), Sustainability: "The Corporate Challenge of the
21st Century”, NSW: Allen & Unwin.
Popoff, F., Buzzelli, D.T. (1993) “Viewpoint: Full-Cost Accounting”, Prism Third Quarter: pp. 69-76.

167
Qest Consulting Pty Ltd 2004 [website], Gas Quality Guidelines – Minutes to Stakeholder
Workshop 26th
November 2004, Available: http://www.ogs.vic.gov.au/ogs/ogsnav.nsf/childdocs/-42D2C35F8477BAD7CA256EA10014DB88-CC3463EC0E148782CA256FF2000D63F9?open (7 October 2005). Roarty, M. 1999 [website], Research Note 21 1998-99 Cogeneration-Combined Heat and
Power (Electricity) Generation, Parliament of Australia, Available: http://www.aph.gov.au/library/pubs/rn/1998-99/99rn21.htm (11 October 2005) Rog, D.J., Huebner, R.B. (1992) Using Research and Theory in Developing Innovative
Programs for Homeless Individuals in Chen, H.T., Rossi, P.H. (ed.), Using Theory to Improve
Program and Policy Evaluations, New York: Greenwood. Rubin, H.J. & Rubin, I.S. (1995) Qualitative interviewing: The art of hearing data, Thousands Oaks, CA: Sage. Scapens, R.W. (1990) “Researching Management Accounting Practice: The Role of Case Study Methods”, British Accounting Review, 22, pp. 259-81. Schaltegger, S., Burritt, R.L. (2000) Contemporary Environmental Accounting – Issues,
Concepts and Practice, Sheffield: Greenleaf Publishing. Schaltegger, S., Muller, K. (1998) Calculating the True Profitability of Pollution Prevention in Bennett, M., James, P. (ed.), The Green Bottom Line: Environmental Accounting for
Management Current Practice and Future Trends, Sheffield: Greenleaf Publishing. Schaltegger, S., Synnestvedt, T. (2002) “The link between ‘green’ and economic success: environmental management as the crucial trigger between environmental and economic performance” Journal of Environmental Management vol. 65 pp. 339-346. Shank, J.K. (1989) “Strategic Cost Management: New Wine, or Just New Bottles?” Journal of
Management Accounting Research vol. 1 pp. 47-65. Shields, D., Beloff, B., Heller, M. (1997) Environmental Cost Accounting for Chemical and
Oil Companies in Bennett, M., James, P. (ed.), The Green Bottom Line: Environmental
Accounting for Management Current Practice and Future Trends, Sheffield: Greenleaf Publishing. Shields, M.D. 1997, “Research in Management Accounting by North Americans in the 1990s”, Journal of Management Accounting Research, vol. 9, pp. 3-61. Square D Company - Schneider Electric 1995 [website], Power Factor Correction Costs,
Benefits, and Cautions, Available: http://ecatalog.squared.com/techlib/docdetail.cfm?oid=090089268012330d (21 September 2006). Standards Australia Limited 2005 [website], About Us, Available: http://www.standards.org.au/cat.asp?catid=21 (7 October 2005). Standards Australia 2000 [website], AS/NZS 1359.5:2000 Rotating electrical machines –
General requirements – Three-phase cage induction motors – High efficiency and minimum

168
energy performance standards requirements, SAI Global, Available: http://www.saiglobal.com/shop/script/Details.asp?DocN=AS777101415727 (23 May 2006). Surma, J.P., Vondar, A.A. (1992) “Accounting for Environmental Costs: A Hazardous subject – How to cope with a changing regulatory and legal framework”, Journal of Accountancy March 1992 pp. 51-55. Sustainability Victoria 2006 [website], Resource Smart Business, Available: http://www.sustainability.vic.gov.au/www/html/2170-resource-smart-business.asp (1 September 2006). Sustainability Victoria 2006 [website], Resource Smart Business Proposal Form, Available: http://www.sustainability.vic.gov.au/www/html/2170-resource-smart-business.asp (16 November 2006). United Nations Department of Economic and Social Affairs Division for Sustainable Development (UNDSD) 2003 [website], Technology: Environmental Management
Accounting Initiative (EMA), Available: http://www.un.org/esa/sustdev/sdissues/technology/estema1.htm (4 June 2005). United Nations Department of Economic and Social Affairs Division for Sustainable Development (UNDSD) 2001 [website], Environmental Management Accounting Procedures
and Principles, Available: http://www.un.org/esa/sustdev/publications/proceduresandprinciples.pdf (04 June 2005). United States Environmental Protection Agency (US EPA) 2005 [website], Beaver Falls,
Niagara Falls, and Syracuse, Available: http://www.epa.gov/airmarkets/applicab/arp/ (04 June 2005). United States Environmental Protection Agency 1995 [website], An Introduction to
Environmental Accounting as a Business Management Tool: Key Concepts and Terms, Available: http://www.epa.gov/docs/opptintr/library/pubs/archive/acct-archive/pubs/busmgt.pdf (04 June 2005). United States Environmental Protection Agency 1996 [website], Full Cost Accounting for
decision Making at Ontario Hydro: A Case Study, Available: http://www.epa.gov/oppt/library/pubs/archive/acct-archive/pubs/ontarhyd.pdf (09 August 2006). United States Environmental Protection Agency (2000) The Lean and Green Supply Chain: A
Practical Guide for Materials Managers and Supply Chain Managers to Reduce Costs and
Improve Environmental Performance, Washington: US EPA. United States Environmental Protection Agency (1996b) Valuing Potential Environmental
Liabilities for Managerial Decision-Making: A Review of Available Techniques in Bennett, M., James, P. (ed.) (1998) The Green Bottom Line: Environmental Accounting for
Management Current Practice and Future Trends, Sheffield: Greenleaf Publishing. Van Maanen, J. (1979) The Fact of Fiction in Organizational Ethnography in Huberman, A.M., Miles, M.B. (ed.) (2002), The Qualitative Researcher’s Companion, Thousand Oaks, CA: Sage.

169
Victorian Energy Networks Corporation (VENCorp) 2003 [website], Access Arrangement for
the Principal Transmission System by Victorian Energy Networks Corporation, Available: http://www.vencorp.com.au/docs/Gas_Market/Market_Management/Access%20Arrangement%202003.pdf (25 August 2006). Victorian Energy Networks Corporation (VENCorp) 2001 [website], Gas Customer
Contestability: Glossary of Terms, Available: http://www.vencorp.com.au/docs/Gas_Contestability/Customer_Info/glossary.pdf (24 August 2006). Victorian Energy Networks Corporation (VENCorp) 2005 [website], Gas Quality Guidelines:
version 7.3, Available: http://www.vencorp.com.au/html/index.htm (23 September 2005). Victorian Energy Networks Corporation (VENCorp) 2006 [website], Gas Market Retail Rules:
version 8, Available: http://www.vencorp.com.au/docs/Gas_Contestability/FRC/Retail_Rules_version_8_(marked_up_from_version_7_to_8).PDF (24 August 2006). Victorian Energy Networks Corporation (VENCorp) 2003 [website], Memorandum between
Essential Services Commission and Victorian Energy Networks Corporation on 16 December
2003, Available: http://www.vencorp.com.au/docs/VENCorp_Publications/Final_MOU_between_ESC_and_VENCorp.pdf (25 August 2006). Victorian Energy Networks Corporation (VENCorp) 2005 [website], Victorian Gas Industry
Market and System Operations Rules: version 25, Available: http://www.vencorp.com.au/docs/Gas_Market/MSOR/MSOR_v25_-_full_text_-_OPERATIONAL_7Apr05.pdf (24 August 2006). Vogt, W.P. (1993) Dictionary of Statistics and Methodology, Newbury Park: Sage. Weizsacker, E.V., Lovins, A.B., Lovins, L.H. (1997) Factor Four: Doubling Wealth –
Halving Resource Use: the new report to the Club of Rome, NSW: Allen & Unwin. Wholey, J.S. (1979) Evaluation: Promise and performance, Washington D.C.: Urban Institute. Winsemius, P., Hahn, W. (1992) “Environmental Option Assessment”, The Columbia Journal of World Business Fall & Winter pp. 249-266. Winter, G. (1988) Business and the Environment, Hamburg: McGraw Hill. World Commission on Environment and Development (1987) Our Common Future, Oxford: Oxford University Press. Yin, R.K. (2003) Case Study Research – design and methods, 3rd edition, Thousand Oaks, California: Sage Publications, Inc. Zadek, S. (2001) The Civil Corporation: The New Economy of Corporate Citizenship, London: Earthscan.

170
Zadek, S., Raynard, P., Forstater, M., Oelschlaegel, J. (2004) [website], “The future of sustainability assurance”, ACCA Research Report No. 86 Available: http://www.accaglobal.com/research/publications/summaries/rr-086?session=fffffffeffffffff0a01213943bb5d2033d3dce979af0a955a2d1257a7a0e80d (04 January 2006).

171
Appendix 1
Glossary
Absolute pressure Gauge pressure plus atmospheric pressure (Gas and Fuel Corporation
of Victoria 1992).
Ambient The temperature of the air surrounding the equipment, measured in
temperature degrees Celsius or Fahrenheit (Hay 1988).
Atmospheric pressure Pressure of weight of water vapour and air on the surface of the earth
which is approximately 101.325 kPa at sea level.
Auxiliary power Electricity consumed internally within a power station or cogeneration
plant for plant operations (Australian Greenhouse Office 2001).
Availability The ratio of time that a unit is capable of being in use to the total time
in a period.
Base load The minimum thermal or electric load produced continuously over a
period of time.
Calorific value, gross Gross calorific value of fuel oil measured in MJ/kg.
Calorific value, net The quantity of heat units released per unit quantity of fuel burned in
oxygen under standard conditions; the products of combustion may
comprise of carbon dioxide, gaseous oxygen, sulphur dioxide, nitrogen
and oxides of nitrogen, and water vapour.
Capacity The rated continuous load-carrying ability of generation equipment,
measured in megawatts; also known as maximum continuous rating
(MCR) or continuous maximum rating (CMR).

172
Capacity factor Total energy generated for a period relative to the total possible amount
of energy that could have been generated for the same period:
Total energy generated for the period (MWh) x 100%
Total installed capacity (MW) x period hours
Compressibility and PV = nRT where:
Super compressibility P = Absolute pressure (Pa)
V = volume (m3)
n = number of moles of gas (kg mole)
R = gas constant for a perfect gas (J/kg mole K)
T = absolute temperature (K)
The excess of compressibility over that indicated by Boyle’s Law is
termed ‘super compressibility’ which depends on the pressure, specific
gravity, temperature and composition of the gas.
Condensate The liquid, usually water, which separates from a gas (including steam
and flue gas) due to an increase in pressure or a decrease in temperature.
Connected load The total volume of gas which can be utilized by all connected
customers of a utility, expressed in cubic metres per unit of time.
Demand load Flow rate of gas in a time interval, expressed in cubic metres per hour
or per day.
Dry gas Natural gas which contains less than 16.1 litres of condensate or crude
petroleum per thousand cubic metres of gas.
Electricity sent out The quantity of gross electricity generated less all auxiliary energy used
by the generating plant and all losses between the generator terminals
and the point where electricity is dispatched for distribution or
transmission to consumer. Also known as net electricity generation.
Measured in MWh.

173
Excess air Air in excess of that theoretically needed for complete combustion.
Measured as a percentage of air required for complete combustion.
Heat (thermal) The maximum amount of heat that can be produced by a system.
capacity
Heating value Measure of the heat of combustion of a fuel. It can be expressed as
mega joules (MJ) or calorific value per unit of volume or weight (for
example per standard cubic meter).
Global warming The instantaneous radiative forcing resulting from the addition of 1 kg
potential (GWP) of a gas to the atmosphere, relative to that from 1 kg of carbon dioxide.
Greenhouse Generic term to indicate the performance of a power plant in regard to
efficiency greenhouse emissions resulting from the combustion of fossil fuels.
Greenhouse intensity Measure of greenhouse efficiency being the emission rate of
greenhouse gases from burning fuel measured in kg CO2 (equivalent) /
MWh sent-out. That is, a ratio of the quantity of greenhouse gases
measured as carbon dioxide equivalent to the quantity of electrical and
if applicable thermal energy generated. For cogeneration, this is
discounted for heat / steam generation.
Heat rate A measure of generating station heat or thermal efficiency. It is the
total fuel heat input in MJ divided by the energy generated from the
power plant in MWh. Its relation to thermal efficiency is as follows:
Heat rate = 3600 x 100, measured in MJ/MWh.
Thermal efficiency (%)
Higher heating value Synonymous with gross calorific value.
Load factor Ratio of the average load over a designated period to the peak load
occurring in that period (hourly, daily, weekly, monthly or annually).
Usually expressed as a percentage.

174
Lower heating value Synonymous with net calorific value.
Output factor Total energy generated relative to the total possible amount of energy
(or load factor) that could have been produced for the service hours during the same
specified period:
Total annual energy produced (MWh) x 100%
Total installed capacity (MW) x service hours
This term is applicable to electricity generators but may not be directly
applicable to some cogeneration plants.
Relative density Density of the dry gas relative to dry air under the same pressure and
(specific gravity) temperature conditions. Density is usually expressed in kg/m3 at 15oC
and 101.325 kPa while relative density is expressed as a ratio. The base
for the specific gravity of liquids and solids is water as unity, and for
gases is dry air as unity.
Service hours The total quantity of hours that a unit was electrically connected to the
transmission system.
Specific gravity The weight of the fuel in relation to water.
Thermal efficiency, Total energy produced (MWh) x 3600 x 100%
Generated Quantity of fuel (kg) x gross calorific value of fuel consumed (MJ/kg)
Thermal efficiency, Total energy sent out (MWh) x 3600 x 100%
Sent-out Quantity of fuel (kg) x gross calorific value of fuel consumed (MJ/kg)
Unaccounted for gas Difference between the total gas accounted for as sales, net interchange
and company use and the total gas available from all sources. The
difference may be due to leakage, discrepancies due to metering
inaccuracies, and variations of pressure, temperature and other
parameters.

175
Viscosity A measure of the resistance to flow and is important in the design of
fuel pumping systems (Boyce 2002). Viscosity of gases affects fluid
flow and heat transfer. Absolute viscosity is measured in Pascal
seconds or centipoises where one centipoise equals 103 Pas. Kinematic
viscosity is the absolute viscosity divided by density in m2/s. The
average absolute viscosity for natural gas is 1.08 x 10⁵ Pas (Gas and
Fuel Corporation of Victoria 1992).
Wobbe Index In regard to gas is an indicator of combustion acceptability for a given
population of appliances. It is the heating value divided by the square
root of the relative density (also known as specific gravity). It is the
most important parameter in terms of gas combustion safety. High
Wobbe index gases may cause excessive formation of carbon monoxide
and NOx, and the potential for explosion from unburnt gas.

176
Appendix 2
The case study company’s cogeneration production process
An understanding of the cogeneration process (refer Appendix 3 for a conceptual
cogeneration flow diagram) is important for this research since this will assist in identifying
areas for improvement in efficiency; and emissions which may be harmful to the environment.
Understanding the cogeneration process will also assist in identifying stages in the process
where emission of green house gases may occur.
Cogeneration – definition and underlying principles
Cogeneration is the process of generating both electrical and thermal energy simultaneously
from the same primary source (Allison Gas Turbine 1992) (refer section 1.3 also for the
definition of ‘cogeneration’). A cogeneration system captures and utilizes the thermal energy
produced by an engine such as a gas turbine which would otherwise dissipate into the
environment as wasted heat. This captured thermal energy can be used for various purposes
such as:
• water heating;
• energy source for another system component; and
• industrial process requirements for example chemical processing and generation of
steam.
Cogeneration is attractive due mainly to the efficiency of fuel use (Allison Gas Turbine 1992).
For example, a conventional electric generation system may require one barrel of oil to
produce 600 kW of electricity, and a conventional steam generating system requires two and a
quarter barrels to produce 8,500 pounds of steam. On the other hand, a cogeneration system
can generate the same amounts of electrical and thermal energy (steam) with two and three
quarter barrels. This results in a savings of half a barrel of oil.
Cogeneration technology can be categorized as either ‘topping’ or ‘bottoming’, depending on
whether electrical or thermal energy is produced first. Topping is the more common mode
whereby electricity is generated first and the remaining thermal energy is then utilized for
further production of electricity, industrial processes et cetera. In a bottoming system, the

177
thermal energy is produced first for use in areas such as steel reheating furnaces. The resulting
hot exhaust wastes are then converted, with a waste heat recovery unit, to electricity via a
steam turbine. Cogeneration systems tend to be gas turbine cycles. One example is the Allison
gas turbine engine where it is claimed that demonstrated fuel savings can range from 15 to
25% over that of conventional systems (that is, non cogeneration systems).
Boyce (2002) affirmed the above classification, stating that combined cycle plants are usually
a combination of the Brayton cycle (gas turbine cycle) and the Rankine cycle (steam turbine
cycle). Boyce (2002) also highlighted the diversity of combined cycle plants, stating that in
most cases the gas turbine is the topping cycle and the steam turbine the bottoming cycle.
Understanding the laws of physics and chemistry is important in understanding cogeneration.
For example, water alone is not energy but the flow of water as used by hydropower stations
is energy (kinetic energy).
Reduction of greenhouse gases
Combustion of natural gas directly produces carbon dioxide and water (Boyce 2002). In gas
turbines, there is plenty of air for combustion and therefore carbon monoxide usually does not
form. In general, carbon monoxide is only produced when there is incomplete combustion
which is typical of idle conditions. Therefore, broadly speaking, the formation of carbon
monoxide from combustion indicates poor efficiency. An advantage of a cogeneration plant is
that it reduces the NOx formed. That is achieved when steam is injected into the combustion
chamber and creates a uniform mixture of steam and air. This uniform mixture reduces the
oxygen content of the fuel-to-air mixture and increases its heat capacity which then reduces
the temperature of the combustion zone and consequently reduces the NOx formed. Generally,
an increase in temperature increases the amount of NOx formed (Boyce 2002). However, in a
Cheng cycle, there is a stage in the steam injection beyond which any reduction in the
emission of NOx is offset by an increase in the emission of CO (refer Appendix 8). Note,
however, that CO is not a greenhouse gas (refer section 1.1).
Overview of the cogeneration process
The plant uses a natural gas-fuelled gas turbine and a waste heat boiler to generate electricity
and steam and operates on the Cheng cycle (Detroit Engine & Turbine Company manual;
Ewbank Preece Sinclair Knight 19…). That is, the only fuel used to drive the gas turbine
generator, the WHB, the induct burner and the package boilers is natural gas (Colbry-Energy
20…). The gas turbine used is a 501-KH gas turbine (rated at approximately … kW without

178
steam injection, and … kW with steam injection) which has been modified to inject steam
into the combustion section. This steam is generated from a heat recovery steam generator or
waste heat recovery boiler using exhaust gas heat. This combination of the ‘Braxton’ gas
turbine cycle with the ‘Rankine’ steam cycle is known as a dual fluid cycle (Allison Gas
Turbine 1992). It gradually became known as the Cheng cycle (Cheng and Nelson 2002).The
Cheng cycle, broadly speaking, is a steam-injected gas turbine which illustrates the
differences between the Cheng cycle and other cogeneration cycles). A conventional open
cycle gas turbine loses 60 to 70% of its turbine power output due to absorption by the
compressor. Therefore, it requires an increase in gas flow alone to have a significant increase
in net turbine power output. However, with the Cheng cycle, high temperature steam
generated from a waste heat recovery boiler (WHB), which is located downstream from the
gas turbine, is injected into the gas turbine. This leads to a huge improvement in overall cycle
efficiency. That is, for a particular quantity of gas fuel, that steam injection can increase the
net power output. Conversely, a particular amount of power output can be maintained with
lower gas fuel consumption. Unlike the conventional combined cycle gas turbine, the Cheng
cycle does not require separate steam turbines, condensers and generators. Therefore, this is
an attraction to small power plants due to the relatively lower initial costs, and less
maintenance since such plant would be relatively simpler. The gas turbine used is an Allison
gas turbine engine where it is claimed that demonstrated fuel savings can range from 15 to
25%.
When steam is injected at …oC at a maximum pressure of 2.50 kg per second (or 5.5 lb per
second), power output is expected to increase by 50% and generating efficiency is improved
by 34%. The turbine inlet temperature (TIT) can be maintained continuously at …oC which
will improve thermal efficiency. The increase in power output is due to a greater mass flow
and greater expansion through the turbine. To better understand the gains in power output and
thermal efficiency from using steam injection, a comparison is made of the estimated
specifications when the turbine is run without steam injection (that is, dry) and with steam
injection, and the improvement with steam injection (in percentage) is as follows:
Variance (%)
Rated power (kW) - liquid 54
Rated power (kW) - gaseous 51
Calculated TIT (oC) 5
Rated RPM (revs per minute) 0
Engine dry weight (kg) 0
179
The cogeneration plant that the company uses is a peaking plant. This means that the plant
only operates during peak hours on weekdays. The plant generates power for its own
requirements when it is operating and generates steam and electricity for the customer.
Since the customers’ usage of steam and electricity fluctuate independently of one another,
there is sometimes a surplus of electricity produced by the cogeneration system. Electricity
which is not required by the customers is not wasted but sold or exported to the grid to be
purchased by utility companies (or power providers).
During off peak hours when the plant is not operating, electrical power is purchased from
another power provider at off peak rates (Colbry-Energy 20…). The package boilers provide
steam to meet the customer’s needs during off peak hours when the cogeneration plant is not
operating, and also to augment the steam produced by the WHB when the cogeneration plant
is operating to meet the customer’s total steam requirements.
Fundamentals of steam generation and steam injection
Power is measured in watts while temperature is a measure of thermal energy and is measured
in Fahrenheit or Celsius. Heat is thermal energy in transition and is measured in British
Thermal Units (BTU) or kJ while enthalpy is a measure of the amount of energy in a pound of
water or steam and is measured in BTU/lb or J/kg. Temperature, pressure and enthalpy are the
main factors that determine steam properties such as how hot the steam is, its energy content
and whether it is saturated or superheated. Superheating involves raising the steam
temperature to over 100oC by increasing the heat. When heat is applied to water, the
temperature rises and steam is formed but this can condensate quickly. If heat is added in a
closed environment, the steam will build up pressure. When the steam is saturated with all the
heat it can contain at the boiling temperature of water which is 100oC at a given pressure, this
is called saturated steam. Steam which is hotter than saturated steam is called ‘superheated
steam’. The saturated steam is sold to the customer and the superheated steam is injected back
into the gas turbine combustion chamber to increase engine thermodynamic efficiency and
improve the heat transfer within the WHB, and reduce the nitrous oxide (NOx) content of the
exhaust gases. The proportion of NOx (parts per million) in the gas turbine exhaust gases is
affected by the residence time of those gases in the combustion chamber and the gas turbine
combustion peak flame temperature. Therefore, by injecting superheated steam into the
combustion chamber, both the exhaust gases’ NOx content (emitted to the atmosphere) and

180
the peak flame temperature are reduced. This principle of operation of a gas turbine, as
discussed in the overview of the cogeneration process, is known as the Cheng cycle.
The energy transformation flow is as follow:
• when gas fuel is burned in the gas turbine or duct burner, chemical energy is converted
into the thermal energy of hot exhaust gas;
• this thermal energy heats up the water in the boiler, increasing the temperature and
pressure and the water changes to steam;
• the steam flows through the steam distribution system which includes a steam header;
• the steam is then sold to the customer and injected;
• as the steam flows through the system the steam pressure, temperature and enthalpy
decrease and the steam turns into condensate where it is stored in the treated water
storage tank and deaerator; and
• the water is then pumped into the boiler again and the cycle repeats itself. This is
known as the Rankine cycle.
Plant performance efficiency
The two factors which most affect turbine efficiencies are temperature and pressure ratios
(Boyce 2002). Therefore, temperature and pressure are two key operating parameters. Gas
turbine thermal efficiency increases when the pressure ratio and turbine firing temperature
increase. At a given temperature, the overall efficiency increases when the pressure ratio
increases. However, the overall cycle efficiency can actually decrease if the pressure ratio
increases beyond a certain value at any given firing temperature. The effect of temperature on
efficiency is very predominant. Every 55.5oC increase in temperature increases work output
by approximately 10% which gives a 1.5% increase in efficiency. Likewise, steam turbine
performance is affected by steam inlet temperature and pressure. A reduction in steam inlet
pressure or steam inlet temperature will reduce efficiency. A reduction in steam inlet
temperature reduces enthalpy, which is a function of both the inlet pressure and temperature.
Lowering the steam temperature also increases the moisture content. Turbine engine
efficiency is the ratio of the real output to the ideal output of the turbine (Boyce 2002).
The current trend is to move from the fix-as-fail maintenance strategy to total performance-
based planned maintenance (Boyce 2002). This is to ensure that the plant has the best
availability and is operating at its maximum efficiency. Another benefit of this maintenance
strategy is to ensure the best and lowest cost maintenance program. This in turn will indirectly

181
ensure that the plant is operating consistently within its environmental constraints, hence
impacting on its environmental performance. Total performance-based planned maintenance
in practice requires on-line monitoring and condition management of all major equipment in
the plant. This includes the use of a distributed control system (DCS). To achieve optimal
just-in-time maintenance with minimal disruption in the operation of the plant requires a good
understanding of the thermodynamic and mechanical aspects of the plant to enable the
implementation of a good predictive maintenance program (Boyce 2002).
The life cycle costs of any equipment are a function of the life expectancy of the various
components of the equipment which is influenced by the efficiency of its operations
throughout its life (Boyce 2002). The three major life cycle cost categories are initial costs,
maintenance costs and operating or energy costs of which operating or energy costs is the
major category. Therefore, operating the plant as close to its design conditions will reduce the
plant’s operating costs. It follows that performance monitoring (of certain parameters) is
essential in any plant condition monitoring system. Such parameters include materials stress
and strain properties, firing temperature, the type of fuel, equipment degradation rates, and the
number of starts and trips (Boyce 2002).
The ASME ‘Performance Test Code on Overall Plant Performance’ ASME PTC 46 provides
detailed procedures to determine power plant thermal performance and electrical output
(Boyce 2002). From an economic point of view, the two most important parameters are the
computation of the power generated and the fuel consumed to generate this power.
Losses in efficiency comprise of two categories as follow (Boyce 2002):
• controllable losses which can be controlled by the plant operator with good
maintenance and operating procedures and or by taking corrective action such as
compressor fouling and inlet pressure drop; and
• uncontrollable losses which cannot be controlled by the plant operator such as ambient
temperature, ambient pressure, ambient humidity and ageing.
Pure preventive maintenance on its own cannot eliminate outages due to plant breakdowns
(Boyce 2002). Breakdowns occur due to various factors such as design and manufacturing
errors in addition to the wearing out of components. Therefore, replacing components at fixed
intervals will not prevent breakdowns completely. A good maintenance program would
include (Boyce 2002):
• complying with proper operating procedures;

182
• maintaining well-regulated basic conditions such as cleaning and lubricating;
• total mechanical, performance and diagnostic condition monitoring;
• improving maintenance and operation skills; and
• improving design defects.
Operating specifications / parameters (extract)
Gas turbine type Detroit Alison 501 KH
Fuel Natural gas and gas turbine exhaust (waste heat)
Turbine base power MW
Turbine exhaust flow Kg/s
Turbine exhaust temperature o C
Excess air (gas turbine combustion) %
Exhaust composition without steam injection (as follows):
O2 % mass
CO2 % mass
SO2 % mass
H2O % mass
N2 and inerts % mass
Total % mass
Natural gas composition as fired (as follows):
CH4 % volume
C2H6 % volume
C3H8 % volume
C4H10 % volume
CO2 % volume
N2 % volume
Total % volume
Gross calorific value kJ/kg
Net calorific value kJ/kg
Density at 0oC and 101.3kPa Kg/Nm3

183
The operating parameters (limits) for the cogeneration plant are specified in the training
manual. These operating parameters represent the conditions under which the cogeneration
plant should be operated.
Module skid
The module skid is a specially designed steel structure. It supports the gas turbine, gearbox,
alternator and associated equipment.
Acoustic enclosure
The acoustic enclosure comprises of the alternator and the turbine compartments, and is
designed to reduce outside noise to an acceptable level.
Gas turbine engine
The Allison 501 KH gas turbine engine is the power generating component of the module. It
converts chemical energy from the gas fuel to electrical energy from the alternator and
thermal energy from the turbine exhaust. Combustion from the burning of gas fuel and air is
used to rotate the turbine shaft which provides the motive force for the alternator. The thermal
energy from the turbine exhaust provides power to the waste heat recovery boiler.
The gas turbine engine comprises of a separate compressor, combustion system, turbine and
exhaust system. The working cycle of the gas turbine engine comprises of four stages which
are induction or air intake, compression of the gas, combustion of the gas fuel with air at a
constant pressure, and finally, exhaust. The turbine engine operates on a continuous cycle and
the parts are separated (that is, non reciprocal) to allow the engine to run more smoothly and
for more energy to be generated for a given engine size. The gas turbine engine used is the
Allison 501-K which has several notable features as follow:
• bleed valves help prevent compressor surge during start and acceleration;
• smoke is eliminated with the use of low emission combustion liners which have
thermal barrier coating on their interiors to increase the turbine’s life and efficiency;
• emissions can be reduced and power increased with the use of nozzle configurations
for water injection; and
• has dual fuel system (uses natural gas with liquid diesel as backup) with automatic
changeover to minimize any disruption to the load being delivered.

184
Gas turbine engine air intake system
The turbine engine air intake system provides cooled filtered air to the engine. The gas turbine
air intake evaporative cooler cools the combustion air when the ambient air temperature is at
or above 18oC to minimize loss of efficiency and maintain power output (Colbry-Energy
20…).
Gas turbine fuel supply system
The purpose of the gas fuel system is to provide a clean metered supply of fuel to the gas
turbine. The gas enters the skid under mains pressure or through the rotary screw compressor
which is located outside the skid. The flow path of the gas is determined by the available
mains pressure and or gas turbine requirements.
The gas flows through a ball valve and the gas filter onto the vortex flow meter. After passing
through this vortex meter, the gas passes through a series of block valves which are installed
on the skid. A tapping between the block valves allows gas to vent to the atmosphere through
the roof of the skid via the vent valve. The block valves are designed to have a special
sequence of operation during the start process to ensure or ‘prove’ their ‘integrity’ for leaks
and operation. This is done prior to starting the turbine. Initially, the vent valve is closed and
the chamber between the block valves is monitored for a pressure increase. If the pressure
increases beyond the limit of 200 kPa within 20 seconds, then the first block valve must be
leaking. Next, the first block valve is opened to allow the gas into the chamber between the
block valves. Then the first block valve closes. Any decline in pressure of more than 200 kPa
within 20 seconds indicates that there is a leak and therefore the start process will be aborted.
If the valves pass this ‘integrity’ test, then the start process can be continued.
Gas compressor (rotary screw compressor)
Where the gas mains pressure is low, a screw compressor is required to boost the gas pressure.
The screw compressor comprises of two rotors enclosed in a casing. Rotation of these rotors
causes the piston to slide along the cylinder and a space is formed. As the volume of this
space increases, a low pressure area is formed which then draws in the gas. Continuous
rotation of these rotors causes the volume of gas which has been drawn in to reduce in volume.
That is, compressed between the rotors and the casing. A discharge port is placed at a
particular point along the casing to allow the gas to flow out of the compressor. The amount
of compression which occurs before the gas is released can be varied by the shaping and

185
positioning of the discharge port. The screw compressor is injected with oil from the oil tank
for the purposes of lubrication, cooling and sealing.
Cooling
When gas is compressed, the increase in the pressure level results in thermodynamic power
being converted to heat in the compressed gas. This discharge temperature can be reduced to
within a predetermined band by injecting oil in sufficient and controlled quantity into the
compressor. This band is normally in the range of 60oC to 100oC. The volume of injected oil
is approximately 1% of the compressor suction volume. Although this volume is relatively
small, its heat absorption capacity is proportionately larger than an equivalent volume of gas
due to it being in a liquid form. Therefore, by injecting a relatively small volume of oil, this
allows for a wide variation in the suction and discharge pressures without any temperature
limitations. The screw compressor can handle a reasonable quantity of liquid such as the
injected oil. This is due to one of its inherent feature, being entirely rotary in action and
rigidly constructed.
Sealing
There must be some clearances or space between the rotors to allow the rotors to mesh
smoothly with some temperature variations. However, this allows the ‘dry’ gas to leak back
through these clearances. This will reduce the compressor’s performance especially at high
pressure differences. These clearances can be effectively sealed by injecting oil into the
compressor.
Oil separation
The injected oil needs to be removed from the compressed gas before the gas leaves the
compressor. This can be done relatively easily since the discharge temperature is low.
Gas compressor cooling tower (Colbry-Energy 20…)
The gas compressor cooling tower provides cooling for the gas and oil in the loop around the
gas compressor and the heat exchanger. The heat absorbed by the cooling water from the
cooling tower system is of ‘low grade’. The gas temperature needs to be reduced otherwise
larger valves will be required to handle the gas volume that flows through.

186
Degassing or the effect of refrigerant solubility in oil
The solubility of the gas in the oil may affect the compressor’s performance. Therefore, to
ensure that the compressor is able to handle soluble gas and oil combinations efficiently, oil is
drawn from the oil tank at discharge pressure and fully saturated with refrigerants. The oil is
then injected into the compressor for lubrication, cooling, sealing and injection. After servings
its functions, this oil (excluding the injection oil) which is saturated with gas at discharge
conditions reduces to suction pressure and collects within the compressor. A large percentage
of gas is released from this oil due to the drop in pressure. In earlier designs of compressors,
this occurred in the suction area of the compressor, resulting in the released gas displacing
incoming gas. This ‘degassing’ can reduce the compressor’s overall performance. With this
later design compressor, the oil is returned not to the suction area but to a point after the
incoming gas has been drawn into the compressor and has been sealed between the casing and
the rotors and is no longer in the suction area including the suction port.
The screw compressor is designed so that the restriction applied to the gas flow from the
discharge, rather than the density of the suction gas, determines the discharge pressure.
Gas fuel filters
The filters are meant to remove any solid or liquid particles from the gas fuel. The filters
comprise of two assemblies connected via valves. Each filter contains an element which
captures solid particles. Liquid, in the form of droplets and mist, are coalesced by the element
and flows through to the bottom of the element into the housing. From here, the liquid is
drained either manually or automatically. If the automatic drainage is not operating correctly,
the housing should be drained often enough to prevent the liquid level from rising to the alarm
level. The liquid comprise mainly of oil from the compressors, with methane (a type of
greenhouse gas) which dissolves under pressure. When the liquid is drained to the atmosphere,
the gas escapes. Therefore, precaution must be taken to ensure that the area is well-ventilated
and that there are no means of ignition to avoid fire and or explosion. If the differential
pressure indicator indicates that an element is blocked, the changeover valves can be operated
so that the turbine runs on the other element.
Electronic gas fuel metering valve
The electronic gas fuel metering valve is designed to be explosion proof and meters natural
gas in accordance with voltage inputs from the control system. Natural gas is supplied to the
valve at a regulated pressure. The valve is a balanced force type which can handle high

187
volume gas flow. It has a dual orifice whereby the inlet and outlet pressures balance each
other on the dual orifice areas. The valve is set to respond to a 0-5 volt signal from the turbine
electronic control which can then control the desired opening of the valve. 0 volts means that
the valve is fully closed and +5 volts means that the valve is fully opened. A linear variable
differential transformer (LVDT) within the valve will then return a feedback output voltage,
which is proportional to the valve position, to the turbine electronic control. This position
feedback from the LVDT, which should be between 0 to -5 volts, is then compared to the 0-5
voltage signal command from the turbine electronic control. 0 volts means that the valve is
fully closed and -5 volts fully open. The signals should be of equal magnitude but of opposite
polarity. If required, the electronic current is varied until the position signal equates to the
command input. Should the input and feedback voltage to the control system vary by more
than 0.5 volts of direct current, a shutdown will occur since this indicates that there is a fuel
system malfunction due to the fuel valve and hence the turbine not being under proper control.
Fuel manifolds and nozzles
The fuel manifolds directs gas from the fuel metering valve to the fuel manifold hoses and
then to the fuel nozzles. The six fuel nozzles ‘break up’ the stream of gas to promote mixing
with air in the combustion chambers. The nozzles should be inspected for carbon deposits
around the outlet holes. A build-up of such carbon is an indication of fuel contamination
probably with oil from the compressors. If the build up is significant, this will distort the fuel
distribution, creating hot spots within the engine which will reduce the turbine life.
Gas fuel pressure and temperature and flow indicators and transmitters
These indicators and transmitters display and measure the gas fuel pressure ad temperature
and gas fuel supply flow.
Ventilation
Ventilation of the gas turbine is necessary to remove any gas leakage and prevent the build-up
of leaked gas to hazardous levels, and to remove any heat build-up (case study company
2004). Another precaution is separating the gas turbine into two compartments with the gas
turbine compartment comprising of the gas turbine, gas fuel filters and valves etc, and the
alternator compartment comprising of the alternator, the reduction gearbox, the lubricating
system components and other ancillaries. This separation of the gas turbine and the fuel
system from the electrical items reduces the risk of fire and explosion.
188
Ventilation of the gas turbine compartment is done with an exhaust fan which is located at the
gas turbine’s exhaust end. However, the turbine is not insulated because this may affect the
temperature of the casing, which would then change in size and upset the integrity of the
turbine. Heat that is radiated from the gas turbine heats the air which comes into contact with
the turbine. The fan draws the air out of the gas turbine compartment which is then discharged
outside the power house via a duct to prevent recirculation of the air. Fresh air then flows into
the compartment from within the power house. This process ensures that the temperature
within the compartment is maintained to within a few degrees of ambience. The temperature
in the compartment must be kept as low as possible because the fuel metering valve and some
other components, albeit to a lesser extent, are sensitive to excessively high temperature. A
suction fan is used to ensure that the ventilation is effective even when a compartment door is
opened. In addition, the ventilation clears any minor gas leakage (note that if there is a major
gas leakage, the gas alarm will shut the turbine down). The fan is started before the turbine is
started to ensure that any flammable gases are removed before any electrical or other activity
which may cause an ignition occurs.
Turbine Engine Water Wash
The turbine engine water wash is necessary for maintenance of compressor efficiency in terms
of optimal power, fuel consumption and service life. Engine performance can decline
gradually due to contamination of the compressor from dirt etc. This contamination reduces
the air supplied for combustion which consequently results in either:
• higher turbine temperature with an increase in fuel consumption to attain the same
power output; or
• higher turbine temperature for the same level of fuel consumption but with lower
power output.
Reduction Gearbox
The Allen reduction gearbox is designed for power transmission and speed reduction. It
transfers the gas turbine power to the alternator shaft and reduces the turbine shaft speed, as
measured in rpm, to the lower speed requirement of the alternator. The maximum power that
can be transmitted with the gear box that was installed is … kW with a gas turbine speed of
14,571 rpm and an alternator speed of 1,500 rpm. In addition, the gearbox provides the motive
power connection for the hydraulic starter motor and the main lube oil pump.

189
Lubricating Oil System
The lubricating oil system includes a reservoir, electrically-driven auxiliary pumps, filters,
piping, pressure gauges and thermometers, pressure and temperature transmitters and pressure
switches which are used for alarms and or shutdowns. This system supplies lubricating oil to
the bearings, gears etc of major rotating assemblies to minimize wear and for cooling. The
injected oil provides an effective film which prevents metal to metal contact and therefore
prevents wear on the rotors. These major rotating assemblies include the gas turbine,
reduction gearbox, alternator and the hydraulic starting system.
Start system (electric starter motor / hydraulic starter pump)
The starting system comprise of a 132kW electric induction motor, and a hydrostatic
transmission (an axial piston hydraulic starter pump and piston hydraulic starter motor, and
lines and hoses). The purpose of this system is to rotate the engine for engine and exhaust
duct gas purging; and to crank the engine while performing compressor washes. However, its
main purpose is to crank the gas turbine, reduction gear and alternator to start the turbine to a
self sustaining speed. The turbine needs to be cranked to 2,250 rpm) (at approximately 15%
speed) before it can be ‘lit’. At this stage, the turbine does not produce enough power to keep
itself going. Therefore, the starter must continue to assist the turbine up to at least 8,400 rpm
(approximately 58% speed) before the turbine can start generating power. Since the starter
installed in this particular project is capable of providing assistance up to 11,000 rpm, it is
used up to this speed. It is critical that the turbine be started within the minimum time possible
otherwise excessive start temperatures may occur. It usually takes about eight minutes to start
the turbine to generate power. The power source for the starting system is mains electricity
power.
When the electric induction motor has been started, the turbine starts to accelerate and the oil
flow to the hydraulic motor increases while the pump maintains the pressure. At the hydraulic
motor speed of 1,514 rpm, the pump displacement is at 51.6 cubic centimetres (Cu. Cm.)
while the motor displacement is at 89.0 Cu. Cm. This allows for a 5% leakage each from the
pump and motor, giving a turbine speed of 4,275 rpm. At 4,000 rpm for the hydraulic motor,
the turbine speed is 11,294 rpm. The electric motor is switched off when the turbine speed
reaches approximately 11,000 rpm. At this speed, the turbine can generate power on its own.
A flow of oil is provided through the transmission for cooling purposes.

190
Leroy Somer alternator
The alternator is an energy conversion device which converts the mechanical energy from the
rotation of the turbine into three phase electrical energy at 11,000 volts for sale and use. It is
rated at … MW and is cooled by the flow of air through it.
Vibration monitoring system
Vibration monitoring devices are installed to detect any excessive vibrations within the gas
turbine, reduction gearbox and alternator to minimize any damage and loss of performance
which will obviously lead to inefficiency.
CO2 gas control stations
The CO2 gas control station allows the discharge of carbon dioxide into the acoustic enclosure.
This is a fire protection system which releases CO2 to put out any fire that is detected by the
sensors.
Fire protection system
The fire protection system includes gas detectors which will trigger an alarm if gas leakage is
detected.
Gas detection system
The gas detection system comprises of the gas detection panel controls and two gas detector
units. The gas detector units are located within the turbine acoustic enclosure and sample the
air which is then exhausted back into the enclosure. Alarms are set at the gas concentrations
preset levels of 20% Lower Explosive Limit (LEL) and 40% LEL.
Turbine engine air intake system
The turbine engine air intake system filters air to the engine.
Waste heat recovery boiler (WHB)
The WHB assembly, which is fitted to the gas turbine module, is designed to recover the gas
turbine exhaust energy and convert this energy into saturated and superheated steam. It
produces injection steam for additional generator electric power output and low pressure
steam for the customer during peak periods. The WHB comprise of major parts such as the
following:
• economizer;

191
• steam drum;
• evaporator;
• induct burner;
• augmenting air supply system and fan;
• steam separator;
• superheater;
• stack and silencer;
• stack damper;
• instrumentation and controls; and
• water sampler.
The WHB is also known as a Heat Recovery Steam Generator (HRSG).
Economizer
The economizer is installed downstream of the boiler in the turbine exhaust flow path. This is
the last component of the HRSG which is part of the WHB assembly that the turbine exhaust
flows through before exiting the exhaust stack. The economizer acts as a heat exchanger,
using the thermal energy (that is, waste heat) from the turbine exhaust to heat feed water from
the deaerator before it is pumped into the boiler. Using the economizer to heat the feed water
reduces the amount of energy which would otherwise be absorbed by the boiler from the
turbine exhaust to maintain the required steam drum temperature and pressure. Therefore, the
economizer increases the overall efficiency of the cogeneration plant by utilizing exhaust
thermal energy that would otherwise have been wasted.
Steam drum
The steam drum acts as a reservoir for feed water supply, saturated steam and as a filter for
impurities that are freed in the evaporator as water flashes to steam. These impurities are
removed by blow downs on a regular basis. A blow down generally involves opening the
boiler to release the water.
Evaporator
The evaporator is a tubed heat exchanger bundle with water pumped from the pumps flowing
through. As the evaporator lies in the path of the gas turbine exhaust gases, the water within
quickly changes to steam.

192
Induct burner
The Coen induct burner is a natural gas fired unit which is located downstream of the
superheater and is operated during peak hours when there is high demand for steam and
electrical power generation. Its purpose is to allow the combustion of gas to raise the
temperature of the gas turbine exhaust gas stream flowing into the boiler. This is in addition to
the combustion of gas by the gas turbine. That is, the induct burner provides supplementary
heating of the turbine exhaust gases (Colbry-Energy 20…). As a result, the evaporator
receives more heat and steam is generated at an increased rate to be passed back to the steam
drum. The main factor in determining when the duct burner should be fired is decreasing
steam drum pressure. Components of the induct burner include:
• main burner gas flow control valve and pilot burner gas pressure regulating valve;
• pilot burner with spark ignition;
• scanner and sight port cooling air supply; and
• augmenting supply.
Augmenting air supply system and fan
The augmenting air supply is required to provide cooling air to prevent overheating and
possible damage, and additional combustion air for improved burner flame stability due to the
high moisture content in the exhaust gases. Combustion air is added, or augmented, to the
turbine gas to supplement for the deficiency in oxygen. The augmenting air flow rate is
regulated by the control system in accordance with the steam injection and duct burner gas
flow rates since an increase in steam injection flow to the turbine will compete with the duct
burner for available oxygen. The augmenting air flow needs to be controlled to ensure that air
is not unnecessarily added to the turbine gas stream. Otherwise, the excess air would absorb
the heat energy and reduce the efficiency of the heat transfer to the boiler by increasing stack
heat loss.
Superheater
The superheater is located immediately downstream of the gas turbine to enable it to receive
the hottest exhaust gases. Gas turbine exhaust is channelled into the superheater through the
turbine exhaust transition duct to produce superheated steam, from saturated steam in the
steam drum, to be injected into the turbine. This process increases operating efficiency by
increasing mass flow through the gas turbine and increases power output while reducing
exhaust emissions such as NOx and CO at the same time. The superheater is made from
stainless steel to minimize the formation of scale which may cause massive damage. Moisture

193
collected in the superheater during start-ups and after shutdowns is drained through valves to
prevent moisture from entering the gas turbine during start-ups.
Silencer and stack
A silencer is fitted to the exit of the WHB to reduce noise emissions, and has four tapping
points as required by the Environmental Protection Authority (EPA) Victoria for gas sampling.
These sample ports are installed between the economizer and the stack to facilitate the
sampling and analysis of exhaust gases for emissions monitoring. The stack is fitted to the
silencer and water entry into the boiler when it is shut down is minimized by attaching a rain
hood to the stack.
Stack damper
As this is a peaking plant, the WHB is operated during peak hours only. However, while it is
shut down during off peak hours, heat is lost from the water (as a result of steam condensing
etc) stored in the WHB as a consequence of the flow of air through the WHB. Therefore, to
minimize this heat loss, a stack damper is fitted to contain this flow of air. By retaining as
much heat as possible in the water within the WHB, this will minimize the amount of time
and energy required to reheat the water to steam.
Instrumentation and controls
Instrumentation and controls include pressure, temperature, flow and level indicators,
transmitters, switches, control and block and safety valves, blow downs and sample cooler.
Steam injection system
The steam injection system within the WHB produces and delivers and controls the flow of
superheated steam to be injected into the gas turbine combustion chamber. It comprises of a
moisture separator, a steam injection control valve, a steam superheater, piping, and
instrumentation and control components. It produces, delivers and controls the flow of
superheated steam for injection into the gas turbine combustion chambers. Saturated steam is
produced in the steam drum of the WHB. The steam then enters the superheater where the
turbine exhaust superheats the steam. The superheated steam then flows past a vortex flow
meter, a block valve and a flow control valve and enters the turbine skid to be injected into the
turbine combustion chamber. The steam injection block valve prevents steam from entering
the turbine whenever the turbine is shutdown or during start-up. In addition, this valve is
closed whenever the turbine trips. The control system via the flow control valve controls the

194
flow of superheated steam to the combustor. The steam injection flow is affected by the
desired turbine generator output, the minimum flow set point and the WHB steam drum
pressure.
Efficient operation of waste heat recovery boilers
The ultimate indicator of the efficiency of the boiler plant is the cost of generating steam.
Therefore, it is vital that records be kept of steam generated, and gas fuel and water consumed
during the plant’s operation. The records should show the flow of steam, water and air, flue
gas and gas fuel analyses, and temperatures. Gas fuel flow rate to the induct burner is
obtained from the gas flow meter. Maintaining accurate records can assist in improving the
overall operation and maintenance of the boiler, ensuring that the boiler is run economically
and safely over time, and reduce outage time. Control of the boiler including the induct burner
is done through the gas turbine control system.
• to measure the flow of water into the boiler, and of the steam generated, water, process
steam and superheated steam flow meters are installed in the WHB;
• an important measure of the efficiency of the fuel-burning equipment, that is WHB in
this case, is flue gas analysis. The silencer has four gas sampling points for the
analysis of flue gas. A flue gas analyzer can be used to check the composition of the
exhaust gas. It is worth noting that the oxygen content does not play a significant role
in this type of plant because of the excess air in the turbine exhaust;
• flue gas temperature is an indication of the amount of heat loss to the stack. In addition,
it gives a general indication of the cleanliness of the boiler system. An increase in flue
gas temperatures may indicate the following:
• the build-up of excessive scale within the boiler tubes which can decrease the heat
transfer capability;
• external contamination of the boiler tubes. This may be caused by insulating
material contaminating the tubes;
• in addition, an increase in stack temperature may be due to inappropriate boiler
water treatment or insufficient boiler blow down.
Water treatment plant
The water treatment plant provides treated water to the WHB and the package boiler. The
plant includes the water filtration and softening system, the treated water tank and the
deaerator (project manual in the construction agreement). The plant performs the following
functions:

195
• water filtration by carbon filters;
• water hardness removal by (sodium) ion exchange softeners (that is, soften the
water prior to deaeration). This will address the problem of scale forming ions
of calcium and magnesium in the water; and
• water pH correction by dosing with caustic soda.
Broadly, the water is treated to prevent metal corrosion and scaling.
Deaerator
The deaerator removes dissolved gases such as free oxygen from the boiler feed water. Water
which is exposed to the atmosphere will absorb the constituent gases present in the
atmosphere which are oxygen, carbon dioxide and nitrogen. Henry’s Law states the
relationship between the mass of gas dissolved in a given volume of water or other solvent at
a given temperature. Therefore, from Henry’s Law, water can be deaerated by maintaining the
appropriate pressure at saturated steam temperature. The dissolved and freed gases will then
exit though a vent valve at the top of the deaerator. Deaeration is important because high
oxygen content can cause corrosion of the components which come into contact with the
water or steam (Boyce 2002).
Black start diesel generator
This diesel generator is connected to the alternator and provides emergency electrical power
with which to start the gas turbine should there be any electrical failure as a result of the
incoming grid supply of electricity. It is not meant to run the gas turbine as an alternative fuel
to natural gas.
Gas supply to the induct burner
Gas is supplied from the utility gas main to the induct burner. The gas flow rate is regulated
by a flow control valve while the gas pressure is controlled by the pressure regulator valve.
The total gas flow is monitored by a flow transmitter. The burner elements are ignited by
separate pilots. The flame is sparked by electronic ignition.
Exhaust System
The exhaust system has the following functions:
• to contain the exhaust gases from the turbine, and bring them to the WHB; and

196
• to capture as much as practically possible of the velocity gas in the exhaust gases and
convert it into static pressure.
When the turbine is running at full load, the exhaust gases are leaving the turbine at
approximately 240 metres per second or 860 kilometres per hour (km/h). Reducing this
velocity gradually, in a smooth flow, transforms the energy of this velocity into pressure. To
achieve this, the first component of the exhaust system is a smooth diffuser which slows down
the gases to approximately 77 metres per second or 277 km/h. The result is a pressure regain
of approximately 11 kPa. If the diffuser were not used, an additional 330 kW would be
required to push the exhaust out which in turn will result in a slight increase in the exhaust
temperature. This exhaust heat is of no use and is just waste heat. Any reduction of pressure at
the turbine exit will reduce the amount of work required to push the exhaust gases out to the
atmosphere. This work is then transferred to the rotor shaft output.
Generator
The electrical generator is the main component in the power generation system and produces
three-phase alternating current (AC) electrical power at 50 cycles per second (Hertz). In the
generator is a rotor that comprises of the generator shaft and all attached components
including coils of wire (which are called field winding). Direct current (DC) from the exciter
at the non-driven end of the rotor shaft is passed through the field windings to create a
magnetic field. The permanent magnet generator is located at the non-driven end of the rotor
shaft. The stationary winding assembly, called the stator, is housed around the rotor. One end
of the rotor shaft is driven by the exhaust. When the rotor turns, rotating magnetic fields are
created which induce voltage in the stationary windings around the magnets. This
electromagnetic field converts the mechanical energy into electrical energy.
Electrical Power Distribution
The electrical distribution system includes motor control centers, power cables, transformers,
circuit breakers, switches, and monitoring and control equipments. A small quantity of the
electricity that is produced is supplied via motor control centers to the gas turbine skid and the
WHB. The bulk of the electricity is exported to the grid.
Package Boilers
The package boilers at the plant comprise of a Maxitherm boiler and a John Thompson boiler.
The package boilers provide the total steam needs of the customer when the cogeneration

197
plant is not operating during off peak hours. These boilers also operate if need be when the
cogeneration plant is operating to supplement the steam production from the WHB. The
package boiler (John Thompson Package Boilers 19…) is designed to produce saturated
steam at working pressures of up to 1,200 kPa. The saturation temperature of steam is 192oC
at 1,200 kPa. The boiler has a nominal rating of …MW which relates to a steam output of
approximately 9,576 kg/hour.
The main cause of boiler failure is low water level. Therefore, there is a low-water alarm to
monitor the water level in the boiler. In addition, water quality is important for high steam
purity and the smooth operation of the boiler. This low pressure boiler produces saturated
steam of up to 1,400 kPa and has a nominal rating of …MW which corresponds to a steam
output of approximately 26,500 kg/h at 100oC or more. The water that is supplied to the boiler
is treated. This is to prevent metal corrosion, and scaling which is the formation of scale from
chemicals that can restrict the flow of water.
Motor Control Centre
The motor control centre is the control point for all auxiliary electrical drives for example
auxiliary pumps and fans.
Plant control system – the Bailey INFI 90 Distributed Control System (DCS)
The plant system comprises of electronic components which controls and monitors plant
functions. The system displays the measured plant parameters and the set points which are the
desired value of the plant parameters. In addition, the system has trend displays which show
graphs of measured plant parameters as a function of time, and alarm displays.

198
Appendix 3
Conceptual Cogeneration Flow Diagram (Ewbank Preece Sinclair Knight 19…)

199

200
Appendix 4
Cogeneration efficiency and greenhouse intensity formulas
4.1 The overall cogeneration efficiency for a cogeneration plant involving the production
of electricity and process steam, and the return of condensate from the process, is calculated
as follows (AGO 2001):
E = PG + (mpshps – m11h11 – mmuhmu)
mFQgr, p, as mFQgr, p, as
where
E energy out (MW)
mF fuel burn rate (kg/s)
Qgr, p, as gross calorific value of fuel at constant pressure (MJ/kg)
PG power at generator terminals (MW)
mps process steam mass flow rate (kg/s)
m11 condensate return mass flow rate (kg/s)
mmu make-up water mass flow rate (where mps = m11 – mmu)
hps process steam enthalpy (MJ/kg)
h11 condensate return enthalpy at the final outlet (MJ/kg)
hmu make-up water enthalpy (MJ/kg)
The efficiency formula stated above represents the equivalent sent-out thermal efficiency (the
concept of sent-out thermal efficiency versus generated thermal efficiency is not used in
cogeneration plants).
A cogeneration plant’s greenhouse intensity is calculated as follows:
3600 x 102 x 1 x Xj (FCO2, j + 21FCH4, j + 310FN2O, j)
Sent-out thermal efficiency Qgr, p, asav.

201
where
Xj mass fraction of each fuel type (j) burnt.
4.2 Under Clause 9.1 of the GES, (AGO 2001), cogeneration efficiency is measured as
follows:
Ethermal + Esent out x 100 percent
Efuel
where
Energy inputs fuel, measured in GJ (Efuel)
Energy outputs thermal energy, usually as steam, measured in GJ (Ethermal)
Electricity sent-out, measured in GJ (Esent-out). These encompass
electricity used by the “host” or the cogeneration customer, and
electricity exported to the grid, less plant auxiliary power.
4.3 Greenhouse intensity for the cogeneration plant can be calculated under Clause 9.2 of
the GES as follows (AGO 2001):
mF x 3.6 x (FCO2 + 21FCH4 + 310FN20)
Ethermal + Esent out
where
mF quantity of fuel used in the period (kg)
F emission factors for CO2, CH4 and N2O respectively where applicable,
from burning fuel j (kg/kg fuel). Formulas for calculating the emission
factors are provided in the GES.
Temperature (Co), pressure (kPa or bar), flow (for example in kg/sec) and mass quantity
(tonnes) data are required for measuring thermal energy in process steam (AGO 2001). In
addition, the enthalpy (GJ/t) is required as well as the flow and temperature (or pressure) for
condensate and make-up water.

202
4.4 The formula for costing the options, as stated in the GES, is as follows (AGO 2001):
Cost / t CO2 avoided = Net cost of implementing greenhouse actions ($)
Tonnes (t) of CO2 saved
where the savings ($) are usually due to fuel savings. For example, if an option has a net cost
of $100,000 per annum (annualized capital cost plus any additional non-fuel operating and
maintenance costs less annual fuel savings) but saves 20,000 t CO2 per annum, the Cost / t
CO2 avoided is $5/t.

203
Appendix 5
Chart of Accounts – extract (case study company 2006)

204

205

206

207

208

209

210
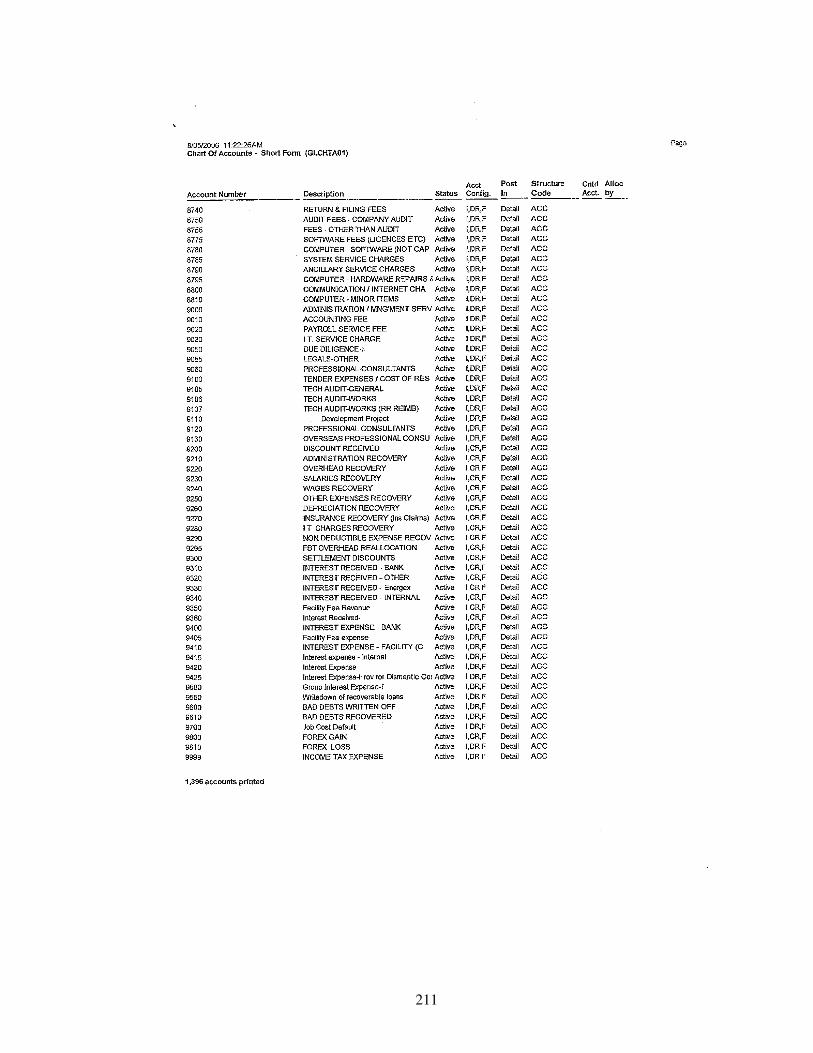
211

212
Appendix 6
Organizational Structure of the case study company (2005)

213

214
Appendix 7-1
Questionnaire for Plant Operator
Section 1: Introduction
1. What is your job title?
2. What is your role in the company?
3. How long have you been in this role?
Section 2: Operational details
1. Can you walk through the plant and describe the cogeneration process (from the inputs
through to the outputs) along the way?
2. What are the wastes discharged from the cogeneration process? Wastes may include
emissions of green house gases, chemical discharge and other wastes (for example waste
heat).
3. How are greenhouse gases emissions identified, measured and monitored (if applicable)?
• what equipments are used?
• how frequent is the measurement and monitoring?
4. What are the optimal or ideal operating conditions (temperature, pressure, humidity,
ambience etc)? Note: consider inputs, process and outputs.
5. Who set the ideal operating parameters, and who reviews? Is there a source of reference
for example Standards Australia?
Section 3: Monitoring and reporting details
1. What do you monitor?
• are there any key performance indicators (KPI) that you need to monitor especially in
regard to emissions and efficiency?

215
2. What monitoring system do you use?
• is the system on real-time or is there a time-lag?
3. What reports are produced?
• is there any report that is specifically related to the environment and plant efficiency?
4. Who are these reports produced for?
• internal that is within the company
• external for example to the EPA of Victoria.
5. How often are these reports produced? Monthly, half yearly, annually? Only on a need-to
basis?
6. Can you go through the reports? Note: Obtain a hardcopy of the reports.
Section 4: Regulatory details
1. What are the regulatory requirements in regard to the environment? For example, EPA
reporting requirements such as the emission inventory report and EPA license submission.
2. Are you involved in the data collection and or reporting?

216
Appendix 7-2
Questionnaire for Central Control Room Operator
Section 1: Introduction
4. What is your job title?
5. What is your role in the company?
6. How long have you been in this role?
Section 2: Monitoring and reporting details
7. What do you monitor?
• what are the operating parameters of the plant?
• do you compare the normal operating parameters of the plant against a benchmark
which is the ideal operating parameters?
• who set the ideal operating parameters?
• are there any key performance indicators (KPI) that you need to monitor especially in
regard to emissions and efficiency?
8. What monitoring system do you use?
• is the system on real-time or is there a time-lag?
9. What reports are produced?
• is there any report that is specifically related to the environment and plant efficiency?
10. Who are these reports produced for?
• internal that is within the company. Who reviews these reports?
• external for example to the EPA of Victoria.
11. How often are these reports produced? Monthly, half yearly, annually? Only on a need-to
basis?

217
12. Can you go through the reports? Note: Obtain a hardcopy of the reports.
Section 3: Regulatory details
3. What are the regulatory requirements in regard to the environment? For example, EPA
reporting requirements such as the emission inventory report and EPA license submission.
4. Are you involved in the data collection and or reporting?

218
Appendix 7-3
Questionnaire for Plant Engineer, Electrical Engineer and Operations Manager
Section 1: Introduction
7. What is your job title?
8. What is your role in the company?
9. How long have you been in this role?
Section 2: Operational details
6. What are the wastes from the cogeneration process?
• any greenhouse gas emissions?
• any chemical discharge?
• any other wastes (for example waste heat)?
7. How are greenhouse gas emissions identified, measured and monitored (if applicable)?
• what equipments are used?
• how much do these equipments cost to purchase and install?
• how frequent are these GHG measured and monitored?
• what is the cost and time involved in taking these readings and analyzing them (if
applicable)?
:
8. Can improving environmental performance lead to increased social and financial
performances? For example, consider whether improving efficiency can lead to a
reduction in GHG emissions or vice versa:
• if yes, how?
• if no, why not?
9. What are the optimal or ideal operating conditions (temperature, pressure, humidity,
ambience etc)? Note: consider inputs, process and outputs.

219
10. Who set the ideal operating parameters?
11. Was a review done to confirm that these are the ideal operating parameters?
12. What is the ideal quality for:
o the inputs:
§ gas;
§ water;
§ air; and
§ steam (that is, steam injection)?
o the production process?
o the outputs:
§ electricity; and
§ steam?
13. Can the company control the quality of the abovementioned inputs, production process
and outputs?
Section 3: Monitoring and reporting details
13. Is there a common measurement unit for all the inputs and outputs?
14. What data is kept in regard to the physical quantities of the inputs and outputs?
15. What is the period of time over which the abovementioned data are kept? For example, is
it on a daily or monthly basis?
16. What are the key performance indicators (KPI) for efficiency? For example:
• output energy (electrical power and steam) equivalent as a ratio of input energy
(natural gas, air, steam, waste heat) equivalent; and
• emissions as a ratio of output energy (electricity and steam generated) equivalent.
17. How are these efficiency performance indicators measured and monitored (if applicable)?
18. What reports are produced in regard to efficiency, especially in regard to the KPIs (if
applicable)?

220
19. Is there any KPI relating to the environment?
20. What reports are produced in regard to the environment, particularly in relation to the
KPIs (if applicable)?
21. Who are these reports produced for?
• for internal purpose that is within the company?
• for external purpose for example to the EPA of Victoria?
22. How often are these reports produced? Monthly, half yearly, annually? Only on a need-to
basis?
23. Who review these reports?
Section 4: Regulatory details
5. What are the regulatory requirements in regard to the environment? For example, the
EPA’s reporting requirements such as the emission inventory report and for the EPA
license submission (obtain a copy of both reports).
6. Can you go through the energy audit report? (Note: obtain a copy of the energy audit
report):
• what is your view on the recommendations in the energy audit report?
7. What are the incentives offered by regulators, for example the federal government of
Australia, to minimize damage to the environment?
8. Are any of the incentives mentioned above available to the cogeneration industry, and in
particular to the company?
9. Are there any penalties for non compliance with the regulations?
Section 5: Plans for the future
1. What are the implications to the company for damaging the environment such as the
emission of GHG:
a. social implications;

221
b. financial implications, and
c. environmental implications?
2. What are the company’s plans in improving its triple bottom line which are its financial,
environmental and social performances?
• can the efficiency of the plant be improved?
• is there any potential cost saving for example by minimizing energy
consumption?
• Can GHG emissions be reduced further?
3. Do you have any personal opinion on improving the company’s triple bottom line?

222
Appendix 8
Cheng Cycle Upstream Injection versus NOx and CO (Detroit Engine & Turbine
Company not dated)

223

224
Appendix 9
Australian legal units of measurement (Australian Government Department of Industry,
Tourism and Resources: National Measurement Institute 2006)
Quantity Name Symbol
Mass kilogram kg
Mass tonne (= 103 kg) t
Mass gram (= 10-3 kg) g
Length Metre m
Time Second s
Electric current Ampere A
Frequency Hertz Hz
Frequency Revolutions per minute (= 60 Hz)
r/min
Pressure Pascal Pa
Pressure Millibar (= 100 Pa) mb or mbar
Energy, work Joule J
Power Watt W
Potential difference, electro-motive force Volt V
Temperature degree Celsius oC
Volume Litre L or l
Volume cubic metre m3
Density kilogram per cubic metre kg/m3 Velocity and speed metre per second m/s
Apparent power Volt ampere VA
Reactive power Volt ampere reactive var
International System of Units (SI) prefixes (Australian Government Department of
Industry, Tourism and Resources: National Measurement Institute 2006) - extract
Numerical value Name Symbol
1015 Peta P
1012 Tera T
109 Giga G
106 Mega M
103 Kilo k 10-3 Milli M

225
Metric conversion (Australian Government Department of Industry, Tourism and
Resources: National Measurement Institute 2006) - extract
Quantity From To Multiply by
Pressure Standard atmosphere (atm) Pascal (Pa) 101325
Volume litres (l) cubic metres (m3) 1E-3
British thermal units (Btu) joules (J) 1.0551E3
joules (J) kilowatt hours (kWh) 2.7778E-7
Energy
kilowatt hours (kWh) joules (J) 3.6E6

226
Appendix 10
Gas – background information
Natural gas is a generic term applied to gases which are commonly associated with
petroliferous geological formations. Therefore, there is no one composition which might be
termed as typical natural gas. The table of compositions and properties of natural gases from
different Australian fields below illustrates this point (Gas and Fuel Corporation of Victoria
1992):
Composition /
properties
Queensland - Roma
(percent by volume)
Western Australia –
North West Shelf
(percent by volume)
Victoria (based on
15oC and
101.325kPa)
(percent by volume)
Methane CH4 87.4 88.1 90.6
Ethane C2H6 5.4 4.9 5.6
Propane C3H8 1.9 2.3 0.8
Butane C4H10 0.8 0.7 0.2 for butane, pentane
Pentane C5H12 0.5 0.1 etc
Nitrogen N2 + Oxygen O2
3.6 1.4 1.1 (0% for O2)
Carbon dioxide CO2 0.4 2.6 1.7
Total 100.0 100.0 100.0
Heating value (MJ/m3) 40.1 39.6 38.7
Relative density (air=1)
0.64 0.643 0.61
Wobbe Index 50.1 49.4 49.4
Based on the natural gas composition for Victoria as illustrated above, the dry air required for
perfect combustion per cubic metre of gas is 9.85 cubic metres or, 16.04 kg per kg of gas in
weight. For a stoichiometric, that is perfect combustion, mixture of this gas, the products of
combustion will be as follow:
Component Wet basis by product volumes
by volumes of natural gas
burned (m3/m
3) or (percent by
volume)
Dry basis (percent by volume)
CO2 1.07 m3/m3 (9.9) 12.2
Water H2O 2.01 m3/m3 (18.5) 0.0 N2 7.79 m3/m3 (71.6) 87.8

227
An increase in the percentage of excess air will increase the percentage of oxygen but
decrease the percentage of carbon dioxide in dry flue gases which arise from the combustion
of natural gas. However, oxides of nitrogen, that is NOx, are formed as part of the combustion
process whereby air acts as the oxidant. The formation of NOx increases with higher
combustion temperatures, higher heat transfer rates, higher excess air ratio and longer
residence time. However, the combustion temperature when burning oil fuels and coal is
higher than when burning natural gas. In addition, efficient gas firing reduces excess air and
hence reduces the formation of NOx. Furthermore, the injection of steam into the air and gas
mixture in the combustion chamber reduces the formation of NOx.

228
Appendix 11
Other EA-related and EMA-related techniques
11.1 Full Cost Accounting and the Sustainability Assessment Model
Full cost accounting (FCA) means the allocation of all manufacturing, sales and
administrative costs to products (Ditz et al. 1995). This has been extended to include the
internalization of environmental costs which were previously considered to be external, for
example, as a result of regulations (Epstein 1996). This broader definition covers the range of
costs (including private and social) throughout a product’s life cycle from the extraction of
raw materials to product disposal.
Therefore, FCA includes allocating the future costs imposed by a product on the environment
back to the product itself (Epstein 1996). Popoff and Buzzeli (1993) argued that air, land and
water are not ‘free’ but rather are economic assets which need to be paid for and allocated in
an efficient and appropriate manner. They believe that the adoption of FCA may ultimately
determine whether a company survives in the long term. A company which considered the
implementation of FCA was Ontario Hydro (Epstein 1996). A concern with FCA is whether
the more environmentally responsible companies will be penalized since their costs will go up
by including environmental costs (Epstein 1996).
An accounting tool, called the Sustainability Assessment Model (SAM), was developed by
British Petroleum (B”) to adhere to the principles of sustainable development (Baxter,
Bebbington and Cutteridge 2004). The SAM is a form of FCA, designed to track significant
economic, environmental, resource and social impacts of projects over their full life cycles
and then convert these positive and negative impacts into a common measurement basis
which is monetary. The SAM is a modification of FCA which attempts to identify all the
internal and external costs and benefits relating to particular projects. Although SAM was
designed as a project evaluation tool to assess the economic, environmental, resource and
social impacts from developing an oil and gas field, Baxter et al. (2004) believed that SAM
could be used to assess the performance of other companies and industries as well.

229
11.2 Life Cycle Assessment and ecological accounting
Life cycle assessment (LCA), also known as life cycle analysis or cradle-to-grave analysis or
eco-balance (Elkington et al. 1992), is an environmental information management tool
(Schaltegger et al. 2000) and is a process which is used to assess the environmental impacts
relating to a product, process or activity (Gray et al., 2001). LCA encompasses the entire life
cycle of the product, activity or process. Hence, the need for ecological accounting which
simply means directly accounting for the physical interactions of the business with the natural
environment (Gray et al. 2001) using physical measurements such as joules (Schaltegger et al.
2000).
The starting point for the LCA (at the life cycle inventory stage) is the product itself, say, a
pencil. The life cycle is then traced (Gray et al. 2001):
• backwards (to the raw materials extraction etc)
• through all intermediate production processes, and
• forward (to its eventual use by consumers etc) from the product.
Life cycle costing can be viewed as an extension of LCA (Epstein 1996). Epstein (1996)
defined life cycle costing as an attempt to identify all the environmental costs – internal and
external – related to a product, process or activity throughout every stage of its life, in
monetary terms (Schaltegger et al. 2000). These stages include research and development,
testing; materials acquisition; manufacturing or production; distribution; use, reuse, recycle,
repairs and maintenance; and waste management. In the past, responsibility for the ultimate
disposal of products, or post-consumer waste, was left to consumers. However, should the
take-back principle be introduced, manufacturers will be required to “take back” their
products when their useful lives end (Epstein 1996; Winsemius et al. 1992). The take-back
principle is an approach that governments can use to reduce and prevent pollution by
motivating manufacturers to design their products in ways that can facilitate recycling and or
disposal. Legislation relating to product-oriented environmental strategy has been introduced
in Europe and Japan (Epstein 1996).
LCA can be used as a basis for environmental accounting. However, LCA has been proven to
be both inefficient and ineffective (Schaltegger et al. 2000), and is not easy to adopt (Epstein
1996). LCA has inherent limitations (Gray et al. 2001). For example, any life cycle may
interrelate with other life cycles (for example, the plant and machinery manufacturers, the

230
paint manufacturers). Therefore, to determine the boundary, lines which are potentially
arbitrary have to be drawn around life-cycle systems. In addition, each LCA will involve an
infinite regress. Taking the example of the pencil, the wood to manufacture the pencil came
from a tree. The tree was an essential element of the local soil ecology and played a role in the
balance of oxygen and carbon dioxide, and housed insects. All these affect the health of the
soil, global warming and bird life (since birds eat insects), which in turn affect other elements
and so on. Therefore, the life cycle of any product would be exceptionally complicated and,
hence, no LCA can be comprehensive and complete. Another example is that there are usually
divergent views regarding the impact of the various elements which can be controversial. One
way of handling this task is to form an independent panel of scientific and environmental
experts who will make judgments about each of the environmentally damaging activities in
the form of an environmental points system to reflect the relative significance of each
pollutant. Another way is to take a series of focused impacts and assess them based on
specific tests (Gray et al. 2001).
11.3 Integrated System of Environmentalist Business Management (the Winter model)
The Integrated System of Environmentalist Business Management (the Winter model) is a set
of environmentalist management techniques which incorporates all sectors of the organization
including research and development, materials management, production, recycling, training,
new plant construction and the selection of equipment and company vehicles (Winter 1988).
It sets out a 20-points checklist of what the environmentalist management approach should
address, which are, briefly (note that some of the points overlap each other):
• management motivation;
• corporate aims and strategies;
• marketing;
• in-house environmental protection arrangements;
• staff motivation and training;
• working conditions;
• canteen food;
• environmental counselling for employees’ households;
• economizing on energy and water;
• product development;
• materials management;
• production technology;

231
• disposal and recycling;
• company vehicles;
• building;
• finance;
• law;
• insurance;
• international business relations; and
• public relations work.
11.4 Environmental Quality Management and Total Quality Environmental
Management
Linked to Total Quality Management (TQM) is Environmental Quality Management (EQM)
which involves striving to comply with regulated environmental standards and seeking
improvements in the quality of the organization’s internal and external environments
(Elkington et al., 1992).
Another variation is Total Quality Environmental Management (TQEM) (Epstein 1996).
TQEM was an adaptation by the Global Environmental Management Initiative (GEMI) of
TQM which was developed by Deming (1982). TQM is a management approach involves the
use of statistical theory to focus on continuous process improvements to better meet
customers’ expectations and needs. Therefore, TQEM is the application of TQM principles to
environmental management to achieve continuous environmental improvements.
11.5 Corporate Environmental Performance Scorecard
Epstein (1996) undertook a study on the practices of companies in effectively identifying,
measuring, monitoring, reporting and managing environmental impacts. In particular, on how
environmental impacts are integrated into the management decision-making process and on
how accountants can enhance this process. These impacts include both costs and benefits. As
a result, Epstein (1996) developed the corporate environmental performance scorecard. He
suggested 10 components for corporate environmental integration as follow:
• development of an environmental strategy;
• integration of environmental concerns into product design systems;
• systems that can help identify, organize and manage environmental impacts;

232
• an internal reporting information system;
• an internal environmental auditing system;
• external environmental reporting and audits;
• costing system;
• capital budgeting system;
• integration of environmental impacts into performance evaluation systems; and
• implementation of a corporate environmental strategy.
A complete Environmental Strategy Implementation (ESI) provides a framework to do a
comprehensive LCA (Epstein, 1996). Total Stakeholder Analysis (TSA), which provides a
systematic analysis of the total environmental impact of a company’s processes, products,
services and other corporate activities on current and future stakeholders, can be integrated
into the ESI to help in identifying the total impact. TSA requires a feedback loop for
continuous monitoring of the impacts so that adjustments can be made where necessary to the
corporate activities. This allows for continuous environmental improvements.
Epstein (1996) realized that measuring useful information in some instances may be too
expensive or difficult. In such instances, the mere identification of the impacts is usually
sufficient to alert management of the effect on stakeholders which may have been ignored
previously in management decision-making. In other instances, the impacts can be quantified
with physical measures or financial measures, therefore providing useful measures. These
measures can then be compared against, say, benchmarks in the same industry or over time;
which can lead to continuous environmental improvements. TSA requires consideration of
both current and future impacts including the possible future impact of external environmental
costs which may be internalized because of future government regulations.
Another approach is the Environmental Remediation Process Model (ERPM) which was
developed by Alcoa (Epstein 1996). The ERPM was designed to develop practical
remediation strategies which are cost effective and in accord with regulatory, technical and
the company’s own perspectives. It was found that environmental remediation had to be
considered early in the strategic planning process to have a substantial impact on project cost.
Another cost management approach that can be applied to environmental costs is strategic
cost management (SCM) (Epstein 1996). Shank (1989) defined SCM as the use of cost

233
information by management with explicit attention to one or more of the four stages of the
strategic management cycle as follow:
• strategy formulation;
• organization-wide communication of those strategies;
• the development and execution of tactics for strategy implementation; and
• the development and implementation of controls for monitoring the success of the
implementation and, hence, in achieving the strategic objectives.
SCM is an interaction of the value chain analysis, cost driver analysis and strategic
positioning analysis. The information obtained from these analyses would be useful input into
the ESI.
11.6 The Sustainability Balanced Scorecard and performance measurement
The balanced scorecard as developed by Kaplan and Norton recognizes that both financial and
non financial measurements of corporate performance are required to effectively manage a
company (Epstein 1996; Chua 2005; Moller and Schaltegger 2005). It forces management to
recognize how improvement in one area may be achieved at the expense of another area. The
four perspectives in the balanced scorecard are financial, customer, internal business process,
and learning and growth, all of which relate to the core values of a company. As
environmental performance becomes a core value of a company, this value should be
integrated into the four perspectives as follow:
• enhanced financial profitability;
• enhanced customer satisfaction;
• enhanced operational effectiveness; and
• enhanced learning and innovation.
Alternatively, environmental performance could be viewed as a fifth perspective to the
scorecard (Epstein 1996), or what is known as the Sustainability Balanced Scorecard (Chua
2005; Moller et al. 2005). Either way, environmental considerations need to be integrated into
the management decision-making process. The environmental information system needs to be
linked to the existing management accounting and financial reporting systems, and integrated
with the current cost management and capital investment decision-making process.

234
Epstein (1996) argued that an environmental information system is necessary to improve
environmental management, although it is insufficient on its own. A system of waste
accounting which includes physical data relating to production yields, waste production and
reduction, and toxicity, provides management with costing information necessary for
decision-making. The environmental information system should be linked to the existing
management accounting and financial reporting systems. Information is needed for
management accounting purposes such as capital budgeting, costing and performance
evaluation. In addition, information is required under financial reporting for the appropriate
accrual of environment-related liabilities and disclosures in the annual reports and
environmental reports. It is likely that both physical and monetized information will need to
be disclosed. While it is arguable whether a link between the environmental information
system with the existing management accounting and financial reporting systems is necessary,
it is certainly preferable. The link will help track waste reduction or toxicity, and relate this to
efficiency and environmental improvements and the associated cost savings. Linking will give
management more complete information for decision-making and better communication and
coordination among employees, and can be attained easily with little financial and employee
costs (Epstein 1996).
Effective environmental management requires an adequate costing system for identifying,
tracking, measuring and accumulating environmental costs for both product costing and
capital investment decision-making, and to understand what causes these costs. Epstein (1996)
stated that determining which costs to include in product costing is controversial. He
identified three categories of costs. The first category is current costs for past sins. These are
current environmental costs to clean up pollution created in the past. Justification for
including such costs is that the current products are benefiting from those prior expenditures
and therefore should bear those costs, too, analogous to research and development
expenditures. In many instances, however, the current products may be improvements on
prior products which are no longer produced and therefore the current products should not
bear those costs. A more appropriate treatment may be to include these costs in overhead or
general administrative expense rather than in product costs. Alternatively, the costs may be
allocated across products rather than to a specific product, therefore lessening the direct effect
on a particular product. This controversy is a result of failure to consider full life-cycle costs.
The second category is current costs for current sins. The consensus is that it is appropriate to
include current environmental costs in current product costs. However, because these costs
may not be adequately separated and tracked, they may be allocated on an arbitrary basis,

235
therefore under-costing some products and over-costing others. This makes analysis for cost
reduction difficult because companies cannot determine which products caused those
environmental costs. Lastly, future costs for current sins. Epstein (1996) argued that current
costs should include an estimate of total product costs. Rather than use current costs for past
sins as a surrogate for the future costs of current production, cost estimation models can be
used that can provide a better estimate.
11.7 TBL and EA
Elkington (1999) was of the view that organizations which refused to face the challenge
implied by the TBL risk extinction. And for TBL to be successful, it would help if there are
widely accepted accounting standards or metrics to measure or account for the economic,
environmental and social activities and impacts. However, this does not appear to be the case
at present (Adams et al., 2004) unlike traditional financial accounting which is strictly
regulated by external legislation and professional standards (Cerin 2002). According to
Howes (2002), the broad approach to environmental cost accounting, which is still evolving,
is to identify where the organization is in regard to its environmental impacts, to set
appropriate sustainability targets to aim for, and to work out the most cost-effective means of
closing the sustainability gap (that is, the gap between the current sustainability levels and the
targeted sustainability levels). With greater understanding of the science of environmental
sustainability, more appropriate targets can be set.
11.8 Environmental management system and risk management
Gray et al. (2001) argued that the only sensible approach to addressing the growing
complexity of the environmental agenda from an organizational perspective is to develop a
fully integrated environmental management system (EMS). The definition of EMS that they
adopted was from the British Standards Institution which refers to the organizational structure,
resources, procedures and processes required to determine and implement environmental
policy. An example of an EMS is ISO 14000 which comprises the following (Gray et al.
2001):
• an environmental policy;
• a management system;
• an assessment of the environmental issues, and legal and voluntary obligations;
• periodic internal audits and reports to top management; and

236
• a declaration to the public that ISO 14000 is implemented.
The need to manage environmental risks is becoming important with the tightening of
environmental legislation and as environmental liabilities grows (Gray et al., 2001). The most
sensible precaution is for organizations to minimize risk at source. Another way of
minimizing the risks is through environmental insurance. However, insurers need to be
assured that organizations are taking steps to minimize risks and ensure legal compliance.
This would involve setting up and maintaining an effective environmental management
system which includes setting up procedures to document, monitor and review all aspects of
the organization’s operations from cradle-to-grave (Gray et al. 2001).
11.9 Activity-based cost and environmental management
Emblemsvag et al (2001) stated that the conventional ISO 14000 implementation may not get
the support required from employees including management because of the sole focus on
environmental issues. However, activity-based cost and environmental management (ABCEM)
can provide management with accurate cost information for cost management and at the same
time with environmental information for environmental management in one single framework
(Emblemsvag et al. 2001). It not only integrates the economic and environmental impact but
is also a more cost efficient approach. This approach is based on building upon modern cost
management principles, especially ABC and ABM, and extends into environmental
management, as opposed to the ISO 14000 approach which starts from an environmental
management perspective and then integrates this with business practices. Emblemsvag et al
(2001) believed that this approach is better because it leverages on the years of knowledge
and experience in cost management. In addition, an activity-based framework is more
accurate and more capable of answering the why-questions (that is, in tracing costs) as
opposed to the conventional management accounting framework. This is because ABC works
on the fundamental principle that resources (such as materials) are used by activities (such as
manufacturing) which, in turn, are consumed by objects (such as products) and therefore can
be traced by resource drivers and activity drivers. Generally, transactions drive costs. In
addition, ABC can be expanded to incorporate non-monetary dimensions. Furthermore, the
environmental assessment is done in a similar and parallel perspective to costs which affect
profitability. Also, having both environmental and economic management in the same
framework makes it easier, compared to having different systems, to identify any win-win
situations and trade-offs between environmental and economic considerations. And, last but

237
not least, cost management is guided, to an extent, by Generally Accepted Accounting
Practices (GAAP) which provides a uniform standard. This approach can build on this
standard to develop analogous Generally Accepted Environmental Accounting Principles
(Emblemsvag et al. 2001).
In addition, Emblemsvag et al. (2001) suggested building on the value chain concept by
including the life-cycle stages of disposal, recycling and or reuse; and considering the
environmental impact from suppliers. Value in many ways can be regarded as the opposite of
waste and, therefore, both are related. Eliminating non-value-added activities means that those
activities would not use resources such as energy and, hence, would not produce waste which
then benefits the environment. Thinking in terms of the value chain can assist in identifying
the stages where energy is consumed and waste produced even though a particular stage may
not consume energy or produce waste (Emblemsvag et al. 2001). Emblemsvag et al. (2001)
recommended thinking in terms of value rather than cost since this may lead to new
opportunities for the organization. They gave an example from their case study on Interface
Flooring Systems, a carpet manufacturer. From a cost perspective, the payback time for
investing in a photovoltaic solar array to manufacture carpets was not feasible because
electricity obtained from the grid was cheaper. However, some customers were willing to pay
a premium for carpet made with clean, renewable energy; thereby enabling the company to set
a higher price for such carpet. As a result, the payback period was reduced to several years
rather than several decades, making the investment feasible. ABM builds on ABC by using
information from ABC to manage costs. In ABM, the emphasis is on managing processes
(which consist of activities) rather than costs per se. ABC has shown that costs cannot be
controlled and therefore the approach is on controlling the activities which cause costs instead
(Youde 1992).
In ABM, non-cost (non-monetary) performance measures including quality measures are also
used. Therefore, ABM, which is process-oriented, can be used in conjunction with TQM
which emphasizes the importance of process continuous improvement. Ferdows and De
Meyer (1990) discussed the importance of focusing on quality in the long term and showed
that to build lasting manufacturing capability, improvements should be made, firstly, to
quality and, then, to dependability of the production system, production flexibility (or reaction
speed that is, time) and finally to cost efficiency.

238
Emblemsvag et al (2001, p. 72) recognized that ‘there is a cost of information’ and that the
more data that are required, the more they will cost.
11.10 Example of a company which used option screening to compare numerous
potential environmental scenarios and report on environmental externalities: the
Niagara Mohawk Power Company (NMPC) (Epstein 1996)
NMPC considered environmental externalities in the context of electricity generation as the
benefits and costs to society relating to electricity supply or consumption which are not
reflected in market prices (and hence are external to the market). The externalities were
monetized based on a dollar per ton of pollutant unit of measurement. The results of the
analysis on the optimum blend of demand and supply strategies in providing electricity at the
least cost within certain constraints are displayed in Table 11.1 (Epstein 1996, p. 182).

239
Table 11.1: Niagara Mohawk Power Company – option assessment
Category Option A Option B Option C
Benefits:
• generation capacity savings
• production cost savings
• emissions savings
• 304
• 1,040
• 155
• 471
• 1,709
• 232
• 566
• 1,573
• 235
Total benefits 1,499 2,412 2,374
Costs:
• gas supply costs
• operating costs
• transmission upgrade costs
• capital costs
• life extension costs
• waste disposal costs
• 0
• 881
• 50
• 750
• 116
• 21
• 0
• 1,402
• 49
• 711
• 77
• 24
• 0
• 1,347
• 49
• 711
• 133
• 24
Total costs 1,818 2,263 2,264
Net present value (benefits less costs)
(319) 149 110
Benefit / cost ratio 0.82 1.06 1.05
Notes:
• the present value of all impacts are stated approximately in 1991 dollars (in millions)
• production cost savings are net of operating, maintenance and fuel costs for the particular option