environmental life cycle assessment in process...
TRANSCRIPT

Environmental Life Cycle Assessment in Process Optimisation
Ana María ELICECHEPLAPIQUI (Universidad Nacional del Sur – CONICET)
Bahía Blanca –[email protected]
PASI – August 2008 - Mar del Plata

Outline
• Motivation.
• Potential environmental impact evaluation.
• Life cycle environmental impact assessment.
• Minimization of life cycle environmental impact.
• Operation of a steam and power sector.
• Different applications
• Conclusions.

Motivation
• Use environmental objectives to support a decision making process.
• Evaluate potential environmental impact from emissions calculated with process simulation.
• Minimization of life cycle environmental impact in process optimization.
• Contribute to a sustainable development in the environmental and economic aspects.

Challenges• Selection of an environmental metric.
• Couple environmental objectives to rigorous process modelling.
(From quantified emissions evaluate potential environmental impact)
• Environmental impact is directly correlated with process emissions so that
the analysis, operation and design stages can be addressed.
• Extend the battery limits to include the mainenvironmental impacts in the life cycle.

Environmental impact evaluation
Select a methodology that allows the quantification of the environmental impacts from the emissions evaluated through process simulation.
Heijungs et al.(1992)

Emissions quantification
Gaseous, liquids and solids

Process modelling and simulation
Rigorous modelling and simulation to quantify emissions.
Emissions
ProductsFeeds Processes
Simulation considering small flows and compositions.

Environmental impact evaluation
Potential environmental impact evaluation
from the contribution of different
environmental impact categories.
Evaluate the environmental impact categories that follows
from process plat emissions.
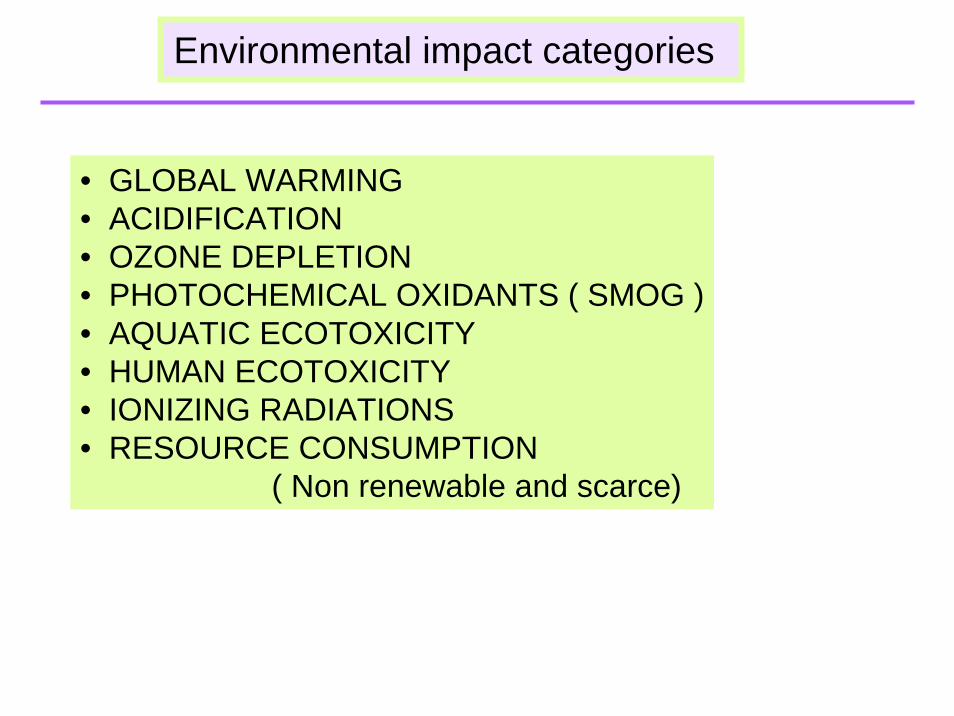
Environmental impact categories
• GLOBAL WARMING• ACIDIFICATION• OZONE DEPLETION• PHOTOCHEMICAL OXIDANTS ( SMOG )• AQUATIC ECOTOXICITY• HUMAN ECOTOXICITY• IONIZING RADIATIONS• RESOURCE CONSUMPTION
( Non renewable and scarce)

∑=k
kjj ψψ Environmental impact category j
Total potential environmental impact: sum of the contributions of categories
ωj waiting factor for each category j
FK flow rate of component k
Heijungs et al, 1992
kj characterization factorcontribution of component k in category j
Environmental impact evaluation
kjkkj γFψ =
∑ ×=j
jj ψωΨ
γ

Rawmaterials
Rawmaterials
UseUse Final dispositionFinal disposition
Emissions to air, water and soil
Production y distributionProduction y distribution
Raw material and energy consumption
Reuse/RecycleReuse/Recycle
Environmental life cycle assessment

Life cycle limits
Extended limitsEmissions
Estimate emissions in the life cycle extended limits.
PROCESSRawmaterials
Productiondistribution
Use
Reuse/ Recycle /
Final disposition
Products

Environmental life cycle
Environmental life cycle has been associated to products and technologies.
Environmental life cycle will be associated to process optimization.
Minimize environmental life cycle:
to select
operating conditions and analysis or design
with rigorous modelling and simulation.

Minimize environmental life cycle
CASE STUDY:
STEAM AND POWER SECTOR OF AN ETHYLENE PLANT
SELECTION OF THE OPERATING CONDITIONS
WITH RIGOROUS MODELLING AND SIMULATION.

Steam and power sector
TCE
TCGC
T2...T11
TCP T1
PTA
Calderas de Fuego Directo
B1...B4
Desaereador
M1...M11
Agua de Reposición
Condensadores de Vacio
Gas Natural Gas Residual
Electricidad Importada
Caldera de recuperación
de calor
Purgas
Cabezal Alta Presion
Cabezal Media Presion
Cabezal Baja Presion
Motores Electricos
Demanda VAP
Demanda VMP
Demanda VBP
Emisiones Gaseosas
Condensados de las Demandas de Vapor
Etileno + Propileno
Etano +Propano
Combustible
Emisiones GaseosasVaporAguaCorriente de Procesos

Minimize environmental impact
Selection of the operating conditions
m
n
UBLB
UP
yx,
{0,1}y
Rx
xxx
0A(y)g(x) 0h(x):s.t.
y)(x,ΨMin
∈
∈
≤≤
≤+=
MINLP problem formulated in GAMS

Operating conditions of steam and power plant
CONTINUOUS OPERATING CONDITIONS :Temperature and pressure of high, medium and low pressure steam headers. Deareator pressure.
BINARY OPERATING CONDITIONS :
Drivers selection between steam turbines and electrical motors for pumps.
Selection of equipment that is ON or OFF related to heaters and their auxiliary air fans and pumps.

Environmental impact evaluation
Emissions evaluation: combustion of natural and residual gases
and purges.
∑×+×+×=p
pAq k,grk,grgnk,gnUPk F ee Fe FF
∑=k
kjj ψψ
kjUPkkj γFψ =Contribution of component k to category j
∑ ×=j
jjUP ψωΨ
Environmental category j
Total potential environmental impact

Operating conditions selection
Minimize environmental impact
m
n
UBLB
UP
yx,
{0,1}y
Rx
xxx
0A(y)g(x) 0h(x):s.t.
y)(x,ΨMin
∈
∈
≤≤
≤+=
Equality constraints include modelling and property predictions.
Inequality constraints include operating conditions and logic constraints.

Objectives and operating conditions
Initial point
MinEnviron.Impact
%change
Environmental impact PEI/h 33188.070 28591.310 13.85Operating cost $/h 1938.341 1777.522 8.30Natural Gas tn/h 8.546 6.995 18.15Imported electricity Kwh 1074.806 3806.508 - 254.18Make up water tn/h 32.000 22.000 31.25High vapour pressure tn/h 193.457 169.568 12.35Heaters purges tn/h 5.327 4.122 22.62HPS Temperature °C 420.000 445.055 -----HPS Pressure bar 50.500 52.000 -----MPS Temperature °C 320.000 310.00 -----MPS Pressure bar 23.000 23.465 -----LPS Temperature °C 210.000 150.00 -----LPS Pressure bar 3.000 5.000 -----Deareator pressure bar 2.500 3.000 -----
CPU time: 11.82 sec, 13 major iterations
Improvements achieved

Main numerical results
Simultaneous reductions in environmental impact, cost, natural gas, make up water, high pressure steam generated are observed.
Increasing the efficiency of the process both environmental impact and cost are reduced simultaneously indicating that they are not conflictive objectives.
Electricity imported has increased.

Driver/Equipment Initial point MINLPSolution
Impulsor Bomba agua torre quenchinq Nº 1 Turbine Motor
Impulsor Bomba agua torre quenchinq Nº 2 Turbine Motor
Impulsor Bomba lubricación Nº 1 Turbine Motor
Impulsor Bomba lubricación Nº 2 Turbine Motor
Impulsor Bomba lubricación Nº 3 Turbine Motor
Impulsor Bomba condensado Nº 1 Turbine Motor
Impulsor Bomba condensado Nº 2 Turbine Motor
Impulsor Compresor aire Turbine Motor
Bomba agua caldera Nº 1, (turbina) OFF OFF
Bomba agua caldera Nº 2, (turbina) OFF OFF
Bomba agua caldera Nº 3, (motor elec.) ON Motor
Bomba agua enfriam. Nº 1,(turbina) ON OFF
Bomba agua enfriam. Nº 2 (turbina) ON OFF
Bomba agua enfriam. Nº 3, (motor elec.) ON Motor
Bomba agua enfriam. Nº 4, (motor elec.) OFF Motor
Bomba agua enfriam. Nº 5, (motor elec.) OFF OFF
Impulsor Ventilador caldera Nº 1 OFF OFF
Impulsor Ventilador caldera Nº 2 Turbine Motor
Impulsor Ventilador caldera Nº 3 Turbine Motor
Impulsor Ventilador caldera Nº 4 Turbine OFF
Caldera Nº 1 OFF OFF
Caldera Nº 2 ON ON
Caldera Nº 3 ON ON
Caldera Nº 4 ON OFF
Motors: 13
Turbines: 0
Motors: 2
Turbines: 13Initial point
Solutionpoint
Binary variables
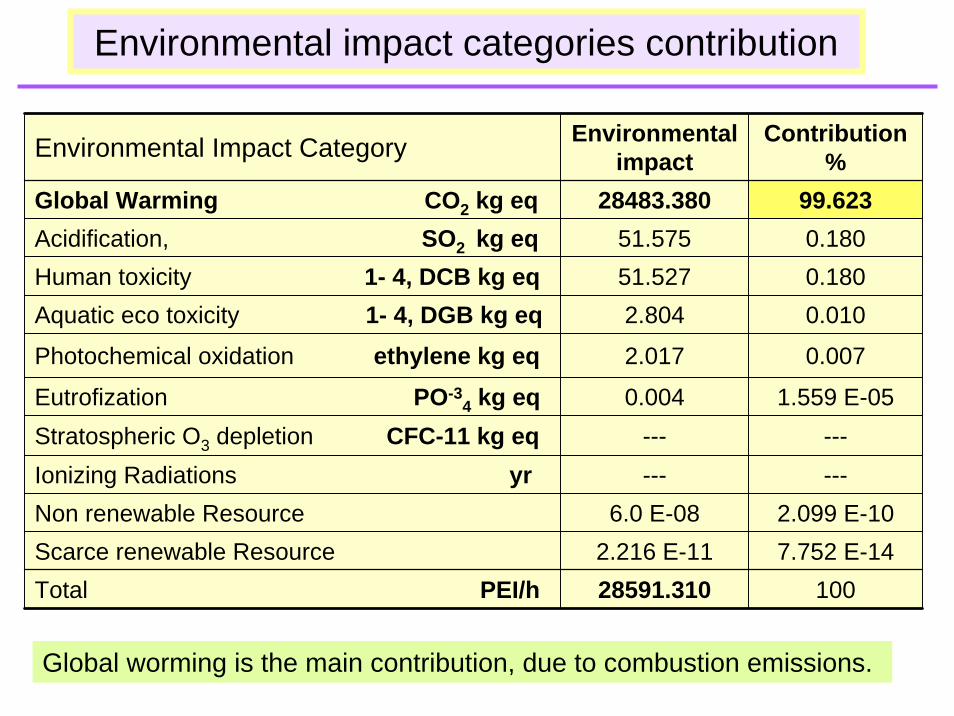
Environmental Impact Category Environmentalimpact
Contribution %
Global Warming CO2 kg eq 28483.380 99.623Acidification, SO2 kg eq 51.575 0.180Human toxicity 1- 4, DCB kg eq 51.527 0.180Aquatic eco toxicity 1- 4, DGB kg eq 2.804 0.010
Photochemical oxidation ethylene kg eq 2.017 0.007
Eutrofization PO-34 kg eq 0.004 1.559 E-05
Stratospheric O3 depletion CFC-11 kg eq --- ---Ionizing Radiations yr --- ---Non renewable Resource 6.0 E-08 2.099 E-10Scarce renewable Resource 2.216 E-11 7.752 E-14Total PEI/h 28591.310 100
Environmental impact categories contribution
Global worming is the main contribution, due to combustion emissions.

TCE
TCGC
T2...T11
TCP T1
PTA
Calderas de Fuego Directo
B1...B4
Desaereador
M1...M11
Agua de Reposición
Condensadores de Vacio
Gas Natural Gas Residual
Electricidad Importada
Caldera de recuperación
de calor
Purgas
Cabezal Alta Presion
Cabezal Media Presion
Cabezal Baja Presion
Motores Electricos
Demanda VAP
Demanda VMP
Demanda VBP
Emisiones Gaseosas
Condensados de las Demandas de Vapor
Etileno + Propileno
Etano +Propano
Combustible
Emisiones GaseosasVaporAguaCorriente de Procesos
Life cycle environmental emissions

Potencia
Vapor
Agua
Extracción & Procesamiento Transporte
Gas Natural
Reserva regional de agua Transporte
Emisiones Liquidas
Emisiones Gaseosas
Minería & Procesamiento Transporte Generación de
Electricidad
Carbón
Extracción & Procesamiento Transporte Generación de
ElectricidadRefinado
Derivados de Petroleo
Extracción & Procesamiento Transporte Generación de
Electricidad
Gas Natural
Nuclear
Minería & Procesamiento
Conversión & Enriquecimiento
Fabricación Barra Combustible
Generación de Electricidad
Almacenamiento combustible agotadoHidroeléctrica
Construcción de la presa
Generación de Electricidad
Electricidad
Emisiones Gaseosas
Transmissionlosses
CARBÓN
DERIVADOS DE PETRÓLEO
EMISIONES
GASEOSASEMISIONES
GASEOSAS
EMISIONES GASEOSAS
GAS NATURAL
NUCLEAR
HIDROELÉCTRICA
ELECTRICITY
NATURAL
GAS
Life cycle environmental emissions and impacts
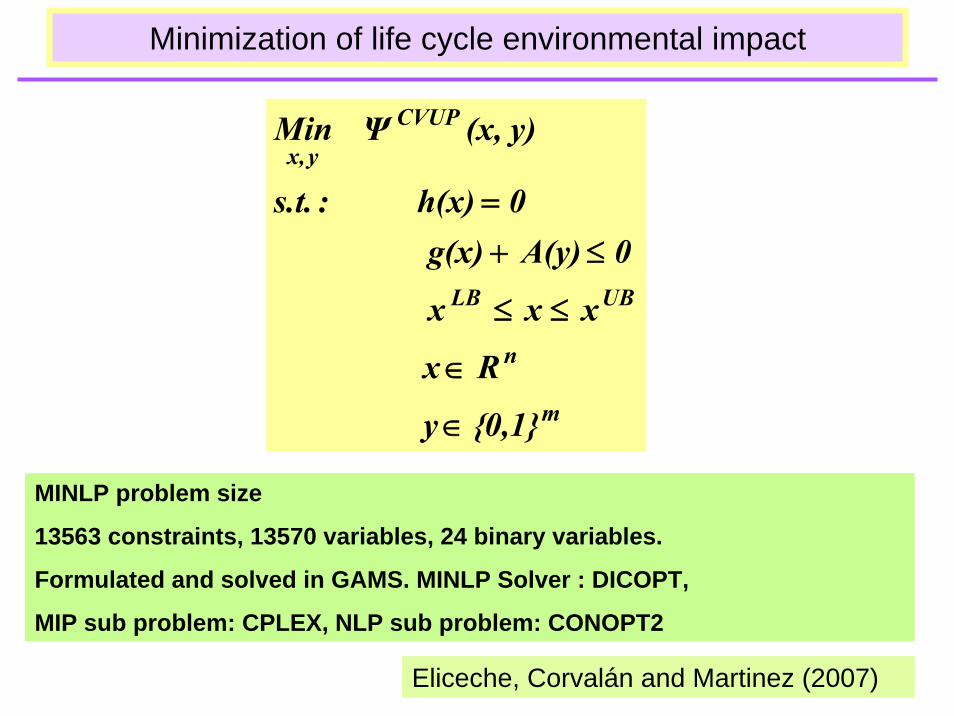
Minimization of life cycle environmental impact
MINLP problem size
13563 constraints, 13570 variables, 24 binary variables.
Formulated and solved in GAMS. MINLP Solver : DICOPT,
MIP sub problem: CPLEX, NLP sub problem: CONOPT2
m
n
UBLB
CVUP
yx,
{0,1}y
Rx
xxx
0A(y)g(x) 0h(x):s.t.
y)(x,ΨMin
∈
∈
≤≤
≤+=
Eliceche, Corvalán and Martinez (2007)

Objectives and operating conditions
Initialpoint
MinLCEI
%change
Environmental impact PEI/h 33627.33 29544.101 12.14Operating cost $/h 1938.341 1638.355 15.48Natural Gas tn/h 8.546 7.167 16.13Imported electricity Kwh 1074.806 1138.947 - 5.97Make up water tn/h 32.000 22.000 31.25High vapour pressure tn/h 5.327 4.205 21.06Heaters purges tn/h 193.457 170.90 12.03HPS Temperature °C 420.000 450.000 -----
HPS Pressure bar 50.500 52.000 -----
MPS Temperature °C 320.000 310.000 -----
MPS Pressure bar 23.000 23.816 -----
LPS Temperature °C 210.000 150.00 -----
LPS Pressure bar 3.000 4.015 -----
Deareator pressure bar 2.500 2.683 -----
Improvement minimizing life cycle environmental impact
CPU time: 3.10 sec, 3 major iterations

Driver / Equipment Initial point MINLPSolution
Impulsor Bomba agua torre quenchinq Nº 1 Turbine Turbine
Impulsor Bomba agua torre quenchinq Nº 2 Turbine Turbine
Impulsor Bomba lubricación Nº 1 Turbine Turbine
Impulsor Bomba lubricación Nº 2 Turbine Turbine
Impulsor Bomba lubricación Nº 3 Turbine Turbine
Impulsor Bomba condensado Nº 1 Turbine Turbine
Impulsor Bomba condensado Nº 2 Turbine Turbine
Impulsor Compresor aire Turbine Turbine
Bomba agua caldera Nº 1, (turbina) OFF OFF
Bomba agua caldera Nº 2, (turbina) OFF OFF
Bomba agua caldera Nº 3, (motor elec.) ON ON
Bomba agua enfriam. Nº 1,(turbina) ON ON
Bomba agua enfriam. Nº 2 (turbina) ON OFF
Bomba agua enfriam. Nº 3, (motor elec.) ON ON
Bomba agua enfriam. Nº 4, (motor elec.) OFF OFF
Bomba agua enfriam. Nº 5, (motor elec.) OFF OFF
Impulsor Ventilador caldera Nº 1 OFF OFF
Impulsor Ventilador caldera Nº 2 Turbine Turbine
Impulsor Ventilador caldera Nº 3 Turbine Turbine
Impulsor Ventilador caldera Nº 4 Turbine OFF
Caldera Nº 1 OFF OFF
Caldera Nº 2 ON ON
Caldera Nº 3 ON ON
Caldera Nº 4 ON OFF
Motors: 2
Turbines:11
PEI / Kwh
PS = 0.276
EI = 0.387
BINARY VARIABLES
Motors: 2
Turbines: 13Initial point
Solutionpoint

Generators EnvironmentalImpact PEI / h
Electricity ImportedKwh
PEI / Kw
Hydro electric 90.092 442.601 0.204Thermo Natural Gas -Gas turbine 158.159 325.368 0.486Thermo Natural Gas - Vap turbine 58.795 104.716 0.561Thermo Fuel Oil - Vap turbine 57.413 63.580 0.903Thermo Gas Oil - Vapour turbine 57.038 89.750 0.636Thermo Carbon - Vapour turbine 11.767 11.221 1.049Nuclear 7.707 101.709 0.076Total – Medium value 440.972 1138.947 0.387
Ratio of environmental impact to power generated
Life cycle potential environmental impact for each type of electricity generation.
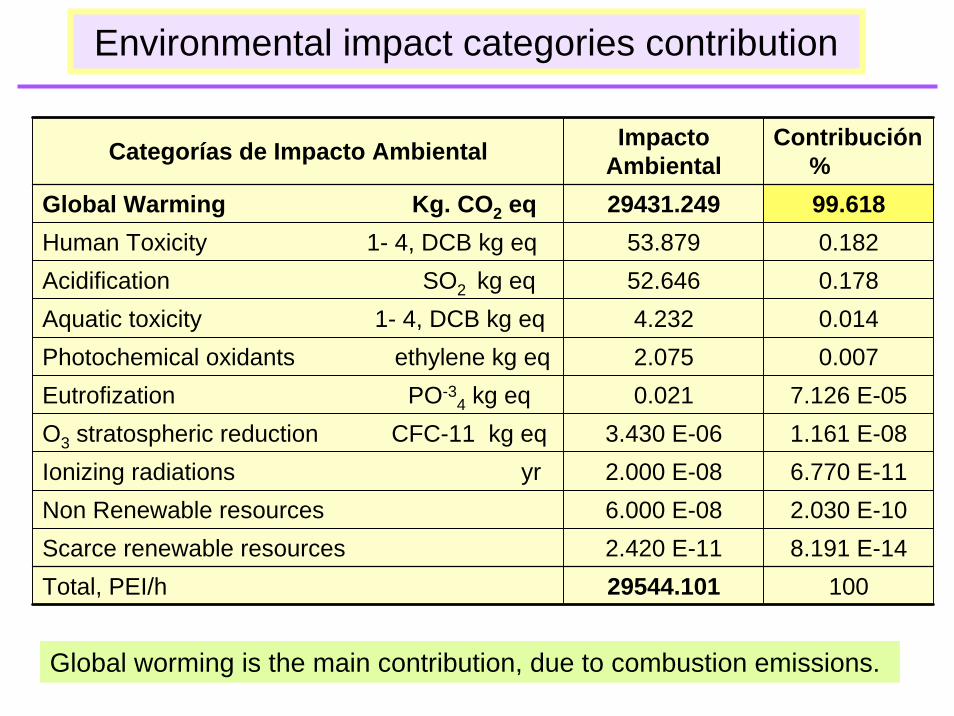
Categorías de Impacto Ambiental ImpactoAmbiental
Contribución %
Global Warming Kg. CO2 eq 29431.249 99.618Human Toxicity 1- 4, DCB kg eq 53.879 0.182Acidification SO2 kg eq 52.646 0.178Aquatic toxicity 1- 4, DCB kg eq 4.232 0.014Photochemical oxidants ethylene kg eq 2.075 0.007Eutrofization PO-3
4 kg eq 0.021 7.126 E-05O3 stratospheric reduction CFC-11 kg eq 3.430 E-06 1.161 E-08Ionizing radiations yr 2.000 E-08 6.770 E-11Non Renewable resources 6.000 E-08 2.030 E-10Scarce renewable resources 2.420 E-11 8.191 E-14Total, PEI/h 29544.101 100
Environmental impact categories contribution
Global worming is the main contribution, due to combustion emissions.

Environmental impact of each stage of the life cycle
Electricity generators Utility plant
Life cycle stage
HidroElec.
Naturalgas
Vapour Turbine
Fuel Oil Vapour Turbine
Gas OilVapour Turbine
CarbonVapour Turbine
Gas Natural
Gas
Turbine
Nuclear
Natural Gas
ResdGas
CONSTRUCTION 5.214 ----- ----- ----- ----- ----- 16.766 ----- -----
EXTRACTION ----- 1.354 0.111 0.022 0.720 1.461 6.587 1.461
CONVERSION ----- ----- ----- ----- ----- ----- 1.198 ----- -----
ENRICHMENT ----- ----- ----- ----- ----- ----- 44.910 ----- -----
FUEL FABRICATION ----- ----- ----- ----- ----- ----- 4.192 ----- -----
TRANSPORT ----- 6.801 E-03 0.037 0.011 0.026 7.337 E-
03 ----- 7.368 E-04 -----
REFINING ----- ----- 0.031 0.06 ----- ----- ----- ----- -----
REPROCESSING ----- ----- ----- ----- ----- ----- 7.185 ----- -----
OPERATION 94.786 98.639 99.821 99.960 99.254 98.531 19.162 98.538 100

Minimizing operating cost
CWCWFWFWE
impENGNG FcFc W cFcC +++= &
Cost of : natural gas + electricity + make up water + water treatment
m
n
UBLB
yx,
{0,1}y
Rx
xxx
0A(y)g(x) 0h(x):s.t.
y)(x, CMin
∈
∈
≤≤
≤+=
Formulation of the MINLP Problem

Solutions minimizing environmental impact and operating cost
Objective Function Min Cost % DevMinLCEI % Dev
Min IAUtility % Dev
Cost $ / h 1624.133 0 1638.355 0.868 1777.522 8.629
Life Cycle EI PEI / h 29595.394 0.173 29544.101 0 30065.070 1.733
Utility EI PEI / h 29335.360 2.536 29103.130 1.759 28591.310 0
Similar solutions are found when minimizing operating cost and life cycle environmental impact, with variations between 0.1 to 1 %.
IT IS VERY IMPORTANT TO EXTEND THE LIMITS TO INCLUDE THE MAIN ENVIRONMENTAL IMPACTS FROM ESTIMATED EMISSIONS.
In this case study, environmental impact and cost are not conflictive objectives if bounds are properly defined.
While comparing results with between cost and environmental impact of the utility plant , differences of 8.6 % in cost and 2.5 % in environmental impact are observed .

APPLICATIONS
SELECTION OF THE ELECTRICITY GENERATORS IN THE ARGENTINIAN INTERCONECTED NETWORK.
DESIGN OF THE PERVAPORATION MEMBRANE MODULES IN A HYBRID SEPARATION SYSTEM WITH AN AZEOTROPIC DESTILLATION COLUMN.

CONCLUTIONS
DEVELOPMENT OF METHODOLOGIES TO:
• Quantify potential environmental impact of industrial process and plants.
• Estimate the main environmental impacts associated to process life cycle.
• Minimize life cycle environmental impact in process optimization.
APPLICATION TO:
• Operation of a steam and power generation plant.

REFERENCES
Azapagic A., 1999, Life Cycle Assessment and its applications on process selection design and optimization. Chemical Engineering Journal, 73, 1-21.Azapagic A. and Clift R., 1999, The application of life cycle assessment to process optimization. Computers and Chemical Engineering, 23 (10), 1509-1526.Cabezas H., Bare J. and Mallick S. 1999. Pollution prevention with chemical process simulator the generalized waste reduction algorithm. Computers and Chemical Engineering, 23, 623-634.Dantus M. and K. High , 1999, Evaluation of waste minimization alternatives under uncertainty: a multiobjective optimization approach, Computers and Chemical Engineering, 23, 1493-1508.Eliceche, A., Corvalán, S. and Martinez, P. 2007. Environmental life cycle impact as a tool for process optimization of a utility plant, Computers and Chemical Engineering, 31, 648-656.Eliceche, A.M. and Martinez, P.E. 2007. Minimization of life cycle CO2 emissions in a petrochemical utility plant. Chemical Engineering Transaction, Vol.XII, 2007 - PRES'07 Proceedings.Heijungs, R., Guinée, J., Huppes G., Lankreijer, R.M., Ansems, A.A.M., Eggels, P.G., van Duin, R. de Goede, H.P. 1992. Environmental Life Cycle Assessment of Products-Guide and Backgrounds. Centre of Environmental Science (CML).Leiden.Martinez P., and Eliceche A. 2007. Minimization of life Cycle CO2 emissions in the operation of a steam and power plant. 17th European Symposium on Computer Aided Process Engineesing – ESCAPE17. V. Plesu and P.S. Agachi (Editors).Young D., Scharp R. and Cabezas H. 2000. The waste reduction (WAR) algorithm: environmental impacts, energy consumption, and engineering economics. Waste Management20 (8), 605-615.