environmental impact of aquaculture on coastal … excretion of n and p (e ... is no formal way to...
TRANSCRIPT

K. Tsukamoto, T. Kawamura, T. Takeuchi, T. D. Beard, Jr. and M. J. Kaiser, eds.Fisheries for Global Welfare and Environment, 5th World Fisheries Congress 2008, pp. 181–196.© by TERRAPUB 2008.
The main focus of this paper is the nutrient emission from cage aquaculturesystems (CAS) in coastal waters and its potential environmental impact onpelagic ecosystems. The nutrient emission from CAS can be estimated basedon mass balance using feed use, fish production, nutrients in feed and fish,and digestibility of nutrient components as input data. CAS release inorganicnutrients (NH
4 and PO
4), particulate organic nutrients, and dissolved organic
nutrients. Pelagic ecosystems are primarily affected by the inorganic nutri-ents. A typical Norwegian salmon farm producing 1000 tonnes fish per yeargenerated an amount of nutrient wastes comparable to a community of 7,500to 10,000 people, with highest emission rates during summer. 3D hydrody-namic modelling is needed to estimate the dilution and transport of nutrientsfrom CAS. Pelagic ecosystems have an inherent capacity of persistence, andsmaller changes in nutrient input are mitigated through adaptive responses.There is an upper assimilation capacity above which pelagic ecosystems mayloose integrity. The assimilation capacity of the pelagic ecosystem is medi-ated by two main mechanisms; the incorporation of nutrient in the organismsand a dilution process driven by hydrodynamics. There is a need for a system-atic waste management from aquaculture in the future.
KEYWORDS cage aquaculture; nutrients; environmental impacts;eutrophication; pelagic ecosystem; hydrodynamics; nutrientassimilation; waste management
Environmental Impact of Aquacultureon Coastal Planktonic
Ecosystems
Yngvar Olsen* and Lasse Mork Olsen
Trondhjem Biological StationDepartment of Biology
Norwegian University of Science and TechnologyTrondheim, Norway
*E-mail: [email protected]

182 Y. OLSEN AND L. M. OLSEN
1. Introduction
There is now a growing attention and con-cern worldwide on societal aspects of the fastgrowing aquaculture industry. These con-cerns include for example animal welfare andparticularly environmental impacts of ma-rine aquaculture on coastal ecosystems (FAO2006). Environmental concern and emerg-ing new legislation, together with a growingcompetition for space in coastal waters, arebecoming among the most important driv-ers for the development of marineaquaculture activities in western countries inthe years to come. Two lines of developmentare apparent. Cage aquaculture systems(CAS) are gradually moved to more open sealocations, characterised by higher hydrody-namic energy, and land- and coastal basedrecycling aquaculture systems (RAS) areincreasingly used for production of earlystages and more local species. These trendsof development are believed to continue(Olsen et al. 2008).
The social perception of the importanceof an environmental problem is affected bythe physical and biological characteristics ofthe coastal system as well as interactions withother important industries or human activi-ties in the coastal zone. The major environ-mental concerns in Southern Europe are nu-trient and organic waste emission from CASin Mediterranean aquaculture producingmainly European sea bream and sea bass.Wastes from CAS are believed to cause eco-system degradation and algal blooms. Thisis particularly regarded as a main threat forthe blue water image of the stronger touristindustry, which is competing severely forspace with aquaculture in coastal waters inMediterranean countries (Katranidis et al.2003). Escapes of fish from CAS and theirinteractions with fisheries are apparently notregarded as a major problem in Mediterra-nean countries, but these are the major envi-ronmental issues in many salmon producing
countries (Muir 2005). Escaped salmon maycontribute to the spreading of disease andparasites to wild stocks and interact nega-tively with these stocks during their spawn-ing in rivers. Associations and industries in-volved in river fisheries of salmon are im-portant stakeholders opposing for examplethe Norwegian salmon industry (Porter 2003;McGinnity et al. 2003).
It is important to realise that aquacultureis the first industry to suffer from an inad-equate coastal water quality and environmen-tal damage. The industry is thus very depend-ent on minimising its own potential pollu-tion, but also the pollution originating fromother human activities like other industry orurban runoff. The concept of an “Ecosystem-based Approach to Aquaculture” (EAA) hasrecently been introduced by FAO representa-tives in cooperation with the scientific com-munity (D. Soto, pers. comm.). Accordingto the principles of this concept, the fishfarms should be managed as a part of themarine ecosystem as any other source or sinkof organic matter and nutrients.
The scientific literature on impacts onsediments and benthic ecosystems is verycomprehensive, and there is a general scien-tific understanding on which we may baseassessments of state and dynamics, manage-ment, and monitoring measures. The poten-tial impacts of wastes from aquaculture onwater column ecosystems is far less studied,presumably because it has been difficult toidentify and quantify such impacts(Merceron et al. 2002; Soto and Norambuena2004; Maldonado et al. 2005; Dalsgaard andKrause-Jensen 2006). There is apparently noscientific concept established for assess-ments of state and dynamics, management,and monitoring measures for open coastalwaters. There is thus not sufficient knowl-edge as to how specific measured environ-mental variables can reflect potential harm-ful impacts on open water ecosystems. Thus,this paper will focus on potential impacts inpelagic waters of nutrient emission from

Environmental impact of aquaculture 183
aquaculture and describe a preliminary gen-eral concept applicable for assessing suchimpacts.
2. Quantification of NutrientEmission from CAS
The carbon (energy) mass balance for theflow of matter through a fish can be repre-sented by the following simple mass balanceequation:
I = A + F = G + R + F (1)
where I is food consumed; A is assimilatedfood, or uptake in tissues; F is defecation;R is respiration, and G is growth and repro-duction (all in terms of carbon or energy)(Fig. 1). The corresponding nutrient balanceis expressed using the analogue equation:
INP = ANP + FNP = GNP + ENP + FNP (2)
where excretion of N and P (ENP) replacesrespiration. These general equations, to-gether with knowledge on assimilationefficiencies of C, N, and P and the stoichio-metric C:N:P composition of produced fishand feed are fundamental for estimatingnutrient and carbon intake, metabolism, andlosses from individuals of cultured fish.
The processes of respiration and excre-tion release inorganic carbon and excess inor-
ganic nutrients, respectively, from fish tis-sues (assimilated matter) to the water. Res-piration is a loss of carbon dioxide (CO2)reflecting the metabolic costs of growth andmaintenance of the organisms. The excretedN and P species are mainly inorganic nutri-ents wastes, i.e. urine (urea-N, PO4) andammonia (NH4). These losses of assimilatedN and P are instrumental to maintain elemen-tal homeostasis in fish tissues.
The assimilated food is the portion ofthe food that is digested by the fish and takenup in tissues, and the assimilation efficiency(AE) is defined as (similar for N and P):
AE = A/I (3)
The undigested food (faeces) passes throughthe fish gut undigested or partially digested.This fraction constitutes mainly particulateorganic substances, including particulateforms of N and P, but some part is rapidlyreleased in molecular dissolved forms in thewater. The assimilated food supports growthand weight increment, and the growth effi-ciency (GE) is generally defined as (similarfor N and P):
GE = G/I (4)
This term expresses the efficiency by whichthe food ingested is converted to newbiomass, similar, although inverse, to the
Fig. 1. Schematic allocation pathways of C, N, and P (energy and materials) in fish. Feed lossesand mortality are relevant flows on the population level.

184 Y. OLSEN AND L. M. OLSEN
food conversion ratio (FCR, feed consumedper fish produced) which is an operationalterm used in aquaculture.
The total wastes of carbon (TLC) andnutrients (TLNP) generated by cultured fishare expressed as:
TLC = I – G = R + F (5)
TLNP = INP – GNP = ENP + FNP (6)
Respiration results in a release of inorganicCO2, the emission of organic carbon (LOC)wastes is most easily estimated as:
LOC = I – A = I (1 – AE) (7)
Values for AE of carbon or energy can beobtained from literature and in some casesfrom feed companies. For the formation ofdissolved components from faeces, there isno formal way to distinguish these dissolvedorganic component (DOC) from theparticulate organic (POC) waste compo-nents, but the particulate fraction is the mostimportant (see below).
The corresponding estimate of organicnutrient wastes (LONP) from fish is:
LONP = INP – ANP = INP (1 – AENP) (8)
INP can be estimated based on total feed in-take times feed NP contents. The assimila-tion efficiency of N can be assumed to beequal to that of protein, widely reported inliterature and by feed companies (Andersonet al. 1995). The assimilation efficiency of Pis widely reported as well, but more uncer-tain because of the addition of indigestible Pcompounds in the feed such as phytate P(Hua and Bureau 2006). As for carbon, thereis no formal way to distinguish between dis-solved organic nutrients (DON, DOP) andparticulate organic nutrients (PON, POP)waste components originating from faeces,
but the particulate nutrient fraction is themost important (see below).
The inorganic N and P release from thefish (LINP) can be estimated as the differencebetween assimilation and production:
LINP = ANP – GNP = (INP × AENP) – GNP (9)
GNP is N and P in produced fish, obtained asproduced fish weight times N and P contents.
The waste production budget for anaquaculture facility differs from the fishbudgets, as there is an additional waste com-ponent in the uneaten feed that may affectthe environment. If mortality is significant,it should be included as well as a lossprocess of nutrients. Dead fish are usuallycollected for land deposition, and are as suchnot lost directly to the environment. To whatextent a fish farm and the produced wastesaffect the surrounding environment, dependson the size and type of the fish farm, thestructure and functioning of the pelagic andbenthic surrounding ecosystems, the overallmanagement practice of the aquaculture fa-cility, and perhaps most importantly on thehydrodynamics and physical conditions ofthe location.
The above method is most applicable forsituations where the cultured organisms feedprimarily on the added feed, and not on feedwhich are produced in the system (e.g., pondaquaculture systems). The method is robustand most accurate when there is adequatestatistical input information on use of feedand fish production available.
If the statistical information on use offeed and fish production with time is morefragmented, the alternative to the mass bal-ance model described above is a more gen-eral dynamic model describing fish metabo-lism, growth, and waste production (e.g.,Fernandes et al. 2007). Such models are notthat robust, but can be useful when input dataare more fragmented.

Environmental impact of aquaculture 185
3. Characteristics and Fate ofNutrient Waste Components
from CAS
Following the above considerations, CASrelease nutrients as dissolved inorganic nu-trients through excretion (NH4 and PO4),particulate organic nutrients (PON and POP)through defecation, and dissolved organicnutrients (DON and DOP) through resuspen-sion from the particulate fractions (Table 1).
There will also be a direct loss of uneatenfeed (feed N and feed P). These differentwaste components will affect different partsof the marine ecosystem; feed losses and thelarger faeces particles will sink and affectsediments and benthic communities whereasdissolved inorganic nutrients, dissolved or-ganic nutrients, and small faeces particlesaffect the pelagic communities and the stateand quality of euphotic waters.
Inorganic nutrients released can affectphytoplankton in euphotic waters quite
Nutrient component Acronym Characteristics and fate
Particulate nutrients PON and POP (particulate organic nitrogen andphosphorous)
• Whole feed pellets, small to very smallparticles originating from feed and fishfaeces, other particles generated in fishfarms (e.g., fouling).• Pellets and larger particles sink rapidlyto the seafloor, are consumed by fish orother benthic organisms, oraccumulate/decompose in sediments.• Small particles are suspended in thewater column, consumed by filter feeders(mussels, zooplankton) and bacteria,within days.• Particles are not available forphytoplankton and macro algae.
Dissolved organicnutrients
DON and DOP (dissolved organic nitrogen andphosphorous)
Molecular nutrient components (organic),mostly complex chemical compounds,released from faeces particles and feed,and other biological activity.
Stable components, available forphytoplankton on very long time scale.To some extent consumed by bacteria-microbial food web, can aggregate andsink (marine snow), relatively slow process.
Dissolved inorganicnutrients
DIN and DIP (dissolved inorganic
nitrogen andphosphorous; NH 4 and PO 4)
Inorganic nutrients, i.e., ammonium andphosphate.
Immediately taken up by phytoplankton,macro algae, and also by bacteria andused for growth, in the worst case they maycause algal blooms.
Table 1. Characteristics and fate of nutrient components released from CAS.

186 Y. OLSEN AND L. M. OLSEN
strongly in the upper mixed, illuminatedlayer of the water column where photosyn-thesis takes place. Organic dissolved nutri-ents are to a low extent available as nutri-ents for the phytoplankton. These nutrientcomponents have long to very long residencetimes in marine waters (Bronk 2002; Karland Björkman 2002). Particulate nutrients donot affect the phytoplankton in the mixedlayer, but zooplankton is moderately affectedall through the water column.
4. Nutrient Waste Emission fromTypical Salmon Farm
The present section describes an annual massbalance for the main C, N, and P flows froma hypothetical salmon CAS producing 1000metric tonnes wet weight of fish per year.Assumptions made in the calculations areshown in the legend of Table 2, which showsemission rates of the principal waste com-ponents from the fish farm. To put the num-bers of Table 2 into a perspective, the totalnutrient wastes generated of the fish farmcorresponds to the emissions from a com-munity of 7,500 to 10,000 people (2 g P perperson per day, 13 g N per person per day,Norwegian standard). The N:P ratio of the
total and inorganic nutrient wastes to openwaters was found to be 10 and 13, respec-tively, which is above the Redfield ratio (7.2,by weight). Contrary to this, not shown inTable 2, the N:P ratio of the particulatewastes affecting sediments and benthic eco-systems was 2.7 and therefore far lower thanthe Redfield ratio. The majority of the Nwastes is released to open waters (68% oftotal) whereas the majority of the P is accu-mulated in sediments (63%).
For the defined salmon farm, there wasa pronounced annual variation in fish pro-duction and waste emission over the year(mean pattern for all Norwegian salmonfarms), among others because of variable fishbiomass and low temperatures in the winterperiod (Fig. 2). The annual variations of theN- and P-allocation into biomass (growth)and different waste components releasedfrom the salmon farm were at their maxi-mum in August, with rates less than half ofthis maximum during the winter months. Asa general trend, a lower proportion of the Pof the feed (feed-P) than that of the N in thefeed (feed-N) was excreted as phosphate andammonia, respectively. Contrary, the fractionof particulate P, mainly released through def-ecation, was throughout higher than that ofparticulate N.
Pelagic loading rates Tonnes farm –1 year–1 g m–3 year–1 mg m–3 day–1 (June–Sept)
OC-loading 20 26 100NH4-loading 28 36 140PO4-loading 2.1 2.7 11Total N-loading 30 39 150Total P-loading 3.0 3.9 15DON + PON loading 17 22 86DOP + POP loading 6.1 7.9 31
Table 2. Estimated loading rates of organic C and specified nutrient components from a hypo-thetical salmon CAS producing 1000 tonne fish per year. The farm area is 51 000 m2 (160 × 320m2) the volume of the fish farm is 770 000 m3, the overall FCR of the farm (feed used per fishproduced) is 1.16 kg dry feed used per kg fish produced (Gillibrandt et al. 2002), feed input is1160 mt year–1, direct feed loss is 5% (Mente et al. 2006), feed P content is 1 % (Islam et al. 2005),feed N content is 6% (Islam et al. 2005), and feed organic C content is 50% (Elser et al. 2000).Input data for feed use and fish produced are obtained from the Norwegian Association of FishFarmers and feed characteristics from the feed company Biomar.

Environmental impact of aquaculture 187
The excretion of phosphate is highlydependent on the feed-P content, and thecalculated P flows are relatively uncertainbecause of the problems in defining an ac-curate P content of the feed and its overalldigestion efficiency (Sugiura et al. 2006).The values for N are probably more robust,because the protein content of the feed is less
variable and its digestibility is higher andbetter known (Anderson et al. 1995). It isfinally noteworthy that the rate of feedlosses and the emission rate of dissolved or-ganic nutrients (re-suspended DON andDOP), which has a low availability forphytoplankton (Table 1), are relatively lowas compared to other waste emission flows.
Fig. 2. Annual variation in nitrogen (upper panel) and phosphorus (lower panel) deposition infish biomass and waste components for a hypothetical CAS producing 1000 tonnes salmon peryear. The sum of the fractions equals the food nitrogen and phosphorous supplied.

188 Y. OLSEN AND L. M. OLSEN
5. Nutrient Assimilation Capacity ofPelagic Ecosystems
There is no general scientific understandingof how wastes from CAS distribute and af-fect water column ecosystems, and there isa poor quantitative understanding of howthese nutrients affect the structure and func-tion of the pelagic ecosystem (Cloern 2001;Olsen et al. 2006). This lack of quantitativeknowledge means that there is no scientificbase for monitoring and managing environ-mental effects of CAS on open waters, mean-ing that management must comply with theprinciple of precautionary approach.
It can be hypothesised that the assimila-tion capacity of the water column ecosys-tem is mediated by two main mechanisms:• Food web response: Nutrient uptake and
assimilation by phytoplankton, with suc-cessive trophic transfers of energy andmaterials (e.g., nutrients) in the plank-tonic food web to the higher trophic lev-els.
• Hydrodynamics: Transport and dilutionof nutrients and plankton organisms me-diated by hydrodynamics at productionsites and their surrounding, downstreamwater masses.
The dilution mechanism is independent onthe organisms of the water column ecosys-tem; major physical forcing processes drivehydrodynamics. The assimilation capacity ofthe planktonic community is, on the otherhand, strongly dependent on hydrodynam-ics, because dilution leads to a continuousreduction of nutrient concentrations andbiomass, and therefore also to an increase incapacity of nutrient assimilation in thepelagic community. Both mechanisms areaccordingly working in concert. Nutrientuptake and allocation in planktonic foodwebs and hydrodynamics are the fundamen-tal processes determining the assimilationcapacity of the water column of coastal andopen waters.
5.1. Food web response
All ecosystems have an inherent capacity ofpersistence, and smaller environmentalchanges are mitigated through adaptive re-sponses of the organisms. Major changes inecosystem structure and function, whetherit is reversible of irreversible, will only takeplace if the environmental signal, or the en-vironmental interaction, is strong and sus-tained. For the planktonic ecosystem of thewater column, we may deduce that nutrientsare efficiently assimilated without any harmas long as the input rate remains below a criti-cal upper level.
Enhanced inorganic nutrient supply topelagic ecosystems results in a stepwiseprocess where the first step is an increasednutrient uptake in phytoplankton (and bac-teria) followed by an increased growth rate(i.e., primary production). If the zooplanktongrazing rate of phytoplankton is not too high,the phytoplankton biomass may accumulateand increase, leading to higher food concen-tration for all groups of heterotrophs, and inturn to successive responses in their feedingactivities and growth. It will most commonlytake some 3–7 days before an increased nu-trient supply rate results in an increasedbiomass, which is the last step of the chainreaction. This means that the effects normallyare becoming realised far downstream of thenutrient source.
The typical responses in primary produc-tion and accumulated phytoplankton biomassin stagnant NE Atlantic coastal waters areillustrated in Fig. 3. There is a close to linearresponse below N loading rates of 11–18mg N m–3 day–1. Open dynamic systems willrespond differently, advection and verticalmixing will reduce the response quitepronouncedly for biomass, dependent on themixing rates. The response in primary pro-duction is less sensitive than biomass forphysical mixing processes and grazing(Olsen et al. 2006).

Environmental impact of aquaculture 189
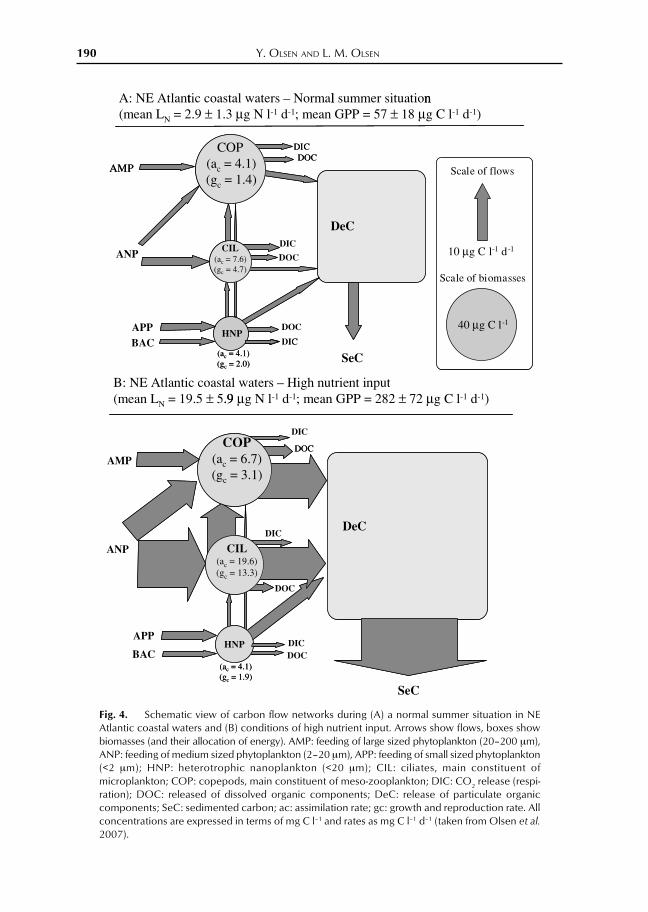
The responses and trophic interactionsof the heterotrophic planktonic food webfollowing enhanced nutrient input are com-plex, but the bottom line is that the food webacts like a buffer which, within certain lim-its, may mitigate negative ecological effectsof enhanced nutrient input, for example anyextensive blooms of phytoplankton. Themain functional components of the plank-tonic food web will respond in a predictableway to increased nutrient supply, althoughnot on species level (Fig. 4). The increasedprimary production represents increased foodavailability for the heterotrophic planktongroups (i.e., zooplankton and bacteria). Theupper panel of Fig. 4 illustrates a representa-tive flow network (structure and function)for the normal, undisturbed situation in theplanktonic food web of NE Atlantic coastalwater. The lower panel illustrates a situationwith a nutrient supply 4–5 times above thenatural level. The main take-home messageof Fig. 4 is that enhanced nutrient supplyaffects carbon flows between the hetero-trophic functional components more stronglythan biomass of these functional groups. Thephytoplankton biomass (not shown) is re-sponding more strongly than the hetero-trophic biomass (Olsen et al. 2006), as indi-
rectly indicated by the increased availabil-ity as food for zooplankton in the figure (in-put arrows). An apparent pattern of Fig. 4 isthat structure and function of the microbialfood web (bacteria, picocyanobacteria, smallprotozoans) is responding very little to nu-trient addition. It is the larger groups ofphytoplankton, metazoan, and protozoan(ciliates) grazers that primarily respond.
The most important message of Fig. 4 isthe very pronounced increase in sedimenta-tion rate that follows enhanced nutrient in-put. This flow of dead organic matter todeepwater and sediments represent an or-ganic loading that becomes important for theoxygen requirements and concentration inaphotic waters and the sea floor communi-ties. A non-linear, accelerating increase insedimentation per primary production re-flects the fact that the zooplankton grazers,at some point of nutrient input, are not anymore able to consume, and efficiently re-move, the enhanced primary production. Ahigh sedimentation fraction of primary pro-duction is an indication that the planktonicecosystem is no longer able to assimilate theenhanced nutrient input very efficiently.
Somewhere in between the loading ratesof 3 and 20 mg N m–3 day–1, we hypothesise
) d
ay Phytoplanktonbiomass
N loading rate, mg N m-3 day-1
0 5 10 15 20 25 30 35
Bio
mas
s (m
g C
m-3
)
0
200
400
600
800PrimaryProduction
0 5 10 15 20 25 30 35Pri
mar
y pr
oduc
tion
(m
g C
m-3
-1
0
100
200
300
400
Fig. 3. Primary production (left) and phytoplankton biomass (right) as functions of N loadingrate in stagnant NE Atlantic plankton ecosystems. (Norwegian data taken from Olsen et al. 2006).
190 Y. OLSEN AND L. M. OLSEN
A: NE Atlantic coastal waters – Normal summer situation(mean LN = 2.9 ± 1.3 µg N l-1 d-1; mean GPP = 57 ± 18 µg C l-1 d-1)
AMP
ANP
APPBAC
DIC
DIC
DIC
DOC
DOC
DOC
DeC
SeC
Scale of flows
Scale of biomasses
APP
BAC
AMP
ANP
DeC
DIC
DIC
DIC
DOC
DOC
DOC
SeC
B: NE Atlantic coastal waters – High nutrient input(mean LN = 19.5 ± 5.9 µg N l-1 d-1; mean GPP = 282 ± 72 µg C l-1 d-1)
COP(ac = 4.1)(gc = 1.4)
COP(ac = 6.7)(gc = 3.1)
CIL(ac = 7.6)(gc = 4.7)
CIL(ac = 19.6)(gc = 13.3)
HNP
(ac = 4.1)(gc = 2.0)
HNP
(ac = 4.1)(gc = 1.9)
40 µg C l-1
10 µg C l-1 d-1
t l n
AMP
DIC
C
DOC
DeC
Scale of flows
Scale of biomasses
DeC
DOC
.9
COP(ac = 4.1)(gc = 1.4)
COP(ac = 6.7)(gc = 3.1)
CIL(ac = 7.6)(gc = 4.7)
CIL(ac = 19.6)(gc = 13.3)
HNP
(ac = 4.1)(gc = 2.0)
HNP
(ac = 4.1)(gc = 1.9)
40 µg C l-1
10 µg C l-1 d-1
Fig. 4. Schematic view of carbon flow networks during (A) a normal summer situation in NEAtlantic coastal waters and (B) conditions of high nutrient input. Arrows show flows, boxes showbiomasses (and their allocation of energy). AMP: feeding of large sized phytoplankton (20–200 μm),ANP: feeding of medium sized phytoplankton (2–20 μm), APP: feeding of small sized phytoplankton(<2 μm); HNP: heterotrophic nanoplankton (<20 μm); CIL: ciliates, main constituent ofmicroplankton; COP: copepods, main constituent of meso-zooplankton; DIC: CO2 release (respi-ration); DOC: released of dissolved organic components; DeC: release of particulate organiccomponents; SeC: sedimented carbon; ac: assimilation rate; gc: growth and reproduction rate. Allconcentrations are expressed in terms of mg C l–1 and rates as mg C l–1 d–1 (taken from Olsen et al.2007).

Environmental impact of aquaculture 191
a critical nutrient loading rate (CNLR) whichcannot be exceeded without loss of ecosys-tem integrity. The food web organisms arecapable to assimilate efficiently the nutrientsinput without major exports to sedimentsbelow this critical rate, but not above. Thereis so far no generally accepted method todetermine a CNLR for open coastal watersexperimentally or empirically, and there isno published value, as far as we understand.There is, however, evidence showing that theprimary production and the zooplanktonfeeding rates in stagnant systems both leveloff for volumetric loading rates around1 mmol N m–3 day–1 (14 mg N m–3 day–1) inNE Atlantic coastal waters (see Fig. 3 andOlsen et al. 2006).
5.2. Hydrodynamics
A cage fish farm represents a point sourceof nutrients to the surrounding water. Thehydrodynamic energy and the depth of thesite will, to a great extent, determine the wa-ter volume that receives the daily nutrientemission of wastes. Due to coastal and tidalcurrents, coastal seawater is rarely or neverstagnant. Usually the current velocity variesbelow 25 cm s–1 (Carroll et al. 2003). Thecurrents will dilute the water in the cages andthe nutrient waste flows and broaden thedeposition area considerably.
The pattern of water currents in coastalwaters is complex, and cannot easily be de-duced, even after extensive field surveys. Asa first approximation for estimating the re-ceiving water volume of our defined salmonfarm, we may assume that water are drainedthrough the cage farm in a plug flow patternwith no further mixing downstream of thefarm site (see legend of Table 2). If waterenters the cage area directly from the lengthside, and there is no major resistance in thecages, Fig. 5A shows the number of waterexchanges and the resulting total volumepassing the cage farm as a function of thewater current velocity. Already water cur-rents of 10 cm sec–1, which are relatively
slow, result in a high frequency of water re-newal and a total exchanged volume of morethan 50 million m3 per day. This is for surean underestimate of the real receiving vol-ume, because the nutrients will become con-tinuously exchanged with and diluted inneighbouring water masses downstream ofthe fish farm.
The volumetric loading rate (LVOL) ofinorganic nutrients is defined as the mass ofnutrients released per volume of water perday. Quantification of the loading rate (massof nutrients released per farm per unit oftime, LTime) and the receiving water volume(V, m3) allow estimation of LVOL for inorganicN and P (Fig. 5B), which decreases rapidlyas the water current velocity increases. Thehypothesised critical loading rate (see above)to coastal waters is 14 mg N m–3 day–1 (10–20 mg N m–3 day–1, P in Redfield proportion).Another important reference is the naturalsupply rates of nitrogen to euphotic coastalwaters. This value has been estimated to4 mg N m–3 day–1 in a 5-year fertilisation ex-periment in a coastal lagoon off CentralNorway (sedimentation measurements, sea-sonal mass balance).
With the critical and the natural loadingrates in mind, Fig. 5B reveals that the volu-metric nutrient loading rate of water passingthrough the fish farm will remain below thecritical value as long as the water currentvelocity is >2 cm sec–1, which is indeed avery low velocity. The fish farm will con-tribute to a loading rate comparable to thenature when the water current velocity isaround 5–6 cm sec–1. These calculations as-sume that there is no further mixing of wa-ter downstream of the fish farm; they there-fore represent worst-case situations.
The exercise illustrates how importanthydrodynamics are to mitigate negative en-vironmental effects of nutrients released fromsalmon fish farms and other point sources ofnutrients. If the production conditions werestagnant, the nutrient concentration follow-ing one day of emission would correspond

192 Y. OLSEN AND L. M. OLSEN
approximately to a spring bloom event inAtlantic waters (typical DIN concentrationof 140 mg N m–3). It is easy to understandthat this situation would have become animmediate disaster for both the salmon andthe producer.
This type of exercise clearly concludesthat advanced 3D hydrodynamic modellingis needed to estimate the mean volumetricloading rates and to demonstrate the spread-ing pattern of the excess nutrients from thefish farm to the surrounding waters moreconsistently. This is particularly importantfor nutrient assessments undertaken on a re-
gional scale, with more than one fish farmdraining to the same body of water.
5.3. Integrated scheme for food weband hydrodynamics
Food web and hydrodynamic contributionsto the assimilation capacity of the water col-umn ecosystem are schematically integratedin Fig. 6, forming a conceptual operationalgraphical tool for risk management of thewater column ecosystem. In the “water cur-rent velocity–nitrogen loading rate”-spacedescribed as Area I, water dynamics arestrong enough to maintain nutrient loading
0 5 10 15 20 25 30
Num
ber
of w
ater
exc
hang
es
0
25
50
75
100
125
150
175
200
Vol
ume
of r
ecei
ving
wat
er, m
illio
n m
3
0
20
40
60
80
100
120
140
160
Water current velocity, cm sec-1
0.1 1.0 10.0
Vol
umet
ric
load
ing
rate
, mg
m-3
day
-1
0.1
1
10
100
NH4-N
PO4-P
Fig. 5. Water exchange (A) and volumetric loading rates of N and P (B) as functions of thewater current velocity (revised from Olsen et al. 2005).
(A)
(B)

Environmental impact of aquaculture 193
below the limits of the assimilation capacityof the water column ecosystems. In Area III,the nutrient loading rate exceeds the limitsof the assimilation capacity of the pelagicecosystem, the loading rate is then above thecritical level (CNLR), and the water columnecosystem can loose its integrity, sedimen-tation rates are strongly enhanced, and harm-ful coastal eutrophication may occur. In thespace described as Area II, the loading rateis coming close to the CNLR where nutrientloading exceeds the assimilation capacity.This situation represents increased risks andcall for a precautionary approach. The solidcurve expresses that the CNLR will increasewith strong hydrodynamics.
The concept illustrated in Fig. 6 is pre-liminary. It will most likely intercept the LVOL
axis in 10–20 mg N m–3 day–1, but the slopeof the indicated line is not known. Moreo-ver, the axis legends are so far accidentally
chosen. Another proxy for hydrodynamicenergy may be more suitable than the watercurrent velocity. The volumetric loading ratecan be translated into a standing stock of fishin fish farm. An ultimate R&D challenge isto examine different response variables forhydrodynamic energy and to quantify theboarders of the areas in Fig. 6.
6. Monitoring and 3D Modellingof Nutrient Mixing
Monitoring techniques, which allow assess-ment of pelagic waters over a wider geo-graphic scale, are paramount for detectingpotential impacts from nutrient sources likeCAS downstream of the farm. The most ap-parent options are regional scale satelliteimaging and 3D hydrodynamic modelling.Satellite images can provide real situationsfor phytoplankton blooms in surface waters
Fig. 6. Conceptual relationship describing the ability of the water column ecosystem to assimi-late nutrient input as a function of the volumetric loading rate of inorganic nutrients and the watercurrent velocity. Area I: Water dynamics are strong enough to maintain nutrient loading withinthe limits of the assimilation capacity of the water column ecosystems; Area II: The critical zonewhere loading rate is coming close to the critical nutrient loading that exceeds assimilation capac-ity. Situations represent increased risks and calls for special attention and a precautionary ap-proach; Area III: Nutrient loading rate exceeds the limits of the assimilation capacity; the watercolumn ecosystem can loose its integrity, which may cause harmful coastal eutrophication. Thefigure is preliminary, slopes and exact x-axis intersections of the indicated lines are unknown.

194 Y. OLSEN AND L. M. OLSEN
at any given time, but it cannot easily distin-guish between the highly variable naturalnutrient supply and the optional anthropo-genic signal. 3D hydrodynamic models pro-duce a virtual world, not a real one, but suchmodels can cover the entire water columncontinuously with time over any geographicregion. Moreover, modelling allows us todistinguish between natural and anthropo-genic signals, and it can potentially predictphytoplankton production and effects onhigher trophic levels. Models can accord-ingly be run with and without nutrient emis-sion from fish farms included, and the dif-ference, termed the “excess” nutrient con-centration, can be estimated right away.Modelling are also well suited to assess theintegrated effects of all CAS and other nu-trient sources located in a region, and accord-ingly instrumental tools for ecosystem-basedmanagement of aquaculture. Classical meas-urements must be used to validate the majortrends found by satellite images and model-ling at specific locations.
A modelling study examining loadingand spreading of inorganic N from three hy-pothetical fish farms in Norway can serve to
Fish farm number and location Location conditions Excess N in farmhotspot, mg N m –3
(mmol N m–3)
% Excess N ofnatural PON infarm hotspot (%)
1. Langøya, outer exposed area Strongly exposed, water isefficiently mixed with openthe ocean
0.6 (0.04) <1
2. Langøysundet, a straightbetween islands
Tidal driven waterexchange, efficiently mixed
6.4 (0.46) 11
3. Eidsfjorden, a relativelystagnant fjord bottom
Unidirectional, steadywater currents
17.9 (1.3) 30
Table 3. Hydrodynamic characteristics and mean excess nitrogen concentrations of the 3 virtualsalmon farms studied. Values express the concentration of excess N in the water occupied by the fishcages (hot-spot, one model grid of 160 × 320 m2). The situations are representative for farms produc-ing 1000 tonnes per year, which is well below today’s production (up to 9,000 tonnes per year), butthe results nevertheless demonstrates the options of the method. PON concentration in undisturbedcoastal waters is set to 60 mg N m–3, which is representative for the region. From Olsen et al. (2005),model data provided by D. Slagstad, SINTEF.
illustrate how a 3D simulation hydrodynamicmodelling can be used to assess concentra-tions and distribution of released inorganicN and P from CAS (Olsen et al. 2005) (Table3). The model predicts the concentration ofexcess N, i.e., the inorganic N released fromthe fish farm, whether it is dissolved or takenup by organisms after being released.
The mean excess N concentration at thefarm hot-spot (see the legend of Table 3) inthe outer exposed site at Langøya showedvery low N concentrations, values that wouldnot be measurable using analytical tech-niques (compare with the plug flow system,Fig. 5). Nitrogen was immediately dispersed,and neither enhanced primary production norenhanced phyto-plankton biomass could betraced downstream of the farm in detectableamounts (not shown). Phosphorous willshow an identical pattern of variation.
The excess N concentration inside thefarm situated in Langøysundet, a strait be-tween islands, was higher, corresponding to11% of the natural PON concentration at thesite (see legend of Table 3). Tides movedthe water back and forth in the strait, and thesurrounding water masses on both sides were

Environmental impact of aquaculture 195
References
Anderson JS, Lall SP, Anderson DM, McNiven MA. Availability of amino acids from various fish meals fed toAtlantic salmon (Salmo salar). Aquaculture 1995; 138: 291–301.
Bronk DA. Dynamics of DON. In: Hansell DA, Carlson CA (eds). Biogeochemistry of Marine DissolvedOrganic Matter. Academic Press. 2002; 153–247.
Carroll ML, Cochrane S, Fieler R, Velvin R, White P. Organic enrichment of sediments from salmon farmingin Norway: environmental factors, management practices, and monitoring techniques. Aquaculture2003; 226:165–180.
Cloern JE. Our evolving conceptual model of the coastal eutrophication problem. Marine Ecology-ProgressSeries 2001; 210: 223–253.
Dalsgaard T, Krause-Jensen D. Monitoring nutrient release from fish farms with macroalgal and phytoplanktonbioassays. Aquaculture 2006; 256: 302–310.
Elser JJ, Sterner RW, Gorokhova E, Fagan WF, Markow TA, Cotner JB, Harrison JF, Hobbie SE, Odell GM,Weider LJ. Biological stoichiometry from genes to ecosystems. Ecol. Lett. 2000; 3: 540–550.
to some extent affected locally (<1 km). Thehydrodynamic forces were still strong, andthe nutrients were widely spread. The resi-dence time of the water was too short to al-low a significant enhanced primary produc-tion and phytoplankton biomass around thefish farm (data are not shown).
The third site Eidsfjorden, which is arelatively stagnant fjord bottom, was char-acterised by regular anti-clockwise watercurrents with a main pattern not much af-fected by the tidal cycle. The concentrationin the farm oscillated, however, quitepronouncedly, meaning that water currentvelocity varied with tides. The fish farm af-fected the water masses downstream of thesite, and the mean hot-spot concentration ofexcess N was around 30% of the natural PONconcentration. Excess N, primary produc-tion, or biomass did not significantly affectthe outer water masses of the fjord. Hydro-dynamics were surprisingly strong down-stream of the farm along the north coast ofthe fjord, and the resources were rapidlyspread to large water masses. There is notmuch space for a bigger salmon farm on thissite, which might be suitable for integratedaquaculture of mussels (Whitmarsh et al.2006).
7. Concluding Remarks
As aquaculture continues to grow, there willbe a need for a more comprehensive wastemanagement, not only for CAS, but for othersystems as well. The means available for re-ducing the potential environmental impactis highly diverse and include feeding man-agement, site selection, alteration of site, andan active use of wastes from feeding aqua-culture to produce organisms on other trophiclevels, organisms that can take advantage ofthe wastes from CAS (Integrated multi-trophic aquaculture). The environmentalimpacts of sediments and benthic ecosystemsare relatively well understood and managed,but there is a need to improve the generalunderstanding of how pelagic ecosystems areimpacted in order to establish a science-based management and monitoring practicesfor open waters. This is important for thesocietal perception of aquaculture, but alsofor the industry itself which require purewater for its activity.
Acknowledgments
We thank The Fishery and Aquaculture Industry Re-search Fund for their support and senior scientist DagSlagstad at SINTEF Fisheries and Aquaculture formaking model results available.

196 Y. OLSEN AND L. M. OLSEN
FAO. The state of world fisheries and aquaculture. FAO Fisheries and Aquaculture Department, Food andAgriculture Organization of the United Nations. Rome, 2006. ISSN 1020-5489.
Fernandes M, Leuer P, Cheshire A, Angove M. Preliminary model of nitrogen loads from southern bluefintuna aquaculture. Marine Pollution Bulletin 2007; 54: 1321–1332.
Gillibrandt PA, Gubbins MJ, Greathead C, Davies IM. Scottish executive locational guidelines for fish farm-ing: predicted levels of nutrient enhancement and benthic impact. Scottish Fisheries Research Report63/2002. 2002; Fisheries Research Services, Aberdeen.
Hua K, Bureau DP. Modelling digestible phosphorus content of salmonid fish feeds. Aquaculture 2006; 254:455–465.
Islam MS. Nitrogen and Phosphorus budget in coastal and marine cage aquaculture and impacts of effluentloading on ecosystem: review and analysis towards model development. Marine Pollution Bulletin2005; 50: 48–61.
Karl DM, Björkman KM. Dynamics of DOP. In: Hansell DA, Carlson CA (eds). Biogeochemistry of MarineDissolved Organic Matter. Academic Press. 2002; 249–366.
Katranidis S, Nitsi E, Vakrou A. Social acceptability of aquaculture development in coastal areas: the case oftwo Greek islands. Coastal Management 2003; 31: 37–53.
Maldonado M, Carmona MC, Echeverria Y, Riesgo A. The environmental impact of Mediterranean cage fishfarms at semi-exposed locations: Does it need a re-assessment? Helgoland Marine Research 2005; 59:121–135.
McGinnity P, Prodohl P, Ferguson A, Hynes R, Maoileidigh NO, Baker N, Cotter D, O’Hea B, Cooke D,Rogan G, Taggart J, Cross T. Fitness reduction and potential extinction of wild populations of Atlanticsalmon, Salmo salar, as a result of interactions with escaped farm salmon. Proc. R. Soc. Lond. B 2003;270: 2443–2450.
Mente E, Pierce GJ, Santos MB, Neofitou C. Effect of feed and feeding in the culture of salmonids on themarine aquatic environment: a synthesis for European aquaculture. Aquaculture Int. 2006; 14: 499–522.
Merceron M, Kempf M, Bentley D, Gaffet JD, Le Grand J, Lamort-Datin L. Environmental impact of a salmonidfarm on a well flushed marine site: I. Current and water quality. J. Appl. Ichthyol. 2002; 18: 40–50.
Muir J. Managing to harvest? Perspectives on the potential of aquaculture. Phil. Trans. R. Soc. B 2005; 360:191–218.
Olsen Y, Vadstein O, Slagstad D. Assimilative carrying capacity: Contribution and impacts on the pelagicsystem. In: Howell B, Flos R (eds). Lessons from the Past to Optimize the Future Aquaculture Europe2005, Trondheim, Norway, August 5–9, 2005; EAS Special Publication No. 35. Extended abstract.
Olsen, Y, Agusti S, Andersen T, Duarte CM, Gasol P, Gismervik I, Heiskanen A-S, Hoell E, Kuuppo P, LignellR, Reinertsen H, Sommer U, Stibor H, Tamminen T, Vadstein O, Vaqué D, Vidal M. A comparativestudy of responses in planktonic food web structure and function in contrasting European coastalwaters exposed to experimental nutrient addition. Limnol. Oceanogr. 2006; 51: 488–503.
Olsen Y, Andersen T, Gismervik I, Vadstein O. Protozoan and metazoan zooplankton-mediated carbonflows in nutrient-enriched coastal planktonic communities. Mar. Ecol. Prog. Ser. 2007; 331: 67–83.
Olsen Y, Otterstad O, Duarte CM. Status and future perspectives of marine aquaculture. In: Holmer M,Black K, Duarte CM, Marba N, Karakassis I (eds). Aquaculture in the Ecosystem. Springer. 2008.
Porter G. Protecting wild Atlantic salmon from impacts of salmon aquaculture. A country by country progressreport. WWF. 2003. [Online] www.worldwildlife.org
Soto D, Norambuena F. Evaluation of salmon farming effects on marine systems in the inner seas of south-ern Chile: a large-scale mensurative experiment. J. Appl. Ichtyol. 2004; 20: 493–501.
Sugiura SH, Merchant DD, Kelsey K, Wiggins T, Ferraris RP. Effluent profile of commercially used low-phosphorus fish feeds. Environmental Pollution 2006; 140: 95–101.
Whitmarsh DJ, Cook EJ, Black KD. Searching for sustainability in aquaculture: An investigation into theeconomic prospects for an integrated salmon-mussel production system. Marine Policy 2006; 30(3):293–298.