environmental impact mitigation needs of future port and waterway
TRANSCRIPT
Environmental Impact Mitigation
Needs of Future Port and
Waterway Modernization
Activities in the United States
2014-R-04
November 2012

Disclaimer: The contents of this report have been developed and reviewed for factual accuracy, logic and clarity but remain the authors’ interpretations and views, and do not necessarily reflect the views of the U. S. Army Corps of Engineers or the Institute for Water Resources.
In preparation for the increasing size of container vessels and enlargement of the Panama Canal, Congress asked IWR for an assessment of port and waterway modernization needs, including environmental impact mitigation. A draft of this report provided a comprehensive reference for the environmental aspects of the Congressional report. We focused on major container ports in the United States and locks in the Mississippi and Illinois Rivers. Container ports were selected to represent needs and impacts in the major coastal regions. Past environmental impacts of ports and waterways were reviewed to establish context and help identify representative data indicating impact vulnerability and impact sources. Vulnerability indicators included data on public health and safety, environmental justice; parks and other preserves; threatened and endangered species; commercial fisheries value; sportfishing activity; and public beaches. Impact sources were indicated by the amount of additional dredging needed, the regional population growth served by the ports, and the difference between percent population growth and percent unused port capacity. A small geographical area of the conterminous United States has been directly affected by ports, waterways, and connecting transportation corridors, but the cumulative adverse impact on natural systems and wild species is particularly intense (e.g., covered by concrete). Off-site impacts of systems operations on air and water quality are often far reaching. Ports and waterways occur in and near ecosystems that are among the scarcest and most damaged in the United States. This study indicates that the costs of environmental impact mitigation are likely to be substantial almost anywhere within and across regions impacted by transportation system modernization, but ports in the Southeast appear to be most in need of modernization attention and are most likely to require significant environmental mitigation. Pacific coast ports follow in order of potential impacts. Unused port and waterway capacity allows for considerable increase in freight movement without stressing port limits in all regions and the numbers of larger vessels are likely to increase gradually. Transportation changes may also increase the demand for grain shipments on the Mississippi River and the possible need for lock expansion requiring some environmental impact mitigation. Adaptive management is a wise strategy to use in future federal modernization investment considerations given the uncertainties associated with future actions and mitigation costs. Trends in transportation system change should be monitored more regularly to better manage the uncertainty and risks of environmental impact.

Environmental Impact Mitigation Needs of Future Port and
Waterway Modernization Activities in the United States
2014-R-04
November 2012
Richard A. Cole
Y. Jae Chung
Shawn B. Komlos
Institute for Water Resources,
U. S. Army Corps of Engineers
Acknowledgements
We acknowledge the input of many others, in and outside USACE, who contributed specific and
general comments and suggestions as the report was being assembled. Thoughtful reviews were
provided by Ms. Lynn Martin, Ms. Janet Cushing, and Ms. Lillian Almodovar of IWR, by Dr.
Tomma Barnes of the USACE Wilmington District, and by Mr. John Furry at USACE
Headquarters. Ms. Cynthia Wood and Ms. Katherine Noland provided helpful editorial support.
Dr. Robert Brumbaugh, Deputy Director of IWR, helped navigate the review process. Fiscal
support and encouragement were provided by the project lead, Mr. Keith Hofseth, and the
Director of IWR, Mr. Robert Pietrowsky

Table of Contents
Acknowledgements ......................................................................................................................... ii
Table of Contents ........................................................................................................................... iii
List of Figures ................................................................................................................................ vi
List of Tables ............................................................................................................................... viii
Term Definitions ............................................................................................................................ ix
Executive Summary ........................................................................................................................ 1
Introduction ..................................................................................................................................... 2
Transportation System Status: Present and Future ......................................................................... 4
Coastal Ports ................................................................................................................................... 4
Existing Condition .................................................................................................................. 4
Future Condition ..................................................................................................................... 6
Waterways ...................................................................................................................................... 7
Existing Condition .................................................................................................................. 7
Future Condition ..................................................................................................................... 8
Rail and Highway Intermodal Links ............................................................................................... 9
Existing Condition .................................................................................................................. 9
Future Condition ..................................................................................................................... 9
Study Approach and Methods ....................................................................................................... 10
Report Focus ................................................................................................................................. 10
System Impact Pathway Analysis ................................................................................................. 10
Environmental Footprint Assessment ........................................................................................... 11
Impact Indicator Selection ............................................................................................................ 12
Health, Safety and Environmental Justice ............................................................................ 13
Heritage Preservation ............................................................................................................ 14

Beneficial Use of the Environment ....................................................................................... 15
Potential Impact Sources from Port Modernization.............................................................. 15
The Environmental Footprint ........................................................................................................ 17
Overview ....................................................................................................................................... 17
Natural Scarcity of Wetlands and Waters ..................................................................................... 18
Sources of Environmental Degradation ........................................................................................ 20
Major Land Use Impacts ....................................................................................................... 20
Landside Transportation Infrastructural Impacts .................................................................. 21
Waterway and Harbor Infrastructural Impacts ..................................................................... 22
Transportation System Operations ........................................................................................ 23
Accidents............................................................................................................................... 28
Impact Distribution and Environmental Justice .................................................................... 28
Net Effect of All Impacts on Native Species and Ecosystems ............................................. 29
Future Environmental Impact and Mitigation Needs.................................................................... 29
Regional Differences in Vulnerability to Environmental Impact ................................................. 30
Variation in Port Vulnerability to Environmental Impact ............................................................ 33
Human and Resource Vulnerability ...................................................................................... 33
Potential for Future Adverse Impacts at Ports ...................................................................... 37
Potential Environmental Impacts at Waterway Locks .................................................................. 39
Concluding Remarks ..................................................................................................................... 41
References ..................................................................................................................................... 42
Appendices .................................................................................................................................... 50
Appendix A1. Selected Topic Literature Reviews ...................................................................... 50
Appendix A2. States Included in Regional Growth Estimates .................................................... 58
Appendix A3. Raw Data Used for Impact Analyses ................................................................... 59

Appendix A4. Port EA, EIS, and Other Information Summaries. ............................................... 97

List of Figures
Figure 1. Modernizing U.S. ports and waterways—while maintaining and improving
environmental quality—is essential for improving citizen welfare now and in the future.
This includes reducing vessel impacts on whales. .................................................................. 3
Figure 2. International freight transport is increasing and transitioning, when possible, to
shipment in standardized containers. ...................................................................................... 4
Figure 3. Traffic congestion leading to gridlock and degraded air quality has been an issue at
some ports. .............................................................................................................................. 5
Figure 4. Location, size (indicated in the figure by circle size), and main channel depths of major
U.S container ports were considered in port selection for in-depth analysis. ......................... 5
Figure 5. Future regional population growth is expected to favor the Southeast and the West as it
has in the last few decades. ..................................................................................................... 6
Figure 6. Small locks cause barge transport delays that can be alleviated by building larger
locks. ....................................................................................................................................... 7
Figure 7. Barge traffic and lock delays have been decreasing for years (RITA 2012), but
international grain demand and the Panama Canal expansion may change that trend. .......... 8
Figure 8. Double stacking containers on railroad cars is one of numerous tactics used to reduce
rail transport costs and decrease atmospheric emissions per ton transported. ........................ 9
Figure 9. A generalized conceptual model was developed to help identify environmental impacts
on human service and welfare. .............................................................................................. 10
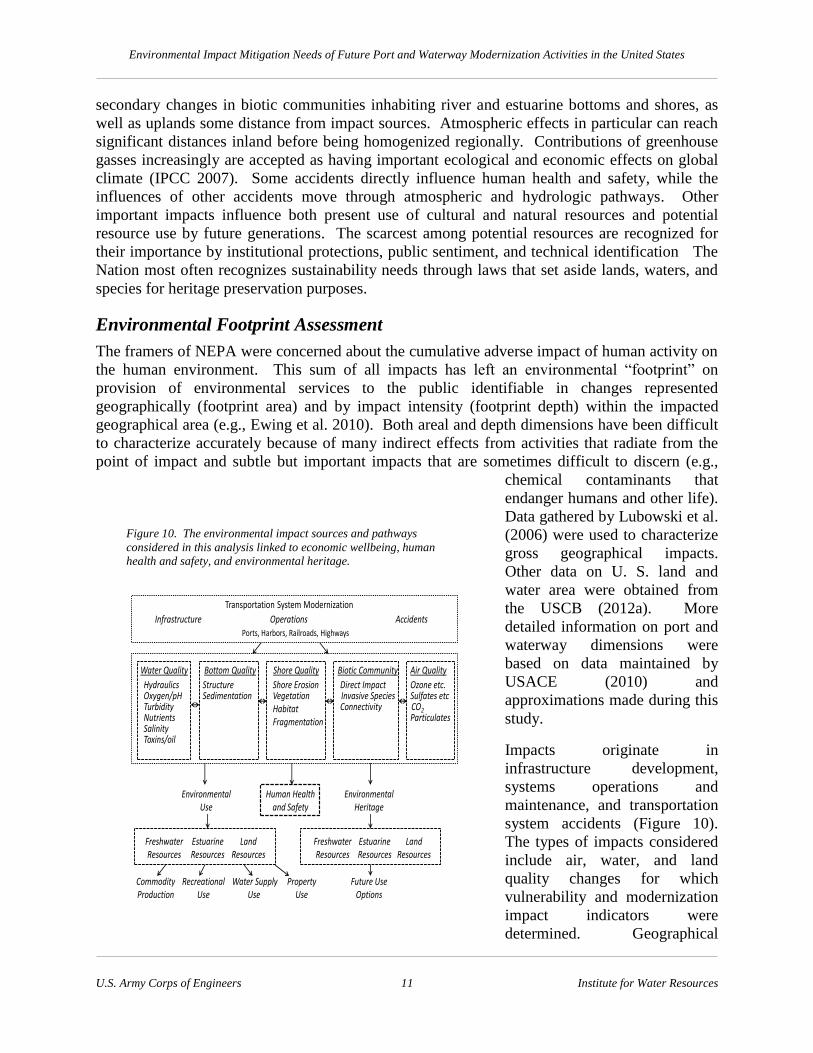
Figure 10. The environmental impact sources and pathways considered in this analysis linked to
economic wellbeing, human health and safety, and environmental heritage. ...................... 11
Figure 11. The vulnerabilities of sport and commercial fishing to increased freight transport are
indicators of possible adverse impacts on the local economy. ............................................. 15
Figure 12. Container storage capacity is one of several indicators of future port capacity for
processing greater freight volume. ........................................................................................ 16
Figure 13. Wetland ecosystems are scare and some are vulnerable to port and waterway
activities because they are concentrated along coasts and large rivers. ................................ 18

Figure 14. Urban land use (upper map) and agricultural land use (lower map) are major sources
of erosion and other environmental impacts ......................................................................... 21
Figure 15. Trucks make up nearly half of the emissions from different U.S. transportation
sources (from EPA and DOT)............................................................................................... 24
Figure 16. Railroads are slightly more fuel efficient than water transport and much more
efficient than trucks............................................................................................................... 24
Figure 17. In the past, some dredged material disposal unintentionally provided valuable habitat.
Now 20-30 percent is intentionally used for habitat and other beneficial purposes. ............ 26
Figure 18. The distribution of impaired water quality is particularly concentrated in many areas
near major ports (EPA data). ................................................................................................ 26
Figure 19. Some of the invasive species introduced to the U. S. via ballast water and cargos have
had costly impacts. The zebra mussel (below) is one example. ........................................... 28
Figure 20. This large Atlantic sturgeon probably was cut in half by a container vessel propeller
(from Mallin 2011) ............................................................................................................... 28
Figure 21. The disproportionate impact of emissions on low income and minority groups in New
Jersey. .................................................................................................................................. 29
Figure 22. The distribution of U. S. endangered species is concentrated near coastal ports (from
Stein et al. 2000). .................................................................................................................. 30

List of Tables
Table 1. Estimated geographical areas of land, wetland, and surface water in the conterminous
United States ......................................................................................................................... 19
Table 2. Areas and percentages of the conterminous United States impacted directly by different
land uses and transportation system infrastructure. Estimates do not include indirect effects
(e.g., contaminated runoff effects). ....................................................................................... 21
Table 3. Potential regional environmental impact from harbor and port modernization based on
indicators of impact sources and possible human population and resource vulnerability to
impact. A higher score indicates higher impact. Each value is the mean of raw data
normalized between 0 and 100 for comparability. Raw data is reported in Appendix A3 .. 31
Table 4. Indicators of relative vulnerability to environmental impacts at representative container
ports in four coastal regions of the United States. Raw indicator values (reported in
Appendix A3) were normalized between 0 and 100 for comparability. ............................... 34
Table 5. Indicators of port needs and relative environmental impact associated with
modernization to meet those needs. Raw indicator values (see Appendix A3) were
normalized between 0 and 100 for comparability. ................................................................ 38
Table 6. Regional indication of potential environmental impact for the four most important
container-port regions. The raw data for Individual metrics (Appendix A3) were
normalized to values between 0 and 100 to allow regional comparison and summation. .... 40

Term Definitions
Adaptive management. Management that accommodates uncertainty by monitoring conditions
and modifying management plans, as needed, as new information informs decisions.
Beneficial use of the environment. Any environmental use that improves human wellbeing
Container transport. Use of standard freight containers that can be efficiently stored,
transported and transferred from one mode of freight transport to another.
Intermodal freight transport. Interlinked modes of freight transport, including ocean vessels,
barges, railroads, and trucks.
Environmental Impact Statement. A report of anticipated environmental effects from
alternative approaches to achieving federally financed or permitted project and program
objectives, including an explanation, when appropriate, for why the approach with the least
impact was not selected. The report is required by the National Environmental Policy Act.
Environmental impact mitigation. Avoidance, minimization, and repair of adverse
environmental impact, when feasible, and compensatory replacement of unavoidably degraded
environmental quality.
Environmental footprint. The cumulative effects of environmental impact.
Environmental Justice. Equitable protection of human health and safety from environmental
degradation regardless of economic, cultural, minority, or other status.
Freight transfer hub. Ports designed to receive large ocean-going vessels and to transfer
freight from them to smaller vessels.
Freight system modernization. Actions taken to maintain or increase the cost effectiveness of
freight transportation.
Heritage preservation. Long-term maintenance of environmental qualities that provide diverse
resource options for potential use by future generations.
Inland waterways. Rivers and coastal areas enhanced by locks and dams, dredging and other
engineered improvements for barge transport of freight and other navigation use.
Panamax vessels. Oceanic vessels that can pass through the old locks in the Panama Canal.
Panamax vessels are now able to call at all major coastal ports.
Post-panamax vessels. Large oceanic vessels that can pass through new Panama Canal locks.
The new locks can pass vessels up to 40 % longer and 64 % wider with drafts up to 50 feet.
Unused port capacity. Surplus port space and processing capability available for receiving,
storing, and transferring more freight between freight transport modes.

Environmental Impact Mitigation Needs of Future Port and Waterway Modernization Activities in the United States
U.S. Army Corps of Engineers 1 Institute for Water Resources
Executive Summary
Introduction
Since the 1970s, compliance with the National Environmental Policy Act (NEPA), Clean Water
Act (CWA), Endangered Species Act (ESA) and other regulatory law has reduced the
environmental impacts of many previous practices and contributed positively to a transformation
in social attitudes toward the environment. Because of these commitments and positive attitudes,
the adverse environmental impacts of proposed port and waterway modernization actions are
likely to be mitigated, often at great expense. As a consequence, mitigation needs will play an
important role in future port and waterway modernization decisions. Numerous recent studies
address intermodal freight system modernization, but few address environmental concerns
thoroughly.
In late 2011, Congress directed the Institute of Water Resources of the U. S. Army Corps of
Engineers (USACE) to study the port and waterway modernization needs of the United States,
including environmental impact and mitigation needs. The purpose of the analysis presented
here is to provide a concise synthesis report on past and potential port and waterway
environmental impacts and mitigation needs for Congressional study reference use and for the
use of any interested person or organization.
The Transportation System
The American freight transportation system has continuously modernized to accommodate
increased trade since colonial days. The most characteristic aspect of contemporary
modernization is the transition of freight transport methods to standardized intermodal
containers, which are more efficiently transferred among vessels, trains, and trucks. The sizes of
container carriers have been steadily increasing —especially oceanic container vessels. The sizes
of other classes of vessels have not changed as much as container vessels in recent decades so
the need for new modernization investment is now focused largely on the ports, waterways, and
intermodal rail and highway networks that support container-based freight transport.
Maritime trade with nations on the Pacific Rim has increased at the fastest rate. As a
consequence, many port harbors on the Pacific Coast of North America are already capable of
receiving the largest container vessels and transferring freight to rail or truck transport far into
the U. S. interior. Expansion of the Panama Canal will allow “post-panamax” vessels larger than
the capacity of the old canal to move more directly to the eastern United States from the Pacific
Rim. Orders for new vessels indicate a gradual increase in the number of post-panamax vessels
over the next two decades.
Because the cost per ton of freight shipped generally decreases with vessel size, much of the
freight moved inland from Pacific Coast ports could shift to ports close to the Panama Canal on
the East Coast. None of these ports are fully ready for the largest post-panamax vessels. Other
freight transport scenarios are possible. Also, because of the potential for reduced shipping costs
through the Panama Canal, waterway transport of grain and soybean export to Asia may increase
in the Upper Mississippi and Illinois Rivers and Gulf ports. This prospect encourages

Environmental Impact Mitigation Needs of Future Port and Waterway Modernization Activities in the United States
U.S. Army Corps of Engineers 2 Institute for Water Resources
investment in lock enlargement to pass large rafts of barges more efficiently. However, the
efficiency of railroads and trucks is increasing and freight transfer hubs in the Caribbean may
allow smaller feeder vessels to call at eastern ports. Past assessments differ over which scenario
is most likely. These uncertainties, and the effects of other uncertain events (such as rates of sea
level change), make precise forecasting of environmental impact and mitigation needs
unrealistic. The approach taken here is to describe environmental impact and mitigation
possibilities contingent on which scenario actually comes about at major container ports and
locks in the upper Mississippi waterways.
Study Approach
A systems approach was used to conceptualize potential impact flows from port and waterway
modernization sources through the environment to impacts on present and future public welfare.
The environmental footprint of the intermodal transportation system was reviewed to identify
possible sources of and vulnerabilities to future modernization impacts. The evaluation of future
potential impacts relies on the use of indicators to characterize modernization impact sources and
human health and resource vulnerabilities. We selected indicators based on our review of past
impacts and data availability, reliability, comparability across sites nationally, and
representativeness. In keeping with recent modernization emphases, we focused on major
container ports in the United States and the one waterway most likely to be affected by
international transportation changes. Both regional impact possibilities and variation among
ports within coastal regions were evaluated. The five regions include Northeastern, Southeastern,
Gulf, and Pacific Coasts and the Upper Mississippi-Illinois Rivers. We selected from four to
seven ports in each of the coastal regions, based largely on present and potential container traffic,
to evaluate potential environmental impact and mitigation needs. The waterway analysis
concentrated on possible impacts from lock expansion on the upper Mississippi and Illinois
Rivers in anticipation of increased barge traffic following lock expansion in the Panama Canal.
Eleven indicators were selected to represent three categories of vulnerability: health, safety and
environmental justice; natural and cultural heritage; and economically valued use of resources.
Three more indicators were selected to broadly represent potential impact sources. We selected
the indicators based on availability, credibility, and national comparability of the indicator data
as well as how well the vulnerabilities and impact sources were represented.
Health, safety, and environmental justice indicators include the number of days air quality did
not meet health standards for vulnerable people within 10 km, the number of permits issued to
release wastes into public waters within 10 km, the number of superfund sites within 10 km, and
the percentages of nearby residents in low income and minority groups within 5 km. Heritage
value in the port vicinity is represented by the geographical area (land & water area) of parks and
other preserves within 10 km, wetland area within 10 km, and number of threatened and
endangered species within the port county. Economic vulnerability is indicated by the value of
state commercial fisheries divided by state shoreline length, the total reported days of state
resident and nonresident salt water sportfishing divided by state shoreline length, and the
geographical area of public beaches in the port vicinity. Adjusting for shoreline length indicates
the accessibility to fishery resources through access points other than port areas. For

Environmental Impact Mitigation Needs of Future Port and Waterway Modernization Activities in the United States
U.S. Army Corps of Engineers 3 Institute for Water Resources
comparability, the raw scores of indices were normalized within a range from 0 to 100 (assigned
to the maximum raw score).
Selection of the potential impact indicators was based on a need to somehow characterize
impacts from port and harbor expansion for larger vessels, port capacity expansion needed to
accommodate increased freight movement, and increased operations based on freight
movements. Relative impact from expansion for larger vessels is indicated by the length of the
main channel into the port times the difference between existing depth and the 50-foot depth
often targeted for large post-panamax vessels. Relative impact from port capacity expansion is
indicated by the difference between the forecast percent growth in regional population served by
ports over 30 years and the percent unused capacity at ports. Relative impact from increased
freight transport operations, which is a function of population growth in the area most served by
the port, is indicated by the total regional population growth forecast over 30 years. These also
were normalized. We did not weight the importance of any of the vulnerability or impact-source
indicators.
Environmental Footprint
The environmental footprint caused by cumulative environmental impact of the freight
transportation system is significant. While a small geographical area of the conterminous United
States has been directly affected, the cumulative adverse impact on natural systems and wild
species has been particularly intense (e.g., covered by concrete). In addition, offsite impacts on
air and water quality from systems operations have been far reaching, including costly invasive
species transported via cargo and ballast water. Ports and waterways also occur in and near
wetlands and rivers, which are among the scarcest and most damaged ecosystems in the United
States. Past impact history has attracted the attention of those concerned about the cumulative
impact of future modernization on vulnerable species, wetlands, and rivers. These impacts are
described in this section.
The identified sources of past environmental effects indicate that future modernization impacts
needing mitigation are most likely to come from expansion of harbor, port, waterway and
intermodal infrastructure, and from increased levels of transportation system operations. If not
fully mitigated, modernization could contribute to degraded air and water quality that threatens
human health and safety, especially among low income and minority groups who tend to live
nearest to ports. It could also contribute to loss of important natural and cultural heritage found
in parks, refuges, wetlands and scarce species as well as to loss of recreational, commercial, and
other economically important resources.
Past infrastructural and dredging improvements for navigation have had environmental impacts.
Among infrastructural sources of impact, lock and dam impoundments have contributed
substantially to the imperilment of numerous freshwater species by totally changing their river
habitat. In general, dredging of uncontaminated river, lake, and estuary bottoms only
temporarily affects biotic communities adversely since they typically colonize quickly following
disturbance. In the past, about 10 % of bottom sediments were contaminated with toxic
materials. Such sediments are now disposed of and treated in isolated containment areas. While
many modifications have been made to avoid adverse impacts, dredging has had some persistent

Environmental Impact Mitigation Needs of Future Port and Waterway Modernization Activities in the United States
U.S. Army Corps of Engineers 4 Institute for Water Resources
environmental effects, including some unavoidable, incidental take of imperiled species (mostly
sea turtles and sturgeons) and some incidental damage to shallow-water estuarine ecosystems.
Deepening coastal navigation channels also can increase the damages caused by saltwater
intrusion into freshwater ecosystems, aquifers, and water supplies.
Some dredged material has been used beneficially for various purposes for many decades,
thereby mitigating some of the impact. USACE was authorized to beneficially use dredged
material for environmental improvement in 1992 and now uses about 20 to 30 % for habitat
creation and other beneficial purposes.
With respect to operations, future emissions of potentially harmful materials into air and water,
including greenhouse gasses, are a significant environmental concern. Since harbors typically
concentrate transportation system operations in densely populated areas, they remain an
important source of air quality degradation and inequitable impact on the low income and
minority groups who tend to concentrate there. But greater reliance on oceanic shipment by
large vessel and inland shipment by train and waterway is generally preferred over truck
transport because trucks contribute much more than any other mode of transportation to
atmospheric emissions. In response to environmental concerns, ports have made improvements
to reduce emissions and are planning substantially more improvement.
Accidents may increase as freight transport operations increase. Human safety is particularly
imperiled when systems operations are congested and stressed. Additionally, accidental collision
of vessels with whales and other animals has been a significant mortality source, but recent limits
on vessel speed may moderate the impact. Potential oil and other contaminants spills are
associated with all transport modes and the local damages increase dramatically with carrier size.
Potential Environmental Impacts and Mitigation Needs
The study revealed the potential for greater environmental impact in the Southeast Atlantic
Region and, to lesser extent, the Pacific Region, than the other regions. These regions are
expected to see the greatest growth in freight transport development because of high regional
population growth rate and less unused port capacity (which requires construction to increase
capacity). The Southeast Atlantic Region requires the greatest amount of harbor expansion to
receive the largest post-panamax vessels and has the greatest amount of wetland and preserve
area vulnerable to impact. The Pacific ports are particularly vulnerable to increased impact on
the health of low income groups and minorities, as well as significant economic loss from
fisheries and recreation impacts. Assuming regional costs of mitigation actions are similar, the
total cost of mitigation is likely to be greater at ports in the southeastern and Pacific regions than
other ports in the United States.
The effects of Panama Canal expansion are uncertain, but have potential to redistribute some
freight transport growth from Pacific ports to southeastern ports. That outcome would most
likely increase impact at southeastern ports and moderate impact at Pacific ports. The canal
expansion may also favor more transport of grains and soybeans on the Upper Mississippi and
Illinois Rivers (IWR 2012), increasing the need for lock expansion on these rivers. Adverse
impacts from possible lock construction are expected to be minor except for potential need to

Environmental Impact Mitigation Needs of Future Port and Waterway Modernization Activities in the United States
U.S. Army Corps of Engineers 5 Institute for Water Resources
mitigate loss of riparian wetlands and to compensate for private property loss. Atmospheric
emissions are expected to improve a bit since less time is needed for lock transit of barge rafts.
Due to increased rail efficiency, railroads may dominate long-haul grain and soybean transport.
But because the emissions differences between waterways and railroads are now small, this
would have little overall impact on air quality unless rail emissions efficiency increases more
than waterway efficiency. Past trends indicate that may happen, thereby favoring rail transport.
Within regions, the vulnerabilities of port areas to further impact are more similar among ports
near each other than ports farther apart. But, in general, the regional port variation within
categories of impact indication is quite high, often reaching category extremes (when
normalized, the extremes are 0 to 100). However, the sum of indicator scores varies much less,
indicating that impact mitigation needs are likely to be relatively consistent among ports even
though the vulnerabilities to impact and sources of impact vary widely.
Conclusions
The costs of environmental impact mitigation are likely to be substantial almost anywhere within
and across regions impacted by transportation system modernization. But the specifics are
impossible to know without detailed information of the kind developed during environmental
impact studies. Based on indicators used in this study, the Southeast Region appears to be most
in need of modernization attention and is most likely to require environmental mitigation
associated with modernization actions. But unused port and waterway capacity allows for
considerable increase in freight movement without stressing port limits in all regions. Although
the number is expected to grow gradually, relatively few vessels of post-panamax size are calling
at ports that are now post-panamax ready. Adaptive management is a wise strategy to use in
future modernization considerations, given the uncertainties held in future actions and mitigation
costs, which depend on specific locations, form of actions taken, and other unknowns. Trends in
transportation system change should be monitored more regularly to better manage the
uncertainty and risks of unnecessarily impacting the environment.

Environmental Impact Mitigation Needs of Future Port and Waterway Modernization Activities in the United States
U.S. Army Corps of Engineers 2 Institute for Water Resources
"When the well's dry, we know the worth of water."
- Benjamin Franklin, Poor Richard's Almanac
Introduction
Water and closely associated land resources are among our most fundamentally valuable
environmental resources. Waterborne freight transport has long been one of many valued uses
and potential uses of water resources. International waterborne trade has steadily increased
through time as well. While maritime trade is essential for maintaining and improving human
welfare in the United States and around the globe, sustaining options for other beneficial use of
environmental resources is now viewed as equally essential. Achieving environmental
sustainability requires long-term maintenance of desired environmental quality and improvement
of degraded quality.
In late 2011, Congress directed the Institute of Water Resources of the U. S. Army Corps of
Engineers (USACE) to study the port and waterway modernization needs of the United States,
including environmental impact and mitigation needs. The report to Congress is entitled U. S.
Port and Inland Waterway Modernization: Options for the Future (IWR 2012). The analysis
presented here provided a distilled and integrated reference source on past and potential port and
waterway environmental impacts and mitigation needs for the Congressional study.
Numerous studies on intermodal freight system modernization needs have been completed in the
last decade, but few address environmental concerns thoroughly. The main intents of this report
were to succinctly describe possible adverse environmental impacts and mitigation needs of port
and waterway modernization based on past cumulative impact identified in the environmental
footprint of the existing freight transportation system and to convey an analysis of future impact
sources, vulnerabilities, and mitigation needs at selected ports and waterways in the United
States. Because of the national scope and strict time limits on information compilation, the
report is limited to readily available and reliable information about major ports and waterways.
Environmentally sustainable modernization of the national freight-transport system is critical for
maintaining and improving the well-being of both present and future generations of Americans
(Figure 1). Some form of intermodal freight transport system modernization is virtually
inevitable in the United States over the next several decades because of nearly certain growth in
imports and exports (EDRG 2012) and infrastructural repair and rehabilitation needs.
Modernization also increases freight transport cost effectiveness, which improves
competitiveness among port, vessel, rail and truck companies. Increasing vessel sizes and
Panama Canal expansion may require some ports and waterways to modernize to adapt to
changing traffic patterns and larger vessels (IWR 2012). If so, pollution restrictions will need to
be met and other significant environmental effects may need to be mitigated.

Environmental Impact Mitigation Needs of Future Port and Waterway Modernization Activities in the United States
U.S. Army Corps of Engineers 3 Institute for Water Resources
Reducing fuel use per ton of freight moved is a major contribution to increased cost effectiveness
and to meeting standards set for environmental quality. Other important strategies used for
increasing fuel and emissions efficiency include moving larger quantities of goods per vessel,
train, and truck and optimizing freight transport across transport modes and number of shipment
transfers. Cost-saving strategies
also include reducing the
variability in freight
containment for more efficient
freight transfer among modes
and increasing engine fuel use
efficiency, including greater
reliance on less polluting fuels
and electricity.
Environmental impact
mitigation often is a large part
of the cost of modernization and
a critical consideration in future
modernization investment
decisions. Consistent with its
interstate and international
commerce authority, the federal
government is deeply involved
with developing and regulating
the Nation’s freight
transportation system and is
expected to ensure that national environmental policy is followed during modernization. Social
attitudes toward environmental sustainability shifted positively during the environmental
movement and unprecedented environmental legislation in the 1970s. The goals of the National
Environmental Policy Act (NEPA), established in 1970, promote beneficial use of the
environment by American citizens, a safe and healthful environment for all citizens, and
preservation of important cultural and natural aspects of national heritage for future citizens.
These three goals form the ideological foundation for evaluating future modernization impacts in
this report. The Clean Air Act (CAA), Clean Water Act (CWA), Endangered Species Act (ESA)
and other environmental laws followed soon after NEPA. Environmental laws and executive
actions establish environmental standards and the authorities to enforce their achievement.
Consistent with NEPA and other law, the significance of environmental impacts and the need to
mitigate them are determined by potential changes in human welfare, now and in the future.
NEPA goals include beneficial use of the environment; a safe, healthful, and pleasant
environment for all (a basis for environmental justice policies), and preservation of important
cultural and natural aspects of national heritage. To be fully representative of impacts and
mitigation needs, impact indicators should consider all of these goals to practical extent.
Mitigation actions include total avoidance when the loss of environmental quality is
irreplaceable, impact minimization, and repair or compensatory replacement of degraded
environmental quality when repair and replacement are reliable alternatives.
Figure 1. Modernizing U.S. ports and waterways—while maintaining
and improving environmental quality—is essential for improving
citizen welfare now and in the future. This includes reducing vessel
impacts on whales.

Environmental Impact Mitigation Needs of Future Port and Waterway Modernization Activities in the United States
U.S. Army Corps of Engineers 4 Institute for Water Resources
Intermodal system modernization is a
continuous process that is recently characterized
by transition to uniform freight containers
(Figure 2), ports with efficient intermodal
freight transfer equipment, and to larger vessels,
barge rafts, trains, and trucks. The transition
reduces costs by decreasing freight processing
time and increasing energy efficiencies. The
transition was also spurred by the
environmental movement four to five decades
ago, which culminated in more intense
regulation of emissions in much of the
developed world. Emissions should decrease as
energy efficiencies increase. More efficient fuel
use is expected to benefit transportation
industry employees as well as investors. It is also expected to benefit the public regionally and
nationally by decreasing the cost of goods and services and by providing better public health and
safety. For these and other reasons, past freight transportation trends are expected to continue
for decades to come (EDRG 2012).
In the approach used here to compare environmental impact potential regionally and nationally,
impact indicators were developed based on quantitative data available from reliable sources.
Even so, significant uncertainty remains in any such analysis. Reliable and comparable indictor
data are limited. None were gathered specifically for the report purpose because of time
limitations. In addition, the effects of local to global changes in environmental conditions and
human preferences often are difficult to forecast accurately. The fundamental assumption here is
that an analysis based on uncertain trends and imperfect indicators has strategic value—even if
precise forecasts are impossible—as long as the results provide greater insight into
environmental ramifications of transportation system modernization and mitigation needs.
Transportation System Status: Present and Future
Coastal Ports
Existing Condition
The international freight transportation system has continuously modernized to accommodate
increased trade for many years. In recent decades, international maritime trade with nations
along the western Pacific Rim has increased most rapidly (Knight 2008, EDRG 2012, IWR
2012). Intermodal freight transporters have progressively converted to equipment designed for
uniform freight containers for many decades. While relatively few container vessels are now
post-panamax size, container vessel size is increasing and will continue to increase based on past
trends and shipyard orders (EDRG 2012). Because other classes of vessels have changed less in
size and number, the primary focus of new modernization needs is on the intermodal container-
transport network of ports, waterways, railroads, and highways.
Figure 2. International freight transport is
increasing and transitioning, when possible, to
shipment in standardized containers.

Environmental Impact Mitigation Needs of Future Port and Waterway Modernization Activities in the United States
U.S. Army Corps of Engineers 5 Institute for Water Resources
Some freight movement through container ports
and inland networks is limited by intermodal
bottlenecks that can elevate consumer prices and
degrade air and water quality. Larger container
vessels require scaled-up freight transfer equipment
and storage capacity at ports, navigation depths up
to 50 feet or more (depending on tide), as well as
wider and typically longer harbor channels, turn-
around basins and berths. Other potential
bottlenecks include poor port connection to
interstate highways and railroads, tunnels too small
to allow railroad container stacking, insufficient
numbers of railroad tracks, outmoded rail
intersections and switching methods, and highway
congestion and air quality issues (Figure 3).
Freight originating in China, South Korea, Japan
and other Asian nations enters the U. S. primarily
through Pacific Coast ports where it is transferred
to trucks and trains for transport across much of the
country. Most large container ports on the Pacific Coast are post-panamax and container-ship
ready, including ports at Long Beach-Los Angeles, Oakland, and Seattle-Tacoma (Figure 4) in
the United States and at Vancouver
and Prince Rupert in British
Columbia. Some traffic also
moves through the Panama Canal
to ports along the Atlantic and Gulf
coasts. But the dimensions of
locks in the Panama Canal limit the
size of vessels traveling in both
directions to a “panamax” size.
The existing locks are 45 feet deep
and significantly narrower and
shorter than the largest ocean-
going vessels. The addition of
wider and longer locks that are 50-
feet deep was expected to be
completed in 2014 (EDRG 2012)
but has been delayed until at least
2016. The expansion is expected
to change the dynamic for freight
transportation from eastern Asia to the eastern United States. The largest ships passing through
the new locks—the post-panamax vessels—will be able to carry nearly three times the freight as
panamax vessels. The use of larger vessels is expected to significantly benefit American
consumers by reducing freight-transport and commodity costs (EDRG 2012).
Figure 3. Traffic congestion leading to
gridlock and degraded air quality has been an
issue at some ports.
Figure 4. Location, size (indicated in the figure by circle size),
and main channel depths of major U.S container ports were
considered in port selection for in-depth analysis.

Environmental Impact Mitigation Needs of Future Port and Waterway Modernization Activities in the United States
U.S. Army Corps of Engineers 6 Institute for Water Resources
On the Atlantic Coast, only ports at Norfolk, Baltimore, New York-New Jersey, Halifax, and
Nova Scotia are either ready to accept post-panamax container vessels or will be ready by 2016
(EDRG 2012 and unpublished USACE information). There are no physical barriers to westward
movement of post-panamax vessels from Europe and Asia. Some post-panamax vessels already
cross the Atlantic to call at post-panamax ready ports on the East Coast and a gradually
increasing number are expected in the future.
Freight movement through all ports along the southeastern Atlantic and Gulf Coasts south of
Norfolk is post-panamax limited by insufficient channel dimensions, port facilities, and/or
intermodal links. The types and degrees of limitation vary significantly among ports. Several
southeastern ports began modernizing in anticipation of the Panama Canal expansion, increasing
regional population growth, and competition advantages. Such investments may be beneficial to
many of these ports and the U. S. as a whole. Other events, described below, may influence the
net benefits of port modernization as well.
Future Condition
The specific locations and types of future environmental impact depend on events that are
difficult to predict reliably. There is little doubt that the demand for international freight will
increase throughout the United States, especially in the southeastern and western United States
where most population growth is expected to occur based on recent growth trends (Figure 5).
Despite more rapid growth in those areas,
much of the growth in freight transport over
the next several decades may be
accommodated with existing port and harbor
capacities (Smith and Knight 2012). Still, U.
S. consumers may significantly benefit from
reduced freight shipment costs made possible
by more post-panamax vessels calling at a
larger number of ports. A shift of freight
movement from Pacific ports to southeastern
ports may occur as a consequence of Panama
Canal enlargement (Knight 2008), especially
at ports that can accept post-panamax
container vessels. Assessments are mixed, but
others in the industry believe that the freight
transport balance between East and West
Coasts will not change much as Pacific ports
and railways adapt (Rodriguez 2010).
On the other hand, many ports may rely on existing post-panamax hub ports in the United States
where shipments are transferred to feeder vessels that can call at ports with shallower harbors
(Rodriquez 2010, EDRG 2012). A number of ports in the Caribbean could provide post-
panamax hub transfer services for ports in North, Central, and South America (Rodriquez 2010,
EDRG 2012), possibly at lower cost than shipment transfers in the United States.
Figure 5. Future regional population growth is
expected to favor the Southeast and the West as it
has in the last few decades.

Environmental Impact Mitigation Needs of Future Port and Waterway Modernization Activities in the United States
U.S. Army Corps of Engineers 7 Institute for Water Resources
Other uncertainties are environmental and demographic. A major environmental uncertainty is
the possible effect of climate change on sea level and the frequency and intensity of destructive
storms (IPCC 2007). Sea level rise would reduce the need for port deepening, but also may
require port modifications with adverse environmental impacts. The effects of past hurricanes
have demonstrated the costly delays that can occur at ports. Storms also interact with dredged
channels and other human alterations of the environment to accelerate loss of scarce estuarine
wetlands (Gosselink 1998, Dahl 2012). Population growth in the United States may not increase
as much as a median projection assumes if immigration rates decrease as the economic
conditions in other countries improve. Or more manufacturing may return to the United States as
differences in international labor costs narrow. At a more technical level, the data available for
indicating future environmental impacts is insufficiently representative and precise.
All of these and other uncertainties affect any analysis of environmental impact mitigation needs
and costs, which depend on the number, location, and specific actions of ports that are
modernized for increased freight movement and post-panamax container ships. For these and
other reasons, pursuit of precise forecasts is ill advised and discussion is limited to broad
consideration of the different future impact possibilities described above.
Waterways
Existing Condition
The inland waterways—including intracoastal, riverine, and Great Lakes waterways—have been
major avenues of barge traffic linking coastal ports to inland locations for many decades. A
significant national investment has been made in excavation, maintenance dredging, and lock-
and-dam construction of over 12,000 miles of improved inland waterways (USACE 2010). The
current waterway system was authorized in 1930 and completed during the 1970s. Much of this
infrastructure is aging and needs some repair or rehabilitation (USDA and USDT 2010). Routine
dredging is required to maintain waterway depths.
Many locks are too small (600 feet long; Figure 6) to avoid barge raft decoupling where barges
are double-rafted. The small locks cause
delays and possible congestion as barge rafts
are decoupled, passed through the locks one
at a time, and recoupled after passage.
Newer locks generally are about twice as
long. Increased lock size allows barges to
push two rafts of barges through the locks
instead of just one. A mix of lock sizes
occur along the upper Mississippi and
Illinois Rivers—two main routes for
agricultural product export (USDA and
USDT 2010). Congress recently authorized
addition of seven large locks on the upper
Mississippi and Illinois rivers to partially
address the issue.
Figure 6. Small locks cause barge transport delays
that can be alleviated by building larger locks.

Environmental Impact Mitigation Needs of Future Port and Waterway Modernization Activities in the United States
U.S. Army Corps of Engineers 8 Institute for Water Resources
Future Condition
Inland waterway traffic and lock delays on the Upper Mississippi have been decreasing for years
(USDA and USDT 2010; Figure 7). But, because of decreased shipment costs through the
Panama Canal, some of the grain, soybean, and other agricultural products now shipped
westward by rail to Pacific Coast ports may move eastward to waterway barges on the
Mississippi River and down to the port of New Orleans.
Increased waterway shipment could
have environmental implications
because of impacts from increased
barge traffic, primarily from
modernization of lock and other
waterway infrastructure.
Consequently, the remaining small
locks on the Mississippi and Illinois
may come under closer scrutiny for
enlargement. At 45 feet deep, the
main channel into the Port of New
Orleans has been able to receive
panamax vessels for some time, but
increasing the cost savings of grain
and soybean transport to the
maximum extent allowed by
Panama Canal transit may ultimately
depend on future channel deepening.
The inland waterway grain shipment
scenario is as uncertain as coastal scenarios (USDA and USDT 2010). Grain sales to western
Pacific rim countries is becoming increasingly competitive among a number of grain exporting
nations and some may have advantages over any form of U. S. shipment. Rail transport
efficiency has increased and is similar to freight movement on inland waterways in many places.
A possible alternative to waterborne transport of grain and soybeans is to bypass a shipment
transfer between rail and waterway, and transport grain and soybeans directly by rail to Gulf
ports. Railroad transport costs are growing more competitive making this alternative scenario
more possible (Economic Development Research, Inc. 2012). The increased cost advantages of
shipping grain through the enlarged Canal via gulf ports are questionable if they remain at 45
feet or less. Also, more efficient railroad shipment westward may improve the competitive
advantages of the Columbia River waterway and Pacific ports. Depending on various trade and
transportation changes, less grain and soybeans may be shipped by barge in the future.
Figure 7. Barge traffic and lock delays have been decreasing for
years (RITA 2012), but international grain demand and the
Panama Canal expansion may change that trend.

Environmental Impact Mitigation Needs of Future Port and Waterway Modernization Activities in the United States
U.S. Army Corps of Engineers 9 Institute for Water Resources
Rail and Highway Intermodal Links
Existing Condition
Rail and highway links between ports, inland freight destinations and freight origins have
improved significantly over time (USDA and USDT 2010). Rail has been less subsidized with
public funding than waterways and highways. After development began in the 1920s, more
freight was moved by barge as the modern waterway system was completed. As public
highways increased in quality more freight was moved by trucking firms. A major change in the
proportion of freight moved by trains and trucks came after development of the interstate
highway system. The advantages of trucking increased as the interstate system extended into
ports and bypassed major congestion on city streets.
As railroads adapted to container shipment, shipment by rail began to regain some of its lost
advantage for long hauls over 400 to 500 miles (Economic Development Research, Inc. 2012),
especially after railroads were deregulated in the early 1980s. Truck transport on the East Coast
has contributed to costly congestion on interstate highways, such as Interstate 95, and to
associated environmental degradation. Truck transport continues to have a cost advantage for
short hauls because container shipment by rail requires freight transfer from or to trucks at some
point along the route. Rail is increasingly promoted over trucks by government agencies because
of environmental advantages (USDA and USDT 2010). The fraction of freight shipped by
container has grown at a faster rate than rapidly increasing trade with the western Pacific Rim
nations. Because of their location advantage, Pacific ports modernized to accommodate the
changes while eastern ports lagged behind. Most of the freight transported by rail originates or
terminates on the Pacific Coast for that reason.
Future Condition
The advantages of direct shipment to the Atlantic
Coast over the Pacific Coast may diminish as
land transport across the continent is
modernized. The big advantage of post-panamax
vessels moving through the Panama Canal is
reduced costs per unit of freight shipped due to
the greater fuel savings. Intermodal transport
through the Pacific ports could continue to have
a shipping time advantage, which is important
for many types of goods. Railroads in particular
are reducing their disadvantage by double
stacking shipment containers (Figure 8),
assembling longer trains, improving delivery
scheduling, doubling single tracks, and
eliminating traffic bottlenecks (Economic
Development Research, Inc. 2010). Trucking is
less adaptable, but is using more double and
triple-container trailers and considering
alternative fuels and more efficient engines.
Figure 8. Double stacking containers on
railroad cars is one of numerous tactics used to
reduce rail transport costs and decrease
atmospheric emissions per ton transported.

Environmental Impact Mitigation Needs of Future Port and Waterway Modernization Activities in the United States
U.S. Army Corps of Engineers 10 Institute for Water Resources
Another possible equalizer is increased Panama Canal fees to pay for the large investment in new
locks (Resor and Gabler 2011).
Study Approach and Methods
Report Focus
We used a simple systems approach to conceptualize and identify the potential impact flow from
modernization action through alteration of environmental attributes to impacts on human service
and welfare (Figure 9). The top container ports in the Nation were of particular interest because
their freight import and export activity and harbor capacity is a generally reliable indicator of
future activity and modernization needs. The Port of Tampa is an exception among the ports
included in the analysis. It is a major port in terms of total freight volume, but is presently a
second-tier container port for the Nation. Yet it is the most important container port on the
eastern Gulf and its container shipment capacity is increasing rapidly (Smith and Knight 2012).
The upper Mississippi Waterway was of secondary interest because of the potential for increased
export of grains and soybeans via the Mississippi and the enlarged Panama Canal.
System Impact Pathway Analysis
Environmental impacts follow pathways from cause to effect. We focused on impact movement
from past and potential transportation system modernization actions to accidents that directly
impact human health and safety, or, more commonly, through various land, freshwater and
estuarine pathways to resources used or preserved for human benefit. We assumed that the
vulnerability to impact depends on the
exposure to the impact and existing
condition of exposed people and resources.
We also assumed the degree of impact to
human well-being depends on the degree of
population and resource vulnerability to
impact and the intensity and spatial
dimensions of the impact sources. If a
population or resource is already in a
condition stressed by previous impacts, it is
likely to be more vulnerable to impact than
one that has not been stressed as much.
Ecological impact pathways are complex,
interactive and typically difficult to capture
without very detailed systems analysis
beyond the scope of this study. Based in
general scientific understanding, Figure 10
depicts elemental considerations during this
assessment of environmental impacts.
Some common impacts start with changes
in the attributes of hydrology,
geomorphology, and flow through
Figure 9. A generalized conceptual model was
developed to help identify environmental impacts on
human service and welfare.
Transportation System Modernization
Physical Impact on the Environment
Adverse and Beneficial Effects on Human Welfare
Future Generation Resource Use Options
Present Generation Resource Use
Environmental Service Impact
Environmental Impact Mitigation Needs of Future Port and Waterway Modernization Activities in the United States
U.S. Army Corps of Engineers 11 Institute for Water Resources
secondary changes in biotic communities inhabiting river and estuarine bottoms and shores, as
well as uplands some distance from impact sources. Atmospheric effects in particular can reach
significant distances inland before being homogenized regionally. Contributions of greenhouse
gasses increasingly are accepted as having important ecological and economic effects on global
climate (IPCC 2007). Some accidents directly influence human health and safety, while the
influences of other accidents move through atmospheric and hydrologic pathways. Other
important impacts influence both present use of cultural and natural resources and potential
resource use by future generations. The scarcest among potential resources are recognized for
their importance by institutional protections, public sentiment, and technical identification The
Nation most often recognizes sustainability needs through laws that set aside lands, waters, and
species for heritage preservation purposes.
Environmental Footprint Assessment
The framers of NEPA were concerned about the cumulative adverse impact of human activity on
the human environment. This sum of all impacts has left an environmental “footprint” on
provision of environmental services to the public identifiable in changes represented
geographically (footprint area) and by impact intensity (footprint depth) within the impacted
geographical area (e.g., Ewing et al. 2010). Both areal and depth dimensions have been difficult
to characterize accurately because of many indirect effects from activities that radiate from the
point of impact and subtle but important impacts that are sometimes difficult to discern (e.g.,
chemical contaminants that
endanger humans and other life).
Data gathered by Lubowski et al.
(2006) were used to characterize
gross geographical impacts.
Other data on U. S. land and
water area were obtained from
the USCB (2012a). More
detailed information on port and
waterway dimensions were
based on data maintained by
USACE (2010) and
approximations made during this
study.
Impacts originate in
infrastructure development,
systems operations and
maintenance, and transportation
system accidents (Figure 10).
The types of impacts considered
include air, water, and land
quality changes for which
vulnerability and modernization
impact indicators were
determined. Geographical
Figure 10. The environmental impact sources and pathways
considered in this analysis linked to economic wellbeing, human
health and safety, and environmental heritage.
Environmental Use
Estuarine Resources
Freshwater Resources
Land Resources
Property Use
Environmental Heritage
Freshwater Resources
Estuarine Resources
Land Resources
Future Use Options
Water Supply Use
Recreational Use
Commodity Production
NutrientsTurbidity
Water Quality Bottom Quality Biotic CommunityShore Quality
Toxins/oil
Sedimentation Invasive SpeciesStructure Shore Erosion
Salinity
Oxygen/pHDirect Impact
Connectivity
HydraulicsVegetationHabitat Fragmentation
Air Quality
Ozone etc.
CO2
Sulfates etc
Particulates
Human Health and Safety
Accidents Operations
Transportation System Modernization
InfrastructurePorts, Harbors, Railroads, Highways

Environmental Impact Mitigation Needs of Future Port and Waterway Modernization Activities in the United States
U.S. Army Corps of Engineers 12 Institute for Water Resources
variation in impact intensity is difficult to discern without site-specific assessments. Data
suitable for that purpose have rarely been assembled into national or regional databases.
Estimates of past impact intensity have relied largely on assessments at sites not located at ports,
but may also include some information obtained for environmental impact assessments at ports
and waterways. Important sources are referenced in the report description of the environmental
footprint and additional information is provided in Appendix A1.
The potential for future impact is also indicated by the geographic extent and proximity to the
transportation system of environments that are naturally scarce and made scarcer by past human
impact. Of particular concern are the Nation’s wetlands and rivers.
Impact Indicator Selection
The detail typically provided in the environmental impact statements of individual project plans
was not feasible for this national study. The purpose here is to broadly indicate and compare
potential impact and mitigation-costs of modernization both regionally and at different sites
within regions. For that purpose, broad indicators of human vulnerability, resource vulnerability,
and potential impact sources were developed. Indicators were chosen based on the following
criteria:
Available data found in existing databases
Nation-wide data allowing comparison across sites
Credible data gathered by authorized federal agencies
Reasonably representative data
Balanced representation of concerns in indicators
Representativeness was the most difficult of the criteria to meet. Truly representative indicators
require data gathered at the site of interest. This requires a local scale that may not be available
in potentially useful national databases. This was particularly a problem for finding good
indicators of potential adverse impact on environmental use, such as recreational/tourism use and
commodity production. Data on health, environmental justice, and heritage impacts was
determined from data gathered at a finer scale—typically the county level or smaller, or from
property boundary maps—and capable of meaningful analysis using geographical information
systems.
Probabilistic forecasts are rarely reliable because of unforeseen events that change the course of
projections. Uncertainty is the general rule for many aspects of future port and waterway
modernization impacts and mitigation needs. For that reason, future possibilities are discussed
broadly, recognizing the limitations of data and analyses. The primary benefit gained from such
an approach is awareness of some fundamentally important environmental considerations in
decisions about where and when to invest in port and waterway modernization.

Environmental Impact Mitigation Needs of Future Port and Waterway Modernization Activities in the United States
U.S. Army Corps of Engineers 13 Institute for Water Resources
The discussion of mitigation possibilities is organized by port and separately by more general
waterway modernization possibilities in regions along the Northeast Atlantic Coast, Southeast
Atlantic Coast, Gulf Coast, Pacific Coast and the Mississippi and Illinois River waterways.
These regions were defined by modernization expectations in ports and waterways. The 20 ports
selected for detailed study are among the top container ports in the nation.
The indicators used for human and resource vulnerability are organized by type of welfare
impact. These include health and safety (including environmental justice), important natural
heritage, and economically valued resource use. The indicators used for modernization-impact
sources include harbor expansion, port facilities expansion, and freight transport operations
effects associated with regional population growth.
Each of the indicators is briefly described below.
Health, Safety and Environmental Justice
The major pathways for increased freight traffic and
modernization effects are through air, water, and, to
lesser extent, land quality. Three indicators were
chosen to represent the potential for human impact
through each of these three pathways. In addition,
measures of potentially disproportionate impact on low
income and minority groups were used to indicate
inequitable distribution of environmental impacts.
Unhealthy Air. The Environmental Protection Agency
(EPA) maintains data on atmospheric conditions that
exceed standards set for the general population, the
young and elderly, and for people with respiratory
illnesses. The last of these categories requires the
strictest standards, which were used here. They are set
by the number of days that air quality standards were
Ports Included in the Detailed Study
Northeast Southeast Gulf West
Boston MA Norfolk VA Tampa FL Los Angeles CA
New York-New Jersey NJ Wilmington NC Mobile AL Long Beach CA
Philadelphia PA Charleston SC New Orleans LA Oakland CA
Wilmington DE Savannah GA Houston TX Tacoma WA
Baltimore MD Jacksonville FL
Port Everglades FL
Miami FL
Indicators of Potential Impact
Unhealthy air
Number of discharges into waters
Number of superfund sites
Minorities
Low income group
Parks and other preserves
Wetlands
Endangered species
Commercial fishing
Sportfishing
Public beaches
Harbor capacity
Regional population growth
Port capacity

Environmental Impact Mitigation Needs of Future Port and Waterway Modernization Activities in the United States
U.S. Army Corps of Engineers 14 Institute for Water Resources
exceeded in counties within 10 km of the port (EPA 2012a). In general, people exposed to
unhealthy air are more vulnerable to the effects of any further contribution to poor air quality.
Degraded Water Quality. Potential adverse impacts from altered water quality are inversely
indicated by the total number of discharges permitted to enter waterways within 10 km of the
port. These data are collected by EPA (2012b). The number of permitted discharges, although
accurately counted, does not account for variation in the volume and quality of the discharged
water or sources of discharge without permit. More precise data on port area water quality is not
equally available for ports and is variable.
Land and Water Contamination. The number of superfund sites is another indicator of potential
environmental issues in the vicinity of ports. The data are maintained by the EPA (2012b).
Superfund sites usually indicate some form of existing chemical or other hazard. The total
number within the port neighborhood is an indicator of vulnerability to additional impacts from
port modernization. While superfund sites vary in degree of contamination and containment,
port vicinities with a high number are more likely to suffer more generally from land, water, and
air quality degradation, making people and other life forms particularly vulnerable to any
additional impact.
Minority Status. The percentage of non-white people living within 5 km of the port compared to
the Nation as a whole was used as an indicator of inequitable exposure of minorities to unhealthy
air, water, and soil; noise; and unpleasant surroundings caused by port operations. The data were
collected by the USCB Geographic Division (2012b). Environmental injustice of this kind is
increasingly a factor in environmental assessments and mitigation requirements.
Low Income. The percentage of people living in poverty within 5 km of the port is another
indicator of inequitable exposure of people to harmful environmental impacts simply because
they cannot afford to avoid the area. NEPA establishes a national goal to provide a healthful,
safe and pleasant environment for all, not just for those who can afford to move. The data were
collected by the USCB Geographic Division (2012b).
Heritage Preservation
Heritage is preserved in diverse ways. It may be officially recognized in preserves, in Executive
Order recognition of protection considerations (e.g. wetlands), or in individual species
protections.
Geographical Area of Parks, Refuges, and Other Preserves. An indicator of potential adverse
impact on natural and cultural heritage is the area set aside officially to conserve important
natural and cultural resources locally and/or nationally. The geographical area of officially
recognized preserves within 10 km was obtained from data collected by USGS (2012).
Wetland Area. Wetlands have been identified as ecosystems of particular importance for the
functions they serve in their natural condition and their growing scarcity. The geographical area
of wetlands within 10 km of the port is an indicator of their vulnerability to impacts. The data are
from USGS (2010).
Vulnerable Species. The number of species in port neighborhoods that are determined to be
threatened or endangered and protected under the Endangered Species Act is an indicator of the

Environmental Impact Mitigation Needs of Future Port and Waterway Modernization Activities in the United States
U.S. Army Corps of Engineers 15 Institute for Water Resources
vulnerability of those and other species yet to be listed. These data are collected and maintained
by FWS (2012).
Beneficial Use of the Environment
Beneficial use of the environment may take many forms including fishing, swimming,
sightseeing, and aesthetic appreciation shown by property values. The three indicators of
beneficial use of natural resources are often found in close proximity to ports. They include
sportfishing, commercial fishing, and public beaches.
Saltwater Sportfishing. Saltwater sportfishing is an important indicator of ocean and estuary
recreational use including closely related recreational boating. Data are periodically collected
for each state by the U. S. Fish and Wildlife Service (FWS 2006). Both in-state and out-of-state
anglers are included. Because the concentration of fishers is a function of shoreline length and
local access sites are typically spaced out along the shoreline, the number of fishing days is
divided by length of tidal shoreline in the state using data from the USCB (2012a). This
accounts to some degree for the numerous fishing access alternatives to the container port area.
Variability in the proximity of fishing access points to container points is not indicated in the
data.
Commercial Fishing. This indicator of an important natural resource use (Figure 11) is based on
the economic value of commercial fish landings—data collected by NOAA (2012). The data are
reported by state. Because the concentration of fishing vessels is a function of shoreline length,
the dock-side value is divided by state shoreline length (using data from the USCB 2012a).
States with long shorelines are less likely to have a significant part of fishery harbor activities in
close proximity to a port. Variability in the proximity of important commercial fishing harbors
to container ports is not indicated in the
data.
Beach Use. Another indicator of valued
resource use is the geographical area of
public beaches within 10 km of the port
area. The data were obtained from EPA
(2012c), which monitors water quality at
public beaches.
Potential Impact Sources from Port
Modernization
Three metrics were chosen to indicate the
potential amount of environmental impact
mitigation required to achieve post-
panamax readiness. The metrics include
harbor capacity expansion needs, future
growth of port operations, and port
capacity expansion needs.
Post-panamax harbor expansion need. This metric is based on the 50-foot depth of the new
locks built in the Panama Canal, the existing depth of main channels leading into ports, and the
Figure 11. The vulnerabilities of sport and commercial
fishing to increased freight transport are indicators of
possible adverse impacts on the local economy.

Environmental Impact Mitigation Needs of Future Port and Waterway Modernization Activities in the United States
U.S. Army Corps of Engineers 16 Institute for Water Resources
length of those channels. The widths of post-panamax channels are expected to be similar, so
the difference between 50 feet and existing depths times the channel length is a reasonably good
indicator of the total excavation and material disposal required to become post-panamax ready.
It may also indicate maintenance dredging needs and possible alteration in salinity, oxygen, and
other water quality attributes that can threaten bottom life, wetlands, and drinking water intakes.
The data are collected by the USACE for agency use (unpublished data).
Future growth of port operations. Any increase of freight movement through ports and
intermodal transport will be accompanied by an array of operations effects. The demand for
more imported freight is a function of future growth of the population served and per capita
increases in income. Regional population growth is the more predictable of the two variables
and is the sole indicator used here to examine potential differences in air quality effects and other
freight transport operations effects. The regional population was defined mostly by state
populations within 500 miles of the port area, but also depended on route directness and the
number of ports in a better position to serve the states (see Appendix A2). The data were median
forecasts of state population growth estimated by the U. S. Census Bureau for the years 2000 to
2030 (USCB 2012c). This indicator has its limitations because some freight travels much longer
distances than 500 miles. Ports in the future may wish to capture a larger market share, thereby
reaching capacity sooner, or give up market share to more aggressive ports, thereby reaching
capacity later.
Port Capacity Expansion Needs. Port expansion
needs and potential impacts are indicated by the
differences between the percent growth of the
regional population over the next 30 years (USCB
2012c) and the percent of unused port capacity
(Smith and Knight 2012). The mean of five port
capacity indicators was used. These include berth
size for vessels calling at the ports, number of
berths serving calling vessels, freight transfer
cranes, and port storage space (Figure 12), and
average vessel use.
We assumed that existing port capacity can absorb
much of the increased growth in freight movement
and areas around ports with high population
growth and low capacity will be most vulnerable
to actions taken to increase capacity.
The raw values of the indicators were normalized
between 100 (assigned to the maximum raw score) and some lower value equal to or greater than
0. The normalized indicators were summed to provide an overall index to the potential relative
impact of each port and region. No attempt was made to weight the relative impact importance
of the indicators.
The indicators have their limitations. They were selected to be representative, quantifiable,
reliable, and comparable across all sites and functioned well for their purpose. However, they are
Figure 12. Container storage capacity is one
of several indicators of future port capacity for
processing greater freight volume.

Environmental Impact Mitigation Needs of Future Port and Waterway Modernization Activities in the United States
U.S. Army Corps of Engineers 17 Institute for Water Resources
not as representative of environmental impacts and impact mitigation needs as data gathered for
site-specific environmental impact assessments. They provide a broad indication of some major
environmental concerns at ports, but do not represent all possible impacts or how impacts
interact uniquely with conditions at individual ports. The indicators provide insights into
environmental concerns that could arise at ports and should be addressed more specifically
during environmental assessments at individual sites, but should be considered in the context of
the data limitations and forecasting uncertainties.
The Environmental Footprint
Overview
The transformation of the American landscape by human development and use has come at
significant environmental cost. Development of existing ports, waterways, and intermodal
transport links has interacted cumulatively with other sources of environmental impact to
adversely affect the Nation’s lands, waters, and atmosphere. The total effect has degraded
numerous commercial and recreational uses of water and associated land area (Millennium
Ecosystem Assessment 2005), contributed to health and safety concerns (Frumkin 2010), and
also contributed to the probable or possible extinction of at least 240 American species and the
decline of many more (Master et al. 2000).
Sorting out the contribution of the transportation system to the Nation’s environmental footprint
is difficult, given poor records for ports and waterways and the complex interrelationships
among all sources of environmental impact. The direct effects of port, waterway, highway, and
railroad infrastructure development, operation, and use on the Nation’s lands and waters makes
up a small fraction of the geographical footprint of all human activity on the natural
environment. However, the effects of land transport are particularly intense (the land surface is
largely converted to concrete and other impermeable surface) and some indirect effects on air
and water quality are far-reaching (EPA 1996, Hecht 1997).
The nation’s freight transportation system geographically interfaces with and often overlies some
of the Nation’s most nationally scarce waters and wetlands. Air, water, land, and biological
attributes of waterways and coastlines have been cumulatively altered by port development,
harbor channel and basin excavation, maintenance dredging, dredged material disposal, lock and
dam structures, intermodal rail and highway infrastructural links, and vehicular/vessel
operations. Much of this impact occurred before major environmental legislation passed in the
1970s, starting with presidential approval of NEPA, followed soon after by the CAA, CWA,
ESA and other significant environmental legislative and presidential directives.
As a consequence of these social commitments to environmental sustainability, the avoidance,
repair, and compensatory mitigation of significantly adverse environmental impact is now
unavoidable. Mitigation for environmental impacts integrates the costs of environmental
protection into evaluations of the net benefits from investments. These costs may be substantial,
sometimes totaling nearly half of the total project cost (e.g. Mayle and Landers 2012). Through
the costs they entail, mitigation actions are a major determinant of forecast investment worth,
and, therefore, are an important consideration in any strategic analysis of transportation system
modernization needs.

Environmental Impact Mitigation Needs of Future Port and Waterway Modernization Activities in the United States
U.S. Army Corps of Engineers 18 Institute for Water Resources
Largely because of protective and restorative legislation, cumulative environmental impact has
lessened in recent decades, and air and water quality have both improved significantly. In
addition, ecological restoration programs administered by USACE, NOAA and other agencies
and organizations have begun to reduce past damage done by physical impacts to lands and
waters.
EPA’s most recent report on the environment (EPA 2008) indicates major improvements in
atmospheric quality. Except for green house gas emissions and atmospheric concentrations,
which continue to increase, most indicators of poor air quality have been in decline over the past
two decades despite substantial population increase. However, local concentrations of harmful
pollutants remain problematic in some dense urban areas; sometimes where major ports are
located.
Water trends are less definitive (EPA 2007). Stream discharge variability appears to be
improving with fewer periods of no flow in indicator streams. However, nutrient concentrations,
contaminants levels in fish, stream bottom stability and bottom-community integrity remain
moderately to severely degraded in many locations. In recent decades, species diversity has been
stable along most coasts, but decreased in the upper Mississippi and Ohio River watersheds
(Chaplin et al. 2000). The large extent of coastal anoxia caused by nutrient enrichment is now
widely recognized in many coastal areas (Diaz and Rosenberg 2008). Wetland loss has slowed,
but significant losses continue in freshwater and estuarine marshes (Dahl 2012).
Natural Scarcity of Wetlands and Waters
Wetlands in the conterminous United States are
concentrated along the coasts and in river
floodplains (Figure 13). In floodplains, wetland
areas join with other riparian ecosystems to
provide corridors that are essential for species
movement and survival. Geographically, wetland
and surface-water ecosystems are among the
scarcest in the conterminous United States (Table
1). Wetland and surface water impacts are of
exceptional environmental concern—as identified
in executive order and law—because they provide
important natural services (e.g., for navigation,
water supply, habitat of desired species, flood moderation, water treatment, property protection
and enhancement) and were growing more scarce.
Wetland area has been reduced from about 11.1 % to 5.3 % of the conterminous states by filling,
draining, excavating, and flooding (Dahl and Alford 1996). Many riparian corridors are badly
fragmented. Tidal estuarine wetlands have been particularly vulnerable to coastal port
development because of their location and natural scarcity. Estuarine wetlands occupy about
5.4% of the total wetland surface area and about 0.3% of the total land and water area. In recent
Figure 13. Wetland ecosystems are scare and some are
vulnerable to port and waterway activities because they are
concentrated along coasts and large rivers.

Environmental Impact Mitigation Needs of Future Port and Waterway Modernization Activities in the United States
U.S. Army Corps of Engineers 19 Institute for Water Resources
Table 1. Estimated geographical areas of land, wetland, and surface water in the
conterminous United States
Geographical Area by Category Area in Thousands of
Square Miles
Percent of total
Conterminous U. S.
Total Land and Water 3, 1201 100.0
Total Land (including wetlands) 2,9551 94.7
Original Total Wetlands 3462 11.1
Present Total Wetlands 1663 5.3
Present Estuarine Wetlands 93 0.3
Total Surface Water (excludes wetlands) 1654 5.3
Marine Coastal (12 miles) 611 2.0
Great Lakes 611 2.0
Remaining Waters 446 1.3
Reservoir Area 247 0.7
Rivers and Natural Lakes 208 0.6
1. USCB 2012s. Includes wetlands.
2. Dahl and Alford (1996). Much of this was converted to crop culture.
3. Dahl (2012). Roughly half of the wetlands are protected in parks, wildlife refuges and wilderness areas so the total land area
undergoing light recreational use or no appreciable use is about eight percent.
4. Includes U. S. Great Lakes, other inland waters, and oceanic waters to the 12-mile territorial limit
5. U. S. waters only (Great Lakes Environmental Research Laboratory, NOAA)
6. Calculated by difference. Includes rivers, natural lakes and reservoirs but not most wetlands.
7. Martin and Hanson (1966). They calculated total reservoir area in1963. That has since changed somewhat as new reservoirs
were built and old ones were drained or filled with sediment.
8. Estimated by difference between surface areas of remaining waters and reservoirs.
______________________________________________________________________________
years, estuarine wetlands have been lost at a rate of about 14,000 acres (0.28%) per year (Dahl
2012). The main causes were hurricanes interacting with rising sea level and man-made
channels. Tidal wetlands once recovered quickly following hurricane damage but many no
longer do because of reduced supplies of replacement sediments and salt water intrusion by way
of dredged channels (Gossalink et al. 1998). The geographical area of nontidal wetlands is more
stable but changing in character. Policy now promotes repair or replacement of significantly
degraded wetlands and avoidance of any impact on irreplaceable wetlands.

Environmental Impact Mitigation Needs of Future Port and Waterway Modernization Activities in the United States
U.S. Army Corps of Engineers 20 Institute for Water Resources
The sum of all surface waters in lakes, rivers, estuaries and territorial oceans are as scarce as
wetlands (Table 1). About three fourths of the total water surface area is nearly equally
distributed among the Great Lakes and territorial oceanic waters within the 12-mile limit. The
remaining area is in inland rivers, lakes, and reservoirs, which in total amount to about 1.3 % of
the conterminous U. S. land and water surface. More than half of that total is reservoirs. Free-
flowing rivers and natural lakes are much scarcer than nontidal wetlands. Each is nearly as
scarce as estuarine wetlands and as aggressively protected from unmitigated impact.
Sources of Environmental Degradation
Major Land Use Impacts
Table 2 summarizes estimates of the geographical area of land and water impacted by use. About
10.3% of the conterminous United States is set aside in a largely wild state for light recreational
or other low-impact use in officially designated public parks, wildlife refuges, and wilderness
areas (Lubowski et al. 2006), and in wetlands outside those protected areas (Dahl 2012).
Table 2. Areas and percentages of the conterminous United States impacted directly by
different land uses and transportation system infrastructure. Estimates do not include
indirect effects (e.g., contaminated runoff effects).
Geographical Area by Category for the
Conterminous U. S.
Area in Thousands
of Square Miles
Percent of Total
Conterminous U. S.
Total Land and Water 3, 1201 100.0
Noncrop Agriculture (includes forest use) 1,7862 57.2
Crop Agriculture 6912 22.1
Parks, wildlife refuges, wilderness 1562 5.0
Rural Residential 1462 4.7
Densely Urban (~10% transportation) 932 3.0
Rural land transportation infrastructure, 422 1.3
Sediment disposal ~1.83 0.06
Inland Waterway channels and reservoirs ~1.24 0.04
Water Ports (landside) ~0.45 0.01
Harbor channels ~.36 0.01
1. USCB (2012a). Includes wetlands.
2. Lubowski et al. (2006). About 10% of the urban area is estimated to be devoted to transportation.
3. Approximated. The annual dredging between 1985 and now is between 200 and 300 million cubic yards based on several
USACE estimates. While using the high estimates may result in an overestimate, the amount of material originally excavated
is unknown and also contributes significantly. The estimate is based on 300 million cubic yards dredged annually since the 9-
foot deep system was virtually completed in the 1970s and half that amount between then and1930 when the 9-foot systems
began to be created (Dredging began nearly a century earlier but was a relatively small amount). Deposits were assumed to

Environmental Impact Mitigation Needs of Future Port and Waterway Modernization Activities in the United States
U.S. Army Corps of Engineers 21 Institute for Water Resources
average 10-feet deep. The area could vary significantly depending on mean depth of deposition and variation in actual
amounts deposited.
4. Approximated. USACE has developed and maintained about 12,000 miles of inland waterways (USACE 2010). About 5,000
miles are impounded. Assuming a 500-foot average river width before impoundment, this amounts to about 500 square miles
of altered river habitat. The remaining 7,000 miles is a channel impact area estimated to average about 500 feet wide (400 feet
authorized by allowing for additional impacts on adjacent bottom). This approaches 700 square miles.
5. Approximated from areal estimates of port land area. Port landside areas for major ports range downward from about 5 square
miles for the combined container ports of Los Angeles and Long Beach to less than 0.1square mile. All but about 50 of the
926 ports maintained by USACE are small and generally less than an approximate mean port area of 0.4 square miles.
Includes marine coastal water to U. S. territorial limit, Great Lakes and artificial reservoirs (USCB 2012a).
6. Based on 26 out of 63 major ports, mean channel length are estimated to be 25 miles and mean width is 700 feet (~200 square
miles). The other 863 ports have much smaller needs and were estimated to occupy in total less than 100 square miles. Many
of them receive very little commercial freight.
More intensively used agricultural and forest lands together make up the largest fraction of the
conterminous United States. About 57% is lightly to moderately altered by forest and grazing
uses and 22% is more intensively affected by crop culture (Figure 14). Nearly 8% is intensively
altered by rural residential and urban development, of which 3% is densely urban (Figure 14).
Landside Transportation Infrastructural
Impacts
Landside transportation system infrastructure
includes platforms for port facilities and storage,
parking lots, railroads, highways, pipelines, and
numerous other artificial structures placed in and
along rivers, coastal areas, and on land.
Landscape changes caused by landside
infrastructure amount to about 1.6%
of the conterminous United States. The rural
transportation system (sum of rail, highway,
airports, water ports, etc.) directly impacts about
1.3% and urban transportation contributes
another 0.3%. Freight transport uses a large
fraction of the transportation system area,
including household delivery and pick up.
Roads contribute most to the transportation
system footprint on land and coastal ports are
among the least. An approximate estimate of
landside port area converted to hard surface is
less than 1% of the transportation system surface
area and about 0.01% of the total land area. The
major cause of wetland loss is associated largely
with drainage for agricultural development (Dahl
and Alford 1996) and urban development is a
secondary cause.
Figure 14. Urban land use (upper map) and agricultural
land use (lower map) are major sources of erosion and
other environmental impacts
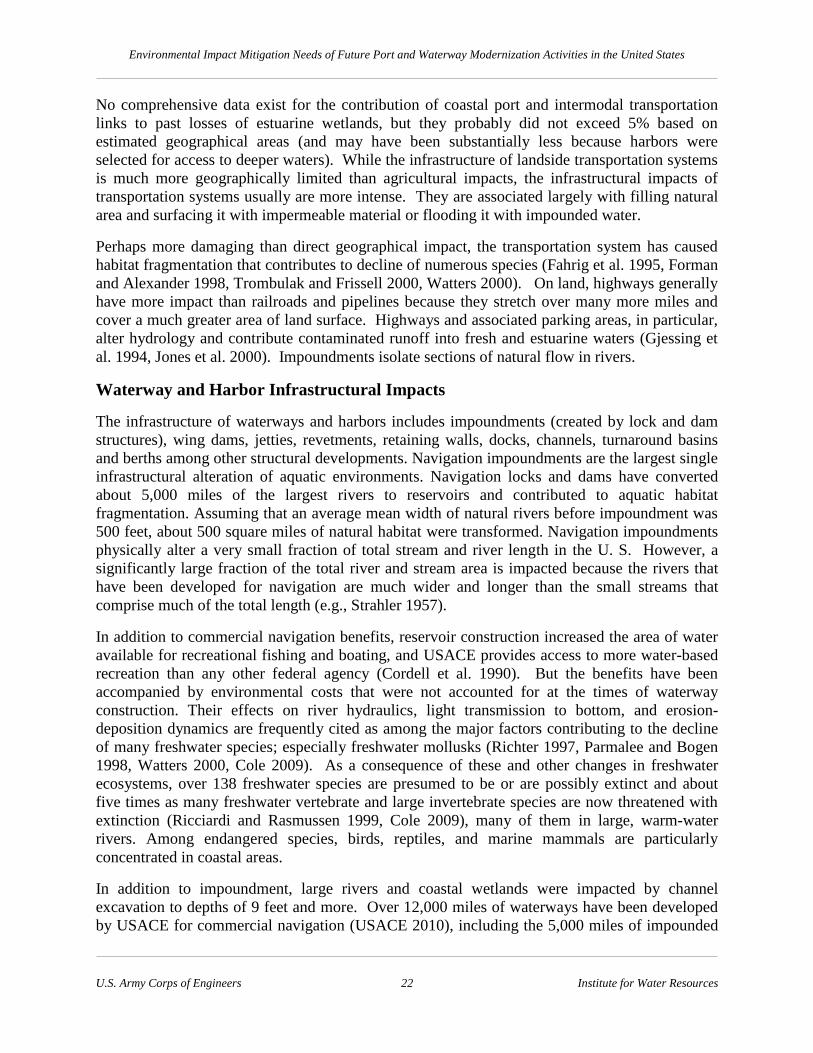
Environmental Impact Mitigation Needs of Future Port and Waterway Modernization Activities in the United States
U.S. Army Corps of Engineers 22 Institute for Water Resources
No comprehensive data exist for the contribution of coastal port and intermodal transportation
links to past losses of estuarine wetlands, but they probably did not exceed 5% based on
estimated geographical areas (and may have been substantially less because harbors were
selected for access to deeper waters). While the infrastructure of landside transportation systems
is much more geographically limited than agricultural impacts, the infrastructural impacts of
transportation systems usually are more intense. They are associated largely with filling natural
area and surfacing it with impermeable material or flooding it with impounded water.
Perhaps more damaging than direct geographical impact, the transportation system has caused
habitat fragmentation that contributes to decline of numerous species (Fahrig et al. 1995, Forman
and Alexander 1998, Trombulak and Frissell 2000, Watters 2000). On land, highways generally
have more impact than railroads and pipelines because they stretch over many more miles and
cover a much greater area of land surface. Highways and associated parking areas, in particular,
alter hydrology and contribute contaminated runoff into fresh and estuarine waters (Gjessing et
al. 1994, Jones et al. 2000). Impoundments isolate sections of natural flow in rivers.
Waterway and Harbor Infrastructural Impacts
The infrastructure of waterways and harbors includes impoundments (created by lock and dam
structures), wing dams, jetties, revetments, retaining walls, docks, channels, turnaround basins
and berths among other structural developments. Navigation impoundments are the largest single
infrastructural alteration of aquatic environments. Navigation locks and dams have converted
about 5,000 miles of the largest rivers to reservoirs and contributed to aquatic habitat
fragmentation. Assuming that an average mean width of natural rivers before impoundment was
500 feet, about 500 square miles of natural habitat were transformed. Navigation impoundments
physically alter a very small fraction of total stream and river length in the U. S. However, a
significantly large fraction of the total river and stream area is impacted because the rivers that
have been developed for navigation are much wider and longer than the small streams that
comprise much of the total length (e.g., Strahler 1957).
In addition to commercial navigation benefits, reservoir construction increased the area of water
available for recreational fishing and boating, and USACE provides access to more water-based
recreation than any other federal agency (Cordell et al. 1990). But the benefits have been
accompanied by environmental costs that were not accounted for at the times of waterway
construction. Their effects on river hydraulics, light transmission to bottom, and erosion-
deposition dynamics are frequently cited as among the major factors contributing to the decline
of many freshwater species; especially freshwater mollusks (Richter 1997, Parmalee and Bogen
1998, Watters 2000, Cole 2009). As a consequence of these and other changes in freshwater
ecosystems, over 138 freshwater species are presumed to be or are possibly extinct and about
five times as many freshwater vertebrate and large invertebrate species are now threatened with
extinction (Ricciardi and Rasmussen 1999, Cole 2009), many of them in large, warm-water
rivers. Among endangered species, birds, reptiles, and marine mammals are particularly
concentrated in coastal areas.
In addition to impoundment, large rivers and coastal wetlands were impacted by channel
excavation to depths of 9 feet and more. Over 12,000 miles of waterways have been developed
by USACE for commercial navigation (USACE 2010), including the 5,000 miles of impounded

Environmental Impact Mitigation Needs of Future Port and Waterway Modernization Activities in the United States
U.S. Army Corps of Engineers 23 Institute for Water Resources
water. The total area actually excavated is not well documented. Original excavation depths
varied widely depending on variation in river and estuary depth. Even where excavation has not
occurred, channel bottoms are regularly disturbed by boat and barge traffic. Based on an
estimated length of 7,000 miles and an average disturbance width of about 500 feet (the channel
is authorized to be 400 feet wide but adjacent areas are also impacted), the disturbed area
amounts to about 700 square miles. Impounded area is an estimated 500 square miles. In
addition, the total area encompassed in coastal harbor excavation of channels, turn-around
basins, and berths is estimated at about 300 square miles. The total area estimated to be directly
impacted by excavation, impoundment, and use is about 1,500 square miles (0.05%).
Channel deepening causes hydraulic changes, which, in tidal environments, can lead to salt water
intrusion into freshwater tidal environments (PIANC Working Group No. 6. 1993) where it may
degrade the quality of domestic or industrial intake water, freshwater wetlands, and other
habitats. Dredging also can create an environment more prone to severe oxygen depletion,
which kills, harms, or repels many species (Diaz et al. 1992 and Diaz and Rosenberg 1995).
This has been a major issue at the Port of Savannah, where channel deepening is anticipated to
foster salt water intrusion (Savannah District Corps of Engineers 2011). In rivers, channel
deepening concentrates more river flow in the channel, diverting flow from other parts of the
river not directly impacted by the deepening. Concentrating flow in deep channels reduces the
area of suitable habitat for many fish and molluscan species adapted to shallower riffles and
shoals, especially during droughts.
Harbor jetties and other infrastructure that extends above the water line alter shore erosion and
deposition (Dean and Dalrymple 2002). In some locations, these changes can influence barrier
beach protection of estuarine wetlands. River revetments, wing dams, and other structures can
contribute to river disconnection from floodplain habitats (Jurajda 1995) that act as fish nurseries
(Holland 1986, Copp 1989) and support other species (e.g., Bodie and Semlitsch 2000).
Transportation System Operations
Air Quality Effects
Atmospheric emissions, including greenhouse gasses, are among the most obvious sources of
environmental impact associated largely with transportation (Figure 15). The land- and water-
based freight transportation system consumes 8.6% of the total energy used in the Nation (from
data reported in USDOE 2012), virtually all of it in the form of fossil fuel. Most of that is from
passenger traffic in cars, light trucks, and aircraft. Less than 3% of the total energy use is for
freight transport, but virtually all of that is from fossil fuel, much of which is from one of the
most polluting sources—diesel fuel. Trucks consume over 72% of the freight-transport energy
(data reported in USDOE 2012). One of the claimed benefits of maritime freight transport is
cost savings from greater fuel efficiency and reduced atmospheric emissions, both of which
improve with increased vessel size (Notteboom and Vernimmen 2009). However, vessels in
ports and waterways can be major contributors to local atmospheric pollution (Corbett and
Fischbeck 2000, PIANC Envicom Task Group 2 2011).
Fuel efficiency and atmospheric emissions are important considerations in seeking the most
beneficial combination of freight transport modes. The high fuel efficiency of large ocean-going
vessels (Notteboom and Vernimmen 2009) is a primary reason why they are the least costly for
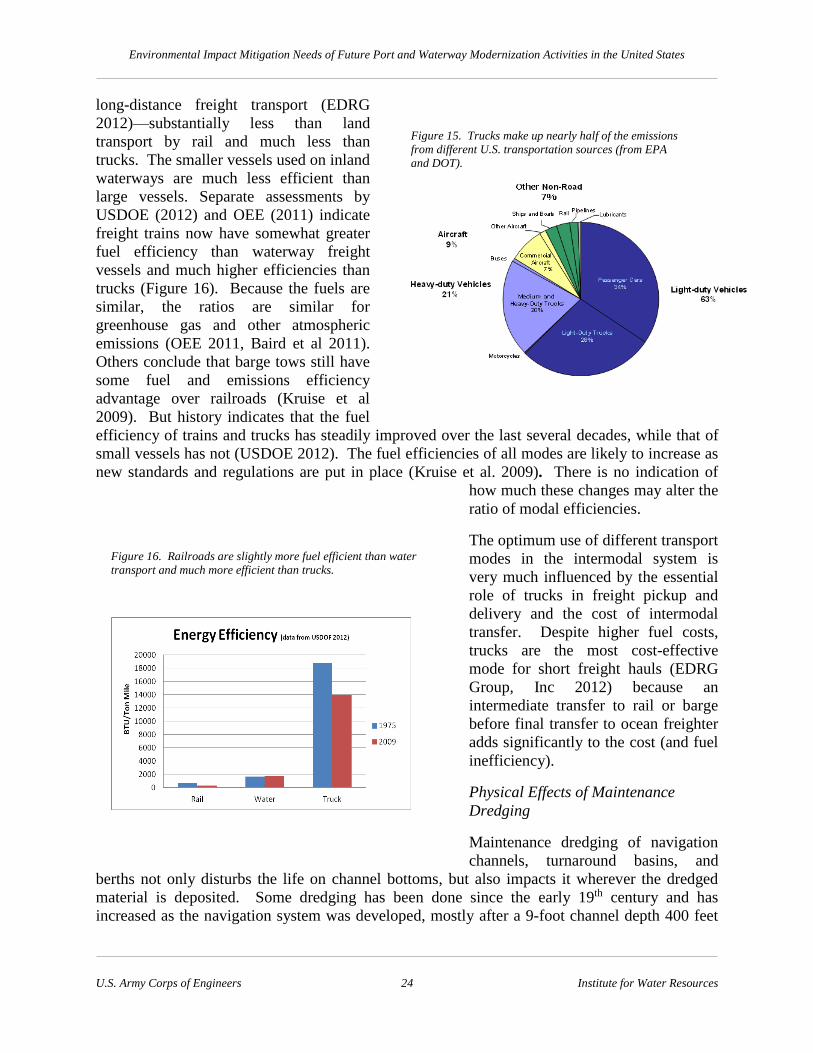
Environmental Impact Mitigation Needs of Future Port and Waterway Modernization Activities in the United States
U.S. Army Corps of Engineers 24 Institute for Water Resources
long-distance freight transport (EDRG
2012)—substantially less than land
transport by rail and much less than
trucks. The smaller vessels used on inland
waterways are much less efficient than
large vessels. Separate assessments by
USDOE (2012) and OEE (2011) indicate
freight trains now have somewhat greater
fuel efficiency than waterway freight
vessels and much higher efficiencies than
trucks (Figure 16). Because the fuels are
similar, the ratios are similar for
greenhouse gas and other atmospheric
emissions (OEE 2011, Baird et al 2011).
Others conclude that barge tows still have
some fuel and emissions efficiency
advantage over railroads (Kruise et al
2009). But history indicates that the fuel
efficiency of trains and trucks has steadily improved over the last several decades, while that of
small vessels has not (USDOE 2012). The fuel efficiencies of all modes are likely to increase as
new standards and regulations are put in place (Kruise et al. 2009). There is no indication of
how much these changes may alter the
ratio of modal efficiencies.
The optimum use of different transport
modes in the intermodal system is
very much influenced by the essential
role of trucks in freight pickup and
delivery and the cost of intermodal
transfer. Despite higher fuel costs,
trucks are the most cost-effective
mode for short freight hauls (EDRG
Group, Inc 2012) because an
intermediate transfer to rail or barge
before final transfer to ocean freighter
adds significantly to the cost (and fuel
inefficiency).
Physical Effects of Maintenance
Dredging
Maintenance dredging of navigation
channels, turnaround basins, and
berths not only disturbs the life on channel bottoms, but also impacts it wherever the dredged
material is deposited. Some dredging has been done since the early 19th century and has
increased as the navigation system was developed, mostly after a 9-foot channel depth 400 feet
Figure 16. Railroads are slightly more fuel efficient than water
transport and much more efficient than trucks.
Figure 15. Trucks make up nearly half of the emissions
from different U.S. transportation sources (from EPA
and DOT).

Environmental Impact Mitigation Needs of Future Port and Waterway Modernization Activities in the United States
U.S. Army Corps of Engineers 25 Institute for Water Resources
wide was authorized for construction in 1930 (USDA and USDT 2010). Maintenance dredging
increased as the system was created until the 1970s and has remained relatively stable since then.
A geographical comparison of dredging impacts is desirable to show perspective, but long-term
records of past amounts of dredging are spotty and approximate. Even though annual dredged
material estimates have improved in recent years, the geographical area impacted by dredge
material deposits can only be roughly approximated. Francinques et al. (1985), USACE Office
of History (1998), EPA and USACE (2007), and USACE (2010) indicate that between 200 and
300 million cubic yards were dredged annually between 1985 and 2002. Similar amounts of
dredged material are assumed to have been removed annually since the waterway system was
completed about 40 years ago. To err on the high side, it was estimated at the high rate of 300
million cubic yards per year over the 40 years. The high annual estimate used since 1970
compensates to some degree for unknown amounts dredged earlier than 1930, before work began
on the modern waterway. There is not much data for dredged material before 1970. The amount
dredged was less during the period of major waterway development because there was less
waterway area to maintain. It was crudely estimated to average about 150 million cubic yards
per year. Assuming a 10-foot average deposition depth, about 1,800 square miles (0.06%) of
aquatic and terrestrial habitat was covered at one time or another with dredged material (Table
2). While the estimate provides some perspective for comparison, the actual deposition depth is
highly variable and the actual amount covered could be substantially more or less than the
estimate.
While the geographical area covered with dredged material may be a good indicator of relative
short-term impact, it is not a good indicator of long-term adverse impact to natural communities.
Numerous studies of the effects of dredging and disposed dredged material completed not long
after NEPA and the CWA act were passed indicate that adverse impacts on bottom organisms
usually are temporary when the material is placed on similar bottom materials and is not
contaminated with toxic material (Allen and Hardy 1980 and Weck and Crossan 1981). More
recent studies generally confirm the temporary or minimal adverse effects of most dredging
(Lewis et al. 2001, O’Donnell et. al. 2007, Crowe et al. 2010, Parsley et al. 2011). Dredging
often adds to underwater relief, which, like other bottom structure (e.g. Turner et al 1999), may
provide habitat diversity in support of a more diverse biotic community. Early disposal
sometimes formed islands, which, from a positive standpoint, were frequently used by birds
(Landin and Soots 1978). Dredged material habitats appear to be as useful as natural sites for
some endangered birds, such as least terns (Krogh and Schweitzer 1999).
Some dredging in the past had more persistent adverse effects on productivity, scarce species and
scarce ecosystems, such as shallow estuary wetlands, coral reefs (Erftemeijer and Lewis 2006,
Ray 2007) and oyster reefs (Visel 1988), as well as some unavoidable take of endangered
species, such as sea turtles and sturgeon. Dickerson (2012) reported that 26 threatened and
endangered species may be affected by dredging in the southeastern United States, but sea turtle
and sturgeon mortalities are most closely monitored. USACE has invested significantly in
improvements to reduce dredging impacts on sea turtles (Dickerson et al. 2004) and they are now
a very small fraction of the total number of turtles killed by other means, including commercial
fishing (Finkbeiner et al. 2007). An average of 29 sea turtles per year made up the known
casualties of USACE dredging from 2002 through 2011(USACE 2012).

Environmental Impact Mitigation Needs of Future Port and Waterway Modernization Activities in the United States
U.S. Army Corps of Engineers 26 Institute for Water Resources
Before 1970, the adverse impacts of
dredging were largely left unmitigated. In
the early 1970s, NEPA, the CWA, and the
ESA contributed importantly to major
changes in those practices, forcing more
care with excavation and disposal.
USACE began to research the use of
dredged material for beneficial habitat
creation during the 1970s (Lunz et al.
1978). Since then, USACE has
increasingly sought deposition sites and
means that would add more value than
mitigation alone. In 1992, USACE was
authorized to plan and implement projects
to beneficially use dredged materials for
various purposes. Habitat improvement
for support of valued species has been the
most common beneficial use (Figure 17).
Such projects need to assure that any habitat destroyed in the newly created use of dredged
material is more valuable than the existing use of the area where it is deposited. About 20 to 30%
of dredged material is now used for beneficial purposes (EPA and USACE 2007) and USACE is
seeking more opportunities. Appendix A1 provides more information about the environmental
impacts of dredging and how USACE disposes of and uses dredged material.
Water Quality Effects
Despite improvement since the CWA was passed in 1972, EPA (2007, 2008, 2012) estimates
that nearly half of all rivers and lakes continue to suffer from degraded water quality (Figure 18),
as do estuaries. Degradation along the coasts is particularly concentrated in urban areas where
large ports are located. Port operations are a significant source of estuarine water quality
degradation (Bailey et al 2004). All
contributions to water quality degradation are
a concern even though they may play
relatively small roles compared to major
watershed sources of agricultural and
municipal pollutants including nutrients,
pesticides, pathogens, and turbidity-causing
suspended sediment. Appendix A1 provides
more information about urban runoff effects.
Maintenance dredging can impact water
quality and bottom areas. About 10% of
dredged material was contaminated enough
with toxic materials in the 1980s and 1990s to
take special precautions with its disposal
(Francinques et al. 1985, EPA 1998). Toxic
Figure 18. The distribution of impaired water quality is
particularly concentrated in many areas near major ports
(EPA data).
Figure 17. In the past, some dredged material disposal
unintentionally provided valuable habitat. Now 20-30
percent is intentionally used for habitat and other beneficial
purposes.

Environmental Impact Mitigation Needs of Future Port and Waterway Modernization Activities in the United States
U.S. Army Corps of Engineers 27 Institute for Water Resources
sediments are common near urban areas, mines and other sources of toxic materials where they
may directly impact bottom organisms or indirectly impact fish and other species that eat them
(Burton and Landrum 2005). Coastal waters near large cities are of particular concern (EPA
1998). Since the Clean Water Act was passed, bottom sediments are tested for contamination
before dredging and contaminated dredged material is disposed of in containment areas designed
to protect public health, fish, and wildlife. Dredging also elevates turbidity temporarily. By
starving wetland plants of light, turbidity can contribute significantly to plant losses (Eldridge et
al. 2004). But the temporary effect of turbidity caused by dredging probably pales compared to
the widespread and more frequent effects of storms, watersheds with high erosion rates, and the
chronic effects of eutrophication, which causes increased growth of light inhibiting algae that
compete with submerged freshwater plants (Jones et al. 1983, Irfanullah and Moss 2004) and
sea grasses (Eldridge et al. 2004, Kopecky and Dunton 2006). The turbidity effect of dredging in
estuaries probably is a small fraction of the massive effect of fishing on the biomass of oysters
and other shellfish, which reduce turbidity by filtering out algae and other organic matter
(Newell 1988, Newell and Koch 2004, Cerco and Noel 2005).
Vessel-caused turbulence also disturbs bottom communities and contributes to turbidity (Allen
and Hardy 1980, Weck and Crossan 1981), which can become chronic where traffic is dense.
Vessel, port, train and truck operations often are sources of oil, metals, and other water pollutants
(Bailey 2004, EPA 2007, PIANC Envicom Task Group 2 2011). Vessels contribute to harbor
noise and cause subsurface noise with unknown consequences in marine ecosystems (PIANC
2011). Vessel and port impacts usually are localized in the immediate harbor area. Highways
and associated parking areas are important sources of metals (tire wear and lubricant leaks), oils
and various synthetic chemicals that wash into drainages entering public waters (EPA 2007).
Vessel wakes contribute to shoreline erosion and to wetland and bottom community changes
(Koch 2002, Bishop 2005a and Bishop 2005b). Erosion destroys wetland directly and indirectly
through increased turbidity. Displaced sediment may contribute to habitat degradation for some
species. In waterways many species of freshwater mussels do not tolerate increased quantities of
fine sediment (Neves et al. 1997).
Operations of the international freight transportation system are well-documented vectors for
nonnative invasive species (Ruiz and Carlton 2003), some of which have or could cause costly
damage. The two main avenues for invasive species entry via ports are vessel ballast water and
freight. Vessel ballast water has been a major vector for non-native invasive species with
adverse environmental effects (NRC 1996, Corn et al. 2002). San Francisco Bay and the Great
Lakes (Wouters, 2010) are among the best documented examples of national waters w have been
invaded by nonnative aquatic species transported in ballast water, including such costly species
as the zebra mussel (Figure 19). Freight transferred from vessels to trucks and trains is a major
source for terrestrial species invasion of inland areas (Greenberg et al. 1997). Numerous insect
and plant species have entered U. S. ports with agricultural/forest goods. Some of the worst
agricultural and forest pest species probably invaded the United States through this means
(Pimentel et al. 2001). Increasing freight movement and future freight traffic changes among
world ports could increase prospects for successful invasions (Kaluza 2010). But new
regulations requiring old ballast-water release well off shore and biocide treatment of the new
ballast water are expected to stem this source of invasive species.

Environmental Impact Mitigation Needs of Future Port and Waterway Modernization Activities in the United States
U.S. Army Corps of Engineers 28 Institute for Water Resources
Accidents
Accidents occur throughout the transportation
system and contribute to human safety and health
concerns as well as to wildlife threats (Figure 20).
Accidents include ship, train, truck and car
collisions, and pipeline breaks and leaks.
Accidents often receive attention disproportionate
to their contribution to all transportation system
impacts, but can be locally to regionally costly as
signified by large oil spills, which are mostly
associated with vessel collisions and pipeline
breaks (Etkins 2001). Accidents in and around
ports are a function of increasing traffic rates and
counteracting facilities and operations
improvements (Etkin 2001). Collisions of vessels
with endangered marine mammals (whales),
reptiles (sea turtles), and fish (sturgeon) is a
significant concern in some port areas (Vanderlann and Taggart 2006, Laist and Shaw 2006,
Brown and Murphy 2010). Vessel strikes are the greatest known human-caused source of
mortality for the highly endangered North Atlantic
Right Whale (Silber and Bettridge 2012). Rules
designed to reduce vessel speeds have been in place
since 2008, but not enough time has passed to
measure the effect (Silber and Bettridge 2012).
Dredging has killed individuals of numerous
species, some of which are imperiled (USACE
2008). Vehicular traffic is also recognized as a
significant source of mortality for some endangered
species (Fahrig et al. 1995).
Impact Distribution and Environmental Justice
The convergence of rail, highway, vessels, and
freight transfer machinery at major ports
concentrate emissions and noise locally. Large
ports produce air pollutants at least equal to
500,000 cars or a power plant of average size
(Bailey et al. 2004). Vessels, trucks, and shipment
transfer equipment all contribute significantly. Port congestion intensifies the problem. Trains
and employee’s vehicles play a smaller role. Truck traffic, in particular, contributes to congestion
near busy ports, which not only inconveniences local drivers, but also elevates atmospheric
emissions.
The relatively low value of adjacent property, which is more affordable for people in lower
income brackets, is a reflection of the local air quality, noise, unpleasant appearance, and other
environmental impact of large ports. Therefore the environmental impacts from port and
Figure 20. This large Atlantic sturgeon probably
was cut in half by a container vessel propeller
(from Mallin 2011)
.
Figure 19. Some of the invasive species introduced
to the U. S. via ballast water and cargos have had
costly impacts. The zebra mussel (below) is one
example.

Environmental Impact Mitigation Needs of Future Port and Waterway Modernization Activities in the United States
U.S. Army Corps of Engineers 29 Institute for Water Resources
waterway developments, operations, and maintenance often have disproportionate impacts on
low income groups (Figure 21). Minority populations are also disproportionately impacted
(Figure 21). Port expansion near population centers has more impact on human health, safety,
and environmental resource use
benefits than at more remote ports.
A review of port websites reveals
that ports are trying to reduce these
sources of problems in various
ways. New rules are being
established, for example, to reduce
the time inert trucks are allowed to
remain in idle. Ports are seeking
corrective action to reduce
congestion wherever access to
major highways is less than
optimal. The ports of Los Angeles
and Long Beach now use
subterranean trains to move freight
to truck terminals outside the city.
Miami is seeking a similar solution
to its port-traffic issues. Port
improvement plans rely more
electricity to drive local shipment transfer operations and to provide energy for docked vessels.
Net Effect of All Impacts on Native Species and Ecosystems
The net effect of all of the changes in land and waterscapes that have occurred in the United
States has had major impacts on the condition of native ecosystem components, which are in
decline (Master et al. 2000). By the end of the last century, 240 plant and animal species were
possibly to probably extinct, and another 6,460 were vulnerable to extinction. Nearly 1,400 of
them were seriously imperiled. Extinctions have been particularly high in southwestern states
(especially California), southeastern states, and in central Midwestern states bordering the Ohio,
Tennessee, and Mississippi rivers (regions where serious transportation system modernization is
underway or contemplated). Species listed under protections of the Endangered Species Act
(Figure 22) and species otherwise known to be imperiled are concentrated largely along the
Pacific, Atlantic, and Gulf coasts (Stein et al. 2000). Inland states in the eastern Mississippi
River watershed are hosts to a large concentration of imperiled aquatic species (fish and
mussels).
Future Environmental Impact and Mitigation Needs
Given the uncertainty about where, what form and to what extent transportation system
modernization takes place, specific forecasts of adverse impacts are highly uncertain and ill-
advised. The uncertainties associated with other influential environmental and social changes
only heightens that conclusion, including the potential effects of sea level change on post-
panamax depth requirements and their associated beneficial and adverse impacts. Instead of
Figure 21. The disproportionate impact of emissions on low
income and minority groups in New Jersey.

Environmental Impact Mitigation Needs of Future Port and Waterway Modernization Activities in the United States
U.S. Army Corps of Engineers 30 Institute for Water Resources
specific forecasts, indicators of
human and resource vulnerabilities
and possible sources of adverse
impacts are used here to compare
regions and ports within regions.
Regional Differences in
Vulnerability to
Environmental Impact
Indicators of impact source and
vulnerability to impact sources are
regionally summarized in Table 3
(see the methods section and table
footnotes for indicator description).
The modernization impact metrics
indicate general sources of impact
while the vulnerability metrics
indicate the relative significance of the populations and resources that may be impacted. The
vulnerability metrics indicate vulnerabilities of human populations, cultural and natural resources
of heritage importance, and beneficial use of natural resources (commercial fishing, sportfishing,
and public beach area). The metrics also indicate potential need to avoid or compensate for
health, safety, environmental equity, heritage, and economic losses. Table 3 provides more
information.
Other metrics were used to indicate the potential for significant environmental impacts of
transportation system modernization on vulnerable people and resources. Growth of operations
impacts is indicated by the regional population growth, which is a predictor of future freight
movement through ports. The difference between the percentage of regional population growth
and estimated percent of unused capacity was used as an indicator of port and intermodal
expansion needs. The difference between the existing depth and length of harbor main channels
and the 50-foot depth desired for post-panamax vessels was used as a general indicator of post-
panamax expansion needs. Table 3 provides more information. In general, regional variations in
vulnerability to impact were small. Total vulnerability scores were slightly lower than average
in the Northeast largely because of low heritage impacts associated with endangered species and
preserves. The Pacific Region vulnerability was slightly higher than average because of greater
potential health and economic impacts. The Southeast stood out for its relatively low health and
equity vulnerability and relatively high heritage vulnerability (high wetland area). Despite the
importance of commercial fishing in the Gulf, its vulnerability to modernization was indicated by
our method to be relatively low. This is a result of high shoreline length leaving many
opportunities for access to fishery resources other than through port locations. Because
vulnerability differences among regions are small, the impacts of modernization and impact
mitigation cost, wherever they occur, are likely to be nearly equally high. However, mitigation
cost would vary widely among ports within regions depending on their specific vulnerabilities
and impact extents and intensities.
Figure 22. The distribution of U. S. endangered species is
concentrated near coastal ports (from Stein et al. 2000).
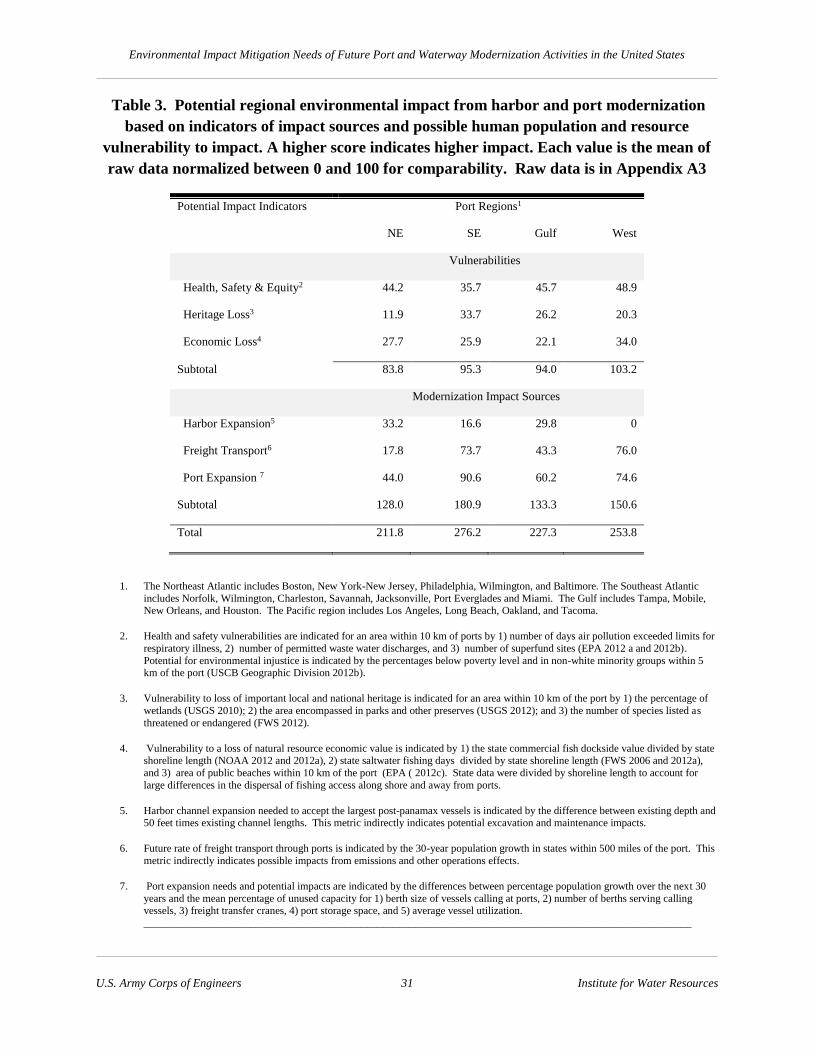
Environmental Impact Mitigation Needs of Future Port and Waterway Modernization Activities in the United States
U.S. Army Corps of Engineers 31 Institute for Water Resources
Table 3. Potential regional environmental impact from harbor and port modernization
based on indicators of impact sources and possible human population and resource
vulnerability to impact. A higher score indicates higher impact. Each value is the mean of
raw data normalized between 0 and 100 for comparability. Raw data is in Appendix A3
Potential Impact Indicators Port Regions1
NE SE Gulf West
Vulnerabilities
Health, Safety & Equity2 44.2 35.7 45.7 48.9
Heritage Loss3 11.9 33.7 26.2 20.3
Economic Loss4 27.7 25.9 22.1 34.0
Subtotal 83.8 95.3 94.0 103.2
Modernization Impact Sources
Harbor Expansion5 33.2 16.6 29.8 0
Freight Transport6 17.8 73.7 43.3 76.0
Port Expansion 7 44.0 90.6 60.2 74.6
Subtotal 128.0 180.9 133.3 150.6
Total 211.8 276.2 227.3 253.8
1. The Northeast Atlantic includes Boston, New York-New Jersey, Philadelphia, Wilmington, and Baltimore. The Southeast Atlantic
includes Norfolk, Wilmington, Charleston, Savannah, Jacksonville, Port Everglades and Miami. The Gulf includes Tampa, Mobile, New Orleans, and Houston. The Pacific region includes Los Angeles, Long Beach, Oakland, and Tacoma.
2. Health and safety vulnerabilities are indicated for an area within 10 km of ports by 1) number of days air pollution exceeded limits for
respiratory illness, 2) number of permitted waste water discharges, and 3) number of superfund sites (EPA 2012 a and 2012b).
Potential for environmental injustice is indicated by the percentages below poverty level and in non-white minority groups within 5 km of the port (USCB Geographic Division 2012b).
3. Vulnerability to loss of important local and national heritage is indicated for an area within 10 km of the port by 1) the percentage of
wetlands (USGS 2010); 2) the area encompassed in parks and other preserves (USGS 2012); and 3) the number of species listed as
threatened or endangered (FWS 2012).
4. Vulnerability to a loss of natural resource economic value is indicated by 1) the state commercial fish dockside value divided by state shoreline length (NOAA 2012 and 2012a), 2) state saltwater fishing days divided by state shoreline length (FWS 2006 and 2012a),
and 3) area of public beaches within 10 km of the port (EPA ( 2012c). State data were divided by shoreline length to account for
large differences in the dispersal of fishing access along shore and away from ports.
5. Harbor channel expansion needed to accept the largest post-panamax vessels is indicated by the difference between existing depth and 50 feet times existing channel lengths. This metric indirectly indicates potential excavation and maintenance impacts.
6. Future rate of freight transport through ports is indicated by the 30-year population growth in states within 500 miles of the port. This
metric indirectly indicates possible impacts from emissions and other operations effects.
7. Port expansion needs and potential impacts are indicated by the differences between percentage population growth over the next 30
years and the mean percentage of unused capacity for 1) berth size of vessels calling at ports, 2) number of berths serving calling vessels, 3) freight transfer cranes, 4) port storage space, and 5) average vessel utilization.
_______________________________________________________________________________________________________

Environmental Impact Mitigation Needs of Future Port and Waterway Modernization Activities in the United States
U.S. Army Corps of Engineers 32 Institute for Water Resources
Potential infrastructural modernization and freight transport operations impacts are especially
high in the Southeast and Pacific regions where regional population growth is equally high and
port capacities are most used. Unused capacity is greater in the Pacific region, but little harbor
expansion is needed because most major ports are already post-panamax ready. The harbors at
two major ports in the Northeast are, or soon will be, ready for post-panamax vessel use, but the
amount of dredging required for post-panamax development at other ports makes potential
harbor expansion impacts the highest among regions. However, actual population growth and
percent growth is quite low in the Northeast compared to the other regions, making future
modernization needs among the lowest regionally.
The Gulf ports serve primarily Midwestern populations where regional population growth rate is
not as high as in the Southeast or Pacific regions. That, and high unused capacity, indicate
relatively little need for port or harbor expansion. If post-panamax readiness were pursued, it
would include harbor expansion impacts nearly as great as in the Northeast.
The totaled vulnerability and potential modernization impact scores are highest for the Southeast
and Pacific regions. Metric scores are not likely to be directly proportional to mitigation costs,
however. For example, the physical need for harbor expansion in the Southeast Region is less
than other regions (many of the ports are close to post-panamax depths), but the vulnerability of
natural heritage to harbor expansion is comparatively high and mitigation costs could be quite
high.
There are potential environmental benefits from increasing capacity for post-panamax vessels if,
as expected, modernization leads to reduced impacts on air and water quality impact per ton of
freight shipped. Assuming that the amount of freight transported will increase regardless of
average vessel size calling at the ports, the increased vessel size expected from harbor expansion
could reduce local emission impacts on human health and inequities among minority and low
income groups near the ports. Other effects are harder to judge. While the frequency of ship
passages may decrease, possibly lowering the number of harmful collisions with scarce species
and other costly accidents, the increased size of the vessels may increase the likelihood of
collisions when a vessel passes through the area. Accidents that damage larger vessels and their
cargo may be more costly because proportionally more freight may be lost and more harmful
pollutants may be released.
Other scenarios are also possible, as indicated in the review of transportation status near the
beginning of this report. The analysis of Table 3 data assumed that regional population growth is
the main driver of freight movement amounts and destinations. That assumption could be
significantly altered by the effects of Panama Canal expansion, which may reduce freight
transport costs below the costs of transporting freight from Pacific Rim nations to the Pacific
Coast. Freight movement could significantly shift eastward in response, elevating the amounts
of freight moved above that estimated by regional population growth alone and depressing
amounts moved through Pacific ports. While total atmospheric emissions could be reduced
because of the higher fuel efficiencies of larger vessels, local pollutant concentrations may
increase more at southeastern ports than Pacific ports. The degree to which increases occur
depends on how effectively emissions are reduced through port modernization actions.

Environmental Impact Mitigation Needs of Future Port and Waterway Modernization Activities in the United States
U.S. Army Corps of Engineers 33 Institute for Water Resources
Another possibility could alter the picture differently. Existing post-panamax ports on the East
Coast and international ports in the Caribbean have potential for becoming deepwater transport
hubs for vessels of all sizes. That may favor smaller vessel delivery of transferred freight to East
Coast ports that are not ready for post-panamax vessels (EDRG 2012). If that happened, freight
transport amounts and pollutant emissions may increase above regional population predictions
while harbor expansion and its environmental impacts are largely avoided. It may also mean less
improvement of total transportation-system emissions, which increases per ton of freight
transported as vessel size decreases (Notteboom and Vernimmen 2009).
Improved performance of rail and highway freight transport from West Coast ports could also
moderate a Panama Canal effect on port advantages. Rail transport in particular has shown
significant improvement in recent decades. Pacific ports are better prepared than eastern and
Gulf ports to accept post-Panamax vessel sizes and container traffic. They also have transport-
time advantages and are projected to serve rapidly growing populations west of the Appalachians
while becoming more competitive by cutting their costs (EDRG 2012). Such advantages could
maintain the proportion of freight moving into eastern and western ports despite Panama Canal
enlargement. More container stacking on railroad cars, increased truck-trailer lengths, improved
scheduling and other cost cutting strategies could significantly reduce the growth in atmospheric
emissions per ton of freight transported, but probably not enough to make up for the much
greater efficiency of large vessels entering the eastern U. S. through East Coast ports. The
tradeoffs are complicated by harbor enlargement impacts at southeastern ports and local air
quality degradation and port congestion at some West Coast ports that are already stressed.
The potential effects of climate change are also important variables. Where ports are already
within 5 feet of the 50 feet used to characterize post-panamax readiness, rising sea level can
contribute significantly to the port capacity for post-panamax vessels, especially when
considered with tidal effects on harbor depths. When combined with the effects of deepening
channels and rising sea levels, hurricanes may drive salt water farther into freshwater
environments, destroying more wetland (Dahl 2012). Climate change also has implications for
port vulnerability to flooding and storm damage. A less certain consideration is the possibility of
more powerful hurricanes energized by warmer oceans. Regardless of those possibilities, ports
that are more exposed to adverse hurricane effects, which can interfere with freight movement
for months, have less of a long-term advantage than more protected ports.
Variation in Port Vulnerability to Environmental Impact
Human and Resource Vulnerability
Regional summaries do not reveal the substantial variation among ports within regions. Table 4
reveals some of that variability among 20 large container ports in four coastal regions. It shows
port variation for vulnerability and modernization impact indicators, as well as total potential
impact from modernization activities. All indicators in Table 4 were normalized to a maximum
of 100, which was assigned to the port with the greatest indicator value. The raw-score data are
provided in Appendix A3. Appendix A4 summarizes environmental assessment and impact
statement information to the extent it is available for the ports.
Health, Safety and Environmental Justice

Environmental Impact Mitigation Needs of Future Port and Waterway Modernization Activities in the United States
U.S. Army Corps of Engineers 34 Institute for Water Resources
Table 4. Indicators of relative vulnerability to environmental impacts at representative
container ports in four coastal regions of the United States. Raw indicator values (reported
in Appendix A3) were normalized between 0 and 100 for comparability.
Ports
Health, Safety & Environmental Justice Heritage Loss Economic Loss Total
Air Water
Super-
fund
Low
Income
Minority
Status
Percent
Wetland Parks
Rare
Species
Comm.
Fishing
Sport-
Fishing
Beach Total
Boston 4 27 7 67 50 11 1 14 100 47 85 413
NY/NJ 15 6 79 79 75 9 14 9 32 61 0 382
Philadelphia 27 12 100 75 58 15 2 6 1 0 0 296
Wilmington, DE 21 0 30 60 95 46 19 5 7 43 0 326
Baltimore 24 42 33 82 35 13 3 9 10 23 0 274
NE Atlantic 18.2 17.4 49.8 72.6 62.6 18.8 7.8 8.6 30.0 34.8 17.0 345.4
Norfolk 6 0 1 54 53 13 0 3 18 21 47 216
Wilmington, NC 18 0 11 61 44 52 1 18 8 13 2 228
Charleston 0 0 27 84 73 57 1 26 2 12 0 282
Savannah 9 5 19 66 73 100 100 21 2 17 0 412
Jacksonville 1 53 25 48 91 54 74 12 7 64 0 429
Port Everglades 1 65 19 63 56 24 0 26 7 64 89 414
Miami 3 36 4 100 81 61 0 62 7 64 100 518
SE Atlantic 5.4 22.7 15.1 68.0 67.4 51.6 25.1 24.0 7.3 36.4 34.0 357.0
Tampa 15 100 45 52 43 33 0 18 7 64 4 381
Mobile 5 29 16 42 94 57 23 29 14 29 0 338
New Orleans 78 89 12 85 60 46 33 17 10 1 0 431
Houston 35 11 5 53 46 40 4 17 19 100 21 351
Gulf 33.3 57.3 19.5 58.0 60.8 44.0 15.0 19.5 12.5 48.5 5.3 375.2
Long Beach 100 15 37 91 100 0 1 82 16 52 54 548
Los Angeles 100 14 33 75 91 0 1 100 16 52 20 502
Oakland 15 5 25 72 94 0 13 36 16 52 0 328
Tacoma 1 1 15 54 50 2 1 8 27 11 91 261
Pacific 54.0 6.3 27.5 73.0 83.8 0.5 4.0 56.5 18.8 41.8 41.3 409.7
The number of days that air quality exceeded standards set for people with respiratory difficulty
was highly variable. The worst conditions were in the Pacific region, but only because the
violation rate was very high at the two adjacent ports in Los Angeles. Air quality was much
better farther north at the Oakland and Tacoma ports.

Environmental Impact Mitigation Needs of Future Port and Waterway Modernization Activities in the United States
U.S. Army Corps of Engineers 35 Institute for Water Resources
This finding was paired with relatively high fractions of low income and minorities within 5 km
of the Los Angeles ports, which together contributed largely to high total scores at those ports.
Southeastern ports had the best air quality followed closely by northeastern ports.
Water quality (indicated by the number of permitted discharges) also was highly variable and, in
contrast to air quality, was particularly low at Pacific ports. Vulnerability to further degradation
in water quality was highest at two of the Gulf ports and moderately high at two southeastern
ports. Four of the five highest values were at ports in Florida. Elsewhere in the Southeast, the
ports had exceptionally low scores. Northeast port scores were generally good, second to the
Pacific in total score.
In contrast with water discharge permits, the number of superfund sites was greatest in the
Northeast, reflecting its manufacturing history. But variation was very high there ranging from
few superfund sites in the Boston port area to the most superfund sites in the Philadelphia port
area. The number of superfund sites elsewhere was variable, but quite consistently lower than
several of the northeastern ports. The major exceptions were at Jacksonville and Long Beach.
Indicators of potential environmental inequity were less variable than other indicators. A higher
fraction of low income and minority groups consistently live near ports. Calculated poverty rates
within 5 km of ports averaged about 38% higher than home states and 104% higher than the
national average. The vulnerability of low income and minority publics to adverse impact from
ports is in general quite high and a reason behind a push to clean up port air quality (Bailey et al.
2004).
Heritage Loss
The vulnerability to further loss of important local to national heritage was indicated by the
percentages of wetland and officially preserved areas, as well as the numbers of threatened and
endangered species (rare species) found within 10 km of the ports. In keeping with the high
percentage of coastal wetland in the Southeast and Gulf regions, vulnerability to wetland
degradation was relatively high on average at those ports, but especially so at Savannah. In
contrast, wetland vulnerability was very low at Pacific ports where conditions do not support
extensive coastal wetlands.
Parks and other preserves were scarce within 10 km of ports, but were most vulnerable in the
Southeast Region because of high vulnerabilities at ports in Savannah and Jacksonville.
Variation was very high, however. Most southeastern ports had little or no nearby preserve area.
The Gulf Region was second highest in preserve vulnerability to port modernization and the
Northeast and Pacific ports were quite consistently low. Low preserve number may reflect to
some extent large city size and extensive manufacturing, which nearly eliminated natural
environments many decades ago.
Rare species—indicated by the number of threatened and endangered species in the counties of
port location—were particularly high in counties with California ports and particularly low in
northeastern counties with ports. After southern California, ports in the Southeast Region tended

Environmental Impact Mitigation Needs of Future Port and Waterway Modernization Activities in the United States
U.S. Army Corps of Engineers 36 Institute for Water Resources
to score moderately high. The tendency for Pacific and southeast ports to score highest is
consistent with the distributions of threatened and endangered species described in the existing
environmental footprint (Figure 21).
Economic Loss
Among indicators of economic losses from beneficial use of natural resources, the commercial
fishing value was particularly high for Massachusetts and the port of Boston. A relatively short
shoreline length concentrated the fishery closer to the port of Boston than many other states with
highly valued fisheries and much longer coastlines. Variation among ports in the Northeast was
very high, however. Values among most ports tended to be much lower than for Boston. Even
New Orleans, in a state that depends greatly on its commercial fishery, was low because of the
high shoreline length. On the Pacific Coast, Tacoma had a relatively high score.
Scores for sportfishing varied significantly from 0 at Philadelphia, which has little saltwater
fishing close by, to the highest at Houston. Moderately high values occurred in Florida, where
nonresidential as well as residential sportfishing is popular. The shoreline is long, however,
increasing the probability of less conflict between ports and sportfishing than in Texas. The
container port at Houston is located in Galveston Bay, which draws resident saltwater fisherman
from an area of high population density. Ports at Boston and NY-NJ had moderately high scores
largely because of the relatively low shoreline length of those states.
Public beach area within 10 km of ports scored high in south Florida ports and near Tecoma and
Boston. Overall, southeastern and Pacific ports scored highest. The variation was high among
ports within all regions, however.
Some General Observations
Port total scores varied between 216 at Norfolk and 548 at Long Beach, which is not as wide a
spread as the variation in individual scores among ports might indicate. In general, ports had
quite different combinations of vulnerabilities and none were consistently low or high. Ports in
close proximity to one another had much more in common than ports farther apart. Among the
three ports ranked above 500, two were next to each other at Los Angeles and Long Beach. Two
other Pacific ports—Tacoma and Oakland—ranked relatively low by comparison. In the
Southeast Atlantic region, the three northern ports were ranked about half as vulnerable as
Miami and significantly lower than all ports south of Charleston. Each region had at least two
ports that ranked highest among all of the ports for specific indicators and at least three ports that
ranked among the lowest. Thus, the vulnerability of regions could be disproportionately
influenced by high scores for certain ports, while other ports in the region ranked low. If one
generality applies to port vulnerabilities, it would be about high variation among ports within
regions. Concluding from regional studies that all ports are likely to reflect regional
vulnerabilities would be wrong and misleading.
From the environmental standpoint alone, the differences at the regional level dampen
potentially important differences at the port level. Regionally, the potential costs of mitigation
for the same port modernization actions appear quite similar, but are in fact quite different
among ports. Mitigation expenses may vary significantly among ports for the same actions
taken.

Environmental Impact Mitigation Needs of Future Port and Waterway Modernization Activities in the United States
U.S. Army Corps of Engineers 37 Institute for Water Resources
These indicators of port vulnerability to modernization impacts and to environmental impact
mitigation costs must be considered preliminary. The indicators imperfectly represent port
vulnerabilities within categories and are an incomplete assessment of all possible vulnerabilities.
Much more detailed study at each port would need to be completed to make more informed
comparisons. In addition, the indicators of vulnerability to adverse impact do not indicate
variations in the intensity and extent of modernization required at different ports to achieve post-
panamax readiness. These are addressed in the next subsection.
Potential for Future Adverse Impacts at Ports
Table 5 summarizes data for indicators of potential adverse impacts in the future based on
perceived modernization needs. Three indicators of modernization need were developed. All
indicators were normalized to a maximum of 100, which was assigned to the port with the
greatest indicator value.
The first metric indicates the needed modernization to accommodate the largest post-panamax
vessels based on a 50-foot depth criterion and the length of the main channel into the port. The
public may benefit from port expansion because freight shipment costs and atmospheric emission
per ton of freight moved decrease with increased size of the transport vessel (Economic
Development Research, Inc. 2012, Notteboom and Vernimmen. 2009). But, depending on
location, deepening and widening, port expansion could also result in significant environmental
impact that requires costly mitigation.
The indicated expansion needs based on this metric was highly variable. Pacific Coast ports are
well prepared for post-panamax vessels and already receive them from Pacific Rim origins. The
Pacific ports in this study consistently scored 0 because they are post-panamax ready. Ports in
the Northeast exhibited the greatest variation because two are nearly ready and scored 0.
Philadelphia and Wilmington, DE scored very high because of the length of the main channel
that needs deepening. The most northern port in the Southeast Region scored 0, but all other
ports required some excavation with the least in south Florida ports. Gulf ports also required
excavation and, in the case of the port of New Orleans, the very long main channel required an
exceptional amount.
Another metric indicates how well existing unused capacity could meet freight transport needs
based on expected percent population growth over the next 30 years. Ports with large capacity
surpluses compared to increases in freight movement through the port may need to invest less in
modernization designed only to handle increased freight movement and storage needs. This
metric varied less among ports within the same region than most metrics. The big need is in the
Southeast which already makes relatively high use of port capacity and anticipates high regional
population growth. The port in greatest need, however, is Oakland. The Northeast ports are
quite consistently better provisioned for future population growth, which is expected to be the
lowest among the regions.
The indicator chosen to forecast changes in the total amount of freight movement through ports
is the actual expected growth in population. Total regional income growth probably is a better
indicator, but is less reliable because of uncertainties about per capita income growth. Regional
populations served by southeastern ports and Pacific ports are expected to grow similarly and
most rapidly. The Northeast is likely to experience the least growth, especially in the service
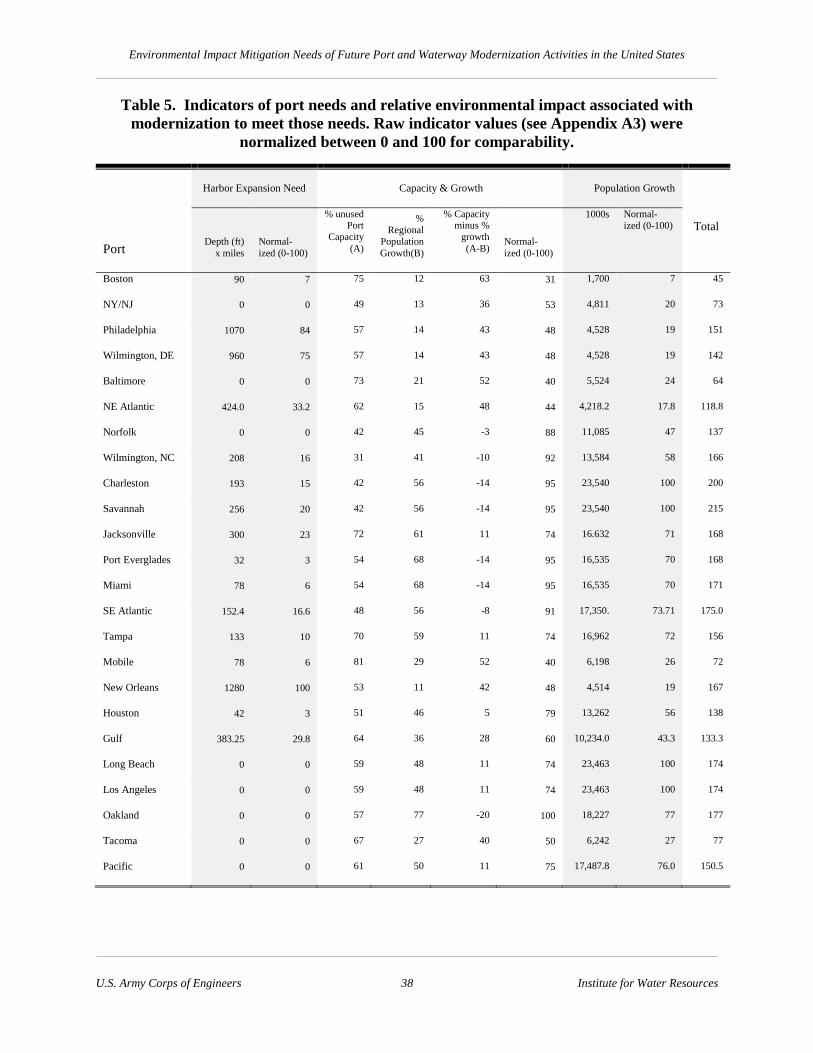
Environmental Impact Mitigation Needs of Future Port and Waterway Modernization Activities in the United States
U.S. Army Corps of Engineers 38 Institute for Water Resources
Table 5. Indicators of port needs and relative environmental impact associated with
modernization to meet those needs. Raw indicator values (see Appendix A3) were
normalized between 0 and 100 for comparability.
Port
Harbor Expansion Need Capacity & Growth
Population Growth
Total
Depth (ft)
x miles
Normal-
ized (0-100)
% unused Port
Capacity
(A)
%
Regional
Population
Growth(B)
% Capacity minus %
growth
(A-B) Normal-
ized (0-100)
1000s Normal-
ized (0-100)
Boston 90 7 75 12 63 31 1,700 7 45
NY/NJ 0 0 49 13 36 53 4,811 20 73
Philadelphia 1070 84 57 14 43 48 4,528 19 151
Wilmington, DE 960 75 57 14 43 48 4,528 19 142
Baltimore 0 0 73 21 52 40 5,524 24 64
NE Atlantic 424.0 33.2 62 15 48 44 4,218.2 17.8 118.8
Norfolk 0 0 42 45 -3 88 11,085 47 137
Wilmington, NC 208 16 31 41 -10 92 13,584 58 166
Charleston 193 15 42 56 -14 95 23,540 100 200
Savannah 256 20 42 56 -14 95 23,540 100 215
Jacksonville 300 23 72 61 11 74 16.632 71 168
Port Everglades 32 3 54 68 -14 95 16,535 70 168
Miami 78 6 54 68 -14 95 16,535 70 171
SE Atlantic 152.4 16.6 48 56 -8 91 17,350. 73.71 175.0
Tampa 133 10 70 59 11 74 16,962 72 156
Mobile 78 6 81 29 52 40 6,198 26 72
New Orleans 1280 100 53 11 42 48 4,514 19 167
Houston 42 3 51 46 5 79 13,262 56 138
Gulf 383.25 29.8 64 36 28 60 10,234.0 43.3 133.3
Long Beach 0 0 59 48 11 74 23,463 100 174
Los Angeles 0 0 59 48 11 74 23,463 100 174
Oakland 0 0 57 77 -20 100 18,227 77 177
Tacoma 0 0 67 27 40 50 6,242 27 77
Pacific 0 0 61 50 11 75 17,487.8 76.0 150.5

Environmental Impact Mitigation Needs of Future Port and Waterway Modernization Activities in the United States
U.S. Army Corps of Engineers 39 Institute for Water Resources
area of the northern-most ports. Variation among ports within a region is relatively small in part
because the regions served by the ports overlap. Appendix A2 summarizes the state populations
included in port service regions.
The sum of indicator scores (Table 6) suggests the largest potential for environmental impact and
mitigation cost at southeastern ports. The Northeast Region has the least potential. The
variation for total scores (shown in Table 5) ranged from 45 at Boston to 215 at Savannah
(followed closely by Charleston with 200). Ports in close proximity tended to have similar
scores because of similar characteristics. The largest score differences seemed to be most related
to harbor enlargement needs.
Some significant impact variables were difficult to capture in simple metrics. The environmental
impacts of the mix of freight transport methods were difficult to measure, for example, because
the different modes have different environmental impacts per ton shipped. Since truck impacts
are much greater than rail and barge transport (which now have similar impacts), transportation
investment decisions that contribute to minimizing truck use are environmentally preferable. As
trains become more cost efficient, they may replace trucks for shorter hauls and reduce
atmospheric emissions. Some ports are well prepared to transfer freight directly to trains while
others are less prepared. Environmental improvements for all modes of transport have increased
over the years as regulations became more demanding and new innovations were applied.
Continuation of this trend should moderate the effect of increasing freight transport traffic.
Potential Environmental Impacts at Waterway Locks
The potential environmental impacts on the Mississippi and Illinois Rivers are most associated
with increased atmospheric emissions along the waterways and building new locks large enough
to pass doubled-up barge rafts. New locks would be built largely in areas located near local
population centers in rural areas where health and safety concerns are relevant but much less
likely to affect as many people as around large container ports.
Atmospheric emissions along the entire waterway route would increase as barge and intermodal
transport increased, but lock expansion would moderate the increased impact from emissions by
reducing barge congestion in lock vicinities. The trend could be further counterbalanced by
replacement of old tugs with more fuel and emission efficient tugs and with new barges that
carry more weight.
New locks may have impacts on wetlands and threatened and endangered species where they
must be placed in riparian areas. Based on data from FWS (2012), 62% of the 100 meter riparian
strip next to locks and dams on the upper Mississippi is wetland, which, if damaged, would most
likely require compensatory mitigation. On the Illinois River, 42% is wetland. No critical
habitat of threatened or endangered species is expected to be impacted, but one or more
threatened prairie riparian species may live in or near counties where locks are located (e.g.,
Asclepias meadii, Platanthera leucophaea). The upper Mississippi and Illinois Rivers are home
to a number of freshwater mussels and other threatened and endangered aquatic species, but, in
general, adverse impacts on them are likely to be small. Locks constructed off shore in existing
navigation pools would have little impact on endangered species, wetlands, and preserves
because the impoundments have so altered original habitats. Agricultural and residential resource
uses are the most likely to be impacted.

Environmental Impact Mitigation Needs of Future Port and Waterway Modernization Activities in the United States
U.S. Army Corps of Engineers 40 Institute for Water Resources
Table 6. Regional indication of potential environmental impact for the four most
important container-port regions. The raw data for Individual metrics (Appendix A3)
were normalized to values between 0 and 100 to allow regional comparison and summation.
Indicators
Port Regions
Northeast
Atlantic
Southeast
Atlantic
Gulf Pacific
Vulnerabilities
Health, Safety & Equity 44.2 35.7 45.7 48.9
Heritage Loss 11.9 33.7 26.2 20.3
Economic Loss 27.7 25.9 22.1 34.0
Subtotal 83.8 95.3 94.0 103.2
Modernization Sources
Harbor Expansion 33.2 16.6 29.8 0
Freight Transport 17.8 73.7 43.3 76.0
Port Expansion 44.0 90.6 60.2 74.6
Subtotal 128.0 180.9 133.3 150.6
Total 211.8 276.2 227.3 253.8
The extent to which grain and soybean transport by barge increases greatly depends on what
railroads and trucks do to compete. The main alternative to barge transport is rail or truck
transport either to the West Coast or directly to Gulf ports, which would circumvent the need for
a shipment transfer. If rail efficiencies continue to improve, the Pacific Coast ports (including
Canadian ports) may continue to capture much of the grain and soybean traffic. Barge shipment
no longer has an environmental advantage over railroads since they are now about equally fuel
efficient (USDOE 2012 and OEE 2011). For these and other reasons, the anticipated reversal of
past downward trends in barge traffic is uncertain and the net effect on air quality will likely be
similar, as long as trucks do not take a much larger fraction of the grain and soybean transport.
Rapid improvements in rail emissions efficiency while waterborne freight transport has remained
static (USDOE 2012) may have contributed to different conclusions about the effects of the
Panama Canal on atmospheric emissions of grain and soybean transport. Conventional wisdom
argues that atmospheric emissions will be improved over the present transport system because of
the longer grain transport distance by large vessel through the Panama Canal (Energy
Development Research, Inc 2012). However, Baird et al. (2011) concluded that grain and
soybean transport down the Mississippi and through the Panama Canal will result in greater
atmospheric emissions than overland transport to Pacific Ports.

Environmental Impact Mitigation Needs of Future Port and Waterway Modernization Activities in the United States
U.S. Army Corps of Engineers 41 Institute for Water Resources
Concluding Remarks
Resor and Gabler (2011) concluded that there is little agreement in recent reports about the
future of trade routes and how they will respond to Panama Canal enlargement and other
changes. Based on past trends, they also believed that changes in ship size and trade routes will
be gradual. There is time for more careful assessment and adaptive decision making as changes
become more certain. Environmental impact mitigation needs are also uncertain. While the costs
of environmental impact mitigation are likely to be substantial most anywhere within and across
regions affected by transportation system modernization, the specific impacts are impossible to
estimate without detailed information developed during studies of project environmental impact.
Taking those uncertainties into consideration, the information developed here suggests that ports
in the Southeast Region are the most likely to require environmental mitigation associated with
modernization actions. But, unused port and waterway capacity at most ports generally allows
for considerable increase in freight movement without stressing port limits for some time into the
future. Relatively few vessels of post-panamax size are calling at ports that are now post-
panamax ready. While the proportion is expected to grow, it is likely to be gradual.
The uncertainties associated with the results of a national study with limited resources point
strategically to the use of a more informed adaptive approach to future investment in port and
waterway modernization. Careful assessment of the environmental impacts of alternative
approaches to transportation system modernization is needed as opposed to more disconnected
studies of transportation system segments. Trends in transportation system change should be
monitored and analyzed regularly to more adaptively manage the uncertainty and risks of
unnecessarily impacting the environment through inefficient modernization decisions.

Environmental Impact Mitigation Needs of Future Port and Waterway Modernization Activities in the United States
U.S. Army Corps of Engineers 42 Institute for Water Resources
References
Allen, K.O., and Hardy. J. W. 1980. Impacts of navigational dredging on fish and wildlife: A literature
review. FWS/OBS-80/07. Washington, DC: U.S. Department of the Interior, Fish and Wildlife Service.
Bailey, D., T. Plenys, G. M. Solomon, T. R. Campbell, G. R. Feuer, J. Masters, and B. Tonkonogy. 2004.
Harboring Pollution: The Dirty Truth about U.S. Ports. Washington DC: Natural Resources Defense
Council,
Baird, T., J. Bittner, R. Gollnik, and S. Gardner 2011. Understanding the Consequences of the Panama
Canal Expansion on Midwest Grain and Agricultural Exports. National Center for Freight &
Infrastructure Research & Education. Madison, WI: University of Wisconsin.
Bishop, M. J. 2005a. Displacement of epifauna from seagrass blades by boat wake. Journal of
Experimental Marine Biology and Ecology 354:111-118
Bishop, M. J. 2005b. Joint effects of boat wake and dredge spoil disposal on sediments and assemblages
of macro-invertebrates. Estuaries 28: 510–518
Bodie, J. R. and R. D. Semlitsch. 2000. Spatial and temporal use of floodplain habitats by lentic and lotic
species of aquatic turtles. Oecologia 122:138–146
Brown, J.J. and G.W. Murphy. 2010. Atlantic sturgeon vessel-strike mortalities in the Delaware estuary.
Fisheries 35:72-83
BTS (Bureau of Transportation Statistics). 2012. Inland waterway commercial vessel and tow delay.
Washington, DC: Research and Innovative Technology Division, Department of Transportation.
Buck, E. H. 2007. Ballast water management to combat invasive species. CRS Report RL32344.
Washington, DC: Congressional Research Service.
Burton, G. A. and P. F. Landrum. 2005. Toxicity of sediments. In Encyclopedia of sediments and
sedimentary rocks, ed. G. V. Middleton, M. J. Church, M. Carigilo, L. A. Hardie, and F. J. Longstaff,
478-571. New York, NY: Springer-Verlag
Cerco, C. F and M. R. Noel. 2005. Assessing a ten-fold increase in the Chesapeake Bay native oyster
population. A Report to the EPA Chesapeake Bay Program. Vicksburg MS: U. S Army Engineer
Research and Development Center
Chaplin, S. J., R. A. Gerrard, H. M. Watson, L. L. Master, and S. R. Flack. 2000. The geography of
imperilment. In Precious heritage: The status of biodiversity in the United States, ed. B. A. Stein, L. S.
Kutner, and J. S. Adams, 159-199. Washington, DC: The Nature Conservancy and Association for
Biodiversity Information
Cole, R. A. 2009. The sustainability of freshwater biodiversity and water resources development policy
of the Army Corps of Engineers. IWR Report 09-12-9. Alexandria, VA: Institute for Water Resources, U.
S. Army Corps of Engineers
Copp, G. H. 1989. The habitat diversity and fish reproductive function of floodplain ecosystems.
Environmental Biology of Fish 26: 1-26
Corbett, J. J. and P. S. Fishbeck (2000). Emissions from waterborne commerce vessels

Environmental Impact Mitigation Needs of Future Port and Waterway Modernization Activities in the United States
U.S. Army Corps of Engineers 43 Institute for Water Resources
in United States continental and inland waterways. Environmental Science and Technology 34: 3254-
3260
Cordell, H. K., J. C. Bergstrom, L. A. Hartman, and D. B. K. English. 1990. An analysis of the outdoor
recreation and wilderness situation in the United States:1989-2040. General Technical Report RM-189.
Fort Collins, CO: Rocky Mountain Forest and Range Experiment Station, USDA Forest Service
Corn, M. L., E H. Buck, J. Rawson, A. Segarra, and E.Fischer. 2002. Invasive non-native species:
Background and issues for Congress. CRS Report RL30123. Washington, DC: Congressional Research
Service.
Crowe, S.E., P. T. Gayes, R. F. Viso, D. C. Bergquist and P. C. Jutte. 2010. Impact of the Charleston
ocean dredged material disposal site on nearby hard bottom reef habitats. Marine Pollution Bulletin 60:
679-691
Dahl, T. E. 2012. Status and trends of wetlands in the conterminous United States 2004 to 2009.
Washington, DC: U. S. Fish and Wildlife Service
Dahl, T. E., and G. J. Alford. 1996. History of Wetlands in the conterminous United States. In National
water summary on wetland resources (Water Supply Paper 2425), ed. J.D. Fretwell, J. S. Williams and P.
J. Redman, 19-26. Washington DC: United States Geological Survey
Dean, R. G. and R. A. Dalrymple. 2002. Coastal Processes with Engineering Applications. New York,
NY: Cambridge University Press
Diaz, R.J., R.J. Neubauer, L.C. Schaffner, L. Pihl and S.P. Baden. 1992. Continuous monitoring of
dissolved oxygen in an estuary experiencing periodic hypoxia and the effect of hypoxia on macrobenthos
and fish. Science of the Total Environment (Supplement) 1992: 1055-1068
Diaz, R.J. and R. Rosenberg. 1995. Marine benthic hypoxia: A review of ecological effects and the
behavioural responses of benthic macrofauna. Oceanography and Marine Biology Annual Review 33:
245-303
Diaz, R.J. and R. Rosenberg. 2008. Spreading dead zones and consequences for marine ecosystems.
Science 321:926-928
Dickerson, D., M. Wolters, C. Theriot, C. Slay. 2004. Dredging impacts on sea turtles in the southeastern
USA: A historical review of protection. In Proceedings of the World Dredging Conference XVII, 27
September to October 1, 2004, ID A1-2. Hamburg, Germany: World Dredging Conference
Dickerson, D. 2012. Dredging and threatened/endangered species in the southeastern U. S. Workshop
presentation. Vicksburg, VA: Engineer Research and Development Center, U. S. Army Corps of
Engineers. http://el.erdc.usace.army.mil/workshops/11May-dmams/18_TES-Dredging_Dickerson.pdf
EDRG (Economic Development Research Group, Inc) 2012. Panama Canal expansion study phase 1
report: Developments in trade and national and global Economies. Prepared for The United States
Department of Transportation, Maratime Administration. Washington, DC: Department of Transportation
Erftemeijer, P. L. A. and R. R. R. Lewis. 2006. Environmental impacts of dredging on seagrasses: A
review. Marine Pollution Bulletin 52:1553–1572

Environmental Impact Mitigation Needs of Future Port and Waterway Modernization Activities in the United States
U.S. Army Corps of Engineers 44 Institute for Water Resources
Eldridge, P. M., J. E. Kaldy, and A. B. Burd. 2004. Stress response model for the tropical seagrass
Thalassiatestudinum: The interactions of light, temperature, sedimentation, and geochemistry. Estuaries
27: 923-37
EPA (United States Environmental Protection Agency). 1996. Indicators of the environmental impacts of
transportation: highway, rail, aviation, and maritime transport. EPA 230-R-96-009. Washington, DC:
US Environmental Protection Agency
EPA. 1998. EPA’s contaminated sediment management strategy. EPA-823-R-98-001. Washington, DC:
U. S. Environmental Protection Agency
EPA. 2007. The national water quality inventory: Report to Congress for 2002. EPA 841-F-07-003.
Washington, DC: U. S. Environmental Protection Agency
EPA. 2008. EPA’s report on the environment. EPA/600/R-07/045. Washington, DC: U. S.
Environmental Protection Agency
EPA. 2012. National coastal condition report IV. EPA 842-R-10-003. Washington, DC: U. S.
Environmental Protection Agency
EPA and USACE (United States Army Corps of Engineers). 2007. The role of the federal standard in the
beneficial use of dredged material from U.S. Army Corps of Engineers new and maintenance navigation
projects. EPA842-B-07-002. Washington, DC: U.S. Environmental Protection Agency
Etkin, D.S. 2001. Analysis of oil spill trends in the United States and worldwide. In Proceedings, 2001
International Oil Spill Conference. Washington, DC: American Petroleum Institute
Ewing B., A. Reed, A. Galli, J. Kitzes, and M. Wackernagel. 2010. Calculation methodology for the
national footprint accounts, 2010 edition. Oakland CA: Global Footprint Network
Fahrig, L., J. Pedlar, H., S. E. Pope, P. D. Taylor, and J. F. Wagner 1995. Effect of road traffic on
amphibian density. Biological Conservation 73:177-182
Finkbeiner, E., B. Wallace, J. Moore, R. Lewison, L.B. Crowder & A.J. Read. 2011. Cumulative
estimates of sea turtle bycatch and mortality in U.S.A. fisheries between 1990-2007. Biological
Conservation 144:2719-2727
Forman, R. T. T., and L. E. Alexander 1998. Roads and their major ecological effects. Annual Review of
Ecology and Systematics 29: 207-231
Francingues Jr., N. R., M. R. Palermo, C. R. Lee, and R. K. Peddicord. 1985. Management strategy for
disposal of dredged material: Contaminant testing and controls. Miscellaneous Paper D-85-1.
Vicksburg, MS: Engineer Research and Development Center, U. S. Army Corps of Engineers
Frumkin, H. (Editor). 2010. Environmental Health: From Global to Local. San Francisco, CA: John
Wiley & Sons, Inc
FWS (U. S. Fish and Wildlife Service). 2006. National survey of fishing, hunting, and wildlife-
associated recreation. FHW/06-NAT. Washington, DC: U. S. Department of Interior
Gjessing, E., E. Lygren, L. Berglind, T. Gulbrandsen, and R. Skanne. 1984. Effect of highway runoff on
lake water quality. Science of the Total Environment 33:247-257

Environmental Impact Mitigation Needs of Future Port and Waterway Modernization Activities in the United States
U.S. Army Corps of Engineers 45 Institute for Water Resources
Gosselink, J. G., J. M. Coleman, and R. E. Stewart, Jr. 1998. Coastal Louisiana. In Status and trends of
the Nation’s biological resources. Volume 1, ed. M. J. Mac, P. A. Opler, C. E. Puckett Haeker, and P. D.
Doran, 385-436. U. S. Geological Survey. Washington, DC: U. S. Government Printing Office,
Greenberg, D.H., S.H. Crownover, and D.R. Gordon. 1997. Roadside soil: a corridor for invasion of
xeric scrub by nonindigenous plants. Natural Areas Journal 17:99-109
Hecht, J. 1997. The environmental effects of freight. Presented to the joint session of trade and
environment experts. Paris, France: Organization for Economic Co-operation and Development.
http://www.oecd.org/dataoecd/14/3/2386636.pdf
Holland, L. E. 1986. Distribution of early life history stages of fishes in selected pools of the Upper
Mississippi River. Hydrobiologia 136: 121-130
IPCC (Intergovernmental Panel on Climate Change). 2007. Climate Change 2007: Impacts, adaptation
and vulnerability. Contribution of Working Group II to the Fourth Assessment Report of the
Intergovernmental Panel on Climate Change, ed. Parry, M. L., O.F. Canziani, J.P. Palutikof, P.J. van der
Linden and C.E. Hanson. Cambridge, UK: Cambridge University Press
Irfanullah H. M. and B. Moss. 2004. Factors influencing the return of submerged plants to a clear-water,
shallow temperate lake. Aquatic Botany 80: 177-191
IWR (Institute for Water Resources). 2012. U.S. port and inland waterways modernization: Options for
the future. A Report to Congress. Washington, DC: U.S. Army Corps of Engineers.
Jones, R.C., K. Walti, and M.S. Adams. 1983. Phytoplankton as a factor in the decline of submerged
macrophyte Myriophyllum spicatum L. in Lake Wingra, Wisconsin, USA. Hydrobiologia 107:213–219
Jones, J.A., F.J. Swanson, B.C. Wemple and K.U. Snyder. 2000. Effects of roads on hydrology,
geomorphology, and disturbance patches in stream networks. Conservation Biology 14:76-85
Jurajda, P. 1995. Effect of channelization and regulation on fish recruitment in a floodplain river.
Regulated Rivers: Research and Management 10: 207-215
Kaluza, P., A Kölzsch, M. T. Gastner and B Blasius. 2010. The complex network of global cargo ship
movements. Journal of the Royal Society Interface 7: 1093-1103
Knight, K. 2008. The implication of Panama Canal expansion to U. S. ports and coastal navigation
economic analysis. IWR White Paper. Alexandria, VA: Institute for Water Resources, U. S. Army Corps
of Engineers
Koch, E. W. 2002. Impact of boat-generated waves on seagrass habitat. Journal of Coastal Research 37:
66-74
Kopecky, A. L., and K. H. Dunton. 2006. Variability in drift macroalgal abundance in relation to biotic
and abiotic factors in two seagrass dominated estuaries in the western Gulf of Mexico. Estuaries and
Coasts 29: 617-29
Krogh, M. G. and S. H. Schweitzer. 1999. Least terns nesting on natural and artificial habitats in
Georgia, USA. The International Journal of Waterbirds 22: 290-296

Environmental Impact Mitigation Needs of Future Port and Waterway Modernization Activities in the United States
U.S. Army Corps of Engineers 46 Institute for Water Resources
Kruse, C. J., A. Protopapas, L. E. Olson and D. H. Bierling 2009. A modal comparison of domestic
freight transportation effects on the general public. Final Report Prepared for U.S. Maritime
Administration and National Waterways Foundation. College Station, TX: Texas Transportation
Institute, The Texas A&M University System.
Laist, D. W. and C. Shaw. 2006. Preliminary evidence that boat speed restrictions reduce deaths of
Florida manatees. Marine Science 22:472-479
Landin, M. C. and R. F. Soots. 1978. Colonial bird use of dredged material islands: A national
perspective. In Proceedings of the Colonial Waterbird Group: Volume 1. Waco, TX: Waterbird Society,
http://www.jstor.org/stable/1520902
Lewis, M. A., D. E. Weber, R. S. Stanley and J. C. Moore. 2001. Dredging impact on an urbanized
Florida bayou: effects on benthos and algal-periphyton. Environmental Pollution 115:161-71
Lovell, S. J., S. F. Stone, and L. Fernandez. 2006. The economic impacts of aquatic invasive species: A
review of the literature. Agricultural and Resource Economics Review 35:195-208
Lubowski, R. N., M. Vesterby, S. Bucholtz, A. Baez, and M. J. Roberts. 2006. Major uses of land in the
United States. 2002/EIB-14, Economic Research Service. Washington, DC: U. S. Department of
Agriculture.
Lunz, J.D., R.J Diaz, and R.A Cole. 1978. Upland and wetland habitat development with dredged
material: Ecological considerations: Synthesis report. Technical Report DS-78-15. Vicksburg, MS:
Waterways Experiment Station, U.S. Army Corps of Engineers
Martin, R. O. R., and R. L. Hanson. 1966. Reservoirs in the United States. Washington, DC: U. S.
Government Printing Office.
Mallin, M. A. 2011. Potential environmental problems from building the proposed North Carolina
International Terminal. Wilmington, NC: Center for Marine Science, University of North Carolina
Wilmington.
Master, L. L., B. A. Stein, L. S. Kutner, and G. A. Hammerson. 2000. Vanishing assets: Conservation
status of U. S. species. In Precious heritage: The status of biodiversity in the United States, ed. B. A.
Stein, L. S. Kutner, and J. S. Adams, 93-118. New York, NY: Oxford University Press.
Mayle, M. C. and M. Landers. 2012. Corps GPA: Deepen river to 47 feet. Savannah, GA: Savannah
Morning News, April 12, 2012
Millennium Ecosystem Assessment. 2005. Ecosystems and human well-being: Synthesis report.
Washington DC: Island Press,
Newell, R. 1988. Ecological changes in Chesapeake Bay: Are they the result of overharvesting the
American oyster (Crassostrea virginica)? In Understanding the estuary –Advances in Chesapeake Bay
research, 536-546. Chesapeake Research Consortium Publication 129.
Newell, R., and E. Koch 2004. Modeling seagrass density and distribution in response to changes in
turbidity stemming from bivalve filtration and seagrass sediment stabilization. Estuaries 27: 793-806
Neves, R. J., A. E. Bogan, J. D. Williams, S. A Ahlstedt, and P. W. Hartfield. 1997. Status of aquatic

Environmental Impact Mitigation Needs of Future Port and Waterway Modernization Activities in the United States
U.S. Army Corps of Engineers 47 Institute for Water Resources
mollusks in the southeasterm United Sates: A downward spiral of diversity. In Aquatic fauna in peril: the
Southeastern perspective, ed. G. W. Benz and D. E. Collins, 43-85. Special Publication 1, Southeastern
Aquatic Research Institute. Decatur, GA: Lenz Design and Communications,
NOAA (National Oceanographic and Atmospheric Administration) 2012. Annual commercial landings
by Group (year 2010). Washington, DC: NOAA Fisheries
http://www.st.nmfs.noaa.gov/st1/commercial/landings/gc_runc.html
Notteboom, T.E. and B. Vernimmen. 2009. The effect of high fuel costs on liner service configuration in
container shipping. Journal of Transportation Geography 17:325-337
Nowacek, S. M., R. S. Wells, E. C. G. Owen, T. R. Speakman, R. O. Flamm, and D. P. Nowacek. 2004.
Florida manatees, Trichechus manatus latirostris, respond to approaching vessels. Biological
Conservation 119: 517–523
NRC (National Academies of Science). 1996. Stemming the tide: Controlling introductions of
nonindigenous species by ships' ballast water. Washington, DC: National Academies of Science
O'Donnell, K.P., R. A. Wahle, M. Bell, and M. Dunnington. 2007. Spatially referenced trap arrays
detect sediment disposal impacts on lobsters and crabs in a New England estuary. Marine Ecology
Progress Series 348: 249-260
OEE (Office of Energy Efficiency). 2011. Energy use handbook tables (Canada). Ottawa, Ontario:
Natural Resources Canada
Parmalee, P. W.. and A. E. Bogan. 1998. The Freshwater Mussels of Tennessee. Knoxville, TN: The
University of Tennessee Press.
Parsley, M. J., N. D. Popoff and J. G. Romine. 2011. Short-term response of subadult white
sturgeon to hopper dredge disposal operations. North American Journal of Fisheries Management 31:1-
11
PIANC (Permanent International Association of Navigation Congresses) Working Group No. 6. 1993.
Problems caused by saltwater infiltration appendix 3: Summary of saltwater intrusion problems due to
inland navigation channels in the United States. Brussels, Belgium: PIANC
PIANC Envicom Task Group 2. 2011. Towards a sustainable waterborne transportation industry.
Brussels, Belgium: PIANC
Pimentel, D., S. McNair, S. Janecka, J. Wightman, C. Simmonds, C. O'Connell, E.Wong, L. Russel, J.
Zern, T. Aquino and T. Tsomondo. 2001. Economic and environmental threats of alien plant, animal and
microbe invasions. Agriculture, Ecosystems and Environment 84:1-20
Ray, G. L. 2005. Ecological functions of shallow, unvegetated estuarine habitats and potential dredging
Impacts (with emphasis on Chesapeake Bay). ERDC TN-WRAP-05-3. Vicksburg, MS: Engineer
Research and Development Center, U. S. Army Corps of Engineers.
Ricciardi, A., and J. B. Rasmussen 1999. Extinction rates of North American freshwater fauna.
Conservation Biology 13: 1220-1222

Environmental Impact Mitigation Needs of Future Port and Waterway Modernization Activities in the United States
U.S. Army Corps of Engineers 48 Institute for Water Resources
Richter, B. D., D. P. Braun, M. A. Mendelson, and L. L. Master. 1997. Threats to imperiled freshwater
fauna. Conservation Biology 11: 14-21
Resor, R. R. and E. Gabler. 2011. Expected impacts of the Panama Canal expansion on United States
foreign trade. New Orleans, LA: Smart Rivers 2011 Conference
Rodrigue, J. 2010. Factors Impacting North American Freight Distribution in View of the Panama Canal
Expansion. Calgary, Alberta: Van Horne Institute, University of Calgary.
Ruiz, G. M., and J. T. Carlton. 2003. Invasive Species: Vectors and Management Strategies.
Washington, DC: Island Press,
Savannah District Corps of Engineers. 2011. Draft tier II environmental impact statement for the
Savannah Harbor expansion: Chatham County, Georgia and Jasper County, South Carolina. Savannah,
GA: U. S. Army Corps of Engineers.
Silber, G.K., and S. Bettridge. 2012. An assessment of the final rule to implement vessel speed restrictions
to reduce the threat of vessel collisions with North Atlantic Right Whales. Silver Spring, MD: National
Marine Fisheries Service
Smith, D. and K. Knight. 2012. Container port capacity study. Draft IWR Report. Alexandria, VA:
Institute for Water Resources, U. S. Army Corps of Engineers.
Stein, B. A., L. S. Kutner, G. A. Hammerson, L. L. Master, and L. E. Morse. 2000. State of the states. In
Precious heritage: The status of biodiversity in the United States. eds. B. A. Stein, L. S. Kutner, and J. S.
Adams, 119-158 . New York, NY: Oxford University Press.
Strahler, A. N. 1957. Quantitative analysis of watershed geomorphology. Transactions American
Geophysical Union 38: 913-920
Trombulak, S. C., and C. Frissell. 2000. Review of ecological effects of roads on terrestrial and aquatic
communities. Conservation Biology 14:18-30
Turner, S. J., S. F. Thrush, J. E. Hewitt, V. J. Cummings, and G. Funnell. 1999. Fishing impacts and the
degradation or loss of habitat structure. Fisheries Management and Ecology 6:401-420
USACE (U. S. Army Corps of Engineers) Office of History. 1998. The History of the U.S. Army Corps of
Engineers. Washington, DC: USACE
USACE. 2010. U. S. waterway system facts. Washington, DC: U. S. Army Corps of Engineers
http://www.ndc.iwr.usace.army.mil//factcard/fc02/factcard.htm
USACE. 2012. USACE sea turtle data warehouse. Washington, DC: U. S. Army Corps of Engineers
http://el.erdc.usace.army.mil/seaturtles/intro.cfm
USDA (U.S. Department of Agriculture) and USDT (U.S. Department of Transportation). 2010. Study of
rural transportation issues. Washington, DC: USDA

Environmental Impact Mitigation Needs of Future Port and Waterway Modernization Activities in the United States
U.S. Army Corps of Engineers 49 Institute for Water Resources
USCB (United States Census Bureau). 2012a: Table 358. Land and water area of states and other entities,
2008. In 2012 Statistical Abstract of the United States. Washington, DC: Department of Commerce
USCB (Geography Division). 2012b. 2010 census TIGER/line shapefiles. Washington DC: U .S.
Department of Commerce
USCB 2012c. U.S. population census table 1. Ranking of census 2000 and projected 2030 state
population and change. Washington, DC: U.S. Department of Commerce,
http://www.census.gov/population/www/projections/projectionsagesex.html
USDOE (U. S. Department of Energy). 2012. Transportation energy data book 30th edition.
Washington DC: USDOE http://cta.ornl.gov/data/index.shtml
Vanderlann, A. S. M. and C. T. Taggart. 2006. Vessel collisions with whales: The probability of lethal
injury based on vessel speed. Marine Mammal Science 23:144-156
Watters, G. T. 2000. Freshwater mussels and water quality: A review of the effects of hydrologic and
instream habitat alterations. In Proceedings of the first freshwater mollusk conservation society
symposium, ed. R. A. Tankersley, D. I. Warmolts, G.T. Watters, B.J. Armitage, P. D. Johnson, and R. S.
Butler, 261-274. Columbus, OH: Ohio Biological Survey.
Weck, T. and B. Crossan. 1981. Analysis of environmental aspects of waterways navigation: National
waterways study. Alexandria, VA: Institute for Water Resources, U.S. Army Corps of Engineers
Wouters, C. E., ed. 2010. Protecting the Great Lakes From Invasive and Nonindigenous Species. New
York, NY: Nova Publication, Inc.
Visel, T. 1988. Mitigation of dredging impacts to oyster populations. Journal of Shellfish Research 7:
267-270
Yip, T. L. 2008. Post traffic risks—A study of accidents in Hong Kong waters. Transportation Research
4:921-931

Environmental Impact Mitigation Needs of Future Port and Waterway Modernization Activities in the United States
U.S. Army Corps of Engineers 50 Institute for Water Resources
Appendices
Appendix A1. Selected Topic Literature Reviews
Influence of Land Uses, Including Ports, on Coastal Waters
The chemical and ecological integrity of coastal open waters is largely influenced by
surrounding land uses, including ports. Urban land use has adverse effects on water quality and
sediment quality, particularly on levels of bacteria and nutrients (Holland et al. 2004; Deacon et
al. 2005; Xian et al. 2007; Van Dolah et al. 2008) and more persistent pollutants such as metals
and organics (Comeleo et al. 1996; Xian et al. 2007; Van Dolah et al. 2008). The high amount of
impervious land cover in urban areas around and in many large ports contributes significantly to
the elevated runoff of pollutants. Comeleo et al. (1996) indicated that land uses within a 10-
kilometer radius of a sampling location explained much of the variation in sediment pollutant
levels. In addition, these types of land uses have effects on benthic organisms (Hale et al. 2004;
Holland et al. 2040; Deacon et al. 2005; Bilkovic et al. 2006) and fish (Deegan et al. 1997; Hale
et al. 2004). There may even be an ecological threshold at 10% of developed shoreline and
developed watershed of 12% (Bilkovic et al. 2006).
The strength of the relationship between urban land uses and chemical endpoints is supported by
the moderate correlations between percent urban land uses and miles of shorelines or streams and
rivers that have been designated as impaired waters. Analysis of rank order correlations shows a
moderately strong relationship exists between urbanization within 10 kilometers of twenty large
container ports in the United States and impaired shorelines within 10 kilometers of a port,
particularly for metals and PCBs (Table A1.1). This type of relationship is similar to
observations made by Comeleo et al. (2006). The relationship between streams/rivers and
urbanization within 10 kilometers of a port are not as strong, most likely because the entire
watershed draining to a stream/river was not analyzed.
Consequently, the extent of urban land uses within a coastal feature of interest such as a
container port can provide insight into the quality of water/sediments and ecological condition.
Activities near container ports with high levels of urban land uses are less likely to affect
chemical and ecological endpoints whereas activities near container ports with low levels of
urban land uses would more likely affect chemical and ecological endpoints. For this purpose, a
radius of 10 kilometers serves as a useful indicator of potential impacts.

Environmental Impact Mitigation Needs of Future Port and Waterway Modernization Activities in the United States
U.S. Army Corps of Engineers 51 Institute for Water Resources
Table A1.1 Spearman’s correlation coefficients between percent urbanization based on the 2006
National Land Cover Database and hydrological features listed as impaired for a pollutant under
Section 303(d) of the Clean Water Act. Hydrologic features are within a 10-kilometer radius of
twenty top container ports in the United States.
Coastlines Streams/Rivers
Spearman’s
Rho
# Spearman’s Rho #
Dioxins 0.50 3 - -
PAHs 0.06 6 -0.40 4
PCBs 0.65 9 -0.43 7
Pesticides 0.21 5 -0.52 9
Mercury -0.24 6 0.17 9
Metals (other than Mercury) 0.69 6 -0.30 10
Pathogens -0.03 6 -0.22 9
Nutrients/Ammonia - - -0.05 12
Oxygen Depletion - - 0.33 18
Bibliography
Bilkovic, D.M., M. Roggero, C.H. Hershner, and K.H. Havens. 2006. Influence of land use on
macrobenthic communities in nearshore estuarine habitats. Estuaries and Coasts 29(6B):1185-
1195.
Comeleo, R.L., J.F. Paul, P.V. August, J. Copeland, C. Baker, S.S. Hale, and R.W. Latimer.
1996. Relationships between watershed stressors and sediment contamination in Chesapeake
Bay estuaries. Landscape Ecology 11(5):307-319.
Deacon, J.R., Soule, S.A., and Smith, T.E. 2005. Effects of urbanization on stream quality at
selected sites in the Seacoast region in New Hampshire, 2001-03. U.S. Geological Survey
Scientific Investigations Report 2005-5103, 18 p.
Deegan, L.A., J.T. Finn, S.A. Ayvazian, C.A. Ryder-Kieffer, and J. Buonaccorsi. 1997.
Development of an estuarine biotic integrity index. Estuaries 20(3):601-617.
Hale, S.S., J.P. Paul, and J.F. Heltshe. 2004. Watershed landscape indicators of estuarine
benthic condition. Estuaries 27(2):283-295.

Environmental Impact Mitigation Needs of Future Port and Waterway Modernization Activities in the United States
U.S. Army Corps of Engineers 52 Institute for Water Resources
Holland, A.F., D.M. Sanger, C.P. Gawle, S.B. Lerberg, M.S. Santiago, G.H.M. Riekerk,L.E.
Zimmerman, and G.I. Scott. 2004. Linkages between tidal creek ecosystems and the landscape
and demographic attributes of their watersheds. Journal of Experimental Marine Biology and
Ecology 298(2):151-178.
Van Dolah, R.F., G.H.M. Riekerk, D.C. Bergquist, J. Felber, D.E. Chestnut, and A.F. Holland.
2008. Estuarine habitat quality reflects urbanization at large spatial scales in South Carolina's
coastal zone. Science of the Total Environment 390:142-154.
Xian, G., M. Crane, and J. Su. 2007. An analysis of urban development and its environmental
impact on the Tampa Bay watershed. Journal of Environmental Management 85(4):965-976.
Dredging and Disposal of Dredged Materials
Dredging operations have effects on marine systems through suspension of dredged sediment or
through the change in the bottom elevation through excavation or placement of dredged
materials. From 1977 to 2010, within those Corps Districts including one of the top twenty U. S.
container ports, dredging activities removed nearly 2000 million cubic yards of dredged material
(1,551 million cubic yards by contractors and 407 million cubic yards directly by the Corps).
Open ocean disposal was the most common means of disposal (Table A1.2). Contractors
disposed About 550 million cubic yards into open water and the Corps directly disposed about
378 million cubic yards into the open ocean. It is expected that this trend will continue. It is
important to note that these volumes represent dredging activities from all the ports in the district
as well as all dredging activities to maintain design conditions.
Suspended sediments released from dredging and disposal operations tend to have localized
effects. For both the dredged and disposal sites, a small fraction 1-3% would become suspended
(Barnard 1978; Bohlen et al. 1979) with the vast majority settling within an hour (as reviewed by
Anchor Environmental 2003). Suspended sediments generally settle rapidly out of the water
column, with increased levels of suspended sediment observed at distances ranging from a few
hundred meters from dredged or disposal sites (LaSalle 1988; Newel et al. 1998) to over 1,000
meters along the bottom of the seafloor for some dredge activities (Hayes 1986; Clarke and
Wilber 2000). In general, mechanical dredging operations release more sediments than hydraulic
dredging operations (Hayes 1986; Havis 1988). Levels of suspended sediments in salt water
tends to be even less because the salt water ions induce flocculation and eventual sedimentation
(Herbich and Brahme 1991; Wilber et al. 2005). However, even the small amount of the fine
sediments that do get suspended can increase turbidity levels by two orders of magnitude
(Bohlen et al. 1979). Documented adverse effects from laboratory studies include mortality,
reduced growth, reduced feeding, damage to gills, and avoidance behavior (as reviewed by
Clarke and Wilber 2000; Berry et al. 2003). For benthic fauna, there is a large data gap because
controlled laboratory studies do not replicate field exposure levels and controlled field level
studies examining the ecological effects of suspended sediment are rare (Clarke and Wilber
2000). In addition, exposure to toxic organic compounds and metals in the water column during
dredging and disposal activities is expected to be minimal, since contaminants are less likely to
be soluble than bound with sediment and suspended sediment usually settles out of the water
column quickly (Anchor Environmental 2003).

Environmental Impact Mitigation Needs of Future Port and Waterway Modernization Activities in the United States
U.S. Army Corps of Engineers 53 Institute for Water Resources
Table A1.2. Mode of disposal of dredged materials by agent (Corps vs. Corps contractor) for
Districts including one or more of the top container ports in the United States from 1977 to 2010.
District Upland Beach /
Upland
Beach Wetland
Creation
Confined Open
Water
Open
Water
/ Upland
Underwater
Confined
Mixed
(>1 type)
Undefined
Dredged by Corps Contractor
Baltimore 0.3 0.1 6.1 0.3 33.4 6.3 0.0 0.0 0.3 2.0
Charleston 3.4 0.0 1.7 0.0 19.2 13.9 0.0 9.7 0.0 0.0
Galveston 13.9 5.7 4.0 19.8 76.4 78.1 18.0 0.0 35.7 27.0
Jacksonville 24.0 9.6 33.9 0.0 0.9 22.4 3.5 0.0 7.8 1.8
Los Angeles 0.0 0.0 11.0 0.0 0.0 0.5 0.0 0.0 1.9 0.0
New England 0.1 0.0 0.0 0.0 0.0 0.7 0.0 0.2 0.2 0.2
New Orleans 18.3 1.0 10.6 189.2 3.7 358.5 0.0 0.0 116.7 5.6
New York 2.5 0.7 16.2 0.0 0.0 3.2 1.3 2.1 0.0 1.9
Norfolk 17.3 0.7 6.4 0.0 0.6 8.0 2.4 0.0 1.7 0.4
Philadelphia 1.8 2.1 26.1 0.0 37.5 2.9 1.5 3.5 2.8 2.9
San Francisco 0.5 0.0 0.0 0.0 0.0 7.3 0.7 0.0 2.4 0.0
Savannah 43.8 0.0 2.7 0.0 0.4 14.8 0.9 0.0 11.4 0.0
Seattle 1.1 0.1 0.3 0.0 0.0 7.2 1.3 0.0 0.0 0.0
Wilmington 12.6 4.0 25.7 0.0 11.1 27.9 21.7 0.0 3.8 5.3
SUBTOTAL
(% of Total)
139.7
(9%)
23.9
(2%)
145.0
(9%)
209.3
(13%)
183.3
(12%)
551.6
(36%)
51.2
(3%)
15.4
(1%)
184.8
(12%)
47
(3%)
Dredged by Corps
New Orleans 53.5 3.1
Philadelphia 1.5 5.3 27.1 0.1 1.0
Portland 115.6 3.4
St. Louis 40.2 1.7
St. Paul 3.5 0.6 4.6 2.1
Vicksburg 105.5
Wilmington 36.2 1.3 0.1 1.0

Environmental Impact Mitigation Needs of Future Port and Waterway Modernization Activities in the United States
U.S. Army Corps of Engineers 54 Institute for Water Resources
SUBTOTAL
(% of Total)
5.0
(1%)
5.9
(1%)
378.1
(93%)
1.4
(<1%)
1.0
(<1%)
4.7
(1%)
10.4
(3%)
For submerged aquatic vegetation, substantial sustained turbidity can depress growth and
increase mortality (as reviewed by Erftemeijer and Lewis 2006). For common species found in
the United States, the critical threshold range for percent surface irradiance was 5-30.5% for
shoalweed (Halodule wrightii), 17.2-30.5% for manatee grass (Syringodium filiforme), 10-22%
for turtle grass (Thalassia testudinum), and 11-37% for eelgrass (Zostera marina) (as reviewed
by Erftemeijer and Lewis 2006). However, extended duration of low light levels was needed to
produce adverse effects, including reported values of 9 months for shoalweed and 11 months for
turtle grass (as reviewed by Erftemeijer and Lewis 2006).
At the dredge site, removal of sediment is expected to disturb benthic communities and
submerged aquatic vegetation. McCauley et al. (1977) indicated that in areas normally subject to
repeated disturbances (e.g., navigation channels) recovery of benthic infauna occurred in as little
as 28 days. The recovery from dredging operations may vary from several months for estuarine
mud substrates to a several years for gravel substrates (Newell et al. 1998). Areas that recover
slowly would tend to be less dynamic substrates where shifting sediments would not replace
sediments from dredged locations. There are documented cases in the United States where
dredging was conducted in submerged aquatic vegetation, resulting in substantial impacts
totaling thousands of acres, although occurring mostly before more stringent application of
environmental laws (Erftemeijer and Lewis 2006).
At areas receiving dredged sediments, including both disposal sites and sites experiencing
sedimentation of re-suspended sediments, deposition of sediment is expected to disturb benthic
communities. However, benthic communities in shallow coastal waters experience natural
deposition and re-suspension processes on a daily basis that would allow such organisms to
acclimate to some small to moderate disposal activities (Wilber et al. 2005). For some life stages
of aquatic organisms (e.g., eggs of marine fishes), burial by millimeters of sediment may be
sufficient to induce mortality (as reviewed by Wilber et al. 2005). For adult stages of benthic
organisms, burial can cause mortality in some species with as little as a few centimeters of
sediment burial (Maurer et al. 1986, Hinchey et al. 2006), but recovery of benthic communities
can occur quickly in areas that are normally experience repeated perturbations in as little as two
weeks (McCauley et al. 1977) or up to three months (Smith and Rule 2001). The ability of a
benthic species to survive and re-colonize depends on the species’ ability to move vertically in
response to the burial (Maurer et al. 1986, Hinchey et al. 2006). For submerged aquatic
vegetation, studies in other countries indicate a few centimeters of sediment deposition may
adversely affect seagrasses (as reviewed by Erftemeijer and Lewis 2006). When the deposited
sediment is contaminated, effects to re-colonizing benthic species are expected. As evidenced by
the previous review of disturbed land uses and ecological condition, exposure to pollutant
sources can affect benthic organisms. Thus, disposal of contaminated sediments at a location
could adversely affect benthic communities.

Environmental Impact Mitigation Needs of Future Port and Waterway Modernization Activities in the United States
U.S. Army Corps of Engineers 55 Institute for Water Resources
Bibliography
Anchor Environmental. 2003. Literature review of effects of resuspended sediments due to
dredging operations. Report prepared for the Los Angeles Contaminated Sediments Task Force.
Los Angeles, California.
Barnard, W.D. 1978. Prediction and control of dredged material dispersion around dredging
and open-water pipeline disposal operations. Technical Report DS-78-13. U.S. Army Engineer
Waterways Experiment Station, Vicksburg, MS.
Berry, W., N. Rubenstein, B. Melzian, and B. Hill. 2003. The biological effects of suspended
and bedded sediments (SABS) in aquatic systems: A review. Internal report to US EPA, Office of
Research and Development, National health and Environmental Effects Laboratory,
Narragansett, RI.
Bohlen, F.W., D.F. Cundy, and J.M. Tramontano. 1979. Suspended material distributions in the
wake of estuarine channel dredging operations. Estuarine and Coastal Marine Science 9: 699-
711.
Clarke, D.G. and D.H. Wilber. 2000. Assessment of potential impacts of dredging operations
due to sediment resuspension. DOER Technical Notes Collection ERDC TN-DOERE9. U.S.
Army Engineer Research and Development Center, Vicksburg, MS.
Erftemeijer, P.L.A., and R.R.R. Lewis, III. 2006. Environmental impacts of dredging on
seagrasses: a review. Marine Pollution Bulletin 52:1553-1572.
Havis, R.N. 1988. Sediment resuspension by selected dredges: Environmental effects of
dredging. Technical Note EEDP-09-2. U.S. Army Engineer Waterways Experiment Station,
Vicksburg, MS.
Hayes, D.F. 1986. Guide to selecting a dredge for minimizing resuspension of sediment.
environmental effects of dredging. Technical Note EEDP-09-1. U.S. Army Engineer Waterways
Experiment Station, Vicksburg, MS.
Herbich, J. B., and S.B. Brahme. 1991. Literature review and technical evaluation of sediment
resuspension during dredging. Contract Report HL-91-1. U.S. Army Engineer Waterways
Experiment Station, Vicksburg, MS.
Hinchey, E.K., L.C. Schaffner, C.C. Hoar, B.W. Vogt, and L.P. Batte. 2006. Responses of
estuarine benthic invertebrates to sediment burial: the importance of mobility and lifestyle.
Hydrobiologia 556:85-98.
LaSalle, M.W. 1988. Physical and chemical alterations associated with dredging: An overview.
In Effects of Dredging on Anadromous Pacific Coast Fishes. Workshop Proceedings, Seattle,
September 8-9, 1988. U.S. Army Corps of Engineers Waterways Experiment Station,
Vicksburg, MS.

Environmental Impact Mitigation Needs of Future Port and Waterway Modernization Activities in the United States
U.S. Army Corps of Engineers 56 Institute for Water Resources
Maurer, D.L., R.T. Keck, J.C. Tinsman, W.A. Leatham, C. Wethe, C. Lord, and T.M. Church.
1986. Vertical migration and mortality of marine benthos in dredged material: a synthesis.
International Revue ges Hydrobiology 71: 50-63.
McCauley, J.E., R.A. Parr, D.R. Hancock. 1977. Benthic infauna and maintenance dredging: a
case study. Water Research 11: 233-242.
Newel, C.R., L.J. Seiderer, D.R. Hitchcock. 1998. The impact of dredging works in coastal
waters: a review of the sensitivity to disturbance and subsequent recovery of biological resources
on the seabed. Oceanography and Marine Biology Annual Review 36: 127-178.
Smith, S.D.A., and M.J. Rule. 2001. The effects of dredge-spoil dumping on a shallow water
soft-sediment community in the Solitary Island Marine Park, NSW, Australia. Marine Pollution
Bulletin 42: 1040-1048.
Wilber, D.H., W. Brostoff, D.G. Clarke, and G.L. Ray. 2005. Sedimentation: Potential
biological effects from dredging operations in estuarine and marine environments. ERDC
Technical Note DOER-E20. Vicksburg, MS: U.S. Army Engineer Research and Development
Center.
Sea Turtles and Sea Mammals
Activities associated with shipping and port expansion can affect sea turtles. Monitoring of
Corps dredging operations documented that hopper dredging using a trailing suction dragheads
have resulted in incidental take of 508 sea turtles from 1980 to 2003 including 360 loggerhead,
37 Kemp’s, 50 green, and 61 unidentified sea turtle species (Dickerson et al. 2004). Of these,
363 occurred in the South Atlantic. Since 1992, implementation of turtle deflectors, relocation
trawling and dredging windows has drastically reduced the rates of incidental take, even though
dredging operations increased. Selective monitoring of other types of dredging operations had
no recorded incidental take of sea turtles. Bolten et al. (2011) estimate dredging activities result
in 11-100 annual deaths of loggerhead turtles within the Northwest Atlantic Ocean.
Ship strikes can also adversely affect sea turtles and sea mammals. Bolten et al. (2011)
estimated ship strikes result in annual deaths of 101 to 1000 loggerhead turtles within the
Northwest Atlantic Ocean. Collisions with green sea turtles in Australia increased for vessel
velocities greater than 4 km/h, suggesting higher velocities elsewhere would increase vessel
strikes with sea turtles (Hazel et al. 2007). In their global review of 292 large whale ship strikes
from 1975 to 2002, Jensen and Silber (2004) documented close to 200 large whale ship strikes in
United States coastal waters, including 38 North Atlantic right whales. Jensen and Silber (2004)
documented a higher chance of collision at higher ship velocities. Of the 134 cases of known
vessel types, there were 23 incidents involving Navy vessels, 20 incidents involving
container/cargo vessels, 19 incidents involving whale-watching vessels, 16 incidents involving
ferries, and 9 incidents involving Coast Guard vessels (Jensen and Silber 2004). Most of the
vessel types were unknown. Also, many of the vessel strikes were only discovered when the
ship arrived into the harbor with a dead whale on the bow. Many more are probably hit and
killed without being impaled.

Environmental Impact Mitigation Needs of Future Port and Waterway Modernization Activities in the United States
U.S. Army Corps of Engineers 57 Institute for Water Resources
The contribution of container ship traffic to vessel strikes appears to be comparatively small.
Bolten et al. (2011) concluded that worldwide fisheries caused the most whale deaths to both
adults (about 3000) and juveniles (about 8600). Jensen and Silber (2004) indicate container and
cargo vessels represent about 15% of known vessel strikes. But vessel collisions are the greatest
known human-caused death of North American right whales (Silber and Bettridge 2012).
Bibliography
Bolten, A.B., L.B. Crowder, M.G. Dodd, S.L. MacPherson, J.A. Musick, B.A. Schroeder, B.E.
Witherington, K.J. Long, and M.L. Snover. 2011. Quantifying multiple threats to endangered
species: an example from loggerhead sea turtles. Frontiers in Ecology and Environment
9(5):295-301.
Dickerson, D., M. Wolters, C. Theriot, and C. Slay. 2004. Dredging impacts on sea turtles in
the southeastern USA: a historical review of protection. In: Proceedings of the World Dredging
Conference XVII, Dredging in a Sensitive Environment. Central Dredging Association, 27
September-1 October 2004, Hamburg, Germany.
Hazel, J., I.R. Lawler, H. Marsh, and S. Robson. 2007. Vessel speed increases collision risk for
the green turtle Chelonia mydas. Endangered Species Research 3:105-113.
Jensen, A.S., and G.K. Silber. 2004. Large whale ship strike database. U.S. Department of
Commerce, National Oceanic and Atmospheric Administration Technical Memorandum NMFS-
OPR-25. 37 pp.
Silber, G.K. and S. Bettridge. 2012. An Assessment of the final rule to implement vessel speed
restrictions to reduce the threat of vessel collisions with North Atlantic Right Whales. National Marine Fisheries Service, Silver Spring, MD
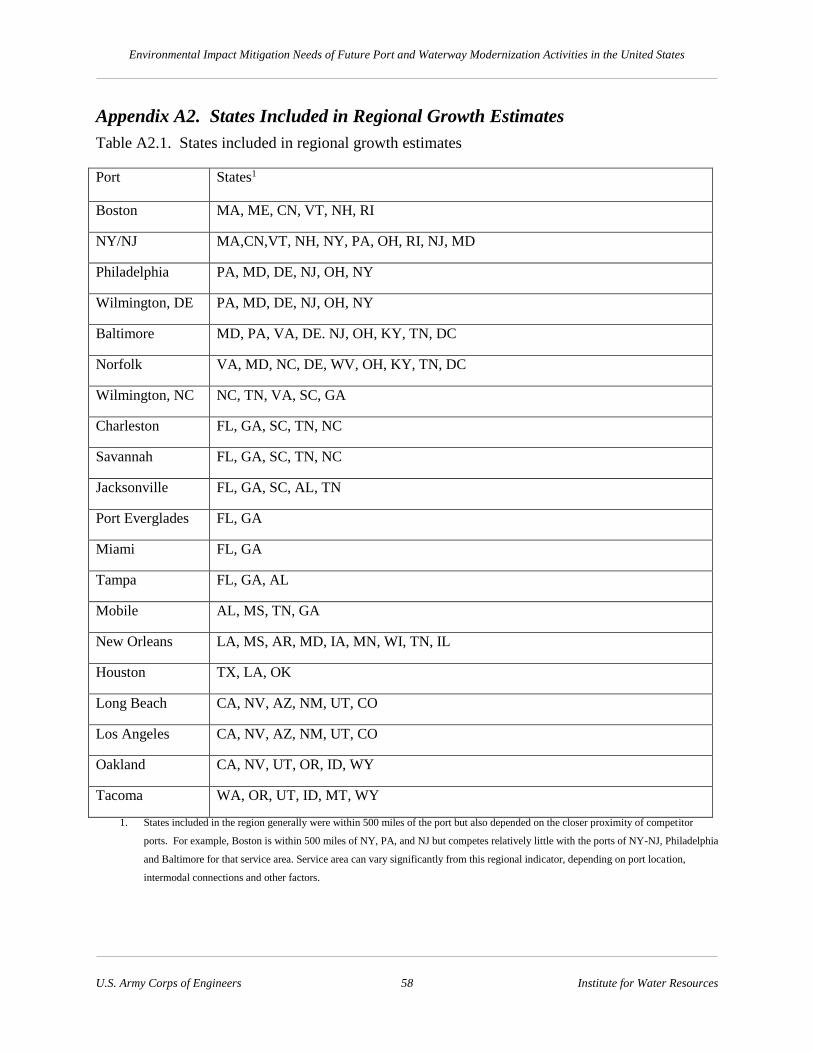
Environmental Impact Mitigation Needs of Future Port and Waterway Modernization Activities in the United States
U.S. Army Corps of Engineers 58 Institute for Water Resources
Appendix A2. States Included in Regional Growth Estimates
Table A2.1. States included in regional growth estimates
Port States1
Boston MA, ME, CN, VT, NH, RI
NY/NJ MA,CN,VT, NH, NY, PA, OH, RI, NJ, MD
Philadelphia PA, MD, DE, NJ, OH, NY
Wilmington, DE PA, MD, DE, NJ, OH, NY
Baltimore MD, PA, VA, DE. NJ, OH, KY, TN, DC
Norfolk VA, MD, NC, DE, WV, OH, KY, TN, DC
Wilmington, NC NC, TN, VA, SC, GA
Charleston FL, GA, SC, TN, NC
Savannah FL, GA, SC, TN, NC
Jacksonville FL, GA, SC, AL, TN
Port Everglades FL, GA
Miami FL, GA
Tampa FL, GA, AL
Mobile AL, MS, TN, GA
New Orleans LA, MS, AR, MD, IA, MN, WI, TN, IL
Houston TX, LA, OK
Long Beach CA, NV, AZ, NM, UT, CO
Los Angeles CA, NV, AZ, NM, UT, CO
Oakland CA, NV, UT, OR, ID, WY
Tacoma WA, OR, UT, ID, MT, WY
1. States included in the region generally were within 500 miles of the port but also depended on the closer proximity of competitor
ports. For example, Boston is within 500 miles of NY, PA, and NJ but competes relatively little with the ports of NY-NJ, Philadelphia
and Baltimore for that service area. Service area can vary significantly from this regional indicator, depending on port location,
intermodal connections and other factors.
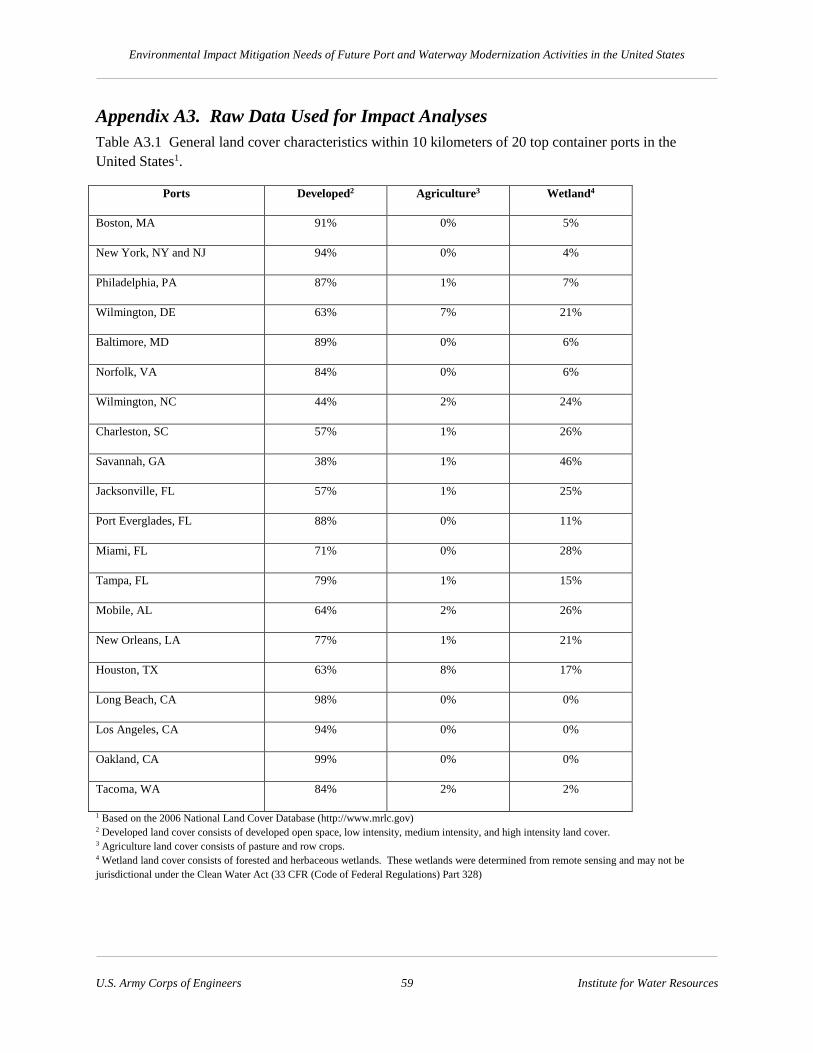
Environmental Impact Mitigation Needs of Future Port and Waterway Modernization Activities in the United States
U.S. Army Corps of Engineers 59 Institute for Water Resources
Appendix A3. Raw Data Used for Impact Analyses
Table A3.1 General land cover characteristics within 10 kilometers of 20 top container ports in the
United States1.
Ports Developed2 Agriculture3 Wetland4
Boston, MA 91% 0% 5%
New York, NY and NJ 94% 0% 4%
Philadelphia, PA 87% 1% 7%
Wilmington, DE 63% 7% 21%
Baltimore, MD 89% 0% 6%
Norfolk, VA 84% 0% 6%
Wilmington, NC 44% 2% 24%
Charleston, SC 57% 1% 26%
Savannah, GA 38% 1% 46%
Jacksonville, FL 57% 1% 25%
Port Everglades, FL 88% 0% 11%
Miami, FL 71% 0% 28%
Tampa, FL 79% 1% 15%
Mobile, AL 64% 2% 26%
New Orleans, LA 77% 1% 21%
Houston, TX 63% 8% 17%
Long Beach, CA 98% 0% 0%
Los Angeles, CA 94% 0% 0%
Oakland, CA 99% 0% 0%
Tacoma, WA 84% 2% 2%
1 Based on the 2006 National Land Cover Database (http://www.mrlc.gov) 2 Developed land cover consists of developed open space, low intensity, medium intensity, and high intensity land cover. 3 Agriculture land cover consists of pasture and row crops. 4 Wetland land cover consists of forested and herbaceous wetlands. These wetlands were determined from remote sensing and may not be
jurisdictional under the Clean Water Act (33 CFR (Code of Federal Regulations) Part 328)

Environmental Impact Mitigation Needs of Future Port and Waterway Modernization Activities in the United States
U.S. Army Corps of Engineers 60 Institute for Water Resources
Table A3.2. Acres of wetlands1 within 10 kilometers of 20 top container ports in the United States.
National Land Cover Database2 National Wetlands Inventory2
Ports Image3
Year
Emergent Forested/
Shrub
Total Image Year3 Emergent Forested/Shrub Total
Estua-
rine
Fresh-
water
Sub-
total
Estua-
rine
Fresh-
water
Sub-
total
Boston, MA 2006 1,794 50 1,844 1992,1995 1,079 124 1,204 1 19 20 1,223
New York, NY
and NJ
2005 904 1,378 2,282 1995,1994 1,320 300 1,620 0 203 203 1,822
Philadelphia, PA 2005 1,656 2,660 4,316 2002,1989 0 1,345 1,345 0 1,054 1,054 2,399
Wilmington, DE 2005 4,616 7,666 12,282 2007,2002,1999 2,082 1,838 3,920 33 5,685 5,718 9,638
Baltimore, MD 2005 716 2,727 3,443 1981,1988,1982 443 259 702 3 180 183 886
Norfolk, VA 2005 996 1,072 2,068 2000 801 177 977 37 438 476 1,453
Wilmington, NC 2007 7079 8,664 15,743 2010,1983 169 4,175 4,344 0 4,444 4,444 8,788
Charleston, SC 2006 12,658 2,268 14,926 1989,1990 12,211 499 12,709 165 1,233 1,399 14,108
Savannah, GA 2005 16,037 14,418 30,455 2006,2007 3,512 12,477 15,989 29 13,786 13,815 29,804
Jacksonville, FL 2006 8,957 5,510 14,467 1983 7,849 571 8,420 40 6,065 6,105 14,525
Port Everglades,
FL
2006 1,022 3,242 4,263 1984,1985,1972 0 175 175 1,485 538 2,024 2,198
Miami, FL4 2006 7,786 1,535 9,320 1972,1984 0 0 352 352 352
Tampa, FL 2005,2006 2,037 5,607 7,644 1982 277 551 828 957 638 1,594 2,422

Environmental Impact Mitigation Needs of Future Port and Waterway Modernization Activities in the United States
U.S. Army Corps of Engineers 61 Institute for Water Resources
Mobile, AL 2005 7,108 3,982 11,090 2002,2001 4,821 289 5,110 815 3,000 3,815 8,925
New Orleans, LA 2005 4,563 9,512 14,075 1988 0 3,648 3,648 0 10,642 10,642 14,290
Houston, TX 2006 4,908 8,220 13,129 2006 1,366 744 2,110 1 3,192 3,193 5,303
Long Beach, CA 2007 57 37 95 2005,2002 14 164 178 0 67 67 245
Los Angeles, CA 2007 77 37 114 2002,2005 4 106 110 0 116 116 226
Oakland, CA 2006 32 15 47 1985 130 30 160 0 8 8 167
Tacoma, WA 2006 768 480 1,248 1980,1981 167 114 281 0 555 555 836
1 Wetland land cover consists of forested and herbaceous wetlands. These wetlands were determined from remote sensing and may not be jurisdictional under the
Clean Water Act (33 CFR (Code of Federal Regulations) Part 328) 2 Based on National Land Cover Database (NLCD) (http://www.mrlc.gov) and the National Wetland Inventory (NWI) (http://www.fws.gov/wetlands) 3 Year of the image ordered by extent of coverage from greatest to least coverage 4 Miami had a large amount of seagrass areas interpreted as emergent wetlands under the NLCD
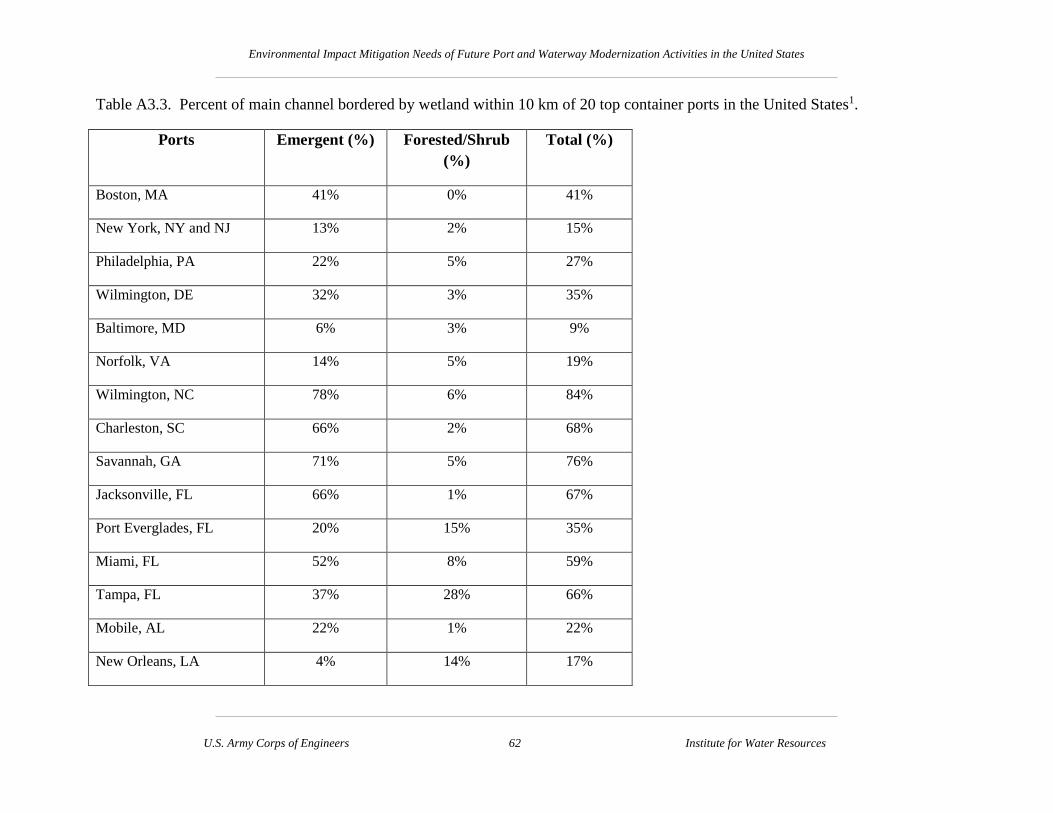
Environmental Impact Mitigation Needs of Future Port and Waterway Modernization Activities in the United States
U.S. Army Corps of Engineers 62 Institute for Water Resources
Table A3.3. Percent of main channel bordered by wetland within 10 km of 20 top container ports in the United States1.
Ports Emergent (%) Forested/Shrub
(%)
Total (%)
Boston, MA 41% 0% 41%
New York, NY and NJ 13% 2% 15%
Philadelphia, PA 22% 5% 27%
Wilmington, DE 32% 3% 35%
Baltimore, MD 6% 3% 9%
Norfolk, VA 14% 5% 19%
Wilmington, NC 78% 6% 84%
Charleston, SC 66% 2% 68%
Savannah, GA 71% 5% 76%
Jacksonville, FL 66% 1% 67%
Port Everglades, FL 20% 15% 35%
Miami, FL 52% 8% 59%
Tampa, FL 37% 28% 66%
Mobile, AL 22% 1% 22%
New Orleans, LA 4% 14% 17%

Environmental Impact Mitigation Needs of Future Port and Waterway Modernization Activities in the United States
U.S. Army Corps of Engineers 63 Institute for Water Resources
Houston, TX 26% 1% 27%
Long Beach, CA 4% 0% 4%
Los Angeles, CA 6% 0% 6%
Oakland, CA 1% 0% 1%
Tacoma, WA 10% 0% 10%
1 Based on the 2006 National Land Cover Database (http://www.mrlc.gov)
Table A3.4. Properties of the navigable waterway between the container port and the open ocean for 20 top container ports in the
United States. Confined channels are in rivers and canals.
Ports Channel Type Confined distance
to Ocean
Wetlands
Downstream of 10 km
Radius
Boston, MA Open 0 N
New York, NY and NJ Confined (> Savannah) 13 N
Philadelphia, PA Confined (> Savannah) 50 N
Wilmington, DE Confined (> Savannah) 10 Y
Baltimore, MD Open 0 N
Norfolk, VA Open 0 N
Wilmington, NC Confined (> Savannah) 40 Y
Charleston, SC Confined (> Savannah) 14 Y

Environmental Impact Mitigation Needs of Future Port and Waterway Modernization Activities in the United States
U.S. Army Corps of Engineers 64 Institute for Water Resources
Savannah, GA Confined (= Savannah) 31 Y
Jacksonville, FL Confined (> Savannah) 21 Y
Port Everglades, FL Confined (< Savannah) 3 N
Miami, FL Confined (~ Savannah) 2 Y
Tampa, FL Open 1 Y
Mobile, AL Confined (~ Savannah) 3 N
New Orleans, LA Confined (> Savannah) 190 N
Houston, TX Confined (~ Savannah) 4 Y
Long Beach, CA Open 0 N
Los Angeles, CA Confined (~ Savannah) 7 N
Oakland, CA Open 0 N
Tacoma, WA Open 0 N

Environmental Impact Mitigation Needs of Future Port and Waterway Modernization Activities in the United States
U.S. Army Corps of Engineers 65 Institute for Water Resources
Table A3.5. Seagrasses, coral, and ecological open space within 10 kilometers for 20 top container ports in the United States. A
blank is 0.
Ports Seagrasses
(acres)1
Coral (acres)1 Ecological Open
Space (acres)2
Boston, MA 35 2
New York, NY and NJ 1,884
Philadelphia, PA 291
Wilmington, DE 2,535
Baltimore, MD 388
Norfolk, VA 6
Wilmington, NC 5
Charleston, SC 8
Savannah, GA 13,314
Jacksonville, FL 9,877
Port Everglades, FL 11,612 7,624
Miami, FL 27,619 4,381
Tampa, FL
Mobile, AL 3,074
New Orleans, LA 4,418
Houston, TX 479

Environmental Impact Mitigation Needs of Future Port and Waterway Modernization Activities in the United States
U.S. Army Corps of Engineers 66 Institute for Water Resources
Long Beach, CA 33
Los Angeles, CA 101
Oakland, CA 2,424 1,707
Tacoma, WA 424
1 Based on United Nations Environment Programme-World Conservation Monitoring Centre database (http://data.unep-wcmc.org/datasets) 2 Based on the United States Geological Survey’s Gap Analysis Program Protected Areas Database of the United States (PADUS) v1.2
(http://gapanalysis.usgs.gov/PADUS). The ecological open space are areas identified as having permanent protection from conversion of natural land cover as
well as a management plan to maintain natural conditions.

Environmental Impact Mitigation Needs of Future Port and Waterway Modernization Activities in the United States
U.S. Army Corps of Engineers 67 Institute for Water Resources
Table A3.6. Federally listed threatened, endangered, and candidate species in counties within 10 kilometers1 of 20 top container ports
in the United States.
# of Species # of Species Using
Freshwater Aquatic/
Riparian Habitat2
# of Species Using
Coastal/Marine Habitat
Ports Animals Plants Total Animals Plants Total Animals Plants Total Names of Coastal/Marine Species
Boston, MA 7 2 9 1 0 1 6 0 6 Green sea turtle (Chelonia mydas), Hawksbill sea
turtle (Eretmochelys imbricata), Leatherback sea
turtle (Dermochelys coriacea), Loggerhead sea turtle
(Caretta caretta), Piping Plover (Charadrius melodus),
Roseate tern (Sterna dougallii dougallii)
New York,
NY and NJ
6 0 6 2 0 2 4 0 4 Green sea turtle (Chelonia mydas), Hawksbill sea
turtle (Eretmochelys imbricata), Leatherback sea
turtle (Dermochelys coriacea), Loggerhead sea turtle
(Caretta caretta)
Philadelphia,
PA
2 2 4 2 2 4 0 0 0 -
Wilmington,
DE
1 2 3 1 1 2 0 0 0 -
Baltimore,
MD
3 3 6 1 1 2 2 1 3 Sensitive joint-vetch (Aeschynomene virginica),
Northeastern beach tiger beetle (Cicindela dorsalis
dorsalis), Puritan tiger beetle (Cicindela puritana)
Norfolk, VA 2 0 2 0 0 0 2 0 2 Northeastern beach tiger beetle (Cicindela dorsalis
dorsalis), Piping Plover (Charadrius melodus)

Environmental Impact Mitigation Needs of Future Port and Waterway Modernization Activities in the United States
U.S. Army Corps of Engineers 68 Institute for Water Resources
# of Species # of Species Using
Freshwater Aquatic/
Riparian Habitat2
# of Species Using
Coastal/Marine Habitat
Ports Animals Plants Total Animals Plants Total Animals Plants Total Names of Coastal/Marine Species
Wilmington,
NC
9 3 12 0 2 2 8 1 9 Seabeach amaranth (Amaranthus pumilus), Green sea
turtle (Chelonia mydas), Hawksbill sea turtle
(Eretmochelys imbricata), Kemp's ridley sea turtle
(Lepidochelys kempii), Leatherback sea turtle
(Dermochelys coriacea), Loggerhead sea turtle
(Caretta caretta), Piping Plover (Charadrius melodus),
Wood stork (Mycteria americana), West Indian
manatee (Trichechus manatus)
Charleston,
SC
13 4 17 2 3 5 9 1 10 Seabeach amaranth (Amaranthus pumilus), Green sea
turtle (Chelonia mydas), Hawksbill sea turtle
(Eretmochelys imbricata), Kemp's ridley sea turtle
(Lepidochelys kempii), Leatherback sea turtle
(Dermochelys coriacea), Loggerhead sea turtle
(Caretta caretta), Piping Plover (Charadrius melodus),
Red knot (Calidris canutus rufa), Wood stork
(Mycteria americana), West Indian manatee
(Trichechus manatus)
Savannah,
GA
11 3 14 1 3 4 8 0 8 Green sea turtle (Chelonia mydas), Hawksbill sea
turtle (Eretmochelys imbricata), Kemp's ridley sea
turtle (Lepidochelys kempii), Leatherback sea turtle
(Dermochelys coriacea), Loggerhead sea turtle
(Caretta caretta), Piping Plover (Charadrius melodus),
Wood stork (Mycteria americana), West Indian
manatee (Trichechus manatus)

Environmental Impact Mitigation Needs of Future Port and Waterway Modernization Activities in the United States
U.S. Army Corps of Engineers 69 Institute for Water Resources
# of Species # of Species Using
Freshwater Aquatic/
Riparian Habitat2
# of Species Using
Coastal/Marine Habitat
Ports Animals Plants Total Animals Plants Total Animals Plants Total Names of Coastal/Marine Species
Jacksonville,
FL
8 0 8 2 0 2 6 0 6 Hawksbill sea turtle (Eretmochelys imbricata),
Leatherback sea turtle (Dermochelys coriacea), Green
sea turtle (Chelonia mydas), Loggerhead sea turtle
(Caretta caretta), Wood stork (Mycteria americana),
West Indian manatee (Trichechus manatus)
Port
Everglades,
FL
14 3 17 3 2 5 9 1 10 Beach jacquemontia (Jacquemontia reclinata),
Hawksbill sea turtle (Eretmochelys imbricata),
Leatherback sea turtle (Dermochelys coriacea), Green
sea turtle (Chelonia mydas), Loggerhead sea turtle
(Caretta caretta), American crocodile (Crocodylus
acutus), Wood stork (Mycteria americana), Red knot
(Calidris canutus rufa), West Indian manatee
(Trichechus manatus), Southeastern beach mouse
(Peromyscus polionotus niveiventris)
Miami, FL 23 18 41 6 4 10 10 1 11 Beach jacquemontia (Jacquemontia reclinata),
Hawksbill sea turtle (Eretmochelys imbricata),
Leatherback sea turtle (Dermochelys coriacea), Green
sea turtle (Chelonia mydas), Loggerhead sea turtle
(Caretta caretta), American crocodile (Crocodylus
acutus), Cape Sable seaside sparrow (Ammodramus
maritimus mirabilis), Wood stork (Mycteria
americana), Piping Plover (Charadrius melodus), Red
knot (Calidris canutus rufa), West Indian manatee
(Trichechus manatus)

Environmental Impact Mitigation Needs of Future Port and Waterway Modernization Activities in the United States
U.S. Army Corps of Engineers 70 Institute for Water Resources
# of Species # of Species Using
Freshwater Aquatic/
Riparian Habitat2
# of Species Using
Coastal/Marine Habitat
Ports Animals Plants Total Animals Plants Total Animals Plants Total Names of Coastal/Marine Species
Tampa, FL 9 3 12 1 1 2 6 0 6 Green sea turtle (Chelonia mydas), Hawksbill sea
turtle (Eretmochelys imbricata), Leatherback sea
turtle (Dermochelys coriacea), Loggerhead sea turtle
(Caretta caretta), Wood stork (Mycteria americana),
West Indian manatee (Trichechus manatus)
Mobile, AL 18 1 19 4 1 5 12 0 12 Gulf sturgeon (Acipenser oxyrinchus desotoi),
Alabama red-belly turtle (Pseudemys alabamensis),
Green sea turtle (Chelonia mydas), Hawksbill sea
turtle (Eretmochelys imbricata), Kemp's ridley sea
turtle (Lepidochelys kempii), Leatherback sea turtle
(Dermochelys coriacea), Loggerhead sea turtle
(Caretta caretta), Piping Plover (Charadrius melodus),
Wood stork (Mycteria americana), Alabama beach
mouse (Peromyscus polionotus ammobates), Perdido
Key beach mouse (Peromyscus polionotus
trissyllepsis), West Indian manatee (Trichechus
manatus)
New
Orleans, LA
9 1 10 0 0 0 8 0 8 Piping Plover (Charadrius melodus), Gulf sturgeon
(Acipenser oxyrinchus desotoi), West Indian manatee
(Trichechus manatus), Green sea turtle (Chelonia
mydas), Hawksbill sea turtle (Eretmochelys
imbricata), Kemp's ridley sea turtle (Lepidochelys
kempii), Leatherback sea turtle (Dermochelys
coriacea), Loggerhead sea turtle (Caretta caretta)

Environmental Impact Mitigation Needs of Future Port and Waterway Modernization Activities in the United States
U.S. Army Corps of Engineers 71 Institute for Water Resources
# of Species # of Species Using
Freshwater Aquatic/
Riparian Habitat2
# of Species Using
Coastal/Marine Habitat
Ports Animals Plants Total Animals Plants Total Animals Plants Total Names of Coastal/Marine Species
Houston, TX 11 0 11 3 0 3 8 0 8 Green sea turtle (Chelonia mydas), Hawksbill sea
turtle (Eretmochelys imbricata), Kemp's ridley sea
turtle (Lepidochelys kempii), Leatherback sea turtle
(Dermochelys coriacea), Loggerhead sea turtle
(Caretta caretta), Eskimo curlew (Numenius borealis),
Piping Plover (Charadrius melodus), West Indian
manatee (Trichechus manatus)
Long Beach,
CA
31 24 55 9 4 13 12 5 17 Brand's phacelia (Phacelia stellaris), Coastal dunes
milk-vetch (Astragalus tener var. titi), Gambel's
watercress (Rorippa gambellii), Salt marsh bird's-
beak (Cordylanthus maritimus ssp. maritimus),
Ventura Marsh Milk-vetch (Astragalus pycnostachyus
var. lanosissimus), El Segundo blue butterfly
(Euphilotes battoides allyni), Tidewater goby
(Eucyclogobius newberryi), Green sea turtle
(Chelonia mydas), Island night lizard (Xantusia
riversiana), Leatherback sea turtle (Dermochelys
coriacea), Loggerhead sea turtle (Caretta caretta),
Olive ridley sea turtle (Lepidochelys olivacea),
California least tern (Sterna antillarum browni),
Light-footed clapper rail (Rallus longirostris levipes),
Marbled murrelet (Brachyramphus marmoratus),
Western snowy plover (Charadrius alexandrinus
nivosus), Pacific pocket mouse (Perognathus
longimembris pacificus)

Environmental Impact Mitigation Needs of Future Port and Waterway Modernization Activities in the United States
U.S. Army Corps of Engineers 72 Institute for Water Resources
# of Species # of Species Using
Freshwater Aquatic/
Riparian Habitat2
# of Species Using
Coastal/Marine Habitat
Ports Animals Plants Total Animals Plants Total Animals Plants Total Names of Coastal/Marine Species
Los Angeles,
CA
35 31 66 11 7 18 12 5 17 Brand's phacelia (Phacelia stellaris), Coastal dunes
milk-vetch (Astragalus tener var. titi), Gambel's
watercress (Rorippa gambellii), Salt marsh bird's-
beak (Cordylanthus maritimus ssp. maritimus),
Ventura Marsh Milk-vetch (Astragalus pycnostachyus
var. lanosissimus), El Segundo blue butterfly
(Euphilotes battoides allyni), Tidewater goby
(Eucyclogobius newberryi), Green sea turtle
(Chelonia mydas), Island night lizard (Xantusia
riversiana), Leatherback sea turtle (Dermochelys
coriacea), Loggerhead sea turtle (Caretta caretta),
Olive ridley sea turtle (Lepidochelys olivacea),
California least tern (Sterna antillarum browni),
Light-footed clapper rail (Rallus longirostris levipes),
Marbled murrelet (Brachyramphus marmoratus),
Western snowy plover (Charadrius alexandrinus
nivosus), Pacific pocket mouse (Perognathus
longimembris pacificus)
Oakland, CA 18 6 24 8 0 8 8 1 9 San Francisco lessingia (Lessingia germanorum),
Myrtle's silverspot butterfly (Speyeria zerene
myrtleae), Delta smelt (Hypomesus transpacificus),
Green sea turtle (Chelonia mydas), Leatherback sea
turtle (Dermochelys coriacea), Loggerhead sea turtle
(Caretta caretta), Olive ridley sea turtle (Lepidochelys
olivacea), Western snowy plover (Charadrius
alexandrinus nivosus), Salt marsh harvest mouse
(Reithrodontomys raviventris)

Environmental Impact Mitigation Needs of Future Port and Waterway Modernization Activities in the United States
U.S. Army Corps of Engineers 73 Institute for Water Resources
# of Species # of Species Using
Freshwater Aquatic/
Riparian Habitat2
# of Species Using
Coastal/Marine Habitat
Ports Animals Plants Total Animals Plants Total Animals Plants Total Names of Coastal/Marine Species
Tacoma,
WA
9 1 10 3 1 4 2 0 2 Marbled murrelet (Brachyramphus marmoratus),
Streaked Horned lark (Eremophila alpestris strigata)
1 Based on the U.S. Fish and Wildlife Service (http://ecos.fws.gov/ecos/indexPublic.do) 2 Inland habitat, excluding Coastal or Marine Habitats

Environmental Impact Mitigation Needs of Future Port and Waterway Modernization Activities in the United States
U.S. Army Corps of Engineers 74 Institute for Water Resources
Table A3.7. Critical habitat of federally listed threatened and/or endangered species1 within 10
kilometers and offshore of 20 top container ports of the United States.
Ports Polygon Line
Boston, MA North Atlantic right whale (Eubalaena
glacialis)
New York, NY and
NJ
Philadelphia, PA
Wilmington, DE
Baltimore, MD
Norfolk, VA
Wilmington, NC
Charleston, SC
Savannah, GA
Jacksonville, FL West Indian manatee (Trichechus
manatus), piping plover (Charadrius
melodus), North Atlantic right whale
(Eubalaena glacialis)
Port Everglades, FL Elkhorn coral (Acropora palmata),
staghorn coral (Acropora cervicornis)
Miami, FL Elkhorn coral (Acropora palmata),
staghorn coral (Acropora cervicornis),
West Indian manatee (Trichechus
manatus), johnson's seagrass (Halophila
johnsonii)
Tampa, FL Piping plover (Charadrius melodus)
Mobile, AL
New Orleans, LA

Environmental Impact Mitigation Needs of Future Port and Waterway Modernization Activities in the United States
U.S. Army Corps of Engineers 75 Institute for Water Resources
Houston, TX
Long Beach, CA
Los Angeles, CA
Oakland, CA Steelhead (Oncorhynchus
mykiss)
Tacoma, WA Chinook salmon (Oncorhynchus
tshawytscha), killer whale (Orcinus orca)
Bull Trout (Salvelinus
confluentus), chinook
salmon (Oncorhynchus
tshawytscha)
1 Based on the U.S. Fish and Wildlife Service critical habitat database (http://criticalhabitat.fws.gov/crithab/ )This
dataset includes digitized maps of critical habitat for some listed species. Not all listed species have digitized
critical habitat and this table probably excludes critical habitat for some species.

Environmental Impact Mitigation Needs of Future Port and Waterway Modernization Activities in the United States
U.S. Army Corps of Engineers 76 Institute for Water Resources
Table A3.8. Miles of beaches within 10 kilometers of 20 top container ports in the United States.
Ports Polygon (miles)
Boston, MA 10.6
New York, NY and NJ
Philadelphia, PA
Wilmington, DE
Baltimore, MD
Norfolk, VA 5.9
Wilmington, NC 0.2
Charleston, SC
Savannah, GA
Jacksonville, FL
Port Everglades, FL 11.1
Miami, FL 12.5
Tampa, FL 0.5
Mobile, AL
New Orleans, LA
Houston, TX 2.6
Long Beach, CA 3.7
Los Angeles, CA 2.5
Oakland, CA
Tacoma, WA 11.4
1 Based on EPA’s BEACHES dataset (http://www.epa.gov/waters/data/downloads.html#BEACH Datasets)
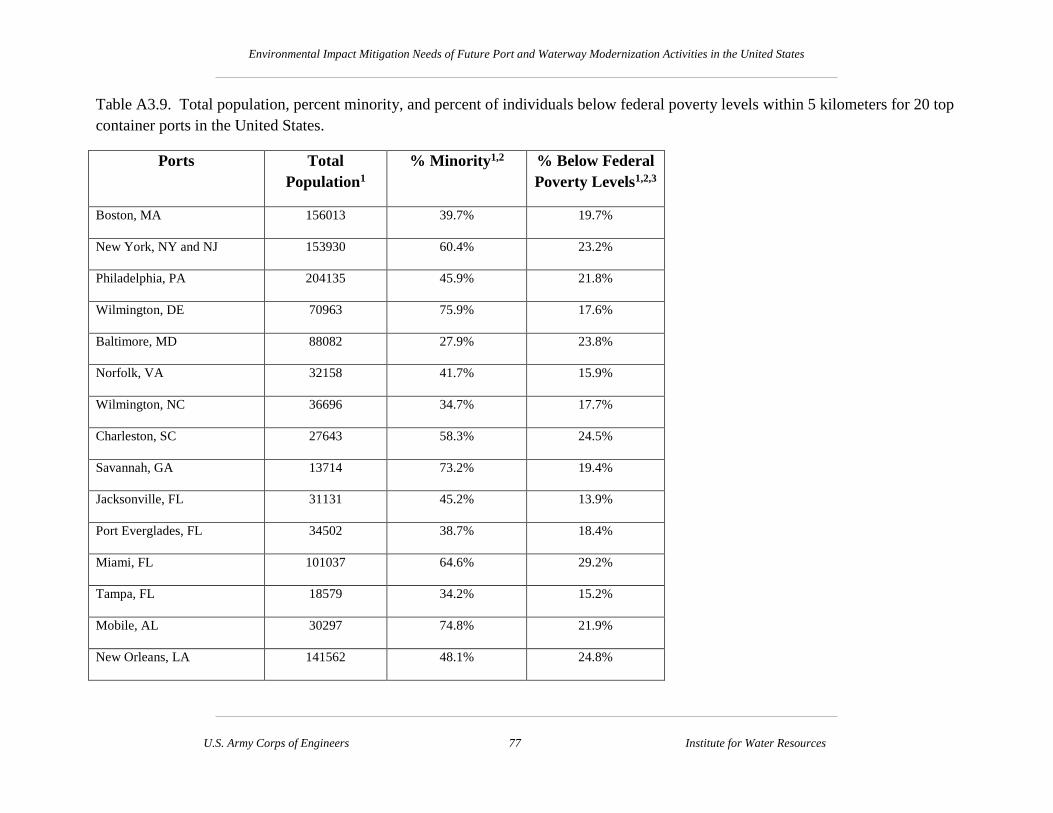
Environmental Impact Mitigation Needs of Future Port and Waterway Modernization Activities in the United States
U.S. Army Corps of Engineers 77 Institute for Water Resources
Table A3.9. Total population, percent minority, and percent of individuals below federal poverty levels within 5 kilometers for 20 top
container ports in the United States.
Ports Total
Population1
% Minority1,2 % Below Federal
Poverty Levels1,2,3
Boston, MA 156013 39.7% 19.7%
New York, NY and NJ 153930 60.4% 23.2%
Philadelphia, PA 204135 45.9% 21.8%
Wilmington, DE 70963 75.9% 17.6%
Baltimore, MD 88082 27.9% 23.8%
Norfolk, VA 32158 41.7% 15.9%
Wilmington, NC 36696 34.7% 17.7%
Charleston, SC 27643 58.3% 24.5%
Savannah, GA 13714 73.2% 19.4%
Jacksonville, FL 31131 45.2% 13.9%
Port Everglades, FL 34502 38.7% 18.4%
Miami, FL 101037 64.6% 29.2%
Tampa, FL 18579 34.2% 15.2%
Mobile, AL 30297 74.8% 21.9%
New Orleans, LA 141562 48.1% 24.8%

Environmental Impact Mitigation Needs of Future Port and Waterway Modernization Activities in the United States
U.S. Army Corps of Engineers 78 Institute for Water Resources
Houston, TX 32079 36.7% 15.4%
Long Beach, CA 106858 80.2% 26.7%
Los Angeles, CA 123515 73.3% 22.0%
Oakland, CA 71121 74.9% 21.0%
Tacoma, WA 69254 39.8% 15.9%
1 Based on U.S. Census Summary File and TIGER data (http://www.census.gov) 2 All % data use the Total 2010 Population as the denominator. 3 Based on Public Use Microdata Areas with 5% sampling (http://www.census.gov/geo/puma/puma2010.html)

Environmental Impact Mitigation Needs of Future Port and Waterway Modernization Activities in the United States
U.S. Army Corps of Engineers 79 Institute for Water Resources
Table A3.10. Indicators of pollution levels within vicinity of 20 top container ports in the United States.
Unhealthy Air days in Counties within
10 km of port in 20101
Pollution Generating Facilities within 10 km of Port (Count)2
Ports General
Populatio
n
Elderly
and
Children
Asthma/Oth
er Lung
Disease
Stationary
Air Source
(AIRS)
Brownfield
Grant
Recipients
(ACRES)
Dischargers
to Waterways
(NPDES/PCS)
Superfund
Sites
(CERCLIS)
Solid Hazardous
Waste Generators
(RCRAInfo)
Boston, MA 0 3 3 960 129 173 5 1820
New York, NY and NJ 1 12 12 993 49 321 59 3688
Philadelphia, PA 1 21 21 472 145 173 74 1912
Wilmington, DE 0 16 16 171 48 32 23 748
Baltimore, MD 1 19 19 1835 63 270 25 1415
Norfolk, VA 1 5 5 117 1 23 6 396
Wilmington, NC 0 1 14 101 5 74 8 211
Charleston, SC 0 0 0 273 10 52 22 479
Savannah, GA 0 0 7 142 0 31 14 362
Jacksonville, FL 0 1 1 135 1 327 19 660
Port Everglades, FL 0 0 1 144 4 389 14 1038
Miami, FL 0 2 2 112 317 219 5 895
Tampa, FL 0 2 12 276 74 599 33 1038
Mobile, AL 0 4 4 98 5 187 12 501

Environmental Impact Mitigation Needs of Future Port and Waterway Modernization Activities in the United States
U.S. Army Corps of Engineers 80 Institute for Water Resources
New Orleans, LA 16 19 61 226 40 530 10 2023
Houston, TX 1 27 27 98 0 85 5 383
Long Beach, CA 3 78 78 76 38 99 27 1380
Los Angeles, CA 3 78 78 76 22 92 24 1207
Oakland, CA 1 4 4 72 94 33 18 1615
Tacoma, WA 0 1 1 71 19 151 42 1165
1 Based on EPA’s AIRNow data (http://www.epa.gov/aircompare/compare_by_state.htm) 2 Based on EPA’s Facility Registry System (http://www.epa.gov/enviro/html/fii/prog_sys.html). Facilities includes data from separate media-specific programs including
Aerometric Information Retrieval System (AIRS); Assessment, Cleanup and Redevelopment Exchange System (ACRES), National Pollutant Discharge Elimination System/Permit
Compliance System (NPDES/PCS), Comprehensive Environmental Response, Compensation, and Liability Information System (CERCLIS), and Resource Conservation and
Recovery Act Information (RCRAInfo).

Environmental Impact Mitigation Needs of Future Port and Waterway Modernization Activities in the United States
U.S. Army Corps of Engineers 81 Institute for Water Resources
Table A3.11. Length and cause of impairments of shorelines of beaches and bays within 10 kilometers of 20 top container ports in the
United States.
Length By Cause of Impairment
Ports Total
Length
(km)1
Dioxins PAHs2
PCBs3
Pesticides Mercury Metals
(other than
Mercury)
Oxygen
Depletion
Pathogens
Boston, MA 102.2 20.7 67.1 102.2
New York, NY and NJ 106.8 88.5 73.9 106.8 73.9 73.9 32.8
Philadelphia, PA
Wilmington, DE
Baltimore, MD 7.7 7.7 7.7
Norfolk, VA 25.5 25.5
Wilmington, NC
Charleston, SC
Savannah, GA
Jacksonville, FL
Port Everglades, FL 21.9 21.9 21.9
Miami, FL
Tampa, FL 71.0 71.0 71.0 13.4
Mobile, AL

Environmental Impact Mitigation Needs of Future Port and Waterway Modernization Activities in the United States
U.S. Army Corps of Engineers 82 Institute for Water Resources
New Orleans, LA
Houston, TX 44.3 32.9 32.9 11.4
Long Beach, CA 89.4 10.3 73.5 71.8 0.9 63.8 74.5
Los Angeles, CA 83.0 10.9 77.0 77.4 0.9 64.2 63.2
Oakland, CA 57.4 57.1 5.5 55.6 57.1 57.1 52.9 0.3
Tacoma, WA 8.6 5.1 8.6 5.1
1 Based on EPA’s Reach Address Database (http://www.epa.gov/waters/data/downloads.html#ATTAINS Datasets). The total length represents all features that are impaired.
Many features have several sources of impairments. 2 Polyaromatic hydrocarbons 3 Polychlorinated biphenyls

Environmental Impact Mitigation Needs of Future Port and Waterway Modernization Activities in the United States
U.S. Army Corps of Engineers 83 Institute for Water Resources
Table A3.12. Length and cause of impairments of streams and rivers within 10 kilometers of 20 top container ports in the United
States.
Length By Cause of Impairment
Ports Total
Length
(km)1
Dioxins PAHs2 PCBs3 Pesticides Mercury Metals
(other than
Mercury)
Oil/
Grease
Nutrients/
Ammonia
Oxygen
Depletion
Pathogens Others
Boston, MA 30.8 8.9 21.9 2.6 11.5 17.1 19.7 19.3 21.9 23.9
New York, NY and NJ 55.6 47.1 45.2 47.1 45.2 43.5 37.1 51.8 23.2 13.3 21.8
Philadelphia, PA 63.1 13.7 56.6 46.6 37.6 46.6 16.9 9.7 29.7
Wilmington, DE 62.7 49.3 35.1 19.9 25.8 21.5 31.9
Baltimore, MD 32.4 21.2 9.4 21.2 1.7 21.2
Norfolk, VA 119.0 104.1 26.5 81.1 46.7
Wilmington, NC 9.4 1.9
Charleston, SC 3.0 3.0
Savannah, GA 6.4 6.4
Jacksonville, FL 48.0 41.1 17.6 6.9 30.1
Port Everglades, FL 26.2 20.2 8.1 18.1 26.2
Miami, FL 2.2 2.2 2.2 2.2 2.2
Tampa, FL 34.5 23.1 10.8 34.5 22.0
Mobile, AL 40.8 20.3 10.8 9.8 20.5

Environmental Impact Mitigation Needs of Future Port and Waterway Modernization Activities in the United States
U.S. Army Corps of Engineers 84 Institute for Water Resources
New Orleans, LA 66.5 47.3 47.3 59.8
Houston, TX 38.3 17.8 17.8 17.5 33.7
Long Beach, CA 8.5 5.5 3.0 5.5
Los Angeles, CA 3.7 3.7 3.7
Oakland, CA 3.6 3.6 1.7 3.6 1.7 3.6
Tacoma, WA 11.7 1.6 0.4 1.9 11.7
1 Based on EPA’s Reach Address Database (http://www.epa.gov/waters/data/downloads.html#ATTAINS Datasets). The total length represents all features that are impaired.
Many features have several sources of impairments. 2 Polyaromatic hydrocarbons 3 Polychlorinated biphenyls 4 Other source of impairments include pH, temperature, sedimentation, total dissolved solids/chlorides, turbidity, and taste/color/odor

Environmental Impact Mitigation Needs of Future Port and Waterway Modernization Activities in the United States
U.S. Army Corps of Engineers 85 Institute for Water Resources
Table A3.13. General land cover characteristics within 100-meters of open water areas and 5 km
of major locks/dams along the Mississippi and Illinois Rivers in the United States1.
General Land Cover within 100 Meters of
River Open Water
Name Developed2 Agriculture3 Wetland4
Mississippi River - Chains of Rocks Lock & Dam 27, IL &
MO
30% 18% 42%
Mississippi River - Mel Price Lock & Dam, IL & MO 35% 5% 43%
Mississippi River - Lock & Dam 25, IL & MO 3% 21% 47%
Mississippi River - Lock & Dam 24, IL & MO 12% 14% 68%
Mississippi River - Lock & Dam 22, IL & MO 8% 9% 64%
Mississippi River - Lock & Dam 21, IL & MO 18% 6% 67%
Mississippi River - Lock & Dam 20, IL & MO 10% 27% 58%
Mississippi River - Lock & Dam 19, IA & IL 35% 11% 41%
Mississippi River - Lock & Dam 18, IA & IL 11% 5% 65%
Mississippi River - Lock & Dam 17, IA & IL 2% 4% 79%
Mississippi River - Lock & Dam 16, IA & IL 18% 7% 62%
Mississippi River - Lock & Dam 15, IA & IL 81% 0% 8%
Mississippi River - Lock & Dam 14, IA & IL 64% 0% 28%
Mississippi River - Lock & Dam 13, IA & IL 19% 3% 58%
Mississippi River - Lock & Dam 12, IA & IL 14% 3% 65%
Mississippi River - Lock & Dam 11, IA, IL, & WI 36% 3% 37%
Mississippi River - Lock & Dam 10, IA & WI 10% 3% 74%
Mississippi River - Lock & Dam 9, IA & WI 12% 4% 75%
Mississippi River - Lock & Dam 8, MN & WI 20% 1% 71%
Mississippi River - Lock & Dam 7, MN & WI 22% 3% 65%
Mississippi River - Lock & Dam 6, MN & WI 33% 0% 56%
Mississippi River - Lock & Dam 5a, MN & WI 16% 1% 75%

Environmental Impact Mitigation Needs of Future Port and Waterway Modernization Activities in the United States
U.S. Army Corps of Engineers 86 Institute for Water Resources
General Land Cover within 100 Meters of
River Open Water
Name Developed2 Agriculture3 Wetland4
Mississippi River - Lock & Dam 5, MN & WI 11% 0% 81%
Mississippi River - Lock & Dam 4, MN & WI 17% 7% 62%
Mississippi River - Lock & Dam 3, MN & WI 8% 1% 85%
Mississippi River - Lock & Dam 2, MN & WI 22% 8% 35%
Illinois River - Lagrange Lock & Dam, IL 5% 9% 82%
Illinois River - Peoria Lock & Dam, IL 33% 0% 57%
Illinois River - Starved Rock Lock & Dam, IL 15% 13% 30%
Illinois River - Marseilles Lock & Dam, IL 25% 9% 13%
Illinois River - Dresden Island Lock & Dam, IL 23% 11% 48%
Illinois River - Brandon Road Lock & Dam, IL 64% 5% 20%
Illinois River - Lockport Lock, IL 40% 1% 33%
1 Based on the 2006 National Land Cover Database (http://www.mrlc.gov) 2 Developed land cover consists of developed undeveloped, low intensity, medium intensity, and high intensity land cover. 3 Agriculture land cover consists of pasture and row crops. 4 Wetland land cover consists of forested and herbaceous wetlands. These wetlands were determined from remote sensing and
may not be jurisdictional under the Clean Water Act (33 CFR (Code of Federal Regulations) Part 328)

Environmental Impact Mitigation Needs of Future Port and Waterway Modernization Activities in the United States
U.S. Army Corps of Engineers 87 Institute for Water Resources
Table A3.14. Percent of open waters with wetland borders within 5 kilometers of major
locks/dams along the Mississippi and Illinois Rivers in the United States1.
Open Water with Wetland Borders2
Name Emergent Forested/Shrub Total
Mississippi River - Chains of Rocks Lock & Dam 27, IL &
MO
36% 15% 52%
Mississippi River - Mel Price Lock & Dam, IL & MO 14% 31% 45%
Mississippi River - Lock & Dam 25, IL & MO 16% 25% 41%
Mississippi River - Lock & Dam 24, IL & MO 10% 60% 69%
Mississippi River - Lock & Dam 22, IL & MO 3% 72% 75%
Mississippi River - Lock & Dam 21, IL & MO 6% 62% 67%
Mississippi River - Lock & Dam 20, IL & MO 3% 65% 68%
Mississippi River - Lock & Dam 19, IA & IL 16% 34% 50%
Mississippi River - Lock & Dam 18, IA & IL 25% 47% 72%
Mississippi River - Lock & Dam 17, IA & IL 15% 69% 84%
Mississippi River - Lock & Dam 16, IA & IL 17% 50% 67%
Mississippi River - Lock & Dam 15, IA & IL 4% 10% 13%
Mississippi River - Lock & Dam 14, IA & IL 16% 19% 35%
Mississippi River - Lock & Dam 13, IA & IL 21% 42% 62%
Mississippi River - Lock & Dam 12, IA & IL 22% 50% 72%
Mississippi River - Lock & Dam 11, IA, IL, & WI 17% 32% 49%
Mississippi River - Lock & Dam 10, IA & WI 22% 61% 83%
Mississippi River - Lock & Dam 9, IA & WI 18% 69% 86%
Mississippi River - Lock & Dam 8, MN & WI 14% 57% 72%
Mississippi River - Lock & Dam 7, MN & WI 21% 56% 78%
Mississippi River - Lock & Dam 6, MN & WI 12% 61% 73%

Environmental Impact Mitigation Needs of Future Port and Waterway Modernization Activities in the United States
U.S. Army Corps of Engineers 88 Institute for Water Resources
Open Water with Wetland Borders2
Name Emergent Forested/Shrub Total
Mississippi River - Lock & Dam 5a, MN & WI 20% 66% 86%
Mississippi River - Lock & Dam 5, MN & WI 9% 76% 85%
Mississippi River - Lock & Dam 4, MN & WI 12% 61% 73%
Mississippi River - Lock & Dam 3, MN & WI 18% 72% 90%
Mississippi River - Lock & Dam 2, MN & WI 7% 34% 41%
Illinois River - Lagrange Lock & Dam, IL 26% 64% 90%
Illinois River - Peoria Lock & Dam, IL 6% 51% 57%
Illinois River - Starved Rock Lock & Dam, IL 11% 24% 35%
Illinois River - Marseilles Lock & Dam, IL 0% 16% 16%
Illinois River - Dresden Island Lock & Dam, IL 0% 51% 51%
Illinois River - Brandon Road Lock & Dam, IL 0% 25% 25%
Illinois River - Lockport Lock, IL 1% 37% 37%
1 Based on the 2006 National Land Cover Database (http://www.mrlc.gov) 2 Wetland land cover consists of forested and herbaceous wetlands. These wetlands were determined from remote sensing and
may not be jurisdictional under the Clean Water Act (33 CFR (Code of Federal Regulations) Part 328)

Environmental Impact Mitigation Needs of Future Port and Waterway Modernization Activities in the United States
U.S. Army Corps of Engineers 89 Institute for Water Resources
Table A3.15. Federally listed threatened, endangered and candidate species in counties within 5 kilometers of major locks/dams along
the Mississippi and Illinois Rivers in the United States.1
# of Species # of Species using
Freshwater
Aquatic/Riparian
Habitat
Name Animals Plants Total Animals Plants Total Names of Freshwater Aquatic/Riparian Habitat Species
Mississippi River
- Chains of
Rocks Lock and
Dam 27, IL &
MO
11 4 15 11 2 13 Decurrent false aster (Boltonia decurrens), eastern prairie fringed orchid
(Platanthera leucophaea), running buffalo clover (Trifolium stoloniferum), pink
mucket (pearlymussel) (Lampsilis abrupta), scaleshell mussel (Leptodea
leptodon), sheepnose mussel (Plethobasus cyphyus), snuffbox mussel
(Epioblasma triquetra), spectaclecase (Cumberlandia monodonta), Illinois cave
amphipod (Gammarus acherondytes), pallid sturgeon (Scaphirhynchus albus),
least tern (Sterna antillarum), Gray bat (Myotis grisescens), Indiana bat (Myotis
sodalis), Eastern Massasauga (Sistrurus catenatus)
Mississippi River
- Mel Price Lock
& Dam, IL &
MO
10 4 14 10 2 12 Decurrent false aster (Boltonia decurrens), eastern prairie fringed orchid
(Platanthera leucophaea), running buffalo clover (Trifolium stoloniferum), pink
mucket (Lampsilis abrupta), scaleshell mussel (Leptodea leptodon), sheepnose
mussel (Plethobasus cyphyus), snuffbox mussel (Epioblasma triquetra),
spectaclecase (Cumberlandia monodonta), pallid sturgeon (Scaphirhynchus
albus), eastern massasauga (Sistrurus catenatus), least tern (Sterna antillarum),
gray bat (Myotis grisescens), Indiana bat (Myotis sodalis)
Mississippi River
- Lock & Dam
25, IL & MO
2 3 5 2 3 5 Decurrent false aster (Boltonia decurrens), eastern prairie fringed orchid
(Platanthera leucophaea), running buffalo clover (Trifolium stoloniferum),
spectaclecase (Cumberlandia monodonta), Indiana bat (Myotis sodalis)

Environmental Impact Mitigation Needs of Future Port and Waterway Modernization Activities in the United States
U.S. Army Corps of Engineers 90 Institute for Water Resources
# of Species # of Species using
Freshwater
Aquatic/Riparian
Habitat
Name Animals Plants Total Animals Plants Total Names of Freshwater Aquatic/Riparian Habitat Species
Mississippi River
- Lock & Dam
24, IL & MO
6 2 8 6 2 8 Decurrent false aster (Boltonia decurrens), eastern prairie fringed orchid
(Platanthera leucophaea), fat pocketbook (Potamilus capax), Higgins eye
pearlymussel (Lampsilis higginsii), sheepnose mussel (Plethobasus cyphyus),
spectaclecase (Cumberlandia monodonta), gray bat (Myotis grisescens), Indiana
bat (Myotis sodalis)
Mississippi River
- Lock & Dam
22, IL & MO
6 3 9 6 3 9 Decurrent false aster (Boltonia decurrens), eastern prairie fringed orchid
(Platanthera leucophaea), western prairie fringed orchid (Platanthera praeclara),
Fat pocketbook (Potamilus capax), Higgins eye pearlymussel (Lampsilis
higginsii), sheepnose fussel (Plethobasus cyphyus), spectaclecase
(Cumberlandia monodonta), gray bat (Myotis grisescens), Indiana bat (Myotis
sodalis)
Mississippi River
- Lock & Dam
21, IL & MO
6 1 7 6 1 7 Eastern prairie fringed orchid (Platanthera leucophaea), fat pocketbook
(Potamilus capax), Higgins eye pearlymussel (Lampsilis higginsii), sheepnose
mussel (Plethobasus cyphyus), spectaclecase (Cumberlandia monodonta), pallid
sturgeon (Scaphirhynchus albus), Indiana bat (Myotis sodalis)
Mississippi River
- Lock & Dam
20, IL & MO
5 1 6 5 1 6 Eastern prairie fringed orchid (Platanthera leucophaea), Higgins eye
pearlymussel (Lampsilis higginsii), sheepnose mussel (Plethobasus cyphyus),
spectaclecase) (Cumberlandia monodonta), pallid sturgeon (Scaphirhynchus
albus), Indiana bat (Myotis sodalis)
Mississippi River
- Lock & Dam
19, IA & IL
6 3 9 6 2 8 Eastern prairie fringed orchid (Platanthera leucophaea), western prairie fringed
Orchid (Platanthera praeclara), fat pocketbook (Potamilus capax), Higgins eye
pearlymusse) (Lampsilis higginsii), sheepnose mussel (Plethobasus cyphyus),
spectaclecase (Cumberlandia monodonta), Topeka shiner (Notropis topeka),
Indiana bat (Myotis sodalis)
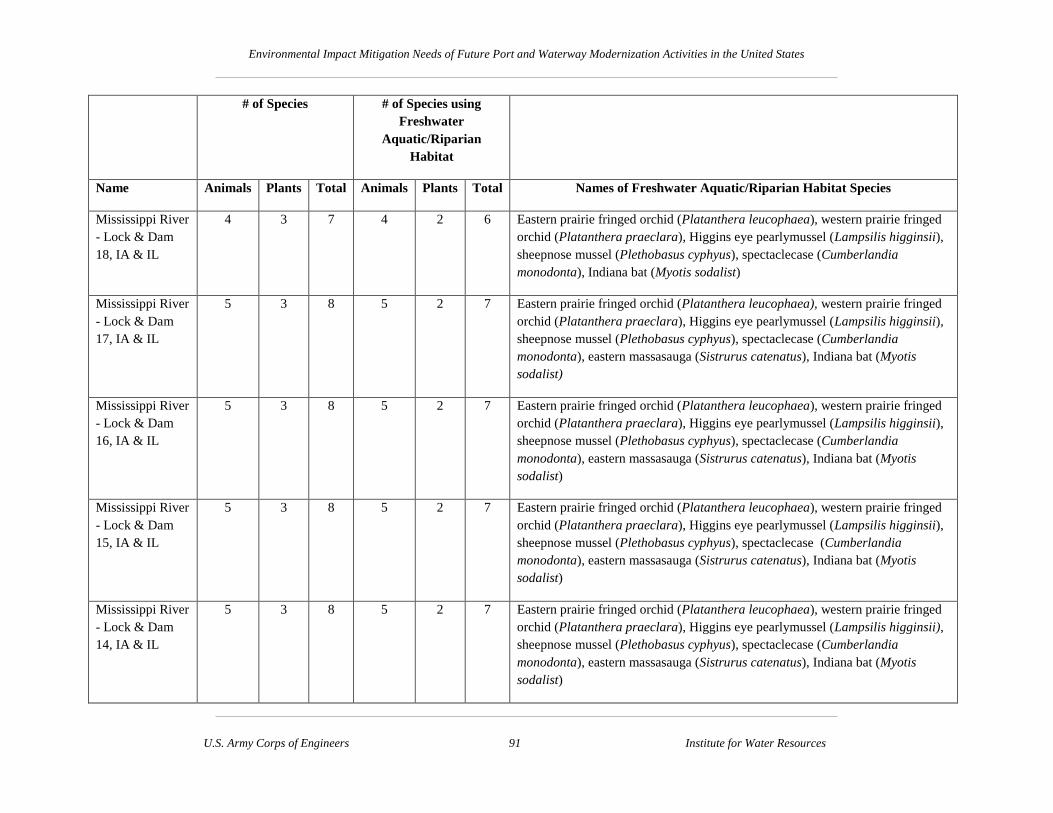
Environmental Impact Mitigation Needs of Future Port and Waterway Modernization Activities in the United States
U.S. Army Corps of Engineers 91 Institute for Water Resources
# of Species # of Species using
Freshwater
Aquatic/Riparian
Habitat
Name Animals Plants Total Animals Plants Total Names of Freshwater Aquatic/Riparian Habitat Species
Mississippi River
- Lock & Dam
18, IA & IL
4 3 7 4 2 6 Eastern prairie fringed orchid (Platanthera leucophaea), western prairie fringed
orchid (Platanthera praeclara), Higgins eye pearlymussel (Lampsilis higginsii),
sheepnose mussel (Plethobasus cyphyus), spectaclecase (Cumberlandia
monodonta), Indiana bat (Myotis sodalist)
Mississippi River
- Lock & Dam
17, IA & IL
5 3 8 5 2 7 Eastern prairie fringed orchid (Platanthera leucophaea), western prairie fringed
orchid (Platanthera praeclara), Higgins eye pearlymussel (Lampsilis higginsii),
sheepnose mussel (Plethobasus cyphyus), spectaclecase (Cumberlandia
monodonta), eastern massasauga (Sistrurus catenatus), Indiana bat (Myotis
sodalist)
Mississippi River
- Lock & Dam
16, IA & IL
5 3 8 5 2 7 Eastern prairie fringed orchid (Platanthera leucophaea), western prairie fringed
orchid (Platanthera praeclara), Higgins eye pearlymussel (Lampsilis higginsii),
sheepnose mussel (Plethobasus cyphyus), spectaclecase (Cumberlandia
monodonta), eastern massasauga (Sistrurus catenatus), Indiana bat (Myotis
sodalist)
Mississippi River
- Lock & Dam
15, IA & IL
5 3 8 5 2 7 Eastern prairie fringed orchid (Platanthera leucophaea), western prairie fringed
orchid (Platanthera praeclara), Higgins eye pearlymussel (Lampsilis higginsii),
sheepnose mussel (Plethobasus cyphyus), spectaclecase (Cumberlandia
monodonta), eastern massasauga (Sistrurus catenatus), Indiana bat (Myotis
sodalist)
Mississippi River
- Lock & Dam
14, IA & IL
5 3 8 5 2 7 Eastern prairie fringed orchid (Platanthera leucophaea), western prairie fringed
orchid (Platanthera praeclara), Higgins eye pearlymussel (Lampsilis higginsii),
sheepnose mussel (Plethobasus cyphyus), spectaclecase (Cumberlandia
monodonta), eastern massasauga (Sistrurus catenatus), Indiana bat (Myotis
sodalist)

Environmental Impact Mitigation Needs of Future Port and Waterway Modernization Activities in the United States
U.S. Army Corps of Engineers 92 Institute for Water Resources
# of Species # of Species using
Freshwater
Aquatic/Riparian
Habitat
Name Animals Plants Total Animals Plants Total Names of Freshwater Aquatic/Riparian Habitat Species
Mississippi River
- Lock & Dam
13, IA & IL
5 3 8 4 2 6 Eastern prairie fringed orchid (Platanthera leucophaea), western prairie fringed
orchid (Platanthera praeclara), Higgins eye pearlymussel (Lampsilis higginsii),
sheepnose mussel (Plethobasus cyphyus), eastern massasauga (Sistrurus
catenatus), Indiana bat (Myotis sodalist)
Mississippi River
- Lock & Dam
12, IA & IL
4 4 8 3 3 6 Eastern prairie fringed orchid (Platanthera leucophaea), northern wild
monkshood (Aconitum noveboracense), western prairie fringed orchid
(Platanthera praeclara), Higgins eye pearlymussel (Lampsilis higginsii),
sheepnose mussel (Plethobasus cyphyus), Indiana bat (Myotis sodalis)
Mississippi River
- Lock & Dam
11, IA, IL, & WI
7 5 12 6 3 9 Eastern prairie fringed orchid (Platanthera leucophaea), northern wild
monkshood (Aconitum noveboracense), western prairie fringed orchid
(Platanthera praeclara), Hine's emerald dragonfly (Somatochlora hineana),
Higgins eye pearlymussel (Lampsilis higginsii), sheepnose mussel (Plethobasus
cyphyus), spectaclecase (mussel) (Cumberlandia monodonta), whooping crane
(Grus americana), Indiana bat (Myotis sodalis)
Mississippi River
- Lock & Dam
10, IA & WI
6 4 10 5 2 7 Northern wild monkshood (Aconitum noveboracense), western prairie fringed
orchid (Platanthera praeclara), Hine's emerald dragonfly (Somatochlora
hineana), Higgins eye pearlymussel (Lampsilis higginsii), sheepnose mussel
(Plethobasus cyphyus), spectaclecase (Cumberlandia monodonta), whooping
crane (Grus americana)
Mississippi River
- Lock & Dam 9,
IA & WI
5 3 8 5 2 7 Northern wild monkshood (Aconitum noveboracense), western prairie fringed
orchid (Platanthera praeclara), Higgins eye pearlymussel (Lampsilis higginsii),
sheepnose mussel (Plethobasus cyphyus), spectaclecase (Cumberlandia
monodonta), eastern massasauga (Sistrurus catenatus), whooping crane (Grus
americana)

Environmental Impact Mitigation Needs of Future Port and Waterway Modernization Activities in the United States
U.S. Army Corps of Engineers 93 Institute for Water Resources
# of Species # of Species using
Freshwater
Aquatic/Riparian
Habitat
Name Animals Plants Total Animals Plants Total Names of Freshwater Aquatic/Riparian Habitat Species
Mississippi River
- Lock & Dam 8,
MN & WI
2 1 3 2 1 3 Northern wild monkshood (Aconitum noveboracense), Higgins eye
pearlymussel) (Lampsilis higginsii), eastern mMassasauga (Sistrurus catenatus)
Mississippi River
- Lock & Dam 7,
MN & WI
5 0 5 4 0 4 Higgins eye pearlymussel (Lampsilis higginsii), sheepnose mussel (Plethobasus
cyphyus), eastern massasauga (Sistrurus catenatus), whooping crane (Grus
americana)
Mississippi River
- Lock & Dam 6,
MN & WI
5 0 5 4 0 4 Higgins eye pearlymussel (Lampsilis higginsii), sheepnose mussel (Plethobasus
cyphyus), eastern massasauga (Sistrurus catenatus), whooping crane (Grus
americana)
Mississippi River
- Lock & Dam
5a, MN & WI
4 0 4 3 0 3 Higgins eye pearlymussel (Lampsilis higginsii), sheepnose mussel (Plethobasus
cyphyus), eastern massasauga (Sistrurus catenatus)
Mississippi River
- Lock & Dam 5,
MN & WI
4 0 4 3 0 3 Higgins eye pearlymussel (Lampsilis higginsii), sheepnose mussel (Plethobasus
cyphyus), eastern massasauga (Sistrurus catenatus)
Mississippi River
- Lock & Dam 4,
MN & WI
3 0 3 3 0 3 Higgins eye pearlymussel (Lampsilis higginsii), sheepnose mussel (Plethobasus
cyphyus), eastern massasauga (Sistrurus catenatus)
Mississippi River
- Lock & Dam 3,
MN & WI
4 2 6 4 1 5 Minnesota dwarf trout lily (Erythronium propullans), Higgins eye pearlymussel
(Lampsilis higginsii), snuffbox mussel (Epioblasma triquetra), spectaclecase
(Cumberlandia monodonta), eastern massasauga (Sistrurus catenatus)

Environmental Impact Mitigation Needs of Future Port and Waterway Modernization Activities in the United States
U.S. Army Corps of Engineers 94 Institute for Water Resources
# of Species # of Species using
Freshwater
Aquatic/Riparian
Habitat
Name Animals Plants Total Animals Plants Total Names of Freshwater Aquatic/Riparian Habitat Species
Mississippi River
- Lock & Dam 2,
MN & WI
5 1 6 5 0 5 Higgins eye pearlymussel (Lampsilis higginsii), sheepnose mussel (Plethobasus
cyphyus), snuffbox mussel (Epioblasma triquetra), spectaclecase (Cumberlandia
monodonta), winged mapleleaf (Quadrula fragosa)
Illinois River -
Lagrange Lock
& Dam, IL
2 3 5 2 2 4 Sheepnose mussel (Plethobasus cyphyus), decurrent false aster (Boltonia
decurrens), eastern prairie fringed orchid (Platanthera leucophaea), Indiana bat
(Myotis sodalis)
Illinois River -
Peoria Lock &
Dam, IL
1 3 4 1 3 4 Decurrent false aster (Boltonia decurrens), eastern prairie fringed orchid
(Platanthera leucophaea), lakeside daisy (Hymenoxys herbacea), Indiana bat
(Myotis sodalis)
Illinois River -
Starved Rock
Lock & Dam, IL
2 3 5 2 3 5 Decurrent false aster (Boltonia decurrens), leafy prairie-clover (Dalea foliosa),
eastern prairie fringed orchid (Platanthera leucophaea), sheepnose mussel
(Plethobasus cyphyus), Indiana bat (Myotis sodalis)
Illinois River -
Marseilles Lock
& Dam, IL
2 3 5 2 3 5 Decurrent false aster (Boltonia decurrens), leafy prairie-clover (Dalea foliosa),
eastern prairie fringed orchid (Platanthera leucophaea), sheepnose mussel
(Plethobasus cyphyus), Indiana bat (Myotis sodalis)
Illinois River -
Dresden Island
Lock & Dam, IL
5 4 9 5 3 8 Eastern prairie fringed orchid (Platanthera leucophaea), lakeside daisy
(Hymenoxys herbacea), leafy prairie-clover (Dalea foliosa), Hine's emerald
dragonfly (Somatochlora hineana), sheepnose mussel (Plethobasus cyphyus),
Spectaclecase mussel (Cumberlandia monodonta), eastern massasauga (Sistrurus
catenatus), Indiana bat (Myotis sodalis)

Environmental Impact Mitigation Needs of Future Port and Waterway Modernization Activities in the United States
U.S. Army Corps of Engineers 95 Institute for Water Resources
# of Species # of Species using
Freshwater
Aquatic/Riparian
Habitat
Name Animals Plants Total Animals Plants Total Names of Freshwater Aquatic/Riparian Habitat Species
Illinois River -
Brandon Road
Lock & Dam, IL
4 4 8 4 3 7 Leafy prairie-clover (Dalea foliosa), eastern prairie fringed orchid (Platanthera
leucophaea), lakeside daisy (Hymenoxys herbacea), Hine's emerald dragonfly
(Somatochlora hineana), spectaclecase (Cumberlandia monodonta), sheepnose
mussel (Plethobasus cyphyus), eastern massasauga (Sistrurus catenatus)
Illinois River -
Lockport Lock,
IL
4 4 8 4 3 7 Leafy prairie-clover (Dalea foliosa), eastern prairie fringed orchid (Platanthera
leucophaea), lakeside daisy (Hymenoxys herbacea), Hine's emerald dragonfly
(Somatochlora hineana), spectaclecase (Cumberlandia monodonta), sheepnose
mussel (Plethobasus cyphyus), eastern massasauga (Sistrurus catenatus)
1 Data were obtained from http://ecos.fws.gov/ecos/indexPublic.do and http://www.natureserve.org/explorer/.

Environmental Impact Mitigation Needs of Future Port and Waterway Modernization Activities in the United States
U.S. Army Corps of Engineers 96 Institute for Water Resources
Table A3.16. Nationally registered historic properties within 5 km of 20 top U. S. container
ports.1
Ports Number
Boston, MA 114
New York, NY and NJ 6
Philadelphia, PA 64
Wilmington, DE 51
Baltimore, MD 6
Norfolk, VA 1
Wilmington, NC 3
Charleston, SC 2
Savannah, GA 0
Jacksonville, FL 1
Port Everglades, FL 5
Miami, FL 45
Tampa, FL 31
Mobile, AL 56
New Orleans, LA 52
Houston, TX 1
Long Beach, CA 7
Los Angeles, CA 11
Oakland, CA 32
Tacoma, WA 50
1 Based on the National Register of Historic Places (http://nrhp.focus.nps.gov/natreg/docs/Download.html#spatial)

Environmental Impact Mitigation Needs of Future Port and Waterway Modernization Activities in the United States
U.S. Army Corps of Engineers 97 Institute for Water Resources
Appendix A4. Port EA, EIS, and Other Information Summaries.
Variable Port of Boston Container Terminal and Harbor
Scarce species
/ecosystem heritage in
vicinity
Endangered species, preserves, and wetlands. Federally protected species that occur at least
sometimes in the vicinity include North Atlantic right, fin, blue, humpback, sei, and sperm whales;
and loggerhead, Kemp’s ridley, leatherback and, rarely, green sea turtles.1
Important natural
resource use in vicinity
Commercial and recreational fisheries. Important species in the port vicinity include softshell
clams, blue mussels, razor clams, rock crabs, Jonah crabs, and American lobsters.1 The state
management area for lobster in the port vicinity ranked first in the state for coastal lobster harvest,
but lobster harvest has undergone significant decline throughout state waters.1 Commercial fishing
does not exist for finfish in the harbor area because of shipping traffic, but does exist for lobster.
Essential Fish Habitat is designated near the harbor for Atlantic sea scallop, Atlantic surf clam,
ocean quahog, longfin and shortfin squid, Atlantic cod, haddock, Atlantic halibut, two hake species,
four flounder species, blue fish, pollack and several other finfish species.1
Environmental quality of
water, sediment, and air.
Historically extensive beds of seagrass existed near the harbor before it became turbid with
suspended matter and phytoplankton generated largely by urban runoff. The Boston Harbor area
has undergone extensive water quality improvement since 1985. The turbidity and nutrient
concentrations in the harbor area have improved since relocation of treated wastewater outlets.
Oxygen concentration range from about 5mg/liter in the inner harbor to 8 mg/liter farther offshore.
Monitoring of channel dredging revealed no exceedence of water quality standards.2 However,
sediment toxicity to test organisms indicated a need for confined disposal of some sediment.2 The
area is considered to be in attainment with all national air quality standards with the exception of
CO and O3 for which it is designated as “maintenance” and “non-attainment,” respectively.1
Environmental justice The percentages of people that live below the poverty line and nonwhite minorities in the port
county are higher than the State average.1
Main channel length About 9 miles3.
Existing channel, basin
and berth information
The main channel is dredged to 40 feet.3The Port of Boston has one container terminal and a total of
2 berths totaling 2000 feet and maintained at 45 feet deep.4
Availability of sediment
disposal locations
Several dredge disposal and management options exist within and proximal to the harbor area,
including the Massachusetts Bay Disposal Site and several proposed habitat improvement sites.1
Port Capacity Container yard utilization is 31%, crane utilization is 22%, berth utilization (vessel calls) is 39%,
berth utilization (percent discharge/load) is 37%, and berth utilization (average vessel size) is 37%.4
Capacity of intermodal
transport links
Container terminal has direct access to interstate highway but no on-dock rail.4
Variable NY-NJ Container Port and Harbor
1 2008. Draft supplemental environmental impact statement, Federal deep draft navigation improvement project, Boston Harbor, MA, New England District, U. S.
rAmy Corps of Engineers, Boston, MA
2 2006. Final supplemental environmental impact statement for the Boston Harbor Inner Harbor maintenance dredging project. New England District, U. S. Army
Corps of Engineers, Boston, MA
3 Unpublished U. S. Army Corps of Engineers data
4 Smith, D. and K. Knight. 2012. Container port capacity study. Draft IWR Report, Institute for Water Resources. U. S. Army Corps of Engineers. Alexandria, VA

Environmental Impact Mitigation Needs of Future Port and Waterway Modernization Activities in the United States
U.S. Army Corps of Engineers 98 Institute for Water Resources
Scarce species
/ecosystem heritage in
vicinity
Species. Federally listed T & E and marine mammal species that may occur in the harbor area
include green, Kemp’s ridley, loggerhead, and leatherback sea turtles; northern Atlantic right ,
humback whale, and peregrine falcon, bald eagle, and least terns, shortnose sturgeon, and harbor
seals.5,6 The New Jersey state-listed yellow-crowned night heron also is present.5 Numerous
migratory birds use the area.
Important natural
resource use in vicinity
Sport and commercial fishing and bird watching. Finfish and shell fish species documented in the
area include striped bass, weakfish, winter flounder, summer flounder, Atlantic sea herring, bay
anchovies, menhaden, rainbow smelt, blue crabs, American oyster, and soft-shelled clam. The
harbor area provides Essential Fish Habitat for some of these and other species that may enter the
area.6 Many recreationally important waterfowl and shorebirds use the harbor area.
Environmental quality of
water, sediment, and air.
Deepening effect models indicate little change in oxygen, salinity, water temperature, and
hydrodynamics.7 Low species of benthic fauna indicates a stressful environment1. Sediments
generally are too contaminated with various heavy metals and organic compounds for ocean
disposal.8 The region was designated as a severe nonattainment area for ozone and a maintenance
area for carbon monoxide (CO). The ozone quantity applies to ozone precursors as well, which are
oxides of nitrogen (NOx) and volatile organic carbons (VOCs).7 Studies in 2004 found no
significant cumulative impact from deepening the harbor.7
Environmental justice No issues indicated.
Main channel length About 7.5 miles9.
Existing channel, basin
and berth information
The main channel is dredged to 50 feet.9 The Port of NY-NJ has six container terminals and a total
of 26 berths totaling 27,421 feet maintained at 35 to 50 feet deep10.
Availability of sediment
disposal locations
Various upland, island, and subaqueous sites were identified as available for confined disposal.5
Port Capacity Container yard utilization is 75 %, crane utilization is 36%, berth utilization (vessel calls) is 45 %,
berth utilization (percent discharge/load) is 53%, and berth utilization (average vessel size) is 45%.10
Capacity of intermodal
transport links
Some container terminals have direct access to interstate highway and 2 terminals have on-dock
rail.10
5 New York District, Army Corps of Engineers. 1997. Kill Van Kull-Newark Bay Channels phase II deepening project. Final environmental
assessment. New York, NY 6 New York District, Army Corps of Engineers. 2005. Essential fish habitat assessment for Newark bay maintenance dredging; Newark Bay—Port Newark Channel, Port Newark Pierhead Channel & Port Elisabeth Channel of Newark Bay, Hackensack & Passaic rivers Federal Navigation
Project. New York, NY 7 New York District, Army Corps of Engineers. 2004. Environmental Assessment on Consolidated Implementation of the
New York and New Jersey Harbor Deepening Project. New York, NY 8 Stern et al. 1998. Processing contaminated dredged material from the Port of New York-New Jersey. Estuaries 21:646-651. 9 Unpublished U. S. Army Corps of Engineers data 10 Smith, D. and K. Knight. 2012. Container port capacity study. Draft IWR Report, Institute for Water Resources. U. S. Army Corps of
Engineers. Alexandria, VA

Environmental Impact Mitigation Needs of Future Port and Waterway Modernization Activities in the United States
U.S. Army Corps of Engineers 99 Institute for Water Resources
Variable Philadelphia and Wilmington Container Ports and Harbors
Scarce species
/ecosystem heritage in
vicinity
Species, preserves, and wetlands. Federally-protected species observed along the federal navigation
channel include: Kemp’s Ridley, green, hawksbill, leatherback, and loggerhead sea turtles 11,12 ; fin,
right, and humpback whales; shortnose sturgeon and Atlantic sturgeon13; bald eagle and peregrine
falcon; and Virginia jointvetch14. New Jersey protects great blue heron, northern harrier, pied-billed
grebe, and osprey1. Some concern exists about freshwater mussels and American eels15. Possible
adverse effects of blasting would be coordinated with NOAA Fisheries11, monitored and mitigated.
Channel deepening is among factors expected to alter inland extent of saline water migration from
Delaware Bay under conditions of drought and sea-level rise11. Hydrologic simulations indicate that
increases in sea levels and deepening of the navigation channel will contribute to small increases in
salinity, but have an insignificant impact on freshwater mussels15.
Important natural
resource use in vicinity
Sport and commercial fishing and wildlife-based recreation. Delaware Bay is a key stopover location
for migratory shorebirds between April and June.11 The Delaware River and Bay are essential fish
habitat for federally-managed fish species.15 Dredging-caused injury is expected to be minimal.15
Environmental quality of
water, sediment, and air.
Sediment contaminants in the Delaware River could cause adverse biological effects and poor benthic
habitat6. Mercury, zinc, phenanthrene and total PCBs exceed “effects range median” concentrations.16
Various metals exceed “effects range low”17 concentrations. A deepening project is expected to
exceed annual emission thresholds for only NOx during every year over the project’s duration.
Requirements could be met by pre-construction acquisition of Emission Reduction Credits.18
Environmental justice No environmental justice issues identified
Main channel length About 107 miles19
Existing channel, basin
and berth information
The main channel is 40 feet deep (mean low water) and averages 400 feet wide.19 Two terminals
(Philadelphia and Wilmington) have five container port berths totaling 5,300 feet long and ranging
between 38 and 40 feet deep.20
Availability of sediment
disposal locations
Seven existing federally-owned confined disposal facilities will satisfy sediment management needs
during the 50-year project lifecycle11,15. Some sediment can be used for wetland and beach habitat
restoration and creation at Kelly Island and Broadkill Beach in Delaware.
Port Capacity Container yard utilization is 68%, Crane utilization is 29%, berth utilization (vessel calls )is 30%,
berth utilization (percent discharge/load) is 46% , and berth utilization (average vessel size) is 40%.20
Capacity of intermodal
transport links
There is no on-dock rail but good interstate highway connections.20
Variable Baltimore Container Ports and Harbor
Scarce species Species. No federally protected species were known to inhabit the inner harbor area in 199721.
11 1997.USACE. Delaware River Main Channel Deepening Project. Supplemental Environmental Impact Statement. Philadelphia, Pennsylvania. 12 Northwestern Distinct Population Segment of loggerhead sea turtle population listed as threatened per 58868 Federal Register / Vol. 76, No.
184 / Thursday, September 22, 2011. Rules and Regulations 13 New York Bight Distinct Population Segment of Atlantic sturgeon listed as endangered per 5880 Federal Register / Vol. 77, No. 24 / Monday,
February 6, 2012 / Rules and Regulations 14 Reported in the 1997 EIS as “Sensitive Joint-Vetch (Asechynomene verginica)” 15 2011. USACE. Final Environmental Assessment, Delaware Main Channel Deepening Project. Philadelphia, PA 16 2005. Versar, Inc., Delaware River, Philadelphia, Pennsylvania to New Castle, Delaware Chemical Analysis of Dredged River Sediments.
Columbia, Maryland. 17 As described by USEPA (after Long et. al., 1995). 18 2009. USACE. Clean Air Act Final Statement of Conformity, Delaware River Main Channel Deepening Project. Philadelphia, PA. 19 Unpublished U. S. Army Corp of Engineers data 20 Smith, D. and K. Knight. 2012. Container port capacity study. Draft IWR Report, Institute for Water Resources. U. S. Army Corps of
Engineers. Alexandria, VA

Environmental Impact Mitigation Needs of Future Port and Waterway Modernization Activities in the United States
U.S. Army Corps of Engineers 100 Institute for Water Resources
/ecosystem heritage in
vicinity
However, loggerhead, Kemp’s ridley, leatherback and, green sea turtles enter Chesapeake Bay.
Important natural
resource use in vicinity
Commercial and recreational fisheries. Important species in the port vicinity include softshell
clams, blue mussels, razor clams, rock crabs, Jonah crabs, and American lobsters.21 The state
management area for lobster in the port vicinity ranked first in the state for coastal lobster harvest,
but lobster harvest has undergone significant decline throughout state waters.21 Commercial fishing
does not exist for finfish in the harbor area because of shipping traffic, but does exist for lobster.
Essential Fish Habitat is designated near the harbor for Atlantic sea scallop, Atlantic surf clam,
ocean quahog, longfin and shortfin squid, Atlantic cod, haddock, Atlantic halibut, two hake species,
four flounder species, blue fish, pollack and several other finfish species. 21
Environmental quality of
water, sediment, and air.
The water quality in the harbor vicinity was poor in 1997, being impacted by the heavy volume of
urban runoff in combination with industrial and commercial discharges21 (no recent EIS data).
Turbidity and nutrient levels are relatively high and algae blooms are frequent. Dissolved oxygen
frequently fell to less than 2 mg/1iter below the pycnocline during summer.21 Studies indicate that
sediments in some areas of Baltimore Harbor exhibited toxic characteristics in the1990s (no recent
EIS data), and sediment toxicity in tributary creeks and bays is patchy and the benthic fauna was
clearly depauperate in those areas.
Environmental justice No issues indicated.
Main channel length About 87 miles.22
Existing channel, basin
and berth information
The main channel is dredged to 50 feet.22 The Port of Baltimore has two container terminals and a
total of 10 berths totaling 8,815 feet maintained at 42 to 50 feet deep.23
Availability of sediment
disposal locations
Disposal was a problem in 1997.21 Poplar Island was proposed to contain 38 million cubic yards of
uncontaminated sediment placed over 25 years and has become a large contained disposal area
about as proposed. Other sites were identified as well.21
Port Capacity Container yard utilization is 23 %, crane utilization is 18%, berth utilization (vessel calls) is 21%,
berth utilization (percent discharge/load) is 60%, and berth utilization (average vessel size) is 14%.23
Capacity of intermodal
transport links
Container terminals have direct access to interstate highway and one terminal with on-dock rail.23
21 1997 Baltimore Harbor Anchorages and Channels, Maryland and Virginia Integrated Feasibility Report and Environmental Impact Statement.
Baltimore District, U. S. Army Corps of Engineers, Baltimore, MD 22 Unpublished U. S. Army Corps of Engineers data 23 Smith, D. and K. Knight. 2012. Container port capacity study. Draft IWR Report, Institute for Water Resources. U. S. Army Corps of
Engineers. Alexandria, VA

Environmental Impact Mitigation Needs of Future Port and Waterway Modernization Activities in the United States
U.S. Army Corps of Engineers 101 Institute for Water Resources
Variable Virginia Container Port and Harbor
Scarce species
/ecosystem heritage in
vicinity
Endangered species and preserves. Federally protected species include loggerhead, Kemp’s ridley,
leatherback, Atlantic hawksbill, and green sea turtles, and northern diamond-backed terrapin; Atlantic
bottlenose dolphin and North Atlantic right whale; piping plover, least tern, black-necked stilt,
Wilson’s plover, yellow-crowned night heron, great blue heron, green heron, bald eagle, and
peregrine falcon24. Virginia protected Atlantic sturgeon are nearby24 , as are national wildlife refuges
and state natural areas. Nearby shallow water and wetland habitats are expected to be impacted.24,25
Important natural
resource use in vicinity
Habitats in the harbor has been designated Essential Fish Habitat for windowpane flounder, bluefish,
Atlantic butterfish, summer founder, black sea bass, king mackerel, Spanish mackerel, cobia, red
drum, dusky shark, sandbar shark, little skate, winter skate, and clear nose skate.24 The National
Marine Fisheries Service has designated an area in the harbor as Habitat of Particular Concern for the
sandbar shark. Blue crab sanctuaries also exist in nearby tidally-influenced waters. Species of
commercial interest include hard shell clams, oysters, and blue crab. There are three nearby state
wildlife management areas (Ragged Island, Princess Anne, and Hog Island).24
Environmental quality of
water, sediment, and air.
The water quality entering southern Chesapeake Bay from western tributaries has been characterized
as poor to fair with the Elizabeth River characterized as one of the most impacted in the Chesapeake
Bay Watershed and not suitable for supporting uncontaminated shellfish beds26. Leaking storage
tanks and other discharges of hazardous substances are reported in the general area. 24 Sediment
contaminants include various heavy metals and organic compounds, and PCBs occur in fish
tissue.24,25,27 As reported in the 2006 EIS, The Hampton Roads Air Quality Control Region has been
in general compliance with the NAAQS for all criteria pollutants.28 Although during the 1990s, the
area had been characterized as a marginal non-attainment area with respect to the 1-hour ozone
standard. Expanded port facilities are not to incur addition adverse air quality impacts.24
Environmental justice No environmental justice issues were identified. 24
Main channel length About 22 miles.29
Existing channel, basin
and berth information
The main channel is 50 feet deep and the width averages 1500 feet. 29 There are 10 berths totaling
11,460 feet at 3 terminals.30 Berth depths range from 43 to 49 feet.30
Availability of sediment
disposal locations
Dredge disposal options include the Norfolk Ocean Disposal Site, the Craney Island Dredged
Material Management Area (with expansion options, and beneficial use for beach sand.31
Port Capacity Container yard utilization is 83%, crane utilization is 30%, berth utilization (vessel calls) is 67%,
berth utilization (percent discharge/load) is 28%, and berth utilization (average vessel size) is 83%.30
Capacity of intermodal
transport links The Port of Virginia is served by 3 railroads and two terminals have on-dock rail.30 There is direct
access to federal and state highways.24
Variable Wilmington, NC Container Port and Harbor
Scarce species Sea turtles (green, hawksbill, Kemp’s ridley, leatherback, and loggerhead sea turtles); Atlantic
242006.USACE. Final Environmental Impacts Statement, Craney Island Expansion, Norfolk Harbor And Channels, Virginia. Norfolk, VA. 25 2009. Craney Island Design Partners. Wetland Mitigation Candidate Site Evaluation Report. Norfolk, VA. 26 EPA-842-R-10-003 27 2008. Malcom Pirnie, Inc. for USACE. Final Data Characterization Report for the Pre-Drainage Area, Craney Island Eastward Expansion.
White Plains, NY. 28 2009. USACE. Environmental Assessment, Supplemental Information to the Final Environmental Impacts Statement for the Craney Island
Eastward Expansion, Norfolk Harbor and Channels, Hampton, Roads, Virginia. Norfolk, VA. 29 Unpublished USACE database 30 Smith, D. and K. Knight. 2010. Container port capacity study. Draft IWR Report, Institute for Water Resources. U. S. Army Corps of
Engineers. Alexandria, VA 31 2006. USACE. Virginia Beach Hurricane Protection Project, Environmental Assessment. Norfolk, VA.

Environmental Impact Mitigation Needs of Future Port and Waterway Modernization Activities in the United States
U.S. Army Corps of Engineers 102 Institute for Water Resources
/ecosystem heritage in
vicinity
sturgeon, shortnose sturgeon; West Indian manatee; piping plover (for which monitoring plans
associated with beach-placement of dredged material exist32); woodstork; red cockaded
woodpecker; colonial water birds, and the plants, Seabeach amaranth; Cooley’s meadowrue; and
rough-leaved loosestrife33,34,35,36 are among federally-protected species reported at/near Brunswick
and New Hanover counties in North Carolina.37
Important natural
resource use in vicinity
The water column, substrate, vegetation, and associated habitat in/proximal to Wilmington Harbor
and its navigation channel have been designated essential fish habitat for a variety of shark species,
snapper-grouper complex, penaeid shrimp, spiny lobster, and other coastal migratory pelagic
species38.
Environmental quality of
sediment, water and air.
The Cape Fear River has elevated nitrate and low dissolved oxygen concentrations. The river is also
known to experience periodic cyanobacteria blooms.39 Dredged sediments disposed of in off-shore
dredged material disposal sites are free of detectible contaminants except for some metals with
concentrations less than that of natural sediments next to the off-shore dredged material disposal
sites. 40,41
Environmental justice No issues identified.
Main channel length About 26 miles.42
Existing channel, basin
and berth information
Main channel is 42 feet deep.42 One multipurpose terminal with three berths near the container yard,
each 42 feet deep and totaling 2633 feet.43
Availability of sediment
disposal locations
Placement of dredged material on approximately 14-miles of beaches is reported as associated with
the Wilmington Harbor deepening project.33 An active off-shore dredged material disposal site is
located near the ocean end of the navigation channel.40,41
Port Capacity Based on total container freight processing, 30.7% capacity.43
Capacity of intermodal
transport links
Interstate highway access.
Variable Charleston Container Port and Harbor
Scarce species
/ecosystem heritage in
Species and wetlands. Federally protected species include shortnose sturgeon; green, leatherback,
Kemp’s Ridley, hawksbill, and loggerhead sea turtles; and North Atlantic right, blue, finback, sei,
32 http://www.frf.usace.army.mil/capefear/mon_birds.stm 33 http://ecos.fws.gov/tess_public/countySearch!speciesByCountyReport.action?fips=37019 34 http://www.nmfs.noaa.gov/pr/pdfs/recovery/sturgeon_shortnose.pdf 35 http://www.nmfs.noaa.gov/pr/pdfs/species/atlanticsturgeon_carolina_dps.pdf 36 http://ecos.fws.gov/tess_public/countySearch!speciesByCountyReport.action?fips=37129 37 Deaton, A.S., W.S. Chappell, K. Hart, J. O‘Neal, B. Boutin. 2010. North Carolina Coastal Habitat Protection Plan. North Carolina Department
of Environment and Natural Resources. Division of Marine Fisheries, NC. 639 pp.
38 http://sharpfin.nmfs.noaa.gov/website/EFH_Mapper/EFH_Report.htm 39 2011. Mallin, Michael A., M.R.McIver, and J.F.Merritt. Environmental Assessment of the Lower Cape Fear River System: CMS Report No. 11-
02. University of North Carolina Wilmington, Center for Marine Science. Wilmington, NC. 40 2010. U.S. EPA. Wilmington ODMDS – Close-Out, May 2010. U.S. Environmental Protection Agency, Region 4, Water Protection Division,
Wetlands, Coastal & Oceans Branch, Wetlands & Marine Regulatory Section, SNAFC, 61 Forsyth St. SW, Atlanta, GA 30303. 41 2010. U.S. EPA. New Wilmington ODMDS - Status and Trends, May 2010. U.S. Environmental Protection Agency, Region 4, Water Protection
Division, Wetlands, Coastal & Oceans Branch, Wetlands & Marine Regulatory Section, SNAFC, 61 Forsyth St. SW, Atlanta, GA 30303. 42 Unpublished U. S. Army Corps of Engineers database 43 Smith, D. and K. Knight. 2010. Container port capacity study. Draft IWR Report, Institute for Water Resources. U. S. Army Corps of
Engineers. Alexandria, VA

Environmental Impact Mitigation Needs of Future Port and Waterway Modernization Activities in the United States
U.S. Army Corps of Engineers 103 Institute for Water Resources
vicinity sperm and humpback whales; West Indian manatee; and woodstork, piping plover, gull-billed tern,
and red knot. 44 A variety of other endangered bird, plant and reptile species inhabit rural upland
areas that are less likely to be impacted. The harbor area is fringed with tidal low and high estuarine
wetlands and tidal creeks.44 There is potential for erosion of an existing bird nesting island in
Charleston Harbor resulting from a deeper/wider channel and larger ships calling on the port.
Important natural
resource use in vicinity
Fisheries and Potable water. The estuary supports large populations of penaeid shrimp and blue
crabs. Fish of commercial or recreational value are commonly found in Charleston Harbor,
including flounder, red drum, spotted seatrout, bluefish, spot, black drum, and striped bass. All of
Charleston Harbor’s tidally influenced reaches and adjacent wetlands are considered Essential Fish
Habitat as defined by NOAA.44
Environmental quality of
water, sediment, and air
The Charleston Harbor system is not considered to be impaired under criteria of Section 303(d) of
the Clean Water Act except near Shem Creek, at the Ft. Johnson pier, and in the Navy Yard Reach
of Cooper River.1 Much of the system does not meet the applicable water quality standard for
dissolved oxygen for significant periods of time and, therefore, is considered water quality limited
for the purposes of wasteload allocation.44 Salinity intrusion to the estuary can cause periodic
increases in chloride concentration above acceptable limits at a freshwater supply reservoir.1
Hazardous and toxic material is not present in the sediments. 45 EPA approved dredged material
from all sites for ocean disposal except one in 1995.46 The adverse water quality effects of dredging
would likely be short term.44 Since the channel is located near the center of the river, deepening
the channel is not expected to have a significant impact on wetlands and marsh. 46 The region was
in attainment of all National Ambient Air Quality Standards in November 2011.44 Periodic
maintenance will result in the temporary removal of benthic infauna and epifauna and temporary
and minor change in air quality.44 Charleston Harbor has the typical noise characteristics of a busy
harbor.44
Environmental Justice USACE is committed to the principles of environmental justice. 44
Main channel length About 38.6 miles.47
Existing channel, basin
and berth information
The main channel depth is 45 feet deep and 800 to 1000 feet wide.47 There are 9 berths at three
terminals totaling 7,940 feet. All berths are 42 feet deep.48
Availability sediment
disposal locations
There is an inland containment site, ocean deposition site44, and potential for beneficial use of
dredged material for bird habitat creation, marsh creation, or beach nourishment.
Port Capacity Container yard utilization is 25%, crane utilization is 35%, berth utilization (vessel calls) is 85%,
berth use (percent discharge/load) is 28%, and berth utilization (average vessel size) is 119%.48
Capacity of intermodal
transport links
The port has two on-dock rail intermodal terminals and direct connection to interstate highways.48 If
freight processing increases significantly there is potential for substantially increased truck traffic
entering and leaving port terminals and resulting congestion and degraded air quality45.
Variable Savannah Container Port and Harbor
44 U. S. Army Corps of Engineers, Charleston District. 2011. Charleston Harbor general reevaluation report Daniel Island reach turning basin.
Charleston, SC 45 U. S. Army Corps of Engineers, Charleston District. 2006. Final environmental impact statement: Proposed marine container terminal at the
Charleston Naval Complex. North Charleston, SC 46 U. S. Army Corps of Engineers. 1996. Environmental assessment: Charleston Harbor deepening and widening, Charleston, SC 47 Unpublished U. S. Army Corps of Engineers database.
48 Smith, D. and K. Knight. 2012. Container port capacity study. Draft IWR Report, Institute for Water Resources. U. S. Army Corps of
Engineers. Alexandria, VA

Environmental Impact Mitigation Needs of Future Port and Waterway Modernization Activities in the United States
U.S. Army Corps of Engineers 104 Institute for Water Resources
Scarce species
/ecosystem heritage in
vicinity
Species, preserves and wetlands. Federally protected species include shortnose sturgeon and
Atlantic sturgeon; green, leatherback, Kemp’s Ridley, hawksbill, and loggerhead sea turtles, and
North Atlantic right and humpback whales49. Extensive wetlands are adjacent to the port including
wetlands on the Savannah National Wildlife Refuge1. Dredging will reduce sturgeon habitat in the
Savannah River. Channel deepening could increase salt water intrusion that would threaten
sturgeon habitat and estuarine wetlands.49 A loss of 233 acres of freshwater wetlands and 15.6 of
salt marsh wetlands is expected from deepening 5 feet. To mitigate, river and ocean flows into the
estuary would be rerouted to sustain the historic salinity.49 Deepened channel waters would be
aerated to sustain oxygen for sturgeon and other species49. A fish passage bypass is planned for
sturgeon to establish in the area 20 miles above the New Savannah Bluff Lock and Dam.49
Important natural
resource use in vicinity
Sport and commercial fishing. There is a potential loss of habitat for striped bass adults, spawning,
habitat and juveniles. Proposed mitigation is provided by a bypass around New Savannah Bluff
Lock and Dam and by channel aeration and flow modification. Important shrimp and crab fisheries
occur in the estuary, but there is no indication of a significant impact by harbor development.
Weakfish, spotted sea trout, and, black drum spawning in the lower estuary may be adversely
effected.49 The historic district of Savannah (one of largest National Historic Landmark Districts) is
several miles from the port and channel.49
Environmental quality of
water, sediment, and air.
The city drinking water could be influenced by increased saltwater intrusion without the planned
mitigation (see species and ecosystems).49 Sediments at certain sites are contaminated naturally
with high levels of cadmium. Contaminated sediment will be consolidated and disposed of in an
EPA approved upland contained site that is capped with a sealing layer49. Outer harbor sediments
are uncontaminated sands that can be dumped in ocean sites. 49 To prevent nonnative species
introduction, all ballast water of ships entering the port will be exchanged in mid-ocean or treated
with a Coast Guard approved method1. No air quality issues were evident in the EIS.49 No erosion
is expected from ships1. The analysis did not identify any significant adverse impacts of vessels to
air quality that would result from implementation of the proposed harbor deepening alternatives.49
Environmental Justice Not addressed directly, but the district is committed to USACE policy. 49
Main channel length About 32 miles.50
Existing channel, basin
and berth information
The main channel is 42 feet deep and 500 feet wide (average).50 The terminal operates nine
container berths with 9,693 feet of berth, all 42 feet deep.51
Availability of sediment
disposal locations
Acceptable confined upland sites are available close to and along the inner harbor channel and
basins and EPA accepted ocean sites are available close to and along the outer harbor.49
Port capacity Container yard utilization is 36%, crane utilization is 45%, berth utilization (vessel calls) is77%,
berth utilization (percent discharge/load) is 34%, and berth utilization (average vessel size) is 97%.51
Capacity of intermodal
transport links
The port includes two on-dock rail intermodal terminals51 and direct access to the interstate highway
system.
Variable Jacksonville Container Port and Harbor
Scarce species
/ecosystem heritage in
Endangered species. Federally protected species include West Indian manatee and North Atlantic
right whale; green, loggerhead, leatherback, and Kemp’s Ridley sea turtles; smalltooth sawfish and;
49 Savannah District Corps of Engineers. 2011. Draft tier II environmental impact statement for the Savannah Harbor expansion: Chatham
County, Georgia and Jasper County, South Carolina. 50 Unpublished U. S. Army Corps of Engineers database
51 Smith, D. and K. Knight. 2010. Container port capacity study. Draft IWR Report, Institute for Water Resources. U. S. Army Corps of
Engineers. Alexandria, VA

Environmental Impact Mitigation Needs of Future Port and Waterway Modernization Activities in the United States
U.S. Army Corps of Engineers 105 Institute for Water Resources
vicinity short-nosed sturgeon; piping plover (critical habitat is located less than 3-miles north of the navigation
channel and wood stork.52
Important natural
resource use in vicinity
The South Atlantic Fishery Management Council (SAFMC) has designated much of the habitat in or
near the harbor as Essential Fish Habitat for brown, pink, and white shrimp; black seabass; gag;
crevalle jack; spotted sea trout; weakfish; gray snapper; Atlantic spadefish; sheepshead; red and black
drum; and associated prey fish. The Lower Saint Johns River, intersecting Intracoastal Waterway and
adjacent lands experience high recreational boating, fishing, and land-based activities.52
Environmental quality of
water, sediment, and air.
Sediment in and near the navigation channel is characterized as unconsolidated sand, silt, clay and
shell and is generally characterized as being of good quality and supportive of good benthic habitat53.
Environmental justice No environmental justice concerns have been identified.
Main channel length About 30 miles.54,55
Existing channel, basin
and berth information
The Port of Jacksonville includes 3 terminals with 11 berths totaling 9,850 feet long and ranging from
38 to 40 feet deep.56 Authorized to a depth of 40 feet, the main channel is subject to ebb tide
restrictions on vessels entering and leaving with fresh-water drafts exceeding 33 feet and 36 feet
respectively.55 There are cross-currents, sharp turns, and rock formations along the main channel.55
Availability of sediment
disposal locations
In addition to several dredge disposal sites located along the Saint Johns River, there are two near
shore (pipeline and barge) disposal sites located along the Atlantic shoreline south of the channel
inlet57. Beach-placement of suitable sand material from the navigation channel is consistent with
authorized shore protection plans.58
Port Capacity Container yard utilization is 24%, crane utilization is 17%, berth utilization (vessel calls) is 39%, berth
utilization (percent discharge/load) is 22%, and berth utilization (average vessel size) is 39%.56
Capacity of intermodal
transport links
Interstate connections. On-dock rail exists at one terminal and is being developed at another with
connections to main railroad lines.56,59
52 2012. USACE. Jacksonville Harbor (Mile Point) Navigation Study, Duval County, Final Integrated Feasibility Report and Environmental
Assessment. Jacksonville, FL. 53 EPA-842-R-10-003 54 Unpublished U. S. Army database 55 http://www.jaxport.com/cargo/facilities/technical-info 56 Smith, D. and K. Knight. 2012. Container port capacity study. Draft IWR Report, Institute for Water Resources. U. S. Army Corps of
Engineers. Alexandria, VA 57 2011.USACE. Draft Supplemental Environmental Assessment, Maintenance Dredging, Jacksonville Harbor, Duval County, Florida.
Jacksonville, FL. 58 2002. USACE. Jacksonville Harbor Duval County, Florida, Navigation Study Final General Reevaluation Report and Environmental
Assessment. Jacksonville, FL. 59 http://www.jaxport.com/cargo/facilities/expansion-plans

Environmental Impact Mitigation Needs of Future Port and Waterway Modernization Activities in the United States
U.S. Army Corps of Engineers 106 Institute for Water Resources
Variable Port Everglades Container Port and Harbor
Scarce species
/ecosystem heritage in
vicinity
Species, preserves, and wetlands. Protected species include West Indian manatee; loggerhead,
green, leatherback, and hawksbill sea turtles.60 finback, humpback, northern right, sei, and sperm
whales; southeastern American kestrel, eastern brown pelican, least tern, little blue heron, snowy
egret, tri-colored heron, roseate spoonbill, osprey, sanderlings, ruddy turnstones, royal terns, ring-
billed gulls, laughing gulls, and herring gulls; elkhorn and staghorn coral; and mangrove trees.
Critical habitat for elkhorn and staghorn corals has been established east of the port.61 Reef flats and
communities occur near the port and its channels.62
Important natural
resource use in vicinity
Commercial fishing, sportfishing and water and beach recreation. The coastal lands and waters
adjacent to Port Everglades support a variety of natural-resource-based activities including sun
bathing, sportfishing, swimming, skin and SCUBA diving, surfing, and boating (private and
chartered).62 Important fish in the port vicinity include spiny lobster, pink shrimp, common snook
(state-listed as of special concern), various snappers and groupers, king and spanish mackerel.62
Nearby habitats have been designated as Essential Fish Habitat (EFH) by NOAA and as EFH-
Habitat Areas of Particular Concern by the South Atlantic Fisheries Management Council. 62
Environmental quality of
water, sediment, and air
Water quality of the area has been designated as suitable for recreation, fish and wildlife, although
some pesticide contamination in the port appears to come from runoff62. Placement of dredged
material associated with maintenance of authorized depths is expected to result in temporary
changes in turbidity and bottom fauna. Expansion would increase the spatial extent of deep water
and could increase impacts associated with additional maintenance dredging. Sediment
contamination seems not to be a concern in a 2003 EA, which indicated suitability for beach
disposal. 62 No air quality permits were required for maintenance dredging in 2003.62
Environmental Justice No indication of environmental justice issues.
Main channel length. About 4 miles.63
Existing channel, basin
and berth information
Main channel depth is 42 feet and the width averages 686 feet. 63 Turning basins are 750 by 1000
feet and 34 to 37 feet deep.62 Port Everglades container terminals have 11 berths totally 7,345 feet
and 43 feet deep (there are numerous other berths for other forms of shipment).64
Availability of sediment
disposal locations
Disposal options include a ten-acre section near the entrance channel, a 251-acre barrier island
immediately south of the entrance channel’s south jetty; and an Ocean Dredged Material Disposal
Site located about 4.5 nautical miles from the port.62
Port Capacity Container yard utilization is 42%, Crane utilization is 49%, berth utilization (vessel calls ) is 44%,
berth utilization (percent discharge/load) is 46%, and berth utilization (average vessel size) is 61%.64
Capacity of intermodal
transport links
While Port Everglades is within 2-miles of a Florida East Coast Railway hub3 it does not have on-
dock rail but is planned.64 Interstate access is good.
Variable Miami Container Port and Harbor
Scarce species Protected species, preserves, and wetlands. Protected species in the vicinity include West Indian
60 Nesting season for sea turtles as defined by Florida Fish and Wildlife Conservation Commission is between 1-March and 31-October in
Broward County. 61 Critical habitat for elkhorn and staghorn corals as announced per 72210 Federal Register / Vol. 73, No. 229 / Wednesday, November 26, 2008 /
Rules and Regulations 2005. 62 USACE. Maintenance Dredging, Port Everglades, Broward County, Florida Final Environmental Assessment and Finding of No Significant
Impact 63 Unpublished USACE database 64 Smith, D. and K. Knight. 2012. Container port capacity study. Draft IWR Report, Institute for Water Resources. U. S. Army Corps of
Engineers. Alexandria, VA

Environmental Impact Mitigation Needs of Future Port and Waterway Modernization Activities in the United States
U.S. Army Corps of Engineers 107 Institute for Water Resources
/ecosystem heritage in
vicinity
manatee; hawksbill, green, Kemp’s ridley, leatherback, and loggerhead sea turtles; fin, humpback,
North Atlantic right, sei, and sperm whales; bottlenose dolphin; smalltooth sawfish; elkhorn and
staghorn corals; osprey, reddish egret, piping plover, southeastern American kestrel, white-crowned
pigeon, and woodstork; American crocodile and eastern indigo snake; Schaus swallowtail butterfly;
and Key Largo woodrat and Key Largo cotton mouse.65,66 All waters of Miami-Dade County are
designated critical habitat for the West Indian Manatee, and much of northern Biscayne Bay has been
designated as critical habitat for Johnson’s seagrass. Critical habitat for elkhorn and staghorn coral is
about 6 miles east of the port. The port is in an area designated by Florida as the Biscayne Bay
Aquatic Preserve.66 Less than 0.5 mile south of the port is the Bill Sadowski Critical Wildlife Area.67
Biscayne Bay National Park and the Florida Keys National Marine Sanctuary are about 8 miles south
of the port. Recommended modifications to the entrance channel and harbor65 are expected to affect
about 419 acres of coastal habitat for which mitigation plans have been developed or recommended.68
Blasting, which is claimed to be the most environmentally compatible method for excavating rock,
would injure or kill species in the immediate vicinity and could adversely affect the behavior of other
species.67 Blast-related safety-zone requirements for manatees and whales were identified.67
Important natural
resource use in vicinity
Fisheries and recreation. Nearshore habitats near the navigation channel have been designated by
NOAA as Essential Fish Habitat (EFH).67 Hard-bottom areas are designated as EFH-Habitat Areas of
Particular Concern by the South Atlantic Fisheries Management Council. Biscayne Bay is designated
as an Outstanding Florida Water in the Florida Administrative Code.
Environmental quality of,
water, sediment, and air.
Port waters are characterized as generally good quality with some problems in northern Biscayne
Bay.67Sediments are characterized as generally free of objectionable levels of contaminants and
appropriate for ocean disposal, with 70 % no more than “slightly" toxic, and less than 6 % having
“high" toxicity.67
Environmental justice. Land adjacent to the port is generally characterized by a combination of low, medium, and high-
density residential, commercial, office, and park/recreation uses.67
Main channel length About 13 miles.69
Existing channel, basin
and berth information
Main channel width averages 575 feet and is 50 feet deep.69 Other channel range from 35 to 44 feet
deep with widths ranging from 400 to 900 feet.67 The 4 existing turning basins are 32 to 42 feet deep
with radii from 600 to 900 feet.67 Five container berths are all 42 feet deep and total 5,000 feet.70
Availability of sediment
disposal locations
Disposal sites for dredged sediment and rock include a sea grass mitigation area 3 miles north of the
port, 2 permitted artificial reef areas 3 miles east and 4 miles east-southeast of the port, the Virginia
Key Confined Disposal Facility about 1 mile south of the port, and the Offshore Dredged Material
Disposal Site about 6 miles east-southeast of the port.67
Port Capacity Container yard utilization is 72%, crane utilization is 53%, berth utilization (vessel calls ) is 31%,
berth utilization (percent discharge/load) is 25% , and berth utilization (average vessel size) is 71%.70
Capacity of intermodal
transport links
The port has no on-dock rail.70 Access to the Port is via Port Boulevard which runs through the city
of Miami. A major project is being advanced to develop a tunnel that would route port traffic around
the city to US 41 and I-395.67
Variable Tampa Container Port and Harbor
Scarce species /ecosystem Species, Preserves, and wetlands. Federally protected species in the port vicinity include green,
hawksbill, Kemp’s ridley, loggerhead, and leatherback sea turtles; West Indian manatee and blue, fin,
65 http://www.nps.gov/bisc/naturescience/threatened-and-endangered-animals.htm 66 Chapter 258.397, Florida Statutes 67 2004. USACE. Miami Harbor General Reevaluation Report Study Final Environmental Impact Statement. Jacksonville, FL 68 2004. USACE. Miami Harbor General Reevaluation Report Study Final Environmental Impact Statement Revised Mitigation Plan.
Jacksonville, FL 69 Unpublished USACE database 70 Smith, D. and K. Knight. 2012. Container port capacity study. Draft IWR Report, Institute for Water Resources. U. S. Army Corps of
Engineers. Alexandria, VA

Environmental Impact Mitigation Needs of Future Port and Waterway Modernization Activities in the United States
U.S. Army Corps of Engineers 108 Institute for Water Resources
heritage in vicinity sei, humpback, and sperm whales; piping plover; wood stork; Florida scrub-jay; red-cockaded
woodpecker; Gulf sturgeon and smalltooth sawfish; and Florida golden aster.71 Critical habitat for
manatees and piping plover are established in Tampa Bay72 where the plovers forage 73 on various
invertebrates species.74 Loggerhead sea-turtles frequently nest in Tampa Bay area and other sea turtle
species occasionally nest there.71 Nine nesting colonies of wood storks are within a 15miles of the
harbor. National, state, and local wildlife refuges, preserves, and management areas are neaby.71
Important natural resource
use in vicinity
Commercial and sportfishing and water-based recreation. The region is a major tourist destination
valued for sightseeing, swimming, fishing, scuba diving, and boating.71 The Gulf of Mexico
Fisheries Management Council (GMFMC) habitat in the vicinity as Essential Fish Habitat for shrimp,
crab, red drum, spotted sea trout, snook, kingfish, flounder, cobia, snapper, and other reef ,coastal-
migratory pelagic, and migratory pelagic fish1. Migratory birds are regularly observed nearby.71
Environmental quality of
water, sediment and air
Sediment within Tampa Bay is generally good to fair quality and supportive of healthy benthic
communities75, with some exceptions near the Port of Tampa and developed shorelines in Tampa
Bay.76 Contaminants of concern include heavy metals, PAHs, PCBs, and pesticides.77 Much of the
contamination results from stormwater runoff.
Environmental Justice Rapid population growth is an increasing source of tension between the port and nearby public.71
Main channel length. About 19 miles.78
Existing channel, basin
and berth information
The main channel is 600 feet wide and 43 feet deep.78 The container port has 2 berths 43 feet deep.79
Plans are for increasing salt-water channel depths to between 47 and 48 feet.79
Availability of sediment
disposal locations
An ocean dredged material disposal site is located 21-miles offshore. Several confined dredged
material placement areas and beneficial use opportunities exist in and near Tampa Bay. Several
borrow pits in Tampa Bay are possible sites for dredged material placement and habitat restoration.76
Port Capacity Capacity used based on maximum TEU is 30.5 %.79 Port plans recommend quadrupling container
port size.
Capacity of intermodal
transport links
Population growth and associated traffic is challenging continued viability of good to excellent rail
service..71
Variable Mobile Container Port and Harbor
Scarce species
/ecosystem heritage in
Species, preserves, and wetlands. The following species listed under the ESA have been observed in or
near Mobile Bay: West Indian manatee (occasional in summer); loggerhead, Kemp’s ridley, and green
sea turtles; blue, humpback, fin, sei, and sperm whales; and piping plover, least tern, bald eagle, red-
71 2011. USACE. Final Environmental Assessment, Tampa Harbor Federal Navigation Project, Operations Maintenance and Dredging.
Jacksonville, FL.
72 “Unit FL–20: Shell Key and Mullet Key and Unit FL–21: Egmont Key. (Federal Register, Vol. 66, No. 132, July 11, 2001) 73 2005. Doonan, T.J., K.M. Lamonte, and N. Douglass. Distribution and Abundance of Piping Plovers and Snowy Plovers in Florida.
Proceedings of the Symposium on the Wintering Ecology and Conservation of Piping Plovers.
74 1989. Nicholls, J. L. Distribution and other ecological aspects of Piping Plovers (Charadrius melodus) wintering along the Atlantic Gulf coasts of the United States. M.S. Thesis, Auburn Univ. Alabama. 75 EPA-842-R-10-003
76 2006. Tampa Bay Estuary Program (TBEP). Charting the Course. Water and Sediment Quality: Address Hot Spots of Toxic Contamination in
the Bay. Pp 62-67. 77 2011. Tampa Bay Estuary Program (TBEP). State of the Bay: Water and Sediment Quality 78 Unpublished USACE database 79 Smith, D. and K. Knight. 2012. Container port capacity study. Draft IWR Report, Institute for Water Resources. U. S. Army Corps of
Engineers. Alexandria, VA

Environmental Impact Mitigation Needs of Future Port and Waterway Modernization Activities in the United States
U.S. Army Corps of Engineers 109 Institute for Water Resources
vicinity cockaded woodpecker, Louisiana quillwort, flatwoods salamander, black pine snake, and eastern
indigo snake. 80 Endangered Gulf sturgeon typically use Mobile Bay between September and June (yet
it is not is not designate critical habitat). A 2003 Regional Biological Opinion80 describes measures
developed to minimize impact to sea turtles and Gulf sturgeon.
Important natural
resource use in vicinity
Commercial fishing and wildlife-based recreation. Mobile Bay is listed as Essential Fish Habitat for
gray snapper, Spanish mackerel, red drum, pink shrimp, brown shrimp, white shrimp, and stone crab,
with waters of the Gulf of Mexico proximal to Mobile Bay listed as essential fish habitat for a variety
of other reef and migratory pelagic fish species. 80 Gaillard Island is an upland disposal site used by
colonial nesting seabirds and brown pelicans.
Environmental quality of
water, sediment, and air.
Because of temporary elevation of nutrients, turbidity, and suspended sediments during dredging and
dredged material disposal, only temporary losses of benthic fauna are expected as a consequence of
any channel deepening and widening. Sediments and benthic communities in Mobile Bay have been
characterized as degraded and poor, respectively81. Tissues of fish collected there exhibit detectible
consecrations of PCBs, DDTs, mercury, and cadmium82. Sediment analysis in 2010 detected
concentrations of arsenic, copper, nickel below their respective Probable Effects Levels in Mobile
River and Mobile Bay sediments.83 Individual and total PAH concentrations sampled in
November/December, 2010 were similar to local background levels and no discernible change
following the Deepwater Horizon Oil Spill.
Environmental Justice No environmental justice issues were identified.
Main channel length. About 38 miles.84
Existing channel, basin
and berth information
Main channel is 45 feet deep and averages 400 feet wide.84 The Port of Mobile has 2 terminals with 3
berths totaling 2,900 feet long and ranging between 40 and 45 feet deep.85
Availability of sediment
disposal locations
Previously-approved upland disposal sites located adjacent to Mobile River or the Mobile-North
Ocean Dredged Material Disposal Site (ODMDS) are available for use along the northern range of the
federal navigation project with the Sand Island Beneficial Use Area identified as serving the southern
range of the federal navigation project. The Deepwater Horizon Oil Spill introduced uncertainty about
the acceptability of future ocean disposal of dredged material.
Port capacity Container yard utilization is 14%, crane utilization is 12%, berth utilization (vessel calls) is 25%, berth
utilization (percent discharge/load) is 20%, and berth utilization (average vessel size) is 25%.85
Capacity of intermodal
transport links
There is direct interstate connectivity and on-dock rail at one terminal that connects to main lines.85
Variable New Orleans Container Port and Harbor
Scarce species
/ecosystem heritage in
vicinity
Endangered species, preserves, and wetlands. federally-protected species that have been observed in
or near the harbor include leatherback, hawksbill, Kemp’s Ridley, loggerhead, and green sea turtles;
Gulf sturgeon and pallid sturgeon; West Indian manatee and Louisiana black bear; and brown pelican,
piping plover, and bald eagle86,87. South of the port are The Jean Lafitte National Park and the
80 Dredging of Gulf of Mexico Navigation Channels and Sand Mining (“Borrow”) Areas Using Hopper Dredges by Corps of Engineers (COE)
Galveston, New Orleans, Mobile, and Jacksonville Districts” 81 EPA-842-R-10-003 82 2006. Alabama Department of Environmental Management. The National Coastal Assessment Alabama 2000-2004 Final Report. 83 November 2011. United States Army Corps of Engineers. DRAFT Environmental Assessment and Section 404(b)(1) Evaluation:
Environmental Certification Package: Mobile Harbor Operations and Maintenance, Mobile County, Alabama. 84 Unpublished U. S. Army Corps of Engineers database 85 Smith, D. and K. Knight. 2012. Container port capacity study. Draft IWR Report, Institute for Water Resources. U. S. Army Corps of
Engineers. Alexandria, VA
86 2010. USACE. Biological Assessment: Louisiana Coastal Area-Mississippi River Gulf Outlet Ecosystem Restoration Project. New Orleans,
LA.

Environmental Impact Mitigation Needs of Future Port and Waterway Modernization Activities in the United States
U.S. Army Corps of Engineers 110 Institute for Water Resources
Barataria–Terrebonne National Estuary. Ten national wildlife refuges and seventeen state refuges and
wildlife management areas are near the Mississippi River channel leading to the port.87
Important natural
resource use in vicinity
The region in the port vicinity supports shellfish and finfish populations that form the basis for
significant commercial and recreational fisheries.86,88 The Gulf of Mexico Fisheries Management
Council (GMFMC) has designated the habitat in and near the Mississippi River from the Port of New
Orleans to the Gulf of Mexico as Essential Fish Habitat for brown shrimp, white shrimp, red drum,
Gulf stone crab, king mackerel, cobia, lane snapper, dog snapper, bonnethead shark, and Atlantic
sharpnose shark. There are opportunities for beneficial use of dredged material to restore marsh,
islands and estuarine habitat but with possible temporary impacts on existing natural habitat.87
Environmental quality of
sediment, water, and air.
Anoxic conditions and high turbidity that have been reported in and near Lake Pontchartrain and the
mouth of the Mississippi River yielding fair to poor water quality conditions4. While benthic habitat is
characterized generally as fair to poor, the degree of sediment contamination in the region is
characterized as low89. However, because of the past and ongoing petroleum and natural gas
exploration, industrial activity, and navigation near the Port of New Orleans and the Mississippi River
from the port to the Gulf of Mexico, contaminated sediment is recognized as a notable because of the
relative stresses on sediment-dependent habitat/systems.87
Environmental Justice No issues identified.
Main channel length About 256 miles.90
Existing channel, basin
and berth information
The main channel is 45 feet deep.90 The single container terminal has 2 berths 45 feet deep and 2000
feet long in total.91
Availability of sediment
disposal locations
A variety of dredged material management options exist and have been proposed in the region ranging
from upland, confined, and open-water disposal, to beneficial use.87
Port Capacity Container yard utilization is 45%, crane utilization is 37%, berth utilization (vessel calls) is 54%, berth
utilization (percent discharge/load) is 34%, and berth utilization (average vessel size) is 63%.91
Capacity of intermodal
transport links
The terminal has on-dock rail 91 and direct access to Interstate 10.88
87 2010. USACE. Final Programmatic Environmental Impact Statement for the Beneficial Use of Dredge Material Program. New Orleans, LA 88 2010. USACE. Mississippi River Gulf Outlet (MRGO) Ecosystem Restoraiton Study Draft Environmental Impact Statement. New Orleans, LA.
89 EPA-842-R-10-003 90 Unpublished U. S. Army Corps of Engineers database 91Smith, D. and K. Knight. 2012. Container port capacity study. Draft IWR Report, Institute for Water Resources. U. S. Army Corps of
Engineers. Alexandria, VA

Environmental Impact Mitigation Needs of Future Port and Waterway Modernization Activities in the United States
U.S. Army Corps of Engineers 111 Institute for Water Resources
Variable Houston Container Port and Harbor
Scarce species
/ecosystem heritage in
vicinity
Scarce Species. Federally protected species observed in or near the harbor in Galveston Bay include
leatherback, hawksbill, Kemp’s Ridley, loggerhead, and green sea turtles; West Indian manatee and
blue, finback, humpback, sei, and sperm whales; gulf sturgeon and smalltooth sawfish; brown
pelican; interior least tern; piping plover; whooping crane; Attwater’s greater prairie chicken; bald
eagle; Houston toad; and Texas prairie dawn (a plant) .92,93 Galveston Bay supports other state-
listed and state managed species.
Important natural
resource use in vicinity
The Gulf of Mexico Fisheries Management Council (GMFMC) has designated habitat near the
Shoal Point Container Terminal as Essential Fish Habitat for adult and juvenile brown and white
shrimp, red drum, and Spanish mackerel. Galveston Bay is on an important migratory corridor for
coastal and trans-oceanic bird migration.92 Over 32,000 recreational boats use the bay.
Environmental quality of
sediment, water and air.
Northern Galveston Bay is listed as an impaired94 water body due to multiple pollutants including
bacteria, dioxin, and PCBs with higher concentrations of dioxins and PCB’s distributed in the upper
tributaries of Galveston Bay. 95 Sediment quality is characterized as of poor to good quality with
poor to fair benthic habitat. 96 The port is heavily industrialized with many generators or stores or
hazardous materials and petroleum products92 and is located in the Houston-Galveston-Brazoria Air
Quality Control Region97 which has been classified as in a severe state of nonattainment with
National Ambient Air Quality Standards for ozone.92 NOx emissions associated with different
landside transportation assumptions have also been identified as possible air quality concerns.
Environmental justice The percentage of the population characterized as minority or economically-stressed near the port is
1.33 to 2.00 times that of the State and some vulnerability may be associated with port activities.92
Main channel length About 14 miles.98 Several channels branch off to connect with other terminals.92, 93
Existing channel, basin
and berth information
The main channel depth is 47 feet. 98 The Port of Houston has two terminals and a total of 8 births
totaling 8000 feet and maintained at 40 feet deep99. There is a 1600 feet diameter turning basin.
Branch channels into the two terminals total 4.8 miles, 40 feet deep and averages 300 feet wide.93
Availability of sediment
disposal locations
Several dredge disposal and management options exist within and proximal to Galveston Bay.95
Port Capacity Container yard utilization is 57 %, Crane utilization is 37%, berth utilization (vessel calls) is 49 %,
berth utilization (percent discharge/load) is 52%, and berth utilization (average vessel size) is 44%8.
The Port of Houston handles about 70% of the container cargo in the Gulf Region.99
Capacity of intermodal
transport links
Container terminals have direct access to interstate highway and to two rail system,92 but no on-
dock rail.99
Variable Los Angeles/Long Beach Container Ports and Harbor
92 2002. USACE. Galveston District Final Environmental Impact Statement for Texas City’s Proposed Shoal Point Container Terminal, Volumes
1and 2. Galveston, TX. 93 2007. USACE. Texas City Channel Deepening Project General Reevaluation Report and Environmental Assessment. Galveston, TX.
94 2008. Texas Commission on Environmental Quality. 2008 Texas 303 (d) list. Austin, Texas. 95 2010. USACE. Final Environmental Assessment. Expansion of Placement Areas 14 and 15, Houston Ship Channel, Chambers County, Texas.
Galveston, TX. 96 EPA-842-R-10-003 97 http://www.epa.gov/oaqps001/greenbk/anayo_tx.html 98 Unpublished U. S. Army Corps of Engineers data 99 Smith, D. and K. Knight. 2010. Container port capacity study. Draft IWR Report, Institute for Water Resources. U. S. Army Corps of
Engineers. Alexandria, VA

Environmental Impact Mitigation Needs of Future Port and Waterway Modernization Activities in the United States
U.S. Army Corps of Engineers 112 Institute for Water Resources
Scarce species
/ecosystem heritage in
vicinity
Species and wetlands. Federally protected species include loggerhead, green, leatherback, and olive
ridley sea turtles; California least tern and western snowy plover; and blue, fin, humpback, and sperm
whales.100,101,102,103 Sea turtles and whales can be expected just outside the harbor. A variety of other
endangered bird, plant and reptile species inhabit terrestrial or fresh water areas that are less likely to
be impacted. The harbor area has very small amounts of wetlands and eelgrass.99,100,101, 192
Important natural
resource use in vicinity
Fisheries and Potable water. The Port area supports a limited amount of natural resources. The port
area lacks estuarine and wetland habitats and possesses limited eelgrass habitat. Fish of commercial or
recreational value include ubiquitous pelagic species such as anchovy, sardines, Pacific mackerel, and
jack mackerel with less common soft bottom species such as Pacific sanddab and English sole. There
is a fish consumption advisory for fish caught in the harbor.104 All waters in the harbor are tidally
influenced and considered Essential Fish Habitat, as defined by NOAA for various species99, 100, 101,102
Environmental quality of
water, sediment and air
Harbor waters and sediments are impaired under criteria of Section 303(d) of the Clean Water Act for
DDT, PCBs, PAHs, multiple pesticides, mercury and other heavy metals, and bacteria.99,100,101,102 Due
to the high levels of contaminants, the local water board agencies have designated the harbor area as a
toxic hot spot.103 Future disposal operations would assume harbor sediments were contaminated.5
Any adverse water quality effects of dredging would likely be short term with implementation of
proper BMPs.103 Regional air quality was in non-attainment status for ozone, PM-2.5, PM-10, and
lead under the National Ambient Air Quality Standards as of March 2012.99, 100
Environmental Justice Port operations expose low income/minority populations to poor air quality, which would partially be
mitigated through fleet modernization, electrification, and additional BMPs.99,100,101,102
Main channel length About 15 miles.105
Existing channel, basin
and berth information
In main channel is 53 feet deep and averages about 600 feet wide.104 Other basins and channels in the
harbors vary from 45 to 81 feet deep.106 In total, there are 55 berths at 15 terminals totaling 56,978
feet. The berths vary between 42 and 55 feet deep.107
Availability of sediment
disposal locations
Due to the high level of sediment contamination, most sediment would be disposed in harbor infills
and shallow water habitat creation projects within the Port of Los Angeles/Long Beach Harbor.
99,100,101,102 Suitable sediment may be disposed of at marine disposal site LA-2 (9 miles away).
Port Capacity Container yard utilization is 75%, crane utilization is 43%, berth utilization (vessel calls) is 25%, berth
utilization (percent discharge/load) is 112%, and berth utilization (average vessel size) is 25%.106
Capacity of intermodal
transport links
Almost all the terminals have on-dock rail connections to the Alameda Corridor and a dedicated sub-
surface rail cargo expressway connecting to railway mainlines near downtown Los Angeles. All
terminals connect directly to interstate highways. There is potential for indirect and/or cumulative
impacts as a result of the larger ships calling on the port associated especially with truck traffic99,100,102
Variable Oakland Container Port and Harbor
Scarce species Species and wetlands. Federally protected species include green sturgeon, tidewater goby, delta
100 U.S. Army Corps of Engineers and the Port of Los Angeles. 2009. Port of Los Angeles Channel Deepening Project – Final Supplemental
Environmental Impact Statement/Supplemental Environmental Impact Report. 101 U.S. Army Corps of Engineers and the Port of Los Angeles. 2011. Draft EIS/EIR – Berths 302-306 APL Container Terminal Project.
102 U.S. Army Corps of Engineers and the Port of Long Beach. 2009. Middle Harbor Redevelopment Project – Final Environmental Impact
Statement (FEIS)/Final Environmental Impact Report (FEIR) and Application Summary Report (ASR). 103 U.S. Army Corps of Engineers and the Port of Long Beach. 2011. Pier S Marine Terminal + Back Channel Improvement Project – Draft
Environmental Impact Statement (DEIS)/Draft Environmental Impact Report (DEIR). 104 Los Angeles Region Contaminated Sediments Task Force. 2005. Los Angeles Regional Contaminated Sediments Task Force: Long-Term
Management Stragey. 104 Unpublished U. S. Army Corps of Engineers database.
106 Marine Exchange of Southern California. 2011. Harbor Safety Plan 2011.
107 Smith, D. and K. Knight. 2010. Container port capacity study. Draft IWR Report, Institute for Water Resources. U. S. Army Corps of
Engineers. Alexandria, VA

Environmental Impact Mitigation Needs of Future Port and Waterway Modernization Activities in the United States
U.S. Army Corps of Engineers 113 Institute for Water Resources
/ecosystem heritage in
vicinity
smelt, coho salmon, steelhead, and chinook salmon; western snowy plover, California clapper rail,
and California least tern; salt marsh harvest mouse; and California sea blite108. A variety of other
endangered bird, plant and reptile species inhabit terrestrial or fresh water areas that are less likely to
be impacted. The harbor area has 5,000 square feet of eelgrass beds, with additional patches within a
200-foot buffer of the Inner Harbor channels.107,109
Important natural
resource use in vicinity
Fisheries and Potable water. The study area supports ground fish including English sole, starry
flounder, sand sole, lingcod, and brown rockfish, to name a few species107. Chinook salmon migrate
through the area. San Francisco Bay is considered Essential Fish Habitat as defined by NOAA.
Environmental quality of
water, sediment, and air
The Oakland Harbor system is considered to be impaired under criteria of Section 303(d) of the
Clean Water Act for dioxins, polyaromatic hydrocarbons, polychlorinated biphenyls, pesticides,
mercury, and other metals.110 Some toxic material present in the sediments, limiting the disposal of
about 0.5 million cubic yards to upland land disposal.108 The adverse water quality effects of
dredging would likely be short term and periodic maintenance will result in the temporary removal of
benthic infauna and epifauna and temporary and minor change in air quality.108 The region was in
attainment of all National Ambient Air Quality Standards in 1998 except for carbon monoxide111 and
since then, has achieved non-attainment status for ozone and PM2.5.112
Environmental Justice The nearby West Oakland community is a socially and economically disadvantaged community. The
port would address traffic, air quality, and quality of life issues on an on-going basis. 110
Main channel length About 10 miles113.
Existing channel, basin
and berth information
The main Channel depth is 50 feet deep and averages about 900 feet wide112. The Outer Harbor
Turning Basin is 1600 feet in diameter, and the Inner Harbor Turning Basin is 1500 feet in diameter.
Port of Oakland has 21 berths at eight terminals totaling 22,454 feet. Thirteen berths are 50 feet
deep, and eight are 42 feet deep.114
Availability of sediment
disposal locations
As of 2009, dredged materials have been discharged to the adjacent Middle Harbor Enhancement
Area (the Montezuma Wetlands Restoration Site) about 48 miles away, San Francisco Deep Ocean
Disposal Site about 60 miles away, Hamilton Wetlands Restoration Site about 20 miles away and
various upland disposal sites.107 Disposal is available at the San Francisco Deep Ocean Disposal
Site.108 Maintenance dredging to 50 feetwould nearly double the cubic yards dredged per year. 109
Port Capacity Container yard utilization is 53%, Crane utilization is 29%, berth utilization (vessel calls) is 40%,
berth utilization (percent discharge/load) is 28%, and berth utilization (average vessel size) is 40%.113
Capacity of intermodal
transport links
The port has two near-dock rail intermodal terminals113 and direct connection to interstate highway
system.
108 U.S. Army Corps of Engineers, San Francisco District. 2010. Environmental Assessment for Fiscal Year 2010-12 Maintenance Dredging of
Oakland Inner and Outer Harbors, Oakland, California. 109 U.S. Army Corps of Engineers, San Francisco District. 1998. Oakland Harbor Navigation Improvement (~50 Foot) Project, Revised Final
Feasibility Study. 110 http://www.swrcb.ca.gov/water_issues/programs/tmdl/integrated2010.shtml 111 U.S. Army Corps of Engineers, San Francisco District. 1998. Oakland Harbor Navigation Improvement (~50 Foot) Project, Final
Environmental Impact Study/Environmental Impact Report. 112 http://www.epa.gov/oaqps001/greenbk/ancl3.html 113 Unpublished U. S. Army Corps of Engineers database 114 Smith, D. and K. Knight. 2010. Container port capacity study. Draft IWR Report, Institute for Water Resources. U. S. Army Corps of
Engineers. Alexandria, VA

Environmental Impact Mitigation Needs of Future Port and Waterway Modernization Activities in the United States
U.S. Army Corps of Engineers 114 Institute for Water Resources
Variable Tacoma Container Port and Harbor
Scarce species
/ecosystem heritage in
vicinity
Species and wetlands. Federally protected species in the vicinity of the project site include marbled
murrelet , chinook salmon, steelhead trout, bull trout, and southern resident killer whales. A variety of
other endangered bird, plant and reptile species inhabit rural upland areas that are less likely to be
impacted. The harbor area has lost most of its marine wetlands and eelgrass, so almost no patches are
left.115,116 There are still some remnant freshwater wetlands of moderate to low quality.115
Important natural
resource use in vicinity
Fisheries and Potable water. The aquatic environment supports tribal fishing for salmon, shellfish, and
non-salmon fish resources.117 There is some recreational fishing, but on tribal commercial fishing is
allowed ( treaty rights). Fishing occurs mostly away from the immediate port area. Notable resources
include Dungeness crab, rock crab, shrimp, scallops, sea urchins, sea cucumbers, and squid as well as
geoducks, clams, and oysters. The area is considered Essential Fish Habitat as defined by NOAA for
salmon, groundfish, and pelagic species.118
Environmental quality of
water, sediment and air
Parts of Port of Tacoma are considered impaired under the 2008 State of Washington 303(d) water
quality assessment for several pollutants including PCBs, phthalates, and dieldrin.119 Much of the Port
of Tacoma was designated a Superfund site and contaminated sediments were removed. Sitcum
Waterway is still designated a Superfund Site with impairments due to organics, PAHs, mercury, and
other metals.116 About eight million cubic yards of suitable sediments have been discharged to the
Commencement Bay disposal area through 2009. The adverse water quality effects of dredging would
likely be short term. The region was in non-attainment for PM-2.5 under the National Ambient Air
Quality Standards as of March 2012.120 Periodic maintenance will result in the temporary removal of
benthic infauna and epifauna and temporary and minor change in air quality.
Environmental Justice Minority and low income populations are not within the project area and in small numbers within the
vicinity of the project area.115
Main channel length About 2.7 miles.121
Existing channel, basin
and berth information
The main channel depth is 51 feet deep and about 650-wide7. It has a 1,700-foot diameter turning
basin. The Port of Tacoma has nine berths at five terminals totaling 10,860 feet. All berths are 51 feet
deep.122
Availability of sediment
disposal locations
Suitable sediments are disposed of in Commencement Bay about 4.5 miles away. In 2010, the
capacity was expanded from 9 million cubic yards to 23 million cubic yards, which would extend the
life to an additional 40 years.123
Port Capacity Container yard utilization is 37%, crane utilization is 15%, berth utilization (vessel calls) is 23%,
berth utilization (percent discharge/load) is 52% , and berth utilization (average vessel size) is 23%.122
Capacity of intermodal
transport links
Most of the terminals have on-dock rail connections122, and all have direct connection to interstate
highway system. The most likely indirect/cumulative impacts are related to increased truck traffic .
115 David Evans and Associates. 1991. Commencement Bay Cumulative Impact Studies: Historic Review of Special Aquatic Sites. 116 U.S. Army Corps of Engineers. 2009. Blair-Hylebos Terminal Redevelopment Project: Final Environmental Impact Statement. 117 U.S. Army Corps of Engineers and Washington State Department of Natural Resources. 2009. Reauthorization of Dredged Material
Management Program Disposal Site Commencement Bay, Washington: Supplemental Environmental Impact Statement. 118 U.S. Army Corps of Engineers. 2005. Department of the Army Permit Evaluation and Decision Document for 200400818, Port of Tacoma,
Blair Waterway Expansion. 119 http://www.ecy.wa.gov/programs/wq/303d/2008/index.html 120 http://www.epa.gov/oaqps001/greenbk/ancl3.html 121 Unpublished USACE database 122 Smith, D. and K. Knight. 2010. Container port capacity study. Draft IWR Report, Institute for Water Resources. U. S. Army Corps of
Engineers. Alexandria, VA 123 U.S. Army Corps of Engineers and U.S. Environmental Protection Agency. 2010. Public Notice–Reauthorization of Dredged Material
Management Program (DMMP) Disposal Site Commencement Bay, Washington.

The Institute for Water Resources (IWR) is a U.S. Army Corps of Engineers (USACE) Field Operating Activity
located within the Washington DC National Capital Region (NCR), in Alexandria, Virginia and with satellite centers in New Orleans, LA; Davis, CA; Denver, CO; and Pittsburg, PA. IWR was created in 1969 to analyze and anticipate changing water resources management conditions, and to develop planning methods and analytical tools to address economic, social, institutional, and environmental needs in water resources planning and policy. Since its inception, IWR has been a leader in the development of strategies and tools for planning and executing the USACE water resources planning and water management programs. IWR strives to improve the performance of the USACE water resources program by examining water resources problems and offering practical solutions through a wide variety of technology transfer mechanisms. In addition to hosting and leading USACE participation in national forums, these include the production of white papers, reports, workshops, training courses, guidance and manuals of practice; the development of new planning, socio-economic, and risk-based decision-support methodologies, improved hydrologic engineering methods and software tools; and the management of national waterborne commerce statistics and other Civil Works information systems. IWR serves as the USACE expertise center for integrated water resources planning and management; hydrologic engineering; collaborative planning and environmental conflict resolution; and waterborne commerce data and marine transportation systems. The Institute’s Hydrologic Engineering Center (HEC), located in Davis, CA specializes in the development, documentation, training, and application of hydrologic engineering and hydrologic models. IWR’s Navigation and Civil Works Decision Support Center (NDC) and its Waterborne Commerce Statistical Center (WCSC) in New Orleans, LA, is the Corps data collection organization for waterborne commerce, vessel characteristics, port facilities, dredging information, and information on navigation locks. IWR’s Risk Management enter is a center of expertise whose mission is to manage and assess risks for dams and levee systems across USACE, to support dam and levee safety activities throughout USACE, and to develop policies, methods, tools, and systems to enhance those activities. Other enterprise centers at the Institute’s NCR office include the International Center for Integrated Water Resources Management (ICIWaRM), under the auspices of UNESCO, which is a distributed, intergovernmental center established in partnership with various Universities and non-Government organizations; and the Conflict Resolution and Public Participation Center of Expertise, which includes a focus on both the processes associated with conflict resolution and the integration of public participation techniques with decision support and technical modeling. The Institute plays a prominent role within a number of the USACE technical Communities of Practice (CoP), including the Economics CoP. The Corps Chief Economist is resident at the Institute, along with a critical mass of economists, sociologists and geographers specializing in water and natural resources investment decision support analysis and multi-criteria tradeoff techniques. The Director of IWR is Mr. Robert A. Pietrowsky, who can be contacted at 703-428-8015, or via e-mail at:
[email protected]. Additional information on IWR can be found at:
http://www.iwr.usace.army.mil. IWR’s NCR mailing address is:
U.S. Army Engineer Institute for Water Resources
7701 Telegraph Road, 2nd Floor Casey Building
Alexandria, VA 22315-3868

2014-R-04