environmental impact evaluation of a fresh milk production
TRANSCRIPT

149
Industria: Jurnal Teknologi dan Manajemen Agroindustri
Volume 10 No 2: 149-161 (2021)
Industria: Jurnal Teknologi dan Manajemen Agroindustri
http://www.industria.ub.ac.id
ISSN 2252-7877 (Print) ISSN 2548-3582 (Online)
https://doi.org/10.21776/ub.industria.2021.010.02.6
Environmental Impact Evaluation of a Fresh Milk Production
Evaluasi Dampak Lingkungan Produksi Susu Segar
Yulianti Agustin1, Miftakhurrizal Kurniawan1*, Retno Astuti1, Mohammad Arifur Rahman2 1Departement of Agro-Industrial Technology Faculty of Agricultural Technology, Universitas Brawijaya,
Jl Veteran, Malang 65145, Indonesia 2Bangladesh Agricultural Research Institute (BARI), Gazipur 1701, Bangladesh
*[email protected] Received: 20th February, 2021; 1st Revision: 5th June, 2021; 2nd Revision: 12th July, 2021; Accepted: 3rd August, 2021
Abstract
The study aimed to evaluate the waste impact on the environment in fresh milk production activities from the
dairy cows rearing on farms to the distribution process of fresh milk to a milk processing factory and fresh milk
selling agents, identify the most significant potential for contamination from fresh milk production activities on the
environment, and provide alternative improvements based on the most significant environmental impact caused by
fresh milk production activities. This research was conducted in a dairy farmer cooperative which is an organization
that produces fresh milk. The Life Cycle Assessment (LCA) method was used to evaluate the environmental impact
of fresh milk production activities. The analysis was carried out using SimaPro 9.0.0.47 software. The LCA stages
carried out were Goal and Scope Definition, Life Cycle Inventory, Life Cycle Impact Assessment (LCIA), and Life
Cycle Interpretation. The assessment of improvement alternatives was then analyzed using the pairwise comparison
method to determine the highest weight. The results showed that the three most significant impact categories,
namely eutrophication, human toxicity soil, and acidification. The biggest contamination from fresh milk production
activities occurs in the fresh milk extraction process. Processing dairy cow dung into manure was the prioritized
recommendation to reduce the impact.
Keywords: environmental impact, life cycle assessment, fresh milk
Abstrak
Penelitian ini bertujuan untuk mengevaluasi dampak limbah terhadap lingkungan pada aktivitas produksi susu
segar mulai dari pemeliharaan sapi perah di peternakan sampai pada proses distribusi susu segar ke pabrik
pengolah susu dan agen penjual susu segar, mengetahui potensi cemaran terbesar dari aktivitas produksi susu
segar terhadap lingkungan, dan memberikan alternatif perbaikan berdasarkan dampak lingkungan terbesar yang
disebabkan oleh aktivitas produksi susu segar. Penelitian ini dilakukan di a dairy farmer cooperative yang
merupakan suatu organisasi yang memproduksi susu dalam bentuk segar. Metode Life Cycle Assessment (LCA)
digunakan untuk mengevaluasi dampak lingkungan dari kegiatan produksi susu segar. Analisis dilakukan dengan
software SimaPro 9.0.0.47. Tahapan LCA yang dilakukan adalah Goal and Scope Definition, Life Cycle Inventory,
Life Cycle Impact Assessment (LCIA), dan Life Cycle Interpretation. Penilaian alternatif perbaikan kemudian
dianalisis menggunakan metode perbandingan berpasangan untuk menentuan bobot tertinggi. Hasil penelitian
menunjukkan bahwa tiga kategori dampak tertinggi yaitu eutrhopication, human toxicity soil dan acidification.
Cemaran terbesar dari kegiatan produksi susu segar terjadi pada proses ekstraksi susu segar. Pengolahan kotoran
sapi perah menjadi pupuk kandang merupakan rekomendasi yang diprioritaskan untuk mengurangi dampak
tersebut..
Kata kunci: dampak lingkungan, life cycle assessment, susu segar
INTRODUCTION
Milk is one of the agroindustry product that
has many health benefits due to its nutritional con-
tent. Milk contains many vitamins and minerals
that are very good for the human body. Dairy
cow's milk contains 4.80% lactose, 0.72% miner-
als, 3.90% fat, 3.40% protein, and 87.10% water
(Soeparno, 2021). Fresh milk production in
Indonesia has been done in some places. One of
the greatest producer of fresh milk is in East Java.
According to data from Statistics Indonesia, fresh
milk production in East Java in 2020 was 534-
151.52 tons (Badan Pusat Statistik, 2021).
All fresh milk production activities from

150
Environmental Impact Evaluation of …
Industria: Jurnal Teknologi dan Manajemen Agroindustri 10(2): 149-161 (2021)
farms to distribution of fresh milk to a milk pro-
cessing factory and fresh milk selling agents gen-
erate waste, including dairy cow dung from dairy
cows owned by farmers, air pollution due to fresh
milk transportation activities from the fresh milk
collecting post to the cooperative and from the co-
operative to the factories and selling agents, liquid
waste in the form of spilled fresh milk during
transportation from the fresh milk collecting post
to the cooperative, and many other possible wastes
generated from these activities. Waste generated
from fresh milk production activities in small and
medium enterprises in Indonesia is still poorly
handled, so it impacts the surrounding environ-
ment (Khalil et al., 2019). Environmental impact
analysis is needed to reduce the impact of waste
generated from fresh milk production activities on
the environment.
Several studies on the agricultural industry by
considering the industry's impact on the environ-
ment have been carried out previously. The re-
search analysis focuses more on supply chain
management (Mustaniroh, Kurniawan, &
Deoranto, 2019; Lestari & Dinata, 2019) and
productivity (Astuti, Deoranto, & Aula, 2019;
Septifani, Astuti, & Akbar, 2020). The previous
research does not consider the category of envi-
ronmental impacts resulting from the industrial ac-
tivities. Environmental impact categories are
needed in determining alternative improvements
based on the effect of emissions on the environ-
ment. Emissions result from all activities in the ag-
ricultural industry in various forms. These emis-
sions must be converted into one unit, which is
translated into one category of environmental im-
pact so that it is easier to determine the alternative
improvements to reduce these emissions.
The method used to assess the environmental
impacts category in the product life cycle is Life
Cycle Assessment (LCA). LCA is a method for
evaluating the environmental impact of processes,
products, and systems during their life cycle from
start to finish by identifying and accounting for all
associated inputs and outputs. The methodology in
LCA is based on ISO 14040 (Ramos et al., 2021).
Improvements can be made using LCA to create a
sustainable production concept (Barzegar, Rasi, &
Niknamfar, 2018).
This study aimed to evaluate the waste impact
on the environment in fresh milk production activ-
ities, starting from the dairy cows rearing on farms
to the distribution process of fresh milk to a milk
processing factory and fresh milk selling agents,
identify the most significant potential for contam-
ination from fresh milk production activities on
the environment, and provide alternative improve-
ments based on the most significant environmental
impact caused by fresh milk production activities.
Alternative of improvements are then recom-
mended to reduce the effects of waste generated
by fresh milk production activities on the environ-
ment to create sustainable production.
METHODS
This research was conducted in a dairy farmer
cooperative located in Mojokerto Regency, East
Java. This dairy farmer cooperative collects fresh
milk from farmers who are the members of the
cooperative. The dairy farmer cooperative carries
out the cooling process of fresh milk without the
addition of other substances. The milk is then sold
to a milk processing factory and fresh milk selling
agents. The fresh milk extraction process involves
204 farmers who daily deliver fresh milk to the
cooperative with an average volume of 5,667
liters.
Life Cycle Assessment (LCA)
LCA consists of four main stages, i.e. goal
and scope, inventory analysis, impact assessment,
and interpretation
Goal and Scope Definition
This stage was carried out to determine the
goal and scope analyzed in this study. The purpose
of the goal and scope definition was for evaluating
the impact and determining the most significant
potential for contamination due to the fresh milk
production process. The goal and scope of this re-
search was the activity of producing fresh milk
from the dairy cows rearing on the farm to the dis-
tribution of fresh milk to a milk processing factory
and fresh milk selling agents.
Life Cycle Inventory (LCI)
LCI data processing was performed after ob-
taining input and output data on all fresh milk pro-
duction activities, starting from the dairy cows
rearing on the farms to the distribution of fresh
milk to a milk processing factory and fresh milk
selling agents. The data was in the form of inputs
and outputs on the extraction of fresh milk on
farms, energy requirements in the production pro-
cess, and transportation activities. The data at this
stage was data for one month of the production
process with the assumption that energy used did

151
Environmental Impact Evaluation of …
Industria: Jurnal Teknologi dan Manajemen Agroindustri 10(2): 149-161 (2021)
not change. The data was then processed using
SimaPro 9.0.0.47 software. The method chosen in
the software was Environmental Design of Indus-
trial Product (EDIP) which was a characterization
method for toxic substances produced in each pro-
cess (Park et al., 2020). This method is most suit-
able for the conditions in the field in this study.
Life Cycle Impact Assessment (LCIA)
The LCIA stage was performed to compare
the impact caused by each stage of the fresh milk
production process. The outputs produced are net-
work process, characterization, normalization,
weighting, and a single score. The network pro-
cess is an overall picture of the system studied.
The contribution of each process contained in a
system is identified in the network process. The
most significant contribution can be seen from the
red line in the network process (Palupi, Tama, &
Sari, 2014). Characterization is an assessment of
the value of substances that contribute to the im-
pact category (Windrianto, Lucitasari, &
Berlianty, 2016). Normalization is the stage of
uniting the units for all impact categories. The pur-
pose of normalization is to make it easier to com-
pare between categories of impacts (Palupi et al.,
2014).
Weighting was performed after normaliza-
tion. Weighting provides an assessment of impact
categories based on the importance level (Eranki
& Landis, 2018). Single Score was then performed
after weighting. Single Score provides an assess-
ment of the most significant contribution at all
stages of the production process. Single Score in-
dicates the stage of the production process that has
the most significant impact on the environment
(Harjanto, Fahrurrozi, & Bendiyasa, 2012).
Life Cycle Interpretation
This stage includes drawing conclusions and
recommendations related to the results of the LCI
and LCIA. The interpretation results were several
alternative improvements due to the most signifi-
cant impact generated by fresh milk production ac-
tivities. The weight value of the improvement al-
ternatives was then calculated using pairwise com-
parisons to determine the recommended improve-
ment alternatives priority.
Determination of Improvement Recommenda-
tions
Recommendations for improvement were
based on the most significant impact of fresh milk
production activities on the environment. The
weighting on the improvement alternatives was
then performed to determine the recommended
improvement alternatives priority. The weighting
was performed by expert respondents, i.e. a man-
ager and a production head of the dairy farmer co-
operative. The improvement recommendations'
weight assessment was performed using pairwise
comparisons with a rating scale of 1-9, as shown
in Table 1. The assessment results were then pro-
cessed using Super Decision software. The pair-
wise comparison matrix is declared consistent if
the Consistency Ratio (CR) is ≤ 0.1 (Saaty,
2012a). The selected improvement recommenda-
tions are recommendations that have the highest
weight (Saaty, 2012b).
RESULTS AND DISCUSSION
Goal and Scope Definition
The goal and scope of this research was the
activity of producing fresh milk from the dairy
cows rearing on farms to distribution to a milk pro-
cessing factory and fresh milk selling agents. This
included the extraction of fresh milk as the main
raw material, the process of producing fresh milk,
and the activities of transporting fresh milk from
the milk collecting post to the cooperative and
from the cooperative to the milk processing fac-
tory and fresh milk selling agents. Extraction of
fresh milk is carried out on dairy cows owned by
farmers who were the members of the dairy farmer
cooperative. Dairy cows are fed grass, concentrate
food, and water drinks. The average amount of
grass needs is 50 kg/cow/day, the concentrate av
Table 1. Pairwise comparison rating scale
Interaction of Interests Meaning/Interpretation
1 Both elements are equally important
3 One element is slightly more important than the other element
5 One element is more important than the other
7 One element is clearly more absolutely important than the other elements
9 One element is absolutely important than the other elements
2, 4, 6, 8 The values between two values of adjacent considerations
Source: Saaty (2012)

152
Environmental Impact Evaluation of …
Industria: Jurnal Teknologi dan Manajemen Agroindustri 10(2): 149-161 (2021)
erage is 6 kg/cow/day, and the average water
needed is 35 liters/cow/day for drinking and bath-
ing. This livestock activity produces dairy cow
dung with an average amount of 28 kg/cow/day.
The total fresh milk produced every day is an av-
erage of 5,667 liters by 721 dairy cows, so that
each dairy cow produced an average of 8 liters of
milk/day
A dairy farmer cooperative carries out the
fresh milk production process. The production
process is only cooling fresh milk with a cooling
machine without the addition of other substances.
Cooling is done in order to make fresh milk re-
mains in a good quality before being sent to a milk
processing factory and fresh milk selling agents.
The inputs to the production process in SimaPro
9.0.0.47 software in this study were fresh milk,
electricity, and diesel fuel.
The fresh milk transportation activities con-
sidered in this study were transporting fresh milk
from the milk collecting post to the cooperative
and from the cooperative to the milk processing
factory and fresh milk selling agents. The trans-
portation activity uses a tank with a capacity of
1,000 liters for transportation activities from the
milk collecting post to cooperatives and fresh milk
selling agents. Transportation from the coopera-
tive to the milk processing factory is carried out
using a 6,000 liters capacity of a tank vehicle. The
fuel used by tank is diesel fuel.
Life Cycle Inventory (LCI)
LCI is the stage of collecting data in the form
of the number of inputs and outputs in the extrac-
tion of fresh milk as the main raw material, the
process of producing fresh milk, and the activities
of transporting fresh milk from the milk collecting
post to the cooperative and from the cooperative
to the milk processing factory and fresh milk sell-
ing agents. The input was the use of materials and
energy in a process, while the output resulted from
production or waste. The input and output data
consisted of primary and secondary data and data
available in the SimaPro 9.0.0.47 database.
Fresh milk was extracted from 721 dairy
cows which require grass, concentrate, and water
for their maintenance. Dairy cows also produce
dung every day. Each number of inputs and out-
puts was multiplied by 721 which were the num-
ber of dairy cows as a source of fresh milk raw
materials. The number of outputs and inputs for
extracting fresh milk can be seen in Table 2.
The input data for the fresh milk production
process were materials, i.e. fresh milk, water, and
energy requirements in production (electricity and
diesel fuel). Electricity is used as a source of en-
ergy in all activities, from lighting to the operation
of cooling machines. Diesel fuel is used to fuel
generators which function as a source of energy
when the electricity goes out. The primary raw
material input for fresh milk was obtained from
the materials in the previous process (the extrac-
tion of fresh milk). Water is used for washing ma-
chines and milking equipment at the head office
and other activities. The use of materials and en-
ergy in the fresh milk production process can be
seen in Table 3.
Data conversion needs to be carried out on
transportation activities to match the SimaPro
9.0.0.47 database because the units required in
SimaPro 9.0.0.47 software in the transportation
category are kilogram kilometers (kgkm). Conver-
sion was performed by multiplying the load, and
Table 2. Number of outputs and inputs
Material Database in SimaPro9.0.0.47 Unit Quantity/day/head Total/month
Grass Grass, at dairy farm/NL Mass kg 50 1,117,550
Water Water, river, ID liter 35 782,285
Concentrate Compound feed dairy cattle/NL Mass kg 6 134,106
Dairy cow
manure
Manure, solid, cattle (waste treatment)
{GLO}| market for | Conseq, U
kg 28 625,828
Table 3. Material and energy use per month
Material Database Unit Total/month
Fresh milk Fresh milk extraction kg 180.075
Electricity Electricity grid mix, AC, consumption mix, at consumer, 220V IS S kWh 7.653
Diesel fuel Diesel fuel, at refinery/l/US liter 20
Water Water, river, ID liter 692.000

153
Environmental Impact Evaluation of …
Industria: Jurnal Teknologi dan Manajemen Agroindustri 10(2): 149-161 (2021)
Table 4. Transport capacity and diesel fuel needed for fresh milk transport tanks
From or to the
Cooperative
Distance
(km)
Fresh Milk
Quantity
(kg)
Conversion
(kgkm /day)
Conversion
(kgkm
/month)
Diesel Fuel
/ Day
(liters)
Diesel Fuel /
Month
(liters)
Tank Capacity 1000 liters
Milk Collecting Post A 3x2* 2,232 13,392 415,152 4 124
Milk Collecting Post B 4x2* 1,892 15,136 469,216 6 186
Milk Collecting Post C 15 660 9,900 306,900 10 310
Central Milk Collecting
Post
0 1,025 0 0 0 0
Fresh Milk Selling Agents 30 658 19,740 611,940 30 930
Total 58,168 1,803,208 50 1,550
Tank Capacity 6000 liters
Dairy processing factory 30 5,000 150,000 4,650,000 30 930
*Distance times the frequency of transportation in one day
the distance traveled from the milk collecting post
to the cooperative and from the cooperative to the
milk processing factory and fresh milk selling
agents. Tank used in transportation activities have
a capacity of 1,000 and 6,000 liters. The fuel used
for the tank was diesel fuel, so diesel fuel was used
as material in this transportation activity. The
transport capacity from each fresh milk collecting
post to the cooperative and from the cooperative
to the milk processing factory and fresh milk sell-
ing agents can be seen in Table 4.
Life Cycle Impact Assessment (LCIA)
Network Process
Network Process is an overall picture of the
system studied. The Network Process can identify
the contribution of each process contained in a
system. The most significant contribution can be
seen from the red line in the network process
(Palupi et al., 2014). Network Process of the fresh
milk production activities in this study can be seen
in Figure 1. The thickest line in the Network
Process is in the fresh milk extraction process, so
it can be concluded that the fresh milk extraction
process provided the most significant contribution
to the impact on the environment with a value of
1.37x10³ Pt. This result is caused by the process of
extracting fresh milk impacts the environment in
the form of solid waste of dairy cow dung which
was directly discharged into the river without prior
processing.
Characterization
Characterization is an assessment of the sub-
stantial value contributing to the impact category
(Windrianto et al., 2016). The resulting impact
category was based on the EDIP method on
SimaPro 9.0.0.47 software. The characterization
values for each impact category can be seen in
Table 5 and Figure 2. The most significant impact
categories in characterization were global warm-
ing (GWP 100) of 7.2x10⁸ g CO2, photochemical
smog of 6.13x10⁴ g of ethane, and eutrophication
of 5.64x10⁷ g of NO3.
Normalization
Normalization is the stage of uniformity units
for all impact categories. The purpose of normali-
zation is to make it easier to compare between cat-
egories of impacts (Palupi et al., 2014). Normali-
zation values for each impact category can be seen
in Table 6 and Figure 3. The most significant im-
pact category in normalization was eutrophication,
with a normalized value of 474. Eutrophication is
water pollution caused by the enrichment of nutri-
ent and mineral elements (such as nitrogen and
phosphorus) which is causing an increase in bio-
mass in the water's environment (Malone &
Newton, 2020). Eutrophication was caused by
dairy cow dung that was directly dumped into the
river without prior processing.
Human toxicity soil was the second largest
category of impacts caused by fresh milk produc-
tion activities. Human toxicity soil affects human
health through soil media. The normalized value
for the impact category of human toxicity soil was
198. Excessive nutrition from livestock manure
causes some nutrients to seep into the soil surface
and eventually cause pollution. Phosphoric, phos-
phate, and nitric acids are some organic materials
that affect soil contamination (Saputro, Wijaya, &
Wijayanti, 2014).
The next most significant category impact
caused by fresh milk production activities was
acidification with a normalized value of 137.
Acidification or acidity is caused by dairy cow
dung waste in fresh milk extraction, which con-
tains nitrogen. Nitrogen compounds are pollutants

154
Environmental Impact Evaluation of …
Industria: Jurnal Teknologi dan Manajemen Agroindustri 10(2): 149-161 (2021)
that have specific pollution effects and can have
consequences for decreasing water quality due to
the eutrophication process (Putri, Tama, &
Yuniarti, 2014).
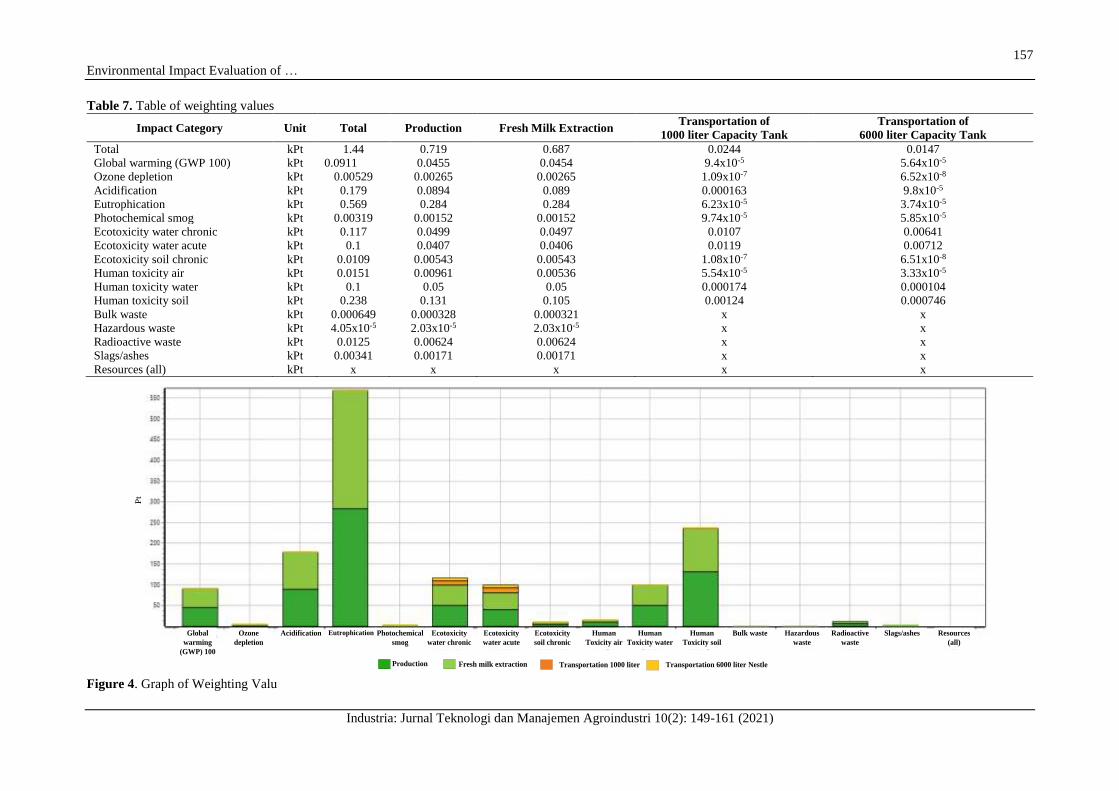
Weighting
Weighting is the stage of assessing the impact
category based on the level of importance. The
unit used for weighting is Pt or point. The Pt unit
is a dimensionless value that is used as a measure
of environmental indicators. A value of 1 Pt means
one-thousandth of the environmental burden in 1
year on the average European population. The in-
crease in the value of each impact category occurs
in weighting because there is a direct weighting
from the SimaPro 9.0.0.47 database (Eranki &
Landis, 2018). The weighting values for each im-
pact category can be seen in Table 7 and Figure 4.
The highest impact categories from the weighting
results were eutrophication, human toxicity soil,
and acidification with the weight value of 0.569
kPt, 0.238 kPt, and 0.179 kPt respectively.
Single Score
Single Score is the stage of assessment of the
most significant contribution to all processes.
Single Score indicates the process that has the
most significant impact on the environment
(Harjanto et al., 2012). The single score assess-
ment can be seen in Table 8 and Figure 5. The pro-
cess that contributed the most significant impact
was the fresh milk production process in the dairy
farmer cooperative, with a total impact contribu-
tion of 0.719 kPt. This result was caused by the
fresh milk extraction process as the input database
of the fresh milk production process. The fresh
milk extraction process contributed to the impact
of 0.678 kPt. The impact contribution caused by
the fresh milk production process itself was only
0.041 kPt, so that the fresh milk extraction process
was still considered as the process that contributed
the most significant impact at this Single Score
stage.
The transportation process using a 1000-liter
capacity tank generates the most significant im-
pact after the impact contribution of fresh milk
production process. The impact contribution gen-
erated by the transportation process was 0.0244
kPt. The smallest impact contribution was caused
by the transportation process using a 6000-liters
capacity tank which contributed 0.0147 kPt of im-
pact. The distance load and diesel fuel needed for
a tank with a capacity of 6000 liters were less than
the distance load and diesel fuel needed for a tank
with a capacity of 1000 liters so so the impact con-
tribution of the 6000-liters capacity tank was also
smaller. According to Jeong et al. (2018), the pol-
lution factors associated with emissions are gener-
ated mainly by diesel-fueled engines.
Life Cycle Interpretation
This stage includes a conclusion and recom-
mendations related to the results of the LCI and
LCIA. The interpretation results were several al-
ternative recommendations for improvement on
the most significant impact generated by the fresh
milk production process activities. The recom-
mended alternative improvements were pro-
cessing dairy cow dung into biogas, processing
dairy cow dung into manure, and utilizing dairy
cow dung into bricks. The alternative recommen-
dations for improvement were obtained based on
literature studies and discussions with expert re-
spondents.
1 p
LCA Agribusiness
Cooperative Fund
1.44x10³ Pt
1.8x10⁵ kg
Production
719 Pt
3.6x10⁵ kg
Fresh milk
extraction
1.37x10³ Pt
2.24x10⁶ kg
Grass at dairy
731 Pt
2.68x10⁵ kg
Compound feed
397 Pt
1.25x10⁶ kg
Manure, solid
246 Pt
4.9x10⁴ kg
Rapeseed meal
105 Pt
1.25x10⁶ kg
Manure, solid
246 Pt
Figure 1. Network Process

155
Environmental Impact Evaluation of …
Industria: Jurnal Teknologi dan Manajemen Agroindustri 10(2): 149-161 (2021)
Table 5. Table of characterization values
Impact Category Unit Total Production Fresh Milk
Extraction
Transportation of
1000 liter Capacity Tank
Transportation of
6000 liter Capacity Tank
Global warming (GWP 100) g CO2 7.2x10⁸ 3.59x10⁸ 3.59x10⁸ 7.43x10⁵ 4.46x10⁵
Ozone depletion g CFC-11 8.65 4.33 4.33 0.000178 0.000107
Acidification g SO2 1.02x10⁷ 5.09x10⁶ 5.07x10⁶ 9.31x10³ 5.58x10³
Eutrophication g NO3 5.64x10⁷ 2.82x10⁷ 2.82x10⁷ 6.18x10³ 3.71x10³
Photochemical smog g ethene 6.13x10⁴ 2.92x10⁴ 2.92x10⁴ 1.87x10³ 1.12x10³
Ecotoxicity water chronic m3 3.42x10⁷ 1.46x10⁷ 1.46x10⁷ 3.14x10⁶ 1.88x10⁶
Ecotoxicity water acute m3 2.65x10⁶ 1.08x10⁶ 1.07x10⁶ 3.14x10⁵ 1.88x10⁵
Ecotoxicity soil chronic m3 1.04x10⁷ 5.22x10⁶ 5.22x10⁶ 104 62.6
Human toxicity air m3 4.19x10¹⁰ 2.67x10¹⁰ 1.49x10¹⁰ 1.54x10⁸ 9.25x10⁷
Human toxicity water m3 4.02x10⁶ 2x10⁶ 2x10⁶ 6.97x10³ 4.18x10³
Human toxicity soil m3 2.52x10⁴ 1.39x10⁴ 1.11x10⁴ 132 79
Bulk waste kg 796 402 394 x x
Hazardous waste kg 0.762 0.381 0.381 x x
Radioactive waste kg 0.397 0.198 0.198 x x
Slags/ashes kg 1.08x10³ 542 542 x x
Resources (all) kg 4.43 2.18 2.15 0.0615 0.0369
%
Global
warming
(GWP)
100
Ozone
depletion
Acidification Eutrophication Photochemical
smog
Ecotoxicity
water chronic
Ecotoxicity
water acute
Ecotoxicity
soil chronic
Human
Toxicity air
Human
Toxicity water
Human
Toxicity soil
Bulk waste Hazardous
waste
Radioactive
waste
Slags/ashes Resources
(all)
Transportation 6000 liter NestleTransportation 1000 literFresh milk extractionProduction
Figure 2. Graph of Characterization Value

156
Environmental Impact Evaluation of …
Industria: Jurnal Teknologi dan Manajemen Agroindustri 10(2): 149-161 (2021)
Table 6. Table of normalization values
Impact Category Unit Total Production Fresh Milk Extraction Transportation of
1000 liter Capacity Tank
Transportation of
6000 liter Capacity Tank
Global warming (GWP 100) 82.8 41.3 41.3 0.0855 0.0513
Ozone depletion 0.084 0.042 0.042 1.72x10⁻⁶ 1.03x10⁻⁶
Acidification 137 68.7 68.5 0.126 0.0754
Eutrophication 474 237 237 0.0519 0.0312
Photochemical smog 2.45 1.17 1.17 0.075 0.045
Ecotoxicity water chronic 97.2 41.5 41.4 8.91 5.34
Ecotoxicity water acute 91.2 37 36.9 10.8 6.47
Ecotoxicity soil chronic 10.9 5.43 5.43 0.000108 6.51x10⁻⁵
Human toxicity air 13.7 8.74 4.88 0.0504 0.0302
Human toxicity water 77.1 38.5 38.5 0.134 0.0802
Human toxicity soil 198 109 87.4 1.04 0.621
Bulk waste 0.59 0.298 0.292 x x
Hazardous waste 0.0368 0.0184 0.0184 x x
Radioactive waste 11.3 5.67 5.67 x x
Slags/ashes 3.1 1.55 1.55 x x
Resources (all) x x x x x
Global
warming
(GWP) 100
Ozone
depletion
Acidification Eutrophication Photochemical
smog
Ecotoxicity
water chronic
Ecotoxicity
water acute
Ecotoxicity
soil chronic
Human
Toxicity air
Human
Toxicity water
Human
Toxicity soil
Bulk waste Hazardous
waste
Radioactive
wasteSlags/ashes Resources
(all)
Transportation 6000 liter NestleTransportation 1000 literFresh milk extractionProduction
Figure 3. Graph of Normalization Value
157
Environmental Impact Evaluation of …
Industria: Jurnal Teknologi dan Manajemen Agroindustri 10(2): 149-161 (2021)
Table 7. Table of weighting values
Impact Category Unit Total Production Fresh Milk Extraction Transportation of
1000 liter Capacity Tank
Transportation of
6000 liter Capacity Tank
Total kPt 1.44 0.719 0.687 0.0244 0.0147
Global warming (GWP 100) kPt 0.0911 0.0455 0.0454 9.4x10⁻⁵ 5.64x10⁻⁵
Ozone depletion kPt 0.00529 0.00265 0.00265 1.09x10⁻⁷ 6.52x10⁻⁸
Acidification kPt 0.179 0.0894 0.089 0.000163 9.8x10⁻⁵
Eutrophication kPt 0.569 0.284 0.284 6.23x10⁻⁵ 3.74x10⁻⁵
Photochemical smog kPt 0.00319 0.00152 0.00152 9.74x10⁻⁵ 5.85x10⁻⁵
Ecotoxicity water chronic kPt 0.117 0.0499 0.0497 0.0107 0.00641
Ecotoxicity water acute kPt 0.1 0.0407 0.0406 0.0119 0.00712
Ecotoxicity soil chronic kPt 0.0109 0.00543 0.00543 1.08x10⁻⁷ 6.51x10⁻⁸
Human toxicity air kPt 0.0151 0.00961 0.00536 5.54x10⁻⁵ 3.33x10⁻⁵
Human toxicity water kPt 0.1 0.05 0.05 0.000174 0.000104
Human toxicity soil kPt 0.238 0.131 0.105 0.00124 0.000746
Bulk waste kPt 0.000649 0.000328 0.000321 x x
Hazardous waste kPt 4.05x10⁻⁵ 2.03x10⁻⁵ 2.03x10⁻⁵ x x
Radioactive waste kPt 0.0125 0.00624 0.00624 x x
Slags/ashes kPt 0.00341 0.00171 0.00171 x x
Resources (all) kPt x x x x x
Pt
Global
warming
(GWP) 100
Ozone
depletion
Acidification Eutrophication Photochemical
smog
Ecotoxicity
water chronic
Ecotoxicity
water acute
Ecotoxicity
soil chronic
Human
Toxicity air
Human
Toxicity water
Human
Toxicity soil
Bulk waste Hazardous
waste
Radioactive
waste
Slags/ashes Resources
(all)
Transportation 6000 liter NestleTransportation 1000 literFresh milk extractionProduction
Figure 4. Graph of Weighting Valu

158
Environmental Impact Evaluation of …
Industria: Jurnal Teknologi dan Manajemen Agroindustri 10(2): 149-161 (2021)
Tabel 8. Table of single score values
Impact Category Unit Total Production Fresh Milk
Extraction
Transportation of
1000 liter Capacity Tank
Transportation of
6000 liter Capacity Tank
Total kPt 1.44 0.719 0.687 0.0244 0.0147
Global warming (GWP 100) kPt 0.0911 0.0455 0.0454 9.4x10⁻⁵ 5.64x10⁻⁵
Ozone depletion kPt 0.00529 0.00265 0.00265 1.09x10⁻⁷ 6.52x10⁻⁸
Acidification kPt 0.179 0.0894 0.089 0.000163 9.8x10⁻⁵
Eutrophication kPt 0.569 0.284 0.284 6.23x10⁻⁵ 3.74x10⁻⁵
Photochemical smog kPt 0.00319 0.00152 0.00152 9.74x10⁻⁵ 5.85x10⁻⁵
Ecotoxicity water chronic kPt 0.117 0.0499 0.0497 0.0107 0.00641
Ecotoxicity water acute kPt 0.1 0.0407 0.0406 0.0119 0.00712
Ecotoxicity soil chronic kPt 0.0109 0.00543 0.00543 1.08x10⁻⁷ 6.51x10⁻⁸
Human toxicity air kPt 0.0151 0.00961 0.00536 5.54x10⁻⁵ 3.33x10⁻⁵
Human toxicity water kPt 0.1 0.05 0.05 0.000174 0.000104
Human toxicity soil kPt 0.238 0.131 0.105 0.00124 0.000746
Bulk waste kPt 0.000649 0.000328 0.000321 x x
Hazardous waste kPt 4.05x10⁻⁵ 2.03x10⁻⁵ 2.03x10⁻⁵ x x
Radioactive waste kPt 0.0125 0.00624 0.00624 x x
Slags/ashes kPt 0.00341 0.00171 0.00171 x x
Resources (all) kPt x x x x x
Production Fresh milk
extraction
Transportation 1000 liter Transportation 6000 liter
Nestle
Pt
Global warming (GWP) 100
Human toxicity air
Ozone depletion
Human toxicity water
Acidification
Human toxicity soil
Eutrophication
Bulk waste
Photochemical smog
Hazardous waste
Ecotoxicity soil chronic
Resources (all)
Ecotoxicity water acute
Slags/ashes
Ecotoxicity water chronic
Radioactive waste Figure 5. Graph of Single Score

159
Environmental Impact Evaluation of …
Industria: Jurnal Teknologi dan Manajemen Agroindustri 10(2): 149-161 (2021)
Alternative Selection
LCA results showed that the most significant
impact of all fresh milk production activities in
dairy farmer cooperatives was the process of ex-
tracting fresh milk. The recommended alternative
improvements were processing dairy cow dung
into biogas, processing dairy cow dung into ma-
nure, and processing dairy cow dung into bricks.
The recommended alternative improvements had
also been successfully implemented in
Bangladesh to reduce emissions produced by cow
dung (Rahman et al., 2017). Biogas is a renewable
energy source that can be used to replace fossil
fuel energy sources. The decomposition of organic
material produces biogas by microorganisms. Bi-
ogas is more environmentally friendly than fuel oil
because biogas is made from renewable materials
(Wahyuni, 2013).
Another alternative improvement to reduce
the impact of fresh milk production activities on
the environment was processing dairy cow dung
waste into manure. Livestock waste is the result of
the livestock business. The waste can be processed
into compost, which can increase crop production,
increase environmental carrying capacity, in-
crease farmers' income, and reduce environmental
pollution (Okoroafor et al., 2013).
Processing dairy cow dung into bricks was
also recommended to reduce the impact of fresh
milk production activities on the environment.
Bricks from dairy cow dung are the same as bricks
in general, with the primary raw material being a
mixture of clay and dairy cow dung. Bricks from
dairy cow dung have an absorption value of 6% so
that the bricks are included in the B bricks cate-
gory (Nugroho & Annur, 2014).
The weight assessment of the improvement
recommendations was then performed using pair-
wise comparisons to determine the recommended
improvement alternatives priority. The assessment
results were then processed using Super Decision
software. The analysis results showed that the
alternative improvement with the highest weight
was the processing of dairy cow dung into manure
with a weight value of 2,425. The weight value for
processing dairy cow dung into biogas was 0.587,
while the weight value for processing dairy cow
dung into bricks was 0.212. Consistency
measurements were then performed to determine
the consistency of expert respondents in
conducting pairwise comparison assessments. The
measurement was carried out by calculating the
Consistency Ratio (CR) value in Super Decision
software. The CR calculation results showed that
the CR value was 0.07. This value means that
expert respondents were consistent in conducting
pairwise comparison assessments, and the results
can be used as a basis for decision-making.
CONCLUSIONS
The results showed that the impacts catego-
ries resulting from fresh milk production activities
in the dairy farmer cooperative were global warm-
ing (GWP 100), ozone depletion, acidification, eu-
trophication, photochemical smog, ecotoxicity
water chronic, ecotoxicity water acute, ecotoxicity
soil chronic, human toxicity air, human toxicity
water, human toxicity soil, bulk waste, hazardous
waste, radioactive waste, slags/ashes, and re-
sources (all). The highest impact categories from
these activities were eutrophication, human tox-
icity soil, and acidification. The most significant
contamination potential from fresh milk produc-
tion activities occurred in the fresh milk extraction
process with an impact value of 1.37x10³ Pt. Al-
ternative priorities for improvement to reduce this
impact were processing dairy cow dung into ma-
nure, processing dairy cow dung into biogas, and
processing dairy cow dung into bricks with weight
values of 2.425, 0.587, 0.212, respectively. Fur-
ther research can evaluate the impact resulting
from the dairy products production activities in the
milk processing factory.
ACKNOWLEDGEMENT
Thanks to the Wageningen Centre for Devel-
opment Innovation, Netherlands which support
the fellowship and networking of the participants
of Refresher Course Food Safety and Phyto-
sanitary Measures in Global Horticulture Supply
Chains in Indonesia so that some participants can
collaborate in this study.
References
Astuti, R., Deoranto, P., & Aula, M. M. (2019).
Productivity and environmental performance: an
empirical evidence from a furniture factory in
Malang City, Indonesia. IOP Conference Series:
Earth and Environmental Science, 230, 012064.
https://doi.org/10.1088/1755-1315/230/1/012064
Badan Pusat Statistik. (2021). Fresh Milk Production
by Province (Tons), 2018-2020. Retrieved August
1, 2021, from https://www.bps.go.id/indicator/
24/493/1/produksi-susu-segar-menurut-

160
Environmental Impact Evaluation of …
Industria: Jurnal Teknologi dan Manajemen Agroindustri 10(2): 149-161 (2021)
provinsi.html
Barzegar, M., Rasi, R. E., & Niknamfar, A. H. (2018).
Analyzing the drivers of green manufacturing using
an analytic network process method: A case study.
International Journal of Research in Industrial
Engineering, 7(1), 61–83.
Eranki, P. L., & Landis, A. E. (2018). Pathway to
domestic natural rubber production: a cradle-to-
grave life cycle assessment of the first guayule
automobile tire manufactured in the United States.
The International Journal of Life Cycle Assessment,
24(8), 1348–1359. https://doi.org/10.1007/s11367-
018-1572-3
Harjanto, T. R., Fahrurrozi, M., & Bendiyasa, I. M.
(2012). Life cycle assessment pabrik semen PT
Holcim Indonesia tbk. Pabrik Cilacap: Komparasi
antara bahan bakar batubara dengan biomassa.
Jurnal Rekayasa Proses, 6(2), 51–58.
Khalil, M., Berawi, M. A., Heryanto, R., & Rizalie, A.
(2019). Waste to energy technology: The potential
of sustainable biogas production from animal waste
in Indonesia. Renewable and Sustainable Energy
Reviews, 105, 323–331. https://doi.org/10.1016/
j.rser.2019.02.011
Lestari, F., & Dinata, R. S. (2019). Green supply chain
management untuk evaluasi manajemen lingkungan
berdasarkan sertifikasi ISO 14001. Industria:
Jurnal Teknologi Dan Manajemen Agroindustri,
8(3), 209–217. https://doi.org/10.21776/ub.
industria.2019.008.03.5
Malone, T. C., & Newton, A. (2020). The globalization
of cultural eutrophication in the coastal ocean:
Causes and consequences. Frontiers in Marine
Science, 7, 1–30. https://doi.org/10.3389/fmars.
2020.00670
Mustaniroh, S. A., Kurniawan, Z. A. F., & Deoranto, P.
(2019). Evaluasi kinerja pada green supply chain
management susu pasteurisasi di Koperasi Agro
Niaga Jabung. Industria: Jurnal Teknologi Dan
Manajemen Agroindustri, 8(1), 57–66.
https://doi.org/10.21776/ub.industria.2019.008.01.
7
Nugroho, M. D., & Annur, M. D. R. (2014).
Pemanfaatan kotoran sapi untuk material konstruksi
dalam upaya pemecahan masalah sosial serta
peningkatan taraf ekonomi masyarakat. Jurnal
Sosioteknologi, 13(2), 101–109. https://doi.org/
10.5614/sostek.itbj.2014.13.2.4
Okoroafor, I. B., Okelola, E. O., Edeh, O. N., Emehute,
V. C., Onu, C. N., Nwaneri, T. C., & Chinaka, G. I.
(2013). Effect of organic manure on the growth and
yield performance of maize in Ishiagu, Ebonyi
State, Nigeria. IOSR Journal of Agriculture and
Veterinary Science, 5(4), 28–31.
Palupi, A. H., Tama, I. P., & Sari, R. A. (2014).
Evaluasi dampak lingkungan produk kertas dengan
menggunakan Life Cycle Assessment (LCA) dan
Analytic Network Process (ANP) (Studi Kasus: PT
X Probolinggo). JRMSI, 2(5), 1136–1147.
Park, W.-J., Kim, R., Roh, S., & Ban, H. (2020).
Analysis of major environmental impact categories
of road construction materials. Sustainability,
12(17), 6951. https://doi.org/10.3390/su12176951
Putri, R. P., Tama, I. P., & Yuniarti, R. (2014). Evaluasi
dampak lingkungan pada aktivitas supply chain
produk susu KUD Batu dengan implementasi life
cycle assessment (LCA) dan pendekatan analytic
network process (ANP). JRMSI, 2(4), 684–695.
Rahman, K. M., Melville, L., Fulford, D., & Huq, S. I.
(2017). Green-house gas mitigation capacity of a
small scale rural biogas plant calculations for
Bangladesh through a general life cycle assessment.
Waste Management & Research: The Journal for a
Sustainable Circular Economy, 35(10), 1023–1033.
https://doi.org/10.1177/0734242X17721341
Ramos, A., Briga-Sá, A., Pereira, S., Correia, M., Pinto,
J., Bentes, I., & Teixeira, C. A. (2021). Thermal
performance and life cycle assessment of corn cob
particleboards. Journal of Building Engineering,
44, 102998. https://doi.org/10.1016/j.jobe.2021.
102998
Saaty, T. L. (2012a). Decision Making for Leaders: The
Analytic Hierarchy Process for Decisions in a
Complex World (3rd ed.). Pittsburgh: RWS
Publications.
Saaty, T. L. (2012b). Fundamentals of Decision
Making and Priority Theory. Pittsburgh: RWS
Publications.
Saputro, D. D., Wijaya, B. R., & Wijayanti, Y. (2014).
Pengelolaan limbah peternakan sapi untuk
meningkatkan kapasitas produksi pada Kelompok
Ternak Patra Sutera. Rekayasa : Jurnal Penerapan
Teknologi Dan Pembelajaran, 12(2), 91–98.
Septifani, R., Astuti, R., & Akbar, R. N. (2020). Green
productivity analysis of tempeh chips production.
IOP Conference Series: Earth and Environmental
Science, 475, 012047. https://doi.org/10.1088/1755
-1315/475/1/012047
Soeparno. (2021). Properti dan Teknologi Produk

161
Environmental Impact Evaluation of …
Industria: Jurnal Teknologi dan Manajemen Agroindustri 10(2): 149-161 (2021)
Susu. Yogyakarta: Gadjah Mada University Press.
Wahyuni, S. (2013). Biogas Energi Alternatif
Pengganti BBM, Gas dan Listrik. Jakarta:
Agromedia.
Windrianto, Y., Lucitasari, D. R., & Berlianty, I.
(2016). Pengukuran tingkat eko-efisiensi
menggunakan metode life cycle assessment (LCA)
untuk menciptakan produksi batik yang efisien dan
ramah lingkungan (Studi kasus di UKM Sri
Kuncoro Bantul). Opsi, 9(2), 143–149.
https://doi.org/10.31315/opsi.v9i2.2324