environmental impact assessment (eia) training course as ... · nina oppdragsmelding (assignment...
TRANSCRIPT

Environmental Impact Assessment (EIA) trainingcourse as part of the TAWIRI - NINA collaborationEds:Jørn ThomassenCassian T. MumbiBjørn P. Kaltenborn
TAWIRI - NINA collaborative programme in capacity building
25
W I L D L I F E E N V I R O N M E N T A L C H A N G E C U L T U R E B I O D I V E R S I T Y
NINA Project report
Cooperation and expertise for a sustainable future

EEnnvviirroonnmmeennttaall IImmppaacctt AAsssseessssmmeenntt ((EEIIAA)) ttrraaiinniinngg ccoouurrssee aassppaarrtt ooff tthhee TTAAWWIIRRII--NNIINNAA ccoollllaabboorraattiioonnConducted at Serengeti Wildlife Research Centre, April 22-26, 2002
Eds:Jørn Thomassen*
Cassian T. Mumbi**
Bjørn P. Kaltenborn***
* Norwegian Institute for Nature Research, Tungasletta 2, NO-7485, Trondheim, Norway ** Tanzania Wildlife Research Institute, Box 661, Arusha, Tanzania *** Norwegian Institute for Nature Research, Fakkelgården, NO-2624, Lillehammer, Norway
TTAAWWIIRRII -- NNIINNAA ccoollllaabboorraattiivvee pprrooggrraammmmee iinn ccaappaacciittyy bbuuiillddiinngg
Norwegian Institute for Nature ResearchNINA

nina Project Report 25
2
Norwegian Institute for Nature Research(NINA) issue the following publications:
NINA Project Report This series presents the results of the institutes' projects whenthe results are to be made available in English. The series mayinclude reports on original research, literature reviews, analysisof particular problems or subjects, etc. The number of copiesprinted will depend on demand.
In addition to this report series published in English, NINApublish the following series in Norwegian:
NINA Fagrapport (Scientific Reports)This series present the results of NINAs own research work,overviews of problems, existing knowledge within a topic, lite-rature reviews and material gathered from outside sources. Thereports are issued as an alternative or a supplement to internati-onal publication when timing, the nature of the material or thesector targeted, call for it.
NINA Oppdragsmelding (Assignment Report)This is the minimum report supplied by NINA when externalresearch or investigative assignments have been completed. Thenumbers of copies are limited.
NINA Temahefte (Topic)These series present special topics. They are targeted at thegeneral public or specific groups in the community, e.g. theagricultural sector, environmental departments, tourism andoutdoor recreation, organizations etc. It is therefore more popu-lar in its presentation form, with more illustrations than the pre-viously mentioned series.
Most of the publications mentioned above are in Norwegian,but will also have an English abstract and legends of figures andtables in English.
NINA Fact Sheet (Fakta-ark)These double-pages sheets give (in Norwegian) a popular sum-mary of other publications to make the results of NINAs workavailable to the general public (the media, societies and organi-zations, various levels of nature management, politicians andinterested individuals).
NINAs staffs also publish their research results in inter-nationalscientific journals, popular scientific periodicals, and newspa-pers.
Thomassen, J., Mumbi, C. T. & Kaltenborn, B. P. (eds.) 2003.Environmental Impact Assessment (EIA) training course as partof the TAWIRI – NINA collaborative programme in capacitybuilding. NINA Project Report 25. 34pp.
Trondheim, November 2003
ISSN 1502-6779ISBN 82-426-1423-7
Management areas:Human- environment studiesPeople- wildlife interactions
Copyright©: NINA, Norwegian Institute for Nature ResearchThe report may be quoted with reference to the source by name
Editor(s):Jørn ThomassenNINA
Quality assuranceJørn ThomassenNINA
Design and layout:Ingrid BrandsletGraphic office NINA
Photograph frontcover: Jørn Thomassen
Stock: 200 (also available as pdf-format)
Contact address:NINATungasletta 2NO-7485 Trondheim, NORWAYTel: +47 73 80 14 00Fax: +47 73 80 14 01Internet: http://www.nina.no
Accessibility: Open
Project nr.: 17261000Signature of responsible person:
Assignment for: Norwegian Agency for Development Cooperation (NORAD)

ReferatThomassen, J., Mumbi, C. T. & Kaltenborn, B. P. (eds.) 2003.Environmental Impact Assessment (EIA) training course as partof the TAWIRI – NINA collaborative programme in capacity bu-ilding. NINA Project Report 25. 34pp.
Som et ledd i samarbeidsprogrammet i kapasitetsbygging(2002-2006) mellom Tanzania Wildlife Research Institute (TA-WIRI) og NINA er det gjennomført et kurs for TAWIRI ansatte iEnvironmental Impact Assessments (EIA – konsekvensutred-ninger). Denne rapporten oppsummerer kurset, inkludert denteoretiske plattformen, en step by step prosedyre for gjennom-føring av EIA etter Adaptive Environmental Assessment andManagement (AEAM) metoden, samt resultatene fra selve kur-set.
Nøkkelord: Konsekvensutredninger, scoping, AdaptiveEnvironmental Assessment and Management, kapasitetsbyg-ging, samarbeid
nina Project Report 25
3
AbstractThomassen, J., Mumbi, C. T. & Kaltenborn, B. P. (eds.) 2003.Environmental Impact Assessment (EIA) training course as partof the TAWIRI – NINA collaborative programme in capacity bu-ilding. NINA Project Report 25. 34pp.
This publication is part of the reporting from the TAWIRI –NINA collaborative programme in capacity building (2002 –2006). One of the targets in this programme is to provide TA-WIRI with an overview and a basic knowledge inEnvironmental Impact Assessment (EIA) to be prepared to carryout EIAs themselves in the future. The purpose of this report isto give a brief overview of the training course, including thetheoretical platform, a step by step procedure when using theAdaptive Environmental Assessment and Management(AEAM) approach in the EIA, and summarise the results fromthe training course.
Keywords: Environmental Impact Assessment, scoping,Adaptive Environmental Assessment and Management, capa-city building, collaborationCorresponding authion, e-mail: [email protected]

ForewordThis publication is part of the reporting from the TAWIRI –NINA collaborative programme in capacity building (2002 –2006). One of the targets in this programme is to provide TA-WIRI with an overview and a basic knowledge inEnvironmental Impact Assessment (EIA) to be prepared to con-duct EIAs themselves in the future. The purpose of this reportis to give a brief overview of the training course, including thetheoretical platform, a step by step procedure when using theAdaptive Environmental Assessment and Management(AEAM) approach in the EIA, and summarise the results fromthe training course.
The EIA training course is part of the collaboration betweenNINA and Tanzania Wildlife Research Institute (TAWIRI). Thetwo institutes co-operate on several fronts ranging from insti-tutional capacity building to field research.
TAWIRI is the central wildlife research agency in Tanzania, andas such mandated to carry out and co-ordinate research withinand outside the protected areas as well as conducting EIAs inTanzania. To be able to fulfil its mandate TAWIRI needs to in-crease their capacity and skills in planning and conducting re-search and Environmental Impact Assessments (EIA).
Funding for the capacity building collaborative programme(2002-2006), which includes the EIA training, is provided byNORAD. We wish to thank the staff at Serengeti WildlifeResearch Centre who made the training course to a successfulevent. We also will give honour to the participants who sho-wed strong willingness to seek new information and learnabout the EIA fundamental principles, process and approach.
It is our hope that that the training course and this report willbe the starting point for TAWIRI to be able to conduct EIAs,and also to develop their own institutional EIA guidelines andskills adapted to the EIA practice and future EIA legislation inTanzania.
Trondheim, Norway, 10.11.03
Jørn Thomassen
nina Project Report 25
4
Table of contentsReferat ........................................................................3Abstract ........................................................................3Foreword ........................................................................4Table of contents ...........................................................4List of acronyms .............................................................5
PART A: Theoretical platform ........................................61. Introduction ..........................................................62. Environmental Impact Assessment as a
management tool ..................................................63. General principles of EIA .......................................64. The EIA process ....................................................75. Case study description: Tourism in Serengeti N.P. ..8
Why tourism? ........................................................8Tourism in Serengeti N.P. – what to look at? .........8
6. The Adaptive Environmental Assessment and Management (AEAM) .....................................9Valued Ecosystem Components (VECs) ................10Schematic Flow Charts ........................................10Impact Hypotheses (IHs) ......................................10Evaluation of Impact Hypotheses ........................10Recommendations ...............................................11
7. Literature ............................................................11
PART B: AEAM – Step by step .....................................12Step 1: Introduction (lecture in plenary) ....................12Step 2: Basic information: description of the project
and of the potential affected environmentand society (lecture in plenary) ......................12
Step 3: Identification of major impact factors (group work 1) ..............................................12
Step 4: Plenary presentations, discussion and conclusions ...................................................13
Step 5: Identification of Valued Ecosystem Components (VECs) (group work 2) ..............13
Step 6: Plenary presentations, discussion and conclusions ..................................................13
Step 7: Construction of Schematic Flow Charts(group work 3) ..............................................14
Step 8: Plenary presentations, discussion and conclusions ..................................................14
Step 9: Formulation of Impact Hypotheses (IHs) and evaluation of the IHs (group work 4) ......14
Step 10: Plenary presentations, discussion and conclusions ..................................................15
Step 11: Recommendations (group work 5) ................15Step 12: Plenary presentations, discussion and
conclusions ...................................................15Summing up ...............................................................15
PART C: Results from the training course ...................161. Identification of Impact Factors ............................162. Identification of Valued Ecosystem Components
(VECs) .................................................................17

3. Construction of Schematic Flow Charts ...............194 Impact Hypotheses (IH), evaluation of IHs and
recommendations ............................................... 23
Annexes ......................................................................301. An example of work plan and time schedule for
conducting EIA based on the AEAM concept....... 302. List of participants ............................................... 323. Tentative programme .......................................... 33
nina Project Report 25
List of acronymsAEAM Environmental Assessment and ManagementEIA Environmental Impact AssessmentFBD Forestry and Beekeeping DivisionGNP Gross National ProductIH Impact HypothesisMNRT Ministry of Natural Resources and Tourism NCAA Ngorongoro Conservation Area AuthorityNGO Non Governmental OrganisationNINA Norwegian Institute for Nature ResearchNP National ParkSENEPA Serengeti National ParkSWRC Serengeti Wildlife Research CentreTANAPA Tanzania National ParksTAWIRI Tanzania Wildlife Research InstituteTEK Traditional Ecological KnowledgeVEC Valued Ecosystem ComponentVSC Valued Social ComponentsWD Wildlife Division
5

Executive summaryAs part of the capacity building collaboration betweenTanzania Wildlife Research Institute (TAWIRI) and NorwegianInstitute for Nature Research (NINA), a training course inEnvironmental Impact Assessment (EIA) was held at theSerengeti Wildlife Research Centre (SWRC) premises in theSerengeti National Park, for 5 days from April 21 – 26, 2002.Thirteen staff from TAWIRI, one from Tanzania National ParkAuthorities (TANAPA) and one from the NgorongoroConservation Area Authority (NCAA) attended the course.The trainers/facilitators were Jørn Thomassen and Bjørn P.Kaltenborn from NINA; with assistance from Kari HeleneBachke Andresen, Norway.
The course was intensive, covering introduction to EIA, gene-ral principles of EIA, EIA legislations, guidelines and policies inthe country, and the quality of Environmental ImpactAssessment in the European Union. Emphasis were put onscoping in the EIA process by using the methodologicalapproach Adaptive Environmental Assessment andManagement (AEAM), were priorities, selections and docu-mentation with regards to decision-making are the main ele-ments. The AEAM approach is based on workshop(s) weredifferent stakeholders participate. The training course wasorganised in working groups with subsequently plenary pre-sentations of the results, and subsequent discussions andconclusions. The basic ideas in AEAM is to give priority toValued Ecosystem Components (VECs), which are the compo-nents to be focused on in an EIA for a specific development.For each VEC a Schematic Flow Chart is constructed, a set ofImpact Hypotheses (IHs) identified and evaluated, and finally,several recommendations given concerning further investigati-ons, research, managing actions and mitigating measures.
For practical purposes, the case study of Tourism in theSerengeti National Park, Tanzania was used. Using the casestudy, impact factors on the environment, natural resourcesand the society were served.
This report gives a summary of the training course and is divi-ded into three parts:
• Part A deals with the theoretical platform for the course; • Part B describes a step by step procedure when using the
AEAM approach in the EIA; and • Part C summarise the result from the different group
works in the training course.
It is a hope that the training course and this report will be thestarting point for TAWIRI to be able to conduct EIAs, and alsoto develop their own institutional EIA guidelines adapted tothe EIA practice and future legislation in Tanzania.
nina Project Report 25
PART A: Theoretical platform1. Introduction
Tanzania Wildlife Research Institute is a GovernmentalOrganisation whose role is to co-ordinate and carry outwildlife research in Tanzania, and advice relevant manage-ment authorities on sustainable conservation of wildliferesources in their respective areas.
The principal stakeholders for TAWIRI include the Ministry ofNatural Resources and Tourism (MNRT), Wildlife Division(WD), Tanzania National Parks (TANAPA), Forestry andBeekeeping Division (FBD) and Ngorongoro Conservation AreaAuthority (NCAA). The stakeholders’ premises are proving todevelopment projects/activities, which require EnvironmentalImpact Assessment (EIA) from time to time. Such activitiesinclude impacts from different encroachments, for examplebuilding construction of tourist hotels, campsites, officepremises, staff quarters, roads etc.
For a long time in the past, the development projects inTanzania were done without EIA, or by hiring expertise fromother organisations and institutions than TAWIRI. The reasonfor this was that TAWIRI had not trained personnel to conductEIAs or in position to bid for EIAs. The situation is nowchanged and TAWIRI has enough personnel with requiredqualification to be trained in EIA. Norwegian Institute forNature Research (NINA) has expertise and experience in plan-ning and conducting EIAs, and it was found appropriate toinclude EIA training as part of the capacity building collabora-tion between NINA and TAWIRI.
The EIA training course was conducted at Serengeti WildlifeResearch Centre in the Serengeti National Park, from April 22to 26, 2002. The premises were the most ideal for the casestudy, which was “Tourism in the Serengeti National Park,Tanzania”.
There were 15 course participants including 13 from TAWIRI,1 from Ngorongoro Conservation Area Authority and 1 fromTANAPA.
2. Environmental Impact Assessmentas a management tool
The Environmental Impact Assessment can be defined as aformal study process used to predict the environmental conse-quences of a proposed major development project. It aims toensure that potential problems are foreseen and addressed atan early stage in the project’s planning and designing. Inorder to achieve this, the assessment findings are communi-cated to all various groups who will make decisions about theproposed project; the project developers and their investors,planners and politicians.
6

minimise adverse impacts.
Guidelines for conducting EIAs in Tanzania have been workedout by the Institute of Resource Assessment, Dar es Salaam,Tanzania in collaboration with the International Institute forEnvironment and Development, UK, but there are no EIA legislation implemented in Tanzania yet.
3. General principles of EIA
Generally and simply spoken, EIA can be thought of as a datamanagement process with three main components (Wathern1988):
1. The identification (and possibly collection) of appropriateinformation necessary for different decisions to be taken.
2. Potential changes in environment and society caused bythe implementation of the pro-ject must be assessed and com-pared with the situation withoutthe project (0-alternative).
3. Actual change must be recordedand analysed.
4. The EIA process
The EIA process vary slightly fromcountry to country, but a generalpicture of the process and princi-ples can nevertheless be generated(Figure 1).
nina Project Report 25
Figure 1. A simplified picture of the EIA pro-cess.
7
Like economic analysis and engineering feasibility studies, EIAis a management tool for officials and managers who mustmake important decisions about major development projects.All developers are familiar with economic and engineeringstudies. These tools provide the basis for designing robust,economically and viable projects. EIA is now seen as an equal-ly important tool in designing a viable project.
In recent, major projects have encountered serious difficultiesbecause insufficient account has been taken of their relation-ship with the surrounding environment. Some projects havebeen found to be unsustainable because of resource deple-tion. Others have abandon because of public opposition,financially encumbered by unforeseen costs, held liable fordamages to natural resources and even been the cause of dis-astrous accidents. Given this experience, it is clearly very riskyto undertake, finance, or approve a major project without firsttaking into account its environmental (and social) conse-quences and then planning and designing the project so as to

5. Case study description: Tourism inSerengeti N.P.
Why tourism?There are many definitions of tourism.
• Going away from home for leisure, recreation.• Generally domestic and international travel to experience
nature and culture. • Tourism is the largest domestic industry in the world, sec-
ond only in global spending to the military industry.• Nature-based tourism is the fastest growing segment of
international tourism with a growth in turnover and vol-ume of approx. 10 per cent annually.
Tourism is a highly dynamic social and economic system.Important approaches include:
• Socio-economic issues• Cultural issues• Market studies, and the economics of tourism• Ecological issues, environmental impacts
Tourism is a mirror of a society. Some critics claim thattourism cannot be sustainable because society itself is not sus-tainable. Tourism in East Africa is a critical factor in thenational economy, but it is also a complex and fragile system,subject to global economic fluctuations and political instabili-ties.
Figure 2. When a charismatic animal (in this case a leopard) is detected,congestion of tourists can reach high levels. Photo: J. Thomassen.
Tourism in Serengeti N.P. – what to look at?Serengeti National Park (SENAPA) was gazetted to a NationalPark 50 years ago. Year 2001 revenue collection on tourism inSENAPA totalled to USD 6 million.
Main question: What will be the future of tourism in
nina Project Report 25
Serengeti? What will happen in 10 years from now? Whichsubjects/factors are important to consider?
• Changes in tourism patterns, increased demand for qualityexperiences (interpretation guides, facilities, domesticationtourism)
• Infrastructure development (lodges, roads etc.)• Strengthening private sector• Political instability in East Africa• Increasing poverty – community relations - benefit sharing• Security concerns – technical and communication infra-
structure• Relationships between science and tourism• New ecotourism products• Changing roles of managers: from police to service• Environmental requirements/certification of managers and
science• Re-introduction of species and diseases.
Serengeti National Park is one of the most famous wildlifeparks in the world, and has a long tourism history. Tourismvisitation and revenue is critical for maintaining the operatingbudget of the park. At the same time, little is known aboutthe type, magnitude, and extent of environmental impacts aswell as the quality of hospitality management and the visitorexperience. The management zone plan of the park specifiesa large number of tourism management objectives in theareas of access/development, visitor use/experience, parkoperations and development, relations and benefits to sur-rounding local communities, cultural resources, and naturalresources. The main purpose of the park is to preserve aunique wilderness type ecosystem and promote sustainablenature-based tourism. This will require increased knowledgeabout the various facets of the tourism system as well as theenvironmental impacts.
Figure 3. One of the more popular species to watch and photograph isthe leopard. Photo: J. Thomassen.
8

Figure 4. Schematic pictureof the differentsteps in the AEAMapproach used inscoping. Case stu-dy is tourism inSerengeti NP,Tanzania.
6. The Adaptive EnvironmentalAssessment and Management(AEAM)
One major challenge in EIA is to identify a limited number ofissues to be addressed by the EIA (Beanlands 1988). This pro-cess is called scoping and will normally include considerationsof impact factors and potential impacts, decision makers,stakeholders, alternatives, access of baseline information, timeschedule and also economic frames. The scoping phase in EIAis furthermore critical for an optimal use of limited resourcesin the perspective of personnel, time and economy, andshould be accomplished as early as possible in the process.
One approach is to use an adjusted form of the AdaptiveEnvironmental Assessment and Management (AEAM) concept(Holling 1978, Hansson et al. 1990, Thomassen et al. 1996,1998). As an EIA normally shall cover various subjects con-cerning environment , natural resources and society, differentactors and stakeholders will be involved in different phases of
nina Project Report 25
the process. Obviously, communication between decisionmakers, authorities, management, public, consultants and sci-entists should be accomplished in a very early stage of an EIA,with the objective to scope on important issues in each specif-ic EIA context. AEAM is a participatory process, based onwork shops attended by different stakeholder and projectholders.
In AEAM the impact predictions and significance includes theselection and priority of VECs (Valued EcosystemComponents), which can be affected by the developmentactivities. Further, to point out major linkages between thedifferent components in the system, by preparing SchematicFlow Charts, and the impact factors by defining and describ-ing (IHs) (Impact Hypotheses) (see Figure 4). Key statements inevery scientific work, as well as in EIA, should be the possibili-ties to document and control the process and the choicesdone. It should be obvious that an open and well-document-ed process is essential when numerous subjects are rejectedas not important enough.
9

Valued Ecosystem Components (VECs)A Valued Ecosystem Component is defined as a resourceor environmental feature that: is important (not onlyeconomically) to a local human population, or has anational or international profile, or if altered from itsexisting status, will be important for the evaluation ofenvironmental impacts of industrial developments, andthe focusing of administrative efforts (Hansson et al.1990).
The selection of VECs is probably the most important and atthe same time the most difficult step in the process of selec-tion and focusing in the EIA. The critical point is to focus ondecision-making, and the VEC concept therefore also shouldinclude social, political and economical qualities. Moreover,there are only rooms for a limited number of VECs, which inturn call for high critical sense in the selection process.
In the EIA work carried out in the Beaufort Sea Region inCanada (see Indian and Northern Affairs Canada 1992a,b,1993) the social components of the EIA are treated by defin-ing and describing so-called Valued Social Components (VSC)in addition to the VECs. The society is clearly an importantpart of the EIA, and the society-based concerns in the devel-opment can be assessed through a clearly defined process, forexample by definitions of VSCs.
Schematic Flow ChartsA Schematic Flow Chart is a diagram of boxes and arrowsindicating in which context each of the VECs appears. Thatmeans which type of impact from the proposed activity willaffect the VEC and how. Each linkage shall be explained in abrief text following the chart. Hansson et al. (1990) describedthe content of the flow chart to include the main categoriesof the physical, biological and possibly also social and politicalfactors influencing the VEC, so-called system components,and impacts from the planned activities, calleddevelopments.
The relationships between the components are called link-ages, and so far we will not put great effort into the quantifi-cation of these linkages by means of for example energy flow,biomass, importance etc. It is however, important that eachlinkage in the flow chart is followed by a brief explanation.See Part C, chapter 3 in this report, showing examples offlow charts.
If all the connections between each VEC and the differentcomponents on primary, secondary, tertiary.... level should beincluded in the flow chart, a more or less chaotic picturewould occur. Each flow chart, therefore, only comprises thecomponents that are in direct contact with the VEC. The flowchart will form the basis for formulating Impact Hypotheses.
When building up the flow chart we use the following sym-bols:
nina Project Report 25
Impact Hypotheses (IHs)An Impact Hypothesis is a hypothesis for testing the possibleimpact from the activity on the VEC. The impact hypothesis isbased on the schematic flow chart and shall be explained anddescribed preferably in scientific terms. The IH is also the basisfor recommendations concerning research, investigations,monitoring and management actions, including mitigatingmeasures.
The flow charts and the linkages indicate which activities willinfluence the VEC directly, or indirectly via the system compo-nents. By means of the linkages a series of impact hypothesescan be prepared for each VEC. All IHs shall be scientific docu-mented if possible. At this stage of the process it is importantto cover all the impacts that can affect the VEC.
Evaluation of Impact Hypotheses After the preparation of the IHs, an evaluation procedure isaccomplished for each IH, putting them into one of the fol-lowing categories:
10
A. The hypothesis is assumed not to be valid. B. The hypothesis is valid and already verified.
Research to validate or invalidate the hypothesis isnot required. Surveys, monitoring, and/or manage-ment measures can possible be recommended.
C. The hypothesis is assumed to be valid. Research,monitoring or surveys is recommended to validateor invalidate the hypothesis. Mitigating measurescan be recommended if the hypothesis is proved tobe valid.
D. The hypothesis may be valid, but is not worth test-ing for professional, logistic, economic or ethicalreasons, or because it is assumed to be of minorenvironmental influence only or of insignificantvalue for decision making.
We use a standard diagram (See Part C, chapter 4 in thisreport for examples) when listing up the evaluated IHs, onediagram for each IH. In the active assessment system, only IHsplaced in category B, C and sometimes D are brought forwardto the assessment of impacts. Normally, the category C -hypotheses will be tested through research, monitoring orsurveys, which also will reflect the different ongoing activitiesin the «Terms of Reference» for an EIA.

Moreover, it is important that all decisions are explained andthat significant references for the decisions are given. In theEIA process it is of significant value to document the differentsteps and choices against the defined objectives.
RecommendationsAs a consequence of the evaluation of the impact hypotheses,several recommendations conserning further investigations/research (baseline), monitoring, management actions andmigration measures are normally given.
Baseline studiesBeanlands (1988) states that baseline studies refers to the col-lection of background information on the environment andsocio-economic setting for a proposed development project,and that a program on baseline studies can be designedaround the results of a scoping exercise.
The needs for research, monitoring and/or surveyingTo validate or invalidate the IHs, research, monitoring and/orsurveying may be necessary. In this context it is important tobear in mind the “good enough” -principle and the relevanceof decisions. It is also important to describe the needs for dataand the methods to be used in testing the hypotheses.
The needs for management actions and mitigating measuresA natural part of an EIA will be to give recommendations con-cerning management actions and mitigating measures withrespect to the proposed activities. It is important not to forgetthis in the early phase of the EIA-process, as this often will bethe most important contribution from the EIA. Recommen-dations concerning revised plans to mitigate negative effectson the environment and on the society must be done in theearly phase of the development.
nina Project Report 25
7.Literature
Beanlands, G. 1988. Scoping methods and baseline studies inEIA. - In Wathern, P. (ed.). Environmental ImpactAssessment: theory and practice. theory and practice.Academic Div. of Unwin Hyman Ltd. London. 332 pp.
Hansson, R., Prestrud, P. & Øritsland, N.A. 1990. Assessmentsystem for the environment and industrial activities atSvalbard. Norw. Polar Research Institute, Report no. 68– 1990. 267 pp.
Holling, C.S. 1978. Adaptive environmental assessment andmanagement. John Wiley & Sons: Chichester- NewYork - Brisbane - Toronto. 1986.
Indian and Northern Affairs Canada 1992a. Beaufort RegionEnvironmental Assessment and Monitoring Program(BREAM). Final Report for 1990/1991. EnvironmentalStudies No. 67. 416 pp.
Indian and Northern Affairs Canada 1992b. Beaufort RegionEnvironmental Assessment and Monitoring Program(BREAM). Final Report for 1991/1992. EnvironmentalStudies No. 69. 359 pp.
Indian and Northern Affairs Canada 1993. Beaufort RegionEnvironmental Assessment and Monitoring Program(BREAM). Final Report for 1992/1993. EnvironmentalStudies No. 71. 298 pp.
Thomassen, J., Løvås, S.M. & Vefsnmo, S. 1996. The adaptiveEnvironmental Assessment and management AEAM inINSROP - Impact Assessment Design. INSROP WorkingPaper No. 31 - 1996. 45 pp.
Thomassen, J., Moe, K.A. & Brude, O.W. 1998. A guide to EIAimplementation INSROP phase II. INSROP DiscussionPaper, June 1998 / INSROP Working Paper No. 142: 91pp.
Wathern, P. (ed.) 1988. Environmental Impact Assessment:theory and practice. Academic Div. of Unwin HymanLtd. London. 332 pp.
11

PART B: AEAM – Step by step
Step 1: Introduction (lecture in plenary)
Describe the principles of EIA and the AEAM process.Important aspects are:
• The Adaptive Environmental Assessment and Manage-ment (AEAM) approach is a participatory systematicmethod designed for work with EIA.
• The working method in AEAM is based on workshop(s)where different stakeholders participate, and where theparticipants alternate between group works and plenarypresentations, discussions and conclusions.
• An experienced facilitator lead the process• 2 to 4 groups with 4-8 members in each is normal and
preferable.• The group composition can change between mixed and
professional according to the task of the group work.• Normally the length of each group work vary between 1
and 2 hours.• According to the size of the EIA, work shops normally last
for 3-5 days.• The participants should cover different stakeholder inter-
ests in the project, and normally include the local commu-nities, NGOs, management authorities (local to nationallevel), representatives from the project holder, profession-als responsible for the EIA etc.
• With different stakeholders involved, the workshop pro-cess can contribute to achieve important results such ascommunication, awareness, ownership to the project andconflict reduction.
• With relatively short time available at each group work,the principal group work philosophy is that the mostimportant and significant problems and solutions will beexposed during the process.
Step 2: Basic information: descripti-on of the project and of thepotential affected environ-ment and society (informati-on given in plenary)
Describe the development plans as detailed as possible withemphasis on potential positive and negative factors concern-ing the environment, natural resources and the society. Beaware of the difference between the construction phase, theoperating phase and the decommission phase.
Describe available baseline information concerning the envi-ronment, natural resources and society in the influence area,
nina Project Report 25
including the accessibility of the data and which format it isstored in. Be especially aware of protected areas, red list andthreatened species, vulnerable habitats and biotopes and tra-ditional ecological knowledge (TEK).
Identify the decision makers and the various decisions to betaken in the EIA process. Mapping of roles, actors and respon-sibilities in the process can be vital to ensure transparency andfrankness.
Step 3: Identification of majorimpact factors (group work 1)
Objective: Identification and discussion of major impact fac-tors from the development plans.
Approach: All groups work with the same task. Use the firstminutes of the group work to be familiar with the develop-ment plans and the potential impacts and impact factors.Discuss the impact factors in the group, rank them withrespect to importance and make conclusions. Explain why theselected impact factors are given priority. One of the groupmembers are responsible for summing up and present theresults in plenary. Use a standardised form for presentation.
Output: A set of potential impact factors with explanationsfrom each group.
Estimated duration of group work: 1.5- 2 hours.
Figure 5. Lodges and tented camps are established as part of the tourisminfrastructure (Picture: Grumeti tented camp in the WesternCorridor). The construction and activities in connection withthis can also be assessed as an impact factor. Photo: J. Thomassen.
12

Step 4: Plenary presentations, discussion and conclusions
Objective: To present the group work and make selection ofmajor impacts factors from the development plans.
Approach: All groups present the results from group work 1using overheads or PowerPoint, including explanations for theselections. Short session with comments and discussions aftereach presentation. The facilitator chair the plenary session andsummarise the different suggestions, open for comments anddiscussions and present the total picture. Conclusions aremade at the end of the session.
Output: Main impact factors to be used in the further assess-ments.
Estimated duration: Each group work presentation: 15 min-utes including time for discussion. 15 minutes for summingup discussions and making conclusions.
Step 5: Identification of ValuedEcosystem Components(VECs) (group work 2)
Objective: Identification of major issues to concentrate on inthe EIA.
Approach: The selected impact factors from group work 1 arebrought forward and used as background information ingroup work 2. All groups work with the same task, namelythe identification of a selected number of priority issues to beaddressed in the EIA. This is probably the most challengingand difficult part of the scoping process. Use the first minutesof the group work to be familiar with the development plans,the impact factors and the VEC concept (use the definition ofa VEC as a starting point). Discuss which issues (VECs) whichmost likely will form the basis for decision making concerningthe encroachment, rank them with respect to importance andmake conclusions consult with available literrature. Make afinal selection of the most important VECs (10-15) and explainwhy the selected VECs are given priority and why others arerejected. One of the group members are responsible for sum-ming up and present the results in plenary. Use a standardisedform for presentation.
Output: A list of 10-15 VECs from each group. Several VECswill normally be identical in each group.
Estimated duration of group work: 2-4 hours depending ofthe development plans.
nina Project Report 25
Step 6: Plenary presentations, discus-sion and conclusions
Objective: To present the group work and make selections ofmajor VECs.
Approach: All groups present the results from group work 2using overheads, or PowerPoint including explanations for theselections. Short session with comments and discussions aftereach presentation. The facilitator summarises the differentsuggestions, presents the total picture after the last groupwork presentation and opens for comments and discussions.It is important to chair the discussion and make conclusionson a selected number of VECs. A total of 10 – 20 VECs can benormative.
Output: 10-20 important VECs to be used in the furtherassessments. The VECs shall normally cover the environmentas well as the society.
Estimated duration: Each group work presentation: 20 - 30minutes including time for discussion. 30 minutes for sum-ming up discussions and making conclusions.
Figure 6. Kopjes and the associated biodiversity can be assessed as aValued Ecosystem Component. Photo: J. Thomassen.
13

Step 7: Construction of SchematicFlow Charts (group work 3)
Objective: Construction of flow charts indicating in whichcontext the VEC appears.
Approach: The selected impact factors from group work 1 arebrought forward and used in group work 3. The VECs fromgroup work 2 are divided between the groups. It is importantthat each group have some professional participants under-standing the nature of the VECs in the group. At least one ofthe groups should concentrate on social issues. Use the firstminutes of the group work to be familiar with the flow chartthinking. Discuss and select the major impact factors concern-ing each VEC. The most important impact factors from thedevelopment can have a direct impact on the VEC, an indirectimpact via so called system components, or no impact at all.Start with one VEC (the one assessed as the most importantin the group) and construct the flow chart. One schematicflow chart is constructed for each VEC. Each flow chart con-sists of a number of boxes and arrows indicating in whichcontext the VEC appears. The linkages between impact fac-tors and the VEC shall be followed by a brief explanation. Oneof the group members are responsible for summing up andpresent the results in plenary. Use a standardised diagram forpresentation of the group work results.
Output: One Schematic Flow Chart for each of the selectedVECs.
Estimated duration of group work: At least one hour for eachflow chart. Be careful to serve coffee/tea!!
Step 8: Plenary presentations, discus-sion and conclusions
Objective: To present the group works and get an under-standing of the context in which the VEC appears.
Approach: All groups present the results from group work 3using overheads or PowerPoint, including explanations for thelinkages. Short session with comments and discussions aftereach Schematic Flow Chart presentation. A workshop secre-tariat is recommended to be able to write down the final flowcharts. The flow charts will form the basis for formulatingimpact hypotheses in group work 4.
Output: One Schematic Flow Chart for each selected VEC,including short explanations for each of the proposed link-ages.
Estimated duration: 10-15 minutes for each flow chart includ-ing time for discussions and conclusions.
nina Project Report 25
Step 9: Formulation of ImpactHypotheses (IHs) and evalua-tion of the IHs (group work 4)
The tasks in group work 4 can be conducted in one very longsession (with several breaks), or split up in two parts withinthe same group work (as described below):
Part A:Objective: Discuss and formulate a set of impact hypothesesfrom the impact factors on each VEC.
Approach: The same group composition as in group work 3.The most important impact factors from the development canhave a direct impact on the VEC, an indirect impact via socalled system components, or no impact at all. The explana-tions and the linkages from the flow charts indicate theseimpacts, and form the basis for the formulation of a set ofimpact hypotheses for each VEC. Since different stakeholderswith different experience and knowledge concerning theVECs participate, it is important to include all hypothesesassessed as important in the group work. Each hypothesisshall be followed by an explanation, if possible based on sci-entific knowledge with citations, or on documented TEK . Dueto shortage of time, it can be adequate to let each groupwork participant work with his/hers own set of hypothesesand discuss the results in the group before presentation. Oneof the group members are responsible for summing up andpresent the results in plenary. Use a standardised form forpresentation of the group work results.
Output: A set of impact hypotheses for each VEC.
Estimated duration of part A of the group work: 2 - 4 hoursdepending on the development plans.
Part B:Objective: Evaluate the proposed Impact Hypotheses by cate-gorising them into one of four categories (A, B, C or D).
Approach: Each of the proposed IHs is evaluated with respectto validity, based on knowledge. Documentation is importantand a rationale is given for each evaluation. One of the groupmembers (the same as in part A?) are responsible for sum-ming up and present the results in plenary. Use the samestandardised form as in part A for presentation of the groupwork results.
Output: All IHs evaluated and categorised in one of for cate-gories. Normally only IHs categorised in B or C is brought for-ward in the assessment system (but sometimes also categoryD hypotheses). The evaluated IHs form the basis for recom-mendations (group work 5) concerning research, surveys,monitoring and management actions, including mitigatingmeasures.
Estimated duration of part B of the group work: 2 - 3 hoursdepending on the development plans.
14

Step 10: Plenary presentations, discus-sion and conclusions
Objective: To present the group works and get an under-standing for all stakeholders of possible impacts from thedevelopment.
Approach: All groups present the results from group work 4using the standardised form on overheads or PowerPoint.Short session with comments and discussions after each set ofIHs for a VEC. The formulation and categorisation of the IHswill form the basis for different recommendations done ingroup work 5.
Output: A set of IHs for each VEC, evaluated and placed inone of four categories.
Estimated duration: 5-10 minutes for each IHs including timefor discussions and conclusions.
Step 11: Recommendations (groupwork 5)
Objective: To make a set of recommendations for the pro-posed development.
Approach: IHs placed in category B or D are given priority. In acategory C hypothesis further research or investigations isneeded to validate or invalidate the hypothesis. In all cate-gories recommendations concerning research, surveys, moni-toring and management actions, including mitigating mea-sures can be given. Remember that differentstakeholders (also representatives from theclient or the responsible for the developmentplans) should participate on the workshop, andthereby understand the recommendations giv-en (agree or disagree). Each IH is treated care-fully, and recommendations given where advis-able. One of the group members are responsi-ble for summing up and present the results inplenary. Use the same standardised form as instep 10 for presentation of the group workresults.
Output: Several recommendations concerningdifferent aspects of the development.
Estimated duration of the group work: Onehour for each IH.
nina Project Report 25
Step 12: Plenary presentations, discus-sion and conclusions
Objective: To present the group works and get an under-standing for all stakeholders of different recommendations.
Approach: All groups present the results from group work 5using the standardised form on overheads or PowerPoint.Short session with comments and discussions after each set ofIHs for a VEC.
Output: Several recommendations given. The different recom-mendations can be grouped according to their nature and canform the basis for Terms of Reference, for Management Plans,for Monitoring Programmes or Mitigating MeasureProgramme.
Estimated duration: 5-10 minutes for each IHs including timefor discussions and conclusions.
Summing up
A workshop secretariat is recommended to be able to sum upand write down the different results from the steps in the pro-cess. The preparation of a work plan and a time schedule forconducting the EIA is critical for the project success.Responsibilities (on personal level) and man hour estimationfor the different activities should also be included in the workplan. The AEAM process could form the basis of the projectsTerms of Reference. The context in which the AEAMapproach is used in the EIA procedure is shown in Figure 7.
Figure 7. The use of Adaptive Environmental Assessment andManagement (AEAM) approach in an EIA.
15

No. Impact factor Priority 1 Road construction2 Lodges construction3 Campsite construction4 Political immaturity5 Unstable ecosystems6 DiseasesExplanation for impact factors given priority (use additional sheets if necessary) Literature:
PART C: Results from the training course
The training course was carried out by using the AEAMapproach on tourism development in Serengeti N.P. AEAM isbased on a workshop process, were the participants systemat-ically works through the identification and selection of issuesto be addressed in the EIA, and critically handle the issueswith respect to potential consequences from the develop-ment, in this case the development of tourism in SerengetiN.P. See also Part B in this report for a step by step procedureof the AEAM approach.
nina Project Report 25
No. Impact factor Priority 1 Off-road driving2 More lodges3 Airstrips4 Visitors Centre5 Walking safaris6 Diseases7 New speciesExplanation for impact factors given priority (use additional sheets if necessary) • Animal disturbance, habitat destruction and biodiversity loss• Water disposal, pollution, change in animal behaviour and temporal • distribution of primates• Loss of biodiversity and habitat• Increased in income generation• Increased in GNP• Reduced number of visitors and low GNP• Reduced domestic tourism and increased poaching• Wise utilisation of resources• Animal mortalities• Suppression of indigenous species Literature:
16
Group no. 2
The participants were distributed in three groups, workingwith the same tasks. The facilitators circulated between thegroups giving supervision and advice. Each group selectedone chair person and one secretary.
The results below are identical with the conclusions made atthe seminar, and have not been changed or modified.
1. Identification of Impact Factors
Group no. 1

nina Project Report 25
No. Impact factor Priority 1 Improved and sustained local and national economies2 Increased congestion of tourists3 Effect on cultural values4 Improvement of infrastructure5 Increased pollution6 Loss of political and economical control by the Government7 Open more circuits for tourismExplanation for impact factors given priority (use additional sheets if necessary) Literature:
17
Group no. 3
Conclusions in plenaryAfter the group presentations and subsequent discussions in plenary, it was concluded to put emphasis and focus on wildlife withpriority on the following impact factors, which will be used further on in the assessments of tourism in Serengeti N.P.:
Impact factors assessed as most important Impact factors given priority
More accommodation facilities Heavy (increased) traffic and off-road driving Traffic Increased access Access Increased conflicts between local communities and park authorities Community conflicts Diseases Diseases Policy Policy
2. Identification of Valued Ecosystem Components (VECs)
Group no. 1
Assessed VEC - name Given priorityVECs: Yes/No
1 Seronera valley 1 2 Wildebeest migration 3 3 Increased viewing of the big five and prey species 5 4 Endangered/threatened species 4 5 Ecotourism 2 6 Kopjes – refugees to many wildlife 6
Yes: Explanation for VECs given priority (use additional sheets if necessary)
1. Lodges increase waste materialsLocation of lodges displaces animalsHeavy traffic changes animal behaviour, accelerate soil erosion and increase siltation in the valley.
3. Attracts tourism whence results to habitat destruction and animal disturbance5. Congestion of tourists and traffics in one area, thence habitat destruction, disturb animals and change in animal behaviour.4. These are good tourist attractants and most of them are sensitive to pressure and are shy2. Increased demand for ecotourism will affect biodiversity in the area.6. Increase in tourists circuits. No: Explanation for VECs not given priority (use additional sheets if necessary) Literature:

Assessed VEC - name Given priorityVECs: Yes/No
1 Wildebeest migration 1 2 Buffer zones soft borders 2 3 Seronera valley 3 4 Water dynamics and quality 4 5 Large predator populations 5 6 Endangered/Threatened species 6 7 Wildlife wealth 7 8 Wilderness experience 8 9 Autheticity (Nature and Culture) 9 10 Forex and national pride 10
Yes: Explanation for VECs given priority (use additional sheets if necessary)
1 & 2. Increased traffic interfere normal migratory routes 3 & 4. Siltation and sewage disposal pollution 5. Hunting success, mating and breeding behaviour interfered6. Stress, reduction in number (population)7. Affect health of vegetation (primary producers), human beings and animals8 & 9. Genuine vs. Artificial10. Increased fame and economy (Government revenue collection).No: Explanation for VECs not given priority (use additional sheets if necessary) Literature:
Assessed VEC - name Given priorityVECs: Yes/No
1 Wildebeest migration 1 2 Open grasslands 2 3 Serengeti Woodlands 3 4 Large predators/prey populations 4 5 Grumeti/Mara River Systems 5 6 Springs, permanent water surfaces and catchment areas 6 7 Keystone species (Elephants) 7 8 Seronera valley 8 9 Serengeti Kopjes 9 10 Endangered/Threatened species 10 11 Endemic species in Serengeti National Park 11 12 Culturally-valued species 12
Yes: Explanation for VECs given priority (use additional sheets if necessary)
1. Wildebeest migrationUnique phenomenonImportant in nutrients cycling and energy flow in ecosystem
2. Open grassland and plainsImportant during calving for wildebeest (Ca++, K+)Food and habitat for migratory animals during wet season.
3. Woodland of SerengetiImportant food and habitat for migratory and other animals during dry season
4. Catchment areasNo: Explanation for VECs not given priority (use additional sheets if necessary) Literature:
nina Project Report 25
18
Group no. 2
Group no. 3

Valued Ecosystem Components Conclusion: Selected VECs Priority(VECs) assessed in the discussions Seronera valley Seronera valley 1 Wildebeest migration Wildebeest Migration 2 Open grasslands/plains Ecosystem Health (plains, woodlands and open grasslands) 3 Vegetation mosaic Springs, permanent surface water, salt licks Water Systems and Catchments 5 Grumeti/Mara river system Large predator/prey/population and observation Wilderness Kopjes Kopjes 7 Endangered/Threatened species Endangered/Threatened species 6 Ecotourism Tourism 4
nina Project Report 25
19
Conclusions in plenary
After the group presentations and subsequent discussions in plenary, it was concluded to put emphasis and focus on a limitednumber of VECs.
3. Construction of Schematic Flow Charts
Normally a Schematic Flow Chart is constructed for each of the proposed VECs. Due to limited time resources on the trainingcourse, only three flow charts were made, namely for VEC Tourism, VEC Ecosystem health and VEC Wildebeest migration.
Group no. 1

1a Increased access, increased opportunities for wildlife view 1b Increased viewing opportunities affect tourism industry 2 Communities generate income from tourism. Similarly tourism contributes to rural development 3a Good and proper policy boost tourism industry 3b Good policy attracts more investments, affect marketing strategies which in turn affect tourism industry 4a Affects tourists and therefore tourism industry 4b Increases opportunities for disease transmission 5a Diseases have got direct impact to predators 5b Diseases contributes to wildlife mortality 6 Mortality reduces wildlife population 7 Endangered species are more susceptible 8 Few attractions causes congestion of tourists 9 Chance of viewing wildlife is reduced by congestion 10 Habitat destruction and change in animal behaviour 11 Only few wildlife are interested by tourists, eg. the big five 12 Kopjes harbour many wildlife, therefore attracts more tourists 13 Kopjes are good habitats for predators 14 Good marketing strategies increases number of tourists hence congestion 15 Good marketing strategies increases number of tourists – and tourism industry 16 Marketing strategies causes congestion, this result to change animal behaviour 17 Displacement of habitat 18 Community become more close to PA – increased poaching 19 Decrease in number of animals in turn decrease population 20 Some animals are preferred by poachers – more affected 21 Encourage poaching for subsistence protein 22 Increases encroachment due to demand for biological resources 23 Employment reduces poverty 24 Employment reduces poaching 25 Employment improves welfare to the community 26 Improved welfare improves domestic tourism 27 Tourism creates employment opportunity to community 28 Population growth around PA’s increases encroachment 29 Decrease in predator population would affect tourism 30 Decrease in wildlife population would affect tourism
nina Project Report 25
20
Explanations to the linkages (VEC: Tourism)

1a Increased traffic will cause pollution 1b Pollution will have a negative effect on ecosystem health 2a Increased access will cause increase in tourist vehicle numbers and lead to disturbance of large predators/prey populations 2b Disturbance will interfere with behaviour, which lead to low population in the ecosystem 3a Community population will led to reduction of resources 3b Reduction of resources will interfere ecosystem functions 4a Diseases will cause mortality of animals 4b High mortality will decrease animal population and hence decrease ecosystem health 5a Disturbance will interfere with reproduction of animals 5b Interference with reproduction will lead to lower animal numbers in the ecosystem 6a Increase traffic will cause disturbance to animals 6b Disturbance to animals will cause disturbance to migratory routes and/or migratory animals
nina Project Report 25
21
Explanations to the linkages (VEC: Ecosystem health)
Group no: 2

1a Increased traffic will cause disturbance on migratory routes and reproductive success 1b Increased traffic will interfere vegetation mosaics and quality tourism services and facilities 1c Increased traffic will affect the wildebeest population (increase/decrease) 1d Increased traffic will cause prey – predator interactions 2a Increased access will cause disturbance to migratory routes 2b Increased access will interfere predator – prey interactions 2c Increased access will promote tourism or will cause congestion of tourists 3a Increased community conflicts will lead to poaching, and poaching will lead to a decrease in animal population 3b Increased community conflicts and power sharing lead to increased human population 4a Introducing new policies or changing existing policies can affect migratory routes between Serengeti N.P. (T2) and Masai
Mara national reserve 4b Change in policies from conservation point of view tourism to a demand driven tourism
nina Project Report 25
22
Group no: 3
Explanations to the linkages (VEC: Wildebeest migration)

nina Project Report 25
VEC: TOURISM IH: no. 1Impact hypothesis: Reduction in entry fees into the park will increase the number Impact factor(s):of tourists Accessibility Explanation: The current entry fees may be inhibiting factor for both domestic and foreign tourism. Category: CRationale: Data can be easily collected from the gates by measuring the number of visitorsRecommended research: The impact of changes in entry fees on the number of tourists.Recommended monitoring and/or surveys: Recommended management actions: Should they notice that frequently changes in entry fees may be the inhibiting factorfor both domestic and foreign tourism.Recommended mitigating measures: Before setting entry fees, thorough market survey should be carried and compared withother competitors.Reference:
23
4 Impact Hypotheses (IH), evaluati-on of IHs and recommendations
Group no. 1.
VEC: TOURISM IH: no. 2Impact hypothesis: There is strong association between the outbreak of somatic diseases and Impact factor(s): decline of tourists. Diseases Explanation: With experience zoonatic diseases explosion in the national park do affect negatively the influx of tourists e.g. Sleeping sickness thought to be in the SNP in 2001 affected the tourists influx. Category: CRationale: Data can be collected before the outbreak and after, and then compared statistically.Recommended research: Impact of the outbreak of zoonatic diseases on the number of tourist.Recommended monitoring and/or surveys: Monitoring of ecosystem health should be carried.Recommended management actions: Avoid close human-wildlife contact.Recommended mitigating measures: Train park staff on wildlife health and diseases.Reference: (Kiondo, 2001). The role of veterinary services in wildlife management.
VEC: TOURISM IH: no. 3 Impact hypothesis: Favourable policy on the tourism industry will improve marketing strategies. Impact factor(s):
PolicyExplanation: Tourist operators respond to the government policy and hence affects marketing strategies, which in turn affecttourism industry. Category: DRationale: This is a complex scenario that can not easily tested statistically.Recommended research: Recommended monitoring and/or surveys: Recommended management actions: Should advise on the favourable policy.Recommended mitigating measures: Policy makers should including stakeholdersReference: (Kihwele, 2001).

VEC: TOURISM IH: no. 4 Impact hypothesis: Domestic tourism in related to household income. Impact factor(s):
Community Explanation: Most people in villages are subsistence farmers who do not produce surplus. Category: CRationale: It is easy to develop the method of testing the income of those local people visiting the park and compared to theaverage income of common people in the village.Recommended research: The effect of household income on the domestic tourism.Recommended monitoring and/or surveys: Recommended management actions: Management should be aware of the socio-economic and cultural status of the com-munity.Recommended mitigating measures: Lower park entry fees for domestic tourists.Reference: (Lowassa, 2000).
nina Project Report 25
24
VEC: TOURISM IH: no. 5 Impact hypothesis: Increased human activities in the park will affect the predators behaviour. Impact factor(s):
Community Explanation: The more the predators interact with human, the more tanned the predators became and the lesser the flight dis-tance; this may increase the poaching activities. Category: CRationale: Data from the areas with no or negligible human activities can be compared with those detrained from the area withhigh human activities.Recommended research: Influence of people on the predators behaviour.Recommended monitoring and/or surveys: Changes in previously known behavioural pattern.Recommended management actions: Avoid close contact between human and predators.Recommended mitigating measures: Train park staff on basic animal behaviour.Reference: (Grayson, 2002).
VEC: TOURISM IH: no. 6 Impact hypothesis: Poaching of endangered species and/or threaten will have a negative impact on Impact factor(s):the tourist influx. Endangered species Explanation: Poaching of Rhino has reduced the number almost to zero, in the Serengeti National Park. Category: CRationale: Data can be collected by interviewing the tourist on the preferred species of big game they would like to see.Recommended research: Understanding tourists preference on specific game animals.Recommended monitoring and/or surveys: Recommended management actions: Enforcement of rules and regulations.Recommended mitigating measures:
• Conservation education for the local community• Identify the endangered species and strongly taken care off.
Reference: (Nyahongo, 2002).
VEC: TOURISM IH: no. 7 Impact hypothesis: Construction at Lodges on the kopjes will reduce the biodiversity in and around Impact factor(s):the area. Access Explanation: Many lodges in the Serengeti National Park have been constructed on the kopjes. No body knows the impact ofthese developmental projects on the biodiversity. Category: CRationale: Data can be collected using biodiversity indices from the kopjes with and without such development.Recommended research: The effect of lodges construction on biodiversity in and around the kopjes.Recommended monitoring and/or surveys: Long term monitoring of biodiversity in and around the kopjes.Recommended management actions: Kopjes environment is sensitive and fragile; hence construction of lodges should avoidsuch environment.Recommended mitigating measures: Construction on the kopjes should be avoided and/or well planned.Reference: (Kihwele, 2002).

VEC: TOURISM IH: no. 8 Impact hypothesis: Biodiversity is high along the tourist roads. Impact factor(s):
Access Explanation: Due to edge effect, biodiversity is always high along the edge of roads. Category: CRationale: Collecting data on the edges of roads and far away from the road can statistically test the hypothesis.Recommended research: Effect of the tourist road ecology on the biodiversity.Recommended monitoring and/or surveys: Recommended management actions: Management should review the roads systems in the park.Recommended mitigating measures: Reduce road system in order to minimise invasive weeds.Reference:
nina Project Report 25
25
VEC: TOURISM IH: no. 9 Impact hypothesis: Congestion of tourist around the kopjes reduces the biodiversity. Impact factor(s):
Access Explanation: There is a tendency of more tourists visiting the kopjes as such causing sound pollution movements and approach-ing the animals. This will drive away those intolerable wildlife species. Category: CRationale: Compare less frequently kopjes and more frequently visited kopjes.Recommended research: The effect of tourists density in and around the kopjes on the biodiversity.Recommended monitoring and/or surveys: Long term monitoring of number of tourists in and around kopjesRecommended management actions: The carrying capacity of the kopjes should be taken care off.Recommended mitigating measures: Tourists should not exceed the carrying capacity of the kopjes.Reference:
VEC: TOURISM IH: no. 10 Impact hypothesis: Cultural changes in the local community adjacent to tourists routes are related Impact factor(s):to tourism activities. Community Explanation: Changes in culture is always accelerated by the force of interaction between two or more different cultures fromdifferent society. Category: CRationale: Note the culture of Maasai who are frequently visited by tourists and those in remote area.Recommended research: Impact of tourists on the socio-cultural changes of local community living along the tourist routes.Recommended monitoring and/or surveys: Recommended management actions: The local people should be educated on the valuable things in their culture whichshould be retained.Recommended mitigating measures:Reference:
Group no. 2
VEC: ECOSYSTEM HEALTH IH: no. 1 Impact hypothesis: Pollution from increased traffic will deter plant photosynthesis and therefore Impact factor(s):affect ecosystem functioning. Increased Traffic Explanation: Dust and emissions due to increased traffic will interfere with photosynthesis in plants. Category: BRationale:Recommended research: The hypothesis is valid and already verified. Research to validate the hypothesis is not required.Recommended monitoring and/or surveys: Monitoring of redistribution of vehicles in the park to assess the trend of trafficon the attraction points.Recommended management actions:
• The management of SENAPA should create and advertise other tourism attraction points.• Introduction of booking system during high season will limit the number of vehicle in the park.
Recommended mitigating measures: Re-distribution of vehicles and diversification of tourism attractions and observationpoints in the park.Reference:

VEC: ECOSYSTEM HEALTH IH: no. 2 Impact hypothesis: Disturbances caused by increased traffic impairs reproduction success of wildlife. Impact factor(s):
Increased Traffic Explanation: The increased number of tourists will interfere with the mating of animals, this result in low reproduction.Category: CRationale:Recommended research: Effect of disturbance due to increased traffic on the reproductive success of wildlife should be inves-tigated.Recommended monitoring and/or surveys:Not applicable now.Recommended management actions: The park authority should come up with a feasible implementable proposal to solve theexisting problem.Recommended mitigating measures: Not applicable now.Reference:
nina Project Report 25
VEC: ECOSYSTEM HEALTH IH: no. 4 Impact hypothesis: Disturbances caused by increased tourist vehicles will reduce hunting success Impact factor(s):of predators. Accessibility Explanation: Noises, from vehicles and increased observation activities will frighten and displace prey, leading to interfaces inthe hunting strategies of the predators. Category: BRationale:Recommended research: The hypothesis is valid and already verified. Research to validate the hypothesis is not is not required.Recommended monitoring and/or surveys: Monitoring of redistribution of vehicles in the park to assess the trend of trafficon the attraction points.Recommended management actions: The management of SENAPA should create and advertise other tourism attractionpoints. Introduction of booking system during high season will limit the number of vehicles in the park.Recommended mitigating measures: Redistribution of vehicles and diversification of tourism attractions and observationpoints in the park.Reference:
26
VEC: ECOSYSTEM HEALTH IH: no. 3 Impact hypothesis: Increased traffic and accessibility will lead into changes in migratory patters. Impact factor(s):
Accessibility/Increased Traffic
Explanation: Most wildebeest will find difficult and risky on the new created routes due to energy consumption and predators. Category: CRationale:Recommended research: Research to investigate the effect of traffic on migratory patters should be done.Recommended monitoring and/or surveys:Note applicable by now.Recommended management actions: The park authority should come up with a feasible, implementable proposal pertinentto the research.Recommended mitigating measures:Not applicable now.Reference:

nina Project Report 25
VEC: WILDEBEEST MIGRATION IH: no. 1 Impact hypothesis: Increased traffic may cause disturbance on migratory routes and reproductive Impact factor(s):success. Traffic Explanation: Increased Traffic has some negative consequences on tourism sustainability. Category: CRationale:Recommended research: Effect of disturbance on reproductive success.Recommended monitoring and/or surveys: Territorial dominance, mating success, number of calves.Recommended management actions: Diversify tourism activities to limit number of vehicles along migratory route.Recommended mitigating measures:
• Introduce strategic plan on viewing tourist attractions in different areas in the ecosystem.• Put emphasis on developing tourist attractions in other National Park
Reference:
27
VEC: ECOSYSTEM HEALTH IH: no. 5 Impact hypothesis: Increased human population and conflicts in the periphery of the ecosystem will Impact factor(s):lead to unsustainable harvesting of resources in the ecosystem. Community Conflicts Explanation: The excessive pressure imposed to the resources due to community conflicts population increase will cause illegalharvesting, which will result to resources depletion on the ecosystem. Category: BRationale:Recommended research: The hypothesis is valid and already verified. Research to validate the hypothesis is not required.Recommended monitoring and/or surveys: Monitoring of the effectiveness of community based conservation (CBC) pro-grammesRecommended management actions: Management to put in place the community based conservation (CBC) programme.Recommended mitigating measures: Involve the communities in planning and management of resources.Reference:
VEC: ECOSYSTEM HEALTH IH: no. 6 Impact hypothesis: Mortality due to diseases will cause population crash in the animal numbers. Impact factor(s):
Diseases Explanation: Diseases cause death of animals and this will lead to a decrease in animal numbers. Category: BRationale:Recommended research: The hypothesis is valid and already verified. Research to validate the hypothesis is not required.Recommended monitoring and/or surveys: Monitoring of the effectiveness of programmes for diseases control and preven-tion.Recommended management actions: The management of SENAPA should institute disease control programmes in the day-to-day conservation endeavours.Recommended mitigating measures: Programmes for control and prevention of diseases should be put in place.Reference:
Group no. 3
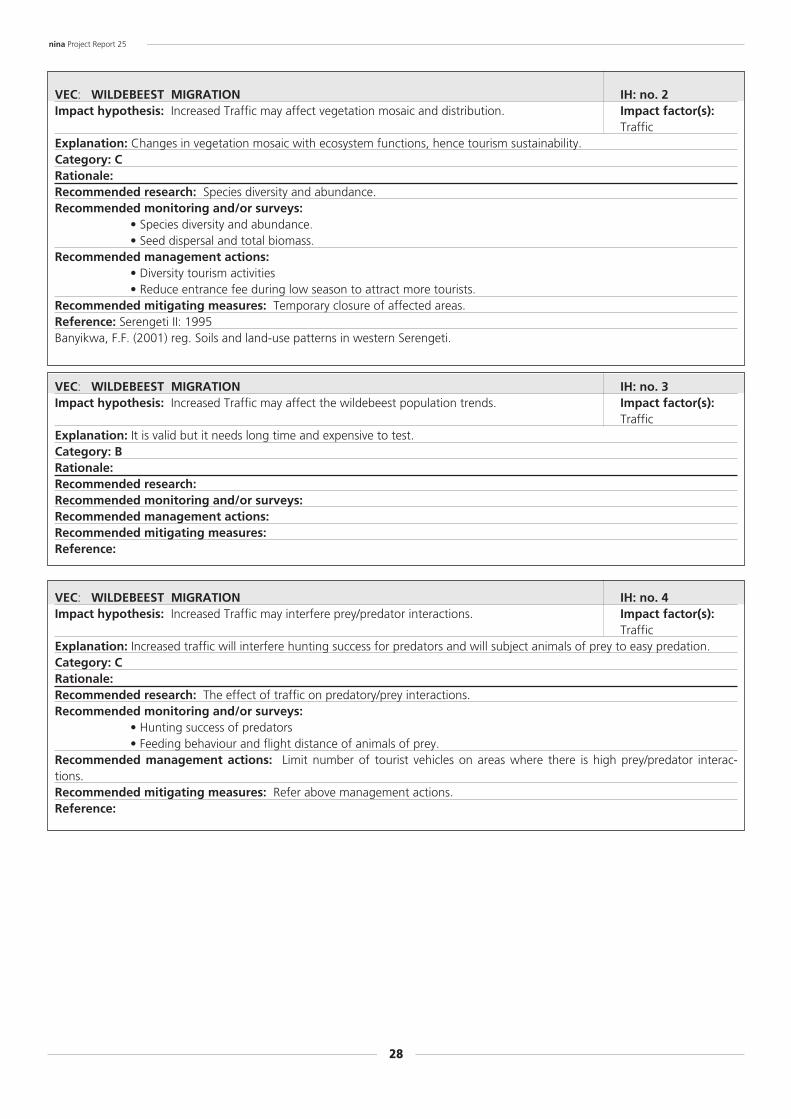
VEC: WILDEBEEST MIGRATION IH: no. 2 Impact hypothesis: Increased Traffic may affect vegetation mosaic and distribution. Impact factor(s):
Traffic Explanation: Changes in vegetation mosaic with ecosystem functions, hence tourism sustainability. Category: CRationale:Recommended research: Species diversity and abundance.Recommended monitoring and/or surveys:
• Species diversity and abundance.• Seed dispersal and total biomass.
Recommended management actions:• Diversity tourism activities• Reduce entrance fee during low season to attract more tourists.
Recommended mitigating measures: Temporary closure of affected areas.Reference: Serengeti II: 1995Banyikwa, F.F. (2001) reg. Soils and land-use patterns in western Serengeti.
nina Project Report 25
28
VEC: WILDEBEEST MIGRATION IH: no. 3 Impact hypothesis: Increased Traffic may affect the wildebeest population trends. Impact factor(s):
Traffic Explanation: It is valid but it needs long time and expensive to test. Category: BRationale:Recommended research: Recommended monitoring and/or surveys:Recommended management actions:Recommended mitigating measures:Reference:
VEC: WILDEBEEST MIGRATION IH: no. 4 Impact hypothesis: Increased Traffic may interfere prey/predator interactions. Impact factor(s):
Traffic Explanation: Increased traffic will interfere hunting success for predators and will subject animals of prey to easy predation.Category: CRationale:Recommended research: The effect of traffic on predatory/prey interactions.Recommended monitoring and/or surveys:
• Hunting success of predators• Feeding behaviour and flight distance of animals of prey.
Recommended management actions: Limit number of tourist vehicles on areas where there is high prey/predator interac-tions.Recommended mitigating measures: Refer above management actions.Reference:

VEC: WILDEBEEST MIGRATION IH: no. 5 Impact hypothesis: Increased access may interfere predator/prey interactions. Impact factor(s):
Access Explanation: Increased access will interfere hunting success for predators and will subject animals of prey to easy predation.Category: CRationale:Recommended research: Effect of increased tourist circuits on predator/prey interactions.Recommended monitoring and/or surveys:
• Hunting success of predators• Feeding behaviour and flight distance of animals of prey.
Recommended management actions: Limit number of tourist vehicles in areas where there is high predator/prey interactions.Recommended mitigating measures: Refer to Management actions.Reference:
nina Project Report 25
29
VEC: WILDEBEEST MIGRATION IH: no. 6 Impact hypothesis: Provision of CBCS may increase human population around Serengeti ecosystem, Impact factor(s):which leads to more benefits and power sharing conflicts. Community Conflicts Explanation: Introducing benefits and power sharing demands will cause emergence of claims on the ownership of wildliferesources (Win-Win situation). Category: BRationale:Recommended research: Research is required on human ecologyRecommended monitoring and/or surveys: Monitoring of populations birth rate and immigration.Recommended management actions: Establish conservation activities (WMA’s).Recommended mitigating measures: Introduce participatory approach in decision-making around SENAPA.Reference: SRCP (2001): Programme Annual Report.

ANNEXES1. An example of work plan and time schedule for conducting EIA based on the
AEAM concept
Each group choosed one VEC and developed a time schedule for an EIA study.
Group no: 1
nina Project Report 25
30
Group no: 2

nina Project Report 25
31
Group no: 3

nina Project Report 25
32
NAME ORGANISATION POSTAL TEL. E-MAIL WEB-SITE OFFICIAL OR PERSONAL
Amiyo T. Amiyo NCAA Box 1 027 253 7043 [email protected]
NCAA 250 2548240
Bjørn P. Kaltenborn NINA Fakkelgåroen, +4761287915 [email protected] www.nina.no
Storhove, N - 2624,
LILLEHAMMER,
NORWAY
Cassian T. Mumbi TAWIRI Box 661 027 7677 [email protected]
ARUSHA 250 2548240
Charles M Masunzu TAWIRI Box 661, 0744562045 [email protected]
ARUSHA
Emilian S. Kihwele TANAPA Box 3134, 0744430537 [email protected]
ARUSHA
Hassan M. Nkya TAWIRI Box 661 0272756968 [email protected]
ARUSHA 0744266838
Jørn Thomassen NINA Tungasletta 2, +4773801573 [email protected] www.nina.no
N-7485,
TRONDHEIM,
NORWAY
Kari Helene Directorate of Pirsenteret 7462, +4773845868 kari-helene.andresen @
Bachke Andresen Fisheries TRONDHEIM, fiskeridir.no
NORWAY
Kiondo, M.R. TAWIRI Box661, ARUSHA 027 7677 [email protected]
Lowassa, A. TAWIRI -Student, UDSM Box 661 0744 568468 [email protected]
ARUSHA
Massawe, E.T. TAWIRI Box 1053, KIGOMA 028 2802072 [email protected]
07444391916
Monica S. James UDSM 0741300381
Mwakalebe G. G. TAWIRI Box 661 ARUSHA 028 2621526 [email protected]
Mwakatobe, A.R. TAWIRI Box 661 ARUSHA 0744817657 [email protected]
Nicephor P. Lesio TAWIRI Box 661 ARUSHA 027 7677 [email protected]
Nyahongo J.W. TAWIRI Box 116 ARUSHA 0744 479856 [email protected]
0744 361573
TAWIRI, TAWIRI Box 661 028 2621526 [email protected]
VET PROJECT ARUSHA 0744 366742
TAWIRI Box 661 ARUSHA 0254 8240 [email protected]
028 2621526 [email protected]
027 7677 [email protected]
2. List of participants

3. Tentative programme
Environmental Impact Assessment, tentative training programme (Changes in the tentative programme was done)
Training responsible: Jørn Thomassen, Bjørn KaltenbornTraining assistant: Kari Helene Bachke Andresen
nina Project Report 25
Monday 22. April
Time Issues Responsible 0900-0930 Introduction to EIA: Capacity building in EIA; General principles of EIA
EIA in Norway; EIA in other countries Jørn Thomassen 0930-0945 Status of EIA in Tanzania History, guidelines, legislation etc. TAWIRI 0945-1000 Break 1000-1030 The EIA process: Project description, impacts and impact factors, screening Jørn Thomassen
procedures, decision makers and relevance, the ”good enough” principle, baseline information, scoping, Terms of Reference
1030-1100 The AEAM concept Jørn Thomassen 1100-1115 Discussion 1115-1130 Break 1130-1210 Tourism – a general overview Bjørn Kaltenborn 1210-1240 Presentation of case study Bjørn Kaltenborn 1240-1300 Discussion 1300-1400 Lunch 1400-1900 Visit to case study area Bjørn Kaltenborn/ TANAPA 1900 Dinner TAWIRI
33
Tuesday 23. April
Time Issues Responsible 0900-0915 Introduction to group works 1, 2 and 3 Jørn Thomassen 0915-1030 Group work 1: Impact factors All 1030-1045 Break 1045-1145 Plenary presentation group work 1, conclusions All 1145-1300 Group work 2: Valued Ecosystem Components (VECs) All 1300-1400 Lunch 1400-1445 Plenary presentations group work 2, conclusions All 1445-1600 Group work 3: Schematic flow charts All 1600-1615 Break 1615-1700 Plenary presentations group work 3, conclusions All 1700-1730 Summing up, discussion All 1800 Dinner

Wednesday 24. April
Time Issues Responsible 0900-0915 Introduction to group works 4, 5 and 6 Jørn Thomassen 0915-1030 Group work 4: Impact Hypotheses (IHs) All 1030-1045 Break 1045-1145 Plenary presentation group work 4, conclusions All 1145-1300 Group work 5: Evaluation of Impact Hypotheses (IHs) All 1300-1400 Lunch 1400-1445 Plenary presentations group work 5, conclusions All 1445-1600 Group work 6: Recommendations All 1600-1615 Break 1615-1700 Plenary presentations group work 6, conclusions All 1700-1730 Summing up, discussion All 1800 Dinner
nina Project Report 25
Thursday 25. April
Time Issues Responsible 0900-1000 Accomplishing the job, introduction, work plan, time-price-quality, field work Bjørn Kaltenborn
compiling the results, valuing the results, report writing (EIS) 1000-1115 Group work 7: Preparing a work plan All 1115-1130 Break 1130-1215 Plenary presentations, group work 7, conclusions All 1215-1300 Discussion 1300-1400 Lunch 1400-1415 Letter of interest Jørn Thomassen 1415-1500 Writing a proposal Bjørn Kaltenborn 1500-1515 Break 1515-1600 EIA training course reporting, Why, how and when Bjørn Kaltenborn 1600-1800 Possible future work in connection with NP’s in Tanzania TANAPA 1800 Dinner
34
Friday 26. April
Time Issues Responsible 0900-1800 Tourism in the Serengeti NP. Summing up the training by site visit. TANAPA, TAWIRI and
Predictions versus reality. Bjørn Kaltenborn 1900 Course dinner

ISSN 1502-6779ISBN 82-426-1423-7
This report is made in co-operation with:TAWIRI Tanzania Wildlife Research Institute
NINA Project report 25
NNIINNAA NNoorrwweeggiiaann IInnssttiittuuttee ffoorr NNaattuurree RReesseeaarrcchhNINA Main office • Tungasletta 2 • NO-7485 Trondheim • NorwayPhone: +47 73 80 14 00 • Fax: +47 73 80 14 01http://www.nina.no