environmental goods and services industry
TRANSCRIPT

(70 1999 03 1 P) FF 120ISBN 92-64-17109-6
9:HSTCQE=V\VU^V:
OR
GA
NIS
AT
ION
FO
R E
CO
NO
MIC
CO
-O
PE
RA
TIO
N A
ND
DE
VE
LO
PM
EN
T
OECDeurostat
G lobally, the environmental goods and servicesindustry is growing rapidly in response toenvironmental pressures and the shift towards
business and government strategies that are moresustainable over the long term. However, the industrywhich supplies the goods and services that enablebusinesses and nations to meet environmentalchallenges is poorly identif ied, measured andunderstood.
This manual, which has been jointly developed by theOECD and Eurostat, aims to provide a firm basis forconstructing comparable statistics of the environmentindustry. It is based on recent experience in OECDcountries in building up a quantitative statistical pictureof this crosscutting industry that is not well identified intraditional statistical systems.
THE ENVIRONMENTALGOODS & SERVICES INDUSTRYMANUAL FOR DATA COLLECTION AND ANALYSIS
THE ENVIRONMENTALGOODS & SERVICES INDUSTRYMANUAL FOR DATA COLLECTION AND ANALYSIS

OECD, 1999.
Software: 1987-1996, Acrobat is a trademark of ADOBE.
All rights reserved. OECD grants you the right to use one copy of this Program for your personal use only. Unauthorised reproduction,lending, hiring, transmission or distribution of any data or software is prohibited. You must treat the Program and associated materials and anyelements thereof like any other copyrighted material.
All requests should be made to:
Head of Publications Service,OECD Publications Service,2, rue Andre-Pascal, 75775 ParisCedex 16, France.

THE ENVIRONMENTALGOODS AND SERVICES
INDUSTRY
Manual for Data Collection and Analysis
ORGANISATION FOR ECONOMIC CO-OPERATION AND DEVELOPMENTSTATISTICAL OFFICE OF THE EUROPEAN COMMUNITIES

ORGANISATION FOR ECONOMIC CO-OPERATIONAND DEVELOPMENT
Pursuant to Article 1 of the Convention signed in Paris on 14th December 1960, and which came into forceon 30th September 1961, the Organisation for Economic Co-operation and Development (OECD) shall promotepolicies designed:
– to achieve the highest sustainable economic growth and employment and a rising standard of living inMember countries, while maintaining financial stability, and thus to contribute to the development of theworld economy;
– to contribute to sound economic expansion in Member as well as non-member countries in the process ofeconomic development; and
– to contribute to the expansion of world trade on a multilateral, non-discriminatory basis in accordancewith international obligations.
The original Member countries of the OECD are Austria, Belgium, Canada, Denmark, France, Germany,Greece, Iceland, Ireland, Italy, Luxembourg, the Netherlands, Norway, Portugal, Spain, Sweden, Switzerland,Turkey, the United Kingdom and the United States. The following countries became Members subsequentlythrough accession at the dates indicated hereafter: Japan (28th April 1964), Finland (28th January 1969),Australia (7th June 1971), New Zealand (29th May 1973), Mexico (18th May 1994), the Czech Republic(21st December 1995), Hungary (7th May 1996), Poland (22nd November 1996) and Korea (12th Decem-ber 1996). The Commission of the European Communities takes part in the work of the OECD (Article 13 of theOECD Convention).
Publie en fran¸cais sous le titre :
L’INDUSTRIE DES BIENS ET SERVICES ENVIRONNEMENTAUX
Manuel de collecte et d’analyse des donnees
OECD, Eurostat 1999Permission to reproduce a portion of this work for non-commercial purposes or classroom use should be obtained through theCentre fran¸cais d’exploitation du droit de copie (CFC), 20, rue des Grands-Augustins, 75006 Paris, France,Tel. (33-1) 44 07 47 70, Fax (33-1) 46 34 67 19, for every country except the United States. In the United States permissionshould be obtained through the Copyright Clearance Center, Customer Service, (508)750-8400, 222 Rosewood Drive,Danvers, MA 01923 USA, or CCC Online: http://www.copyright.com/. All other applications for permission to reproduce ortranslate all or part of this book should be made to OECD Publications, 2, rue Andre-Pascal, 75775 Paris Cedex 16, France.

3
FOREWORD
In the context of globalisation, technological change, and new political priorities, policy makers haveexpressed a strong interest in the environmental goods and services industry. This is widely seen as anew growth sector, generating wealth and creating jobs as well as playing a major role in the transition ofeconomies towards sustainable development.
OECD interest in the environment industry arose initially as part of the Industry Committee activityon Environmental Policy and Industrial Competitiveness. A first report was prepared in 1992 to describethe status of this industry, market developments and the impact of environmental policies.1 Interest inthe environment industry was re-affirmed by the Industry Committee in 1994, and in subsequent work onnew growth industries. A new report on the environment industry received wide recognition and showeda clear need for continued analysis and improved data on the industry.2
In its Communication on “Industrial Competitiveness and Protection of the Environment”, theEuropean Commission stressed that “the significance of the environmental goods and services industryas a fast-expanding industrial market can no longer be denied, even though considerable doubt sur-rounds its exact level of development”.3 A more recent Communication from the Commission on Environ-ment and Employment emphasises the employment effects of environmental policy and the positivelink between sustainable development and employment.4 It recognises that the development of a strongenvironmental goods and services industry can make a major contribution to enabling enterprises to bet-ter integrate cleaner technologies and environmental practices in production and more generallyimprove environmental performance.
This policy interest has raised a number of questions on different aspects of the environment industry.These include: what is the potential for growth and employment creation, what has been the record inexporting environmental technologies, is there progress in research and development for cleaner productsand processes, can we measure the impact on industrial competitiveness due to the application of cleanertechnologies, and how can environmental and economic policy be modified to encourage and supportgrowth, job creation and trade in the environment industry? Answering these questions poses statisticaland methodological difficulties related to problems of industry delimitation and data availability.
In response to such questions, a first meeting was organised in Washington in 1994, supported bythe US government (US EPA and Department of Commerce), to help collect more comprehensive infor-mation to enable a clearer definition and classification of the environment industry, and provide a foun-dation for more firmly based policy analysis.5 As a follow-up to the Washington meeting, the OECD, incollaboration with Eurostat (the Statistical Office of the European Communities), organised an InformalWorking Group (see Annex 8 for participants) to work towards definition and classification of the environ-mental goods and services industry.
The OECD/Eurostat Informal Working Group on the Environment Industry developed a common def-inition and classification of the environment industry, in order to improve the collection of consistentinformation on production, employment, trade, investment and R&D. It gathered experts from OECDcountries who collect and analyse data on the environmental goods and services industry as part of theirwork at national ministries for economics or industry, national statistical offices, or public and privateresearch institutes.
At its first meeting in Luxembourg in April 1995, the OECD/Eurostat Informal Working Group agreedon an interim definition and classification of the environment industry which was published in 1996.6 The
OECD 1999

4
The Environmental Goods and Services Industry: Manual for Data Collection and Analysis
definition and classification were tested during 1996 and 1997 by collecting new data and re-organisingavailable data in OECD countries. In particular, the United States, Canada, the Commission of theEuropean Communities and France used this classification to design and carry out new surveys and stud-ies on the environment industry. The interim definition and classification was refined and improved onthe basis of this new work by the OECD/Eurostat Informal Working Group at its second meeting inLuxembourg in May 1997.
The results of this work have been used in the drafting of the present manual, the need for which wasexpressed during the first Luxembourg meeting in 1995. The manual was prepared under the joint aegisof the OECD and Eurostat. It provides a set of flexible guidelines that can be used to produce compre-hensive and comparable data on the environment industry. Governments, researchers and consultantsare encouraged to use it as a reference for their future initiatives and work.
Special thanks are due to all the experts who contributed their time and resources to this first editionof the Environmental Goods and Services Industry Manual. Special thanks also go to all the colleagues in OECDfor their comments and contributions. The work was organised by Mr G. Vickery and Ms M. Iarrera of theOECD Industry Division, and by Mr A. Steurer of Eurostat. The manual is published on the joint respon-sibility of the Secretary-General of the OECD and the Director General of Eurostat.
Directorate for Science, Technology and Industry EUROSTAT
OECD
1. OECD (1992), The OECD Environment Industry: Situation, Prospects and Government Policy, Paris.
2. OECD (1996a), The Global Environment Goods and Services Industry, Paris.
3. Commission of the European Communities (1992), Communication of the Commission to the Council andEuropean Parliament, Industrial Competitiveness and Protection of the Environment, SEC(92)1986 final.
4. Communication of the European Communities (1997), Communication from the Commission on Environmentand Employment, Building a Sustainable Europe, COM(97)592 final.
5. OECD (1996b), The Environment Industry – The Washington Meeting, Paris.
6. OECD (1996c), “Interim Definition and Classification of the Environment Industry”, OCDE/GD(96)117, Paris.
OECD 1999

5
TABLE OF CONTENTS
Foreword ........................................................................................................................................................................... 3
Chapter I. Objectives and Scope of the Manual .......................................................................................................... 71. Preamble ........................................................................................................................................................................ 72. Objectives and scope ................................................................................................................................................... 83. Possible future revisions .............................................................................................................................................. 8
Chapter II. General Concepts ........................................................................................................................................... 91. Definition of the environment industry...................................................................................................................... 92. Classification of the environment industry ................................................................................................................ 10
Chapter III. A System for Data Collection and Analysis ................................................................................................ 151. The general framework ................................................................................................................................................. 152. Evaluating methods for data collection and analysis ............................................................................................... 173. Some suggestions.......................................................................................................................................................... 18
Chapter IV. Practical Approaches and Methods for Data Collection and Analysisof the Environment Industry ......................................................................................................................... 21
1. Supply-side approach .................................................................................................................................................. 212. Demand-side approach................................................................................................................................................ 253. Combining supply- and demand-side approaches .................................................................................................. 284. Other methods............................................................................................................................................................... 28
Chapter V. Remaining Issues: Progress and Approaches ........................................................................................... 311. Dual-use and multi-purpose products ....................................................................................................................... 312. Cleaner technologies and products ............................................................................................................................ 313. International trade ........................................................................................................................................................ 32
Annex 1. Explanatory Notes on the Classification of the Environmental Goods and Services Industry .............. 33A. The “Pollution Management” Group........................................................................................................................... 33B. The “Cleaner Technologies and Products” Group..................................................................................................... 35C. The “Resource Management” Group .......................................................................................................................... 35
Annex 2. Environmental Goods: Illustrative Categories with Harmonized Commodity Descriptionand Coding System (HS) Commodity Codes ................................................................................................... 39
A. Pollution Management Group ..................................................................................................................................... 39B. Cleaner Technologies and Products Group................................................................................................................ 42C. Resource Management Group .................................................................................................................................... 43
Annex 3. Environmental Activities in the North American Industry Classification System (NAICS) ...................... 45
Annex 4. Nace Rev. 1 Codes related to the Environment Industry: The Netherlands ............................................. 46
Annex 5. Distribution of the Environmental Goods and Services Industryby Standard Industrial Activity: France, 1991 ................................................................................................ 52
Annex 6. Distribution of the Environment Industry by Standard Industrial Activity: Germany, 1992................... 53
Annex 7. An Example of a More Detailed Breakdown of the Environment Industry............................................... 54A. Pollution Management Group ..................................................................................................................................... 54B. Cleaner Technologies and Products Group ............................................................................................................... 56C. Resource Management Group .................................................................................................................................... 56
Annex 8. OECD/Eurostat Informal Working Group on the Environment Industry: List of Participants................. 58
Notes ...................................................................................................................................................................................... 61
Bibliography .......................................................................................................................................................................... 63
OECD 1999

7
Chapter I
OBJECTIVES AND SCOPE OF THE MANUAL
1. Preamble
Many studies have attempted to quantify the impact of the environmental goods and services indus-try on economic growth. Identifying this industry is not straightforward because enterprises engaged inmany different industrial activities are involved in producing environmental goods and services. Some ofthese are new firms specialising in this area, while others operate in traditional industries with low spe-cialisation in the environment. Some firms produce environmental services for their own use; others,which used to do so, now outsource this activity. Only if all environment-protection-related activities canbe identified, i.e. those by specialist firms, those by non-specialist firms in other industries, and thoseproduced by firms for their own internal use, can we begin to speak of an “environmental protectionindustry” with some precision, as we do for, say, the iron and steel industry. Further, because many of theproducts used for environmental protection are multi-purpose, it is impossible to identify a set of prod-ucts as being exclusively and exhaustively used for environmental protection. This means that it is nei-ther possible to point to an “environmental protection industry” or to environmental protection productsexclusively and exhaustively within the standard international classification of industrial activities (Inter-national Standard Industrial Classification, ISIC) or products (Central Product Classification, CPC), nor touse standard statistical collections based entirely on existing classifications to measure the industry. Newtechniques have to be developed in order to identify as closely as possible enterprises, activities andproducts involved in the environment industry.
There is considerable interest in dealing with these difficulties and disparities in order to makeavailable data that is broadly comparable across countries. The OECD/Eurostat Informal Working Groupon the Environment Industry met several times between 1994 and 1997 to share experiences and harmo-nise views on the environmental goods and services industry. An interim definition and classification ofthe environmental goods and services industry was published in 1996.1 The interim report proposed anOECD-wide definition and classification and identified a set of “core” environmental goods and servicesactivities.
The definition and classification were subsequently tested to verify their feasibility. The UnitedStates, Canada, the Commission of the European Communities and France used the interim definitionand classification to collect new data on environmental goods and services but with somewhat differentapproaches and methods. The United States, Canada and France undertook direct surveys of the envi-ronmental goods and services industry, while the European Commission adopted a combined approachwhich gathered and matched information from different sources (e.g. direct survey, environmental expen-diture) on the basis of the UN System for Integrated Environmental and Economic Accounting (SEEA).
The experience gained through the implementation of these new data surveys was used to modifyand improve the definition and classification and to provide a set of guidelines on best practices andmethods for data collection on the environmental goods and services industry. The results form the basisof this first edition of the Environmental Goods and Services Industry Manual. This manual was extensively dis-cussed, both internally by the OECD/Eurostat Informal Working Group on the Environment Industry andexternally with various Departments of the OECD (the Science, Technology and Industry Directorate, theStatistics Directorate, the Environment Directorate), Eurostat and the UN Statistics Division.
OECD 1999

8
The Environmental Goods and Services Industry: Manual for Data Collection and Analysis
Chapter I specifies the objectives and scope of the Environmental Goods and Services Industry Manual.Chapter II describes the general concepts, definition and classification of the environment industry, whileChapter III presents a general framework for the collection of data, indicates the relative strengths andweaknesses of each method and approach, and recommends best methods for analysis. Chapter IVdescribes methods and approaches for data collection and analysis. Chapter V discusses outstandingissues. Annex 1 provides a detailed description of the environmental goods and services industry classi-fication. Annex 2 shows links between environmental goods and Harmonized Commodity Descriptionand Coding System (HS) commodity codes for international trade. Annexes 3, 4, 5 and 6 illustrate thepractical experience gained in OECD countries in using standard classification systems to define andmeasure the environment industry. Annex 7 presents an example of a more detailed breakdown of theenvironment industry and Annex 8 gives the composition of the OECD/Eurostat Informal Working Groupon the Environment Industry.
2. Objectives and scope
This manual aims to serve as a set of guidelines to assist in developing new data collection and stud-ies and to enable more rigorous and improved cross-country comparison of work in this area. It proposesa definition and classification of the environmental goods and services industry, describes methods fordata collection and recommends best methods and approaches for analysis.
The definition and classification aim to be as complete, flexible and operational as possible in orderto measure the environment industry as it currently stands, and to allow for future structural changes,such as shifts from end-of-pipe to cleaner technologies or the development of new environmentalservices.
The methods and approaches recommended in this manual have been assessed by statisticians,researchers and consultants on the basis of current best practices in OECD countries. National statisticaloffices and researchers are provided with a toolbox that allows flexible adaptation to specific national sit-uations in terms of the predominant policy interests, data availability, research budgets and structure ofthe industry.
3. Possible future revisions
In drafting this manual for data collection and analysis of the environmental goods and servicesindustry, the OECD/Eurostat Informal Working Group recognised that it constitutes “work in progress”, asthe statistical assessment of the environmental goods and services industry is complex, and availabledata are limited, incomplete and not always comparable across countries. Furthermore, accounting forcertain classes of environmental goods and services, such as cleaner technologies and products, remainsdifficult and/or laborious. In future, more appropriate solutions may be found for these classes based onthe experience gained in data collection. For example, the implementation of new classifications ofindustrial activities and products (e.g. the North American Industry Classification System, the UN CentralProduct Classification) is proceeding, and results are not yet fully available in all countries. Moreover,important new data collection exercises on the environmental goods and services industry have beenundertaken or are planned in a number of countries (e.g. France, Germany). This work will also help toclarify outstanding issues such as those identified in Chapter V.
The OECD/Eurostat Informal Working Group considers it important to produce this EnvironmentalGoods and Services Industry Manual at this point in time so as to provide a solid, although necessarily incom-plete, reference point for future work. The manual will be revised if there is sufficient practical experienceto show that the definition, classification or methodologies have become out of date or are not opera-tional. For example, if further development and improvement of environmental statistics enable a moresystematic and efficient definition, classification and collection of data on cleaner technologies, pro-cesses and products, then the OECD/Eurostat Informal Working Group will initiate a revision process.
OECD 1999
9
Chapter II
GENERAL CONCEPTS
1. Definition of the environment industry
After considering various definitions of the environment industry, the OECD/Eurostat InformalWorking Group agreed on the following definition:
The environmental goods and services industry consists of activities which produce goods and services to measure, pre-vent, limit, minimise or correct environmental damage to water, air and soil, as well as problems related to waste, noiseand eco-systems.
This includes cleaner technologies, products and services that reduce environmental risk and minimise pollution andresource use.
For cleaner technologies, products and services, despite their importance, there is currently noagreed methodology which allows their contribution to be measured in a satisfactory way.
It is not possible to exclusively or exhaustively identify environmental goods and services. Manygoods which may be used for environmental protection, for example pumps, may also be used for quitedifferent activities, and some goods which at first sight may seem unconnected with the environment mayin certain applications be so used.
Information on the environmental goods and services industry should be presented in a way thatallows a breakdown into principal, secondary and ancillary activities, and private and public activitieswhere possible and practical. This breakdown is useful for the following reasons.
Principal, secondary and ancillary activities: The firms that are of interest in identifying the environmentalgoods and services industry are those which produce significant amounts of products deemed to be actu-ally or potentially useful for environmental protection. This is a variation on usual practice in nationalaccounting whereby firms are allocated to industries according to the principal (main) product. Relativelyfew firms are so specialised that they produce only a single product, and those that are tend to be verysmall. Larger firms almost always produce one or more secondary products. If we measure the activity ofall firms whose principal product is environmental, we may include non-environmental secondary prod-ucts and exclude environmental secondary production from non-environmental firms. To minimise theexclusion of the latter, it is possible to be more inclusive in the definition of the “industry” by specifying“significant” production rather than main production of environmental products.
In addition to principal and secondary products, most firms also produce ancillary services, the out-put of which is not intended for use outside the enterprise. An ancillary activity is undertaken within anenterprise to create the conditions within which the principal and secondary activities can be carried out(e.g. record-keeping, purchasing of material and equipment, hiring, training, managing and payingemployees, cleaning and maintenance of buildings and other structures, etc.). An ancillary activity maygrow to the point that it has the capacity to provide services outside the enterprise. For example, a wastemanagement unit may develop in-house capabilities for which there is outside demand. When an ancil-lary activity starts to provide services to outsiders, that part of the activity which produces output for salehas to be treated as secondary rather than ancillary.2
In the same way, an enterprise may have to choose between undertaking ancillary activities whichprovide supporting services for its principal or secondary activities or purchasing such services on themarket from a specialist service producer. In this case, if ancillary activities are not separately considered,
OECD 1999

10
The Environmental Goods and Services Industry: Manual for Data Collection and Analysis
institutional changes, which lead to the outsourcing of ancillary activities, may be interpreted as growthrather than as a substitution of internal (ancillary) activities by external (market) transactions. There issome evidence of a trend towards outsourcing of previously ancillary environmental activities or viceversa as a result of economic forces, including the introduction of more stringent environmental regula-tions. Therefore, it is suggested that, wherever possible, separate information on ancillary activities beprovided.
Private and public activities: Ownership structures in the environmental goods and services industry dif-fer widely across countries. This is particularly true for the provision of environmental services. For exam-ple, public shares of municipal waste management range from some 25% in Spain and France, to 85% incountries such as Denmark and Portugal. Similarly, the public sector share of municipal wastewater man-agement ranges from 15% of the market in the United Kingdom to 95% in Germany (Drouet, 1997a).
There is evidence of a trend towards privatisation, either through increased subcontracting to pri-vate institutions or through full privatisation of environmental activities. If data collection and analysiscover only private activities and ownership, then changes resulting from privatisation (or contracting out)of activities that were previously carried out in the public sector could lead to an overestimation of theenvironmental goods and services industry private sector growth rate, and render national studies lesscomparable. Distinctions between private and public ownership, and measurement of both, provide theinformation necessary to avoid such mis-interpretation.
As a general conclusion, where the above recommendations cannot be applied in full, it is suggestedthat studies and analytical results clearly label the types of activities that are described (private,public, etc.), and furnish some indicators for the trends in privatisation or outsourcing in order to ensurecorrect interpretation of the data.
2. Classification of the environment industry
A general framework
In classifying the environmental goods and services industry, the OECD/Eurostat Informal WorkingGroup underlined that the major concern is to provide a system which is accurate and useful, and whichcan be adapted to future needs. This industry is forecast to experience substantial structural changes,which include concentration, privatisation, a shift away from the production of end-of-pipe equipment tothe invention of new, integrated and cleaner technologies, and a move to totally new activities(e.g. environmental services). To achieve a flexible classification system which will capture such changes,the environmental goods and services industry is classified according to the matrix shown in Table 1. Thismatrix combines general categories of business activities of different kinds (columns) and the relatedenvironmental goods and services activity classes (rows). It can be modified and adjusted to betterreflect the structure of the environmental goods and services industry in different countries at differentmoments in time.
Guidelines underlying the classification
In classifying the environmental goods and services industry, activities producing environmentalgoods and services have been grouped on the basis of two main guidelines:
– the clear environmental purpose of goods or services supplied by the environmental goods andservices industry; and
– ease of statistical assessment of these activities and products.
The first guideline distinguishes between activities or products which directly aim to protect theenvironment and have a clear positive impact on environmental protection, and those which are carriedout for other reasons but which can also be used to protect, or are beneficial to, the environment. Thisguideline is particularly useful in identifying multi-purpose products (e.g. pumps, and products such asmore energy-efficient cars), or activities and products provided by highly diversified enterprises. Thesecond guideline provides a practical and cost-effective approach to data collection. The collection of
OECD 1999

11
General Concepts
information and the international comparability of data should be time- and resource-efficient. There-fore, if the assessment of a particular class of environmental goods or services is likely to produce impre-cise or ambiguous results and is resource-intensive, then it may be more convenient to neglect it for thetime being (e.g. cleaner technologies and products).
In accordance with these guidelines, the environmental goods and services industry has beendivided into three main groups: a “Pollution management” group; a “Cleaner technologies and products”group; and a “Resource management” group.
The “Pollution management” group comprises goods and services that are clearly supplied for anenvironmental purpose only, that have a significant impact in reducing polluting emissions and that are easilystatistically identifiable.
The “Cleaner technologies and products” group comprises goods and services which reduce or elim-inate negative environmental impacts, but which are often supplied for other than environmental pur-poses and for which statistical assessment remains disputed, difficult or expensive. The classification andcollection of data for the cleaner technologies and products group is still in the development stage.
The “Resource management” group comprises goods and services which may be associated withenvironmental protection, although their prime purpose is not environmental protection (e.g. energy sav-ing and management, renewable energy plants or indoor air pollution control). This group will most oftenbe an optional addition to collection of data, and its inclusion will depend on policy interest and statis-tical feasibility. The classification and collection of data for the resource management group is still in thedevelopment stage.
To ensure international comparability it is most important to collect and present data in a way whichallows identification of individual parts of the industry, especially with respect to the borderlinesbetween “Pollution management”, “Cleaner technologies and products” and “Resource management”.
The “Pollution management” group represents the core of the environmental goods and servicesindustry, as all activities have as their main aim to protect the environment and data are easily collected.“Cleaner technologies and products” and “Resource management” are also significant areas and it isbelieved that their importance will increase in the future (see e.g. IVA 1996, OECD, 1996a). However, theselatter two areas suffer from identification, measurement or agreement problems, with the result that thereis little comparability between existing data, which have usually been collected on the basis of differentdefinitions and different groupings of activities.
Table 1. Mapping environment activities
Business activitiesProduction
of equipmentand specific materials
Provisionof services
Constructionand installation
of facilities.......
Environmental goods and services classes
Pollution management groupAir pollution controlWastewater managementSolid waste managementRemediation/clean-up of soil and waterNoise/vibration abatementMonitoring, analysis, assessment
Cleaner technologies and products group
Resource management group
Note: This matrix is used to allocate business activities carried out by the environmental goods and services industry to environment classes. Theenvironmental goods and services industry is assessed by filling the cells to indicate where satisfactory definitions and reliable data are avail-able. This process can be repeated to adjust the classification to structural changes in the industry. The matrix is designed to allow compre-hensive identification of environmental goods and services industry classes. Not all cells in the matrix can be satisfactorily filled due tolimitations in the current state of knowledge and data collection possibilities. In addition, not all the cells of the matrix are considered to beof sufficient quantitative importance to justify major investment in data collection and research.
OECD 1999
12
The Environmental Goods and Services Industry: Manual for Data Collection and Analysis
The classification
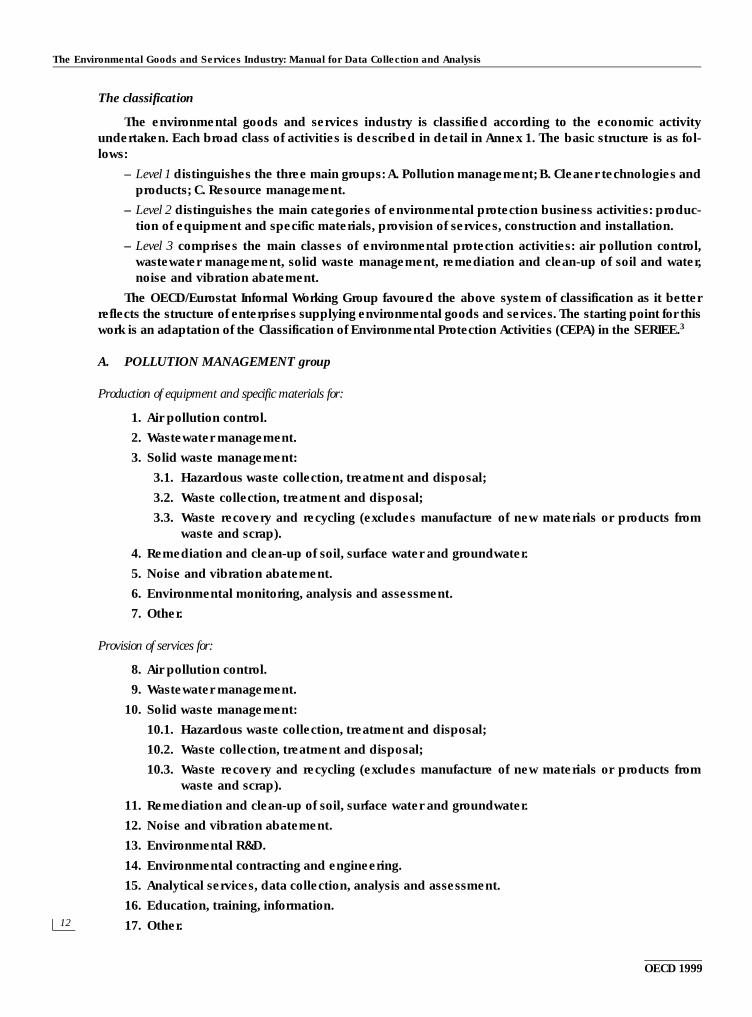
The environmental goods and services industry is classified according to the economic activityundertaken. Each broad class of activities is described in detail in Annex 1. The basic structure is as fol-lows:
– Level 1 distinguishes the three main groups: A. Pollution management; B. Cleaner technologies andproducts; C. Resource management.
– Level 2 distinguishes the main categories of environmental protection business activities: produc-tion of equipment and specific materials, provision of services, construction and installation.
– Level 3 comprises the main classes of environmental protection activities: air pollution control,wastewater management, solid waste management, remediation and clean-up of soil and water,noise and vibration abatement.
The OECD/Eurostat Informal Working Group favoured the above system of classification as it betterreflects the structure of enterprises supplying environmental goods and services. The starting point for thiswork is an adaptation of the Classification of Environmental Protection Activities (CEPA) in the SERIEE.3
A. POLLUTION MANAGEMENT group
Production of equipment and specific materials for:
1. Air pollution control.
2. Wastewater management.
3. Solid waste management:
3.1. Hazardous waste collection, treatment and disposal;
3.2. Waste collection, treatment and disposal;
3.3. Waste recovery and recycling (excludes manufacture of new materials or products fromwaste and scrap).
4. Remediation and clean-up of soil, surface water and groundwater.
5. Noise and vibration abatement.
6. Environmental monitoring, analysis and assessment.
7. Other.
Provision of services for:
8. Air pollution control.
9. Wastewater management.
10. Solid waste management:
10.1. Hazardous waste collection, treatment and disposal;
10.2. Waste collection, treatment and disposal;
10.3. Waste recovery and recycling (excludes manufacture of new materials or products fromwaste and scrap).
11. Remediation and clean-up of soil, surface water and groundwater.
12. Noise and vibration abatement.
13. Environmental R&D.
14. Environmental contracting and engineering.
15. Analytical services, data collection, analysis and assessment.
16. Education, training, information.
17. Other.
OECD 1999

13
General Concepts
Construction and installation for:
18. Air pollution control.
19. Wastewater management.
20. Solid waste management:
20.1. Hazardous waste collection, treatment and disposal;
20.2. Waste collection, treatment and disposal;
20.3. Waste recovery and recycling (excludes manufacture of new materials or products fromwaste and scrap).
21. Remediation and clean-up of soil, surface water and groundwater.
22. Noise and vibration abatement.
23. Environmental monitoring, analysis and assessment.
24. Other.
B. CLEANER TECHNOLOGIES AND PRODUCTS group
Production of equipment, technology, specific materials or services for:
1. Cleaner/resource-efficient technologies and processes.
2. Cleaner/resource-efficient products.
C. RESOURCE MANAGEMENT group
Note: For this group, activities aimed at the production of environmental goods and services and related construction aregrouped together for convenience. However, it is suggested that, wherever possible, information on these items be separatelycollected and presented.
Production of equipment, technology and specific materials, provision of services, and construction and installation for:
1. Indoor air pollution control.
2. Water supply.
3. Recycled materials (manufacture of new materials or products from waste or scrap, separatelyidentified as recycled).
4. Renewable energy plant.
5. Heat/energy saving and management.
6. Sustainable agriculture and fisheries.
7. Sustainable forestry.
8. Natural risk management.
9. Eco-tourism.
10. Other (e.g. nature conservation, habitats and biodiversity).
OECD 1999

15
Chapter III
A SYSTEM FOR DATA COLLECTION AND ANALYSIS
1. The general framework
Data for industrial activities are generally collected on the basis of national or international standardclassifications. In the case of the environment industry, information and data cut across standard classifi-cations of economic activities, making usual statistical assessments difficult, if not impossible.
An assessment of the environment industry requires the implementation or combination of alternative methods. As dif-ferent methods have different data coverage, benefits and costs, the OECD/Eurostat Informal WorkingGroup on the Environment Industry recommends that those collecting data on the environment goodsand services industry:
– Clearly identify the aims of the enquiry and economic variables which best fulfil informationneeds. As no single method ensures – at low cost – data for the whole environmental goods andservices industry for all economic variables, it is recommended that the objectives and informationneeds be clearly analysed and stated before choosing the most appropriate methods for data col-lection and analysis.
– Identify the best method or combination of methods for data collection and analysis according tothe aims and information needs, desired coverage of the industry and cost effectiveness.
Identifying the aims of the enquiry and the optimal set of economic variables requires careful consider-ation of the policy questions which the enquiry will have to address. For example, if policy makers areinterested in understanding the environmental goods and services industry’s contribution to economicgrowth, the aim of the enquiry will be to acquire knowledge about the relative impact of this industry onthe economy as a whole, and annual growth rates for the industry (for turnover, value added,employment, etc.), will be the most appropriate economic variables (see Table 2).
In general, information should be collected at least for the following standard economic variables toenable basic analysis of the environment industry, as far as possible broken down by environmental protec-tion activity (air pollution control, wastewater management, solid waste management, etc.) and business activ-ity (production of equipment and specific materials, provision of services, construction and installation):
– turnover;
– employment (if possible by skill level or occupational classification);
– investment;
– exports;
– R&D.
For a full analysis of the environmental goods and services industry, the following further informa-tion, obtained from other sources or by other methods, would be particularly helpful:
– innovation (from innovation surveys);
– patents (national or international patent statistics);
– state aid for industry promotion and exports (from government sources);
– mergers and acquisitions (information may be obtained from structural statistics, or from special-ised consultants and financial analysts).
OECD 1999

16
The Environmental Goods and Services Industry: Manual for Data Collection and Analysis
Having identified aims and economic variables, it is crucial to choose the method which will provideall (or most) of the required information. The OECD/Eurostat Informal Working Group on the EnvironmentIndustry suggests alternative methods of four different kinds: supply-side approach; demand-side approach;integrated supply and demand approach; other methods.
The supply-side approach is characterised by the collection of information on the supply of goods andservices for environment protection, principally by means of targeted surveys of environmental goodsand services industry producers. The demand-side approach is characterised by the collection of informationon the demand for goods and services for environment protection in the form of data on environmentprotection expenditure. The integrated supply and demand approach combines information available on boththe supply and demand sides and attempts to reconcile this information in a consistent accountingframework.
Historically, the supply-side approach has been used by statistics-gathering bodies within govern-ments to collect information on manufacturing enterprises (often collected by government IndustryDepartments); and on environmental services (often collected by government Environment Depart-ments). Statistical offices have tended to use the demand-side approach and have only recently startedto launch more comprehensive supply-side surveys (e.g. Canada, France, Germany, the United States).Outside government, business associations frequently survey their members in manufacturing orservices.
In this chapter, these approaches and methods will be described and analysed, indicating data cov-erage, advantages and disadvantages of each, in order to help collectors of data on the environmentalgoods and services industry choose the best mix of methods and approaches.
Table 2. Correspondence between policy questions and economic variables
Policy questions Variables/ indicators
Environmental goods and services industry contribution to economic growth
⇒ Annual growth in turnover, value added, employment, etc.
Environmental goods and services industry production and employment
⇒ Turnover, value added, employment and type of jobs
Environmental goods and services industry contribution to international trade
⇒ Exports, imports, international direct investment, licensing agreements
Environmental goods and services industry contribution to regional, structural strategies
⇒ Turnover, value added, employment, etc., by region or industry structure
Interaction between R&D policy and environmental technology development
⇒ Environmental R&D as share of total R&D; new patents for environmental technology
Cost of environmental services ⇒ Price per unit of environmental services (e.g. $/tonne of treated waste)
Barriers to international competition in the provision of environmental goods and services
⇒ Share of the market served by local suppliers or monopoly suppliers
Ability of environmental goods and services industry activities to meet environmental protection goals
⇒ Environmental industry activities linked to environment indicators
Environmental goods and services industry contribution to sustainable development
⇒ Preventive activities’ (e.g. cleaner technologies and products) share of total environment industry output
Environmental goods and services industry and innovation ⇒ Environmental goods and services industry R&D and investment expenditure, non-economic data, e.g. patent counts
Ownership, concentration and structure of the environmental goods and services industry
⇒ Number and size of producers by ownership (domestic/foreign, public/private), mergers and acquisitions
Source: Based on Drouet (1997a).
OECD 1999

17
A System for Data Collection and Analysis
2. Evaluating methods for data collection and analysis
To identify the best method or combination of methods for data collection, it is suggested that themethods be evaluated on the basis of the following criteria: magnitude of business activities which constitutethis industry; data coverage and collection efficiency (extent and level of detail of information needed for theanalysis of the environment industry, and the relative costs in terms of resources and time to collect thesedata); economic variables and data quality (each method has its strengths and weaknesses in delivering infor-mation on specific variables – see below for details).
Magnitude of business activities. It is recommended that the structure of the environmental goods andservices industry and the relative weight of each business activity be taken into consideration in thechoice of the appropriate method to be used. Table 3 shows OECD average relative weights of businessactivities of the environmental goods and services industry. Equipment manufacturing and provision ofservices together constitute some 70-80% of the environment industry. Methods which provide compre-hensive data for equipment manufacturing and provision of services will give a better idea of the size andstructure of the industry as a whole than will methods which only cover engineering and research anddevelopment, since the latter represent only a small fraction of the industry.
Data coverage and collection efficiency. To select the most appropriate method, it is recommendedthat the effectiveness of each method be evaluated in terms of data coverage. Each method will providea different level of coverage for different business activities. Table 4 assesses each method with regardto data coverage for different business activities. The rankings are based on experience gained acrossOECD countries and on the amount and quality of data already available from other statistics(e.g. pollution control expenditure statistics).
Table 3. Typical structure of the environmental goods and services industryin OECD countries, by business activity
Environmental goods and services industry business activities Share of the total environment industry
Equipment manufacturing 25-35%Provision of services 40-50%Research and development 2-4%Engineering services 5-10%Construction and installation of facilities 15-25%
Note: Shares are based either on value added or employment. These indicative estimates are derived from the results of environmental goods andservices industry surveys and studies in OECD countries.
Source: Drouet, 1997a.
Table 4. Coverage of environmental goods and services industry business activities using different methods
Business activitiesSupply-side
surveyStandardstatistics
Trade association data
Demand-sidedata
Physical data combined with financial ratios
Combining supply and
demand side approaches
Equipment manufacturing A C/D B/C B B/D BProvision of services A/Ba B/C B/C B B AResearch and development B C E C E AEngineering services A C B/C B/C E AConstruction and installation of facilities A B/C C B B/D A
a) Marketed services are well covered, but public sector service provision and in-house services may be difficult to cover.Key: A: Good coverage.
B: Reasonable coverage.C: Method applicable for providing sub-activity data, but not sufficient to cover the entire activity.D: Not sufficient, needs further development.E: Not normally applicable.
Source: OECD, based on national surveys and research results.
OECD 1999

18
The Environmental Goods and Services Industry: Manual for Data Collection and Analysis
In order to make best use of Table 4, it should be borne in mind that the methods differ in their abil-ity to cover private and public, and primary, secondary and ancillary activities. For example, supply-sidesurveys are best suited to covering private and public enterprises producing environmental goods andservices, and are less powerful when it comes to ancillary activities and some government activities.Demand-side data based on environmental expenditure statistics, on the other hand, often provide bet-ter information on secondary, ancillary and some government activities, whereas data on the private envi-ronmental goods and services supply industry are only covered indirectly (for details see Chapter IV).
The third approach, which combines supply- and demand-side data, is not an independent data col-lection method in itself. It is instead a modelling approach which merges data from other methods.
Economic variables and data quality. The different statistical approaches and methods are also eval-uated according to the main economic variables: turnover (defined as the value of the goods and servicesthat a company/enterprise has sold during a period of time), value added, employment, exports andimports, number and size of enetrprises, etc. Table 5 shows an evaluation of each method with regard todata quality for each variable. As data quality only refers to the level of detail provided by each method,Table 5 should be read in combination with Table 4 to gain a more comprehensive picture of thestrengths and weaknesses of the different methods.
While the combination of supply- and demand-side information increases the coverage of environ-mental goods and services industry classes (i.e. it is to some extent additive, see Table 4), the quality ofthe data is not necessarily improved. Consistency and reliability of data increase for broad categories,but at the expense of the level of detail.
3. Some suggestions
Specific supply-side survey
As indicated in Tables 4 and 5, a comprehensive supply-side survey is the best method as far as data cov-erage and quality are concerned. Work by the OECD/Eurostat Informal Working Group on the Environ-ment Industry suggests that supply-side surveys are indispensable to provide comprehensive informa-tion on the environmental goods and services industry. By using a specific survey, it is possible to providedetailed information covering most relevant economic variables (e.g. turnover, employment and exportsby environmental class, by size class of enterprise and with reference to standard industrial classifica-tions, R&D) for most environmental goods and services industry classes. Direct surveys will also providereliable information on public and private R&D.
Table 5. Quality of environmental goods and services industry variables using different methods
VariablesSupply-side
surveyStandard statistics
Tradeassociation data
Demand-side data
Physical data combined with financial ratios
Combiningsupply and
demand side approaches
Turnover 1 2 2 2 3 1Value added 3 3 4 4 4 3Employment 1 2 2 2 4 3Investment 1 1 2 2 3 3Exportsa 1 3 2 4 4 3Research and developmentb 1 3 2 2 4 4Number and size of enterprises 2 1 2 4 4 4
a) Imports of environmental goods and services are in general very difficult to measure.b) Research and development activities of environmental goods and services providers. They may also include non-environmental research and
development.Key: 1: Good quality, detailed and reliable data.
2: Reasonable quality, some weaknesses in level of detail or reliability.3: Estimates or modelling results. Reliable at aggregate level, generally weak or unreliable at disaggregated level.4: Insufficient quality/variable not covered.
Source: OECD, based on national surveys and research results.
OECD 1999

19
A System for Data Collection and Analysis
However, specific surveys present some inconveniences. For example, they do not capture all turn-over (e.g. secondary and ancillary activities) and employment effects of environment protection activi-ties. They more easily survey information for turnover and labour employed in the production of goodsand services when these are marketed. They are less effective in measuring values for the same variableswhen activities are non-market, ancillary or multi-purpose.
Furthermore, double counting is a problem specific to comprehensive surveys with respect to turn-over estimates. For example, if filter cloths and complete filters are both included in the list of environ-mental goods, the same filter cloths may appear twice. This problem is particularly severe in the field ofwaste management as it is characterised by complex relationships among public and private waste col-lectors, specialised treatment operators, recycling firms, etc. Also, survey results often include informa-tion relating to secondary, non-environmental activities. Even if it is possible to exclude this output, itmay be difficult to separate out the labour and other costs according to whether they are connected tothe environmental or the non-environmental output.
Although specific surveys of environmental goods and services enterprises deliver the largestamount of information, they are time- and resource-intensive. A comprehensive supply-side survey maycost several hundred thousand dollars and may take one to two years to design and conduct. When com-prehensive supply-side surveys are not feasible because of time or resource constraints, it is recommended that other methodsbe used, following the general suggestions in Tables 4 and 5, depending on the information available at country level and theaim of the enquiry.
Standard statistics
Data for some parts of the environmental goods and services industry can be obtained by usingavailable industrial or product classifications, although information will still be limited. For example,standard statistics for industrial activities provide data for some of the main parts of environmental ser-vices. In the case of Europe (e.g. the Netherlands), this method has been used to provide information ongeneral environmental services operations, by using data from NACE Rev. 1, Divisions 37, 5157 and 90(see Annex 4). Information on general environmental services can also be obtained through the Interna-tional Standard Industrial Classification (ISIC Rev. 3), Divisions 37 and 90.
When a specific supply survey is to be carried out, it is suggested that a detailed table be built estab-lishing correspondences between the enterprises surveyed and the categories of the national classifica-tion or International Standard Industrial Classification (ISIC). This can be done by creating a link betweenthe code for each enterprise and the activity to which it belongs in the standard classification system. Insuch a way, some information can be derived. For example, value added can be evaluated by using exist-ing data collected according to standard classifications. This table will also prove useful in designing thepopulation for future surveys.
Data classified by standard trade statistical codes (e.g. HS commodity codes) provide a first-roundmeasure of trade in environmental goods (see Annex 2 for more detail, services are not included). How-ever, coverage by standard trade codes is very limited and results in a grossly underestimated total tradevolume. It is estimated that the information derived from selected trade codes identified solely as envi-ronmental goods represents only about 20% of total international trade flows for environmental goods.This is because the majority of the environmental industry goods are multi-purpose products (e.g. filters,pumps, control equipment; see, for example, some goods included in Annex 2), and data for trade inenvironmental services are not provided, because services are not included in the HS commodity codesystem.
Data from trade associations or specialised business associations
Trade associations are a further source of information on the environment industry. They regularlypublish data on their members. This usually covers a particular class or sub-class of the industry – privateor municipal waste management, urban wastewater collection and treatment, recycling firms, equipmentproviders, etc. Either turnover and employment data or physical parameters, and in some cases value
OECD 1999

20
The Environmental Goods and Services Industry: Manual for Data Collection and Analysis
added, are usually reported. In general, these detailed data may complete existing data on the environ-ment industry, but they are insufficient to provide a wider picture of the whole industry.
The demand-side approach
The demand-side approach can help to provide and improve data on the environment protectionindustry. By using demand-side information (principally statistics on environment protection expendi-tures, see the European System for the Collection of Economic Information on the Environment –SERIEE,4 for more detail), it is possible to estimate supply-side data for broad parts of the industry. Dataon expenditures for pollution abatement and control can be manipulated by applying engineering esti-mates of typical cost structures, e.g. by estimating the share of construction and installation in total envi-ronmental investment expenditure to extract information on the environmental goods and servicesindustry. These ratios can then be applied at the level of the main sub-classes – wastewater treatmentplants, sewer systems, solid waste treatment facilities, etc.
This approach ensures consistency and provides information on most economic variables for theindustry as a whole. It allows assessment of secondary and ancillary activities; avoids the problem of hav-ing to identify and estimate environmental shares of multi-purpose goods; and eliminates double count-ing. However, interpretation of the results is subject to the assumptions implicit in the estimations andfor this reason, the data may be inaccurate.
This approach may be used to obtain data on employment. To do so, expenditure has to be trans-formed first into domestic production and then into employment. The estimation of domestic production(as opposed to domestic consumption) poses difficulties in the calculation of exports and imports. Thesecond step requires information on labour productivity, which implies the need to disaggregate produc-tion by sector. Average productivity for broad industry aggregations may be used as an approximation forthe environment industry (see also Blazejczak and Edler, 1997). This approach is a useful adjunct tosupply-side measurement to cross-check the information collected and is an important source of data forassessing parts of the industry that are otherwise difficult to capture (e.g. secondary and ancillaryactivities).
Combining supply- and demand-side approaches
An integrated approach, using both supply- and demand-side data, will combine the strengths andreduce the weaknesses of the two approaches taken separately. Combining supply- and demand-sidedata makes it possible to provide a more consistent picture of the total turnover and employment in theenvironment industry. Moreover, this integrated approach may help in assessing the turnover andemployment effects of cleaner technologies as well as the indirect effects, by providing a sound basis forestimates (see Pasurka and Steurer, 1995). See Chapter IV for more detail.
OECD 1999

21
Chapter IV
PRACTICAL APPROACHES AND METHODSFOR DATA COLLECTION AND ANALYSIS
OF THE ENVIRONMENT INDUSTRY
1. Supply-side approach
Specific environmental goods and services industry surveys
In designing and implementing supply-side surveys of the environmental goods and services indus-try, the following issues should be addressed: definition and classification of the industry; populationand sample design; questionnaire; costs versus coverage; correspondence between environmental goodsand services industry definitions and classification and those of standard statistics.
Definition and classification: Specific surveys on manufacturing and services suppliers are usuallycompiled on the basis of a recognised definition and classification. In the case of the environmentalgoods and services industry, the standard statistics do not contain a comprehensive recognised defini-tion and classification, therefore it is recommended that the definition and classification of the environmental goods andservices industry presented in Chapter II be used. If a modified version of the classification is used, it is essentialto specify the detailed list of goods and services taken into consideration in order to enable comparisonswith other surveys and data sources.
Population and sample design: In general, the population for surveys is built by choosing the divisionsof standard classifications which constitute an industrial sector, and then using statistical office registersof businesses and organisations to identify the establishments. In the case of the environmental goodsand services industry, the universe is unknown (a complete list of suppliers does not exist). Standardclassifications provide very few divisions (ISIC Rev. 3 Divisions 37 and 90) which regroup environmentalgoods and services enterprises, while most are classified under different divisions (e.g. chemicals, equip-ment manufacturing) as this industry is a cross-cutting one.
Therefore, it will be necessary to constitute a survey population. In doing so, it is important to ensurea good coverage of the universe: manufacturing, services and construction enterprises; public and privateenterprises; small, medium and large enterprises; other relevant public or private organisations. At thisstage, it is critical to ensure that both public and private suppliers are included in the survey populationand to be as inclusive as possible. Experience shows that building the survey population requires con-siderable effort.
One way of constituting the universe is to select divisions from standard classifications which mayinclude environmental goods and services producers, and to analyse each division at a more detailedlevel to verify whether environmental goods and services enterprises are effectively included. This canbe facilitated by using statistical office registers of businesses and organisations; catalogues, registersand lists from specialised industry associations as well as lists of contacts from environment trade showsand fairs and other sources (e.g. surveys of consulting engineering, scientific and technical services, wastemanagement industry, wholesale trade survey for scrap materials). It is suggested that all divisions thatcontain a sufficiently large number of establishments producing environmental goods and services beincluded. It would also be possible to run a special filtering survey to see how many of the original sampleis involved in the production of environmental goods and services.
OECD 1999

22
The Environmental Goods and Services Industry: Manual for Data Collection and Analysis
Alternatively, the universe can be constituted by selecting products which have an environmentaluse and relating them to existing product categories. Subsequently, these can be related to lists of enter-prises or establishments producing such goods and services. Although this method does produce goodresults, the fact that enterprises may change their product lines over time can create problems in identi-fying environmental producers.
Another way of proceeding is to directly identify environmental producers through specialised reg-isters and catalogues of suppliers. Where a comprehensive register exists, this can be used(e.g. environmental goods and services enterprises directory). For example, standard statistics for indus-trial activities, which usually already have a list of producers (e.g. ISIC Rev. 3/NACE Rev. 1 Division 90),include some parts of the environment industry.
Specific problems will arise in constituting the population for the survey of environmental goods andservices. Some producers may be difficult to identify. For example, in the manufacturing sector, enter-prises producing filters for environmental purposes may not be identifiable as part of the environmentindustry since filters are not used only to protect the environment, and enterprises in the trucking indus-tries that provide waste collection and hazardous material transportation services may be classifiedalong with enterprises that transport non-waste material.
Similarly, in the services sector, enterprises providing or specialising in environmental managementand consulting are classified among enterprises providing other management services such as humanresources, information systems, economic or traffic consulting. The treatment of enterprises providingenvironmental engineering, architectural, or land survey services is even more complicated. These enter-prises, which are classified in engineering, architectural and surveying service industries, may be exclu-sively environmental, exclusively non-environmental or may provide a combination of services.
Construction projects for environmental purposes present the same identification problems. Construc-tion enterprises may be involved in any combination of environmental or non-environmental projectsthat may change from year to year. Consequently, it is important to consider both large and small enter-prises in the relevant industries as potentially constructing projects for environmental use.
As for any other survey, once the population is established, the sample will be specified accordingto needs.
Questionnaire: Experience shows that the longer the questionnaire, the lower the response rate. It isrecommended that specific surveys collect, at a minimum, data on three economic variables: turnover (byenvironmental class); employment (by number employed); and exports. Any additional informationrequirements should be weighed in terms of survey cost and the likelihood of lower response rates.
Part of the questionnaire must be dedicated to a careful explanation of the reasons for and aims ofthe survey, together with instructions on how to compile the answers to avoid inappropriate responses.The questionnaire should include at least one filtering question to ensure a clear distinction betweenenterprises that satisfy the definition for inclusion in the industry and those that do not. This will avoid asituation in which businesses that do not provide environmental goods and services are inadvertentlyincluded in the population, or that environmental goods and services producers declare that they do notprovide environmental goods and services, when in fact they do. Thus, problems with the reporting andanalysis of results, in particular for the grossing up procedures, will be avoided.
This inconvenience can be reduced by setting out, at the beginning of the questionnaire, the reasonswhy enterprises have received the form, and how to respond if they have no environmental activity(e.g. by asking them to specify their activities). In some cases, respondents may provide both non-environmental and environmental goods and services. It is essential in these cases to ask respondentsto identify and report that portion of the value of products (or sales) which they recognise as being envi-ronmental, and to specify how the allocation is made.
Costs versus coverage: When deciding on the questionnaire and the survey sample, those collecting dataneed to consider the cost of operating the questionnaire and collecting responses. This is particularlypertinent when choosing between a census of the universe of suppliers, or a sample survey, and whenchoosing between an interview-based and a postal survey.
OECD 1999

23
Practical Approaches and Methods for Data Collection and Analysis of the Environment Industry
Correspondence with standard statistics: Once the universe and the population for the survey have been estab-lished, it is recommended that, wherever possible, the correspondences with standard statistics be estab-lished (e.g. enterprises are normally classified with a code number which links them to the main standardindustrial classification). This will improve the quality of the survey and facilitate analysis and further surveys.
In future, correspondence with standard statistical classifications may be more easily established assome national classifications are being revised to include separate items for parts of the environmentindustry. This is the case for ISIC Rev. 3 and NACE Rev. 1 (see Table 6). It is also the case for the NorthAmerican Industry Classification System implemented for the statistical year 1997, which includes disag-gregated classification levels for the environment industry. For example, firms which primarily constructwater, sewer and pipeline projects are classified separately from enterprises constructing other projects(see Annex 3 for details).
In conclusion, when collecting data on the basis of a supply-side survey, it is recommended that thefollowing issues be borne in mind:
a) A detailed classification and a detailed list of unique goods and services should be specified onthe basis of the definition and the classification (for an example of a detailed breakdown of theindustry, see Annex 7).
b) A universe and a practical survey population should be established. This phase, although time-consuming, is crucial as a complete list of all suppliers of environmental goods and services isnot readily available; the majority of the larger enterprises producing environmental goods andservices are not specialised; and many enterprises are unable to specify whether their productsare used for environmental or other purposes (e.g. filters and pumps). Since the statistical office’sregister of businesses and organisations is unlikely to be a very useful source of information initself, other sources must be used, such as industry association lists, government lists, cata-logues of environmental product suppliers, etc. The sample should be as representative as possible of thestructure of the environment industry, i.e. it should include private and public enterprises, small,medium and large enterprises, etc.
c) Collection units (enterprises, establishments, business units) should be specified, for examplefollowing suggestions presented in the International Standard Industrial Classification of all Eco-nomic Activities (ISIC Rev. 3).
Table 6. ISIC categories which identify environmental protection activitiesa
ISIC Code Category
37 Recycling
41b Collection, purification and distribution of water
51 Wholesale trade and commission trade, except of motor vehicles and motorcycles
5149 (part of) Wholesale of other intermediate products, waste and scrap
73 (part of) Research and development
74 Other business activities
7421 (part of) Architectural and engineering activities and related technical consultancy
75 Public administration and defence; compulsory social security
7512 (part of) Regulation of the activities of agencies that provide health care, education, cultural services and other social services, excluding social security
90 Sewage and refuse disposal, sanitation and similar activities
a) This list is not exhaustive. Environmental protection activities may also be part of other ISIC divisions and classes.b) Part of the Resource Management group.Source: Drawn from ISIC Rev. 3.
OECD 1999
24
The Environmental Goods and Services Industry: Manual for Data Collection and Analysis
d) The surveys should collect, at a minimum, data on three economic variables: turnover (by envi-ronment class); employment (by number employed); and exports.
e) The questionnaire should include a full explanation of the reasons for and aims of the survey, aswell as instructions on how to compile answers to avoid inappropriate responses.
f) An evaluation of costs against coverage should be carried out.
g) Wherever possible, correspondences between the environmental goods and services industrydefinitions and related detailed classifications and existing detailed industry and commodityclassifications should be made (see next section).
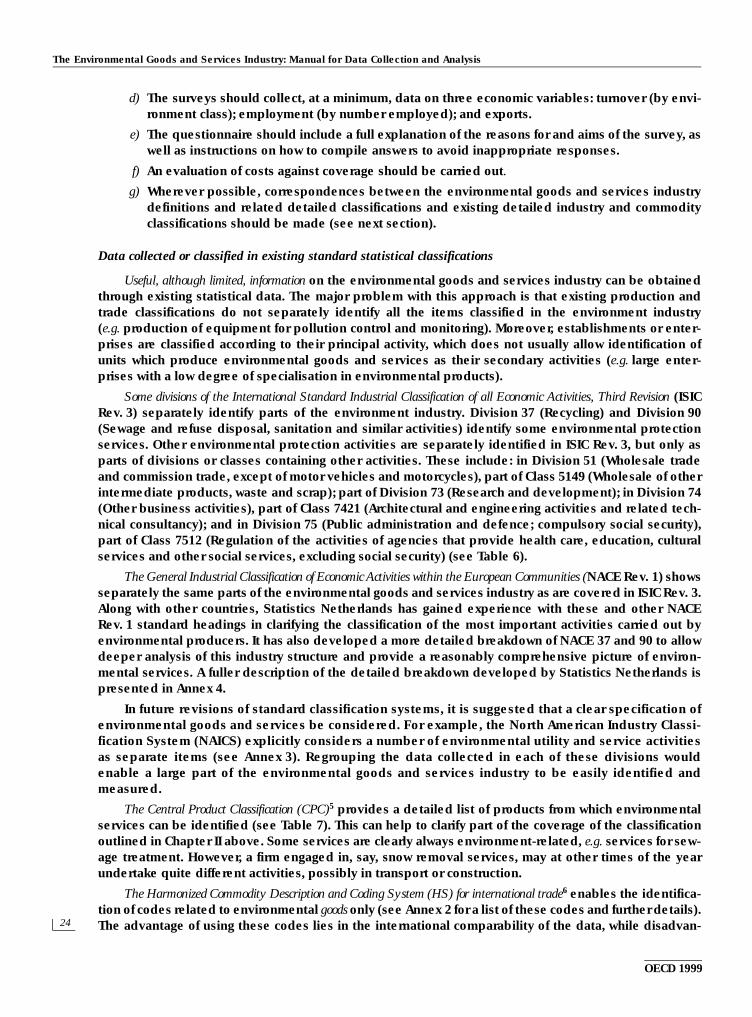
Data collected or classified in existing standard statistical classifications
Useful, although limited, information on the environmental goods and services industry can be obtainedthrough existing statistical data. The major problem with this approach is that existing production andtrade classifications do not separately identify all the items classified in the environment industry(e.g. production of equipment for pollution control and monitoring). Moreover, establishments or enter-prises are classified according to their principal activity, which does not usually allow identification ofunits which produce environmental goods and services as their secondary activities (e.g. large enter-prises with a low degree of specialisation in environmental products).
Some divisions of the International Standard Industrial Classification of all Economic Activities, Third Revision (ISICRev. 3) separately identify parts of the environment industry. Division 37 (Recycling) and Division 90(Sewage and refuse disposal, sanitation and similar activities) identify some environmental protectionservices. Other environmental protection activities are separately identified in ISIC Rev. 3, but only asparts of divisions or classes containing other activities. These include: in Division 51 (Wholesale tradeand commission trade, except of motor vehicles and motorcycles), part of Class 5149 (Wholesale of otherintermediate products, waste and scrap); part of Division 73 (Research and development); in Division 74(Other business activities), part of Class 7421 (Architectural and engineering activities and related tech-nical consultancy); and in Division 75 (Public administration and defence; compulsory social security),part of Class 7512 (Regulation of the activities of agencies that provide health care, education, culturalservices and other social services, excluding social security) (see Table 6).
The General Industrial Classification of Economic Activities within the European Communities (NACE Rev. 1) showsseparately the same parts of the environmental goods and services industry as are covered in ISIC Rev. 3.Along with other countries, Statistics Netherlands has gained experience with these and other NACERev. 1 standard headings in clarifying the classification of the most important activities carried out byenvironmental producers. It has also developed a more detailed breakdown of NACE 37 and 90 to allowdeeper analysis of this industry structure and provide a reasonably comprehensive picture of environ-mental services. A fuller description of the detailed breakdown developed by Statistics Netherlands ispresented in Annex 4.
In future revisions of standard classification systems, it is suggested that a clear specification ofenvironmental goods and services be considered. For example, the North American Industry Classi-fication System (NAICS) explicitly considers a number of environmental utility and service activitiesas separate items (see Annex 3). Regrouping the data collected in each of these divisions wouldenable a large part of the environmental goods and services industry to be easily identified andmeasured.
The Central Product Classification (CPC)5 provides a detailed list of products from which environmentalservices can be identified (see Table 7). This can help to clarify part of the coverage of the classificationoutlined in Chapter II above. Some services are clearly always environment-related, e.g. services for sew-age treatment. However, a firm engaged in, say, snow removal services, may at other times of the yearundertake quite different activities, possibly in transport or construction.
The Harmonized Commodity Description and Coding System (HS) for international trade6 enables the identifica-tion of codes related to environmental goods only (see Annex 2 for a list of these codes and further details).The advantage of using these codes lies in the international comparability of the data, while disadvan-
OECD 1999

25
Practical Approaches and Methods for Data Collection and Analysis of the Environment Industry
tages concern the limited coverage of purely environmental codes (of the order of only 20% of the totaltrade in environmental goods), the fact that services are excluded, and the fact that many of the identifiedgoods are also used for purposes other than environmental protection.
Estimations using standard statistical classifications
Other methods used to evaluate the size of the environmental goods and services industry arebased on estimated coefficients. Technical experts/engineers indicate the share of output of industrialactivities related to the production of environmental goods and services, on the basis of the environmen-tal demand features of the national economy. These coefficients are subsequently applied to selectedclasses in standard statistical classifications.
Alternatively, environmental protection activities can be identified by cross-classifying divisions ofstandard industrial statistical classifications (e.g. ISIC) by their main activity and by the category relatedto environmental activities. For example, treatment of wastewater in the textile industry will be identifiedunder the industry code for “Manufacture of textiles” and, by aggregation, it is possible to obtain an esti-mation of the total for all activities. This approach can be used to account for ancillary environmental pro-tection activities.
By establishing a correspondence between producers of environmental goods and services and pro-ducers listed in standard statistics, it is possible to estimate the share of total suppliers producing envi-ronmental goods and services. For example, the results of a survey show that X% of industrial equipmentsuppliers produce goods and services with an environmental purpose. This share can then be applied toestimate the number of suppliers and turnover of environmental goods and services in this sector. Ofcourse, this method is very approximate and does not allow for possible changes in the structure of theenvironmental protection industry (see Annex 5 for results for France and Annex 6 for Germany).
2. Demand-side approach
One of the major differences between supply and demand estimates involves their consideration ofprincipal, secondary and ancillary products. Supply-side estimates should include all production fromenterprises for which environmental goods and services form the principal product. As explained inChapter II, it is suggested that supply-side estimates also include enterprises for which the productionof environmental protection goods and services is significant, even if these are not the principal products.Only exceptionally will all environmental protection goods and services be covered this way and therewill almost always be some goods and services produced in small quantities by enterprises which falloutside the scope of the supply-side enquiry. There is also the risk that production data may containinformation on non-environmental protection goods and services. This may happen inadvertently orbecause the enterprise is simply unable to distinguish between the two. This problem will arise in par-ticular in the case of multi-purpose products or when the supplier is unaware of the purpose for which hisproducts are purchased.
Table 7. CPC categories which identify environmental protection services
CPC Code Category
94110 Sewage treatment services94120 Tank emptying and cleaning services94211 Non-hazardous waste collection services94212 Non-hazardous waste treatment and disposal services94221 Hazardous waste collection services 94222 Hazardous waste treatment and disposal services94310 Sweeping and snow removal services94390 Other sanitation services94900 Other environmental protection services
Source: Drawn from United Nations (1998), Central Product Classification (CPC) Version 1.0, New York.
OECD 1999

26
The Environmental Goods and Services Industry: Manual for Data Collection and Analysis
In contrast, demand-side approaches will pick up all environmental protection goods and servicesexpenditure irrespective of the source and will exclude the production of non-environmental goods andservices even when this comes from principal producers of environmental goods and services. On theother hand, although it may be fairly straightforward to measure the amount of money spent on environ-mental protection, demand-side approaches may be unable to precisely identify the productsconcerned.
For both supply- and demand-side estimates, measuring ancillary activity may present problems inpractice. Theoretically, such activities should be included in both measures. An example of a case inwhich the demand-side estimate may exceed the supply-side estimate is that of an enterprise whichdoes not supply any environmental protection goods and services for sale but nevertheless has a signif-icant amount of ancillary production of environmental protection goods and services. For these reasons,it is desirable to separate the use and production of ancillary services from transactions involving the saleand purchase of environmental protection goods and services.
The demand-side approach provides a view of the environmental goods and services industrythrough data on expenditure for pollution abatement and control and other expenditures related to envi-ronmental protection. In many countries, standard statistical systems have been better developed onthe demand side, so that extensive data on environmental expenditure are already available. Thisapproach is based on a comprehensive national accounting system for environmental demand (seeOECD, 1993).
The United Nations has proposed the System for Integrated Environmental and Economic Account-ing (SEEA) as a satellite system closely related to the core of the System of National Accounts (SNA). Thissystem is designed to measure environmental impacts on the whole economy (see UN Systems ofNational Accounts).
The SEEA comprises four parts. The first describes production and consumption activities andaccounting of non-financial assets, which also includes information on changes in the stocks of naturalassets. This part is constituted from the general SNA Input-Output table, where environmental activitiesare separately identified from the rest of the economy.
The second part describes the physical relationship between the natural environment and the pro-ducing sectors of the economy. The third evaluates the economic costs of the actual or potential deteri-oration of the environmental and natural resource assets associated with economic activities. This exer-cise requires a monetary evaluation of natural resources.
The fourth part contains information derived by extending the boundary to incorporate the eco-nomic functions of the natural environment (i.e. inclusion of the economic value of the service providedby wetlands in mitigating floods). Information on the environmental goods and services industry isobtained by disaggregating the environmental and non-environmental components of economic activi-ties within the Input-Output framework.
The separation of the SNA general Input-Output table into environmental and non-environmentalactivities depends on a large number of assumptions. Nevertheless, this approach is a very usefuladjunct to supply-side measurement in crosschecking the information gathered, and an important sourceof data for assessing parts of the industry which are otherwise difficult to capture or resolve (e.g. internalactivities, multi-purpose products).
The European System for the Collection of Economic Information on the Environment (SERIEE) hasproposed an accounting system for environmental expenditure: the Environmental Protection Expendi-ture Account (EPEA). This constitutes an application at the European level of the SNA proposal for satel-lite environmental accounts and analysis. Implementation of this system is also being considered inother OECD Member countries.
The EPEA system is used to calculate national environmental expenditure, and to analyse thefinance structure (how and by whom expenditures are financed) and the output of environmental protec-tion activities. The methodology applied varies depending on the sectors being investigated: public,
OECD 1999

27
Practical Approaches and Methods for Data Collection and Analysis of the Environment Industry
private (industrial and commercial) or household. Detailed methods for the collection of demand-sidedata in each of these areas are described below.
Public sector
All OECD countries have well-developed systems of public accounts data. These consist of a set ofdefinitions, units and classifications to obtain consistent data for inputs to national accounts. Consider-able effort is devoted to classifying the transactions of government organisations by purpose. This exist-ing source is a valuable one for investigating public expenditure on environmental protection and is wellestablished in a number of countries. The classification based on the purpose approach does not, how-ever, have many categories that could be entirely included in environment protection, and many trans-actions are effectively hidden under grouped codes.
In the new UN Classification of the Functions of Government (COFOG), Division 5 is dedicated toenvironmental expenditure, using the same breakdown as in the European SERIEE CEPA classification.This classification poses practical problems in identifying expenditure on environmental protection,because it may appear as a relatively minor item in the expenditure of administrative bodies. For exam-ple, the public authorities responsible for agriculture may have a programme to monitor the environmen-tal impact of chemical pesticides, but this may not be easily identified as environmental expenditure.
Annual reports of government institutions can also be used to obtain environmental expendituredata. These provide useful information, which can be reorganised to produce reasonable estimates forpublic sector expenditure on the environment.
Private (industrial and commercial) sectors
Comprehensive information is being collected in many countries on capital and current expendi-tures for pollution abatement and control of industrial and commercial businesses. The data are obtainedthrough specific surveys or through appending additional questions to existing surveys. For example,additional filtering questions can be used in existing capital expenditure surveys to provide a betterunderstanding of the purpose of the expenditure and to collect specific data on pollution abatement andcontrol expenditures. An alternative approach is to add questions on environmental expenditure to sur-veys designed for a different purpose, although this may be hampered by the lack of explicit environ-mental information in most company accounting systems.
The major conceptual issue to be resolved is the identification of the categories that should beincluded in capital expenditure on pollution abatement and control. The “end-of-pipe” category is easilyidentifiable, while “integrated” equipment is not. To overcome this identification problem, respondentsmay be requested to include expenditure only if the major reason for the expenditure is related to theenvironment (e.g. if the acquisition of the new item is required by environmental regulations). Otherapproaches include asking the respondent to provide details on each major item and then having a qual-ified engineer in the statistical office decide what proportion of the expenditure should be counted asenvironmental protection.
Household sector
Information on household expenditure is usually obtained through sample surveys. This kind of sur-vey is very demanding since respondents are asked to monitor all expenditures in considerable detailover a given period of time. In the case of environmental expenditures, this kind of survey would be avaluable source of data if it were possible to clearly classify the purchase of goods and services that pro-tect the environment. An alternative approach for obtaining environmental expenditure by householdsis to survey sales from environmental manufacturers and/or seek information from retailers. Theincreased use of bar codes and scanners to record sales has opened the possibility of obtaining informa-tion on specific product lines. However, in both approaches, the problem of identifying cleaner productshas to be dealt with.
OECD 1999

28
The Environmental Goods and Services Industry: Manual for Data Collection and Analysis
Household activities usually involve the purchase of environmental goods and services for finalconsumption. They are mainly included in final demand (e.g. automobile catalytic converters, expen-diture associated with the repair and maintenance of septic tanks). Once demand-side environmen-tal activities have been identified and measured, they need to be integrated with the available sup-ply-side information. This requires identification of the relevant transactions between economicactors.
3. Combining supply- and demand-side approaches
Reconciling supply- and demand-side estimates for economic production is an important and inte-gral part of the System of National Accounts (SNA).7 One of the SNA handbooks covers the application of sup-ply and use balancing for environmental issues in some detail: Integrated Environmental and Economic Account-ing (SEEA) (UN Studies in Methods Series F, No. 1, New York, 1993). The SEEA covers many aspects ofenvironmental accounting, including the development of accounts for specific environmental assets inphysical terms as well as attaching monetary values to these assets. Of particular interest in the presentcontext, is the elaboration of a supply and use table, which specifically identifies environmental protec-tion goods and services.
The first step is to create separate supply and demand tables as shown in Figure 1. Here, we dis-tinguish four types of environmental products; those which are ancillary; those which consist of equip-ment, technology and specific materials; services; and construction and installation. All other productsare grouped together as non-environmental products. For ancillary activities (in italics) the entries in thetwo tables are theoretically identical. For the other items, it is first necessary to enter the allocationsobtained from the separate supply and demand sources and then to decide how to reconcile the num-bers such that the row totals for each table correspond, element by element. The demand-side infor-mation described above will provide guidance on government and household demand as well as oncapital formation and exports. In reconciling the figures, expert judgement will be needed to adjust theoriginal data based on information about the relative reliability of the various elements. The compila-tion of such a table resembles a police enquiry in that information from disparate sources is calledupon to verify (or amend) the initial information. However, the end product should be robust and ableto stand up to external, possibly sceptical, enquiry.
By integrating supply-side information with expenditure/demand for environmental goods and ser-vices, it is possible to obtain a general and aggregate picture of the environment industry, although it maybe rather weak on detail and require further detailed investigations.
The integrated demand/supply approach can be developed at a deeper level of detail by using dataon environmental protection expenditure and integrating the data available on the supply side togetherwith engineering data and case studies for both supply and demand (see also Pasurka and Steurer, 1995).The results obtained through the use of engineering modelling data are more complete and balanced,but require more time and work. The strength of this approach derives from the use of Input-Outputtables and techniques. It allows data gaps on the supply side to be filled to a considerable extent. Over-all, this approach can provide a complete picture of the industry including the impact of cleaner technol-ogies and the importance of the secondary activities of enterprises.
Some guidance on alternative data sources which may be used is given below.
4. Other methods
When such economic data are not available information on turnover can be estimated by combin-ing physical output data (e.g. tonnes of waste or m3 of wastewater) with average price ratios. Thisapproach can be applied only for the provision of services category and to some extent to equipment(e.g. based on data on newly installed treatment capacities) and the results will generally be veryapproximate.
Other information sources can be used to improve the quality of data on the environment industry.For instance, in the case of R&D, information can be obtained by using data on research outputs –
OECD 1999

Pra
ctical A
pp
roa
che
s an
d M
eth
od
s for D
ata
Co
llectio
n a
nd
An
alysis o
f the
En
viron
me
nt In
du
stry
OE
CD
Figure 1. Supply and demand framework
vities Imports Total supply
Final demand
l formation Households Exports Total demand
29
1999
Supply of environmental and other products
Environmental producers
Other actiPollution management
groupCleaner technologiesand products group
Resource management group
Environmental products– Ancillary– Equipment and specific materials– Services– Construction and installation
Non-environmental products
Demand for environmental and other products
Intermediate consumption
Pollution management
group
Cleaner technologies and products group
Resource management
groupOther activities Government Capita
Environmental products– Ancillary– Equipment and specific materials– Services– Construction and installation
Non-environmental products

30
The Environmental Goods and Services Industry: Manual for Data Collection and Analysis
e.g. based on scientific citation indexes or on patent registers. Information on state aid for industry promo-tion and exports and mergers and acquisitions will have to be extracted or estimated from a variety of othersurveys or databases (see Chapter III).
In the preceding sections, brief mention was made of obtaining information on the environmentalgoods and services industry by extraction and manipulation of data from existing statistical collections orby adding specific questions to existing data collection exercises. Some countries have obtained infor-mation about specific environmental services by including additional questions in other data surveys.For example, a survey on the legal services industry could ask respondents to split income by source andto include environmental law as a separate category. This kind of approach is reasonable for a quick, low-cost investigation of part of the environment industry, but it does not provide a comprehensive view ofthe whole industry within a common framework and common reference period.
Other possible sources of statistical information are organisations that routinely collect environmen-tal information as part of their usual activities. For example, environment protection agencies usually col-lect data as part of their monitoring and regulation programmes. Government organisations responsiblefor employment and training policy may obtain data from businesses through various environmental-employment-generation programmes. Further information may be obtained from databases on researchand from development projects for waste management and pollution control.
Trade associations regularly issue information on parts of the industry, and some associations regu-larly publish data on their members. Often, such data are highly detailed on physical parameters (e.g. m3
of treated wastewater, number of waste collection trucks, etc.), although in some cases economic data arealso available (number of suppliers, turnover, employment). However, trade association data are usuallynarrowly class-specific.
Estimates for value added and R&D can be derived by applying ratios to turnover figures. Such ratioscan be derived by using general enterprise surveys for manufacturing services, and construction activi-ties, but the results obtained will be approximate.
OECD 1999

31
Chapter V
REMAINING ISSUES: PROGRESS AND APPROACHES
The approaches and methods proposed in this manual can provide comprehensive information on theenvironmental goods and services industry. But they leave a number of outstanding unresolved issues:
– dual-use and multi-purpose products;
– cleaner technologies and products;
– international trade.
1. Dual-use and multi-purpose products
Dual-use and multi-purpose products are those products that can also be used for non-environmentalpurposes (e.g. filters, pumps, and pipes). These products have been estimated to account for a consider-able share of sales of environmental equipment and goods.
In principle, a reliable answer to the problem of multi-purpose products can be obtained by survey-ing the final user. Environmental suppliers and investors are not always able to assess that part of thesales of the product that is for environmental protection.
In order to gain a more accurate picture of dual-use and multi-purpose products, some studies havetried to match the results from supply- and demand-side approaches. The use of an Input-Output frame-work makes it possible to evaluate the total environmental goods and services industry, while avoidingdouble counting and mis-measurement (Pasurka and Steurer, 1995).
2. Cleaner technologies and products
Clear definition, identification and easy measurement of integrated or cleaner technologies andproducts have proved difficult despite their importance, for example, for sustainable development.Cleaner technologies and products are determined with reference to “standard” technologies andproducts. In a dynamic perspective, the cleaner technologies and products of today will become the“standard” technologies and products of tomorrow. Following this approach requires very detailedinformation. Moreover, the question of the proportion of, for example, turnover in cleaner technologiesand products that should be attributed to the environmental protection industry (e.g. cleaner cars)remains open.
However, the slowdown in the growth of the classical end-of-pipe equipment industry and the inter-est in a more integrated regulatory approach to environmental protection suggest the increasing impor-tance of cleaner technologies and products.
The OECD/Eurostat Informal Working Group on the Environment Industry has identified a numberof methods which can be used to account for cleaner technologies and products. It is important toconsider that, although these approaches are relatively comprehensive and consistent with the aim ofdefining and assessing cleaner technologies and products, they are either limited or still at an experi-mental stage.
1. Measurement of R&D, innovation and engineering efforts to improve environmental performance oftechnologies, processes and products. This would focus on measuring R&D and related innova-tion and engineering costs. R&D, innovation and engineering costs are not always possible to
OECD 1999

32
The Environmental Goods and Services Industry: Manual for Data Collection and Analysis
obtain, particularly in the business sector. Nevertheless, some R&D surveys do already capturethese values, and respondents indicate – in budgetary or full-time equivalent employmentterms – specific environmental research, innovation or engineering efforts.
2. Measurement of efforts to improve environmental performance by measuring the incrementalcost of cleaner technologies and products. This is the SERIEE approach, which considers“cleaner” technologies and products, that, from an expenditure point of view, are more costly thanthe equivalent less-clean alternative products. Only the extra costs are considered as environ-mental protection expenditure. This requires comparing the price of the clean product with thatof the superseded item. However, from a supply-side perspective, technologies which are lesspolluting could also be less costly.
3. Creation of a list of cleaner technologies and products. This approach consists of creating a comprehensivelist of dedicated cleaner technologies, processes and products. For example, the Dutch Ministryof Finance has developed a list of cleaner technologies which is up-dated each year, to imple-ment a tax-incentive system for cleaner production investment. This could be complementedwith an Eco-label approach based on labelling procedures, once these are complete and effective.However, the eco-label approach is currently impracticable for many reasons (e.g. slow productidentification, difficulties in defining unambiguous criteria and methodologies for the labellingprocedure, under-representation of SME products). Similarly, “leading market edges” could be mea-sured. This approach attempts to measure for each product group that part which is consideredas the “leading green edge” of the market, based on current standards. For example, in the fieldof construction, the market share of low-energy houses could be estimated.
4. Physical assessment. This approach consists of measuring and evaluating reductions in pollutantemissions and waste generation due to cleaner technologies, and placing an economic value onthese reductions (e.g. savings in disposal costs).
3. International trade
International trade in environmental products is not easy to measure. The OECD/Eurostat InformalWorking Group studied various approaches. These approaches are limited and do not allow a compre-hensive picture of trade in environmental products.
Specific supply-side surveys provide the best and most comprehensive information on exports ofgoods and services, but available data are limited in accuracy and detail. For example, information is pro-vided as a share of total environmental turnover, with a very limited breakdown by main destination.
The analysis of trade codes based on standard foreign trade statistics provides useful indicators ofthe direction and change in magnitude of imports and exports by country of origin and destination (seeAnnex 2, includes some multi-purpose products). However, this approach suffers from various limitations.First, flows of services are not covered. Second, goods trade flows may be underestimated because onlya few traded goods codes can be separately identified as solely for environmental purposes. Data forAustria and Germany suggest that the analysis of environmentally dedicated trade codes underestimatestotal environmental goods trade by a factor of five.
The two approaches taken together will provide useful information. However, information is stillmissing on some variables, such as trade in cleaner technologies and products, and multi-purpose prod-ucts, as well as information on other important aspects of globalisation such as foreign direct investment,international payments for patents and other intellectual property rights for the use of environmentalequipment, etc.
Further research on each of these issues is required.
OECD 1999

33
Annex 1
EXPLANATORY NOTES ON THE CLASSIFICATIONOF THE ENVIRONMENTAL GOODS AND SERVICES INDUSTRY
A. The “POLLUTION MANAGEMENT” group
Environmental equipment and specific materials
Air pollution control
This class includes any activity that produces equipment or specific materials for the treatment and/or removalof exhaust gases and particulate matter from both stationary and mobile sources. It includes air-handling equipment,dust collectors, precipitators, filters, catalytic converters, chemical treatment and recovery systems, specialisedstacks, incinerators, scrubbers, odour control equipment, environmentally less-damaging specialised fuels.
Wastewater management
This class includes any activity that produces equipment or specific materials for the collection, treatment andtransport of wastewater and cooling water. It includes pipes, pumps, valves, aeration equipment, gravity sedimenta-tion equipment, chemical treatment and recovery equipment, biological recovery systems, oil/water separation sys-tems, screens/strainers, sewage treatment equipment, wastewater reuse equipment, water purification equipmentand other water handling systems.
Solid waste management
This class includes any activity that produces equipment or specific materials for the collection, treatment, trans-port, disposal and recovery of hazardous and non-hazardous solid waste. It includes waste storage and treatmentequipment (thermal, biological, chemical), waste collection equipment, waste disposal equipment, waste handlingequipment, waste separation and sorting equipment, recovery equipment, recycling equipment. It also includesequipment for outdoor sweeping and watering of streets, paths, parking lots, etc. It includes equipment, technologyor specific materials for the treatment of low-level nuclear waste. It excludes materials for the treatment of high-levelnuclear waste. Recycling activities exclude production of equipment or specific materials for the manufacture or pro-duction of new materials or products from waste or scrap and subsequent use of these materials or products.
Remediation and clean-up of soil, surface water and groundwater
This class includes any activity that produces equipment or specific materials to reduce the quantity of pollutingmaterials in soil and water, including surface water, groundwater and seawater. It includes absorbents, chemicals andbioremediators for cleaning up, as well as cleaning-up systems either in situ or in appropriate installations.
Noise and vibration abatement
This class includes any activity that produces equipment or specific materials to reduce or eliminate the emis-sion and propagation of noise and vibration, both at source and dispersed. It includes mufflers/silencers, noise dead-ening material, noise control equipment and systems vibration control equipment and systems.
Environmental monitoring, analysis and assessment
This class includes any activity that produces equipment or specific materials for the sampling, measurement,and subsequent recording, analysis and assessment of various characteristics of environmental media. It includesmeasuring and monitoring equipment, sampling systems, data acquisition equipment, other instruments ormachines for measurement. Environmental information systems, analytical software, specific safety and personalprotection for environmental purposes are included.
OECD 1999

34
The Environmental Goods and Services Industry: Manual for Data Collection and Analysis
Other
This class includes any activity that produces equipment or specific materials to measure, prevent, limit orcorrect environmental damage to air, water and soil, as well as problems related to waste, noise and eco-systems,not included in any other class. These activities should be separately specified and listed.
Environmental services
Air pollution control
This class includes any activity that designs, manages systems or provides other services for the treatment and/or removal of exhaust gases and particulate matter from both stationary and mobile sources.
Wastewater management
This class includes any activity that designs, operates systems or provides other services for the collection, treat-ment and transport of wastewater and cooling water. It includes design, management or other services for sewagetreatment systems, wastewater reuse systems, and water handling systems.
Solid waste management
This class includes any activity that designs, operates systems or provides other services for the collection, treat-ment, management, transport, storage and recovery of hazardous and non-hazardous solid waste. It includes design,management or other services for waste handling (collection, transport, separation, sorting and disposal), operationof sites, recycling (including collection of waste and scrap), operation of recycling plants. It includes services for out-door sweeping and watering of streets, paths, parking lots, etc. Services for the treatment of low-level nuclear wasteare included. It excludes services for the treatment of high-level nuclear waste. It excludes services for the manufac-ture of new materials or products from waste or scrap and the subsequent use of these materials or products.
Remediation and clean-up of soil, surface water and groundwater
This class includes any activity that designs, manages systems or provides other services to reduce the quantityof polluting materials in soil and water, including surface water, groundwater and seawater. It includes cleaning-upsystems either in situ or in appropriate installations, emergency response and spills clean-up systems. Treatment ofwater and dredging residues are included.
Noise and vibration abatement
This class includes any activity that designs, manages systems or provides other services to reduce or eliminatethe emission of noise and vibration, both at source and dispersed. It includes design, management or other servicesfor acoustic and soundproof screens and street covering.
Environmental R&D
This class includes any systematic and creative activity concerned with the generation, advancement, dissemi-nation and application of scientific and technological knowledge to reduce or eliminate emissions in all environmen-tal media and to improve environmental quality. It includes non-technological research to improve knowledge onecosystems and the impact of human activities on the environment.
Environmental contracting and engineering
This class includes any activity that investigates feasibility, designs and manages environmental projects notincluded elsewhere. It includes multidisciplinary environmental contracting and engineering. Environmental man-agement consulting, other environmental consulting services and environmental audit services are included.
Analytical services, data collection, analysis and assessment
This class includes any activity that designs, manages systems or provides other services to sample, measureand record various characteristics of environmental media. It includes monitoring sites, operating both singly and innetworks, and covering one or more environmental medium. Health, safety, toxicology studies and analytical labora-tory services are included. Weather stations are excluded.
OECD 1999

Annex 1
35
Education, training, information
This class includes any activity that provides environmental education or training or disseminates environmentalinformation and which is executed by specialised institutions or other specialised suppliers. It includes education,training and information management for the general public, and specific environmental workplace education andtraining. The activities of the general educational system are excluded.
Other
This class includes any activity that provides services to measure, prevent, limit or correct environmental dam-age to air, water and soil, as well as problems related to waste, noise and eco-systems, not included in any other class(e.g. general public administration, if it provides specific environmental services not elsewhere classified). Theseactivities should be separately specified and listed.
Construction and installation
This class includes any activity for the construction and installation of facilities for: air pollution control; waste-water management; solid waste management; remediation and clean-up of soil, surface water and groundwater; noiseand vibration abatement; environmental monitoring, analysis and assessment; other environmental facilities.
B. The “CLEANER TECHNOLOGIES AND PRODUCTS” group
This group includes any activity which continuously improves, reduces or eliminates the environmental impactof technologies, processes or products.
Cleaner/resource-efficient technologies and processes
Cleaner and resource-efficient technologies which decrease material inputs, reduce energy consumption,recover valuable by-products, reduce emissions, minimise waste disposal problems, or some combination of these.
Cleaner/resource-efficient products
Cleaner or resource-efficient products which decrease material inputs, improve product quality, reduce energyconsumption, minimise waste disposal problems, reduce emission during use, or some combination of these.
C. The “RESOURCE MANAGEMENT” group
Note: In the case of the “Resource management” group, activities aimed at the production of environmental goods and services and relatedconstruction are grouped together for convenience. However, it is suggested that, wherever possible, information on these items be separatelycollected and presented under separate headings for equipment, services and construction.
Indoor air pollution control
This class includes any activity that produces equipment, technology or specific materials, designs, constructsor installs, manages or provides other services for the treatment and renewal of indoor air to remove pollutants. Itexcludes air-conditioning.
Water supply
This class includes any activity that produces equipment, technology or specific materials, designs, constructsor installs, manages or provides other services for water supply and delivery systems, both publicly and privatelyowned. It includes activities aiming to collect, purify and distribute potable water to household, industrial, commer-cial or other users.
Recycled materials
This class includes any activity that produces equipment, technology or specific materials, designs, constructsor installs, manages or provides other services for manufacturing new materials or products, separately identified asrecycled, from waste or scrap.
Renewable energy plant
This class includes any activity that produces equipment, technology or specific materials, designs, constructsor installs, manages or provides other services for the generation, collection or transmission of energy from renew-able sources, including solar, wind, tidal, geothermal or biomass sources.
OECD 1999

36
The Environmental Goods and Services Industry: Manual for Data Collection and Analysis
Heat/energy saving and management
This class includes any activity that produces equipment, technology or specific materials, designs, constructsor installs, manages or provides other services to reduce heat and energy use or minimise heat and energy loss(e.g. co-generation). It includes equipment, technology or specific materials to reduce climate change.
Sustainable agriculture and fisheries
This class includes any activity that produces equipment, technology or specific materials, designs, constructsor installs, manages or provides other services for systems which reduce the negative environmental impact of agri-culture and fishery activities. It includes biotechnology applied to agriculture and fishery activities.
Sustainable forestry
This class includes any activity that produces equipment, technology or specific materials, designs, constructsor installs, manages or provides other services for programmes and projects for reforestation and forest managementon a long-term sustainable basis.
Natural risk management
This class includes any activity that produces equipment, technology, or specific materials, designs, constructsor installs, manages or provides other services for systems to prevent or reduce the impact of natural disasters(storms, floods, volcanic eruptions, etc.).
Eco-tourism
This class includes any activity that designs, constructs, installs, manages or provides other services for tourismthat involves protection and management of natural and cultural heritage, or education and interpretation of the nat-ural environment, and that does not damage or degrade the natural environment.
Other
This class includes any activity that measures, prevents, limits or corrects environmental damage to air, waterand soil, as well as problems related to waste, noise and eco-systems, which is not included in any other class(e.g. nature conservation, habitats and biodiversity). These activities should be separately specified and listed.
OECD 1999

37
NOTE: THE FOLLOWING ANNEXES 2-7 SHOULD NOT BE CONSIDEREDAS RECOMMENDATIONS, BUT AS ILLUSTRATIVE EXAMPLES ONLY
OECD 1999

Annex 2
39
Annex 2
ENVIRONMENTAL GOODS: ILLUSTRATIVE CATEGORIESWITH HARMONIZED COMMODITY DESCRIPTIONAND CODING SYSTEM (HS) COMMODITY CODES
Note: The list is not exhaustive; not all environmental goods are covered. Some environmental goods have noequivalent HS commodity code. Some HS commodity codes include goods which may not be environmentalgoods.
A. POLLUTION MANAGEMENT group
1. Air pollution control HS code
1.1 Air-handling equipmentVacuum pumps 841410Compressors of a kind used in refrigerating equipment 841430Air compressors mounted on a wheeled chassis for towing 841440Other air or gas compressors or hoods 841480Parts for air or gas compressors, fans or hoods 841490
1.2 Catalytic convertersFiltering or purifying machinery and apparatus for gases 842139Parts for filtering or purifying machinery 842199
1.3 Chemical recovery systemsLimestone flux 252100Slaked (hydrated) lime 252220Magnesium hydroxide and peroxide 281610Activated earthsFiltering or purifying machinery and apparatus for gases* 842139Parts for filtering or purifying machinery* 842199
1.4 Dust collectors Filtering or purifying machinery and apparatus for gases* 842139Parts for filtering or purifying machinery* 842199
1.5 Separators, precipitatorsOther glass fibre products 701990Machinery for liquefying air or other gases 841960Other machinery. for treatment of materials by change of temperature 841989Filtering or purifying machinery and apparatus for gases* 842139Parts for filtering or purifying machinery* 842199
1.6 Incinerators, scrubbersOther furnaces, ovens, incinerators, non-electric 841780Filtering or purifying machinery and apparatus for gases* 842139Parts for filtering or purifying machinery* 842199Industrial or laboratory electric resistance furnaces 851410Industrial or laboratory induction or dielectric furnaces 851420Other industrial or laboratory electric furnaces and ovens 851430Parts, industrial or laboratory electric furnaces 851490
1.7 Odour control equipmentParts for sprayers for powders or liquids 842490
OECD 1999

40
The Environmental Goods and Services Industry: Manual for Data Collection and Analysis
2. Wastewater management HS code
2.1 Aeration systemsCompressors of a kind used in refrigerating equipment * 841430Air compressors mounted on a wheeled chassis for towing * 841440Other air or gas compressors or hoods* 841480Parts for air or gas compressors, fans or hoods* 841490
2.2 Chemical recovery systemsLimestone flux* 252100Slaked (hydrated) lime* 252220Chlorine 280110Anhydrous ammonia 281410Sodium hydroxide solid 281511Sodium hydroxide in aqueous solution 281512Magnesium hydroxide and peroxide* 281610Activated earths*Aluminium hydroxide 281830Manganese dioxide 282010Manganese oxides (other) 282090Lead monoxide 282410Sodium sulphites 283210Other sulphites 283220Phosphinates or phosphonates 283510Phosphates of triammonium 283521Phosphates of mono or disodium 283522Phosphates of trisodium 283523Phosphates of potassium 283524Calcium hydrogenorthophosphate 283525Other phosphates of calcium 283526Other phosphates (excl. polyphosphates) 283529Activated carbon 380210Water filtering or purifying machinery and apparatus 842121Other machinery for purifying liquids 842129Parts for filtering or purifying machinery* 842199
2.3 Biological recovery systems
2.4 Gravity sedimentation systems Flocculating agents
2.5 Oil/water separation systemsOther centrifuges 842119Parts of centrifuges 842191Water filtering or purifying machinery and apparatus* 842121Other machinery for purifying liquids* 842129Parts for filtering or purifying machinery* 842199
2.6 Screens, strainersOther articles of plastic 392690Water filtering or purifying machinery and apparatus* 842121Other machinery for purifying liquids* 842129Parts for filtering or purifying machinery* 842199
2.7 Sewage treatmentFlocculating agentsWoven pile and chenille fabrics of other textile materials 580190Tanks, vats, etc. > 300 l 730900Tanks, drums, etc. > 50 l < 300 l 731010Cans < 50 l, closed by soldering or crimping 731021Other cans < 50 l 731029Hydraulic turbines 841000
841011841012841013
Parts for hydraulic turbines 841090Other furnaces, ovens, incinerators, non-electric* 841780Weighing machines capacity < 30 kg 842381
A. POLLUTION MANAGEMENT group (cont.)
OECD 1999

Annex 2
41
Weighing machines capacity > 30 kg < 5 000 kg 842382Other weighing machines 842389Parts for sprayers for powders or liquids* 842490Industrial or laboratory electric resistance furnaces* 851410Industrial or laboratory induction or dielectric furnaces* 851420Other industrial or laboratory electric furnaces and ovens* 851430Parts, industrial or laboratory electric furnaces* 851490
2.8 Water pollution control, wastewater reuse equipment
2.9 Water handling goods and equipmentCast articles of cast iron 732510Root control equipmentPositive displacement pumps, hand operated 841320Other reciprocating positive displacement pumps 841350Other rotary positive displacement pumps 841360Other centrifugal pumps 841370Other pumps 841381Valves, pressure reducing 848110Valves, check 848130Valves, safety 848140Other taps, cocks, valves, etc. 848180Instruments for measuring the flow or level of liquids 902610Instruments for measuring or checking pressure 902620
3. Solid waste management HS code
3.1 Hazardous waste storage and treatment equipmentOther articles of cement, concrete 681099Other articles of lead 780600Other electric space heating and soil heating apparatus 851629Lasers 901320Vitrification equipment
3.2 Waste collection equipmentHousehold or toilet articles of plastic 392490Brooms, hand 960310Brushes as parts of machines, appliances 960350Mechanical floor sweepers 960390Trash bin liners (plastic)
3.3 Waste disposal equipment CompactorsRefuse disposal vehiclesPolypropylene sheeting, etc. 392020
3.4 Waste handling equipment
3.5 Waste separation equipmentMagnetic separators
3.6 Recycling equipmentMagnetic separators*Machinery to clean, dry bottles, etc. 842220Other mixing or kneading machines for earth, stone, sand, etc. 847439Other machines for mixing/grinding, etc. 847982Other machines, nes, having individual functions 847989Tire-shredding machinery
3.7 Incineration equipment Other furnaces, ovens, incinerators, non-electric* 841780Parts of furnaces, non-electric 841790Industrial or laboratory electric resistance furnaces* 851410Industrial or laboratory induction or dielectric furnaces* 851420Other industrial or laboratory electric furnaces and ovens* 851430Parts, industrial or laboratory electric furnaces* 851490
A. POLLUTION MANAGEMENT group (cont.)
OECD 1999

42
The Environmental Goods and Services Industry: Manual for Data Collection and Analysis
4. Remediation and clean-up of soil and water HS code
4.1 Absorbents
4.2 Cleaning-upOther electric space heating and soil heating apparatus* 851629Lasers* 901320Vitrification equipment*
4.3 Water treatment equipment Surface active chemicals (not finished detergents)Oil spillage clean-up equipmentOther electrical machines and apparatus with one function 854389
5. Noise and vibration abatement HS code
5.1 Mufflers, silencersParts for spark-ignition internal combustion piston engines 840991Parts for diesel or semi-diesel engines 840999Silencers and exhaust pipes, motor vehicles 870892
5.2 Noise deadening material
5.3 Vibration control systems
5.4 Highway barriers
6. Environmental monitoring, analysis and assessment HS code
6.1 Measuring and monitoring equipmentThermometers, pyrometers, liquid filled 902511Other thermometers, pyrometers 902519Hydrometers, barometers, hygrometers, etc. 902580Other instruments for measuring liquids or gases 902680Parts of instruments for measuring, checking liquids or gases 902690Instruments for analysing gas or smoke 902710Chromatographs, etc. 902720Spectrometers, etc. 902730Exposure meters 902740Other instruments using optical radiation 902750Other instruments for physical or chemical analysis 902780Parts for instruments, incl. microtomes 902790Ionising radiation measuring or detecting instruments 903010Other optical instruments 903149Other measuring or checking instruments 903180Manostats 903220Hydraulic/pneumatic automatic regulating, controlling instruments 903281Other automatic regulating, controlling instruments 903289Auto emissions testersNoise measuring equipment
6.2 Sampling systems
6.3 Process and control equipmentThermostats 903210Electrical process control equipmentOn board monitoring/control
6.4 Data acquisition equipment
6.5 Other instruments, machines
B. CLEANER TECHNOLOGIES AND PRODUCTS group
1. Cleaner/resource-efficient technologies and processes HS code
Electrochemical apparatus/plantExtended cooking (pulp)Oxygen delignificationUltrasonic cleaningFluidised bed combustion
A. POLLUTION MANAGEMENT group (cont.)
OECD 1999

Annex 2
43
2. Cleaner/resource-efficient products HS code
CFC substitutesHydrogen peroxidePeat replacements (e.g. bark) 284700Water-based adhesivesPaints and varnishes, in aqueous medium, acrylic or vinyl 320910Other paints and varnishes, in aqueous medium 320990Double hulled oil tankersLow-noise compressors
C. RESOURCE MANAGEMENT group
1. Indoor air pollution control HS code
2. Water supply HS code
2.1 Potable water treatment
2.2 Water purification systemsChlorine* 280110
2.3 Potable water supply and distribution Waters, including natural or artificial mineral water 220100Distilled and conductivity water 285100Ion exchangers (polymer) 391400
3. Recycled materials HS code
3.1 Recycled paper
3.2 Other recycled products
4. Renewable energy plant HS code
4.1 SolarInstantaneous gas water heaters 841911Other instantaneous or storage water heaters, non-electric 841919Photosensitive semiconductor devices, including solar cells 854140
4.2 WindWindmillsWind turbines
4.3 Tidal
4.4 Geothermal
4.5 OtherMethanol 290511Ethanol 220700Hydroelectric plant
5. Heat/energy saving and management HS code
Catalysts 381500Multiple walled insulating units of glass 700800Other glass fibre products* 701990Heat exchange units 841950Parts for heat exchange equipment 841990Heat pumpsDistrict heating plantWaste heat boilersBurners, fuel other than oil or gasFluorescent lamps, hot cathode 853931Electric carsFuel cellsGas supply, production and calibrating meters 902810Liquid supply, production and calibrating meters 902820Thermostats* 903210
B. CLEANER TECHNOLOGIES AND PRODUCTS group (cont.)
OECD 1999

44
The Environmental Goods and Services Industry: Manual for Data Collection and Analysis
6. Sustainable agriculture and fisheries HS code
7. Sustainable forestry HS code
8. Natural risk management HS code
Satellite imagingSeismic instruments
9. Eco-tourism HS code
10. Other HS code
* Indicates that the HS code appears previously in a different sub-class.Source: OECD, drawing on detailed breakdown presented in Annex 7. HS commodity codes are drawn from World Customs Organization (1996),
Harmonized Commodity Description and Coding System, Explanatory notes, Second edition, Brussels. See also presentation and discussion inOECD (1999), COM/TD/ENV(98)37/FINAL.
C. RESOURCE MANAGEMENT group (cont.)
OECD 1999

Annex 3
45
OECD 1999
Annex 3
ENVIRONMENTAL ACTIVITIES IN THE NORTH AMERICAN INDUSTRYCLASSIFICATION SYSTEM (NAICS)
The North American Industry Classification System (NAICS) provides common industry definitions for Canada,Mexico and the United States. It was jointly developed by the US Economic Classification Policy Committee, Sta-tistics Canada, and Mexico’s Instituto Nacional de Estadística, Geografía e Informática to better compare economic andfinancial statistics and ensure that such statistics keep pace with the changing economy. The NAICS replaces thethree countries’ separate systems with a uniform classification system. Within this classification it is possible toidentify some classes which are clearly related to the environment industry, and some new environment classeshave been added.
22. Utilities
22.13 Water, sewage and other systems
22.13.1 Water supply and irrigation systems
22.13.2 Sewage treatment facilities
22.13.3 Steam and air-conditioning supply
23. Construction
23.49 Other heavy construction
23.49.1 Water, sewer, and pipeline construction
31-33. Manufacturing
33.34 Ventilation, heating, air-conditioning, and commercial refrigeration equipment manufacturing
33.34.1 Ventilation, heating, air-conditioning, and commercial refrigeration equipment manufacturing
33.34.11 Air purification equipment manufacturing
54. Professional, scientific, and technical services
54.16 Management, scientific, and technical consulting services
54.16.2 Environmental consulting services (new)
56. Administrative and support and waste management and remediation services (new)
56.2 Waste management and remediation services
56.21 Waste collection
56.22 Waste treatment and disposal
56.29 Remediation and other waste management services
71. Arts, entertainment, and recreation
71.2 Museums, historical sites, and similar institutions
71.21.9 Nature parks and other similar institutions
81. Other services (except public administration)
81.33 Social advocacy organisations
81.33.12 Environment, conservation and wildlife organisations (new)
92. Public administration
92.4 Administration of environmental quality programmes
Source: 1997 U.S. NAICS Codes and Titles, July 1998, at http://www.census.gov/epcd/nalcs/naicscod.txt.

The Environmental Goods and Services Industry: Manual for Data Collection and Analysis
46
Annex 4
NACE REV. 1 CODES RELATED TO THE ENVIRONMENT INDUSTRY:THE NETHERLANDS
In implementing NACE Rev. 1 at national level, Statistics Netherlands encountered a number of definitionalproblems relating to NACE Rev. 1 headings 37, 51.57 and 90, as well as to other NACE activities. The following list wasdeveloped to clarify and explain the classification of the most important activities carried out by specialisedenvironmental producers.
14. Other mining and quarrying
14.50 Other mining and quarrying n.e.c. This class includes treatment of melting slag for reuse (forexample in the form of granulates) regardless of its finaldestination. The heading 37.20 includes this activity as input forsandblasting and construction works.
15. Manufacture of food products and beverages
15.7 Manufacture of prepared animal feeds Headings 15.71 and 15.72 also include treatment of slaughterwaste to produce animal feeds.
17. Manufacture of textiles
17.11 Preparation and spinning of cotton-type fibres In this class manufacturing of polishing cloths or cleaning ragsfrom textile waste is also included.
21. Manufacture of paper and paper products
21.11 Manufacture of pulp This class includes activities related to manufacture of pulp fromwaste paper and shredding of waste paper.
23. Manufacture of coke, refined petroleum products and nuclear fuel
23.20 Manufacture of refined petroleum products
23.20.2 Manufacture of oil-based lubricating oils or greases including from waste or used oil.
If manufacturing of oils or greases from waste oil is carried out incombination with collection of waste oil, these will be classifiedunder this item. If enterprises only collect used oil, these will beclassified in 90.00.2.
24. Manufacture of chemicals and chemical products
24.16 Manufacture of plastics in primary forms This class does not include any recycling activities. Reclaiming,processing of plastic waste (cleaning, melting, grinding) is inprinciple classified within the heading 37.20, while puremanufacturing of plastic products is 25.24. When enterprises carryout both activities, it is suggested to follow the remarksdeveloped for heading 37.20.
24.64 Manufacture of photographic chemical material Processing of waste from photographic industry such as fixersolution or photographic film and paper containing silver isclassified under 37.20.
25. Manufacture of rubber and plastic products
25.12 Recovering, retreading and rebuilding of rubber tyres
Enterprises only reclaiming rubber are classified as part of 37.20.
OECD 1999

Annex 4
47
25.24 Manufacture of other plastic products This class also includes enterprises engaged in the production ofnew plastic products from plastic waste (e.g. bottles, pickets orflowerpots). If this activity is carried out in combination with arecuperation process such as cleaning, melting, grinding resultingin granulates, it will be included in 37.20.
27. Manufacture of basic metals
27.4 Manufacture of basic precious and non-ferrous metals
New recycling techniques have been specifically developed toreuse non-ferrous metals from waste; for example reclaimingcobalt from spent industrial catalysts or reclaiming preciousmetals by means of electrolytic refining. It is suggested that theseactivities be classified under 37.10.
35. Manufacture of other transport equipment
35.11 Building and repairing of ships and boats Includes ship dismantling.
37. Recycling
37.10 (Preparation prior to) Recycling of metal waste and scrap
This class includes processing of metal waste and scrap intosecondary raw material fit for further processing. Typically wasteand scrap, either sorted or unsorted, needs to be processedbefore being used as an intermediate good in another industrialprocess. Mechanical or chemical processes usually used are:– Shredding of metal waste, end of life vehicles, etc.– Reclaiming metals from cables by grinding.– Reclaiming non-ferrous metals from metal waste by means of a
process other than electrolysis.
This class does not include:
– Manufacture of new metals or new metal products fromsecondary metal raw materials (these activities classified under27 or 28).
– Recycling of non-ferrous metals from metal waste by means ofelectrolysis (classified under 27.4).
– Reclaiming non-ferrous metals from waste other than metalwaste such as photographic or hazardous waste (classifiedunder 37.20).
– Wholesale in waste and scrap including mechanical treatmentwhich does not lead to secondary raw materials, such as cutting,pressing or other methods to reduce the volume (classifiedunder 51.57.2).
– Dismantling, demolition of machinery, computers, etc.(included in 51.57.2).
– Car dismantling sites including wholesale trade in second-handspare parts (included in 51.57.1).
– Pre-recycling of non-metallic waste and waste materials(included in 37.20).
37.20 (Preparation prior to) Recycling of non-metal waste and scrap
– This class includes processing of non-metallic waste and scrapand of non-metal articles into secondary raw material fit forfurther processing. Waste and scrap, either sorted or unsorted,needs to be processed before being used as an intermediategood in another industrial process. Typical activities are:
– Processing (cleaning, melting, grinding) of plastic or rubberwaste to granulates. Only when these activities are carried outin combination with final good production, and the sales ofrecycled products represent more than 80% (for example,recycled plastic bottles or rubber tiles) are they to beclassified, in respectively, 25.24 or 25.13. This practical rule willhelp in the case of enterprises which “do” the whole recyclingchain (collection, processing, producing granulates andproducing end products). Despite the fact that a large part oftheir output consists of end products, their classificationremains NACE 37.
OECD 1999

48
The Environmental Goods and Services Industry: Manual for Data Collection and Analysis
– Treatment of slag and fly ashes resulting in granulates used forreplacement of gravel or in road constructions.
– Mechanical crushing and grinding of waste from theconstruction and demolition of buildings (including wood),asphalt.
– Processing of melting slag to blasting grit.– Processing of used cooking oils and fats to secondary raw
materials for pet foods or feeds for farm animals.– Crushing, cleaning and sorting of glass.– Shredding paper, also in combination with destruction of
archives.– If this activity is carried out in combination with collection,
storage and dealing (as is mostly the case), it is to be classifiedunder 51.57.3.
– Reclaiming materials (also metals) from hazardous waste.– Refining of and making fit for reuse chemical baths and liquids,
also when containing dissolved metals.– Reclaiming metals from photographic waste, for example, fixer
solution or photographic films and paper.
This class does not include:
– Treatment of slaughter waste to produce animal feed (includedin 15.7)
– Production of new products from secondary raw material suchas spinning of yarn from stock (included in 17.1), making pulpfrom waste paper (included in 21.11) or recovering/retreadingtyres (included in 25.12).
– Recycling of waste oil and grease (included in 23.20.2).– Wholesale in non-metallic waste and scrap including collecting,
sorting, packing, dealing, etc., without an industrial process(included in 51.57.3).
– Collection of household and industrial waste (included in90.00.2).
– Composting of waste (included in 90.00.3).– Treatment of manure (slurry) (included in 90.00.3).– Incineration, dumping, burying, etc., of waste (included in
90.00.3).
45. Construction
This class includes:
– Construction of sewer systems (45.21.3).– Clearing, de-blocking of sewers (45.33.1).– Demolition and wrecking of buildings and other structures
(45.11.1).
51. Wholesale trade and commission trade, except of motor vehicles and motorcycles
51.42 Wholesale of clothing and footwear This class includes (51.42.1) sorting of and dealing in used clothes.
51.57 Wholesale of waste and scrap It also includes dismantling of end-of-life vehicles (dismantling ofcars; wholesale of car wrecks; sale of parts from car wrecks toprivate persons and professional users).
This class does not include dismantling of cars by means of amechanical process such as shredding (included in 37.10).
51.57.2 Wholesale of metal waste and scrap This class includes:
– Wholesale (purchase and sale) of ferrous and non-ferrous metalwaste and scrap.
– Collection of ferrous and non-ferrous metal waste.– Treatment of ferrous and non-ferrous metal waste without a
mechanical or chemical process.– Demolition or dismantling of machinery, cranes, computers, etc.
OECD 1999
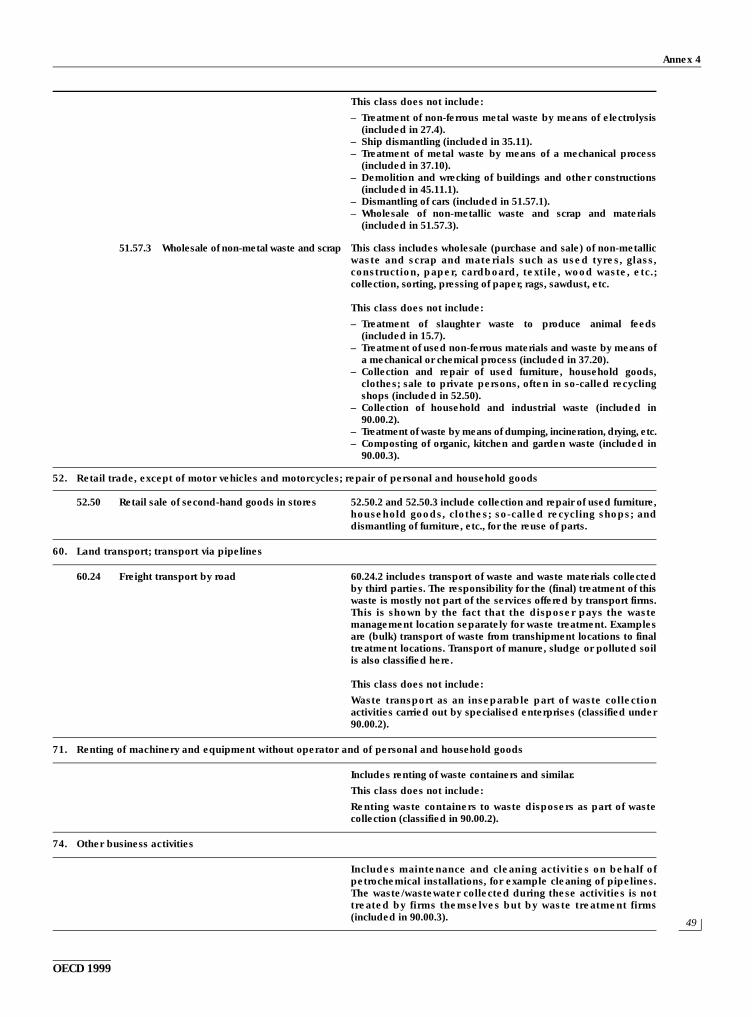
Annex 4
49
This class does not include:
– Treatment of non-ferrous metal waste by means of electrolysis(included in 27.4).
– Ship dismantling (included in 35.11).– Treatment of metal waste by means of a mechanical process
(included in 37.10).– Demolition and wrecking of buildings and other constructions
(included in 45.11.1).– Dismantling of cars (included in 51.57.1).– Wholesale of non-metallic waste and scrap and materials
(included in 51.57.3).
51.57.3 Wholesale of non-metal waste and scrap This class includes wholesale (purchase and sale) of non-metallicwaste and scrap and materials such as used tyres, glass,construction, paper, cardboard, textile, wood waste, etc.;collection, sorting, pressing of paper, rags, sawdust, etc.
This class does not include:
– Treatment of slaughter waste to produce animal feeds(included in 15.7).
– Treatment of used non-ferrous materials and waste by means ofa mechanical or chemical process (included in 37.20).
– Collection and repair of used furniture, household goods,clothes; sale to private persons, often in so-called recyclingshops (included in 52.50).
– Collection of household and industrial waste (included in90.00.2).
– Treatment of waste by means of dumping, incineration, drying, etc.– Composting of organic, kitchen and garden waste (included in
90.00.3).
52. Retail trade, except of motor vehicles and motorcycles; repair of personal and household goods
52.50 Retail sale of second-hand goods in stores 52.50.2 and 52.50.3 include collection and repair of used furniture,household goods, clothes; so-called recycling shops; anddismantling of furniture, etc., for the reuse of parts.
60. Land transport; transport via pipelines
60.24 Freight transport by road 60.24.2 includes transport of waste and waste materials collectedby third parties. The responsibility for the (final) treatment of thiswaste is mostly not part of the services offered by transport firms.This is shown by the fact that the disposer pays the wastemanagement location separately for waste treatment. Examplesare (bulk) transport of waste from transhipment locations to finaltreatment locations. Transport of manure, sludge or polluted soilis also classified here.
This class does not include:
Waste transport as an inseparable part of waste collectionactivities carried out by specialised enterprises (classified under90.00.2).
71. Renting of machinery and equipment without operator and of personal and household goods
Includes renting of waste containers and similar.
This class does not include:
Renting waste containers to waste disposers as part of wastecollection (classified in 90.00.2).
74. Other business activities
Includes maintenance and cleaning activities on behalf ofpetrochemical installations, for example cleaning of pipelines.The waste/wastewater collected during these activities is nottreated by firms themselves but by waste treatment firms(included in 90.00.3).
OECD 1999

50
The Environmental Goods and Services Industry: Manual for Data Collection and Analysis
90. Sewage and refuse disposal, sanitation and similar activities
90.00.1 Collection and treatment of wastewater This class includes:– Maintenance and cleaning of sewers.– Emptying of septic tanks and cesspools/cesspits.– Emptying of sewage sinks and pits.– Transport of wastewater to a sewage treatment plant or points
of discharge.– Treatment of wastewater by means of physical, chemical, and
biological processes.
This class does not include:
– Construction of sewer systems (included in 45.21.3).– Clearing, de-blocking of sewers (included in 45.33.1).– Treatment of polluted ground or surface water in combination
with cleaning-up of environmental pollution (included in90.00.4).
90.00.2 Collection of waste This class includes:
– Sweeping of streets, squares, paths, markets, public gardens,parks, etc.
– Collection of waste from households and enterprises by meansof refuse bins, wheeled bins, containers, etc.
This class also includes:
– Collection of hazardous waste, used batteries, used cookingoils and fats, etc.
– Collection of used oil from shipment or garages.– Collection of construction and demolition waste.– Exploitation of recycling centres.
This class does not include:
– Cleaning of ditches for the benefit of agriculture (included in01.41.2).
– Collection of waste as part of wholesale of waste (included in51.57).
– Transport of waste without collection or treatment (included in60.24.2).
– Industrial cleaning (included in 74.70).– Exploitation of landfill sites (included in 90.00.3).
90.00.3 Treatment of waste This class includes the treatment of waste by means of incineration,dumping, burying, separation, drying, neutralising, detoxification,anaerobic digestion and composting. Treatment of hospital waste,radio-active waste, used oil and grease; of polluted soil anddredged soil supplied by third parties; removal and treatment ofCFCs from refrigerators, PCBs from transformers; exploitation oflandfills are also included
This class does not include:
– Treatment of slaughter waste to produce animal feeds(included in 15.7).
– Treatment of metal waste without mechanical or chemicalprocess and for sale to third parties, such as dismantling of cars,machinery or computers (included in 51.57).
– Treatment of non-metallic waste without a mechanical orchemical process and for sale to third parties, such as sorting orpressing of paper, textiles, plastics, wood waste, etc. (includedin 51.57.3).
– Treatment of metal waste by a mechanical or chemical processinto secondary raw materials, for example shredders (includedin 37.10).
– Treatment of non-metallic waste by means of a mechanical orchemical process into secondary raw materials such as breakingor grinding of glass, used tyres, rubber into granulates(included in 37.20).
OECD 1999

Annex 4
51
90.00.4 Cleaning up of environmental pollution This class includes:
– Clean-up of polluted soil, including underwater soil.– Clean-up of polluted ground or surface water.– Removal of asbestos.– Removal of underground oil tanks.
This class does not include:
– Treatment of wastewater (included in 90.00.1).
Source: Dietz (1997).
OECD 1999

The Environmental Goods and Services Industry: Manual for Data Collection and Analysis
52
OECD 1999
Annex 5
DISTRIBUTION OF THE ENVIRONMENTAL GOODS AND SERVICES INDUSTRYBY STANDARD INDUSTRIAL ACTIVITY: FRANCE, 1991
Industrial activityNumber of enterprises
in the environment industry
Share of environment industry turnover in industry total
(percentage)
Water distribution and urban heating 46 14.5Manufacture of organic chemicals 21 4.0Ventilation, heating and refrigeration materials 78 10.5Industrial equipment, misc. 125 3.7Construction material, other mineral products 43 6.8Machinery for chemical, plastic and food manufacturing 53 9.1Manufacture of paints, varnishes and glues 28 9.2Metal, plastic and paper packaging 50 2.7Automobiles, locomotives, railway rolling stock 46 0.4Electrical/electronic equipment 29 2.1Plastic products, not including packaging 20 3.9Paperboard, not including packaging 25 1.7Manufacture of inorganic chemicals 14 2.8Smelting, steel pipes 3 2.9Manufacture of fine chemicals 23 0.8Household equipment 4 2.3Material-handling, mining, iron and steel, engineering equipment 11 2.9Manufacture of rubber products 31 0.4Precision instruments 7 2.1Petroleum refineries 11 0.1Manufacture of textiles, non-woven 6 1.3
Total 674 2.5
Source: SESSI (1994), Les marchés de l’environnement, Ministère de l’Industrie, des Postes et Télécommunications et du Commerce extérieur, Edition1994.

Annex 6
53
OECD 1999
Annex 6
DISTRIBUTION OF THE ENVIRONMENT INDUSTRYBY STANDARD INDUSTRIAL ACTIVITY: GERMANY, 1992
Industrial activityValue of environment industry
production(million DM)
Share of environment industry production in industry total
(percentage)
Non-metallic mineral products 398. 6 1.0Foundry products 1 056.6 n.a.Production of continuous steel forming and cold-rolling mills 391.1 1.1Fabricated metal products, railway locomotives and rolling stock 1 375.3 3.5Machinery 17 043.9 8.8Vehicles 1 825.0 0.8Electronic 7 471.0 4.6Instruments and machinery 1 545.0 8.1Iron, steel and metals 368.5 0.6Chemicals 1 072.9 0.7Ceramics 265.8 5.2Glass n.a.Wood products n.a.Pulp and paper 179.5 0.7Plastics 1 849.7 3.1Rubber 406.4 2.7Textiles 389.5 1.1
Source: Limbert, 1995.

The Environmental Goods and Services Industry: Manual for Data Collection and Analysis
54
Annex 7
AN EXAMPLE OF A MORE DETAILED BREAKDOWNOF THE ENVIRONMENT INDUSTRY8
A. POLLUTION MANAGEMENT Group
Production of equipment and specific materials for:
1. Air pollution control
1.1 Air-handling equipment1.2 Catalytic converters1.3 Chemical recovery systems1.4 Dust collectors 1.5 Separators, precipitators1.6 Incinerators, scrubbers1.7 Odour control equipment
2. Wastewater management
2.1 Aeration systems2.2 Chemical recovery systems2.3 Biological recovery systems2.4 Gravity sedimentation systems2.5 Oil/water separation systems2.6 Screens, strainers2.7 Sewage treatment2.8 Water pollution control, wastewater reuse equipment2.9 Water handling goods and equipment
3. Solid waste management
3.1 Hazardous waste storage and treatment equipment3.2 Waste collection equipment3.3 Waste disposal equipment3.4 Waste handling equipment3.5 Waste separation equipment3.6 Recycling equipment3.7 Incineration equipment
4. Remediation and clean-up of soil and water
4.1 Absorbents4.2 Cleaning-up4.3 Water treatment equipment
5. Noise and vibration abatement
5.1 Mufflers, silencers5.2 Noise deadening material5.3 Vibration control systems5.4 Highway barriers
6. Environmental monitoring, analysis and assessment
6.1 Measuring and monitoring equipment6.2 Sampling systems6.3 Process and control equipment
OECD 1999

Annex 7
55
6.4 Data acquisition equipment6.5 Other instruments, machines
7. Other
Provision of services for:
8. Air pollution control
8.1 Emission monitoring8.2 Assessment/evaluation/planning
9. Wastewater management
9.1 Sewage treatment systems9.2 Wastewater reuse systems9.3 Water handling systems
10. Solid waste management
10.1 Emergency response and spills clean-up10.2 Waste handling, collection, transport and disposal10.3 Operation of sites10.4 Recycling (sorting, baling, cleaning)10.5 Operation of recycling plants (materials recovery facilities)10.6 Hazardous waste management10.7 Medical waste management
11. Remediation and clean-up of soil and water
11.1 Cleaning-up11.2 Operation of water treatment facilities11.3 Industrial services (cleaning for facilities and tanks)
12. Noise and vibration abatement
12.1 Assessment/monitoring
13. Environmental research & development
13.1 Clean processes13.2 End-of-pipe pollution abatement control
14. Environmental contracting and engineering
14.1 Engineering design/specification/project management14.2 Biological and ecosystem studies14.3 Environment impact assessment, audits14.4 Water treatment14.5 Environmental planning14.6 Risk and hazard assessment14.7 Laboratory and field services14.8 Environmental economics14.9 Legal services (environmental law)14.10 Environmental management
15. Analytical services, data collection, analysis and assessment
15.1 Measuring and monitoring15.2 Sampling 15.3 Process and control15.4 Data acquisition15.5 Others
16. Education, training, information
16.1 Environmental education and training
A. POLLUTION MANAGEMENT Group (cont.)
OECD 1999

56
The Environmental Goods and Services Industry: Manual for Data Collection and Analysis
16.2 Environmental information searching services16.3 Environmental data managemeìnt and analysis
17. Other
Construction and installation for:
18. Air pollution control
19. Wastewater management
19.1 Sewer systems19.2 Wastewater treatment plant
20. Solid waste management
20.1 Solid waste treatment, storage and disposal20.2 Hazardous waste management20.3 Recycling
21. Remediation and clean-up of soil and water
22. Noise and vibration abatement
22.1 Highway barriers
23. Environmental monitoring, analysis and assessment
24. Other
B. CLEANER TECHNOLOGIES AND PRODUCTS Group
Production of equipment, technology, specific materials or services for:
1. Cleaner/resource-efficient technologies and processes
1.1 Components of cleaner/resource-efficient technologies1.2 Biotechnology
2. Cleaner/resource-efficient products
2.1 Components of cleaner/resource-efficient products
C. RESOURCE MANAGEMENT Group
Production of equipment, technology, specific materials, services, construction and installation for:
1. Indoor air pollution control
2. Water supply
2.1 Potable water treatment 2.2 Water purification systems2.3 Potable water supply and distribution
3. Recycled materials
3.1 Recycled paper3.2 Other recycled products
4. Renewable energy plant
4.1 Solar4.2 Wind4.3 Tidal
A. POLLUTION MANAGEMENT Group (cont.)
OECD 1999

Annex 7
57
4.4 Geothermal4.5 Other
5. Heat/energy saving and management
6. Sustainable agriculture and fisheries
7. Sustainable forestry
7.1 Reforestation7.2 Forest management
8. Natural risk management
9. Eco-tourism
10. Other
10.1 Conservation and resource management
C. RESOURCE MANAGEMENT Group (cont.)
OECD 1999

The Environmental Goods and Services Industry: Manual for Data Collection and Analysis
58
Annex 8
OECD/EUROSTAT INFORMAL WORKING GROUPON THE ENVIRONMENT INDUSTRY
LIST OF PARTICIPANTS
AUSTRALIA Mr. G. OAKLEYAustralian Bureau of StatisticsP.O. Box 10Belconnen, ACT 2616Tel.: 61 2 6252 7369Fax: 61 2 62525335E-mail: [email protected]
AUSTRIA Mrs M. BELKEBundesministerium fur WirtschaftlicheAngelegenheitenUmweltkoordinationund UmwelttechnikLandstrasse HauptstrasseA – 1030 WienTel.: 43 1 711 02 316Fax: 43 1 71 43 582
CANADA Mr M. CAMERONStatistics Canada21st Floor R.H. Coats Bldg.Tunney’s PastureOttawa, Ontario KIA 0T6Tel.: 1 613 951 37 65Fax: 1 613 951 36 18
DENMARK Mr. P. RORMOSEDenmark StatisticsSejrøgade 11DK-2100 CopenhagenTel.: 45 39 17 38 62Fax: 45 31 18 48 01
FINLAND Ms M. SAARNILEHTOStatistic FinlandP.O. 6AFIN-00022 TilastokeskusTel.: 358 0 17 34 34 42Fax: 358 0 17 34 34 29
FRANCE Mr G. VITTEKMinistère de l’Industrieet du Commerce Extérieur120, rue du Cherche-MidiF-75353 Paris 07 5PTel.: 33 1 43 19 41 47Fax: 33 1 43 19 25 58
Mr D. DROUETR.D.I.2, rue TraversièreF-71200 Le CreusotTel.: 33 3 85 55 84 77Fax: 33 3 85 55 84 78E-mail: [email protected]
Mr F. HINTERMANNBIPEl’Atrium6, place Abel-GanceF-92652 Boulogne-Billancourt CedexTel.: 33 1 46944508Fax: 33 1 46944587
Mr D. DESAULTYInstitut Français de l’Environnement61, Bl. A.-MartinF-45 0 58 Orléans Cedex 1FranceTel.: 33 1 38 79 78 94Fax: 33 1 38 79 78 60
GERMANY Mrs H. LIMBERTFederal Bureau of StatisticsGustav-Stresemann – Ring 11D-65180 WiesbadenTel.: 49 611 75 21 84Fax: 49 611 76 14 57
Mr. M. KUHNFederal Bureau of StatisticsGustav-Stresemann – Ring 11D-65180 WiesbadenTel.: 49 611 75 21 84Fax: 49 611 76 14 57
Mrs M. HALSTRICK-SCHWENKRhineland-WestphaliaEconomic Research InstituteHohenzollernstrasse 1-3D-4300 Essen 1Tel.: 49 201 81 49 278Fax: 49 201 81 49 200
OECD 1999

Annex 8
59
Mr D. EDLERDeutsches Institut fürWirtschaftsforschungKönigin-Luise Strasse 5D-1000 Berlin 33Tel.: 49 30 89 789 280Fax: 49 30 89 789 200
Mr. J. WACKERBAUERIFO – Abt. UmweltökonomiePoschingerstrasse 5D-81679 MunchenTel.: 49 89 92 24 1277Fax: 49 89 98 5369
Mr M. LEMKEKlaus Novy InstitutAnnostrasse 27-33D- 50 678 KOLNTel.: 49 221 332 80 27Fax: 49 221 31 52 92
ITALY Mr R. MALAMANAutorità per l’Énergia Eletrica e il GasPiazza Cavour 5I-20123 MilanoTel.: 39 2 566 566Fax.: 39 2 566 566E-mail:[email protected]
Ms A. TUDINIISTAT/AMBvia Ravà 15000142 ROMATel.: 39 6 54 900 434Fax: 39 6 54 900 460
JAPAN Mr KUSUDAGlobal Environmental AffairsMinisty of International Tradeand Industry1-3-1 Kasumigaseki, Chiyoda-kuTokioTel.: 813 53 01 16 79Fax: 813 35 01 35 60
NETHERLANDS Mr E. DIETZStatistics NetherlandsPrinses Beatrixlaan 428NL-2270 AZ VoorburgTel.: 31 70 33 74 256Fax: 31 70 38 77 429
UNITED Mrs L. OLDFIELDKINGDOM Department of Trade and Industry
Room 5.03 Green151,Buckingham Palace RoadLondon SW1W 9SSUntied KingdomTel.: 44 171 215 1071Fax: 44 171 215 1879Mr P. TEN BRINKECOTECAvenue de Tervueren, 13BB-1040 BruxellesTel.: 33 2 743 89 49Fax: 33 2 732 71 11
UNITED Mr J. MENESSTATES U.S. Department of Commerce
14th & Constitution Ave, NWRoom 2815Washington, DC 20230Tel.: 202 482 51 45Fax: 202 482 46 14
Mrs E. CHAMPIONU.S. Department of Commerce/Bureauof the CensusManufacturing and ConstructionDivisionWashington D.C.Tel.: 301 457 46 83Fax: 301 457 13 18E-mail:[email protected]
Mr C. PASURKAUS Environmental Protection AgencyMail Stop 2172401 M Street S.W.Washington, DC 20460Tel.: 202 260 61 97Fax: 202 260 57 32E-mail: [email protected]
Mr T. HARRISThe Delta Group – LLC 82 45Taunton, VA 22 152Tel.: 703 451 50 95Fax: 703 451 61 18
Mr D. NOBLEEnvironmental Business International4452 Park Boulevard, Suite 306,San Diego, CA 92 116Tel.: 1 619 295 76 85Fax: 1 619 295 57 43E-mail: Dan_Noble@together. org
EUROPEAN Mr. B. NEWSONCOMMISSION Eurostat
European CommissionRue Alcide de GasperiL – 2029 Luxembourg-KirchbergTel.: 352 4301 320 86Fax: 352 4301 330 29
Mr A. STEUREREurostatEuropean CommissionRue Alcide de GasperiL – 2029 Luxembourg – KirchbergTel.: 352 4301 37 3 39Fax: 352 4301 33 0 29E-mail: [email protected]
Mr J.-M. RENAUXDG III – IndustryEuropean CommissionRue de la Loi 200B – 1049 BrusselsTel.: 32 2 295 60 91Fax: 32 2 299 19 25E-mail:[email protected]
OECD 1999

60
The Environmental Goods and Services Industry: Manual for Data Collection and Analysis
Ms Helena BERENDSDG XI – EnvironmentEuropean CommissionRue de la Loi, 200B-1049 BruxellesTel.: 322 29 68743Fax: 322 29 69559E-mail: [email protected]
OECD Mr G. VICKERYSECRETARIAT Industry Division
OECD2, rue André-Pascal75016 ParisTel.: 33 1 45 24 93 87Fax: 33 1 45 24 94 38E-mail: [email protected]
Ms M. IARRERAIndustry DivisionOECD2, rue André-Pascal75016 ParisTel.: 33 1 45 24 16 48Fax: 33 1 45 24 94 38E-mail: [email protected]
OECD 1999

61
OECD 1999
NOTES
1. OECD (1996c), “Interim Definition and Classification of the Environment Industry”, OCDE/GD(96)117, Paris.
2. Commission of the European Communities, International Monetary Fund, Organisation for Economic Co-operationand Development, United Nations and World Bank (1993), System of National Accounts 1993, prepared under theauspices of the Inter-Secretariat Working Group on National Accounts.
3. United Nations Economic Commission for Europe (1994), SERIEE 1994 Version (European System for the Collection ofEconomic Information on the Environment), Luxembourg, Chapter II, Annex I. The CEPA is published separately in:United Nations Economic Commission for Europe (1994), Single European Standard Statistical Classification of Environ-mental Protection Activities and Facilities, Document CES/822, approved at the 42nd Plenary Session of the Conferenceof European Statisticians, Paris, 13-17 June. The CEPA is also used to illustrate “environmental protection prod-ucts” in United Nations and United Nations Environmental Programme (1999), Integrated Environmental and EconomicAccounting – An Operational Manual.
4. Note also that the Classification of Environmental Protection Activities (CEPA) in the SERIEE was the startingpoint for the classification adopted here.
5. The CPC constitutes a comprehensive classification of all goods and services and serves as an instrument forassembling and tabulating all kinds of statistics requiring product detail. It provides a framework for the interna-tional comparison of statistics dealing with goods, services and assets, and serves as a guide for developing orrevising existing classification schemes of products in order to make them compatible with international stan-dards. Categories are both exhaustive and mutually exclusive. Products are classified into categories based ontheir physical properties and their intrinsic nature, as well as the principle of industrial origin. In relation to theISIC (the activity side of UN classifications), each sub-class of CPC (most detailed 5-digit category) consists ofgoods or services that are predominantly produced in a specific class or classes of ISIC Rev.3. However, “there isno intention of establishing one-to-one correspondence between CPC and ISIC”, United Nations (1998), CentralProduct Classification (CPC) Version 1.0, par. 36.
6. The Harmonized Commodity Description and Coding System (HS) is an exhaustive nomenclature of internationallytraded commodities (goods) classified according to: raw or basic material; degree of processing; use or function;or economic activities. The CPC uses the detailed subheadings of the HS as building blocks for dealing withtransportable goods [United Nations (1998), Central Product Classification (CPC) Version 1.0, par. 3]. CPC subclasses(5-digit categories) in sections 0 to 4 constitute groupings and rearrangements of complete categories of the HS,World Customs Organization (1996).
7. Commission of the European Communities, IMF, OECD, UN, and World Bank (1993), System of National Accounts1993. A detailed exposition of this process can be found in Chapter XV.
8. Statistics Canada used a similar breakdown, based on the classification presented in OECD (1996c), “Interim Def-inition and Classification of the Environment Industry”, OCDE/GD(96)117, to survey the environmental goodsand services industry for the year 1995. See Statistics Canada (1997), “Environment Industry, 1995, PreliminaryData”. The breakdown presented here in Annex 7 has been re-organised to match the revisions to the “InterimDefinition and Classification of the Environment Industry”. This breakdown is also the basis for the detailed cor-respondence with HS codes presented in Annex 2.

63
BIBLIOGRAPHY
BLAZEJCZAK J. and D. EDLER (1997),“Methodological Aspects of Environmental Labour Market Analysis”, Discussion Paper No. 147, DeutschesInstitut fur Wirtschaftsforschung, Berlin.
COMMISSION OF THE EUROPEAN COMMUNITIES (1992),Communication of the Commission to the Council and European Parliament, Industrial Competitiveness and Protectionof the Environment, SEC(92)1986final.
COMMISSION OF THE EUROPEAN COMMUNITIES (1997),Communication from the Commission on Environment and Employment, Building a Sustainable Europe,COM(97)592final.
COMMISSION OF THE EUROPEAN COMMUNITIES, INTERNATIONAL MONETARY FUND, ORGANISATION FORECONOMIC CO-OPERATION AND DEVELOPMENT, UNITED NATIONS AND WORLD BANK (1993),System of National Accounts 1993, prepared under the auspices of the Inter-Secretariat Working Group on NationalAccounts.
DIETZ, E. (1997),NACE REV. 1 Codes Related to the Environment Industry: The Netherlands, Statistics Netherlands.
DROUET, D. (RDI) (1996),“Production and Employment in the Environment Industry. Analysis of Available Supply-side Data in OECDEuropean Countries”, report prepared for the OECD DSTI/Industry Division.
DROUET, D. (RDI) (1997a),“Comments on the ‘Manual for Data Collection on the Environment Industry’”, report prepared for the OECDDSTI/Industry Division.
DROUET, D. (RDI) (1997b),The Environment Industry in France, Armand Colin/Masson Éditeur, Paris.
ECOTEC (1995),Towards a World-Wide Classification Scheme for the Environmental Industry, ECOTEC, Birmingham, United Kingdom.
ENVIRONMENTAL BUSINESS INTERNATIONAL (1995),“A Working Classification” (facsimile communication), San Diego.
EUROSTAT (1994),SERIEE 1994 Version (European System for the Collection of Economic Information on the Environment), Luxembourg.
EUROSTAT (1997),“An Estimate of Eco-Industries in the European Union – 1994”, Eurostat Working Paper No. 2/1997/B/1, preparedfor the European Commission (DGXI and Eurostat), by ECOTEC, BIPE, and IFO, March.
FEDERAL STATISTICS AGENCY (Germany) (1994),List of Environmental Products, Wiesbaden.
GASTON, C. (1995),“Cleaner Products, Cleaner Technologies and Embedded Technologies”, Statistics Canada, paper presented at themeeting of the OECD/Eurostat Informal Working Group on the Environment Industry, Luxembourg, 26-27 April 1995.
GERHOLD S. (1997),“An Estimate of Environmental Construction Activities in Austria”, Austrian Central Statistical Office, paper pre-sented at the OECD/Eurostat Informal Working Group on the Environment Industry, Luxembourg, 26-27 May 1997.
IVA (1996),“Miljödriven teknikutveckling”, Royal Swedish Academy of Engineering Sciences, Stockholm.
LOBBE, K. (1995),“Mapping the Environment Activities”, Rhineland-Westphalia Economic Research Institute, paper pre-sented at the meeting of the OECD/Eurostat Informal Working Group on the Environment Industry,Luxembourg, 26-27 April 1995.
OECD 1999

64
The Environmental Goods and Services Industry: Manual for Data Collection and Analysis
LIMBERT, H. (1995),“Multi-use Products and Services”, German Federal Statistics Agency, paper presented at the meeting of theOECD/Eurostat Informal Working Group on the Environment Industry, Luxembourg, 26-27 April 1995.
MINISTRY OF INTERNATIONAL TRADE AND INDUSTRY (1994),“Environment Industry Policy in Japan”, Attachment 5, Eco-Business in Japan, MITI, Tokyo.
NOBLE, D. (1995a),“Comments on the Draft Document for a Common Definition and Classification of the Environment Industry”,Environmental Business International, paper presented at the meeting of the OECD/Eurostat Informal WorkingGroup on the Environment Industry, Luxembourg, 26-27 April 1995.
NOBLE, D. (1995b),“Comments on the OECD Country Numbers Provided by EBI”, Environmental Business International, San Diego.
NOBLE, D. (1996),“EBI Markets and Industry Research Methods”, Environmental Business International, San Diego.
NOBLE, D. (1997a),“Comments on the ‘Manual for Data Collection on the Environment Industry’”, report prepared for the OECDDSTI/Industry Division.
NOBLE, D. (1997b),“Sustainable Development and Clean Technology: Industrial Sustainability Benchmarks and their Implication forGuiding Industrial Environmental Policy and Business Opportunities Identification and Evaluation”, paper pre-sented at the OECD/Eurostat Informal Working Group on the Environment Industry, Luxembourg, 26-27 May 1997.
OAKLEY, G. (1995a),“Methods and Tools for Data Collection – An Overview”, Australian Bureau of Statistics, paper presented at themeeting of the OECD/Eurostat Informal Working Group on the Environment Industry, Luxembourg, 26-27 April 1995.
OAKLEY, G. (1995b),“Draft Classification of the Environment Industry”, Australian Bureau of Statistics, paper presented at the meet-ing of the OECD/Eurostat Informal Working Group on the Environment Industry, Luxembourg, 26-27 April 1995.
OAKLEY, G. (1995c),“Second Draft Classification of the Environment Industry”, Australian Bureau of Statistics, paper presented at themeeting of the OECD/Eurostat Informal Working Group on the Environment Industry, Luxembourg, 26-27 April 1995.
OECD (1992),The OECD Environment Industry: Situation, Prospects and Government Policy, Paris.
OECD (1993),Environmental Protection Expenditures, Paris.
OECD (1995),“Draft Synthesis Document for a Common Definition and Classification of the Environment Industry for DataCollection”, paper presented at the meeting of the OECD/Eurostat Informal Working Group on the EnvironmentIndustry, Luxembourg, 26-27 April 1995.
OECD (1996a),The Global Environmental Goods and Services Industry, Paris.
OECD (1996b),The Environment Industry – The Washington Meeting, Paris.
OECD (1996c),“Interim Definition and Classification of the Environment Industry”, OCDE/GD(96)117, Paris.
OECD (1999),“Future Liberalisation of Trade in Environmental Goods and Services: Ensuring Environmental Protection as wellas Economic Benefits”, COM/TD/ENV(98)37/FINAL, Paris.
PASURKA, C. and A. STEURER (1995),“Assessing the Environment Industry through Integration of Demand- and Supply-side Data”, paper presentedat the meeting of the OECD/Eurostat Informal Working Group on the Environment Industry, Luxembourg,26-27 April 1995.
SANCHEZ, L. (1997),“Statistics on Environmental Protection Expenditure and the Producers of Environmental Services”, paper pre-sented at the OECD/Eurostat Informal Working Group on the Environment Industry, Luxembourg, 26-27 May 1997.
SESSI (1994),Les marchés de l’environnement, Ministère de l’Industrie, des Postes et Télécommunications et du Commerceextérieur, Edition 1994.
OECD 1999

Bibliography
65
STATISTICS CANADA (1997),“Environment Industry, 1995, Preliminary Data”, National Accounts and Environment Division, Ottawa.
UNITED NATIONS (1998),Central Product Classification (CPC) Version 1.0, Statistical Papers, Series M, No. 77, Ver.1.0, New York.
UNITED NATIONS and UNITED NATIONS ENVIRONMENTAL PROGRAMME (1999),Integrated Environmental and Economic Accounting – An Operational Manual, New York.
UNITED NATIONS ECONOMIC COMMISSION FOR EUROPE (1994), Single European Standard Statistical Classification of Environmental Protection Activities and Facilities, Document CES/822,approved at the 42nd Plenary Session of the Conference of European Statisticians, Paris, 13-17 June.
US BUREAU OF THE CENSUS (1997),“Survey of Environmental Products and Services, 1995. Issues Raised in the First Survey”, US Bureau of theCensus, paper presented at the OECD/Eurostat Informal Working Group on the Environment Industry,Luxembourg, 26-27 May 1997.
US BUREAU OF THE CENSUS/US ENVIRONMENTAL PROTECTION AGENCY/US DEPARTMENT OF COMMERCE(1998),“Survey of Environmental Products and Services”, Washington.
WORLD CUSTOMS ORGANIZATION (1996),Harmonized Commodity Description and Coding System, Explanatory notes, Second edition, Brussels.
OECD 1999

OECD PUBLICATIONS, 2, rue André-Pascal, 75775 PARIS CEDEX 16
PRINTED IN FRANCE
(70 1999 03 1 P) ISBN 92-64-17109-6 – No. 50829 1999