environmental and management influences on temporal variability of near saturated soil hydraulic...
TRANSCRIPT
Geoderma 204–205 (2013) 120–129
Contents lists available at SciVerse ScienceDirect
Geoderma
j ourna l homepage: www.e lsev ie r .com/ locate /geoderma
Environmental and management influences on temporal variability ofnear saturated soil hydraulic properties☆
G. Bodner a,⁎, P. Scholl a, W. Loiskandl b, H.-P. Kaul a
a Department of Crop Sciences, Division of Agronomy, University of Natural Resources and Life Sciences, BOKU Vienna, Gregor Mendel Straße 33, A-1190 Vienna, Austriab Department of Water, Atmosphere and Environment, Institute of Hydraulics and Rural Water Management, University of Natural Resources and Life Sciences, BOKU Vienna, Muthgasse 18,A-1190 Vienna, Austria
Abbreviations:K(h), hydraulic conductivity; ε, effectiveθs, water content at saturation; θr, residual water conterm, median pore radius; σ, standard deviation of pore s☆ This is an open-access article distributed under the tAttribution-NonCommercial-No Derivative Works License,use, distribution, and reproduction in any medium, provideare credited.⁎ Corresponding author. Tel.: +43 1 47654 3331; fax
E-mail address: [email protected] (G. Bodne
0016-7061/$ – see front matter © 2013 The Authors. Phttp://dx.doi.org/10.1016/j.geoderma.2013.04.015
a b s t r a c t
a r t i c l e i n f oArticle history:Received 19 September 2012Received in revised form 12 April 2013Accepted 15 April 2013Available online 17 May 2013
Keywords:MacroporosityTemporal variabilityTension infiltrometerWetting–drying cyclesCover croppingTillage
Structural porosity is a decisive property for soil productivity and soil environmental functions. Hydraulic prop-erties in the structural range vary over time in response tomanagement and environmental influences. Althoughthis is widely recognized, there are few field studies that determine dominant driving forces underlying hydrau-lic property dynamics. During a three year field experiment we measured temporal variability of soil hydraulicproperties by tension infiltrometry. Soil properties were characterized by hydraulic conductivity, effectivemacroporosity and Kosugi's lognormal pore size distribution model. Management related influences comprisedthree soil cover treatment (mustard and rye vs. fallow) and an initial mechanical soil disturbance with a rotaryharrow. Environmental driving forces were derived from meteorological and soil moisture data. Soil hydraulicparameters varied over time by around one order ofmagnitude. The coefficient of variation of soil hydraulic con-ductivity K(h) decreased from 69.5% at saturation to 42.1% in the more unsaturated range (−10 cm pressurehead). A slight increase in the Kosugi parameter showing pore heterogeneity was observed under the ryecover crop, reflecting an enhanced structural porosity. The other hydraulic parameters were not significantlyinfluenced by the soil cover treatments. Seedbed preparationwith a rotary harrow resulted in a fourfold increasein macroporosity and hydraulic conductivity next to saturation, and homogenized the pore radius distribution.Re-consolidation after mechanical loosening lasted over 18 months until the soil returned to its initial state.The post-tillage trend of soil settlement could be approximated by an exponential decay function. Among envi-ronmental factors, wetting-drying cycles were identified as dominant driving force explaining short term hy-draulic property changes within the season (r2 = 0.43 to 0.59). Our results suggested that beside consideringaverage management induced changes in soil properties (e.g. cover crop introduction), a dynamic approachto hydrological modeling is required to capture over-seasonal (tillage driven) and short term (environmentaldriven) variability in hydraulic parameters.
© 2013 The Authors. Published by Elsevier B.V. All rights reserved.
1. Introduction
Agricultural productivity and most environmental functions of thesoil depend on an intact soil structure (Blum et al., 2006). Regardingsoil hydraulics, soil structure controls the two fundamental relationsfor water flow in the saturated and near-saturated range, i.e. the re-tention and hydraulic conductivity functions (Cresswell et al., 1992).
Soil structural porosity is a highly dynamic property subject tonumerous natural and human influences. Therefore knowledge of its
macroporosity;ϕ, total porosity;nt; hm, median pressure head;ize distribution.erms of the Creative Commonswhich permits non-commerciald the original author and source
: +43 1 47654 3342.r).
ublished by Elsevier B.V. All rights r
spatial and temporal variability is fundamental to accurately describesoil processes like water infiltration and storage (van Es et al., 1999).Changes in soil structure occur on different time scales (Kay, 1990).Land use changes result in long-term adaptation of soil properties(e.g. Fuentes et al., 2004; Scheffler et al., 2011; Schwärzel et al., 2010).Tillage and crop rotation modify soil structure on an intermediateover-seasonal scale (e.g. Green et al., 2003; Moret and Arrúe, 2007;Roger-Estrade et al., 2000; Schwen et al., 2011; Snyder et al., 2000;Strudley et al., 2008). Within a cropping season soil structure respondsto environmental conditions such as the amount and intensity of rain-fall, wet–dry and freeze–thaw cycles, (e.g. Angulo-Jaramillo et al.,1997; Peng et al., 2007; Rousseva et al., 2002).
In agricultural soils, environmental andmanagement related factorsinteract in driving temporal dynamics of structure related soil hydraulicproperties (Mapa et al., 1986). Tillage operations and crop rotationare key management decisions that can improve or deteriorate soilstructural porosity and water permeability (Munkholm et al., 2013).For example, no-tillage is considered particularly adapted to conserve
eserved.

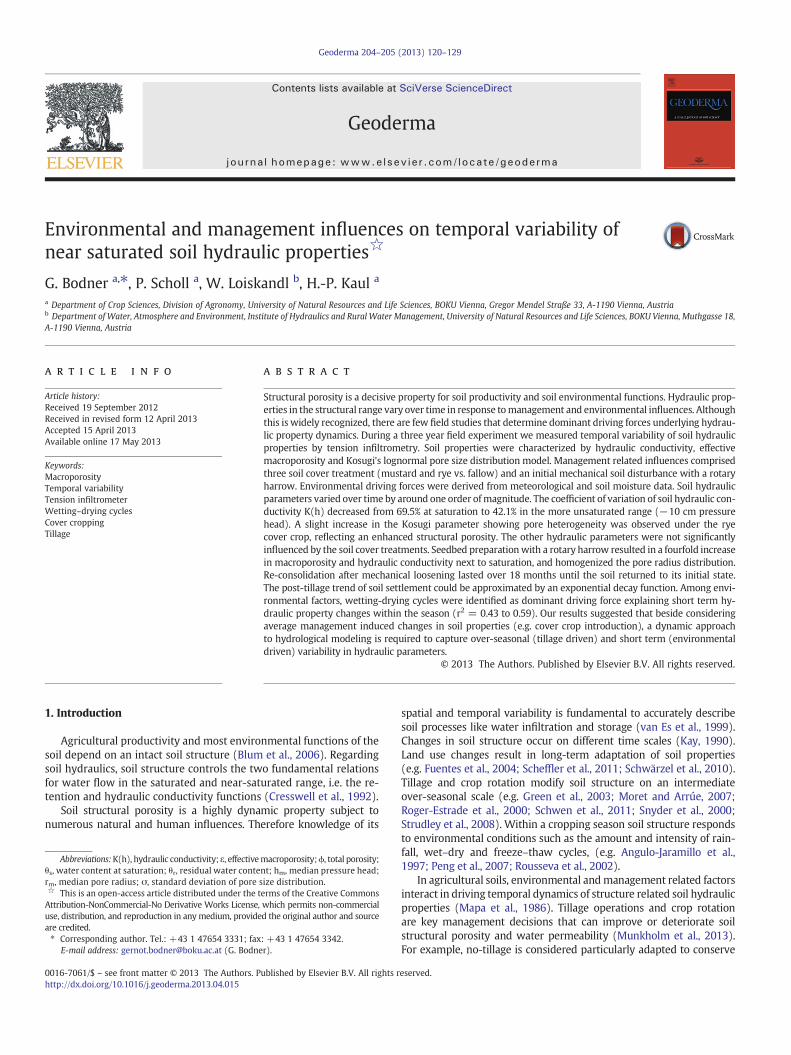
Fig. 1. Precipitation, air temperature and reference evapotranspiration (ET0) at theexperimental site.
121G. Bodner et al. / Geoderma 204–205 (2013) 120–129
soil structure (Bronick and Lal, 2005). The transition from regularsoil loosening to no-tillage requires several years to achieve a stable,natural soil structure (Wright et al., 1999). Munkholm et al. (2003)demonstrated that soils under long term no-tillage with low “self-mulching potential” (low clay and organic matter content) can alsotend to increased bulk density and reduced water permeability.
Crop rotation influences structural porosity via plant canopy andmulch coveragewhich protect aggregates at the soil surface against dis-ruption by heavy rainfall (Blanco-Canqui et al., 2006). Also the differentamount and quality of aboveground as well as root derived organicmatter input and their microbiological decomposition are related tosoil structure formation and stabilization (Angers and Caron, 1998;Feeney et al., 2004; Gregory, 2006). Particularly roots can modify poreproperties in various ways, such as temporal pore clogging (Scanlanand Hinz, 2008), biopore formation upon decay (Rasse and Smucker,1998), local compaction, enhanced wetting–drying (Whalley et al.,2004) and hydrophobicity of rooted pore walls (Czarnes et al., 2000).
The introduction of cover crops is a widely applied measure to im-prove soil quality and fertility within the crop rotation. Cover cropscorrespond to what Yunusa and Newton (2003) called primer-plants,i.e. plants without a direct economic benefit, but effective in condition-ing the soil for cash crops and in conserving environmental resources.Folorunso et al. (1992) and Joyce et al. (2002) reported improved rain-fall infiltration in cover-cropped plots compared to a fallow rotation.Carof et al. (2007) and Bodner et al. (2008) did not find a significantlyhigher hydraulic conductivity under cover crops, but showed a stabili-zation of near saturated hydraulic properties over time. Williams andWeil (2004) considered cover crops as an effective way to alleviatesoil compaction due to root induced biopores being used by the fol-lowing crop to penetrate the soil.
Horn and Smucker (2005) reviewed the role of various environ-mental driving forces for soil structure formation. Capillary forcesenhance soil aggregation upon drying, while rewetting may increasestructural instability (Lado et al., 2004; Leij et al., 2002; Peng et al.,2007). Rainfall intensity is an indicator for the disaggregating force ofraindrop impact on surface aggregates (Singh et al., 2012). Thesedynamic environmental driving forces interact with stabilizing agentsin a given soil such as organic matter (e.g. exudates) and ion composi-tion (e.g. Ca++) as well as management (e.g. tillage, cover cropping).
The importance of temporal soil structure dynamics is widelyrecognized (e.g. Green et al., 2003; Stange and Horn, 2005) andthere is substantial qualitative knowledge about structure formingfactors. However, only few studies attempted to demonstrate the re-lation of structure dependent hydraulic properties and processes withtheir driving forces under field conditions. The present study analysesthe temporal variability of field hydraulic properties in the near satu-rated range and aims to reveal major environmental and manage-ment induced driving forces. A main hypothesis of the study is thatmanagement factors modify soil structural porosity over a longertime scale, while within season variability can be explained by envi-ronmental driving forces. Our objective is to identify factors andtime scales to be taken into consideration for a dynamic descriptionof hydrological processes in an agricultural field, and to highlightthe potential of agricultural management measures to influence soilhydraulic properties in the structural range.
2. Materials and methods
2.1. Experimental site
Fieldmeasurements were conducted on an arable field near Raasdorf,Lower Austria (48°14′N 16°35′E, 156 m asl) between 2009 and 2012. Cli-matically the site is characterized by sub-humid conditions (pannonic)with an average annual precipitation of 525 mm, amean annual temper-ature of 9.8 °C, and a mean relative humidity of 75%. Weather data wererecorded by an automated weather station (Adcon Telemetry GmbH,
Austria) at the experimental site. Fig. 1 shows rainfall, temperature andreference evapotranspiration (ET0) for the three experimental years.
Capacitance sensors (CProbe, Adcon Telemetry GmbH, Austria)were installed in each experimental plot via access tubes for continuoussoil water measurement. Fig. 2 shows the soil water dynamics in theupper soil layer during the experimental period.
The soil at the site is classified as Chernosem in the WRB (IUSS,2007). Basic soil properties are given in Table 1.
The field trial was established on a site under no tillage since 1996.Three different soil cover treatments were integrated during the fallowperiod between cash crops of a three year crop rotation. Cash cropswere durum wheat (Triticum turgidum L. subsp. durum, 2010), fieldpea (Pisum sativum L., 2011) and durum wheat (2012). The soil covertreatments consisted of (i) bare soil without any plant cover betweenmain crops, and two different cover crops, being (ii) mustard (Sinapisalba L.) and (iii) rye (Secale cereale L). The two cover crops differed inthe duration of green canopy coverage and their root systems. Rye is awinter-hard cover crop while mustard is killed by frost during winter.Rye has a fibrous homorrhizal root system, while mustard is anallorhizal plant with a tap root (Kutschera et al., 2009). The soil in thiscrop rotation is left uncovered for around eight months (August toMarch) in case of not including a cover crop. The three soil cover treat-ments were arranged in a randomized complete block design (RCBD)with three replicates. Each plot had a length of 20 m and awidth of 3 m.
Table 2 gives an overview of management measures and measure-ments during the study period. In spring 2010, before seeding ofdurum wheat into the cover crop residues, a shallow seed bed prepa-ration of the top five centimeter soil was performed using a rotaryharrow. In the subsequent years the soil again returned to no-tillagewithout any further mechanical soil disturbance.
2.2. Tension infiltrometer measurements
Infiltration experiments were conducted twelve times betweenSeptember 2009 and July 2012 (cf. Fig. 2 and Table 2). The measure-mentswere performed using a tension infiltrometer (SoilMeasurementSystems Inc., Tucson, AZ). The infiltrometer disc had a diameter of20 cm and was separate from the supply and tension control tubes.Measurements were taken at the soil surface where most structuraldynamics were expected. The soil surface was prepared by carefully re-moving mulch and any above-ground plant material. A nylon mesh toavoid macropore clogging and a fine layer of quartz sand (diameter:0.08–0.2 mm) to ensure good hydraulic contact were placed betweenthe disc and the soil. The supply pressure heads were −10, −4, −1,and 0 cm. The first two pressure heads were maintained for approxi-mately 40–60 min, and the last two pressure heads were applied forabout 10–20 min. Preliminary tests found these durations to be suffi-cient to achieve steady-state infiltration. The water level in the supplytube was observed visually in intervals of 15 s during the first 5 minafter application of a supply pressure, and in increasing intervals of 2–10 min afterwards. All infiltration experiments were conducted in the
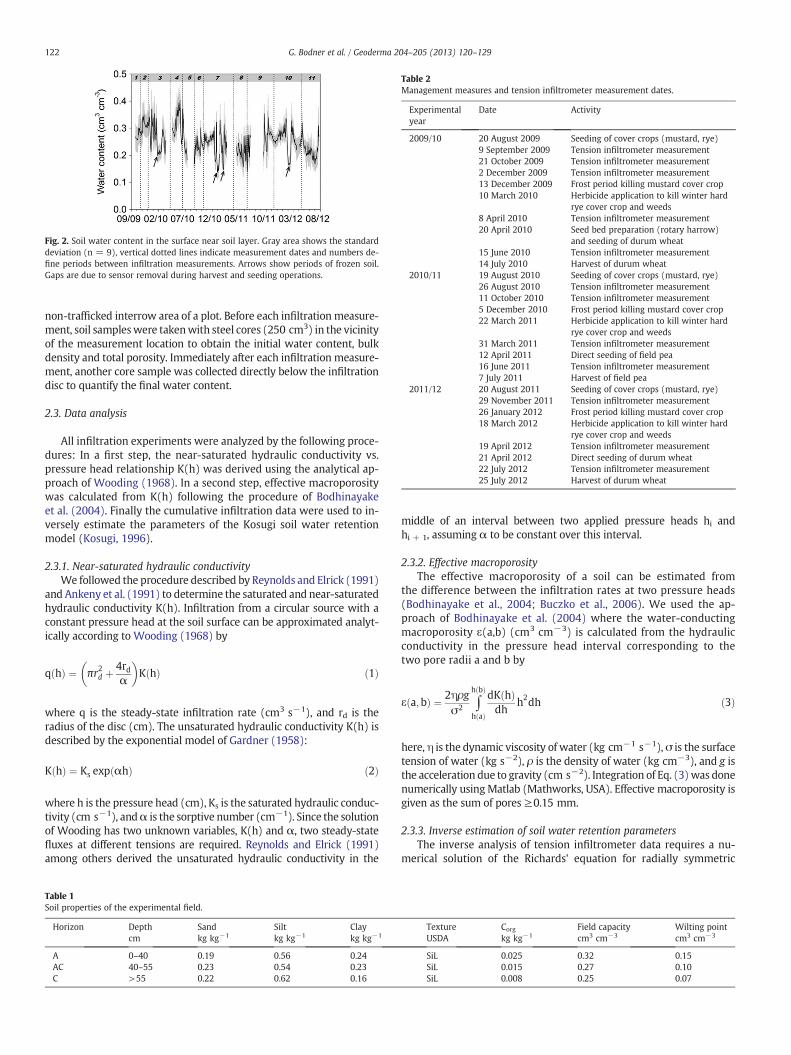
Fig. 2. Soil water content in the surface near soil layer. Gray area shows the standarddeviation (n = 9), vertical dotted lines indicate measurement dates and numbers de-fine periods between infiltration measurements. Arrows show periods of frozen soil.Gaps are due to sensor removal during harvest and seeding operations.
Table 2Management measures and tension infiltrometer measurement dates.
Experimentalyear
Date Activity
2009/10 20 August 2009 Seeding of cover crops (mustard, rye)9 September 2009 Tension infiltrometer measurement21 October 2009 Tension infiltrometer measurement2 December 2009 Tension infiltrometer measurement13 December 2009 Frost period killing mustard cover crop10 March 2010 Herbicide application to kill winter hard
rye cover crop and weeds8 April 2010 Tension infiltrometer measurement20 April 2010 Seed bed preparation (rotary harrow)
and seeding of durum wheat15 June 2010 Tension infiltrometer measurement14 July 2010 Harvest of durum wheat
2010/11 19 August 2010 Seeding of cover crops (mustard, rye)26 August 2010 Tension infiltrometer measurement11 October 2010 Tension infiltrometer measurement5 December 2010 Frost period killing mustard cover crop22 March 2011 Herbicide application to kill winter hard
rye cover crop and weeds31 March 2011 Tension infiltrometer measurement12 April 2011 Direct seeding of field pea16 June 2011 Tension infiltrometer measurement7 July 2011 Harvest of field pea
2011/12 20 August 2011 Seeding of cover crops (mustard, rye)29 November 2011 Tension infiltrometer measurement26 January 2012 Frost period killing mustard cover crop18 March 2012 Herbicide application to kill winter hard
rye cover crop and weeds19 April 2012 Tension infiltrometer measurement21 April 2012 Direct seeding of durum wheat22 July 2012 Tension infiltrometer measurement25 July 2012 Harvest of durum wheat
122 G. Bodner et al. / Geoderma 204–205 (2013) 120–129
non-trafficked interrow area of a plot. Before each infiltration measure-ment, soil sampleswere takenwith steel cores (250 cm3) in the vicinityof the measurement location to obtain the initial water content, bulkdensity and total porosity. Immediately after each infiltration measure-ment, another core sample was collected directly below the infiltrationdisc to quantify the final water content.
2.3. Data analysis
All infiltration experiments were analyzed by the following proce-dures: In a first step, the near-saturated hydraulic conductivity vs.pressure head relationship K(h) was derived using the analytical ap-proach of Wooding (1968). In a second step, effective macroporositywas calculated from K(h) following the procedure of Bodhinayakeet al. (2004). Finally the cumulative infiltration data were used to in-versely estimate the parameters of the Kosugi soil water retentionmodel (Kosugi, 1996).
2.3.1. Near-saturated hydraulic conductivityWe followed the procedure described by Reynolds and Elrick (1991)
and Ankeny et al. (1991) to determine the saturated and near-saturatedhydraulic conductivity K(h). Infiltration from a circular source with aconstant pressure head at the soil surface can be approximated analyt-ically according to Wooding (1968) by
q hð Þ ¼ πr2d þ4rdα
� �K hð Þ ð1Þ
where q is the steady-state infiltration rate (cm3 s−1), and rd is theradius of the disc (cm). The unsaturated hydraulic conductivity K(h) isdescribed by the exponential model of Gardner (1958):
K hð Þ ¼ Ks exp αhð Þ ð2Þ
where h is the pressure head (cm), Ks is the saturated hydraulic conduc-tivity (cm s−1), andα is the sorptive number (cm−1). Since the solutionof Wooding has two unknown variables, K(h) and α, two steady-statefluxes at different tensions are required. Reynolds and Elrick (1991)among others derived the unsaturated hydraulic conductivity in the
Table 1Soil properties of the experimental field.
Horizon Depthcm
Sandkg kg−1
Siltkg kg−1
Claykg kg−1
A 0–40 0.19 0.56 0.24AC 40–55 0.23 0.54 0.23C >55 0.22 0.62 0.16
middle of an interval between two applied pressure heads hi andhi + 1, assuming α to be constant over this interval.
2.3.2. Effective macroporosityThe effective macroporosity of a soil can be estimated from
the difference between the infiltration rates at two pressure heads(Bodhinayake et al., 2004; Buczko et al., 2006). We used the ap-proach of Bodhinayake et al. (2004) where the water-conductingmacroporosity ε(a,b) (cm3 cm−3) is calculated from the hydraulicconductivity in the pressure head interval corresponding to thetwo pore radii a and b by
ε a;bð Þ ¼ 2ηρgσ2 ∫
h bð Þ
h að Þ
dK hð Þdh
h2dh ð3Þ
here, η is the dynamic viscosity of water (kg cm−1 s−1), σ is the surfacetension of water (kg s−2), ρ is the density of water (kg cm−3), and g isthe acceleration due to gravity (cm s−2). Integration of Eq. (3)was donenumerically usingMatlab (Mathworks, USA). Effective macroporosity isgiven as the sum of pores ≥0.15 mm.
2.3.3. Inverse estimation of soil water retention parametersThe inverse analysis of tension infiltrometer data requires a nu-
merical solution of the Richards' equation for radially symmetric
TextureUSDA
Corg
kg kg−1Field capacitycm3 cm−3
Wilting pointcm3 cm−3
SiL 0.025 0.32 0.15SiL 0.015 0.27 0.10SiL 0.008 0.25 0.07
123G. Bodner et al. / Geoderma 204–205 (2013) 120–129
Darcian flow. We followed the procedure presented by Šimůnek et al.(1998). Soil water retention was described by the model of Kosugi(1996) which is based on a lognormal pore-size distribution. Weused the Kosugi model due to the physical interpretability of its pa-rameters. Soil water retention Se(h) is given by
Se hð Þ ¼ 0:5erfclog h
hm
� �ffiffiffi2
pσ
!ð4Þ
where Se (−) is the effective saturation corresponding to θ−θrθs−θr
with θ
(cm3 cm−3) being the volumetric water content, θr (cm3 cm−3)being the residual water content and θs (cm3 cm−3) being the satura-tion water content. Erfc is the complementary error function, hm (cm)is the median pressure head and σ (−) is the standard deviation ofthe log-transformed pressure head. The median pore radius (rm)can be calculated from the median pressure head hm using theYoung–Laplace equation.
Parameter estimation is done by minimizing the objective func-tion as defined by Šimůnek and Van Genuchten (1996) using theprogram HYDRUS 2D/3D (Šimůnek et al., 2006) which applies aLevenberg–Marquardt nonlinear minimization algorithm. Initial pa-rameter estimates were derived from the texture based pedotransferfunction Rosetta (Schaap et al., 2001) (input parameters: soil textureand bulk density). To reduce the amount of unknown variables, θrwas fixed to 0.067 cm3 cm−3, as predicted by Rosetta, and Ks valueswere used from the Wooding analysis (Šimůnek et al, 1998). Theremaining parameters θs, σ, and hm were then inversely estimated.
2.4. Driving force parameters
Different parameters may act as driving forces for the temporal var-iability of soil hydraulic properties. In our experiment management in-duced driving forces included three soil covers arranged as randomizedplots on the field. Cover crop plants were characterized by their above-ground (soil cover, biomass) and root properties (root–shoot ratio, rootlength density). A further management impact on the entire experi-mental field was the mechanical soil disturbance at seedbed prepara-tion in spring 2010.
Environmental driving forces included cumulative rainfall, rainfallintensity, cumulative reference evapotranspiration and three parame-ters reflecting soil wetting and drying (trend in soil moisture, intensityof wetting–drying, frequency of wetting–drying cycles). These parame-ters were calculated from meteorological data and surface near soilwater content in the period between two consecutive infiltration mea-surements. The trend in soil moisture was obtained by linear regressionof water content vs. time. Wetting–drying cycle intensity and cyclefrequency were calculated by spectral analysis of the de-trended soilwater content time series using the SAS (SAS Institute Inc., 2004) proce-dure PROC SPECTRA.
2.5. Statistical evaluation
Analysis of variance was performed using the MIXED procedure inSAS that computes Wald-type F-statistics using generalized leastsquares (GLSE) based on restricted maximum likelihood estimatesof the variance components (Littell et al., 1998). Denominator de-grees of freedom were approximated by the Kenward Roger method(Kenward and Roger, 1997). In case of significant differences in theWald-F-statistic for p b 0.05, treatment means were compared usinga two-sided t test. To account for the serial correlation of non-randomized repeated measures on the same experimental unit, i.e.pressure head sequence in the K(h) data andmeasurement date, an ad-equate correlation model must be fit to the data (Piepho et al., 2004).This was done within the procedure MIXED using the Akaike Informa-tion Criterion (AIC).
3. Results and discussion
3.1. Near saturated hydraulic conductivity
Near saturated hydraulic conductivity K(h) was calculated from in-filtration measurements using Wooding's analytical solution at twelvemeasurement dates over the three year crop rotation (Fig. 3). All yearsincluded at least one measurement in the growing cover crop inautumn, one after winter before cash crop seeding and one in earlysummer before cash crop harvest.
Table 3 shows the results of the analysis of variance. The p-valuesreveal the dominant role of temporal variance on K(h) at all pressureheads. In average 62.5% of the total variance in K(h) was due to thetemporal effect. This was substantially higher compared to spatialeffects, which are indicated by replication and inter-plot (error) var-iance and explained 20.2% of the total variance. Also Messing andJarvis (1993) found higher temporal than spatial variability in K(h)measured by tension infiltrometers.
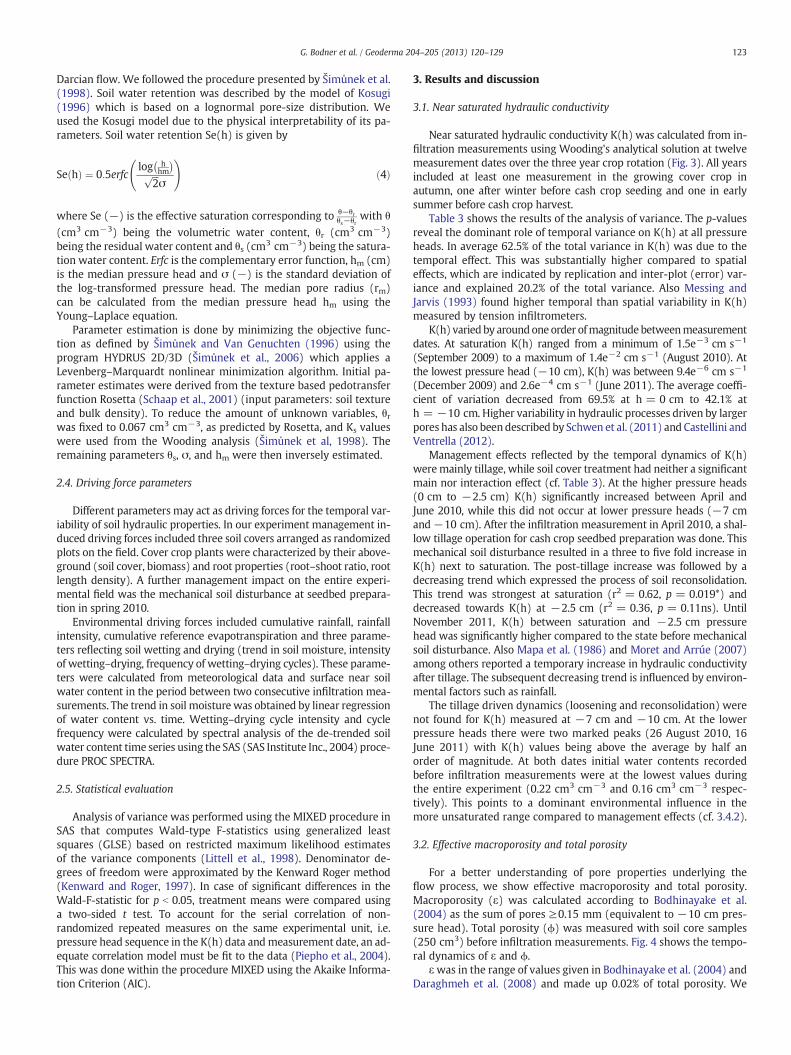
K(h) varied by aroundone order ofmagnitude betweenmeasurementdates. At saturation K(h) ranged from a minimum of 1.5e−3 cm s−1
(September 2009) to a maximum of 1.4e−2 cm s−1 (August 2010). Atthe lowest pressure head (−10 cm), K(h) was between 9.4e−6 cm s−1
(December 2009) and 2.6e−4 cm s−1 (June 2011). The average coeffi-cient of variation decreased from 69.5% at h = 0 cm to 42.1% ath = −10 cm. Higher variability in hydraulic processes driven by largerpores has also beendescribed by Schwen et al. (2011) and Castellini andVentrella (2012).
Management effects reflected by the temporal dynamics of K(h)weremainly tillage, while soil cover treatment had neither a significantmain nor interaction effect (cf. Table 3). At the higher pressure heads(0 cm to −2.5 cm) K(h) significantly increased between April andJune 2010, while this did not occur at lower pressure heads (−7 cmand−10 cm). After the infiltration measurement in April 2010, a shal-low tillage operation for cash crop seedbed preparation was done. Thismechanical soil disturbance resulted in a three to five fold increase inK(h) next to saturation. The post-tillage increase was followed by adecreasing trend which expressed the process of soil reconsolidation.This trend was strongest at saturation (r2 = 0.62, p = 0.019*) anddecreased towards K(h) at −2.5 cm (r2 = 0.36, p = 0.11ns). UntilNovember 2011, K(h) between saturation and −2.5 cm pressurehead was significantly higher compared to the state before mechanicalsoil disturbance. Also Mapa et al. (1986) and Moret and Arrúe (2007)among others reported a temporary increase in hydraulic conductivityafter tillage. The subsequent decreasing trend is influenced by environ-mental factors such as rainfall.
The tillage driven dynamics (loosening and reconsolidation) werenot found for K(h) measured at −7 cm and −10 cm. At the lowerpressure heads there were two marked peaks (26 August 2010, 16June 2011) with K(h) values being above the average by half anorder of magnitude. At both dates initial water contents recordedbefore infiltration measurements were at the lowest values duringthe entire experiment (0.22 cm3 cm−3 and 0.16 cm3 cm−3 respec-tively). This points to a dominant environmental influence in themore unsaturated range compared to management effects (cf. 3.4.2).
3.2. Effective macroporosity and total porosity
For a better understanding of pore properties underlying theflow process, we show effective macroporosity and total porosity.Macroporosity (ε) was calculated according to Bodhinayake et al.(2004) as the sum of pores ≥0.15 mm (equivalent to −10 cm pres-sure head). Total porosity (ϕ) was measured with soil core samples(250 cm3) before infiltration measurements. Fig. 4 shows the tempo-ral dynamics of ε and ϕ.
εwas in the range of values given in Bodhinayake et al. (2004) andDaraghmeh et al. (2008) and made up 0.02% of total porosity. We
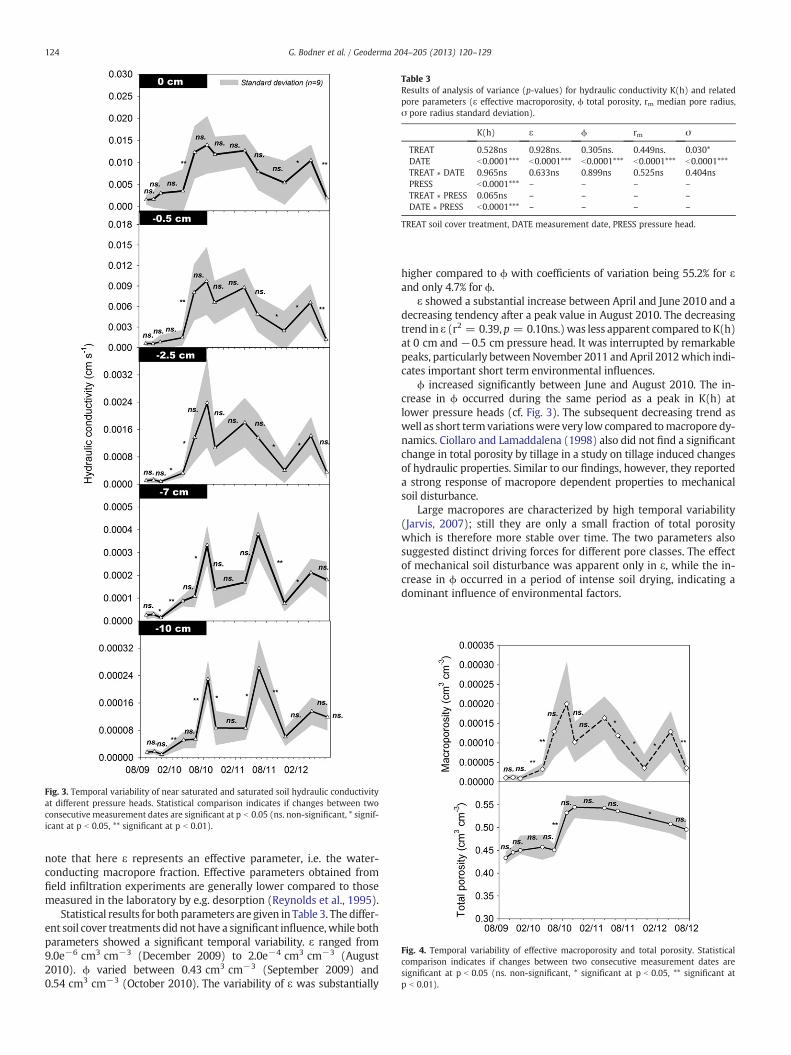
Fig. 3. Temporal variability of near saturated and saturated soil hydraulic conductivityat different pressure heads. Statistical comparison indicates if changes between twoconsecutive measurement dates are significant at p b 0.05 (ns. non-significant, * signif-icant at p b 0.05, ** significant at p b 0.01).
Table 3Results of analysis of variance (p-values) for hydraulic conductivity K(h) and relatedpore parameters (ε effective macroporosity, ϕ total porosity, rm median pore radius,σ pore radius standard deviation).
K(h) ε ϕ rm σ
TREAT 0.528ns 0.928ns. 0.305ns. 0.449ns. 0.030*DATE b0.0001*** b0.0001*** b0.0001*** b0.0001*** b0.0001***TREAT ∗ DATE 0.965ns 0.633ns 0.899ns 0.525ns 0.404nsPRESS b0.0001*** – – – –
TREAT ∗ PRESS 0.065ns – – – –
DATE ∗ PRESS b0.0001*** – – – –
TREAT soil cover treatment, DATE measurement date, PRESS pressure head.
Fig. 4. Temporal variability of effective macroporosity and total porosity. Statisticalcomparison indicates if changes between two consecutive measurement dates aresignificant at p b 0.05 (ns. non-significant, * significant at p b 0.05, ** significant atp b 0.01).
124 G. Bodner et al. / Geoderma 204–205 (2013) 120–129
note that here ε represents an effective parameter, i.e. the water-conducting macropore fraction. Effective parameters obtained fromfield infiltration experiments are generally lower compared to thosemeasured in the laboratory by e.g. desorption (Reynolds et al., 1995).
Statistical results for both parameters are given in Table 3. The differ-ent soil cover treatments did not have a significant influence,while bothparameters showed a significant temporal variability. ε ranged from9.0e−6 cm3 cm−3 (December 2009) to 2.0e−4 cm3 cm−3 (August2010). ϕ varied between 0.43 cm3 cm−3 (September 2009) and0.54 cm3 cm−3 (October 2010). The variability of ε was substantially
higher compared to ϕ with coefficients of variation being 55.2% for εand only 4.7% for ϕ.
ε showed a substantial increase between April and June 2010 and adecreasing tendency after a peak value in August 2010. The decreasingtrend in ε (r2 = 0.39, p = 0.10ns.) was less apparent compared to K(h)at 0 cm and −0.5 cm pressure head. It was interrupted by remarkablepeaks, particularly between November 2011 and April 2012which indi-cates important short term environmental influences.
ϕ increased significantly between June and August 2010. The in-crease in ϕ occurred during the same period as a peak in K(h) atlower pressure heads (cf. Fig. 3). The subsequent decreasing trend aswell as short termvariationswere very low compared tomacropore dy-namics. Ciollaro and Lamaddalena (1998) also did not find a significantchange in total porosity by tillage in a study on tillage induced changesof hydraulic properties. Similar to our findings, however, they reporteda strong response of macropore dependent properties to mechanicalsoil disturbance.
Large macropores are characterized by high temporal variability(Jarvis, 2007); still they are only a small fraction of total porositywhich is therefore more stable over time. The two parameters alsosuggested distinct driving forces for different pore classes. The effectof mechanical soil disturbance was apparent only in ε, while the in-crease in ϕ occurred in a period of intense soil drying, indicating adominant influence of environmental factors.
125G. Bodner et al. / Geoderma 204–205 (2013) 120–129
3.3. Retention parameters
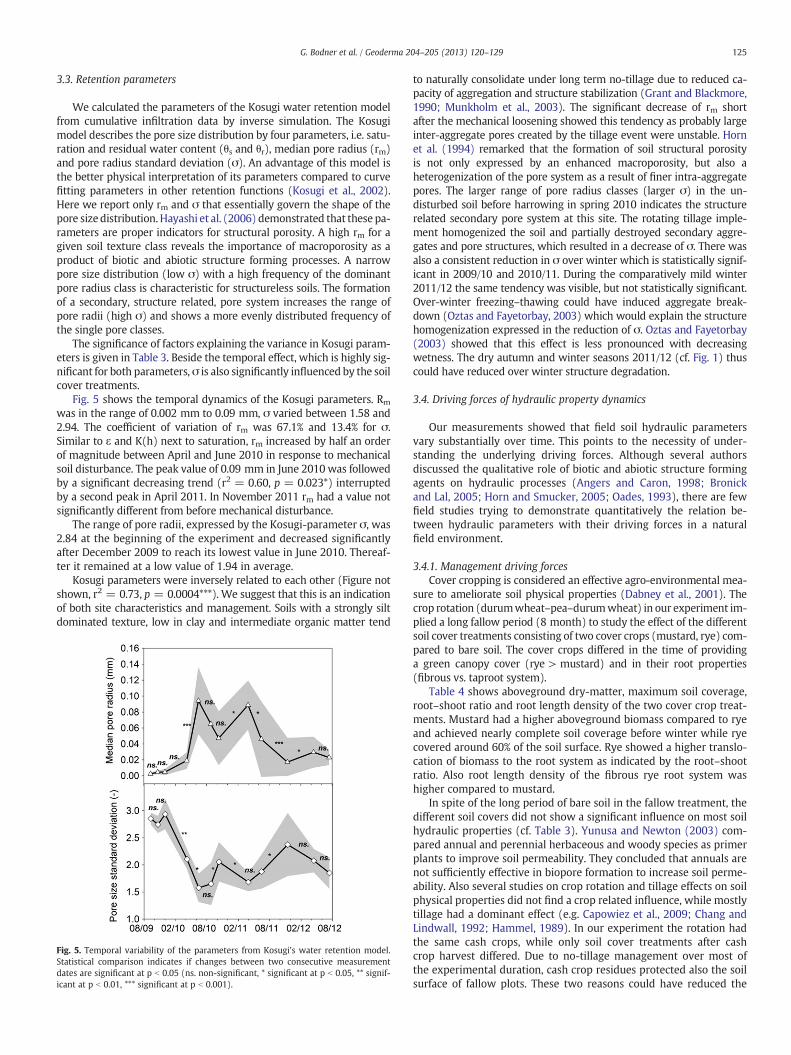
We calculated the parameters of the Kosugi water retention modelfrom cumulative infiltration data by inverse simulation. The Kosugimodel describes the pore size distribution by four parameters, i.e. satu-ration and residual water content (θs and θr), median pore radius (rm)and pore radius standard deviation (σ). An advantage of this model isthe better physical interpretation of its parameters compared to curvefitting parameters in other retention functions (Kosugi et al., 2002).Here we report only rm and σ that essentially govern the shape of thepore size distribution. Hayashi et al. (2006) demonstrated that these pa-rameters are proper indicators for structural porosity. A high rm for agiven soil texture class reveals the importance of macroporosity as aproduct of biotic and abiotic structure forming processes. A narrowpore size distribution (low σ) with a high frequency of the dominantpore radius class is characteristic for structureless soils. The formationof a secondary, structure related, pore system increases the range ofpore radii (high σ) and shows a more evenly distributed frequency ofthe single pore classes.
The significance of factors explaining the variance in Kosugi param-eters is given in Table 3. Beside the temporal effect, which is highly sig-nificant for both parameters, σ is also significantly influenced by the soilcover treatments.
Fig. 5 shows the temporal dynamics of the Kosugi parameters. Rm
was in the range of 0.002 mm to 0.09 mm, σ varied between 1.58 and2.94. The coefficient of variation of rm was 67.1% and 13.4% for σ.Similar to ε and K(h) next to saturation, rm increased by half an orderof magnitude between April and June 2010 in response to mechanicalsoil disturbance. The peak value of 0.09 mm in June 2010 was followedby a significant decreasing trend (r2 = 0.60, p = 0.023*) interruptedby a second peak in April 2011. In November 2011 rm had a value notsignificantly different from before mechanical disturbance.
The range of pore radii, expressed by the Kosugi-parameter σ, was2.84 at the beginning of the experiment and decreased significantlyafter December 2009 to reach its lowest value in June 2010. Thereaf-ter it remained at a low value of 1.94 in average.
Kosugi parameters were inversely related to each other (Figure notshown, r2 = 0.73, p = 0.0004***). We suggest that this is an indicationof both site characteristics and management. Soils with a strongly siltdominated texture, low in clay and intermediate organic matter tend
Fig. 5. Temporal variability of the parameters from Kosugi's water retention model.Statistical comparison indicates if changes between two consecutive measurementdates are significant at p b 0.05 (ns. non-significant, * significant at p b 0.05, ** signif-icant at p b 0.01, *** significant at p b 0.001).
to naturally consolidate under long term no-tillage due to reduced ca-pacity of aggregation and structure stabilization (Grant and Blackmore,1990; Munkholm et al., 2003). The significant decrease of rm shortafter the mechanical loosening showed this tendency as probably largeinter-aggregate pores created by the tillage event were unstable. Hornet al. (1994) remarked that the formation of soil structural porosityis not only expressed by an enhanced macroporosity, but also aheterogenization of the pore system as a result of finer intra-aggregatepores. The larger range of pore radius classes (larger σ) in the un-disturbed soil before harrowing in spring 2010 indicates the structurerelated secondary pore system at this site. The rotating tillage imple-ment homogenized the soil and partially destroyed secondary aggre-gates and pore structures, which resulted in a decrease of σ. There wasalso a consistent reduction in σ over winter which is statistically signif-icant in 2009/10 and 2010/11. During the comparatively mild winter2011/12 the same tendency was visible, but not statistically significant.Over-winter freezing–thawing could have induced aggregate break-down (Oztas and Fayetorbay, 2003) which would explain the structurehomogenization expressed in the reduction of σ. Oztas and Fayetorbay(2003) showed that this effect is less pronounced with decreasingwetness. The dry autumn and winter seasons 2011/12 (cf. Fig. 1) thuscould have reduced over winter structure degradation.
3.4. Driving forces of hydraulic property dynamics
Our measurements showed that field soil hydraulic parametersvary substantially over time. This points to the necessity of under-standing the underlying driving forces. Although several authorsdiscussed the qualitative role of biotic and abiotic structure formingagents on hydraulic processes (Angers and Caron, 1998; Bronickand Lal, 2005; Horn and Smucker, 2005; Oades, 1993), there are fewfield studies trying to demonstrate quantitatively the relation be-tween hydraulic parameters with their driving forces in a naturalfield environment.
3.4.1. Management driving forcesCover cropping is considered an effective agro-environmental mea-
sure to ameliorate soil physical properties (Dabney et al., 2001). Thecrop rotation (durumwheat–pea–durumwheat) in our experiment im-plied a long fallow period (8 month) to study the effect of the differentsoil cover treatments consisting of two cover crops (mustard, rye) com-pared to bare soil. The cover crops differed in the time of providinga green canopy cover (rye > mustard) and in their root properties(fibrous vs. taproot system).
Table 4 shows aboveground dry-matter, maximum soil coverage,root–shoot ratio and root length density of the two cover crop treat-ments. Mustard had a higher aboveground biomass compared to ryeand achieved nearly complete soil coverage before winter while ryecovered around 60% of the soil surface. Rye showed a higher translo-cation of biomass to the root system as indicated by the root–shootratio. Also root length density of the fibrous rye root system washigher compared to mustard.
In spite of the long period of bare soil in the fallow treatment, thedifferent soil covers did not show a significant influence on most soilhydraulic properties (cf. Table 3). Yunusa and Newton (2003) com-pared annual and perennial herbaceous and woody species as primerplants to improve soil permeability. They concluded that annuals arenot sufficiently effective in biopore formation to increase soil perme-ability. Also several studies on crop rotation and tillage effects on soilphysical properties did not find a crop related influence, while mostlytillage had a dominant effect (e.g. Capowiez et al., 2009; Chang andLindwall, 1992; Hammel, 1989). In our experiment the rotation hadthe same cash crops, while only soil cover treatments after cashcrop harvest differed. Due to no-tillage management over most ofthe experimental duration, cash crop residues protected also the soilsurface of fallow plots. These two reasons could have reduced the
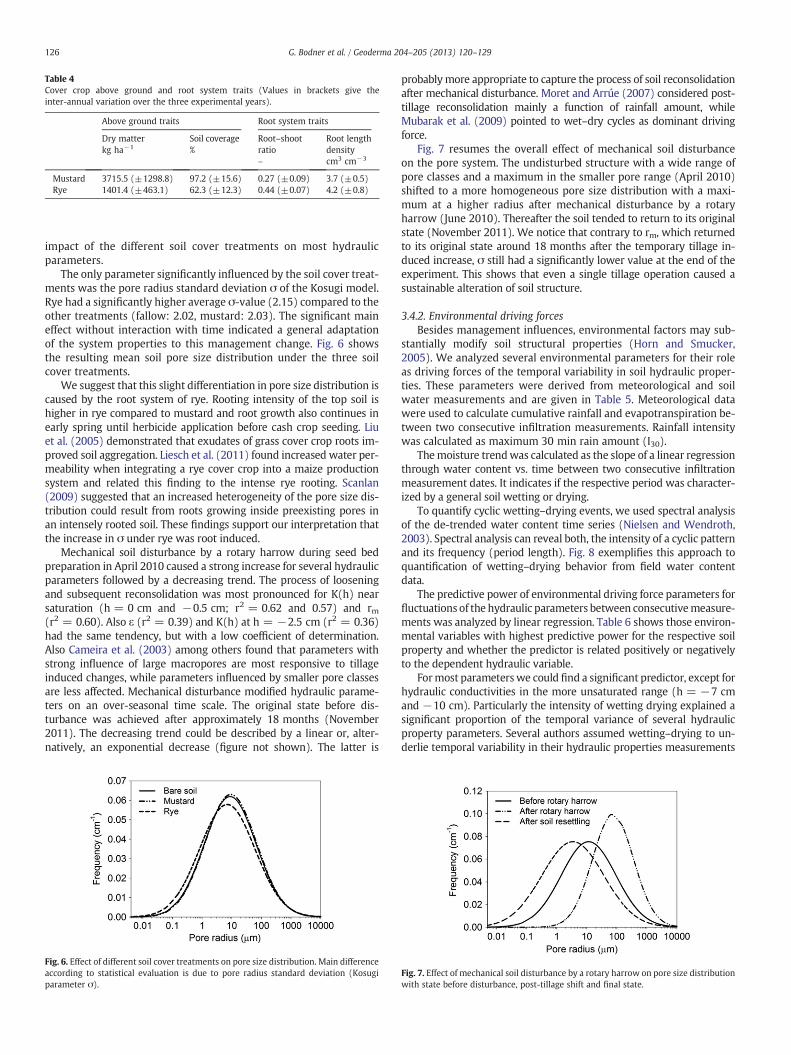
Table 4Cover crop above ground and root system traits (Values in brackets give theinter-annual variation over the three experimental years).
Above ground traits Root system traits
Dry matterkg ha−1
Soil coverage%
Root–shootratio–
Root lengthdensitycm3 cm−3
Mustard 3715.5 (±1298.8) 97.2 (±15.6) 0.27 (±0.09) 3.7 (±0.5)Rye 1401.4 (±463.1) 62.3 (±12.3) 0.44 (±0.07) 4.2 (±0.8)
126 G. Bodner et al. / Geoderma 204–205 (2013) 120–129
impact of the different soil cover treatments on most hydraulicparameters.
The only parameter significantly influenced by the soil cover treat-ments was the pore radius standard deviation σ of the Kosugi model.Rye had a significantly higher average σ-value (2.15) compared to theother treatments (fallow: 2.02, mustard: 2.03). The significant maineffect without interaction with time indicated a general adaptationof the system properties to this management change. Fig. 6 showsthe resulting mean soil pore size distribution under the three soilcover treatments.
We suggest that this slight differentiation in pore size distribution iscaused by the root system of rye. Rooting intensity of the top soil ishigher in rye compared to mustard and root growth also continues inearly spring until herbicide application before cash crop seeding. Liuet al. (2005) demonstrated that exudates of grass cover crop roots im-proved soil aggregation. Liesch et al. (2011) found increased water per-meability when integrating a rye cover crop into a maize productionsystem and related this finding to the intense rye rooting. Scanlan(2009) suggested that an increased heterogeneity of the pore size dis-tribution could result from roots growing inside preexisting pores inan intensely rooted soil. These findings support our interpretation thatthe increase in σ under rye was root induced.
Mechanical soil disturbance by a rotary harrow during seed bedpreparation in April 2010 caused a strong increase for several hydraulicparameters followed by a decreasing trend. The process of looseningand subsequent reconsolidation was most pronounced for K(h) nearsaturation (h = 0 cm and −0.5 cm; r2 = 0.62 and 0.57) and rm(r2 = 0.60). Also ε (r2 = 0.39) and K(h) at h = −2.5 cm (r2 = 0.36)had the same tendency, but with a low coefficient of determination.Also Cameira et al. (2003) among others found that parameters withstrong influence of large macropores are most responsive to tillageinduced changes, while parameters influenced by smaller pore classesare less affected. Mechanical disturbance modified hydraulic parame-ters on an over-seasonal time scale. The original state before dis-turbance was achieved after approximately 18 months (November2011). The decreasing trend could be described by a linear or, alter-natively, an exponential decrease (figure not shown). The latter is
Fig. 6. Effect of different soil cover treatments on pore size distribution. Main differenceaccording to statistical evaluation is due to pore radius standard deviation (Kosugiparameter σ).
probablymore appropriate to capture the process of soil reconsolidationafter mechanical disturbance. Moret and Arrúe (2007) considered post-tillage reconsolidation mainly a function of rainfall amount, whileMubarak et al. (2009) pointed to wet–dry cycles as dominant drivingforce.
Fig. 7 resumes the overall effect of mechanical soil disturbanceon the pore system. The undisturbed structure with a wide range ofpore classes and a maximum in the smaller pore range (April 2010)shifted to a more homogeneous pore size distribution with a maxi-mum at a higher radius after mechanical disturbance by a rotaryharrow (June 2010). Thereafter the soil tended to return to its originalstate (November 2011). We notice that contrary to rm, which returnedto its original state around 18 months after the temporary tillage in-duced increase, σ still had a significantly lower value at the end of theexperiment. This shows that even a single tillage operation caused asustainable alteration of soil structure.
3.4.2. Environmental driving forcesBesides management influences, environmental factors may sub-
stantially modify soil structural properties (Horn and Smucker,2005). We analyzed several environmental parameters for their roleas driving forces of the temporal variability in soil hydraulic proper-ties. These parameters were derived from meteorological and soilwater measurements and are given in Table 5. Meteorological datawere used to calculate cumulative rainfall and evapotranspiration be-tween two consecutive infiltration measurements. Rainfall intensitywas calculated as maximum 30 min rain amount (I30).
Themoisture trendwas calculated as the slope of a linear regressionthrough water content vs. time between two consecutive infiltrationmeasurement dates. It indicates if the respective period was character-ized by a general soil wetting or drying.
To quantify cyclic wetting–drying events, we used spectral analysisof the de-trended water content time series (Nielsen and Wendroth,2003). Spectral analysis can reveal both, the intensity of a cyclic patternand its frequency (period length). Fig. 8 exemplifies this approach toquantification of wetting–drying behavior from field water contentdata.
The predictive power of environmental driving force parameters forfluctuations of the hydraulic parameters between consecutivemeasure-ments was analyzed by linear regression. Table 6 shows those environ-mental variables with highest predictive power for the respective soilproperty and whether the predictor is related positively or negativelyto the dependent hydraulic variable.
Formost parameterswe could find a significant predictor, except forhydraulic conductivities in the more unsaturated range (h = −7 cmand −10 cm). Particularly the intensity of wetting drying explained asignificant proportion of the temporal variance of several hydraulicproperty parameters. Several authors assumed wetting–drying to un-derlie temporal variability in their hydraulic properties measurements
Fig. 7. Effect of mechanical soil disturbance by a rotary harrow on pore size distributionwith state before disturbance, post-tillage shift and final state.
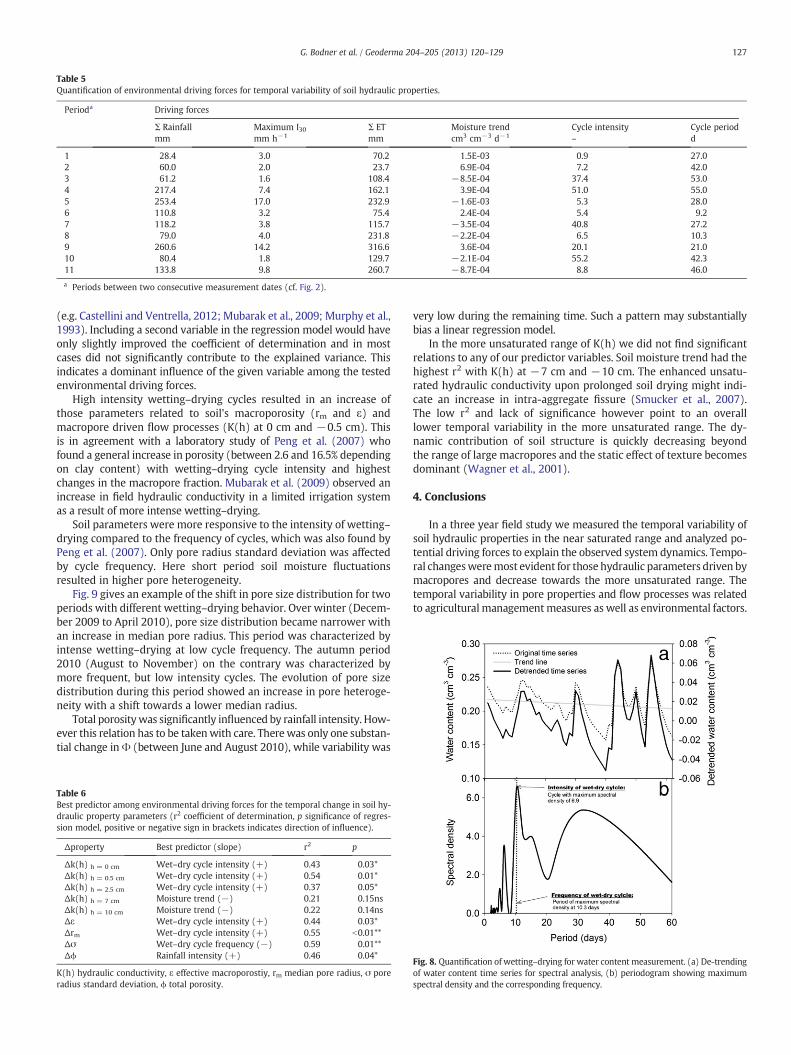
Table 5Quantification of environmental driving forces for temporal variability of soil hydraulic properties.
Perioda Driving forces
Σ Rainfallmm
Maximum I30mm h−1
Σ ETmm
Moisture trendcm3 cm−3 d−1
Cycle intensity–
Cycle periodd
1 28.4 3.0 70.2 1.5E-03 0.9 27.02 60.0 2.0 23.7 6.9E-04 7.2 42.03 61.2 1.6 108.4 −8.5E-04 37.4 53.04 217.4 7.4 162.1 3.9E-04 51.0 55.05 253.4 17.0 232.9 −1.6E-03 5.3 28.06 110.8 3.2 75.4 2.4E-04 5.4 9.27 118.2 3.8 115.7 −3.5E-04 40.8 27.28 79.0 4.0 231.8 −2.2E-04 6.5 10.39 260.6 14.2 316.6 3.6E-04 20.1 21.010 80.4 1.8 129.7 −2.1E-04 55.2 42.311 133.8 9.8 260.7 −8.7E-04 8.8 46.0
a Periods between two consecutive measurement dates (cf. Fig. 2).
127G. Bodner et al. / Geoderma 204–205 (2013) 120–129
(e.g. Castellini and Ventrella, 2012; Mubarak et al., 2009; Murphy et al.,1993). Including a second variable in the regression model would haveonly slightly improved the coefficient of determination and in mostcases did not significantly contribute to the explained variance. Thisindicates a dominant influence of the given variable among the testedenvironmental driving forces.
High intensity wetting–drying cycles resulted in an increase ofthose parameters related to soil's macroporosity (rm and ε) andmacropore driven flow processes (K(h) at 0 cm and −0.5 cm). Thisis in agreement with a laboratory study of Peng et al. (2007) whofound a general increase in porosity (between 2.6 and 16.5% dependingon clay content) with wetting–drying cycle intensity and highestchanges in the macropore fraction. Mubarak et al. (2009) observed anincrease in field hydraulic conductivity in a limited irrigation systemas a result of more intense wetting–drying.
Soil parameters were more responsive to the intensity of wetting–drying compared to the frequency of cycles, which was also found byPeng et al. (2007). Only pore radius standard deviation was affectedby cycle frequency. Here short period soil moisture fluctuationsresulted in higher pore heterogeneity.
Fig. 9 gives an example of the shift in pore size distribution for twoperiods with different wetting–drying behavior. Over winter (Decem-ber 2009 to April 2010), pore size distribution became narrower withan increase in median pore radius. This period was characterized byintense wetting–drying at low cycle frequency. The autumn period2010 (August to November) on the contrary was characterized bymore frequent, but low intensity cycles. The evolution of pore sizedistribution during this period showed an increase in pore heteroge-neity with a shift towards a lower median radius.
Total porositywas significantly influenced by rainfall intensity. How-ever this relation has to be takenwith care. Therewas only one substan-tial change inΦ (between June and August 2010), while variability was
Table 6Best predictor among environmental driving forces for the temporal change in soil hy-draulic property parameters (r2 coefficient of determination, p significance of regres-sion model, positive or negative sign in brackets indicates direction of influence).
Δproperty Best predictor (slope) r2 p
Δk(h) h = 0 cm Wet–dry cycle intensity (+) 0.43 0.03*Δk(h) h = 0.5 cm Wet–dry cycle intensity (+) 0.54 0.01*Δk(h) h = 2.5 cm Wet–dry cycle intensity (+) 0.37 0.05*Δk(h) h = 7 cm Moisture trend (−) 0.21 0.15nsΔk(h) h = 10 cm Moisture trend (−) 0.22 0.14nsΔε Wet–dry cycle intensity (+) 0.44 0.03*Δrm Wet–dry cycle intensity (+) 0.55 b0.01**Δσ Wet–dry cycle frequency (−) 0.59 0.01**Δϕ Rainfall intensity (+) 0.46 0.04*
K(h) hydraulic conductivity, ε effective macroporostiy, rm median pore radius, σ poreradius standard deviation, ϕ total porosity.
very low during the remaining time. Such a pattern may substantiallybias a linear regression model.
In the more unsaturated range of K(h) we did not find significantrelations to any of our predictor variables. Soil moisture trend had thehighest r2 with K(h) at −7 cm and −10 cm. The enhanced unsatu-rated hydraulic conductivity upon prolonged soil drying might indi-cate an increase in intra-aggregate fissure (Smucker et al., 2007).The low r2 and lack of significance however point to an overalllower temporal variability in the more unsaturated range. The dy-namic contribution of soil structure is quickly decreasing beyondthe range of large macropores and the static effect of texture becomesdominant (Wagner et al., 2001).
4. Conclusions
In a three year field study we measured the temporal variability ofsoil hydraulic properties in the near saturated range and analyzed po-tential driving forces to explain the observed system dynamics. Tempo-ral changesweremost evident for those hydraulic parameters driven bymacropores and decrease towards the more unsaturated range. Thetemporal variability in pore properties and flow processes was relatedto agricultural managementmeasures as well as environmental factors.
Fig. 8. Quantification of wetting–drying for water content measurement. (a) De-trendingof water content time series for spectral analysis, (b) periodogram showing maximumspectral density and the corresponding frequency.

Fig. 9. Pore size evolution at two periods with different wetting–drying pattern. Periodogram with cyclic pattern in the respective period is shown in the left corner (high intensityand lower frequency cycles left; high frequency and lower intensity cycles right).
128 G. Bodner et al. / Geoderma 204–205 (2013) 120–129
The distinct driving forces induced changes at different time scales. Achange in crop rotation by integrating different soil cover treatmentsduring the post-harvest fallow period led to an average system adapta-tion with different frequency distributions of pore radius classes. Thewinter hard, intensely rooted rye cover crop increased pore heteroge-neity, indicating an enhanced soil structure formation. Still the overallimpact of the plant based measure was substantially less compared toamechanical soil disturbance. A single seedbed preparationwith a rota-ry harrow significantly changed structural porosity on an over-seasonaltime scale. Mechanical soil loosening increased macroporosity and hy-draulic conductivity next to saturation, while it homogenized the poreradius frequency distribution. The effect of mechanical loosening lastedover 18 months until the soil returned to its original state in most hy-draulic parameters.
Short term variability was found in all hydraulic properties and wasmore pronounced for parameters expressing macropore dynamics. Themacropore range was mainly influenced by intense wetting–dryingcycles. In the more unsaturated range periods of prolonged soil dryingresulted in a temporal increase in hydraulic conductivity. Ourfieldmea-surements confirmed the dominant role of wetting–drying intensity forsoil pore evolution.
The study shows the necessity to consider time dependence in hy-draulic functions when modeling water flow processes under fieldconditions. While post-tillage trends in hydraulic properties could beapproximated by an exponential decay functions, spectral analysisallowed a quantification of field wetting–drying behavior to be usedas predictor variable for describing short term fluctuations in hydraulicfunctions. A major challenge remains capturing the causal factors of aplant based management measure on soil structural porosity. Furtherresearch of root–soil interactions is required to advance our under-standing in this field and define applicable management solutions.
Acknowledgment
The present study was funded by the Austrian Science Foundation(FWF) by grant number P 21836-B16. The authors are grateful for thefinancial support provided to their work.
References
Angers, D.A., Caron, J., 1998. Plant-induced changes in soil structure: processes andfeedbacks. Biogeochemistry 42, 55–72.
Angulo-Jaramillo, R., Moreno, F., Clothier, B.E., Thony, J.L., Vachaud, G., Fernandez-Boy,E., Cayuela, J.A., 1997. Seasonal variation of hydraulic properties of soils measuredusing a tension disk infiltrometer. Soil Science Society of America Journal 61,27–32.
Ankeny, M.D., Ahmed, M., Kaspar, T.C., Horton, R., 1991. Simple field method for deter-mining unsaturated hydraulic conductivity. Soil Science Society of America Journal55, 467–470.
Blanco-Canqui, H., Lal, R., Post, W.M., Izaurralde, R.C., Owens, L.B., 2006. Corn stoverimpacts on near-surface soil properties of no-till corn in Ohio. Soil Science Societyof America Journal 70, 266–278.
Blum, W.E.H., Warkentin, B.P., Frossard, E., 2006. Soil, human society and the environ-ment. Geological Society, London, Special Publications 266, 1–8.
Bodhinayake, W., Si, B.C., Xiao, C.J., 2004. Newmethod for determining water-conductingmacro- and mesoporosity from tension infiltrometer. Soil Science Society of AmericaJournal 68, 760–769.
Bodner, G., Loiskandl, W., Buchan, G., Kaul, H.-P., 2008. Natural and management-induced dynamics of hydraulic conductivity along a cover-cropped field slope.Geoderma 146, 317–325.
Bronick, C.J., Lal, R., 2005. Soil structure and management: a review. Geoderma 124, 3–22.Buczko, U., Bens, O., Huttl, R.E., 2006. Tillage effects on hydraulic properties and
macroporosity in silty and sandy soils. Soil Science Society of America Journal 70,1998–2007.
Cameira, M.R., Fernando, R.M., Pereira, L.S., 2003. Soil macropore dynamics affected bytillage and irrigation for a silty loam alluvial soil in southern Portugal. Soil and Till-age Research 70, 131–140.
Capowiez, Y., Cadoux, S., Bouchant, P., Ruy, S., Estrade, J.R., Richard, G., Boizard, H.,2009. The effect of tillage type and cropping system on earthworm communities,macroporosity and water infiltration. Soil and Tillage Research 105, 209–216.
Carof, M., De Tourdonnet, S., Coquet, Y., Hallaire, V., Roger-Estrade, J., 2007. Hydraulicconductivity and porosity under conventional and no-tillage and the effect ofthree species of cover crop in northern France. Soil Use and Management 23,230–237.
Castellini, M., Ventrella, D., 2012. Impact of conventional and minimum tillage on soilhydraulic conductivity in typical cropping system in Southern Italy. Soil and TillageResearch 124, 47–56.
Chang, C., Lindwall, C.W., 1992. Effects of tillage and crop rotation on physical proper-ties of a loam soil. Soil and Tillage Research 22, 383–389.
Ciollaro, G., Lamaddalena, N., 1998. Effect of tillage on the hydraulic properties of avertic soil. Journal of Agricultural Engineering Research 71, 147–155.
Cresswell, H.P., Smiles, D.E., Williams, J., 1992. Soil structure, soil hydraulic propertiesand the soil water balance. Australian Journal of Soil Research 30, 265–283.
Czarnes, S., Hallett, P.D., Bengough, A.G., Young, I.M., 2000. Root- and microbial-derivedmucilages affect soil structure and water transport. European Journal of Soil Science51, 435–443.
Dabney, S.M., Delgado, J.A., Reeves, D.W., 2001. Using winter cover crops to improvesoil and water quality. Communications in Soil Science and Plant 32, 1221–1250.
Daraghmeh, O.A., Jensen, J.R., Petersen, C.T., 2008. Near-saturated hydraulic propertiesin the surface layer of a sandy loam soil under conventional and reduced tillage.Soil Science Society of America Journal 72, 1728–1737.
Feeney, D., Daniell, T.J., Hallett, P.D., Ritz, K., Young, I.M., 2004. Fungi and root inducedmeso- and microscale soil structural changes. Eurosoil 2004. Proceedings, Freiburg(2004).
Folorunso, O.A., Rolston, D.E., Prichard, T., Loui, D.T., 1992. Soil surface strength and in-filtration as affected by winter cover crops. Soil Technology 5, 189–197.
Fuentes, J.P., Flury, M., Bezdicek, D.F., 2004. Hydraulic properties in a silt loam soilunder natural prairie, conventional till, and no-till. Soil Science Society of AmericaJournal 68, 1679–1688.
Gardner, W.R., 1958. Some steady-state solutions of the unsaturated moisture flow equa-tion with application to evaporation from a water table. Soil Science 85, 228–231.
Grant, C.D., Blackmore, A.V., 1990. Self mulching behavior in clay soils—its definitionand measurement. Australian Journal of Soil Research 29, 155–173.
Green, T.R., Ahuja, L.R., Benjamin, J.G., 2003. Advances and challenges in predictingagricultural management effects on soil hydraulic properties. Geoderma 116, 3–27.
Gregory, P.J., 2006. Roots, rhizosphere and soil: the route to a better understanding ofsoil science? European Journal of Soil Science 57, 2–12.
Hammel, J.E., 1989. Long-term tillage and crop rotation effects on bulk density and soilimpedance in Northern Idaho. Soil Science Society of America Journal 53, 1515–1519.
Hayashi, Y., Kosugi, K., Mizuyama, T., 2006. Changes in pore size distribution and hy-draulic properties of forest soil resulting from structural development. Journal ofHydrology 331, 85–102.
Horn, R., Smucker, A., 2005. Structure formation and its consequences for gas andwater transport in unsaturated arable and forest soils. Soil and Tillage Research82, 5–14.
Horn, R., Taubner, H., Wuttke, M., Baumgartl, T., 1994. Soil physical properties relatedto soil structure. Soil and Tillage Research 30, 187–216.
129G. Bodner et al. / Geoderma 204–205 (2013) 120–129
IUSS, 2007. World Reference Base for Soil Resources. FAO, Rome.Jarvis, N.J., 2007. A review of non-equilibrium water flow and solute transport in soil
macropores: principles, controlling factors and consequences for water quality.European Journal of Soil Science 58, 523–546.
Joyce, B.A., Wallender, W.W., Mitchell, J.P., Huyck, L.M., Temple, S.R., Brostrom, P.N.,Hsiao, T.C., 2002. Infiltration and soil water storage under winter cover croppingin California's Sacramento Valley. Transactions of ASAE 45, 315–326.
Kay, B.D., 1990. Rates of change of soil structure under different cropping systems.Advances in Soil Science 12, 1–52.
Kenward, M.G., Roger, J.H., 1997. Small sample inference for fixed effects from restrictedmaximum likelihood. Biometrics 53, 983–997.
Kosugi, K., 1996. Lognormal distribution model for unsaturated soil hydraulic proper-ties. Water Resources Research 32, 2697.
Kosugi, K., Hopmans, J.W., Dane, J.H., 2002. Parameteric models. In: Dane, J.H., Topp,G.C. (Eds.), Methods of Soil Analysis. Part 4. Physical Methods. Soil Science Societyof America. Inc., Madison, Wisconsin, USA, pp. 739–757.
Kutschera, L., Lichtenegger, E., Sobotik, M., 2009. Wurzelatlas der Kulturpflanzengemäßigter Gebiete mit Arten des Feldgemüsebaues. DLG-Verlag, Frankfurt Main.
Lado, M., Paz, A., Ben-Hur, M., 2004. Organic matter and aggregate-size interactions insaturated hydraulic conductivity. Soil Science Society of America Journal 68,234–242.
Leij, F.J., Ghezzehei, T.A., Or, D., 2002. Modelling the dynamics of the soil pore-size dis-tribution. Soil and Tillage Research 64, 61–78.
Liesch, A.M., Krueger, E.S., Ochsner, T.E., 2011. Soil structure and physical propertiesunder rye–corn silage double-cropping systems. Soil Science Society of AmericaJournal 75, 1307–1314.
Littell, R.C., Henry, P.R., Ammerman, C.B., 1998. Statistical analysis of repeated mea-sures data using SAS procedures. Journal of Animal Science 76, 1216–1231.
Liu, A., Ma, B.L., Bomke, A.A., 2005. Effects of cover crops on soil aggregate stability,total organic carbon, and polysaccharides. Soil Science Society of America Journal69, 2041–2048.
Mapa, R.B., Green, R.E., Santo, L., 1986. Temporal variability of soil hydraulic propertieswith wetting and drying subsequent to tillage. Soil Science Society of America Journal50, 1133–1138.
Messing, I., Jarvis, N.J., 1993. Temporal variation in the hydraulic conductivity of atilled clay soil as measured by tension infiltrometers. Journal of Soil Science 44,11–24.
Moret, D., Arrúe, J.L., 2007. Dynamics of soil hydraulic properties during fallow asaffected by tillage. Soil and Tillage Research 96, 103–113.
Mubarak, I., Mailhol, J.C., Angulo-Jaramillo, R., Ruelle, P., Boivin, P., Khaledian, M., 2009.Temporal variability in soil hydraulic properties under drip irrigation. Geoderma150, 158–165.
Munkholm, L.J., Schjønning, P., Rasmussen, K.J., Tanderup, K., 2003. Spatial and tempo-ral effects of direct drilling on soil structure in the seedling environment. Soil andTillage Research 71, 163–173.
Munkholm, L.J., Heck, R.J., Deen, B., 2013. Long-term rotation and tillage effects on soilstructure and crop yield. Soil and Tillage Research 127, 85–91.
Murphy, B.W., Koen, T.B., Jones, B.A., Huxedurp, L.M., 1993. Temporal variation of hy-draulic properties for some soils with fragile structure. Australian Journal of SoilResearch 31, 179–197.
Nielsen, D.R., Wendroth, O., 2003. Spatial and Temporal Statistics. Sampling Field Soilsand Their Vegetation. Catena publisher, Reiskirchen, Germany.
Oades, J.M., 1993. The role of biology in the formation, stabilization and degradation ofsoil structure. Geoderma 56, 377–400.
Oztas, T., Fayetorbay, F., 2003. Effect of freezing and thawing processes on soil aggre-gate stability. Catena 52, 1–8.
Peng, X., Horn, R., Smucker, A., 2007. Pore shrinkage dependency of inorganic and or-ganic soils on wetting and drying cycles. Soil Science Society of America Journal71, 1095–1103.
Piepho, H.P., Büchse, A., Richter, C., 2004. A mixed modelling approach for randomizedexperiments with repeated measures. Journal of Agronomy and Crop Science 190,230–247.
Rasse, D.P., Smucker, A.J.M., 1998. Root colonization of previous root channels in cornand alfalfa rotations. Plant and Soil 204, 203–212.
Reynolds, W.D., Elrick, D.E., 1991. Determination of hydraulic conductivity using a ten-sion infiltrometer. Soil Science Society of America Journal 55, 633–639.
Reynolds, W.D., Gregorich, E.G., Curnoe, W.E., 1995. Characterization of water trans-mission properties in tilled and untilled soil using tension infiltrometers. Soil andTillage Research 33, 117–131.
Roger-Estrade, J., Richard, G., Boizard, H., Boiffin, J., Caneill, J., Manichon, H., 2000.Modelling structural changes in tilled topsoil over time as a function of croppingsystems. European Journal of Soil Science 2000, 455–474.
Rousseva, S., Torri, D., Pagliai, M., 2002. Effect of rain on the macroporosity at the soilsurface. European Journal of Soil Science 53, 83–94.
Scanlan, C.A., 2009. Processes and Effects of Root-Induced Changes to Soil HydraulicProperties. PhD Thesis at the University of Western Australia School of Earth andEnvironment.
Scanlan, C.A., Hinz, C., 2008. A conceptual model to quantify plant root induced changesin soil hydraulic conductivity and water retention. Geophysical Research Abstracts,vol. 10, pp. EGU2008–A-05854 (EGU General Assembly 2008).
Schaap, M.G., Leij, F.J., van Genuchten, M.T., 2001. ROSETTA: a computer program forestimating soil hydraulic parameters with hierarchical pedotransfer functions.Journal of Hydrology 251, 163–176.
Scheffler, R., Neill, Ch., Krusche, A.V., Elsenbeer, H., 2011. Soil hydraulic response toland-use change associated with the recent soybean expansion at the Amazonagricultural frontier. Agriculture, Ecosystems & Environment 144, 281–289.
Schwärzel, K., Carrick, S., Wahren, A., Feger, K.-H., Bodner, G., Buchan, G.D., 2010. Soilhydraulic properties of recently tilled soil under cropping rotation comparedwith 2-years-pasture: measurement and modelling the soil structure dynamics.Vadose Zone Journal 10, 354–366.
Schwen, A., Bodner, G., Scholl, P., Buchan, G.D., Loiskandl,W., 2011. Temporal dynamics ofsoil hydraulic properties and the water-conducting porosity under different tillage.Soil and Tillage Research 113, 89–98.
Šimůnek, J., van Genuchten, M.T., 1996. Estimating unsaturated soil hydraulic proper-ties from tension disc infiltrometer data by numerical inversion. Water ResourcesResearch 32, 2683–2696.
Šimůnek, J., Angulo-Jaramillo, R., Schaap, M.G., Vandervaere, J.P., van Genuchten, M.T.,1998. Using an inverse method to estimate the hydraulic properties of crusted soilsfrom tension-disc infiltrometer data. Geoderma 86, 61–81.
Šimůnek, J., van Genuchten, M.T., Sejna, M., 2006. The HYDRUS Software Packagefor Simulating the Two- and Three-Dimensional Movement of Water, Heat, andMultiple Solutes in Variably-Saturated Media. Prague, Czech Republic, TechnicalManual PC Progress.
Singh, M.J., Khera, K.L., Santra, P., 2012. Selection of soil physical quality indicators inrelation to soil erodibility. Archives of Agronomy and Soil Science 58, 657–672.
Smucker, A.J.M., Park, E.-L., Dorner, J., Horn, R., 2007. Soil micropore development andcontributions to soluble carbon transport within macroaggregates. Vadose ZoneJournal 6, 282–290.
Snyder, V.A., Rivadeneira, J., Lugo, H.M., 2000. Temporal changes in soil structure andhydraulic properties in the plow layer of an oxisol following tillage. Advances inGeoecology 32, 314–324.
Stange, F.C., Horn, R., 2005. Modeling the soil water retention curve for conditions ofvariable porosity. Vadose Zone Journal 4, 602–613.
Strudley, M.W., Green, T.R., Ascough, J.C., 2008. Tillage effects on soil hydraulic proper-ties in space and time: state of the science. Soil and Tillage Research 99, 4–48.
Van Es, H.M., Ogden, C.B., Hill, R.L., Schindelbeck, R.R., Tsegaye, T., 1999. Integratedassessment of space, time, and management-related variability of soil hydraulicproperties. Soil Science Society of America Journal 63, 1599–1608.
Wagner, B., Tarnawski, V.R., Hennings, V., Müller, U., Wessolek, G., Plagge, R., 2001.Evaluation of pedo-transfer functions for unsaturated soil hydraulic conductivityusing an independent data set. Geoderma 102, 275–297.
Whalley, W.R., Leeds-Harrison, P.B., Leech, P.K., Riseley, B., Bird, N.R.A., 2004. The hy-draulic properties of soil at root-soil interface. Soil Science 169, 90–99.
Williams, S.M., Weil, R.R., 2004. Crop cover roots may alleviate of soil compactioneffects on soybean crop. Soil Science Society of America Journal 68, 1403–1409.
Wooding, R.A., 1968. Steady infiltration from a shallow circular pond. Water ResourcesResearch 4, 1259–1273.
Wright, S.F., Starr, J.L., Paltineanu, I.C., 1999. Changes in aggregate stability and concen-tration of glomalin during tillage management transition. Soil Science Society ofAmerica Journal 63, 1825–1829.
Yunusa, I.A.M., Newton, P.J., 2003. Plants for amelioration of subsoil constraints and hy-drological control: the primer-plant concept. Plant and Soil 257, 261–281.