environmental and exploration geophysics ii
DESCRIPTION
Environmental and Exploration Geophysics II. Amplitude, Frequency and Bandwidth and their relationship to Seismic Resolution (part 2). tom.h.wilson [email protected]. Department of Geology and Geography West Virginia University Morgantown, WV. - PowerPoint PPT PresentationTRANSCRIPT
Environmental and Exploration Geophysics II
Department of Geology and GeographyWest Virginia University
Morgantown, WV
Amplitude, Frequency and Amplitude, Frequency and Bandwidth and their Bandwidth and their
relationship to Seismic relationship to Seismic Resolution (part 2)Resolution (part 2)
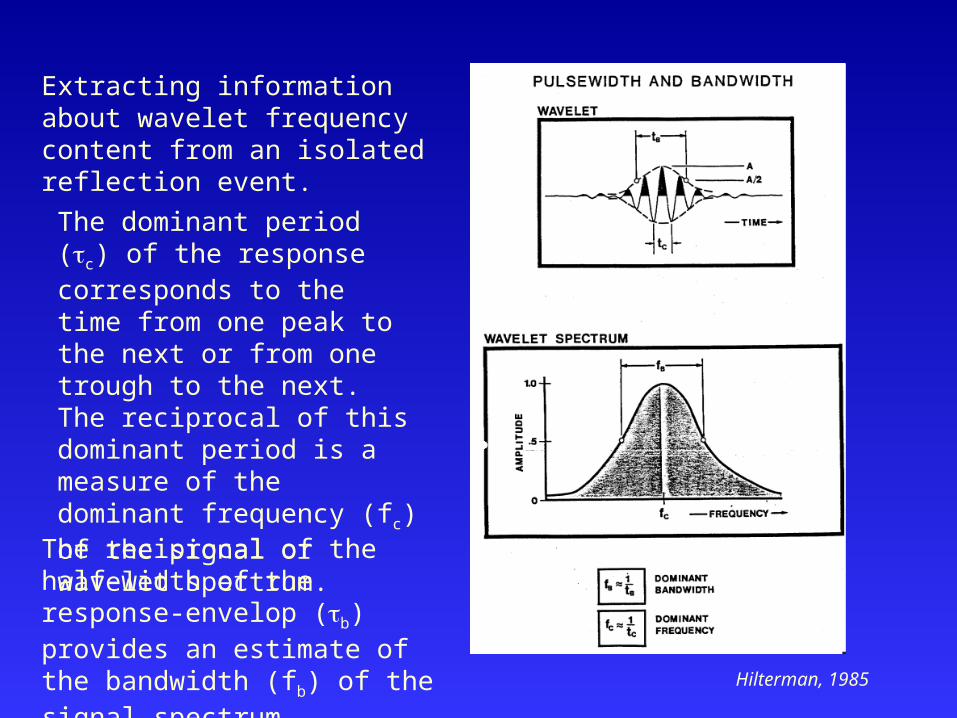
Extracting information about wavelet frequency content from an isolated reflection event.
The dominant period (c) of the response corresponds to the time from one peak to the next or from one trough to the next. The reciprocal of this dominant period is a measure of the dominant frequency (fc) of the signal or wavelet spectrum.
The reciprocal of the half-width of the response-envelop (b) provides an estimate of the bandwidth (fb) of the signal spectrum. Hilterman,
1985

The dominant frequency and bandwidth measured from the time-domain representation of the signal wavelet can be used to provide a sketch of the wavelet spectrum.
Just as importantly these measures can be related directly to the resolution properties of the seismic wavelet.Hilterman,
1985
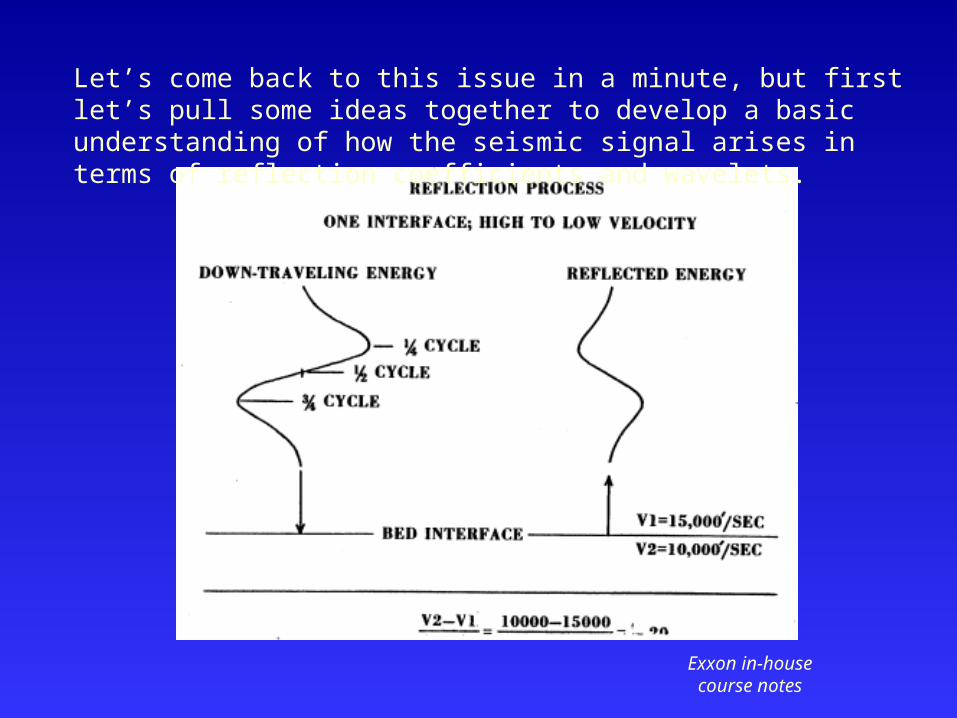
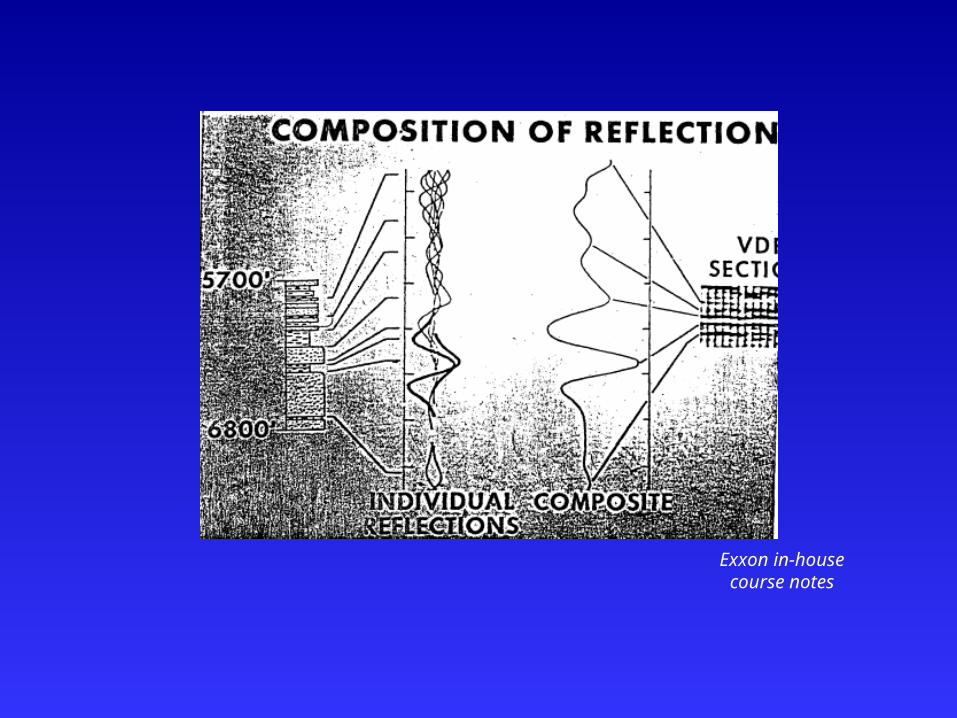
Let’s come back to this issue in a minute, but first let’s pull some ideas together to develop a basic understanding of how the seismic signal arises in terms of reflection coefficients and wavelets.
Exxon in-house course
notes

Exxon in-house course
notes
Exxon in-house course
notes
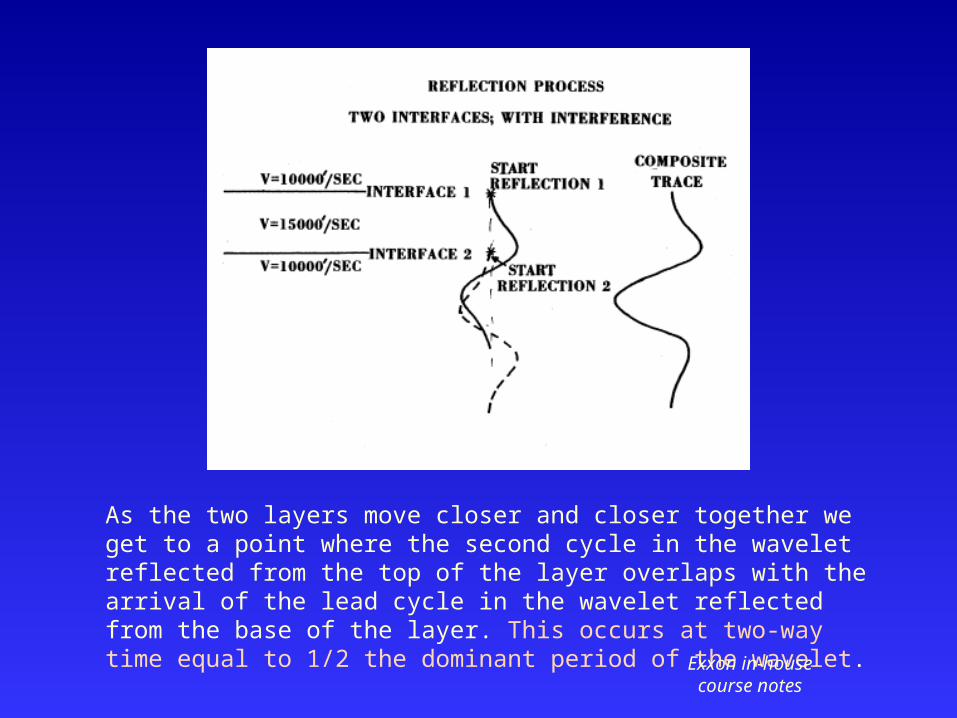
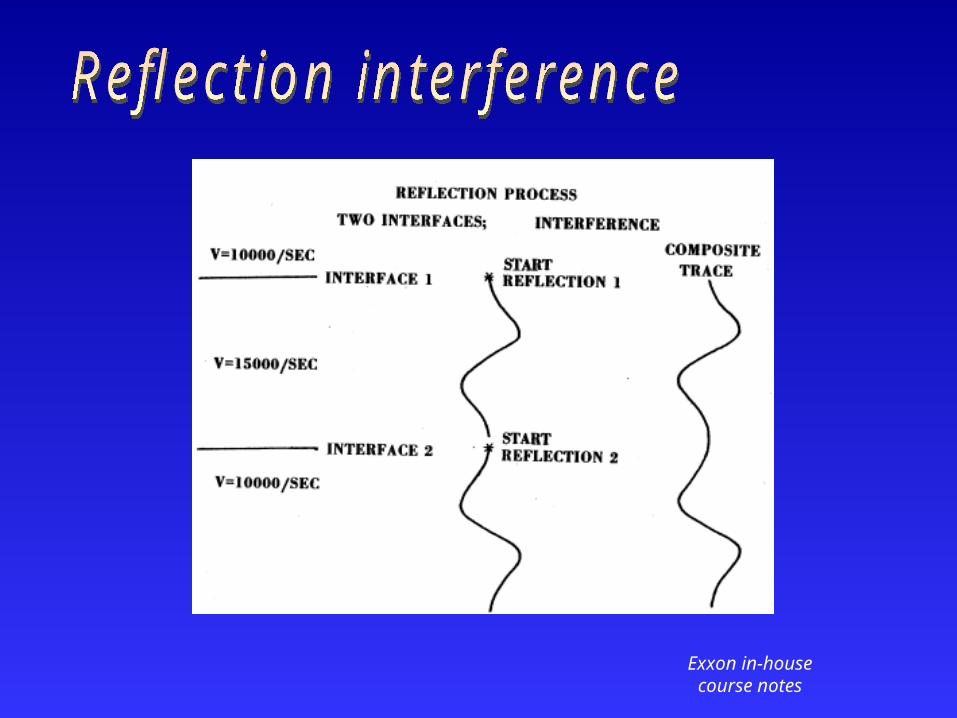
As the two layers move closer and closer together we get to a point where the second cycle in the wavelet reflected from the top of the layer overlaps with the arrival of the lead cycle in the wavelet reflected from the base of the layer. This occurs at two-way time equal to 1/2 the dominant period of the wavelet.
Exxon in-house course
notes
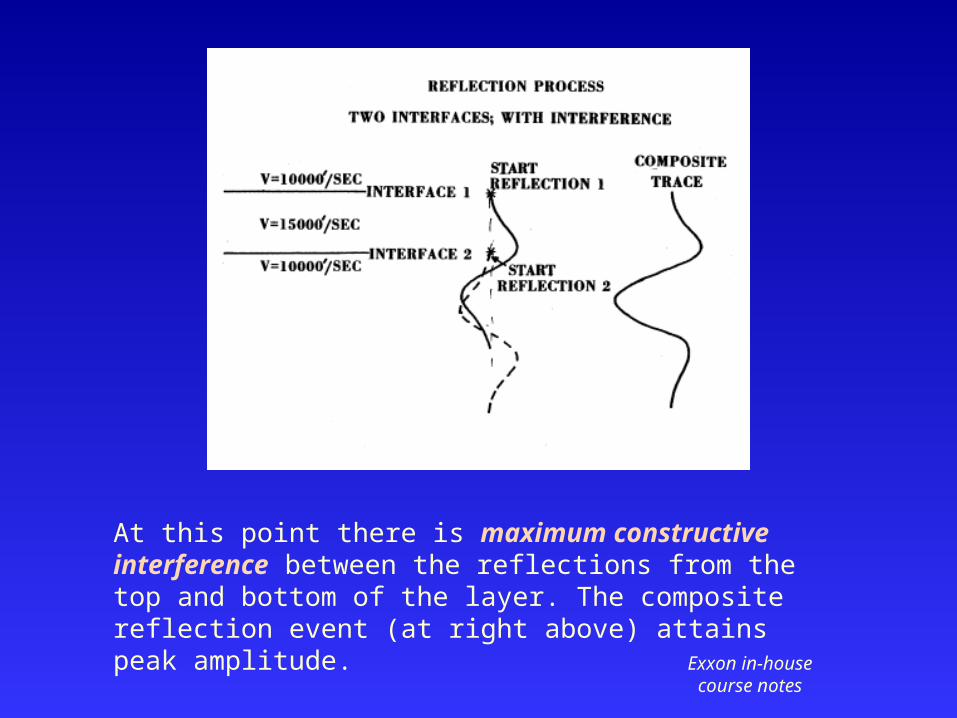
At this point there is maximum constructive interference between the reflections from the top and bottom of the layer. The composite reflection event (at right above) attains peak amplitude.
Exxon in-house course
notes
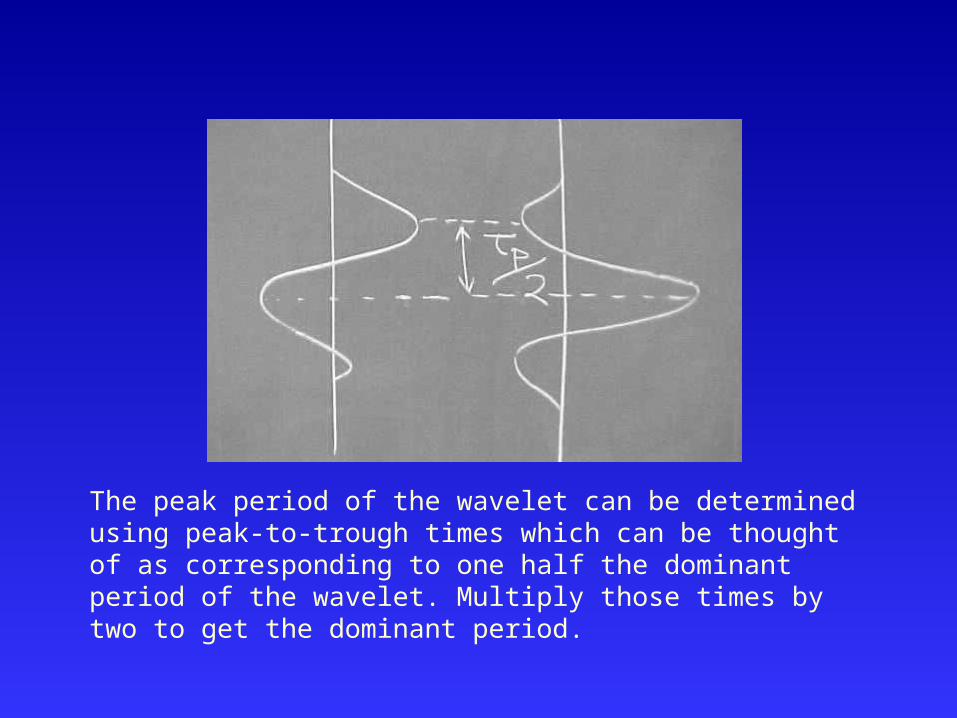
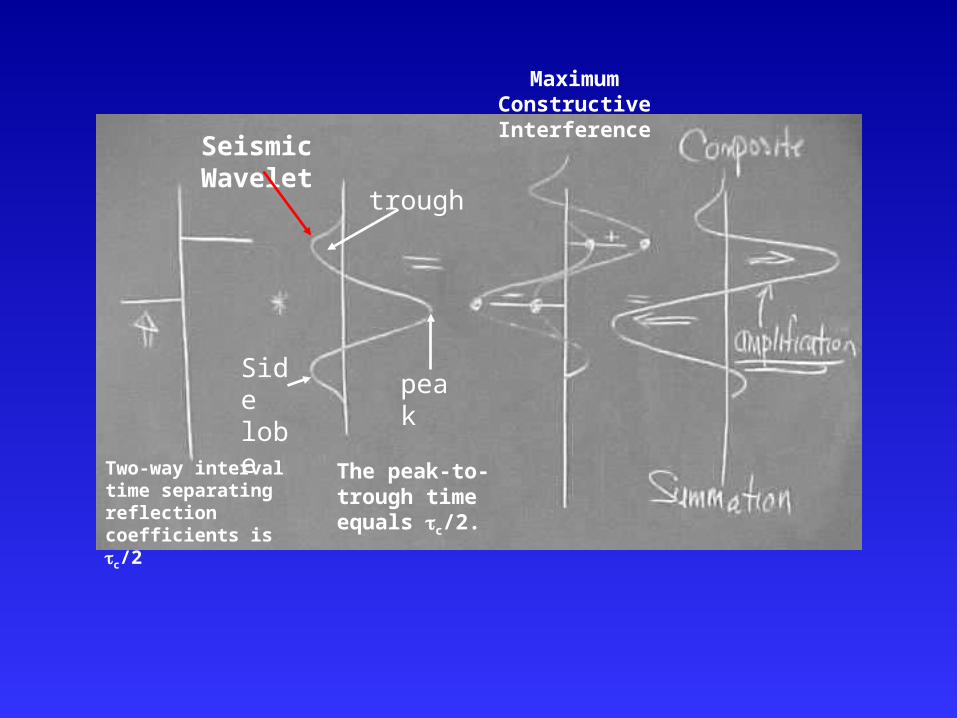
The peak period of the wavelet can be determined using peak-to-trough times which can be thought of as corresponding to one half the dominant period of the wavelet. Multiply those times by two to get the dominant period.
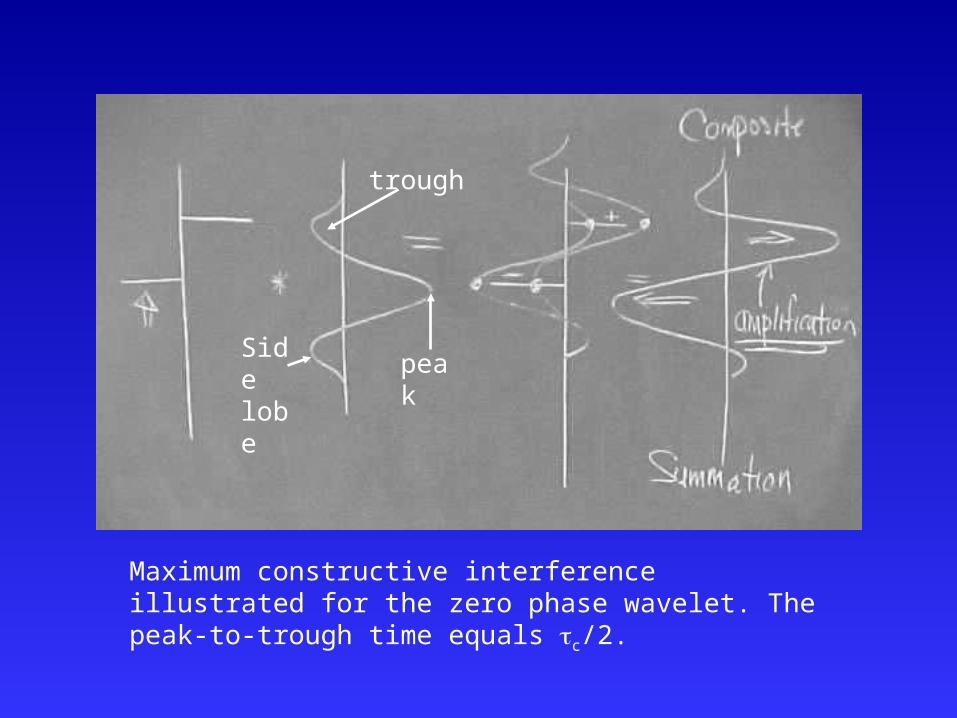
Maximum constructive interference illustrated for the zero phase wavelet. The peak-to-trough time equals c/2.
Side lobe
trough
peak
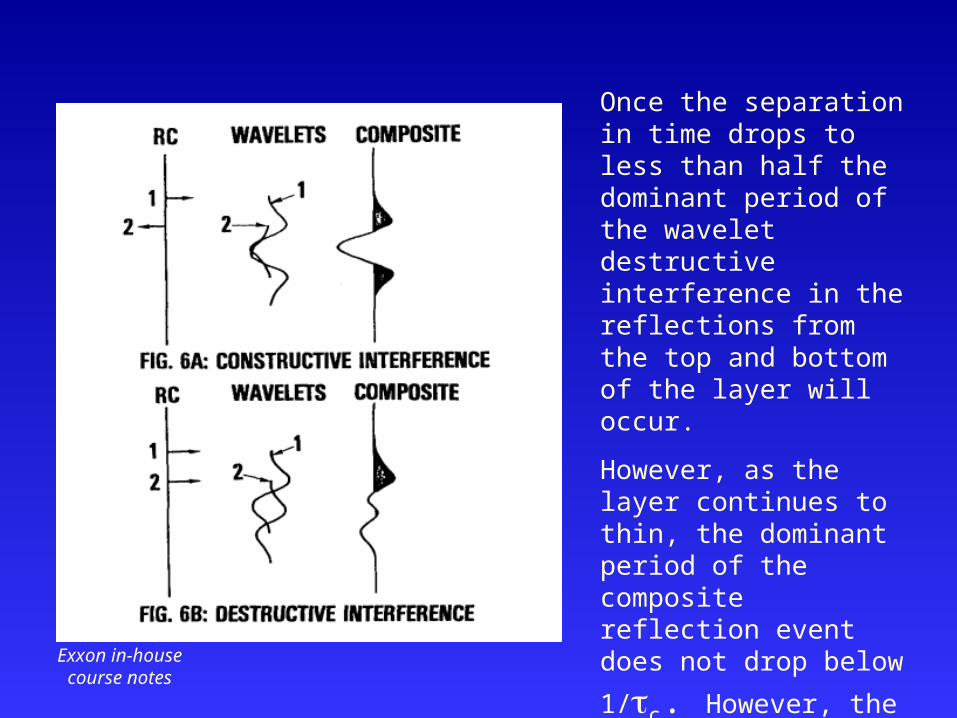
Once the separation in time drops to less than half the dominant period of the wavelet destructive interference in the reflections from the top and bottom of the layer will occur.
However, as the layer continues to thin, the dominant period of the composite reflection event does not drop
below 1/c. However,
the amplitude of the composite continues to drop. But not the period.
Exxon in-house course
notes
The peak-to-trough time equals c/2.
Side lobe
trough
peak
Seismic Wavelet
Maximum Constructive Interference
Two-way interval time separating reflection coefficients is c/2

These amplitude relationships are summarized below in the model seismic response of a thinning layer similar to that which you will generate in lab today.
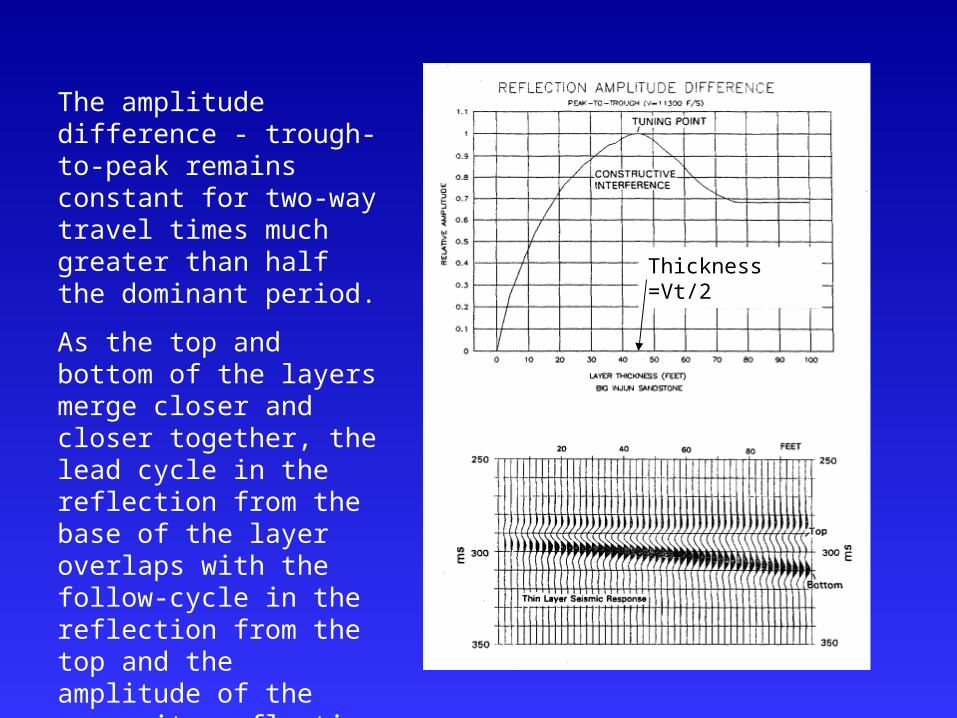
The amplitude difference - trough-to-peak remains constant for two-way travel times much greater than half the dominant period.
As the top and bottom of the layers merge closer and closer together, the lead cycle in the reflection from the base of the layer overlaps with the follow-cycle in the reflection from the top and the amplitude of the composite reflection event begins to increase.
Thickness =Vt/2
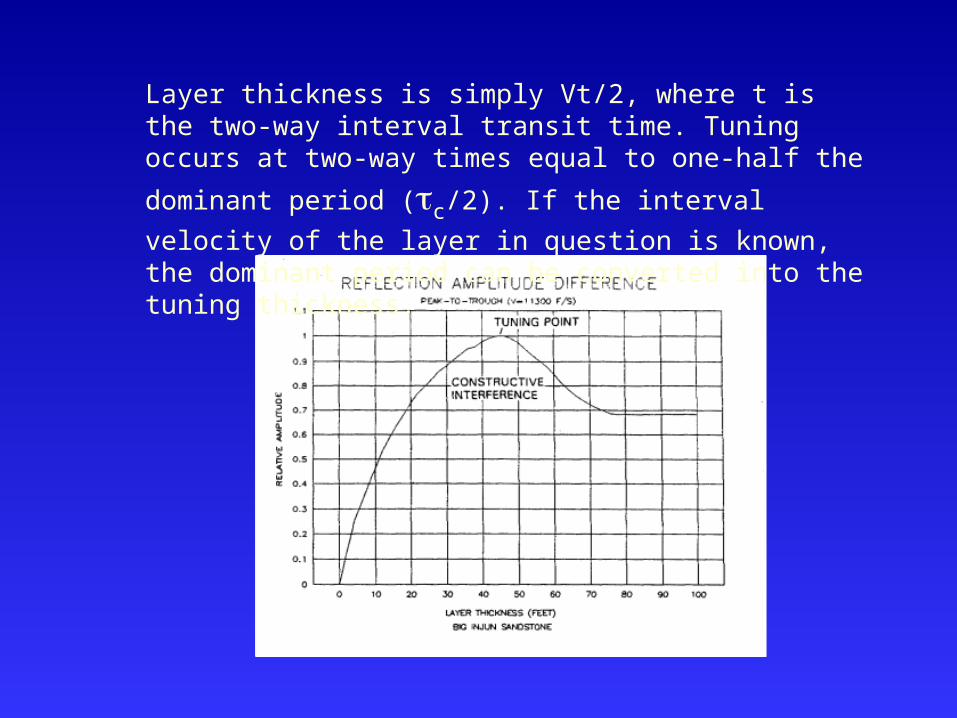
Layer thickness is simply Vt/2, where t is the two-way interval transit time. Tuning occurs at two-way times
equal to one-half the dominant period (c/2). If the
interval velocity of the layer in question is known, the dominant period can be converted into the tuning thickness.

Difference of arrival time between the reflections from the top and bottom of the layer decreases abruptly at about 8 milliseconds.
8 milliseconds represents the two-way travel time through the layer; it is also the time at which tuning occurs and is half the dominant period of the seismic wavelet.
8 milliseconds is c/2 and the two way time through the layer. Thus, c/4 is the one-way time through the layer.
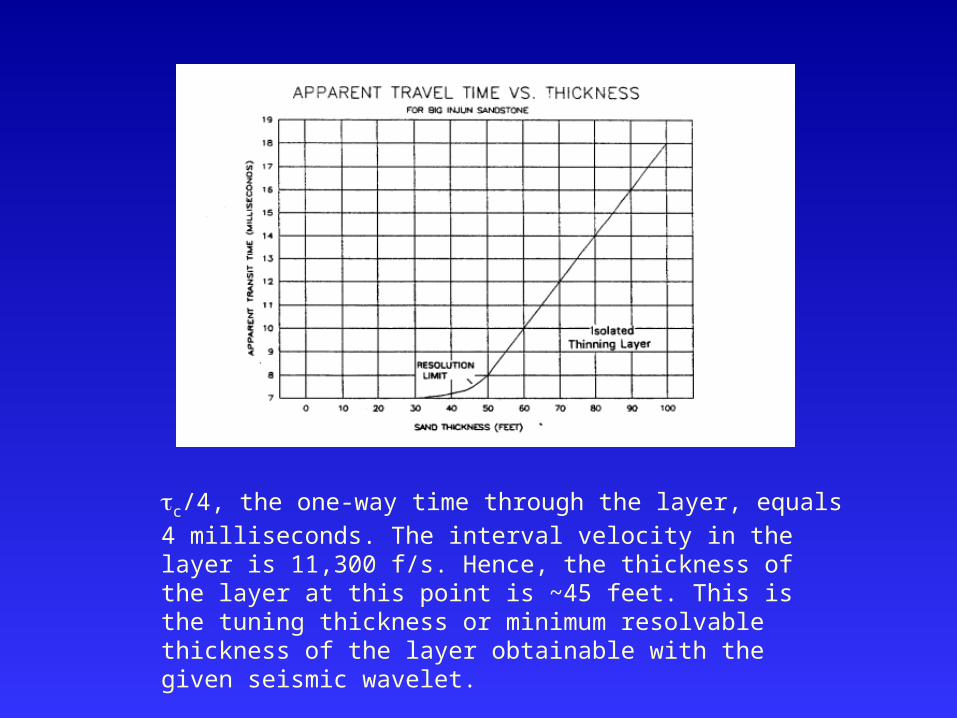
c/4, the one-way time through the layer, equals 4 milliseconds. The interval velocity in the layer is 11,300 f/s. Hence, the thickness of the layer at this point is ~45 feet. This is the tuning thickness or minimum resolvable thickness of the layer obtainable with the given seismic wavelet.
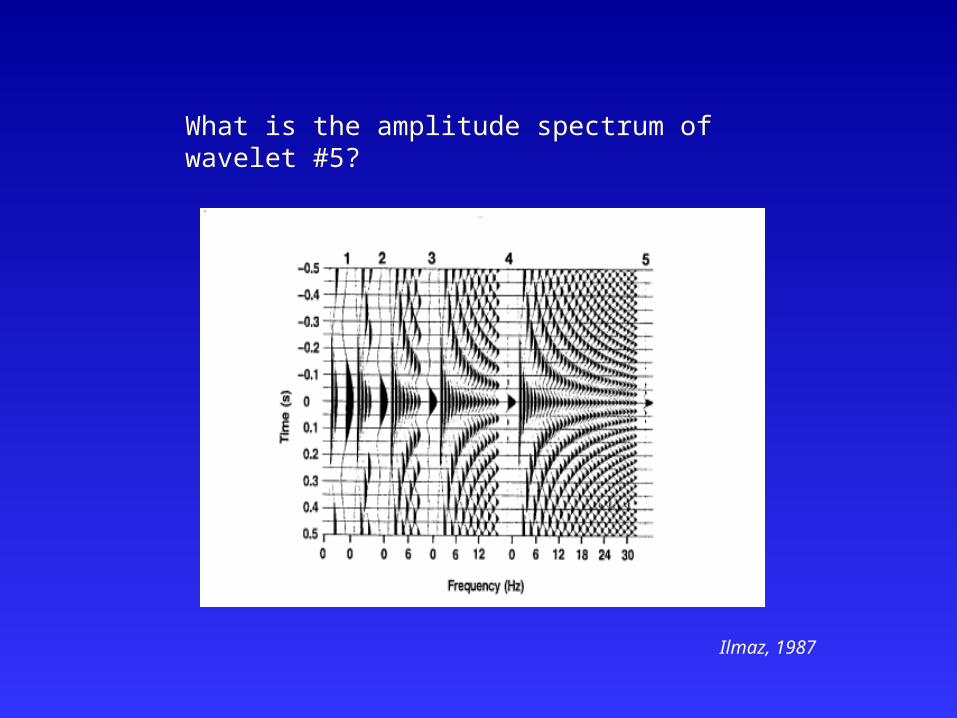
What is the amplitude spectrum of wavelet #5?
Ilmaz, 1987
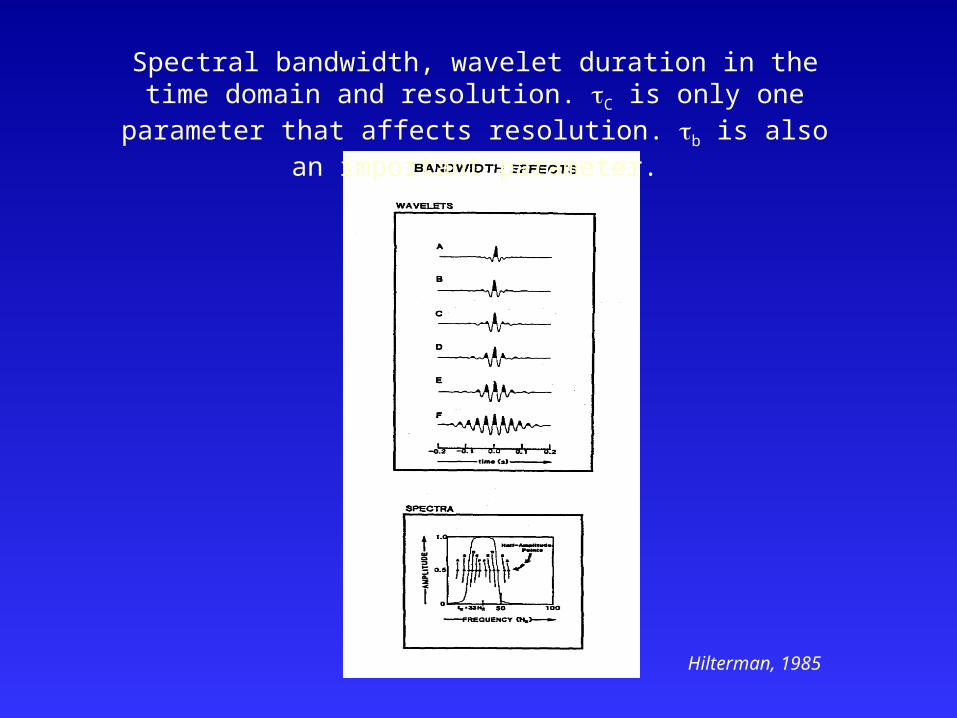
Spectral bandwidth, wavelet duration in the time domain and resolution. C is only one parameter that affects resolution. b is also an important parameter.
Hilterman, 1985
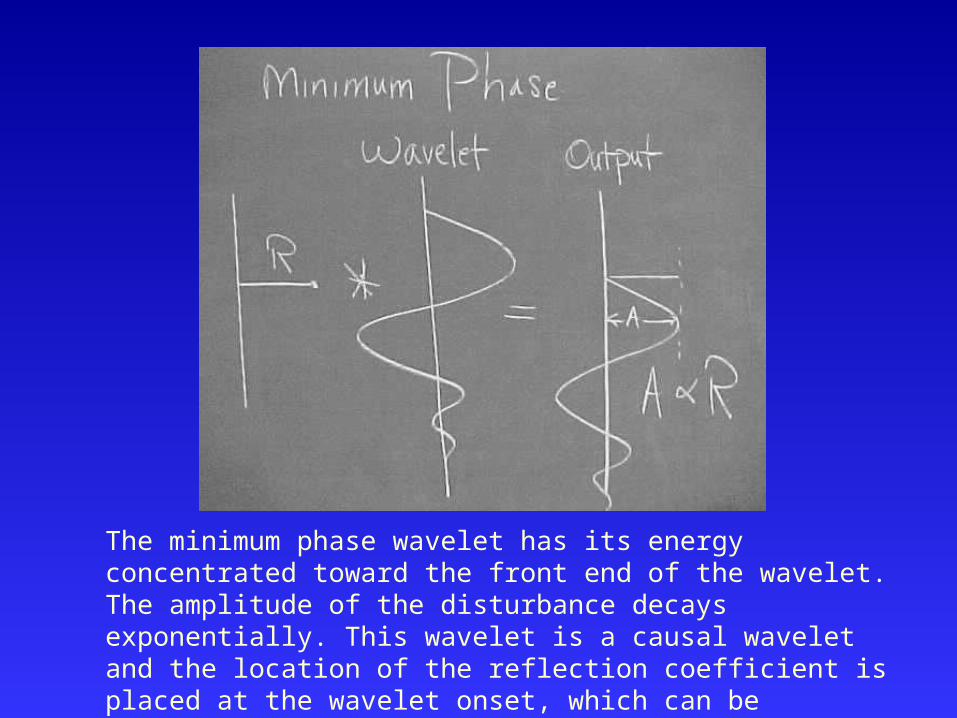
The minimum phase wavelet has its energy concentrated toward the front end of the wavelet. The amplitude of the disturbance decays exponentially. This wavelet is a causal wavelet and the location of the reflection coefficient is placed at the wavelet onset, which can be difficult for the interpreter to pick.
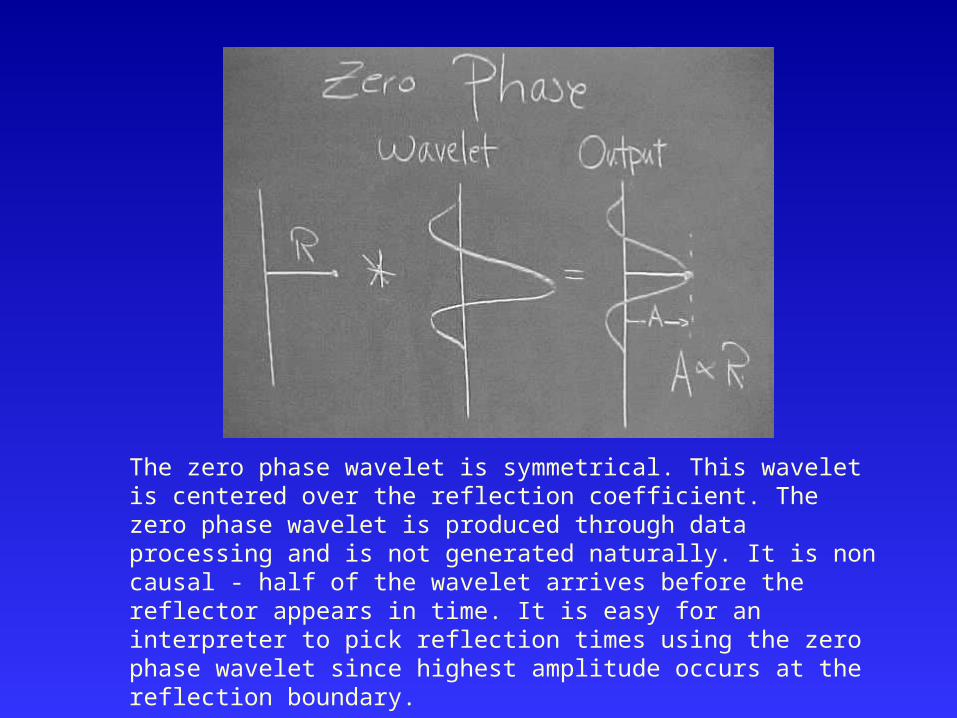
The zero phase wavelet is symmetrical. This wavelet is centered over the reflection coefficient. The zero phase wavelet is produced through data processing and is not generated naturally. It is non causal - half of the wavelet arrives before the reflector appears in time. It is easy for an interpreter to pick reflection times using the zero phase wavelet since highest amplitude occurs at the reflection boundary.

The zero-phase wavelet is also considered to have higher resolving power. It is generally more compact than the equivalent minimum phase wavelet and is, overall, easier to interpret.
The exploration data is in a zero phase format.
Hilterman, 1985
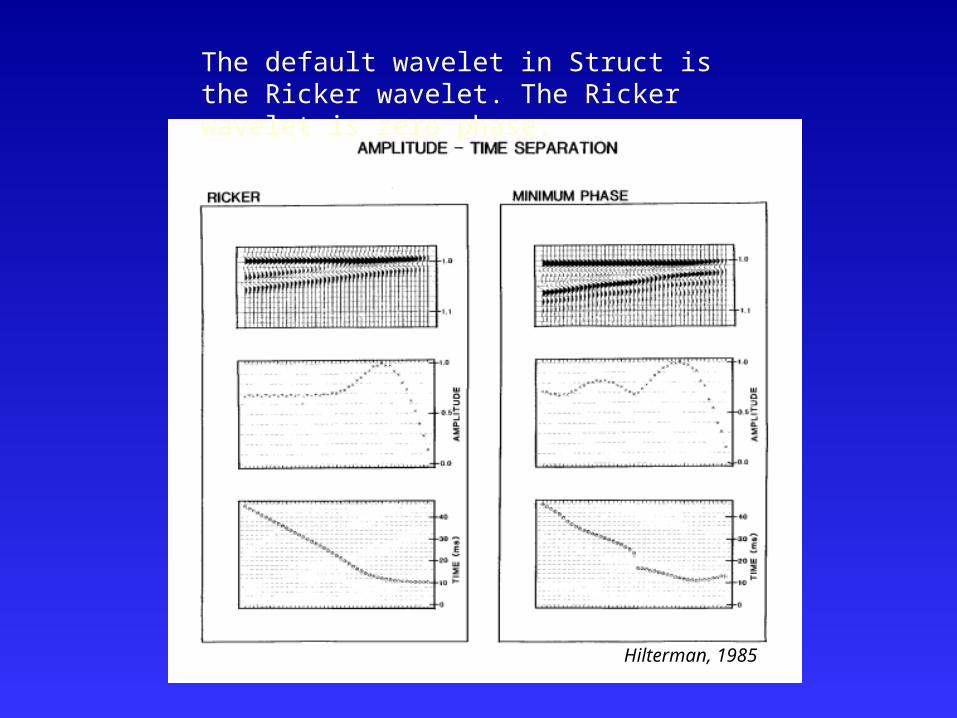
The default wavelet in Struct is the Ricker wavelet. The Ricker wavelet is zero phase.
Hilterman, 1985
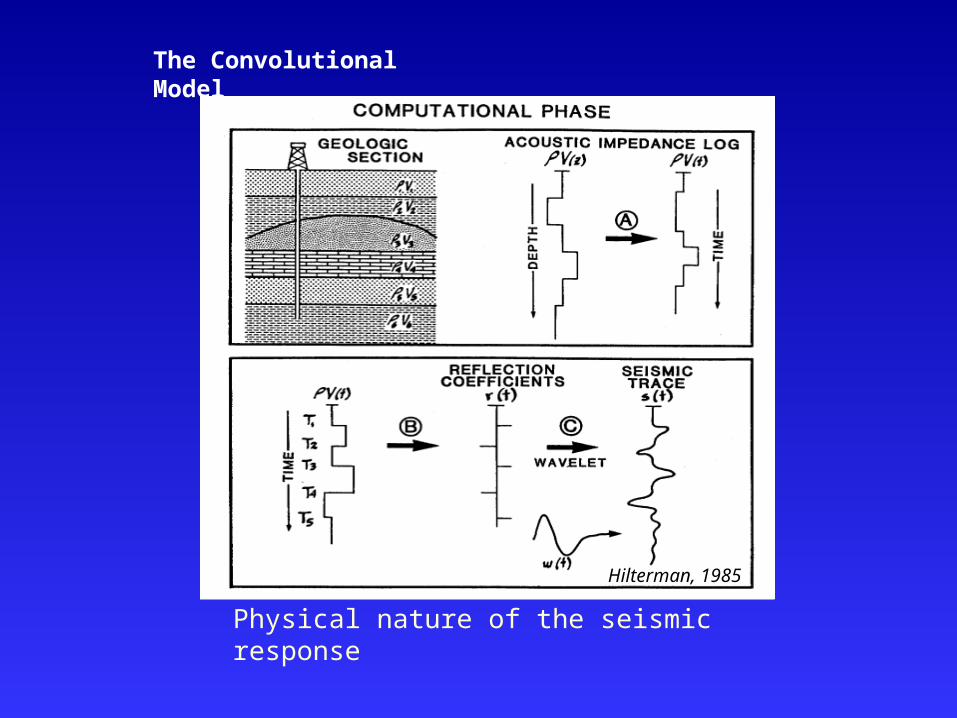
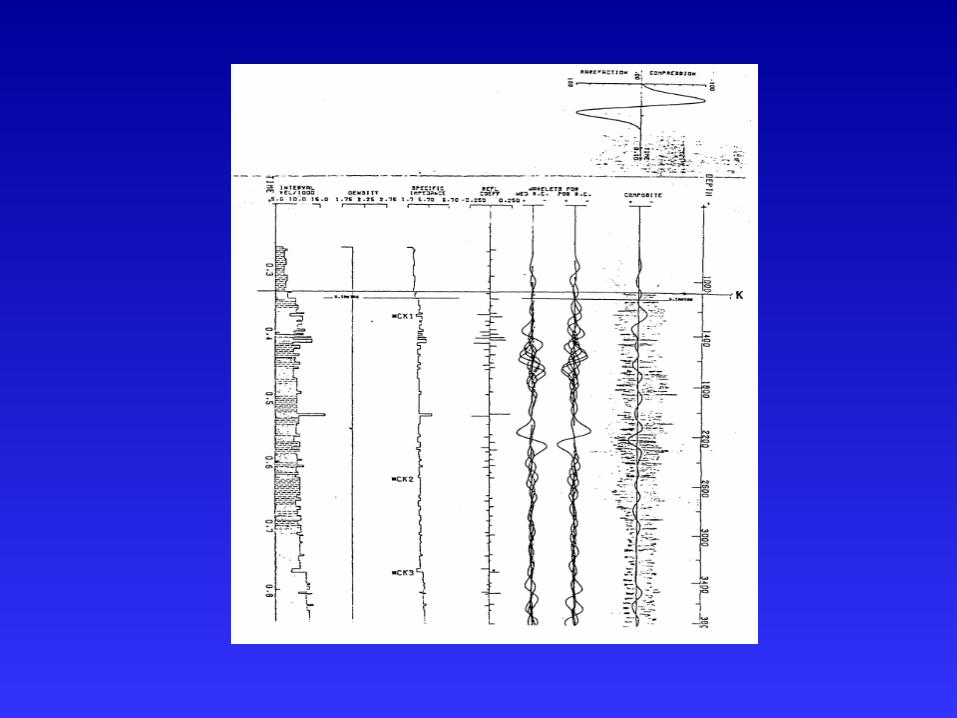
Physical nature of the seismic response
Hilterman, 1985
The Convolutional Model
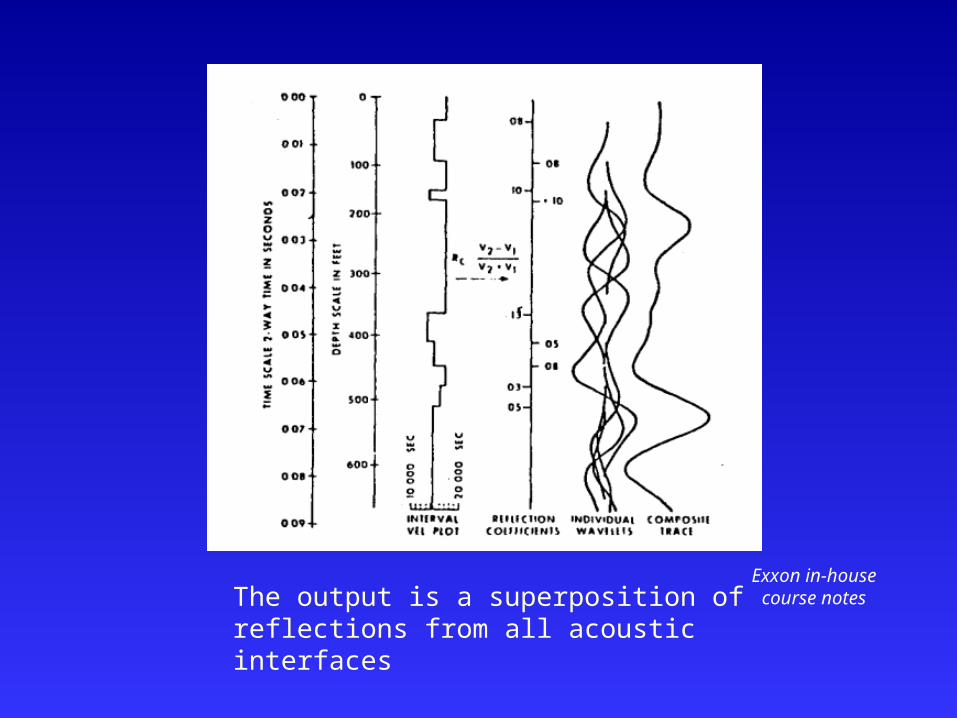
The output is a superposition of reflections from all acoustic interfaces
Exxon in-house course
notes
Exxon in-house course
notes
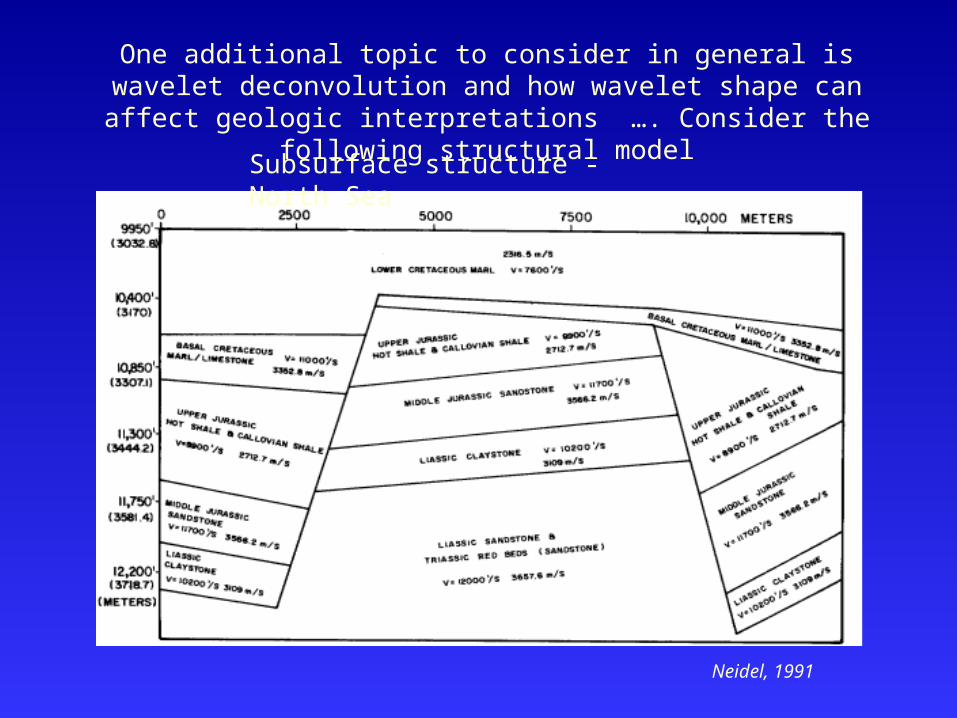
Subsurface structure - North Sea
One additional topic to consider in general is wavelet deconvolution and how wavelet shape can affect geologic interpretations …. Consider the following structural model
Neidel, 1991
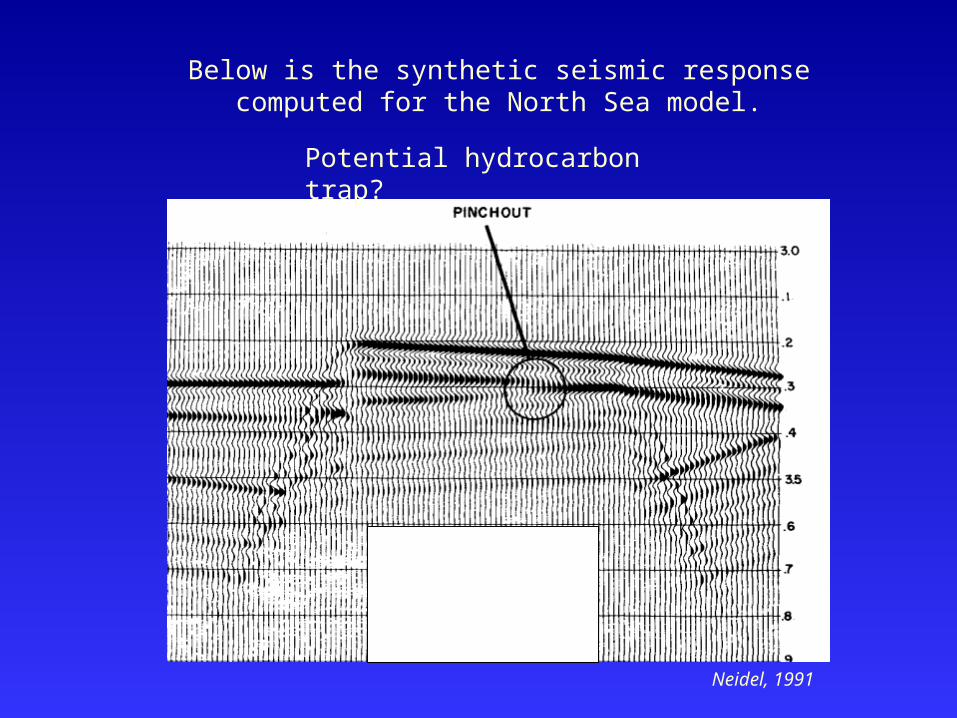
Potential hydrocarbon trap?
Below is the synthetic seismic response computed for the North Sea model.
Neidel, 1991
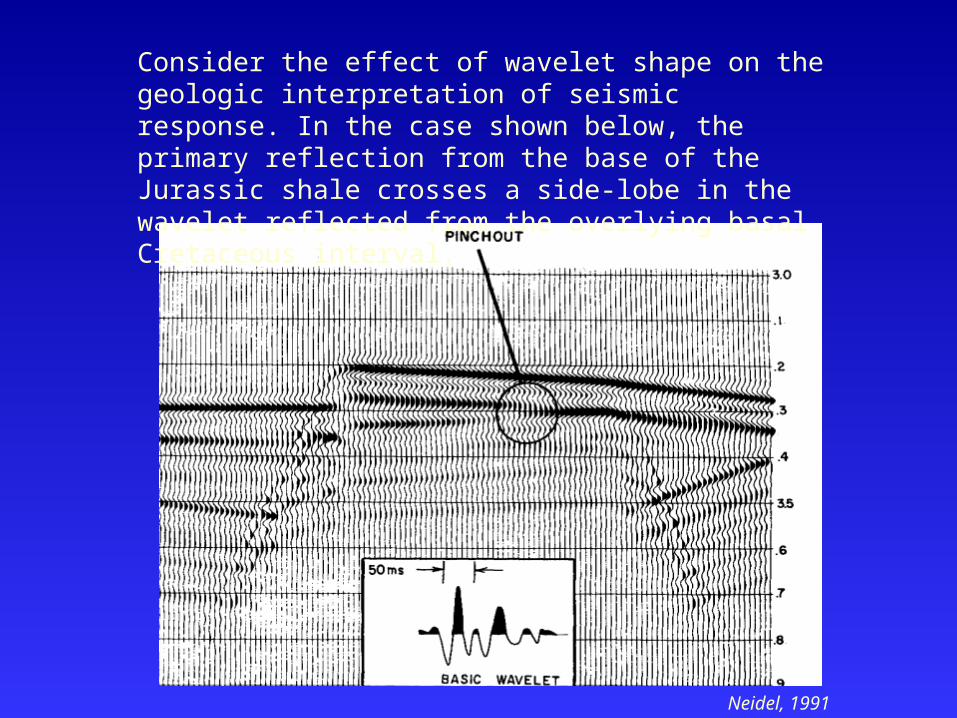
Consider the effect of wavelet shape on the geologic interpretation of seismic response. In the case shown below, the primary reflection from the base of the Jurassic shale crosses a side-lobe in the wavelet reflected from the overlying basal Cretaceous interval.
Neidel, 1991

Deconvolution is a filter operation which compresses and simplifies the shape of the seismic wavelet. Deconvolution improves seismic resolution and simplifies interpretation.
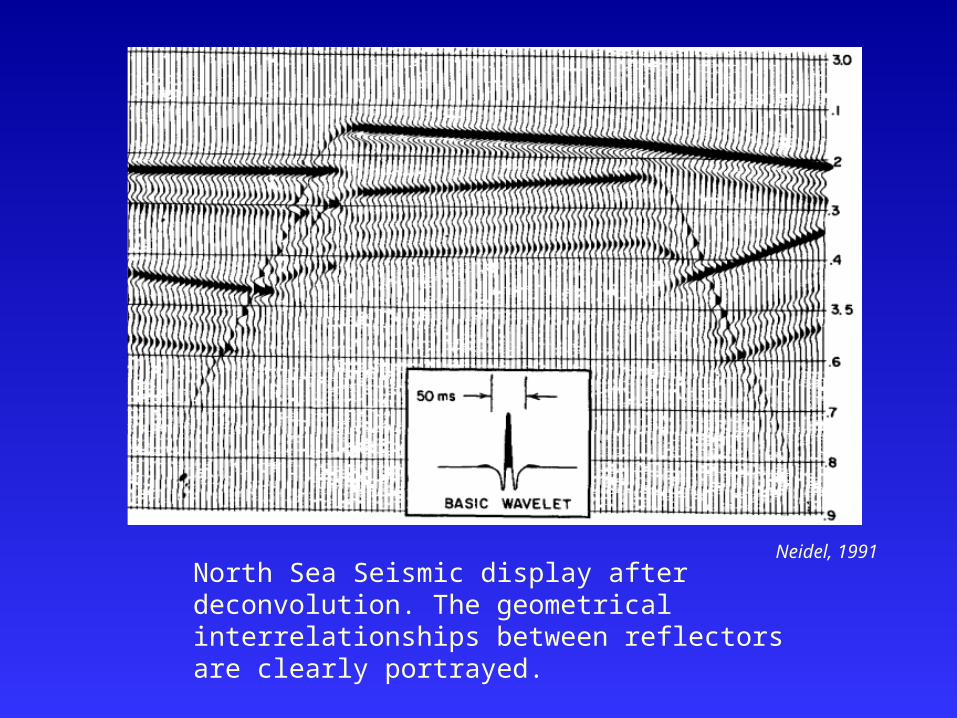
North Sea Seismic display after deconvolution. The geometrical interrelationships between reflectors are clearly portrayed.
Neidel, 1991