enscc - smart and mobile work in growth regions · enscc - smart and mobile work in growth regions...
TRANSCRIPT

ENSCC - Smart and Mobile Work inGrowth Regions
Deliverable 1.2: Survey results of the mobileworkers’ needs
Work package No. and title: WP1 User needsTask No. and title: 1.3 Country surveysLead partner of the WP: Aalto UniversityMain Author: Tero Haahtela / Aalto UniversityContributors: Esa Viitamo / Aalto University
Roland Hackl / tbw ResearchFabian Härri / ZHAWJohannes Asamer /AITTeemu Surakka / Aalto University
Version historyVersion Date1.0 6.6.20171.1 15.6.2017
Final VersionReleased by DateTero Haahtela 15.6.2017

Smart Commuting – Smart and Mobile Workin Growth RegionsThis project explores new ways of combining work and life on the move withintelligent and sustainable transport system services. The first objective of thisproject is to identify the changing needs of mobile workers. For this objective,the consortium will collect data by surveys, interviews and workshops inAustria, Finland and Switzerland. The second objective is to increase thesustainability of mobility by supporting the implementation of new mobilityconcepts. These implementations help scale up our partners’ operations,evaluate how these new concepts meet the evolving needs of mobile workersand discover some common ground for city planning policies.
PartnersAalto University, AIT Austrian Institute of Technology, tbw research GesmbH, ZHAWZurich University of Applied Sciences, Virta Ltd. (Liikennevirta Oy), AC2SG Software Oy,Tuup Oy, ISTmobil GmbH, Growth Corridor Finland, Office for Mobility of the Canton ofBasel-Stadt
https://smartcommuting.eu/
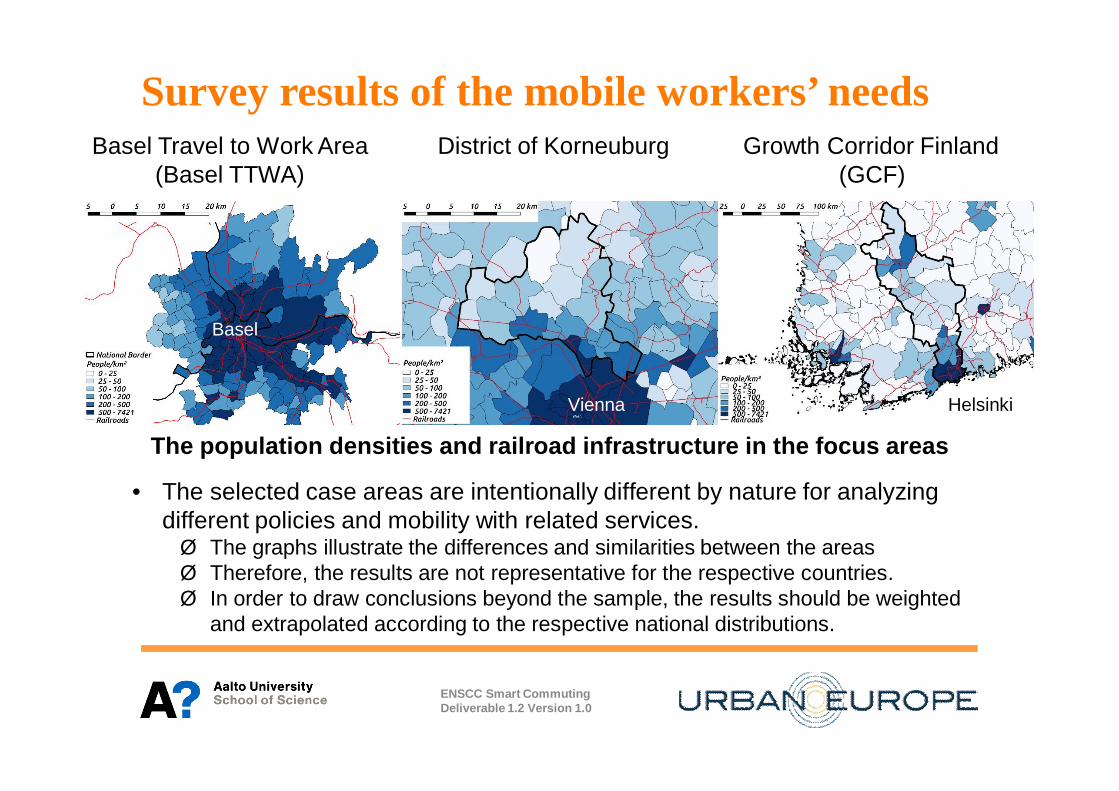
Survey results of the mobile workers’ needsBasel Travel to Work Area
(Basel TTWA)District of Korneuburg Growth Corridor Finland
(GCF)
HelsinkiVienna
Basel
ENSCC Smart CommutingDeliverable 1.2 Version 1.0
The population densities and railroad infrastructure in the focus areas
• The selected case areas are intentionally different by nature for analyzingdifferent policies and mobility with related services.Ø The graphs illustrate the differences and similarities between the areasØ Therefore, the results are not representative for the respective countries.Ø In order to draw conclusions beyond the sample, the results should be weighted
and extrapolated according to the respective national distributions.

Survey results of the mobile workers’ needs§ This deliverable presents the basic results of the commuting survey
conducted in Austria, Finland and Switzerland. Future deliverable 1.3 willpresent more detailed analysis of the survey.
§ The questions are presented in APPENDIX (see slides 49-57)§ The questions were related to the following topics (no. of questions):
§ Background (18)§ Commuting environment (5)§ Present commuting (13)§ Satisfaction and motivations (5)§ Future commuting (3)
§ The questionnaire was issued in Oct. 2016 – Feb. 2017§ The data was collected in Dec. 2016 – May 2017
ENSCC Smart CommutingDeliverable 1.2 Version 1.0

Survey results of the mobile workers’ needs§ Three identical (region-adjusted) commuting surveys
§ Austria, N = 531, reps. the whole country§ Finland, N = 523, reps. the Finnish Growth Corridor§ Switzerland, N = 549, reps. the Basel-region
§ The geographic focus in each country reflects in part policy priorities indeveloping sustainable commuting
§ Owing to the large sample sizes in each country, the data enablesstatistical analysis and§ comparisons of the results across the three regions§ identification of commuting profiles within each region
ENSCC Smart CommutingDeliverable 1.2 Version 1.0

Survey results of the mobile workers’ needsData collection in Finland
• The Finnish data (n=521) was collected from the Growth Corridor Finland• The data was collected using the internet panel of Taloustutkimus• Half of the responses represents municipalities and small towns, while the
other half represents the four large cities (Helsinki, Espoo, Vantaa, Tampere)located in the Helsinki-Tampere growth corridor.
• Along with the place of living, representative sampling was applied also toother central background variables e.g. age and gender
ENSCC Smart CommutingDeliverable 1.2 Version 1.0

Survey results of the mobile workers’ needsData collection in Switzerland
• ZHAW contacted 2504 companies and other employers in the canton of Basel-Stadt by e-mail, based on a random sample out of the official business register
• Companies and other employers were asked to forward the link to the onlinequestionnaire to their employees.
• The questionnaire was available both in German and French– Total responses (completed questionnaires and all types of drop-outs): 1’186
• Completed responses: 549• Completion rate: 46.37%
– Of the respondents with completed responses• 462 lived in Switzerland• 65 in Germany• 22 in France
ENSCC Smart CommutingDeliverable 1.2 Version 1.0

Survey results of the mobile workers’ needs
Data collection in Austria
• The survey was implemented by ZHAW in unipark (online survey tool)• The survey was distributed to registered users of a market research institute
(iterative and selective to collect a representative sample)• The questionnaire was available in German and English• Total responses (completed questionnaires and all types of drop-outs): 724
– Completed responses: 531– Completion rate: 73,34%
ENSCC Smart CommutingDeliverable 1.2 Version 1.0
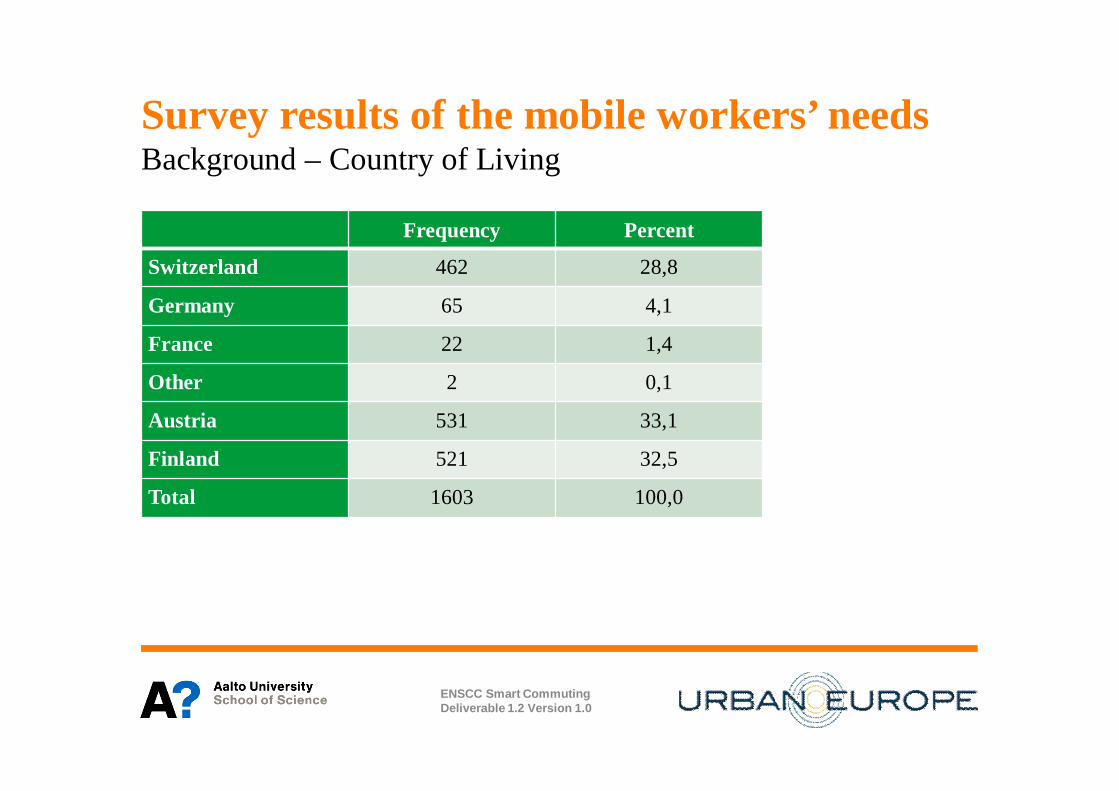
Survey results of the mobile workers’ needsBackground – Country of Living
Frequency Percent
Switzerland 462 28,8
Germany 65 4,1
France 22 1,4
Other 2 0,1
Austria 531 33,1
Finland 521 32,5
Total 1603 100,0
ENSCC Smart CommutingDeliverable 1.2 Version 1.0
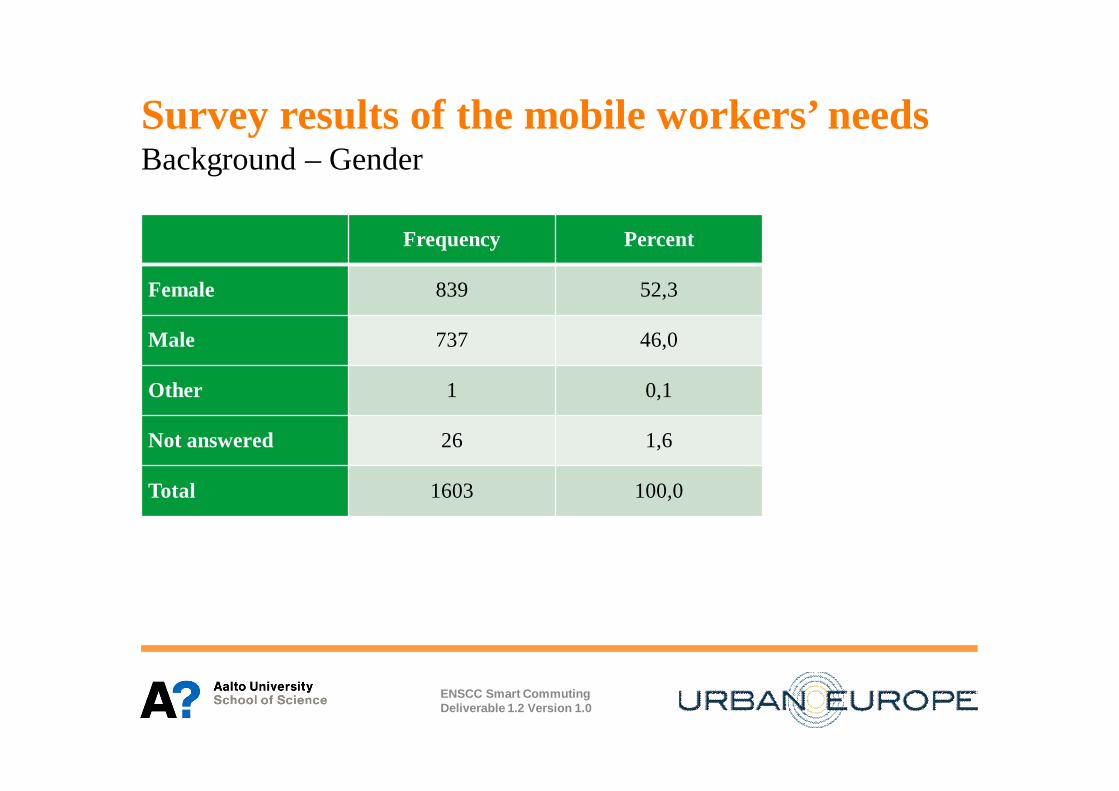
Survey results of the mobile workers’ needsBackground – Gender
Frequency Percent
Female 839 52,3
Male 737 46,0
Other 1 0,1
Not answered 26 1,6
Total 1603 100,0
ENSCC Smart CommutingDeliverable 1.2 Version 1.0

Survey results of the mobile workers’ needsBackground - Age of the respondents
ENSCC Smart CommutingDeliverable 1.2 Version 1.0
0,0 %
5,0 %
10,0 %
15,0 %
20,0 %
25,0 %
30,0 %
35,0 %
< 25 26 - 35 36 - 45 46 - 55 56 - 65 > 66
GCF Basel TTWA Austria

Survey results of the mobile workers’ needsBackground - Educational levels
ENSCC Smart CommutingDeliverable 1.2 Version 1.0
0,0 % 10,0 %20,0 %30,0 %40,0 %50,0 %60,0 %
No school education
Primary and secondary education
Diploma of higher education
Higher professional education
Bachelor or equivalent level
Master or equivalent level
Doctoral or equivalent level
Basel TTWA GCF Austria
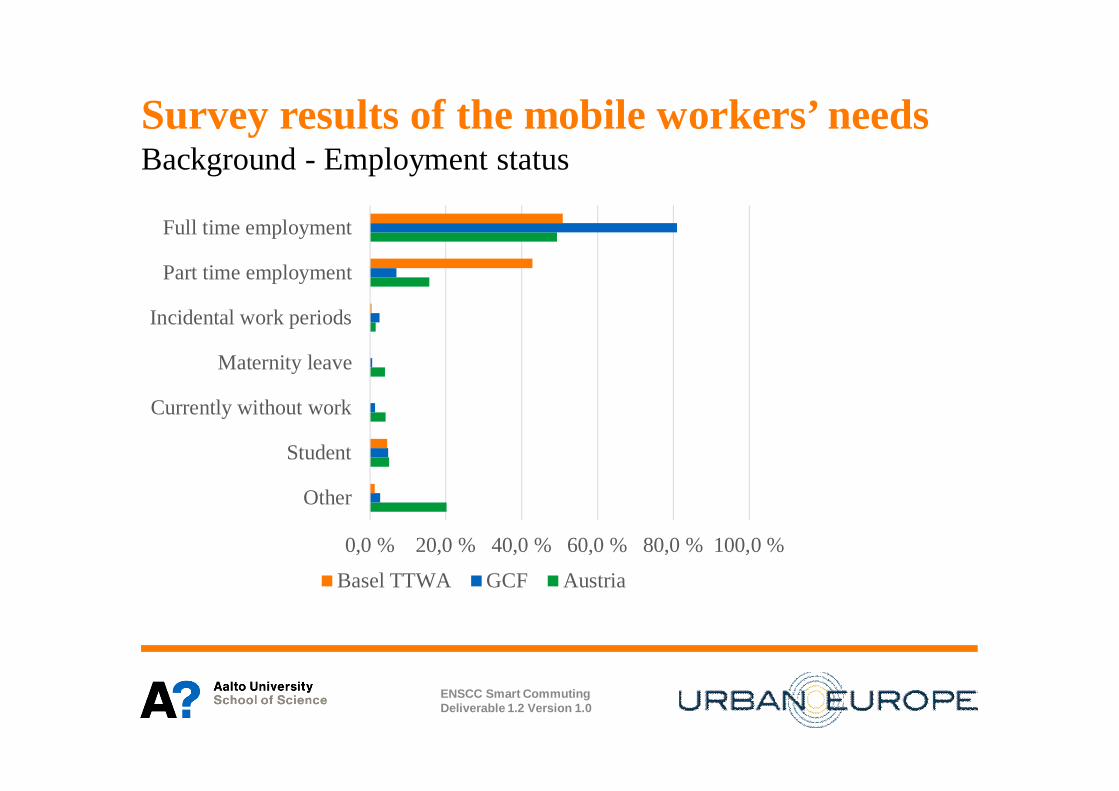
Survey results of the mobile workers’ needsBackground - Employment status
ENSCC Smart CommutingDeliverable 1.2 Version 1.0
0,0 % 20,0 % 40,0 % 60,0 % 80,0 % 100,0 %
Other
Student
Currently without work
Maternity leave
Incidental work periods
Part time employment
Full time employment
Basel TTWA GCF Austria

Survey results of the mobile workers’ needsBackground - Household size (number of people)
ENSCC Smart CommutingDeliverable 1.2 Version 1.0
0,00%5,00%
10,00%15,00%20,00%25,00%30,00%35,00%40,00%45,00%50,00%
1 2 3 4 5 6 or more
Austria GCF Basel TTWA

Survey results of the mobile workers’ needsBackground - Number of working and studying persons inhousehold
ENSCC Smart CommutingDeliverable 1.2 Version 1.0
0,0 %
10,0 %
20,0 %
30,0 %
40,0 %
50,0 %
60,0 %
0 1 2 3 4 5 or more
Austria GCF Basel TTWA

Survey results of the mobile workers’ needsBackground - Number of children living at home
ENSCC Smart CommutingDeliverable 1.2 Version 1.0
0,0 %
10,0 %
20,0 %
30,0 %
40,0 %
50,0 %
60,0 %
70,0 %
80,0 %
0 1 2 3 4 or moreAustria GCF Basel TTWA

Survey results of the mobile workers’ needsBackground - Number of cars in household
ENSCC Smart CommutingDeliverable 1.2 Version 1.0
0,0 %5,0 %
10,0 %15,0 %20,0 %25,0 %30,0 %35,0 %40,0 %45,0 %50,0 %
0 1 2 3 4 or more
Austria GCF Basel TTWA

Survey results of the mobile workers’ needsBackground - Number of bicycles in household
ENSCC Smart CommutingDeliverable 1.2 Version 1.0
0,0 %
5,0 %
10,0 %
15,0 %
20,0 %
25,0 %
30,0 %
35,0 %
0 1 2 3 4 5 6 or more
Austria GCF Basel TTWA

Survey results of the mobile workers’ needsBackground - Number of motorcycles and e-bikes in household
0,0 %
10,0 %
20,0 %
30,0 %
40,0 %
50,0 %
60,0 %
70,0 %
80,0 %
90,0 %
100,0 %
0 1 2 3 or more
Austria GCF Basel TTWA
0,0 %
10,0 %
20,0 %
30,0 %
40,0 %
50,0 %
60,0 %
70,0 %
80,0 %
90,0 %
100,0 %
0 1 2 3 or more
Motorcycles E-bikes
ENSCC Smart CommutingDeliverable 1.2 Version 1.0

Survey results of the mobile workers’ needsBackground - Household monthly net income
02 0004 0006 0008 000
10 00012 00014 00016 000
10 20 30 40 50 60 70 80 90
PercentilesAustria GCF Basel TTWA
EurosFor example, in Basel TTWA 80 % ofrespondents’ households earns less than €11 000 per month
ENSCC Smart CommutingDeliverable 1.2 Version 1.0

Survey results of the mobile workers’ needsBackground - Having driving license
95,0 % 92,1 % 89,6 %
0,0 %
10,0 %
20,0 %
30,0 %
40,0 %
50,0 %
60,0 %
70,0 %
80,0 %
90,0 %
100,0 %
Austria GCF Basel TTWA
ENSCC Smart CommutingDeliverable 1.2 Version 1.0

Survey results of the mobile workers’ needsCommuting environment - Type of the living environment
0,05,0
10,015,020,025,030,035,040,045,050,0
Rural Village Suburban Urban City center
Austria GCF Basel TTWA
%
ENSCC Smart CommutingDeliverable 1.2 Version 1.0

Survey results of the mobile workers’ needsCommuting environment - Access to basic necessities withinwalking distance
0,0 % 20,0 % 40,0 % 60,0 % 80,0 % 100,0 %
Other public services
Pharmacy / drugstore
Groceries or supermarket
School or kindergarten
Public transport access point
GCF Basel TTWA Austria
ENSCC Smart CommutingDeliverable 1.2 Version 1.0

Survey results of the mobile workers’ needsCommuting environment - Walking distance to the closest publictransportation point
0,0 % 20,0 % 40,0 % 60,0 % 80,0 % 100,0 %
Bike- or carsharing station
Other
Subway station
Train station
Taxi station
Tram stop
Bus stop
GCF Basel TTWA Austria
ENSCC Smart CommutingDeliverable 1.2 Version 1.0
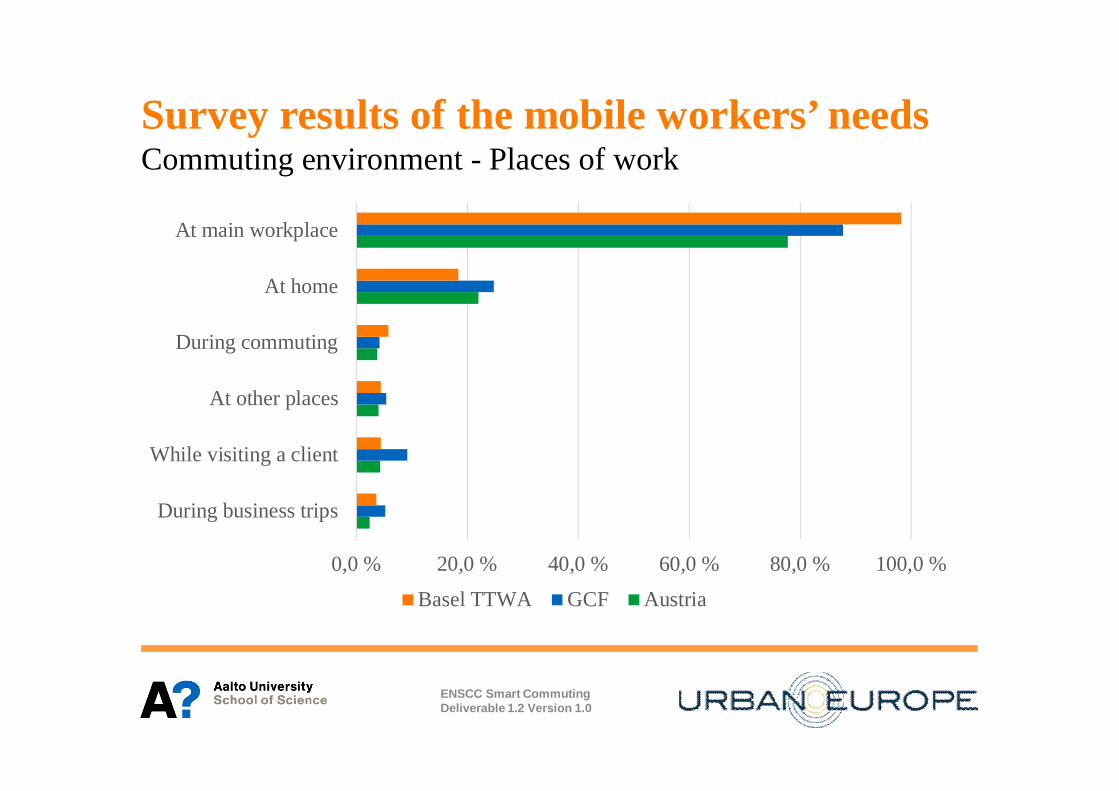
Survey results of the mobile workers’ needsCommuting environment - Places of work
0,0 % 20,0 % 40,0 % 60,0 % 80,0 % 100,0 %
During business trips
While visiting a client
At other places
During commuting
At home
At main workplace
Basel TTWA GCF Austria
ENSCC Smart CommutingDeliverable 1.2 Version 1.0

Survey results of the mobile workers’ needsCommuting environment - Workplace location type
0,0 %
10,0 %
20,0 %
30,0 %
40,0 %
50,0 %
60,0 %
Rural Village Suburban Urban City center
Austria GCF Basel TTWA
ENSCC Smart CommutingDeliverable 1.2 Version 1.0
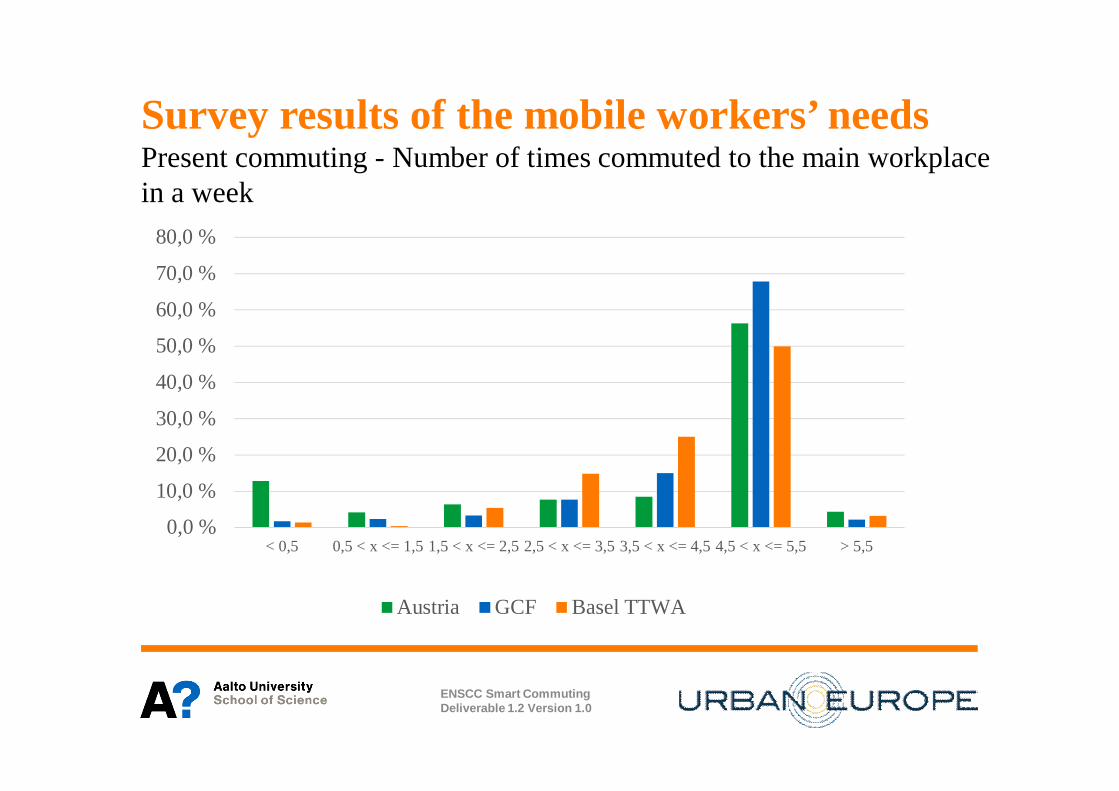
Survey results of the mobile workers’ needsPresent commuting - Number of times commuted to the main workplacein a week
0,0 %
10,0 %
20,0 %
30,0 %
40,0 %
50,0 %
60,0 %
70,0 %
80,0 %
< 0,5 0,5 < x <= 1,5 1,5 < x <= 2,5 2,5 < x <= 3,5 3,5 < x <= 4,5 4,5 < x <= 5,5 > 5,5
Austria GCF Basel TTWA
ENSCC Smart CommutingDeliverable 1.2 Version 1.0

Survey results of the mobile workers’ needsPresent commuting - Distance between home and workplacekm
0,0
10,0
20,0
30,0
40,0
50,0
60,0
70,0
10 20 30 40 50 60 70 80 90
PercentilesAustria GCF Basel TTWA
For example, in Basel TTWA ofSwitzerland, 80 % of respondents havecommuting distance less than 30 km.
ENSCC Smart CommutingDeliverable 1.2 Version 1.0

Survey results of the mobile workers’ needsPresent commuting - Daily commuting time
0,00
20,00
40,00
60,00
80,00
100,00
120,00
140,00
10 20 30 40 50 60 70 80 90
PercentilesAustria Basel TTWA GCF
MinutesFor example, in Growth CorridorFinland, 80 % of respondents use lessthan 100 minutes for commuting.
ENSCC Smart CommutingDeliverable 1.2 Version 1.0
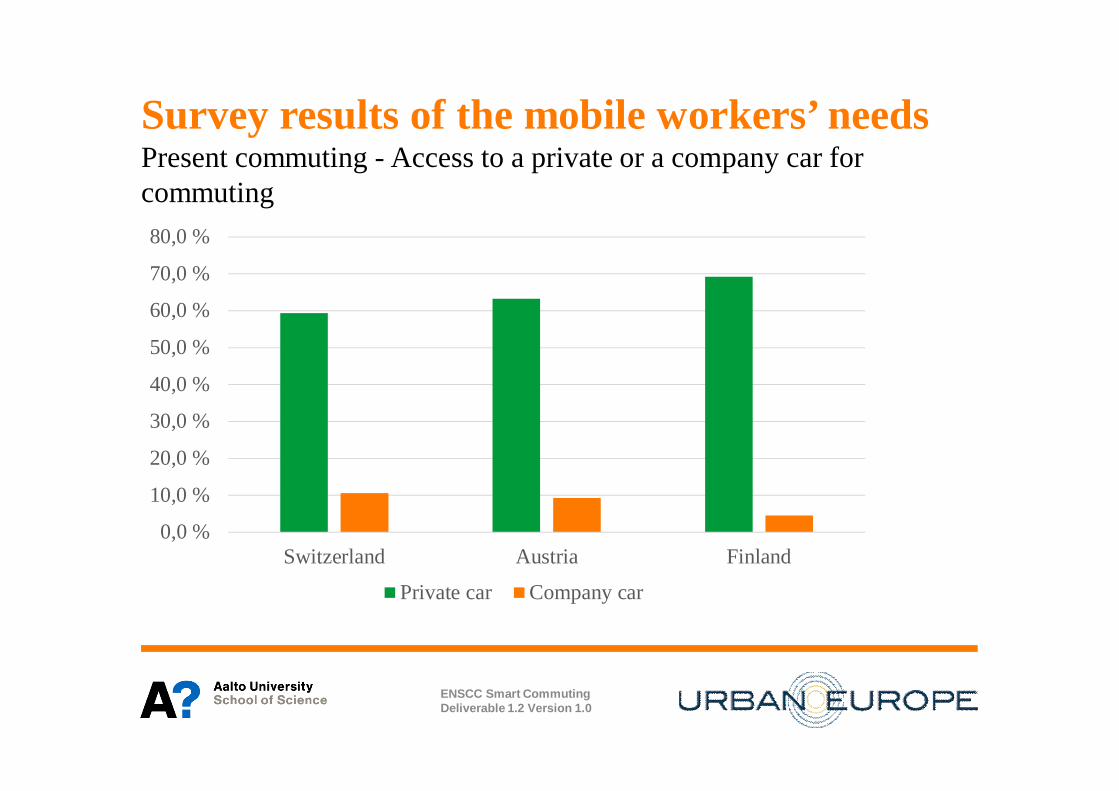
Survey results of the mobile workers’ needsPresent commuting - Access to a private or a company car forcommuting
0,0 %
10,0 %
20,0 %
30,0 %
40,0 %
50,0 %
60,0 %
70,0 %
80,0 %
Switzerland Austria Finland
Private car Company car
ENSCC Smart CommutingDeliverable 1.2 Version 1.0

Survey results of the mobile workers’ needsPresent commuting -The most important means of transport used forcommuting*
* Share of respondents answering “often” or “nearly always”
ENSCC Smart CommutingDeliverable 1.2 Version 1.0
0,0 % 10,0 % 20,0 % 30,0 % 40,0 % 50,0 % 60,0 %
e-BikeMotorbike
TramMetro
Car - passengerTrainBikeBus
WalkingCar - driver
Austria GCF Basel TTWA

Survey results of the mobile workers’ needsPresent commuting - Other modes of transportation used forcommuting• Ridesharing• Skiing and kick sledge (in the winter)• Roller-skating
ENSCC Smart CommutingDeliverable 1.2 Version 1.0

Survey results of the mobile workers’ needsPresent commuting - PT ticket types used commonly in commuting
0,0 % 20,0 % 40,0 % 60,0 %
Single/return ticket, one-day ticket
Year ticket / year subscription
Route-specific month pass
Multi-trip ticket
Discount card (e.g. pension)
Single/return ticket, one-day ticket
Flatrate month pass
Value ticket
GCF Basel TTWA Austria
ENSCC Smart CommutingDeliverable 1.2 Version 1.0

Survey results of the mobile workers’ needsPresent commuting - Combining other activities with commuting*
0,0 % 20,0 % 40,0 % 60,0 % 80,0 % 100,0 %
Picking-up someone
Education
Using public services
Leisure or sports
Social activities
Shopping
GCF Austria Basel TTWA
*share of respondents answering often or sometimes
ENSCC Smart CommutingDeliverable 1.2 Version 1.0

Survey results of the mobile workers’ needsPresent commuting - Use of Internet for info seeking duringcommuting
0 % 20 % 40 % 60 % 80 % 100 %
Finland
Austria
Switzerland
never rarely sometimes often every workday
ENSCC Smart CommutingDeliverable 1.2 Version 1.0

Survey results of the mobile workers’ needsPresent commuting - Use of Internet for booking trips duringcommuting
0 % 20 % 40 % 60 % 80 % 100 %
Finland
Austria
Switzerland
never rarely sometimes often every workday
ENSCC Smart CommutingDeliverable 1.2 Version 1.0
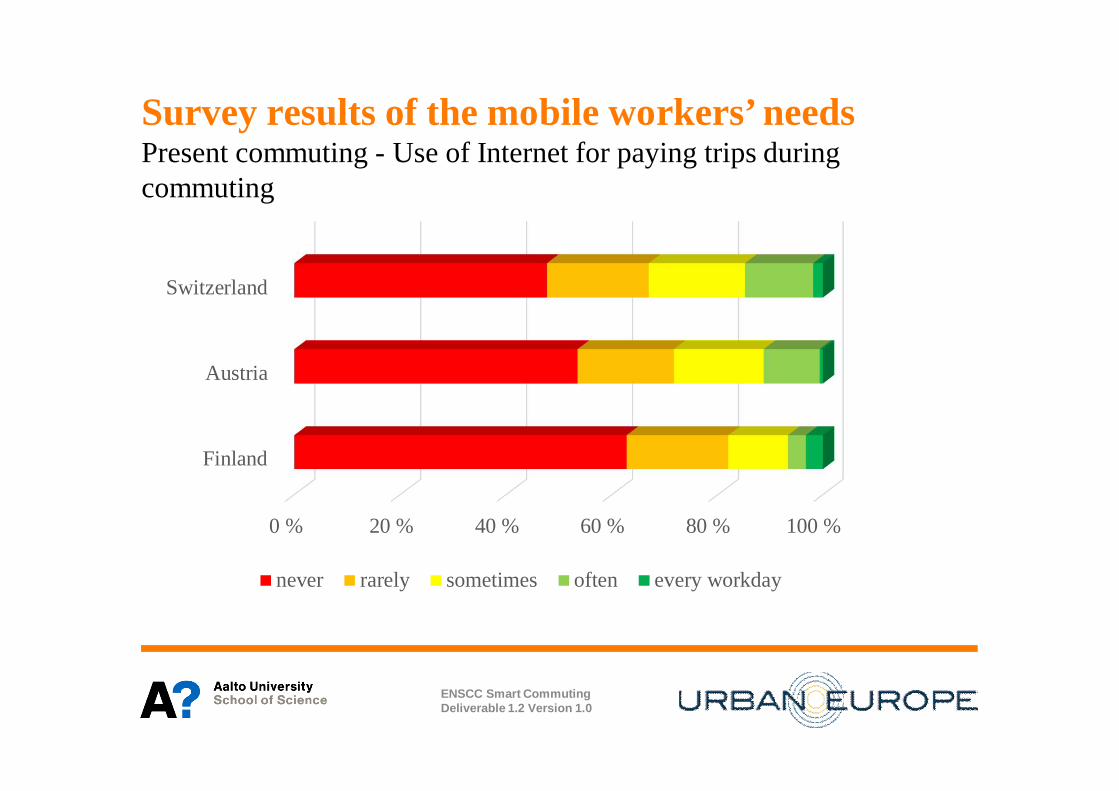
Survey results of the mobile workers’ needsPresent commuting - Use of Internet for paying trips duringcommuting
0 % 20 % 40 % 60 % 80 % 100 %
Finland
Austria
Switzerland
never rarely sometimes often every workday
ENSCC Smart CommutingDeliverable 1.2 Version 1.0

Survey results of the mobile workers’ needsPresent commuting - Activities during commuting
0,0 % 10,0 % 20,0 % 30,0 % 40,0 % 50,0 %
Working/studying without electronic devices
Sleeping
Eating / Drinking
Personal communication with fellow travelers
Working/studying with electronic devices
Calling
Using electronic devices for leisure (music,video, news, games, internet surfing)
Reading (newspaper, magazine, book)
Basel TTWA Austria GCF
ENSCC Smart CommutingDeliverable 1.2 Version 1.0

Survey results of the mobile workers’ needsPresent commuting - Reasons to commute during peak hours
ENSCC Smart CommutingDeliverable 1.2 Version 1.0
0,0 % 20,0 % 40,0 % 60,0 % 80,0 %
Habit
Childcare / school
Company culture
Requirement of job
GCF Basel TTWA Austria

Survey results of the mobile workers’ needsSatisfaction and motivations - Satisfaction with the mostcommon mode of commuting
ENSCC Smart CommutingDeliverable 1.2 Version 1.0
0,0 % 20,0 % 40,0 % 60,0 % 80,0 % 100,0 %
Enjoymnent of travel
Travel time
Price for service
Service frequency
Comfort
reliability /punctuality
Easy to use
GCF Basel TTWA Austria

Survey results of the mobile workers’ needsSatisfaction and Motivations - Reasons to use car incommuting; rank order
Austria Switzerland FinlandFlexibility 1 1 1Speed 2 2 2Transportation of goods 6 3 4Free parking-space at work 4 4 7Reliability 7 5 3Bad access to public transport 5 6 5No other alternative 3 7 8Privacy 8 9 6Weather 9 8 9Price 10 10 12Safety 11 11 10To avoid traffic jams 12 13 13Medical reasons 13 12 14Transportation of other people 15 15 11Environmental concerns 14 14 15
ENSCC Smart CommutingDeliverable 1.2 Version 1.0

Survey results of the mobile workers’ needsSatisfaction and motivations - Reasons to use public transportationin commuting; rank order
Austria Switzerland FinlandEnvironmental concerns 2 1 2Price 1 5 3To avoid traffic jams 3 2 7Reliability 4 3 5No other alternative 5 8 1Speed 6 6 4Weather 6 4 8Safety 8 9 6Possibility to work while commuting 9 7 10Flexibility 10 10 9Transportation of goods 11 11 12Medical reasons 12 12 11Privacy 13 13 13
ENSCC Smart CommutingDeliverable 1.2 Version 1.0

Survey results of the mobile workers’ needsSatisfaction and motivations - Reasons to use bicyclein commuting: rank order
Austria Switzerland FinlandFlexibility 3 1 3Price 2 4 1Environmental concerns 1 3 4Speed 4 2 5Do sports / health 7 9 2To avoid traffic jams 5 6 9Weather 6 8 6Reliability 8 5 8Privacy 9 7 7Transportation of goods 11 10 10No other alternative 10 11 12Safety 12 12 11Possibility to work while commuting 13 13 13
ENSCC Smart CommutingDeliverable 1.2 Version 1.0
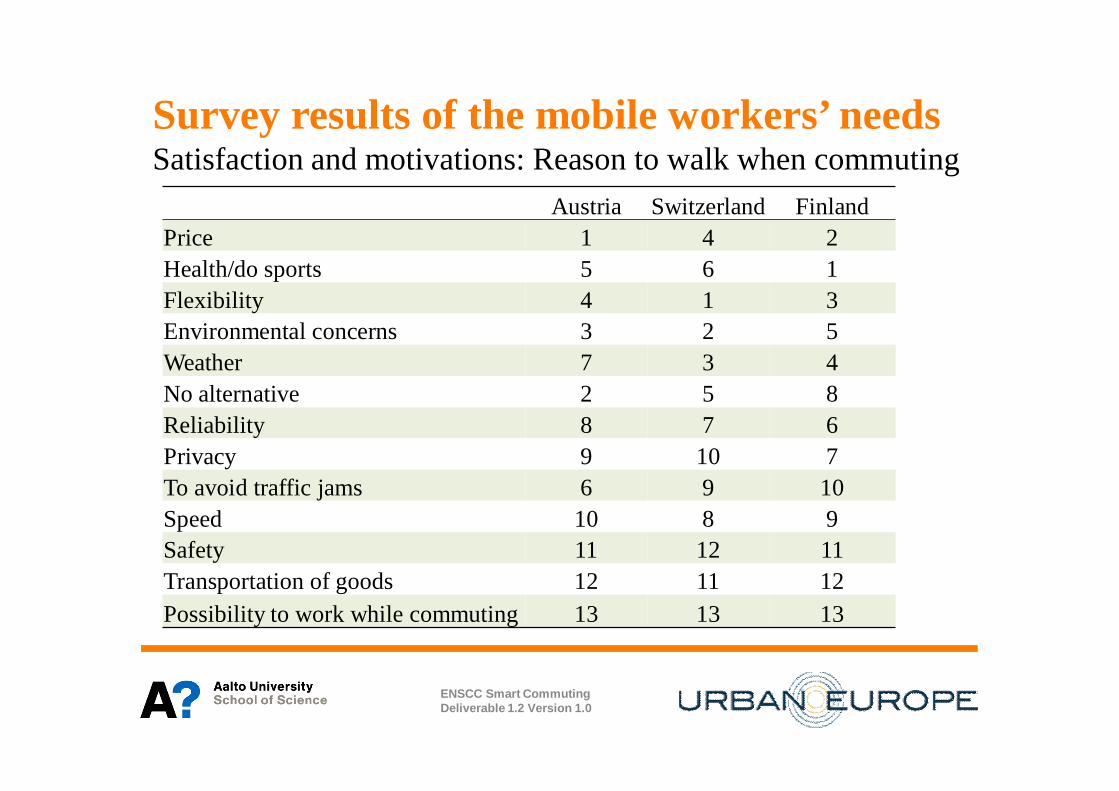
Survey results of the mobile workers’ needsSatisfaction and motivations: Reason to walk when commuting
Austria Switzerland FinlandPrice 1 4 2Health/do sports 5 6 1Flexibility 4 1 3Environmental concerns 3 2 5Weather 7 3 4No alternative 2 5 8Reliability 8 7 6Privacy 9 10 7To avoid traffic jams 6 9 10Speed 10 8 9Safety 11 12 11Transportation of goods 12 11 12Possibility to work while commuting 13 13 13
ENSCC Smart CommutingDeliverable 1.2 Version 1.0
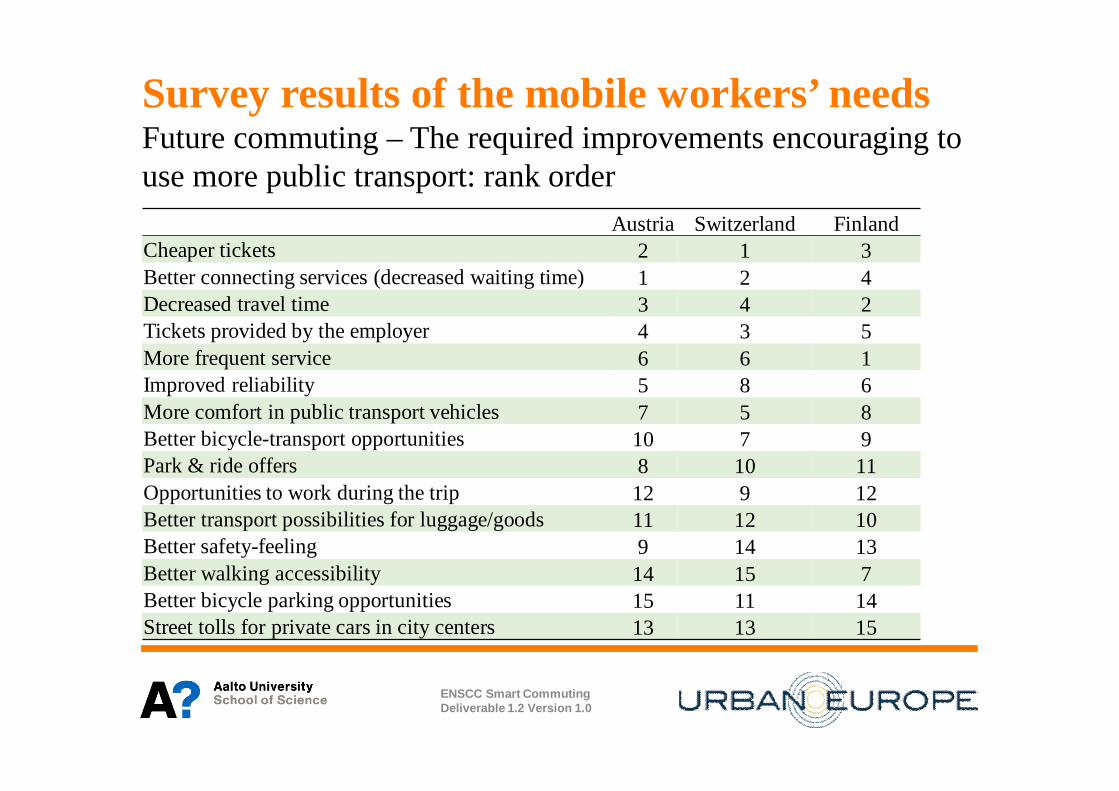
Survey results of the mobile workers’ needsFuture commuting – The required improvements encouraging touse more public transport: rank order
Austria Switzerland FinlandCheaper tickets 2 1 3Better connecting services (decreased waiting time) 1 2 4Decreased travel time 3 4 2Tickets provided by the employer 4 3 5More frequent service 6 6 1Improved reliability 5 8 6More comfort in public transport vehicles 7 5 8Better bicycle-transport opportunities 10 7 9Park & ride offers 8 10 11Opportunities to work during the trip 12 9 12Better transport possibilities for luggage/goods 11 12 10Better safety-feeling 9 14 13Better walking accessibility 14 15 7Better bicycle parking opportunities 15 11 14Street tolls for private cars in city centers 13 13 15
ENSCC Smart CommutingDeliverable 1.2 Version 1.0

Survey results of the mobile workers’ needsFuture commuting - Better tools, infrastructure and services needed towork during trips
• Internet connection and electricity• More space for laptop or a table for a laptop• A place to sit in public transport• Quiet working space in train• Quiet space for calling• Employer should give better tools for that (e.g. a tablet)• Permission from employer to work during commuting• Loud alarm that would tell me when I should get out of the bus/train
ENSCC Smart CommutingDeliverable 1.2 Version 1.0

0,0 % 20,0 % 40,0 % 60,0 %
Bike sharing
On-demand service (taxi, uber, etc.)
Shared on-demand service
Car sharing
Ride sharing
GCF Basel TTWA Austria
Survey results of the mobile workers’ needsFuture commuting – The market potential for new modes ofcommuting
*The question: “Could you imagine using one or more of the following transportmodes for your commuting trips?”
ENSCC Smart CommutingDeliverable 1.2 Version 1.0

Survey results of the mobile workers’ needsAPPENDIX – the questionnaireQuestion(s) Item(s) and preliminary scale Additional info1. Language choice Scale: 1x Y
Defines language of survey2. In which country do you live? Open_______ Presupposes an independent survey-
implementation for each study-regionFI: “municipality”
3. In which country do you work? Open_______ FI: “municipality”4. What is your gender? - female
- male- other
Scale: 1x Y
5. In which year were you born? _____ (Four digit number)6. What is the highest education gradeyou have completed?
- No school education- Primary education- Secondary education (e.g. high school or vocational
school)- Diploma of higher education- Bachelor or equivalent level- Master or equivalent level- Doctoral or equivalent level
Scale: 1x Y
7. Which is your current employmentstatus?
- full time employment- part-time employment- incidental work periods- maternity leave- currently without work- student- other: _____
Scale: 1x Y to allIf student -> Show comment that the term“workplace” also refers to “place of study”
ENSCC Smart CommutingDeliverable 1.2 Version 1.0
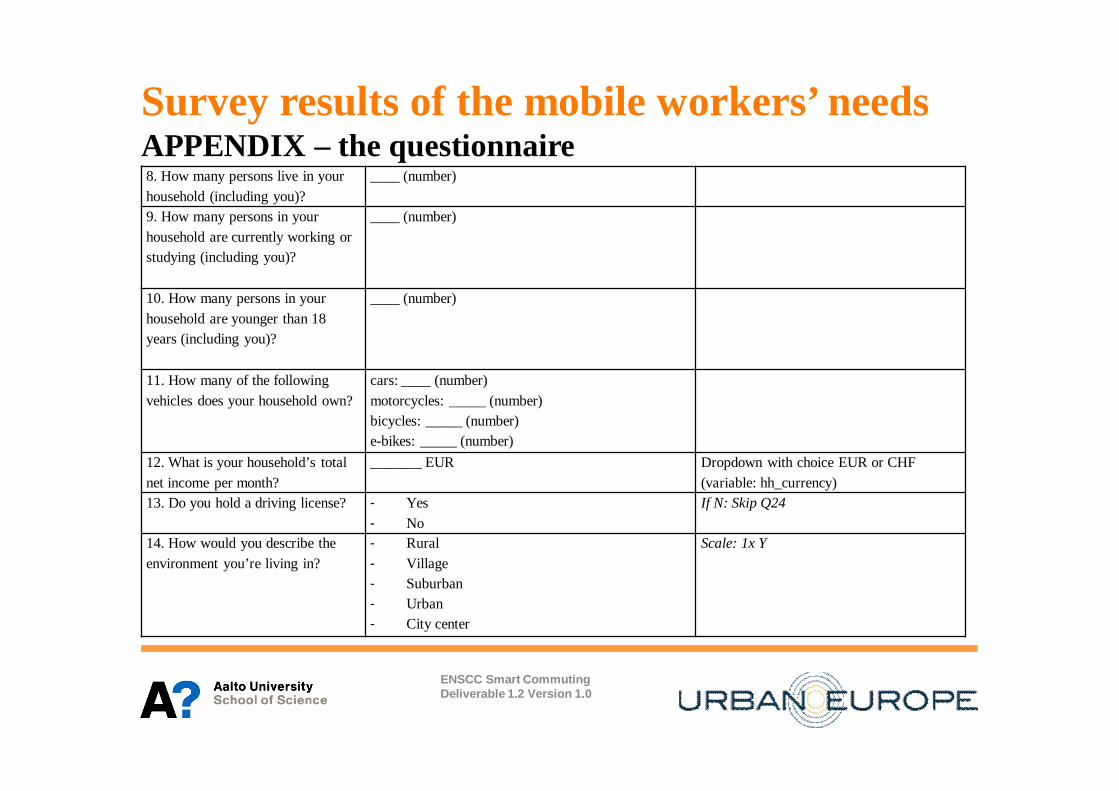
Survey results of the mobile workers’ needsAPPENDIX – the questionnaire8. How many persons live in yourhousehold (including you)?
____ (number)
9. How many persons in yourhousehold are currently working orstudying (including you)?
____ (number)
10. How many persons in yourhousehold are younger than 18years (including you)?
____ (number)
11. How many of the followingvehicles does your household own?
cars: ____ (number)motorcycles: _____ (number)bicycles: _____ (number)e-bikes: _____ (number)
12. What is your household’s totalnet income per month?
_______ EUR Dropdown with choice EUR or CHF(variable: hh_currency)
13. Do you hold a driving license? - Yes- No
If N: Skip Q24
14. How would you describe theenvironment you’re living in?
- Rural- Village- Suburban- Urban- City center
Scale: 1x Y
ENSCC Smart CommutingDeliverable 1.2 Version 1.0
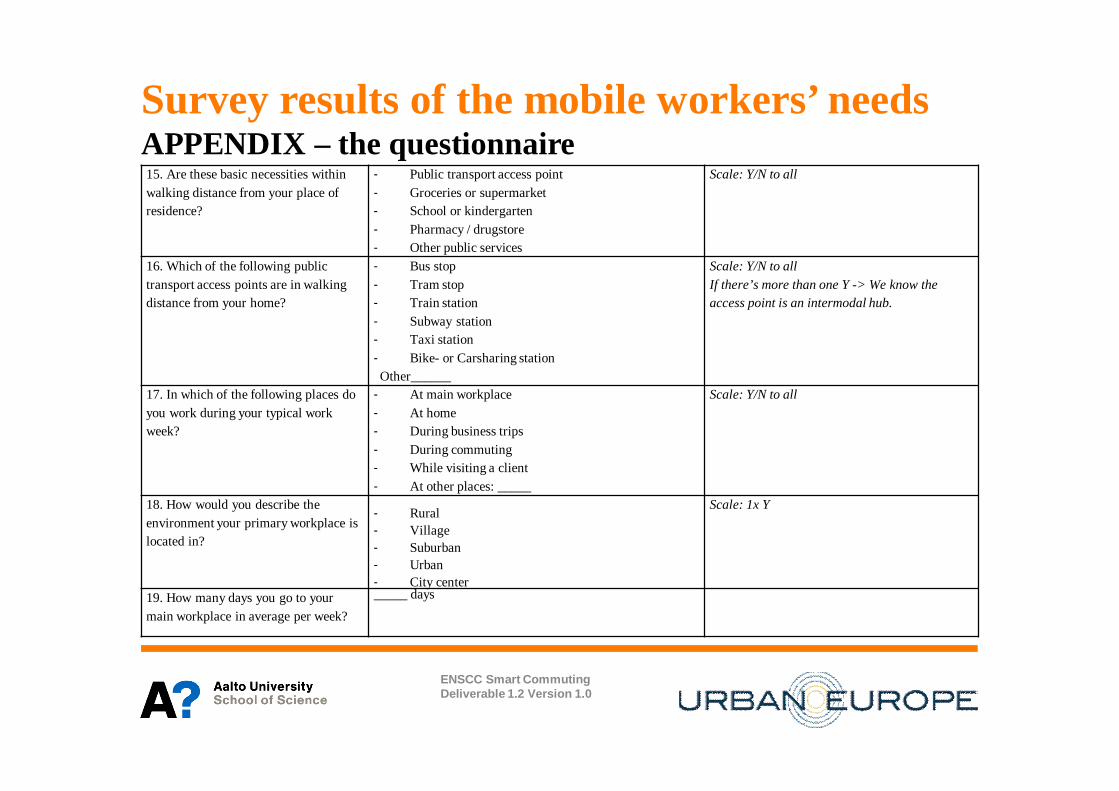
Survey results of the mobile workers’ needsAPPENDIX – the questionnaire15. Are these basic necessities withinwalking distance from your place ofresidence?
- Public transport access point- Groceries or supermarket- School or kindergarten- Pharmacy / drugstore- Other public services
Scale: Y/N to all
16. Which of the following publictransport access points are in walkingdistance from your home?
- Bus stop- Tram stop- Train station- Subway station- Taxi station- Bike- or Carsharing stationOther______
Scale: Y/N to allIf there’s more than one Y -> We know theaccess point is an intermodal hub.
17. In which of the following places doyou work during your typical workweek?
- At main workplace- At home- During business trips- During commuting- While visiting a client- At other places: _____
Scale: Y/N to all
18. How would you describe theenvironment your primary workplace islocated in?
- Rural- Village- Suburban- Urban- City center
Scale: 1x Y
19. How many days you go to yourmain workplace in average per week?
_____ days
ENSCC Smart CommutingDeliverable 1.2 Version 1.0

Survey results of the mobile workers’ needsAPPENDIX – the questionnaire20. What is the estimated distance betweenyour home and your main workplace?
____ km
21. Which means of transport do you usefor commuting trips and how often?
- Car - as driver- Car - as passenger- Motorcycle- Bus- Train- Tram- Subway/Metro- Bicycle- e-bike- Walking- Other__________
Scale: 1=never; 5=every workdayIf none of the PT-Answers were chosen, skip Q25.If one of the “Car”-Options are chosen: Ask Q30If one of the “PT”-Options are chosen: Ask Q31If one of the “Bike”-Options are chosen: Ask Q32If “walking” is chosen: Ask Q33
22. Please estimate the daily total timespent for commuting on average?
- ____ minutes
23. Which other means do you consider forcommuting, if any?
Open_________
24. Do you have access to a private orcompany owned vehicle for commuting?
- Private vehicle- Company vehicle
Scale: Y/N to all
25. Do you use one of the following formsof PT-tickets for commuting?
- Single/return ticket- Daily ticket- Multi-trip ticket- Value on travel card- Season ticket- Route-specific season ticket- Year ticket- Discount card (e.g. discount card for pensioners or
students)- Other ________
Scale: Y/N to allExample should be country-specific
ENSCC Smart CommutingDeliverable 1.2 Version 1.0

Survey results of the mobile workers’ needsAPPENDIX – the questionnaire26. How often do you combine workplacecommuting with other activities?
- Shopping- Social activities- Picking-up someone- Leisure or Sports- Education- Using public services
Other: _________
Scale: 1=never; 5=every workday
27. How often do you use the Internet for thefollowing actions related to commuting?
- Information seeking (e.g. routes)- Booking- Paying
Other: _____
Scale: 1=never; 5=every workday
28. What are you doing while using yourmain mode of commuting?
- Reading (newspaper, magazine, book)- Working/studying without electronic devices- Using electronic devices for working/studying- Using electronic devices for leisure (music, video, news,
games, internet surfing)- Calling- Eating/Drinking- Sleeping- Personal communication with fellow travelers- Other: _____
Scale: Y/N to all
29. How satisfied are you with followingaspects of your current main mode ofcommuting?
- Price for services- Reliability / punctuality- Service frequency- Comfort- Travel time- Easy to use- Enjoyment of travel
Scale: 1 =not at all; 5 = very muchAnswer-categories based on Swiss “Micro-sensus2010” Q5.29Main mode of commuting is deduced from Q21.
ENSCC Smart CommutingDeliverable 1.2 Version 1.0

Survey results of the mobile workers’ needsAPPENDIX – the questionnaire30. Why do you use the car for commuting? - No alternative
- Security- Reliability- Medical reasons- Weather- Faster- Cheaper- More flexible- Privacy- Environmental concerns- Transportation of goods- Transportation of other people- To avoid traffic jams- Free parking-space at work- Bad access to public transport
Other: _____
Scale: Y/N to allAnswer-categories based on Swiss “Micro-sensus2010” Q5.26 – 5.29
31. Why do you use public transport forcommuting?
- No alternative- Security- Reliability- Medical reasons- Weather- Faster- Cheaper- More flexible- Privacy- Environmental concerns- Transportation of goods- To avoid traffic jams- Possibility to work while commuting
Other: _____
Scale: Y/N to allAnswer-categories based on Swiss “Micro-sensus2010” Q5.26 – 5.29
ENSCC Smart CommutingDeliverable 1.2 Version 1.0

Survey results of the mobile workers’ needsAPPENDIX – the questionnaire32. Why do you use a bicycle/e-bike forcommuting?
- No alternative- Security- Reliability- Medical reasons- Weather- Faster- Cheaper- More flexible- Privacy- Environmental concerns- Transportation of goods- To avoid traffic jams- To do sport- Other: _____
Scale: Y/N to allAnswer-categories based on Swiss “Micro-sensus2010” Q5.26 – 5.29
33. Why do you walk for commuting? - No alternative- Security- Reliability- Medical reasons- Weather- Faster- Cheaper- More flexible- Privacy- Environmental concerns- Transportation of goods- To avoid traffic jams- To do sport- Bad public transport allotment- Other: _____
Scale: Y/N to allAnswer-categories based on Swiss “Micro-sensus2010” Q5.26 – 5.29
ENSCC Smart CommutingDeliverable 1.2 Version 1.0

Survey results of the mobile workers’ needsAPPENDIX – the questionnaire34. Which of the following aspectswould encourage you to use PT morefrequently for commuting?
- Cheaper tickets- Tickets provided by the employer- More comfort in public transport vehicles- Better connecting services (decreased waiting time)- More frequent service- Decreased travel time- Improved reliability- Street tolls for private cars in city centers- Better safety-feeling- Better transport possibilities for luggage/goods- Park & ride offers- Better bicycle-transport opportunities- Better bicycle parking opportunities- Better walking accessibility- Opportunities to work during the trip- Other:________
Scale: Y/N to allAnswers based on Swiss “Micro-sensus 2010”Q9.6
35. What tools, infrastructure orservices would you need to work duringtrips?
Open_______
36. Could you imagine using one ormore of the following transport modesfor your commuting trips?
- Car sharing- Ride sharing (e.g. carpooling)- Bike sharing- On-demand service (taxi, uber, etc.)- Shared on-demand service- Other________
Scale: Y/N/haven’t heard of it to all
ENSCC Smart CommutingDeliverable 1.2 Version 1.0

Survey results of the mobile workers’ needsAPPENDIX – the questionnaire37. If you commute duringpeak hours, why?
- Childcare / school opening hours- Requirement of job- Company culture- Habit- Better connectivity / timetable- Other __________
Scale: Y/N to allIf no answer to this question ->They don’t commute during peakhours.
ENSCC Smart CommutingDeliverable 1.2 Version 1.0