enhancing the thermoelectric performance of calcium
TRANSCRIPT

Graduate Theses, Dissertations, and Problem Reports
2017
Enhancing the Thermoelectric Performance of Calcium Cobaltite Enhancing the Thermoelectric Performance of Calcium Cobaltite
through Cation Substitution and Non-Stoichiometric Addition through Cation Substitution and Non-Stoichiometric Addition
Cullen Boyle
Follow this and additional works at: https://researchrepository.wvu.edu/etd
Recommended Citation Recommended Citation Boyle, Cullen, "Enhancing the Thermoelectric Performance of Calcium Cobaltite through Cation Substitution and Non-Stoichiometric Addition" (2017). Graduate Theses, Dissertations, and Problem Reports. 5247. https://researchrepository.wvu.edu/etd/5247
This Dissertation is protected by copyright and/or related rights. It has been brought to you by the The Research Repository @ WVU with permission from the rights-holder(s). You are free to use this Dissertation in any way that is permitted by the copyright and related rights legislation that applies to your use. For other uses you must obtain permission from the rights-holder(s) directly, unless additional rights are indicated by a Creative Commons license in the record and/ or on the work itself. This Dissertation has been accepted for inclusion in WVU Graduate Theses, Dissertations, and Problem Reports collection by an authorized administrator of The Research Repository @ WVU. For more information, please contact [email protected].

Enhancing the Thermoelectric Performance of Calcium Cobaltite through Cation Substitution and Non-
Stoichiometric Addition
Cullen Boyle
Dissertation submitted to the Benjamin Statler College of Engineering and Mineral Resources
at West Virginia University
in partial fulfillment of the requirements for the degree of
Doctor of Philosophy in Mechanical and Aerospace Engineering
Committee members:
Xueyan Song, Ph.D., Chair Yun Chen, Ph.D.
Jacky Prucz Ph.D. Dustin McIntyre Ph.D.
Hailin Li Ph.D. Bruce Kang Ph.D.
Department of Mechanical and Aerospace Engineering
Morgantown, West Virginia 2017
Keywords: Thermoelectric, Oxide, Grain Boundary, Segregation Copyright 2017 Cullen Boyle

Abstract
Enhancing the Thermoelectric Performance of Calcium Cobaltite through Cation Substitution and Non-Stoichiometric Addition
Cullen Boyle
Thermoelectric (TE) materials have the unique ability to convert temperature
differences directly into electricity due to the Seebeck effect. Thermoelectric generators
have a variety of applications including waste heat recovery for power plants and
automobiles. For high-temperature waste-heat recovery, misfit layered calcium cobaltite,
Ca3Co4O9, is one of the most promising p-type TE oxides offering good durability in air
with low cost and minimized environmental impact. A challenge for developing
polycrystalline calcium cobaltite TE materials is to improve its energy conversion
efficiency for large scale applications. The energy conversion efficiency of TE materials
is characterized using the figure-of-merit ZT, which is defined as ZT = S2ρ-1Κ-1T, where
S, ρ, S2ρ-1, Κ-1, and T are Seebeck coefficient, electrical resistivity, power factor, thermal
conductivity, and temperature respectively. State of the art commercial conventional TE
materials, such as bismuth telluride (Bi2Te3) and lead telluride (PbTe), possess values of
ZT ≈ 1, which corresponds to an energy conversion efficiency of 10%. Calcium cobaltite
single crystals show extraordinary TE performance with an extrapolated ZT value of 0.87
at 973 K.4 By contrast, the TE performance of polycrystals is reported to be only ~20% of
that from the single crystal and with the commonly measured ZT of ~0.2 at ~900 K. This
dissertation focuses on improving the performance of polycrystalline Ca3Co4O9 ceramics
for large scale applications. The present work demonstrates the feasibility of increasing
the values of Seebeck coefficient, S and power factor of calcium cobaltite Ca3Co4O9
ceramics through dopant grain boundary (GB) segregation. For the first time in the field
of thermoelectrics, various dopants which include Bi, Ba, and co-dopants Bi-Ba were
proved to segregate to the GBs and dramatically increased the ZT of Ca3Co4O9, and a
high ZT of 0.52 was achieved for Ca3Co4O9 ceramics through dopants grain boundary
segregation. The method of introducing the dopants to the grain boundaries, and their
origin of the performance enhancement of thermoelectric oxide ceramics were thoroughly
investigated and presented in this dissertation.

iii
Acknowledgments
I would like to extend my greatest thanks to my advisor Dr. Xueyan Song for all of
her help throughout my research experience. She believed in me from the day she first
approached me to be a part of her research group. She was always interested in my input
and took my ideas and concerns seriously which allowed me to grow as a student,
researcher, and a person. She taught me how to approach and analyze a situation from
the best perspective and to never give up. She was always encouraging and pushing me
to reach my potential. She demonstrated and conducted herself in a professional fashion
and set an example for me to look up to and something to strive for.
I would like to thank to Dr. Chen for his patience and the knowledge he has
bestowed upon me. Thank you for everything you have taught me these past years in the
lab including the constant refreshers and reminders necessary for me to fully understand
and grasp a concept. Thank you for teaching me patience, dedication, and attention to
the finer details.
Thank you to Dr. Victor Mucino for guiding me during the times I did not have an
advisor and continuing to help me through this process. You pushed me and gave me
someone to bounce ideas off of when I had no one else to consult. When I was new to
the area and had no idea how to proceed in the program you gave me direction and
helped me to choose my coursework, find my interests, and obtain funding. Thank you
for your kind words of wisdom.
I would like to thank my committee members for their valuable time and effort to
help guide and advise me through this endeavor.
A very special thank you to my family. I would not be where I am today without
your constant encouragement and belief in me. Thank you to my mother and father for
the encouragement to go back to school and further my degree, even if it meant going
months at a time not seeing you. You were always there to help me see things
optimistically when things looked bleak. You gave me someone to talk to when I was
feeling frustrated and were always there to reassure me during moments of uncertainty.
Your patience and unconditional support throughout my many years of schooling has
allowed me to achieve something great that I otherwise would have never thought
possible. You taught me the value of hard work and how to be the best version of myself
even when the task felt impossible. The morals and beliefs you have instilled in me gave
me the fortitude and confidence to follow my interests and dreams and to set goals no
matter how difficult the path may seem.
Lastly, I would like to thank God for giving me the capacity to constantly push and
better myself no matter the task. For creating a world full of wonder and awe which allows
scientist to ask the question ‘Why?’ and, if driven enough, the ability to find the answers.
Without the constant mysteries and perpetual questions of the world we would not have
a reason to search for answers and push boundaries in the first place.

iv
Table of Contents Abstract……………….…………..……………………………………………………………...ii
Acknowledgments……………..………………………………………………………………..iii
Table of Contents……………………...……………………………………………………….iv
List of Figures.……………………..…………………………………………………...……...viii
List of Tables.……………………..…………………………………………………...…….....xii
Chapter 1: Background Review of Thermoelectric Generators and Materials ...... 13
1.1 Brief introduction of thermoelectric generators .............................................. 13
1.2 P & n type of thermoelectric materials .............................................................. 15
1.3 Figure of Merit ZT and specific ZTs of various materials ................................ 20
1.4 Physical characteristics of thermoelectric materials ...................................... 22
1.4.1 Electrical Properties of p- & n- type materials ................................................. 22
1.4.2 Thermal Properties of p- & n- type materials .................................................. 26
1.5 Oxides and Calcium Cobaltite as Thermoelectric materials ........................... 29
1.5.1 Use of oxides as Thermoelectric Materials ..................................................... 29
1.5.2 Crystal Structure and anisotropic nature of Ca3Co4O9 .................................... 34
1.5.3 Current Status of Ca3Co4O9 Thermoelectric Performance Reported in
Literatures ................................................................................................................. 37
1.6 References ............................................................................................................ 42
Chapter 2: Research Objectives and Methodology .................................................. 47
2.1 Objectives ............................................................................................................. 47
2.2 Methodology ......................................................................................................... 49
Chapter 3: Effect of Bismuth Telluride Addition on the Electrical Performance of
Ca3Co4O9 Ceramics ..................................................................................................... 53
3.1 Background & motivation of using Bismuth Telluride as a dopant in
Ca3Co4O9 ..................................................................................................................... 53
3.2 Experimental Procedure ..................................................................................... 55
3.3 Electrical Performance of Ca3Co4O9 doped with Bi2Te3 .................................. 57
3.4 Summary of results for Bi2Te3 doped Ca3Co4O9 ............................................... 60
3.5 References ............................................................................................................ 62
Chapter 4: Improving the TE performance and crystal texture of Ca3Co4O9
ceramics through Bismuth Cation Substitution ....................................................... 64
4.1 Introduction to Cation Substitution ................................................................... 64

v
4.2 Background and motivation for Bismuth as a dopant in Ca3Co4O9 ............... 64
4.3 Experimental Procedure ..................................................................................... 69
4.4 Experimental Results of Bismuth doped Ca3Co4O9 using cation substitution
..................................................................................................................................... 71
4.4.1 Presence of bismuth in the lattice & at the grain boundary of Ca3Co4O9
ceramics ................................................................................................................... 71
4.4.2 Power factor enhancement of Ca3Co4O9 through Bismuth Substitution of Ca 74
4.4.3 Microstructure of bismuth doped Ca3Co4O9 .................................................... 76
4.4.4 Nanostructure of bismuth doped Ca3Co4O9 .................................................... 78
4.4.5 Impact of sample density on thermal conductivity........................................... 80
4.4.6 Significance of low thermal conductivity for achieving the high Figure of Merit
.................................................................................................................................. 82
4.5 Summary of results for Bismuth cation substitution in Ca3Co4O9 ................. 84
4.6 References ............................................................................................................ 87
Chapter 5: The Versatility of Bismuth doping through Non-stoichiometric Addition
of Ca3Co4O9 .................................................................................................................. 89
5.1 Background and motivation for non-stoichiometric addition method .......... 89
5.2 Experimental Procedure ..................................................................................... 90
5.3 Simultaneously doping the lattice and grain boundary .................................. 92
5.3.1 Increasing the carrier mobility through bismuth non-stoichiometric addition .. 92
5.3.2 Improvement of grain alignment along with boundary segregation ................ 94
5.3.3 Significance of Phonon Scattering and a small Mean Free Path (MFP) ....... 100
5.3.4 Figure of merit of bismuth non-stoichiometric addition doped Ca3Co4O9 ..... 102
5.4 Effects of processing parameters on electrical & thermal properties ......... 103
5.4.1 Electrical performance of Ca3Bi3Co4O9 varying ceramic processing
parameters .............................................................................................................. 104
5.5 Summary of results for bismuth non-stoichiometric addition of Ca3Co4O9 109
5.6 References .......................................................................................................... 112
Chapter 6: Non-stoichiometric Addition of Barium to Enhance Electrical Power
Factor of Ca3Co4O9 .................................................................................................... 115
6.1 Background and motivation for Barium as a dopant in Ca3Co4O9 ............... 115
6.2 Experimental Procedure ................................................................................... 116
6.3 Effect of barium’s grain boundary segregation on the power factor ........... 118
6.3.1 Increased electrical properties of Ca3Co4O9 through Ba addition ................ 118

vi
6.3.2 Microstructure and nanostructure of Barium doped Ca3Co4O9 ..................... 121
6.4 Summary of electrical properties of Barium non-stoichiometric addition of
Ca3Co4O9 ................................................................................................................... 124
6.5 References .......................................................................................................... 126
Chapter 7: Non-Stoichiometric dual doping of Bismuth and Barium ................... 127
7.1 Motivation of introducing dual dopants using non-stoichiometric addition
................................................................................................................................... 127
7.2 Experimental Procedure ................................................................................... 128
7.3 Finding a balance between carrier mobility & concentration through tuning
dopant concentration .............................................................................................. 130
7.4 Summary of results for doping Ca3Co4O9 using dual dopants Bismuth &
Barium through non-stoichiometric addition ....................................................... 135
7.5 References .......................................................................................................... 137
Chapter 8: Dual Doping Ca3Co4O9 through Cationic Substitution & Non-
Stoichiometric Addition ............................................................................................ 139
8.1 Background and motivation for dual doping with cation substitution and
non-stoichiometric addition ................................................................................... 139
8.2 Experimental Procedure ................................................................................... 140
8.3 Comparison of Non-stoichiometric dual doping to Cation Substitution &
Non-stoichiometric dual doping ............................................................................. 142
8.4 Summary of results for cation substitution & non-stoichiometric addition
dual doping of Ca3Co4O9 ......................................................................................... 146
8.5 References .......................................................................................................... 148
Chapter 9: Optimization of Dual Doping Ca3Co4O9 by Controlling Grain Growth &
Texture while Enhancing Absolute Seebeck Coefficient ....................................... 150
9.1 Motivation ........................................................................................................... 150
9.2 Experimental Procedure ................................................................................... 151
9.3 Decreased electrical resistivity and enhanced thermoelectric properties of
Ca3Co4O9 induced by dual doping ......................................................................... 153
9.3.1 Low electrical resistivity achieved through dual doping ................................ 153
9.3.2 Fine tuning eletrical resistivity and Seebeck coefficient through dual dopants.
................................................................................................................................ 154
9.4 Microstructure of dual doped Bismuth & Barium .......................................... 157
9.4.1 Structure and lattice parameters ................................................................... 157
9.4.2 Texture and Grain Alignment ........................................................................ 159

vii
9.5 Nanostructure analysis of dual doped Bismuth & Barium through use of
TEM ............................................................................................................................ 161
9.6 Calculating the thermal conductivities and ZT of dual doped Ca3Co4O9 .... 164
9.7 Summary of results for Ca3Co4O9 dual doping of bismuth cation substitution
& barium non-stoichiometric addition ................................................................... 166
9.8 References .......................................................................................................... 168
Chapter 10: Conclusion and Suggestions for Future Work .................................. 170
10.1 Conclusion ....................................................................................................... 170
10.2 Suggestions for future work ........................................................................... 177
10.3 References ........................................................................................................ 178
Publications ............................................................................................................... 179

viii
List of Figures
Figure 1 Cutaway of Thermoelectric Generator. ............................................................. 14
Figure 2 Inside of a Photovoltaic cell .............................................................................. 15
Figure 3 Schematic of thermoelectric device. ................................................................. 17
Figure 4 P- & n- type legs of a Thermoelectric Generator. ............................................. 18
Figure 5 Energy band diagram of a semiconductor. [1] .................................................. 20
Figure 6 ZT for various p-type thermoelectric materials. ................................................ 22
Figure 7 Typical waste heat and operating temperature ranges of various thermoelectric
materials .......................................................................................................... 30
Figure 8 Log electrical conductivity for Ca3Co4O9 with various dopants ........................ 32
Figure 9 Absolute Seebeck coefficient for Ca3Co4O9 with various dopants. .................. 33
Figure 10 Log thermal conductivities of Ca3Co4O9 with various dopants. ...................... 33
Figure 11 Figure of merit for Ca3Co4O9 with various dopants. ....................................... 34
Figure 12 Schematic of alternating subsystems of Ca3Co4O9 crystal structure ............. 35
Figure 13 Schematic of lattice misfit. .............................................................................. 37
Figure 14 Dimensionless figure of merit vs. temperature of typical current thermoelectric
materials .......................................................................................................... 40
Figure 15 Temperature dependence of electrical resistivity for Ca3Co4O9 Bi2Te3
addition. ........................................................................................................... 58
Figure 16 Temperature dependence of absolute seebeck coefficient for Ca3Co4O9
Bi2Te3 addition. ............................................................................................... 59
Figure 17 Temperature dependence of power factor for Ca3Co4O9 Bi2Te3 addition. ..... 60
Figure 18 Temperature dependence of figure of merit for Ca3-xBixCo4O9+δ (x=0.0 and
0.5) [9] .............................................................................................................. 66
Figure 19 Lattice parameters calculated by Rietveld analysis as a function of Bi
composition b1 and b2 correspond to the b parameters of [Ca2CoO3] and
[CoO2] layers, respectively. [11] ....................................................................... 68
Figure 20 Temperature dependence of electrical resistivity for Ca3-xBixCo4O9 bismuth
cation substitution. .......................................................................................... 72
Figure 21 Temperature dependence of absolute seebeck coefficient for Ca3-xBixCo4O9
bismuth cation substitution. ............................................................................ 74
Figure 22 Temperature dependence of power factor for Ca3-xBixCo4O9 bismuth cation
substitution. ..................................................................................................... 76

ix
Figure 23 SEM cross-sectional view of undoped Ca3Co4O9 and doped Ca3-xBixCo4O9
with x=0.0, 0.1, 0.2, 0.3, 0.4 ............................................................................ 77
Figure 24 TEM nanostructure of Ca2.7Bi0.3Co4O9 ............................................................ 79
Figure 25 TEM images of undoped and bismuth doped Ca3Co4O9. ............................... 80
Figure 26 Temperature dependence for thermal conductivity of Ca3-xBixCo4O9 bismuth
cation substitution. .......................................................................................... 81
Figure 27 Temperature dependence of figure of merit for Ca3-xBixCo4O9 bismuth cation
substitution. ..................................................................................................... 83
Figure 28 Temperature dependence of the ZT values for undoped Ca3Co4O9 and
(Ca0.95Bi0.05)3Co4O9 ......................................................................................... 84
Figure 29 Microstructure drawing of undoped Ca3Co4O9 and Ca2.7Bi0.3Co4O9. ............. 85
Figure 30 Temperature dependence of electrical resistivity for Ca3BiuCo4O9 bismuth
non-stoichiometric addition. ............................................................................ 93
Figure 31 SEM cross-sectional view of undoped Ca3Co4O9 and doped Ca3BiuCo4O9 with
u=0.0, 0.1, 0.2, 0.3, and 0.35. ......................................................................... 94
Figure 32 Temperature dependence of absolute seebeck coefficient for Ca3BiuCo4O9
bismuth non-stoichiometric addition. .............................................................. 95
Figure 33 X-Ray Diffraction patterns of undoped and doped Ca3Co4O9. ....................... 96
Figure 34 (004) peak from X-Ray Diffraction patterns of undoped and doped Ca3Co4O9
powders. .......................................................................................................... 97
Figure 35 (a) Temperature dependence of electrical resistivity and (b) absolute seebeck
coefficient of Ca3BiuCo4O9 bismuth non-stoichiometric addition. ................... 99
Figure 36 Temperature dependence of the power factor for Ca3BiuCo4O9 bismuth non-
stoichiometric addition. ................................................................................. 100
Figure 37 Temperature dependence of thermal conductivity for Ca3BiuCo4O9 bismuth
non-stoichiometric addition. .......................................................................... 102
Figure 38 Temperature dependence of figure of merit for Ca3BiuCo4O9 bismuth non-
stoichiometric addition. ................................................................................. 103
Figure 39 Temperature dependence of electrical resistivity for Ca3Bi0.3Co4O9 bismuth
non-stoichiometric addition with pressing parameter variation. ................... 105
Figure 40 SEM cross-sectional view of undoped Ca3Co4O9 and doped Ca3BiuCo4O9 with
u=0.0, 0.1, 0.2, 0.3, 0.3 (0.75 GPa), and 0.35. ............................................. 106
Figure 41 Temperature dependence of power factor for Ca3Bi0.3Co4O9 bismuth non-
stoichiometric addition with pressing parameter variation. ........................... 107

x
Figure 42 Temperature dependence of thermal conductivity for Ca3Bi0.3Co4O9 bismuth
non-stoichiometric addition with pressing parameter variation. ................... 108
Figure 43 Temperature dependence of figure of merit for Ca3Bi0.3Co4O9 bismuth non-
stoichiometric addition with pressing parameter variation. ........................... 109
Figure 44 Microstructure drawing of undoped Ca3Co4O9 and Ca2.7Bi0.3Co4O9. ........... 111
Figure 45 Temperature dependence of electrical resistivity for Ca3BauCo4O9 barium
non-stoichiometric addition ........................................................................... 119
Figure 46 Temperature dependence of absolute seebeck coefficient for Ca3BauCo4O9
barium non-stoichiometric addition. .............................................................. 120
Figure 47 Temperature dependence of power factor for Ca3BauCo4O9 barium non-
stoichiometric addition. ................................................................................. 121
Figure 48 SEM cross-sectional view of undoped Ca3Co4O9 and doped Ca3BauCo4O9
with u=0.0, 0.01, 0.05, and 0.1. .................................................................... 122
Figure 49 Diffraction contrast images and the selected area diffraction patterns from the
Ca3Ba0.05Co4O9 sample. ............................................................................... 123
Figure 50 Microstructure drawing of undoped Ca3Co4O9 and Ca3Ba0.05Co4O9. ........... 125
Figure 51 Temperature dependence of electrical resistivity for Ca3BiuBawCo4O9 bismuth
& barium non-stoichiometric addition where u=0.0, 0.02, 0.05, and 0.07. ... 132
Figure 52 Temperature dependence of absolute seebeck coefficient for
Ca3BiuBawCo4O9 bismuth & barium non-stoichiometric addition where u=0.0,
0.02, 0.05, and 0.07. ..................................................................................... 133
Figure 53 Temperature dependence of power factor for Ca3BiuBawCo4O9 bismuth &
barium non-stoichiometric addition where u=0.0, 0.02, 0.05, and 0.07. ...... 135
Figure 54 Temperature dependence of electrical resistivity for Ca3-xBixBauCo4O9
bismuth cation substitution & barium non-stoichiometric addition where u=0.0,
0.02, 0.05, and 0.07. ..................................................................................... 143
Figure 55 Temperature dependence of absolute seebeck coefficient for
Ca2.8Bi0.2BauCo4O9 bismuth cation substitution & barium non-stoichiometric
addition where u=0.0, 0.02, 0.05, and 0.07. ................................................. 145
Figure 56 Temperature dependence of power factor for Ca2.8Bi0.2BauCo4O9 bismuth
cation substitution & barium non-stoichiometric addition where u=0.0, 0.02,
0.05, and 0.07. .............................................................................................. 146
Figure 57 Temperature dependence of electrical resistivity for Ca2.9Bi0.1BauCo4O9
bismuth cation substitution & barium non-stoichiometric addition where u=0.0,
0.02, 0.05, 0.07, and 0.1. .............................................................................. 154

xi
Figure 58 Temperature dependence of absolute seebeck coefficient for
Ca2.9Bi0.1BauCo4O9 bismuth cation substitution & barium non-stoichiometric
addition where u=0.0, 0.02, 0.05, 0.07, and 0.1 ........................................... 156
Figure 59 Temperature dependence of power factor for Ca2.9Bi0.1BauCo4O9 bismuth
cation substitution & barium non-stoichiometric addition where u=0.0, 0.02,
0.05, 0.07, and 0.1. ....................................................................................... 157
Figure 60 XRD powder diffraction patterns for the Ca3-xBixBauCo4O9 samples. .......... 158
Figure 61 SEM images showing crystal texture development of the Ca3Co4O9 samples
with dual element doping of bismuth and barium simultaneously. ............... 160
Figure 62 Microstructure drawing of undoped Ca3Co4O9 and Ca2.9Bi0.1Ba0.07Co4O9. .. 161
Figure 63 (a) Diffraction contrast image and (b) high resolution TEM from the
Ca2.9Bi0.1Co4O9 sample. ................................................................................ 162
Figure 64 TEM images from the Ca2.9Bi0.1Ba0.07Co4O9 sample. ................................... 163
Figure 65 Temperature dependence of thermal conductivity for Ca2.9Bi0.1BauCo4O9
bismuth cation substitution and barium non-stoichiometric addition where
u=0.0, 0.05, and 0.07. ................................................................................... 165
Figure 66 Temperature dependence of figure of merit for Ca2.9Bi0.1BauCo4O9 bismuth
cation substitution and barium non-stoichiometric addition where u=0.0, 0.05,
and 0.07. ....................................................................................................... 166
Figure 67 Microstructure development of undoped Ca3Co4O9, Ca2.7Bi0.3Co4O9,
Ca3Ba0.05Co4O9, and Ca2.9Bi0.1Ba0.07Co4O9. ................................................. 173
Figure 68 Comparisons of temperature dependence of power factor between a)
Ca2.8Bi0.2Co4O9, b) Ca3Bi0.3Co4O9, c) Ca3Ba0.05Co4O9, and d)
Ca2.9Bi0.1Ba0.07Co4O9. ................................................................................... 175
Figure 69 Comparisons of temperature dependence of figure of merit between a)
Ca2.8Bi0.2Co4O9, b) Ca3Bi0.3Co4O9, c) Ca3Ba0.05Co4O9, and d)
Ca2.9Bi0.1Ba0.07Co4O9. ................................................................................... 176

xii
List of Tables
Table 1 EDS spot examination showing the chemistry of segregation regions and
neighboring grains in the sample Ca2.7Bi0.3Co4O9. ............................................ 79
Table 2 Chemical Compositions of two neighboring grains A (spots 1, 2, 3, and 4) and B
(spots 9, 10, 11, and 12) and at the grain boundary between (spots 5, 6, 7, and
8) shown in figure 42. ....................................................................................... 124
Table 3 Lattice parameters for samples with different chemistries ............................... 159
Table 4 Chemical compositions of two neighboring grains and grain boundary in
between. ........................................................................................................... 162
Table 5 Chemical compositions of two neighboring grains and grain boundary in
between for the Ca2.9Bi0.1Ba0.07Co4O9 sample. ................................................ 163

Chapter 1: Background Review of Thermoelectric Generators and Materials
13
Chapter 1:
Background Review of Thermoelectric Generators and Materials
1.1 Brief introduction of thermoelectric generators
Thermoelectric generators (TEGs) are silent devices having no moving parts and are
very low maintenance. [1,2] This enables them to be ideal in harsh environments and used
in situations where mechanical servicing is not possible or easily accessible. TEGs are
also environmentally friendly causing no CO2 emissions and are used to repurpose
energy through harnessing waste heat. [1,2] Figure 1 shows a common design and set up
of a thermoelectric generator. In 1821 Thomas Seebeck discovered that dissimilar
material subjected to different temperatures at opposite ends will produce a voltage. [3,4]
This voltage produced from the temperature gradient within became known as the
Seebeck Effect. This temperature gradient causes a heat flow within the material creating
an electrical potential and diffusing charge carriers throughout the material. [4] It is these
charge carriers that are responsible for the current within the material. He then realized
that by utilizing this property that heat, waste heat to be more exact, can be “captured”
and transformed directly into electrical energy.

Chapter 1: Background Review of Thermoelectric Generators and Materials
14
Figure 1 Cutaway of Thermoelectric Generator. [5]
As of now there are two main methods to utilize the Seebeck Effect. The first is
through the Photovoltaic process or solar thermal processes.[6] Photovoltaic process
shown in figure 2 is the excitement of the electron-hole pair, through light, to create a
current within the device.[6,7] This process is commonly seen being used with a flat panel,
mainly seen on rooftops of houses, buildings, or in solar farms to harness the light from
the Sun.[6] The second is through solar thermal process which utilizes mechanical waste
heat through engines.[6, 8] In this instance a device can be designed to capture heat from
household appliances or heat supplied by means of solar hot-water systems or even from
the waste heat of a car engine. More than 60% of energy is lost, mostly as waste heat,
and most mechanical devices operate at a 30% efficiency, meaning the other 70% is lost

Chapter 1: Background Review of Thermoelectric Generators and Materials
15
during combustion or dissipated into the atmosphere as waste heat as well, causing these
all to be optimal methods of harvesting wasted energy. [9,10,11]
Figure 2 Inside of a Photovoltaic cell [12]
1.2 P & n type of thermoelectric materials
All circuits are comprised of components with specific charge carriers and just as
batteries have a positive and a negative side, so too do TEGs. The charge carriers are
the electron-hole pair and the charge-carrying mediums are the negative and positive
materials of the device, referred to as the n-type and p-type, respectively. These
Chapter 1: Background Review of Thermoelectric Generators and Materials
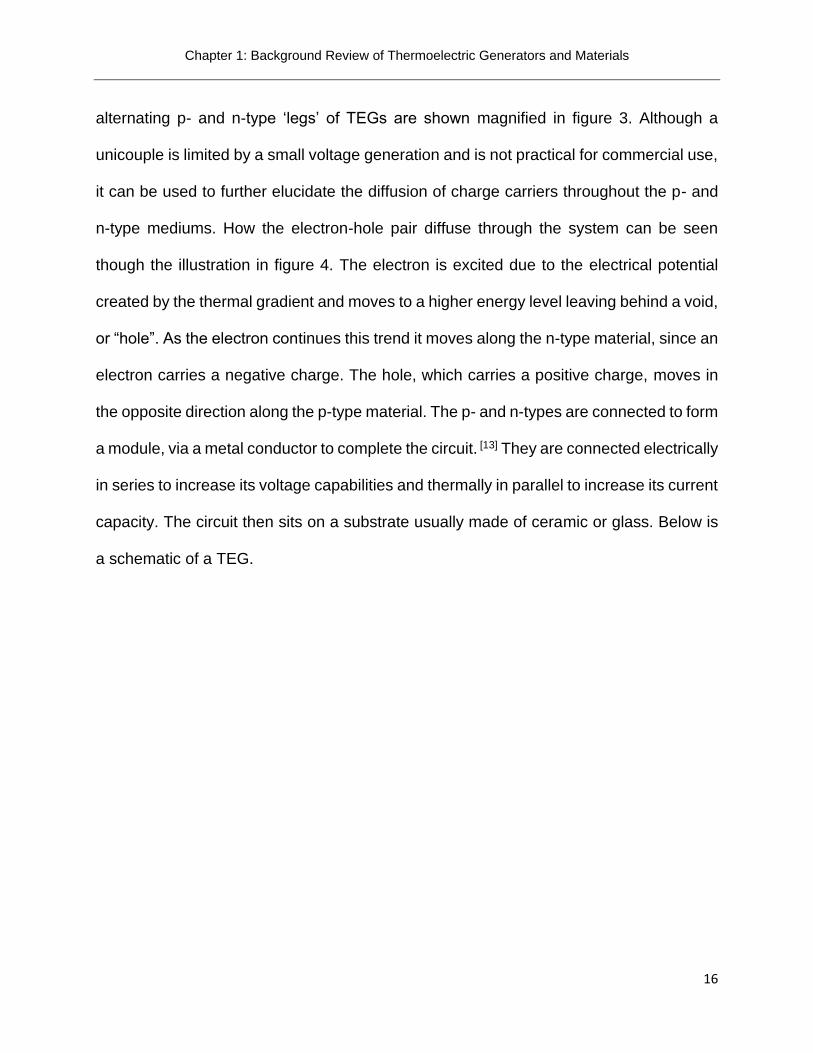
16
alternating p- and n-type ‘legs’ of TEGs are shown magnified in figure 3. Although a
unicouple is limited by a small voltage generation and is not practical for commercial use,
it can be used to further elucidate the diffusion of charge carriers throughout the p- and
n-type mediums. How the electron-hole pair diffuse through the system can be seen
though the illustration in figure 4. The electron is excited due to the electrical potential
created by the thermal gradient and moves to a higher energy level leaving behind a void,
or “hole”. As the electron continues this trend it moves along the n-type material, since an
electron carries a negative charge. The hole, which carries a positive charge, moves in
the opposite direction along the p-type material. The p- and n-types are connected to form
a module, via a metal conductor to complete the circuit. [13] They are connected electrically
in series to increase its voltage capabilities and thermally in parallel to increase its current
capacity. The circuit then sits on a substrate usually made of ceramic or glass. Below is
a schematic of a TEG.

Chapter 1: Background Review of Thermoelectric Generators and Materials
17
Figure 3 Schematic of thermoelectric device. [14]
A semiconductor has a conductivity of that between an insulator and a metal and is
often described by its dominating charge carrier. An intrinsic semiconductor is a pure
semiconductor uninfluenced by external factors. Its number of charge carriers is strictly
determined by the properties of the material itself. When an intrinsic semiconductor is
doped with an impurity it takes on extrinsic properties pertaining to the specific dopant
thus making it an extrinsic semiconductor. [15,16] This allows the electron or hole to be the
dominating carrier thus distinguishing between the p- and n-type. [10,11] The Seebeck
coefficient is another distinguishing factor in deciding whether the material is p- or n-type.

Chapter 1: Background Review of Thermoelectric Generators and Materials
18
A p-type material will have a positive Seebeck coefficient just as an n-type material would
have a negative Seebeck coefficient. Figure 4 illustrates how the electron-hole pair move
through their respective materials.
Figure 4 P- & n- type legs of a Thermoelectric Generator. [4]
The two main kinds of dopants are donors and acceptors. Doping a semiconductor
has various effects on the material’s properties such as indirectly affecting its electrical
properties by directly affecting its carrier concentration. [17,18Error! Bookmark not defined.] Doping
allows for energy states within the band gap, which is the gap between the conductive
band and the valence band shown in figure 5. [18] Depending on the dopant type these
energy states can be close to its corresponding energy band. [Error! Bookmark not defined.]
Donor dopants will create energy states close to the conduction band, while acceptor

Chapter 1: Background Review of Thermoelectric Generators and Materials
19
dopants will create energy states close to the valence band. [Error! Bookmark not defined.] This
gap that is created between the energy state and its nearest band is referred to as the
dopant site. [Error! Bookmark not defined.]
A donor dopant has extra valence electrons so that when it is introduced as an impurity
it will increase the amount of electrons in the conductor and in turn increase its overall
negative charge. This causes the electron to be the majority charge carrier making it a
negative material or an n-type semiconductor. [15,16] An acceptor impurity atom has fewer
valence electrons than the atom it’s replacing allowing it to accept electrons from the
conductor so there will be a decrease in electrons thus decreasing its electrical charge.
Decreasing the electrical charge will make it positively charged causing the hole to be the
majority charge carrier. [15,16] This component becomes a positive material or a p-type
semiconductor. Together, the n- and p-type semiconductors work in tandem to create a
circuit for current to pass through.
Chapter 1: Background Review of Thermoelectric Generators and Materials
20
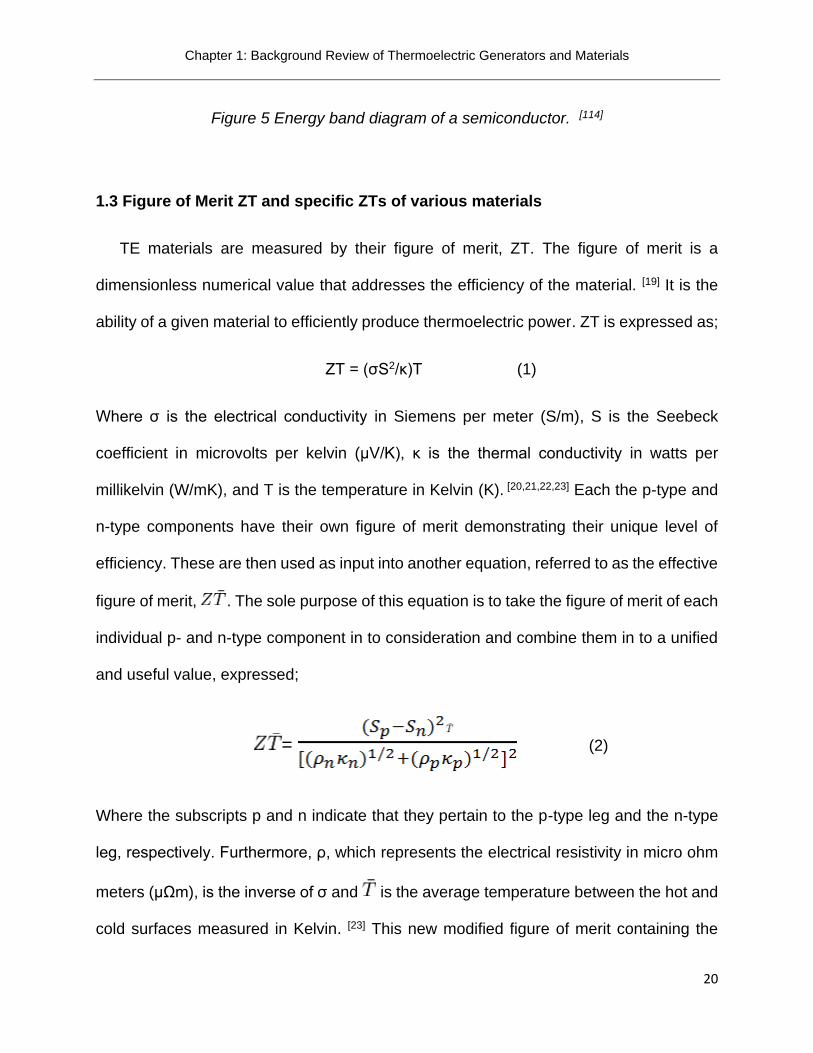
Figure 5 Energy band diagram of a semiconductor. [114]
1.3 Figure of Merit ZT and specific ZTs of various materials
TE materials are measured by their figure of merit, ZT. The figure of merit is a
dimensionless numerical value that addresses the efficiency of the material. [19] It is the
ability of a given material to efficiently produce thermoelectric power. ZT is expressed as;
ZT = (σS2/κ)T (1)
Where σ is the electrical conductivity in Siemens per meter (S/m), S is the Seebeck
coefficient in microvolts per kelvin (µV/K), κ is the thermal conductivity in watts per
millikelvin (W/mK), and T is the temperature in Kelvin (K). [20,21,22,23] Each the p-type and
n-type components have their own figure of merit demonstrating their unique level of
efficiency. These are then used as input into another equation, referred to as the effective
figure of merit, . The sole purpose of this equation is to take the figure of merit of each
individual p- and n-type component in to consideration and combine them in to a unified
and useful value, expressed;
= (2)
Where the subscripts p and n indicate that they pertain to the p-type leg and the n-type
leg, respectively. Furthermore, ρ, which represents the electrical resistivity in micro ohm
meters (µΩm), is the inverse of σ and is the average temperature between the hot and
cold surfaces measured in Kelvin. [23] This new modified figure of merit containing the

Chapter 1: Background Review of Thermoelectric Generators and Materials
21
efficiencies of both the p and n types can now be used in an equation discovered in 1909
by Edmund Altenkirch to find the overall maximum efficiency of the device
ɳmax = (3)
Where the subscripts H and C represent hot and cold temperatures in Kelvin respectively.
[3,23] Since the scope of this paper only encompasses the p-type, the main focus will be
on equation 1, the figure of merit.
The above is an explanation of the physical meaning of this dimensionless figure
of merit; however, to fully grasp its concept and further demonstrate its importance, the
figure of merits of different materials can be compared. This way the figure of merit of a
particular material, when discussed, can be put into perspective with respect to other
types of materials. As seen in figure 6, lead, Pb, containing material demonstrates a high
figure of merit. The main concerns with this material is that it only produces this efficiency
at the mid temperature ranges and lead has a high toxicity.
When analyzing the high temperature ranges there are two standout materials in
figure 6. Yb14MnSb11 has a high figure of merit in the high temperature range but
antimony, Sb is known to be toxic as well making it an undesirable candidate. Silicon
germanium, SiGe, is not considered a toxic material; however, it oxidizes at high
temperatures necessitating its use in a vacuum environment. These are common issues
in existing materials leaving research advances in the high temperature range wide open
for materials containing low toxicity at a low cost. To be competitive in the high

Chapter 1: Background Review of Thermoelectric Generators and Materials
22
temperature range a material’s figure of merit must surpass that of silicon germanium or
be competitive at a lower cost and/or toxicity.
Figure 6 ZT for various p-type thermoelectric materials. [24]
1.4 Physical characteristics of thermoelectric materials
1.4.1 Electrical Properties of p- & n- type materials
To better understand the figure of merit its subcomponents such as the electrical
conductivity, Absolute Seebeck Coefficient and the thermal conductivity must be further
explained. The electrical conductivity of a material is its measurement or ability to conduct
or transfer electricity. A high electrical conductivity means that the component in question
will allow electricity to flow more freely through it because it will conduct it not resist it.

Chapter 1: Background Review of Thermoelectric Generators and Materials
23
This flow or speed is also referred to as its carrier mobility. [25] The three main factors that
affect the conductivity are demonstrated in the equation below
ρ = = (4)
Where ρ is the electrical resistivity in micro ohm meters (µΩm), σ is the electrical
conductivity in Siemens per meter (S/m), mu, µ, is the carrier mobility in centimeters
squared per Volt seconds (cm2/V•s), n is the carrier concentration in units per centimeter
cubed (cm-3), and e is the charge of the carrier. [25] For this reason the electrical
conductivity will be referred to in this dissertation as its reciprocal, or the electrical
resistivity.
Carrier concentration is the concentration of the dominating charge carrier for that
particular material and the carrier mobility is the freedom of flow of electrons throughout.
The concentration and mobility are both directly correlated and directly proportional to the
electrical conductivity, making them inversely proportional to the resistivity. If either the
carrier mobility or carrier concentration decreases, the resistivity increases and vice
versa. A high carrier mobility and high carrier concentration lead to good electrical
properties. [21] Conceptually a high mobility means the charge carrier in question can
move freely causing a flow of current and the higher the concentration the higher the flow
of current. Generally speaking, material with a high density will achieve a low electrical
resistivity. A high density reflects that of a material with high grain alignment which act as
the transport highway for the charge carriers. Material with poor alignment will contain

Chapter 1: Background Review of Thermoelectric Generators and Materials
24
more grains oriented more perpendicular to one another thus impeding the electron
transport.
The Seebeck coefficient is the proportionality constant between the voltage
produced and the difference in temperature across the junction of semiconductors. [3]
Platinum probes are used to measure the Seebeck coefficient since they are highly
unreactive, and they are resistant to corrosion even at high temperatures. The Relative
Seebeck Coefficient of the material is measured, which is the simultaneous influence of
the Seebeck Coefficient of the material and the contribution of the Seebeck Coefficient of
the platinum probes used to take the measurement. Only the Seebeck Coefficient of the
material is desired, referred to as the Absolute Seebeck Coefficient, so the influence of
the platinum probe must be subtracted from the relative Seebeck Coefficient. The
platinum thermocouple has been studied and accounted for in order to isolate the results
of just the material, leaving behind the desired Absolute Seebeck Coefficient.
The predicament with the two electrical properties (electrical resistivity and
Absolute Seebeck coefficient) is that they are intimately connected; however, not in a
favorable way. If a doping impurity deposits itself at the grain boundary when it is
introduced to the baseline it will act as a filter reducing the carrier concentration. This
reduction in carrier concentration will enhance the Seebeck coefficient as it will be seen
later on. A high carrier concentration is desirable to achieve a low resistivity yet a low
carrier concentration is beneficial for achieving a high Seebeck coefficient. To avoid this
paradox one can attempt to find a balance with the carrier mobility and carrier
concentration. When the carrier concentration is decreased, to benefit the Seebeck
coefficient, the carrier mobility can theoretically be increased to preserve the resistivity.

Chapter 1: Background Review of Thermoelectric Generators and Materials
25
The idea is to find the balance that optimizes both parameters. This is done mainly
through ion doping to create an extrinsic semiconductor. Doping with the proper impurity,
in theory, one should be able to alter the material’s structure and grain texture to improve
upon its properties.
To better demonstrate the electrical transport properties and make them more concise
they can be combined to form one factor. This combination, commonly referred to as the
power factor, is the materials ability to produce electrical power. [4,23] The power factor is
expressed as,
PF=S2σ (5)
Where S is the Absolute Seebeck Coefficient in microvolts per kelvin (µV/K) and σ is the
electrical conductivity in Siemens per meter (S/m). [4,23] The higher the power factor the
greater the electrical power. Also the Seebeck coefficient is a quadratic, meaning not only
does it dominate the outcome of the power factor but it negates the fact that an n-type
component has a negative Seebeck coefficient value which will then always give a
positive value for the power factor.
The figure of merit can easily be summed up as the division of the electrical
transport properties (power factor) by the thermal transport properties (thermal
conductivity). In order to achieve a desirable device, a high figure of merit must first be
attained. It has already been stated that this can be done by increasing its electrical
properties and decreasing its thermal properties. According to the Wiedemann-Franz
Law, the electrical conductivity, Absolute Seebeck Coefficient and thermal conductivity
are all interconnected. [19] In pursuance of lowering the thermal conductivity the electrical

Chapter 1: Background Review of Thermoelectric Generators and Materials
26
properties must suffer and vice versa. It has been shown so far how the electrical
conductivity and Absolute Seebeck coefficient are connected. Next is to demonstrate how
the thermal properties are intertwined in an adverse way as well.
1.4.2 Thermal Properties of p- & n- type materials
The thermal transport properties are comprised solely of the thermal conductivity
making it much more transparent to work with than the electrical properties. A low thermal
conductivity is desirable which assures that the device will not dissipate the system’s heat
but instead act as an insulator by trapping and using the heat. After all, the greater the
heat gradient the higher the voltage output of the device. This explains why TE generators
generally are not good heat sinks. The thermal conductivity is calculated by the equation
K=λCpρm (6)
Where K is the thermal conductivity in watts per millikelvin (W/mK), λ is the thermal
diffusivity in meters squared per seconds (m2/s), Cp is the specific heat in joules per
kilogram Kelvin (J/kg•K), and ρm is the mass density in grams per centimeter cubed
(g/cm3). [6]
Despite being more concise than the electrical transport properties, the thermal
conductivity is still a very difficult component to fine tune, in some ways perhaps more
difficult. Just as the electrical resistivity can be broken into the carrier concentration and
the carrier mobility, the thermal conductivity, K, too can be broken down into two
components shown by equation 7.
K=Ke+KL (7)
Chapter 1: Background Review of Thermoelectric Generators and Materials
27
Where Ke represents the electronic thermal conductivity and KL represents the lattice or
phonon thermal conductivity. [26,27,28] According to the Wiedemann-Franz Law the
electrical and thermal conductivities are intimately intertwined through the electronic
thermal conductivity as shown below.
Ke = LσT (8)
Where Ke is the electronic thermal conductivity, L is the Lorentz number (2.44 x 10⁻⁸ V2/K2
for free electrons), σ the electrical conductivity and T is the temperature in Kelvin. [26,27,28]
To be more exact, the electrical and thermal conductivities are directly correlated to each
other, through the electrical conductivity, as can be seen in equation 8. When the
electrical properties are improved, the thermal properties suffer which proves to be
problematic in the overall enhancement of the figure of merit, which is the overarching
goal.
It was later studied and found that when the electrical conductivity, σ, increases
with temperature, only the electronic thermal conductivity component, Ke, increases
shown in equation 8 and the phonon thermal conductivity, KL, is left unaffected. [29,30] It
was then discovered that the ratio of Ke/KL is very small so it can be assumed that the
phonon thermal conductivity is much greater than the electronic thermal conductivity and
thus is the dominant force in determining the overall thermal conductivity. [29,30] This allows
the lack of control over the increase in the electronic thermal conductivity to be of little
concern and focus can be moved to reducing the lattice thermal conductivity in order to
increase efficiency.

Chapter 1: Background Review of Thermoelectric Generators and Materials
28
Phonons play a crucial role in the electrical and thermal properties of
thermoelectric material. The p-type and n-type components are comprised of atoms that
are bound together in a three dimensional pattern forming what is called a crystal lattice.
[29,31] The atoms in the lattice act as if they are attached by springs thus vibrating due to
any external energy that may be expelled into the system. [29,31] In this case the energy
would be that of the waste heat which also creates the heat gradient to excite the atoms.
These vibrations create mechanical waves containing a specific energy and momentum.
[29,31] These wave “packets” of energy are treated as particles and are referred to as
phonons. Just as Einstein’s quanta or packets of light are referred to photons, packets of
lattice vibrational energy are referred to as phonons. Phonons and electrons are the main
excitations in solids. [32]
One way to decrease the lattice thermal conductivity is by enhancing phonon
scattering. [20,29,30] A common method used is to introduce heavy elements as dopants to
aid in this scattering. [33] Decreasing the thermal conductivity can also be done by
decreasing the grain size, thus having an increase in the boundary density. This increase
in boundary density will act as a filter and be responsible for controlling the carrier
concentration. Also, smaller grain size means more boundaries and a shorter mean-free
path (MFP). [29,30] The mean-free path is the path the phonon follows before its next
scattering event and the mean-free time is the amount of time until the next scattering
event. [29,30] The shorter the mean free path and mean free time are the more scattering
occurs and the lower the phonon thermal conductivity; the driving component of the
overall thermal conductivity.

Chapter 1: Background Review of Thermoelectric Generators and Materials
29
In the mid 1990’s a concept called “phonon glass electron crystal” was proposed
which decoupled the two components of the thermal conductivity allowing for a low
thermal conductivity, due to phonon scattering as in a glass, and a high electric
conductivity, due to increased electron mobility as in a crystal. [3,19] This way the electrical
properties can be improved upon without negatively effecting the thermal properties. As
of present day scientists have not yet found a perfect replica of the phonon glass electron
crystal scenario. [19]
1.5 Oxides and Calcium Cobaltite as Thermoelectric materials
1.5.1 Use of oxides as Thermoelectric Materials
Many approaches have been made to maximize the efficiency of the
Thermoelectric Generator. Although the design of the circuit can be altered, most hope
lies within doping the chemistries of the p-type and n-type material with impurities in order
to improve their electrical and thermal properties. Common thermoelectric materials used
today are doped alloy semiconductors such as Bi2Te3, PbTe and SiGe. [25] These
materials have poor durability at high temperatures, tend to oxidize and are unstable due
to decomposition. [34] These alloy semiconductors also seem to face the complication of
melting at high temperatures along with having a high toxicity and are costly. [34] These
characteristics are detailed in figure 7. These issues are unfavorable and have been the
cause for a search of better and more efficient materials.

Chapter 1: Background Review of Thermoelectric Generators and Materials
30
Figure 7 Typical waste heat and operating temperature ranges of various thermoelectric materials. [4]
Oxides were first overlooked as thermoelectric material due to the belief of their
having low figure of merits caused by poor carrier mobility from their ionic structures. [30,35]
However, the discovery of NaxCo2O4 in 1997 with a high Seebeck coefficient of around
100 µV/K at room temperature dismissed the conventional wisdom and ignited extensive
research into layered cobalt oxides. [15] Since oxides have high thermal and chemical
stability they present a much more promising alternative than alloy semiconductors.
Oxides are also easier to handle in the lab because of their nontoxicity and high oxide
resistance which can also be seen from figure 7. These attributes helped to push oxides
into the forefront of research.

Chapter 1: Background Review of Thermoelectric Generators and Materials
31
NaxCo2O4 is just one of many oxides that have been studied and are being used
in labs today. Ca3Co4O9 is another Co-based oxide that has a thermoelectric performance
of its single crystal comparable to that of alloys allowing it to be a promising candidate for
research. [34] Ca3Co4O9 has been studied extensively in the past years and it has been
found that the performance of the single crystal shows great promise as a thermoelectric
material. The figure of merit of the Ca3Co4O9 single crystal is ~0.87 at 973 K but the
polycrystalline bulk sample, with its highest ZT reported as 0.22 at 1173 K for pure
Ca3Co4O9 and 0.32 at 1000K for bismuth and sodium substitution, still needs
improvement and is not yet suitable for technical or commercial application. [36,37,38] This
is mainly due to an intrinsically low electrical conductivity and a high thermal conductivity.
[36]
Many attempts have been made to improve upon the thermoelectric performance
of this already promising material. Some solutions involve ion doping or altering the
fabrication process. Most hopes, however, are to decrease the thermal conductivity by
means of doping through cationic substitution at the Ca site with Sr, Y, Bi and other rare-
earth elements such as Yb, Lu, Dy, Er, Ho, and Eu which are detailed in figures 8-11. [4,27]
There are also reports of doping at the Co site which are included in figures 8-11 as well;
however, the Ca site has proven to be more beneficial and is what this dissertation will
focus on. The following four graphs were published by Jeffrey Fergus in Oxide materials
for high temperature thermoelectric energy conversion and detail the results of various
dopants in the Ca3Co4O9 ceramic and under differing processing parameters. VPP
represents the data from Ca3Co4O9 ceramics with varied processing parameters under
undoped conditions.

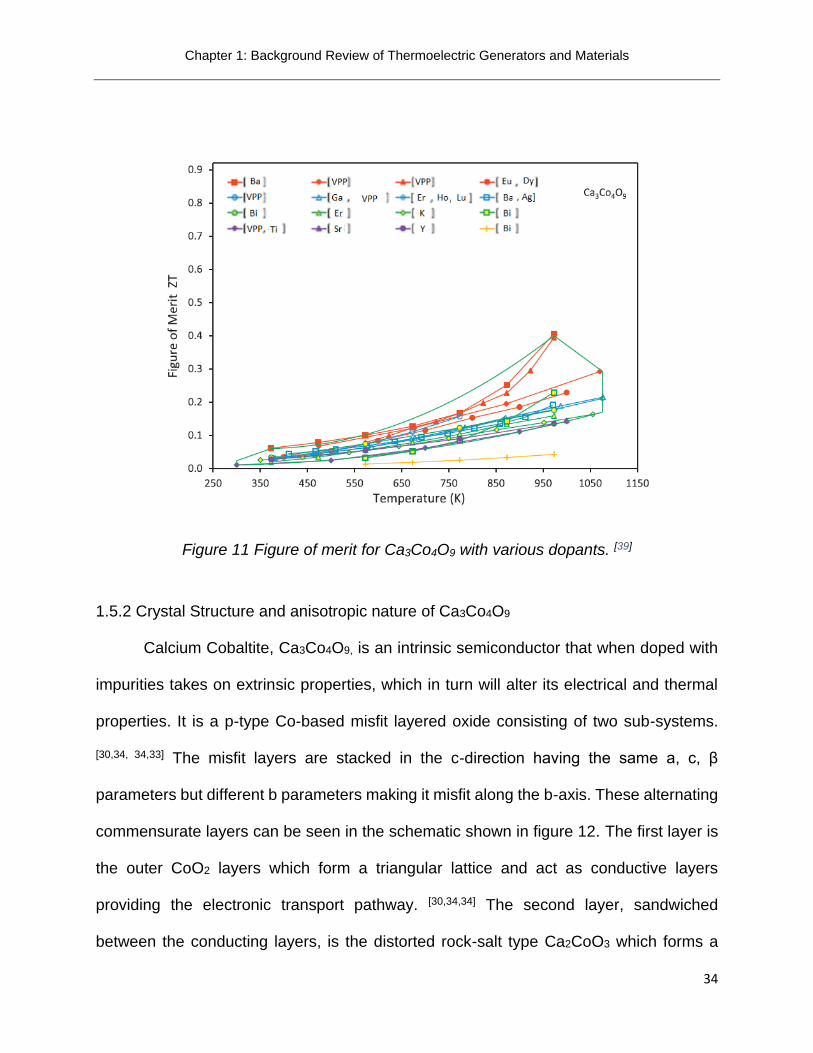
Chapter 1: Background Review of Thermoelectric Generators and Materials
32
Figure 8 shows the log electrical conductivity in S/m and this range would be
equivalent to an electrical conductivity of the magnitude 104 S/m or an electrical resistivity
in the range of 100 µΩm. Figure 9 shows the thermal power or Seebeck coefficient of
these same materials which range within a window of 100-150 µV/K depending on the
material or processing parameters used. Figure 10 is the log thermal conductivities which
would equate to around 2 W/mK and figure 11 shows the figure of merits for these
materials. It is evident from figure 11 that none of these materials have been reported as
passing the 0.5 ZT mark. Although these specific materials are the better alternative to
alloy semi-conductors and skutterudites, in regards to their thermal and chemical stability,
along with low toxicity and cost, their ZT values are still inferior.
Figure 8 Log electrical conductivity for Ca3Co4O9 with various dopants. [39]

Chapter 1: Background Review of Thermoelectric Generators and Materials
33
Figure 9 Absolute Seebeck coefficient for Ca3Co4O9 with various dopants. [39]
Figure 10 Log thermal conductivities of Ca3Co4O9 with various dopants. [39]
Chapter 1: Background Review of Thermoelectric Generators and Materials
34
Figure 11 Figure of merit for Ca3Co4O9 with various dopants. [39]
1.5.2 Crystal Structure and anisotropic nature of Ca3Co4O9
Calcium Cobaltite, Ca3Co4O9, is an intrinsic semiconductor that when doped with
impurities takes on extrinsic properties, which in turn will alter its electrical and thermal
properties. It is a p-type Co-based misfit layered oxide consisting of two sub-systems.
[30,34, 34,33] The misfit layers are stacked in the c-direction having the same a, c, β
parameters but different b parameters making it misfit along the b-axis. These alternating
commensurate layers can be seen in the schematic shown in figure 12. The first layer is
the outer CoO2 layers which form a triangular lattice and act as conductive layers
providing the electronic transport pathway. [30,34,34] The second layer, sandwiched
between the conducting layers, is the distorted rock-salt type Ca2CoO3 which forms a

Chapter 1: Background Review of Thermoelectric Generators and Materials
35
rectangular lattice and is the insulating layer, responsible for phonon-scattering, lowering
its thermal properties. [30,34, 34] In this regard it has a lattice constant and lattice geometry
misfit.
Figure 12 Schematic of alternating subsystems of Ca3Co4O9 crystal structure [40]
As mentioned Calcium Cobaltite’s single crystal has a relatively high figure of merit
due to its significant grain alignment in the c-direction. This is the direction of the stacking
of the alternating sub-systems. The polycrystalline form however, suffers from
misalignment of these crystals thus having a high electrical resistivity. The challenge for
this material is to improve the thermoelectric performance, or ZT, of the polycrystalline
ceramic. This can be done by improving its electrical properties through grain alignment

Chapter 1: Background Review of Thermoelectric Generators and Materials
36
which in turn will improve its overall power factor. Furthermore, by reducing the thermal
conductivity of the material through phonon scatter the figure of merit, ZT, can be
increased as well.
Grain alignment is measured through what is called the Lotgering factor and given
a value between 0 and 1. [41] Material with complete disorder is represented by a Lotgering
factor of 0 and materials with complete order have a factor of 1. The Calcium Cobaltite’s
baseline has a Lotgering factor of about 0.74. [27,41] Although grain growth can be
beneficial it can have a downside as well. If the grain growth is too rapid and significant
the grains can have a difficult time aligning themselves during the sintering process and
can cause the lattice to expand, reducing the density and negatively affecting the
material’s electrical resistivity. This growth also causes misalignment in the grains and
does not allow for smooth transport of the electron-hole pair.
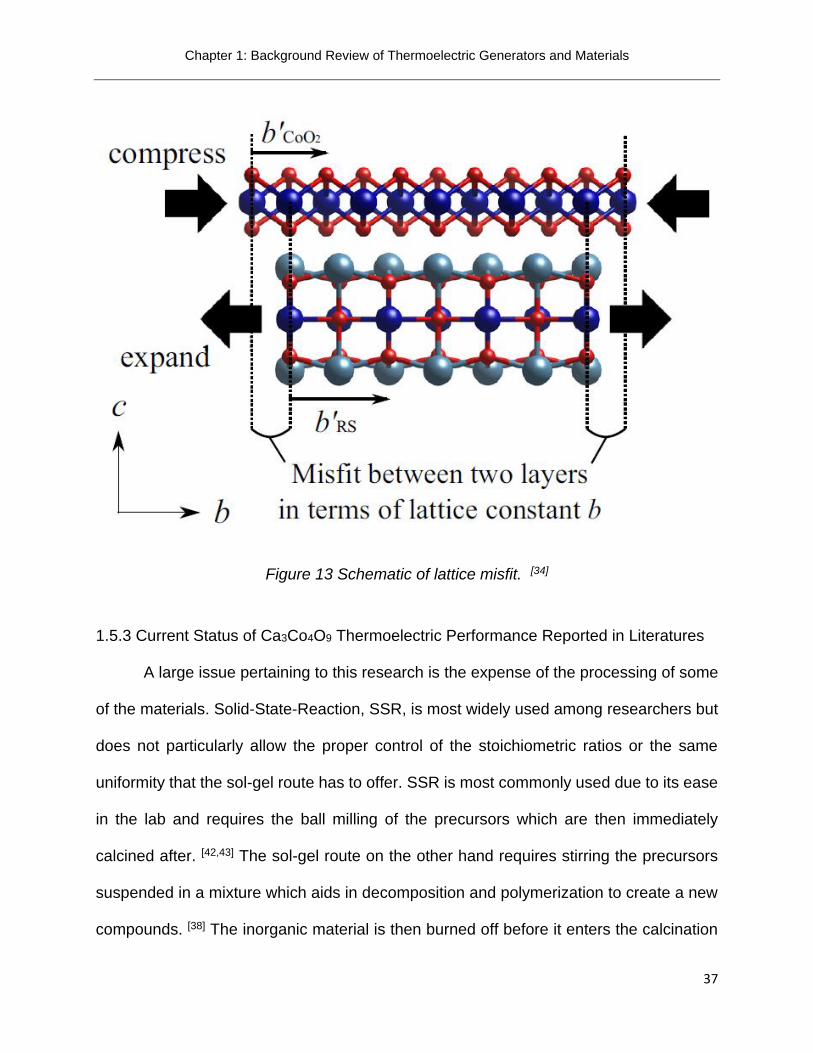
The Ca3Co4O9 material is anisotropic, having different values for its lattice
depending on which direction it is measured in. This has to do with its unique stacking
structure. Not only do the stacks alternate in the c-direction, but this causes each
individual insulating layer to have different dimensions from its neighboring conductive
layer, thus giving it two different b-direction values, b1 and b2. This misalignment at the
boundaries can be a platform for phonon scattering events, leading to a low thermal
conductivity. This also tends to create misalignment throughout the material. These
commensurate b-direction values can be seen in figure 13, labeled as b’CoO2 and b’RS. In
order to properly bond the alternating layers one must compress thus creating undulations
within this layer while the other expands.
Chapter 1: Background Review of Thermoelectric Generators and Materials
37
Figure 13 Schematic of lattice misfit. [34]
1.5.3 Current Status of Ca3Co4O9 Thermoelectric Performance Reported in Literatures
A large issue pertaining to this research is the expense of the processing of some
of the materials. Solid-State-Reaction, SSR, is most widely used among researchers but
does not particularly allow the proper control of the stoichiometric ratios or the same
uniformity that the sol-gel route has to offer. SSR is most commonly used due to its ease
in the lab and requires the ball milling of the precursors which are then immediately
calcined after. [42,43] The sol-gel route on the other hand requires stirring the precursors
suspended in a mixture which aids in decomposition and polymerization to create a new
compounds. [38] The inorganic material is then burned off before it enters the calcination

Chapter 1: Background Review of Thermoelectric Generators and Materials
38
stage. This extra step allows the materials to rearrange their structures and create bonds
before they reach their crystal structure during calcination. The sol-gel process for
precursors allows for the exact chemistry which can be controlled from the beginning of
the process to the pelletization of the powders. This ensures that end results reflect the
original intentions of the chemistry. From here it is much easier to know how to change
the parameters and which parameters to change. SSR also requires a higher
temperature, for thermal polymerization, or multiple thermal treatments, in order to react
together, constituting a higher calcination temperature [42]. A higher temperature can
stimulate too much grain growth too early in the process creating a bulk material with a
lower density and a higher electrical resistivity. SSR is also often accompanied by lattice
deformation energy and strain. [44] This process only exacerbates this material’s
preexisting lattice deformation which can be responsible for impeding its electrical
properties as well.
Another variance in processing are the pressing parameters. Two main methods
of pressing are through hot and cold pressing. A lot of the times the dopant involved will
dictate which method is used. Certain materials react more favorably when exposed to
heat during the pressing stage and can assist in the alignment of grains whether through
their reaction and action to the heat or from the densification of a liquid phase achieved.
More often than not the pressure or temperature involved in this stage predominantly
effects the densification and texture of the pellet.
Spark plasma sintering, SPS, has been a commonly used practice for
thermoelectric ceramic material. SPS uses pulses of DC current that pass through a
graphite press. [45,46] The purpose of the process is to increase density within the pellet

Chapter 1: Background Review of Thermoelectric Generators and Materials
39
during sintering. [45,46] This can be beneficial for electrical purposes but can pose an issue
when testing its thermal properties considering thermal conductivity is directly related to
the material’s density. The other benefit SPS has is that it only takes minutes to sinter
since there is internal heat created through the current. This allows the temperature to
ramp up quicker than a conventional furnace would for alternative methods. This high
heating rate of SPS, allowing for less holding time, also reduces the possibility of
unwanted sintering reactions. Aside from the shorter sintering time, SPS creates a bulk
sample with a relatively higher density. [47] Conventional sintering although more time
consuming than SPS has less opportunity for cracking to occur in the sample due to the
slower ramping temperature. Conventional sintering is the cheaper alternative of the two
methods and is also highly reproducible. This is the chosen method for this study covered
in this dissertation.
Previously alloy semiconductors, lead and antimony containing compounds such
as PbTe, Sb2Te3, and Sb2Se3 have been widely used as thermoelectric material. The
benefits of utilizing these materials is that most are very robust and efficient at high
temperatures. However, due to their instability and issues with oxidizing, some of the
higher temperature operating materials need to be used in a vacuum. Silicon germanium
for instance has a figure of merit of around 1 at temperatures around 1000 K and
BiCuSeO figure of merit has been improved upon from 0.5 to 1.4 from 2010 to 2014 both
needing a vacuum to achieve these values for a long timeline. [24,38,48] Both can be located
in the graph in figure 14. Lead, Pb and antimony, Sb, containing material yield very
promising ZTs at mid to high temperatures but are toxic and not desirable to handle in the
lab. The idea is to create a material that not only provides efficiency and a high electrical

Chapter 1: Background Review of Thermoelectric Generators and Materials
40
power, but also one that is stable and robust at high temperatures along with being
structurally sound.
Figure 14 Dimensionless figure of merit vs. temperature of typical current thermoelectric materials. [48]
For the purpose of this dissertation it is important to approach the efficiency of
silicon germanium in order to be competitive on a large scale. Some other materials may
yield a figure of merit well over 1 but once again they either operate at low temperatures
or the material can be toxic or pricey due to its rare status. Since these achievements,
oxides have made substantial leaps in this field to finally be competitive with their costly

Chapter 1: Background Review of Thermoelectric Generators and Materials
41
and toxic counterparts. Rare-earth elements such as Yb, Lu, Pr, Nd, Gd, and Eu have
recently been used to dope oxides to achieve great success. [49,50,51 Oxides have
improved vastly over the years but still suffer from inferior ZTs comparted with alloys alike.
The highest ZT to date for oxides was reported by Shrikant Saini et al through Terbium
Ion doping of Ca3Co4O9 with a record ZT of 0.74 at 800 K. [52] This is the highest value
reported for any polycrystalline sample. [52] this work proves that oxides still have a place
in this particular research and have plenty of room to grow through processing and
doping.

Chapter 1: Background Review of Thermoelectric Generators and Materials
42
1.6 References
1 Yi-Cheng Hou, Mei-Jiau Huang, Pi-Yueh Chuang, Hsiu-Cheng Chang, Chun-Hua Chen. Numerical and model predictions of the thermal conductivity of bismuth telluride nanoprism-assembled films. International Journal of heat and Mass Transfer 87. 536-543. April 13, 2015
2 Kasper A. Borup, Johannes de Boor, Heng Wang, Fivos Drymiotis, Franck Gascoin, Xun Shi, Lidong Chen, Mikhail I. Fedorov, Eckhard Muller, Bo B. Iversen and G. Jeffrey Snyder. Measuring thermoelectric transport properties of materials. Energy and Environmental Science. 8 pp.423-434. September 23, 2014.
3 Materials Science. Division of Engineering & Applied Science. California Institute of Technology. 2017
4 Michitaka Ohtaki. Recent aspects of oxide thermoelectric materials for power generation from mid-to-high temperature heat source. Journal of the Ceramic Society of Japan 119 [11] 2011.
5 Ashok Kumar Yadav, Shatrughan Singh, Gaurav Gupta. Solar Air-Conditioning: Design for a Compressor-Less System using Peltier Effect. International Journal of Advance Research and Innovation. Vol. 2, Iss. 2, pp. 429-432, 2014.
6 Daniel Kraemer, Bed Poudel, Hsien-Ping Feng, J. Christopher Caylor, Bo Yu, Xiao Yan, Yi ma, Xiaowei Wang, Dezhi Wang, Andrew Muto, Kenneth McEnaney, Matteo Chiesa, Zhifeng Ren and Gang Chen. High-performance flat-panel solar thermoelectric generators with high thermal concentration. Mature Materials 10, 532-538. May 1, 2011
7 Mahmoud Dhimish, Violeta Holmes, Mark Dales. Parallel fault detection algorithm for grid-connected photovoltaic plants. Renewable Energy. Vol. 113, pp. 94-111, December 2017.
8 Independent Statistics & Analysis. U.S. Energy Information Administration. (2016).
9 Xiao zhang, Li-Dong Zhao. Thermoelectric materials: Energy conversion between heat and electricity. Journal of Materiomics. Vol.1, pp.92-105, 2015.
10 T. Sun, H. H. Hng, Q. Y. Yan, and J. Ma. Enhanced high temperature thermoelectric properties of Bi-doped c-axis oriented Ca3Co4O9 thin films by pulsed laser deposition. Journal of Applied Physic 108. AIP Publishing. 2010.
11 T. Sun, H. H. Hng, Q. Y. Yan, and J. Ma. Enhanced high temperature thermoelectric properties of Bi-doped c-axis oriented Ca3Co4O9 thin films by pulsed laser deposition. Journal of Applied Physics. Vol.108, 2010.
12 Past, Present, and Future of Solar Energy. Cleaner Green Green solutions for today. Dan Clem. April 2012.
13 Nong Ngo Van and Nini Pyrds. Nanostructured oxide materials and modules for high-temperature power generation from waste heat. Advances in Natural Sciences: Nanoscience and Nanotechnology. 4 March 25, 2013.

Chapter 1: Background Review of Thermoelectric Generators and Materials
43
14 Mohamed Hamid Elsheikh, Dhafer Abdulameer Shnawah, Mohd Faizul Mohd Sabri,
Suhana Binti Mohd Said, Masjuki Haji Hassan, Mohamed Bashir Ali Bashir, Mahazanti Mohamad. A review on thermoelectric renewable energy: Principle parameters that affect their performance. Renewable and Sustainable Energy Reviews. Vol. 30, pp.337-355. 2014.
15 Intrinsic and Extrinsic Semiconductors. DoITPoMS. University of Cambridge. 2004-2015
16 Donor and Acceptor Impurities in Semiconductor. Electrical4u. 2011-2017.
17 Ananya Ganguly. Fundamentals of Physical Chemistry for Competitive Examinations. Dorling Kindesley Pearson Education, pp. 40-41, 2011
18 Dragica Vasileska, Stephen M. Goodnick, Gerhard Klimeck. Computational Electronics: Semiclassical and Quantum Device Modeling and Simulation. CRC Press, pp. 34-35, 2016.
19 Chong Xiao, Jie Xu, Boxiao Cao, Kun Li, Mingguang Kong, and Yi Xie. Solid-solutioned homojunction nanoplates with disordered lattice: A promising approach toward “Phonon Glass Electron Crystal” thermoelectric materials. Journal of the American Chemical Society 134, pp.7971-7977. April 23, 2012.
20 Michael P. Rowe, Li Qin Zhou, Debasish Banerjee, and Minjuan Zhang. Improvement of the thermoelectric figure-of-merit of a doped telluride nanocomposite by combining phonon scattering with grain boundary-modifying Zn-containing nanostructures. Journal of Electronic Materials, Vol.44, No.1, 2015.
21 Tao Wu, Trevor A. Tyson, Haiyan Chen, Jianming Bai, Hsin Wang and Cherno Jaye. A structural phase transition in Ca3Co4O9 Associated with enhanced high temperature thermoelectric properties. Cornell University Library. April 15, 2012.
22 T. Takeuchi, T. Kondo, K. Soda, U. Mizutani, R. Funahashi, M. Shikano, S. Tsuda, T. Yokoya, S. Shin, T. Muro. Electronic structure and large thermoelectric power in Ca3Co4O9. Journal of Electron Spectroscopy and Related Phenomena 137-140 2004 595-599. March 18, 2004.
23 Hee Seok Kim, Weishu Liu, G Hang Chen, Ching-Wu Chu, and Zhifeng Ren. Relationship between thermoelectric figure of merit and energy conversion efficiency. Proceedings of the National Academy of Sciences of the United States of America. June 22, 2015.
24 Materials Science and Engineering. McCormick School of Engineering. Northwestern University 2017.
25 Haoshan Hao, Qinglin He, ChangQing Chen, Hongqei Sun and Xing Hu. Textured structure and anisotropic thermoelectric properties of Ca2.7Bi0.3Co4O9 oxide prepared by conventional solid-state reaction. International Journal of Modern Physics B Vol. 23, No.1. World Scientific Publishing Company. 2009.
26 Guodong Tang, Wenchao Yang, Jianfeng Wen, Zhuangchun Wu, Cang Fan, Zhihe Wang. Ultralow thermal conductivity and thermoelectric properties of carbon

Chapter 1: Background Review of Thermoelectric Generators and Materials
44
nanotubes doped Ca3Co4O9+δ. Ceramics International 41, pp.961-965. September 15, 2014.
27 S. Demirel, E. Altin, E. Oz, S. Altin, A. Bayri. An enhancement ZT and spin state transition of Ca3Co4O9 with Pb doping. Journal of Alloys and Compounds 627 pp.430-437. December 27, 2014.
28 A. Sotelo, F. M. Costa, N. M. Ferreira, A. Kovalevsky, M. C. Ferro, V. S. Amaral, J. S. Amaral, Sh. Rasekh, M. A. Torres, M. A. Madre, J. C. Diez. Tailoring Ca3Co4O9 microstructure and performances using a transient liquid phase sintering additive. Journal of the European Ceramic Society 36, pp.1025-1032. November 30, 2015.
29 Lijun Wu, inping Meng, Christian Jooss, Jin-Cheng Zheng, H. Inada, Dong Su, Quang Li, and Yimei Zhu. Origin of phonon glass-electron crystal behavior in thermoelectric layered cobaltate. Advanced Functional Materials Journal 23, 5728-5736. 2013.
30 Guangkun Ren, Jinle Lan, Chengcheng Zeng,Yaochun Liu, Bin Zhan, Sajid Butt, Yuan-Hua Lin, and Ce-Wen Nan. High performance oxides-based thermoelectric materials. Journal of the Minerals, Metals, & Materials Society, Vol.67, No.1, 2015.
31 NanoEngineering Group. Massachusetts Institute of Technology
32 Kasper A. Borup, Johannes de Boor, Heng Wang, Fivos Drymiotis, Franck Gascoin, Xun Shi, Lidong Chen, Mikhail I. Fedorov, Eckhard Muller, Bo B. Iversen and G. Jeffrey Snyder. Measuring thermoelectric transport properties of materials. Energy and Environmental Science. 8 pp.423-434. September 23, 2014.
33 Sajid Butt, Yaoyu Ren, Muhammad Umer Farooq, Bin Zhan, Rizwan Ur Rahman Sagar, Yuanhua Lin, Ce-Wen Nan. Enhanced thermoelectric performance of heavy-metals (M: Ba, Pd) doped misfit-layered ceramics: (Ca2-xMxCoO3)0.62(CoO2). Energy Conversion and Management. Vol. 83, pp. 35-41, 2014.
34 Susumu Fujii and Masato Yoshiya. Manipulating thermal conductivity by interfacial modification of misfit-layered cobaltites Ca3Co4O9.
35 Masashi Mikami, Kanji Chong, Yuzuru Miyazaki, Tsuyoshi Kajitani, Takahiro Inoue, Satoshi Sodeoka, and Ryoji Funahashi. Bi-substitution effects on crystal structure and thermoelectric properties of Ca3Co4O9 single crystals. Japanese Journal of Applied Physics. Vol.45, No.5A, pp. 4131-4136, 2006.
36 Chang-Hyun Lim, Won-Seon Seo, Soonil Lee, Young Soo Lim, Jong-Young Kim, Hyung-Ho Park, Soon-Mok Choi, Kyu Hyoung Lee, Kyeongsoon Park. Anisotropy of the Thermoelectric Figure of Merit (ZT) in Textured Ca3Co4O9 Ceramics Prepared by using a Spark Plasma Sintering Process. Journal of the Korean Physical Society, Vol. 66, pp. 794-799, March 2015.
37 T. Takeuchi, T. Kondo, K. Soda, U. Mizutani, R. Funahashi, M. Shikano, S. Tsuda, T. Yokoya, S. Shin, T. Muro. Electronic structure and large thermoelectric power in Ca3Co4O9. Journal of Electron Spectroscopy and Related Phenomena 137-140 pp.595-599. March 18, 2004.
38 Cullen Boyle, Paulo Cavillo, Yun Chen, Ever J. Barbero, Dustin McIntyre, Xueyan Song. Grain boundary segregation and thermoelectric performance enhancement of bismuth

Chapter 1: Background Review of Thermoelectric Generators and Materials
45
doped calcium cobaltite. Journal of the European Ceramic Society. Vol. 36, pp. 601-607, 2016.
39 Jeffrey W. Fergus. Oxide materials for high temperature thermoelectric energy conversion. Journal of the European Ceramic Society. 32, pp. 525-540, 2012.
40 Tao Wu, Trevor A. Tyson, Jianming Bai, Kaumudi Pandya, Cherno Jaye, and Daniel Fischer. On the origin of enhanced thermoelectricity in Fe doped Ca3Co4O9. Journal of Materials Chemistry C. Vol. 1, pp. 4114-41212, 2013.
41 Ruomin Tian, Tianshu Zhang, Dewei Chu, Richard Donelson, Li Tao, Sean Li. Enhancement of high temperature thermoelectric performance in Bi, Fe co-doped layered oxide-based material Ca3Co4O9. Journal of Alloys and Compounds. 615:311-315. July 4, 2014.
42 Ankam Bhaskar, Z.-R. Lin, Chia-Jyi Liu. Thermoelectric properties of Ca2.95Bi0.05Co4-
xFexO9+δ (0<x<0.15). Energy Conversion and Management. Vol. 76, pp. 63-67, 2013.
43 Rezaul Kabir, Ruoming Tian, Tianshu Zhang, Richard Donelson, Thiam Teck Tan, Sean Li. Role of Bi doping in thermoelectric properties of CaMnO3. Journal of Alloys and Compounds. Vol. 628, pp. 347-351, 2015.
44 Tadeusz Luty and Craig J. Eckhardt. General Theoretical Concepts for Solid State Reactions: Quantitative Formulation of the Reaction Cavity, Steric Compression, and Reaction-Induced Stress Using an Elastic Multipole Representation of Chemical Pressure. Journal of American Chemical Society. Vol. 117, pp. 2441-2452, 1995.
45 H. Q. Liu, X. B. Zhao, T. J. Zhu, Y. Song, F. P. Wang. Thermoelectric properties of Gd, Y co-doped Ca3Co4O9+δ. Current Applied Physics. Vol. 9, pp. 409-413, 2009.
46 NingYu Wu, Tim C. Holgate, Ngo Van Nong, Nini Pryds, Søren Linderoth. High temperature thermoelectric properties of Ca3Co4O9+δ by auto-combustion synthesis and spark plasma sintering. Journal of the European Ceramic Society. Vol. 34, pp. 925-931, 2014.
47 Ana Júlia Tertuliano, Guido Boidi, Daniel Rodrigues, Izabel Fernanda Machado. Comparison between a conventional sintering process and by SPS (Spark Plasma Sintering) consolidation of WC-6Co (%wt). Brazilian Congress of Engineering and Material Science. Pp. 2042-2047, 2014.
48 Li-Dong Zhao, Jiaqing He, David Berardan, Yuanhua Lin, Jing-Feng Li, Ce-Wen Nan, and Nita Dragoe. BiCuSeO oxyselenides: new promising thermoelectric materials. Energy & Environmental Science. Vol. 7, pp. 2900-2924, 2014.
49 C.S. Huang, F.P.Zhang, X. Zhang, Q. M. Lu, J. X.Zhang, Z. Y. Liu. Enhanced thermoelectric figure of merit through electrical and thermal transport modulation by dual-doping and texture modulating for Ca3Co4O9+δ oxide materials. Journal of Alloys and Compounds. 687, pp. 87-94, 2016.
50 Yang Wang, Luxiang Xu, Yu Sui, Xianjie Wang, Jinguang Cheng, and Wenhui Su. Enhanced electron correlation in rare-earth doped Ca3Co4O9. Applied Physics Letters. 97, 2010.

Chapter 1: Background Review of Thermoelectric Generators and Materials
46
51 Nong Ngo Van and Nini Pryds. Nanostructured oxide materials and modules for high-
temperature power generation from waste heat. Advances in Natural Sciences: Nanoscience and Nanotechnology. Vol. 4, 2013.
52 Shrikant Saini, Haritha Sree Yaddanapudi, Kun Tian, Yinong Yin, David Magginetti & Ashutosh Tiwari. Terbium Ion Doping in Ca3Co4O9: A Step towards High-Performance Thermoelectric Materials. Nature. 2016.

Chapter 2: Research Objectives and Methodology
47
Chapter 2:
Research Objectives and Methodology
2.1 Objectives
Over 80% of the United States’ electrical energy comes from fossil fuels which is
the major source of CO2 emissions leading to global warming. [1] Furthermore, these
natural resources are limited and threaten to eventually be exhausted. Scientists have
been working on an answer for years, utilizing many different methods and thoughts for
renewable energy and waste energy recovery. For as far back as one can search the holy
grail for scientists and inventors has been the fabled “perpetual motion machine”. [2] It is
a device that will run forever without the loss of energy. In theory a perpetual motion
machine works with 100% efficiency and no waste heat at all. [2,3] This is impossible from
a physics standpoint due to the second law of thermodynamics. The second law states
that waste heat must always be produced thus increasing entropy in the Universe. [2]
One approach widely used today is the harvesting of this unused energy. One of
the earliest and probably most recognizable forms of harvesting energy would be that of
solar panels which use the Sun’s light as its source of energy and were first used in space
in 1958 and later introduced to the commercial market in the 70s. [4] The use of solar
panels is an example of the photovoltaic process. Since then, many attempts have been
made to utilize this same concept of harnessing waste heat and transforming it into usable
energy. A second approach is through thermoelectric generation. As stated in the
previous chapter TEG are used to harness and repurpose energy through waste heat.

Chapter 2: Research Objectives and Methodology
48
Oxides as a thermoelectric material provide a much greater alternative than the
long used alloy semiconductors. As of now their efficiencies are still inferior in comparison
but they hold great promise due to their low toxicity, low cost, ease of use, thermal and
chemical stability, and their ability to operate in air. Oxides are quickly catching up in their
thermoelectric performance and more and more research has been dedicated to altering
their micro- and nanostructures, in order to boost their efficiency. Their robust nature and
ability to operate at high temperatures allow them to have a bright future in this field.
Calcium cobaltite is in the forefront of that research right now with plenty of room to
improve upon.
The main sources of harvestable energy have been through mechanical vibrations
and waste heat. Both byproducts that go unused and a lot of times unnoticed. Harvesting
energy through waste heat is what this paper will mainly focus on. More specifically, the
method discussed in this dissertation will be by use of a TEG pertaining to waste heat. It
will cover what a TEG is, what it does, and how it works. It will also describe the
components that comprise the device and how they work as well.
The objective of this research is to improve the thermoelectric performance of
Calcium Cobaltite ceramics by modifying its chemistry. This was done through
conventional sol-gel processing for precursors and conventional pelletization and
sintering. It will investigate different doping elements along with different methods of
introducing these dopants into the Ca3Co4O9 ceramic. The effects of the chemistry
modification on its thermoelectric performance and nanostructure will be extensively
investigated to understand the correlation between the two induced by the chemistry
modification.

Chapter 2: Research Objectives and Methodology
49
2.2 Methodology
Three different dopants in the Ca3Co4O9 are investigated in this dissertation.
Chapter three focuses on the first which is the addition of the Chalcogen bismuth
telluride, Bi2Te3 in the Ca3Co4O9. This was achieved by mixing stoichiometric
measurements of Ca3Co4O9 then adding the Bi2Te3 in a second stage ball mill. The
motivation of this set is to investigate whether the addition of bismuth telluride forms an
alloy or a composite with Ca3Co4O9. Bismuth telluride was doped into the Ca3Co4O9 in
order to analyze the possibility of grain boundary segregation. The formation of a
secondary phase using bismuth telluride as a dopant is also very possible and was
analyzed as well.
Chapter four introduces the second dopant which covers the cationic
substitution of bismuth into the Ca3Co4O9. Bismuth has a high atomic mass which
should help to increase the density of the material to enhance its electrical properties and
create scattering events in order to reduce its thermal conductivity. Bismuth is also known
to be the most naturally occurring diamagnetic element in nature allowing it to have the
lowest thermal conductivity of all metals.
Chapters five and six discuss the use of non-stoichiometric addition of dopants
into the Ca3Co4O9 chemistry. The motivation was to investigate the thermoelectric
properties of a chemistry where the dopant will most likely not replace calcium in the
lattice and not deposit itself at the grain interior. With this approach the stoichiometry was
purposely not preserved in order to analyze where such a dopant presents itself and how
it affects the overall performance of the material. In chapter five, bismuth was once
again used to dope the Ca3Co4O9. Bismuth’s ionic radius is close in size to that of

Chapter 2: Research Objectives and Methodology
50
calcium’s but with no subtraction of the calcium the bismuth should have nowhere else to
go but the grain boundary. The motivation was to explore whether the bismuth still finds
its way into the lattice or is deposited elsewhere. Chapter six introduces the third and
final dopant, discussing the doping of Ca3Co4O9 with barium to further investigate this
non-stoichiometric addition. Barium has a larger ionic radius than calcium and does not
deposit in the lattice whether there are calcium deficiencies or not thus leaving it nowhere
to go but the grain boundary. Barium is known to have a high electrical conductivity and
is considered a heavy element which can cause phonon scattering to decrease the
thermal conductivity positively affecting the overall performance.
Chapters seven, eight, and nine investigate the dual doping of both bismuth
and barium into the Ca3Co4O9 polycrystalline powders. Chapter seven discusses the
non-stoichiometric addition of bismuth and the non-stoichiometric addition of barium while
chapter eight and nine addresses the cationic substitution of bismuth and the non-
stoichiometric addition of barium.
All chemistries in this dissertation began through a sol-gel stage of precursors with
conventional methods of pelletization. Not only was this process affordable it was
controllable and highly reproducible. Pellets were tested using a Linseis LSR-1100 to
attain their electrical resistivities and Absolute Seebeck coefficients and a Linseis LFA-
1200 laser flash machine was used to acquire their thermal conductivities. Fractured
pieces of the sample pellets were then further analyzed by their microstructures through
a Hitachi Scanning Electron Microscope and PANalytical X-Ray Diffraction and their
nanostructures analyzed by way of Transmission Electron Microscope.

Chapter 2: Research Objectives and Methodology
51
2.3 References
1 Independent Statistics & Analysis. U.S. Energy Information Administration. (2016).
2 Kaku, Michio. Physics of the Impossible. 2008
3 The Laws of Thermodynamics.
4 The History of Solar. U.S. Department of Energy. Energy Efficiency and Renewable Energy.
5 Materials Science. Division of Engineering & Applied Science. California Institute of Technology. 2017
6 The History of Solar. U.S. Department of Energy. Energy Efficiency and Renewable Energy.
7 Michitaka Ohtaki. Recent aspects of oxide thermoelectric materials for power generation from mid-to-high temperature heat source. Journal of the Ceramic Society of Japan 119 [11] 2011.
8 Yi-Cheng Hou, Mei-Jiau Huang, Pi-Yueh Chuang, Hsiu-Cheng Chang, Chun-Hua Chen. Numerical and model predictions of the thermal conductivity of bismuth telluride nanoprism-assembled films. International Journal of heat and Mass Transfer 87. 536-543. April 13, 2015
9 Kasper A. Borup, Johannes de Boor, Heng Wang, Fivos Drymiotis, Franck Gascoin, Xun Shi, Lidong Chen, Mikhail I. Fedorov, Eckhard Muller, Bo B. Iversen and G. Jeffrey Snyder. Measuring thermoelectric transport properties of materials. Energy and Environmental Science. 8 pp.423-434. September 23, 2014.
10 Nong Ngo Van and Nini Pyrds. Nanostructured oxide materials and modules for high-temperature power generation from waste heat. Advances in Natural Sciences: Nanoscience and Nanotechnology. 4 March 25, 2013.
11 Daniel Kraemer, Bed Poudel, Hsien-ping Feng, J.Christopher Caylor, Bo Yu, Xiao Yan, Yi Ma, Xiaowei Wang, Dezhi Wang, Andrew Muto, Kenneth McEnaney, Matteo Chiesa, Zhifeng Ren and Gang Chen. High-performance flat-panel solar thermoelectric generators with high thermal concentration. Nature Materials 10, pp.532-538. May 1, 2011
12 T. Sun, H. H. Hng, Q. Y. Yan, and J. Ma. Enhanced high temperature thermoelectric properties of Bi-doped c-axis oriented Ca3Co4O9 thin films by pulsed laser disposition. Journal of Applied Physics 108. AIP Publishing. October 21, 2008.
13 Haoshan Hao, Qinglin He, ChangQing Chen, Hongqei Sun and Xing Hu. Textured structure and anisotropic thermoelectric properties of Ca2.7Bi0.3Co4O9 oxide prepared by conventional solid-state reaction. International Journal of Modern Physics B Vol. 23, No.1. World Scientific Publishing Company. 2009.
14 T. Takeuchi, T. Kondo, K. Soda, U. Mizutani, R. Funahashi, M. Shikano, S. Tsuda, T. Yokoya, S. Shin, T. Muro. Electronic structure and large thermoelectric power in
Chapter 2: Research Objectives and Methodology
52
Ca3Co4O9. Journal of Electron Spectroscopy and Related Phenomena 137-140 pp.595-599. March 18, 2004.
15 S. Demirel, E. Altin, E. Oz, S. Altin, A. Bayri. An enhancement ZT and spin state transition of Ca3Co4O9 with Pb doping. Journal of Alloys and Compounds 627 pp.430-437. December 27, 2014.
16 Susumu Fujii and Masato Yoshiya. Manipulating thermal conductivity by interfacial modification of misfit-layered cobaltites Ca3Co4O9.
17 Guangkun Ren, Jinle Lan, Chengcheng Zeng, Yaochin Liu, Bin Zhan, Sajid Butt, Yuan-Hua Lin, and Ce-Wen Nan. High performance oxides-based thermoelectric materials. Journal of Electronic Materials, Vol. 67, No.1 pp. 211-221. 2014.

Chapter 3: Effect of Bismuth Telluride Addition on the Electrical Performance of Ca3Co4O9 Ceramics
53
Chapter 3:
Effect of Bismuth Telluride Addition on the Electrical Performance of Ca3Co4O9 Ceramics
3.1 Background & motivation of using Bismuth Telluride as a dopant in Ca3Co4O9
Chalcogens, otherwise known as group 16 or the oxygen family, are considered
among the main group elements. [1] They consist of the elements oxygen, sulfur,
selenium, tellurium and polonium which can all be found in nature in both free and
combined states. The name Chalcogen proposed by Wilhelm Blitz and colleague Werner
Fischer in 1932 comes from the combination of the Greek word chalkos, meaning “bronze
ore”, and the Latinized Greek word genes, meaning born or produced. [1,2] All of the
Chalcogens have six valence electrons, leaving them two electrons short of a full outer
shell. [2,3] This means that they will most likely act as an accepter impurity when used as
a dopant. Since they will accept electrons to fill their outer shell the baseline will lose two
electrons leaving behind holes thus making it a good candidate for doping p-type material.
Oxygen, sulfur and selenium are all nonmetals while tellurium is a metalloid meaning that
its chemical properties are between those of a metal and a nonmetal which will make for
a good semi conductive material. [1] However, it is not certain whether polonium is a metal
or a metalloid.
Tellurium, a member of the Chalcogen family was discovered in the Habsburg Empire
in 1782 by Franz-Joseph Müller von Reichenstein in a mineral containing tellurium and
gold. [2,3] His first thought was that it was already among the known elements mistaking it

Chapter 3: Effect of Bismuth Telluride Addition on the Electrical Performance of Ca3Co4O9 Ceramics
54
for antimony. In 1798, almost two decades later, Reichenstein sent a sample to German
chemist Martin Heinrich Klaproth to analyze further. [3] Klaproth discovered that it was in
fact a new element giving all credit to its discoverer von Reichenstein. [2] Klaproth named
this new element tellurium after the Latin word, tellus, meaning “earth”. [2] This was due
to the ubiquitous amounts found in the earth’s crust. It is known now that tellurium seldom
occurs in its pure state and is often found as a compound in ores of gold along with silver,
copper, lead, mercury or bismuth. [1,2] Commercially, tellurium has mainly been used in
alloys. It is often found in steel for its malleability, copper to improve machinability, and
lead to resist vibrations and fatigue. [2,3] Depending on its atomic alignment, tellurium is a
semiconductor that can display a high electrical conductivity, which can be useful for
thermoelectric applications.
As mentioned, tellurium combines easily with certain elements. It is also easy to
engineer the band structure of a Chalcogen by impurity doping. [3] If the Chalcogen has
energy levels resonant with the host band this will alter the electrical properties. This
chapter discusses the results of Ca3Co4O9 doped with the compound bismuth telluride,
Bi2Te3. Bismuth telluride’s small band gap of 0.16 eV causes it to be a partially degenerate
semiconductor with its Fermi-level close to the conduction band. [4] This means that it has
a high intrinsic carrier concentration which should reduce the electrical resistivity.
Tellurium bonds with bismuth to comprise some of the best room temperature
thermoelectric results with a temperature-independent ZT between 0.8 and 1.0. [4]
Weon Ho Shin et al reported a ZT value of 1.16 at 393 K with reduced graphene oxide,
RGO, incorporated Bi0.36Sb1.64Te3 composites which is ~15% higher than its pristine form.
[5] Kim et al. also reported an impressively high ZT of 1.86 at 320 K for Bi0.5Sb1.5Te3 due

Chapter 3: Effect of Bismuth Telluride Addition on the Electrical Performance of Ca3Co4O9 Ceramics
55
to a low lattice thermal conductivity of 0.33 W/mK. [6] Cheng et al. report a ZT of 0.73 at
320 K for Bi2Te3 heteronanojunctions. [7]
3.2 Experimental Procedure
Ca3Co4O9 powders were obtained through a sol-gel route in which stoichiometric
ratios of Ca(NO3)2•4H2O, Co(NO3)2•6H2O were mixed in deionized water. Ethylene glycol
and polyethylene glycol were used to aid polymerization of the solution and to vary particle
size. [8] Lastly in the process nitric acid was added under a fume hood to induce nitrate
salts decomposition and facilitate new compound formation. [9] The liquid solution was
then submerged in a silicone oil bath on a hot plate and mechanically stirred at 353 K for
3 hours to achieve the sol-gel state. The sol-gel was distributed in to ceramic crucibles
loosely covered with aluminum foil and put into a box furnace. The furnace was heated
with a ramp rate of 10 K per minute reaching a temperature of 773 K where it was held
for 2 hours. Holding the temperature here, at 773 K, for the allotted time ensures that any
inorganic material is removed from the material. The furnace was then cooled at a rate of
10 K per minute. The ashes were suspended in ethanol and ball milled for 20 minutes
alternating between 1 minute of milling and 1 minute of resting in order to aid in the
dissipation of heat. The ball milled powders were calcined in an oxygen rich induced
environment with a ramp rate of 10 K per minute reaching a temperature of 973 K and
held for 4 hours to achieve the Ca3Co4O9 crystal structure. The powders were then cooled
down to room temperature at 10 K per minute. Bi2Te3 was then added in non-
stoichiometric ratios to the Ca3Co4O9 crystal. The two powders were hand ground

Chapter 3: Effect of Bismuth Telluride Addition on the Electrical Performance of Ca3Co4O9 Ceramics
56
together for uniformity then placed in the ball mill suspended in ethanol for another 20
minutes in 1 minute intervals then set out to dry.
Two pellets were pressed, one to test its electrical properties and the other for its
thermal properties. The calcined powders were pressed uniaxially with 1 GPa of force
and held for 10 minutes at 298 K. The pellets’ densities were obtained before they were
put in to a tubular furnace to be sintered. The sintering process removes any extra
moisture the pellet may contain and assures proper grain alignment. Pellets were sintered
in an oxygen rich induced environment with a ramp rate of 10 K per minute and held at
1233 K for 9 hours. They were then cooled back to room temperature at a rate of 4 K per
minute and once again the densities were taken. Pellets were cut into a 2 mm x 3.5 mm
x 9 mm rectangular shapes and inserted into a Linseis LSR 3-Seebeck machine,
subjected to a low pressure helium, He, environment where the pellet’s electrical
resistivity and Absolute Seebeck Coefficient were simultaneously determined by means
of a dc four-probe method. Since helium is an inert gas it will not react or interfere with
the measurement. A second pellet was cut along a different axis and inserted into the
Linseis LFA 1000 machine to test its thermal conductivity. The pellet was cut to be 2 mm
thick and polished to a diameter of 11-13 mm. Any less than 11 mm and there would be
room for heat to escape the holder, any more than 13 mm and the pellet would be too
large for the holder. The thermal conductivity is calculated by the equation
K=λCpρm (13)
Where λ is the thermal diffusity in meters squared per second (m2/s), Cp is the specific
heat capacity in joules per kilogram kelvin (J/kg•K), and ρm is the mass density in grams

Chapter 3: Effect of Bismuth Telluride Addition on the Electrical Performance of Ca3Co4O9 Ceramics
57
per centimeter cubed (g/cm3). As stated in the first section, these are the three values
needed in order to obtain the materials’ ZT value. For this set the concentrations of Bi2Te3
were as follows: Ca3 (Bi2Te3)u Co4O9 where u=0.0, 0.003, 0.006, 0.025, 0.05, and 0.1.
3.3 Electrical Performance of Ca3Co4O9 doped with Bi2Te3
Each doping concentration had an electrical resistivity that was higher than the
baseline; up to ~65% higher. This is not caused by over doping considering there were
samples with a very low concentration. It also goes to show that it’s not the case where
the sample was under doped either considering the highest concentration had a resistivity
almost 7 times that of the baseline. This chemistry set does, however, reinforce the
intimate connection between the resistivity and the Seebeck coefficient through the carrier
concentration. As mentioned in the literature review a decrease in carrier concentration
generally leads to an increase in resistivity. This can clearly be seen in the Ca3Co4O9
sample doped with Bi2Te3 0.1 in figure 15. This reduction in carrier concentration then
leads to a slight enhancement of the Seebeck coefficient in the same sample which can
be seen in figure 16.

Chapter 3: Effect of Bismuth Telluride Addition on the Electrical Performance of Ca3Co4O9 Ceramics
58
Figure 15 Temperature dependence of electrical resistivity for Ca3Co4O9 Bi2Te3 addition.
It can be observed from figure 16 that there is in fact a benefit to the doping of
Bi2Te3 in the Ca3Co4O9. At 315 K the Seebeck coefficient experiences a large increase
up to ~160 µV/K which is a 20 µV/K jump. Generally the Seebeck coefficient is highly
intrinsic to the particular material and Ca3Co4O9 has a very stable and consistent room
temperature Seebeck coefficient of around 140 µV/K. More often than not any variation
of the Seebeck coefficient manifests itself as an increase or decrease as the temperature
rises. A change in Seebeck coefficient at room temperature is not a common occurrence.
This enhancement in the Seebeck coefficient is most likely the direct cause of the Bi2Te3
addition. Due to the increase in resistivity along with the lack of change in Seebeck
40
90
140
190
240
290
300 400 500 600 700 800 900 1000 1100
Elec
tric
al R
esis
tivi
ty µ
Ωm
Temperature K
Ca3Co4O9 Ca3(Bi2Te3)0.003Co4O9 Ca3(Bi2Te3)0.006Co4O9
Ca3(Bi2Te3)0.025Co4O9 Ca3(Bi2Te3)0.05Co4O9 Ca3(Bi2Te3) 0.1Co4O9

Chapter 3: Effect of Bismuth Telluride Addition on the Electrical Performance of Ca3Co4O9 Ceramics
59
coefficient, with the exception for the Seebeck coefficient of the Bi2Te3 0.1 sample, the
power factor decreases significantly shown in figure 17. The resistivities of the samples
were too high to offset the room temperature enhancement in the Seebeck coefficient.
This caused all samples to achieve a lower power factor than the pure Ca3Co4O9.
Figure 16 Temperature dependence of absolute seebeck coefficient for Ca3Co4O9 Bi2Te3 addition.
130
140
150
160
170
180
190
200
300 400 500 600 700 800 900 1000 1100
Ab
solu
te S
eeb
eck
coef
fici
ent µ
V/K
Temperature K
Ca3Co4O9 Ca3(Bi2Te3)0.003Co4O9 Ca3(Bi2Te3)0.006Co4O9
Ca3(Bi2Te3)0.025Co4O9 Ca3(Bi2Te3)0.05Co4O9 Ca3(Bi2Te3) 0.1Co4O9

Chapter 3: Effect of Bismuth Telluride Addition on the Electrical Performance of Ca3Co4O9 Ceramics
60
Figure 17 Temperature dependence of power factor for Ca3Co4O9 Bi2Te3 addition.
3.4 Summary of results for Bi2Te3 doped Ca3Co4O9
The literature has shown great difficulty in enhancing the Absolute Seebeck
coefficient and although bismuth telluride has been reported on extensively throughout
the literature this is the first time this enhancement in Absolute Seebeck Coefficient at
room temperature has been investigated. Bismuth telluride enhanced the Seebeck
coefficient from ~140 µV/K to ~158 µV/K at 315 K. This shows that a large room
temperature Seebeck coefficient can be achieved through doping the Ca3Co4O9 ceramic
with Bi2Te3. There is also hope in experiencing this enhancement in the Absolute Seebeck
coefficient while tuning the carrier mobility to achieve a low electrical resistivity. Achieving
0
0.1
0.2
0.3
0.4
0.5
0.6
300 400 500 600 700 800 900 1000 1100
Po
wer
Fac
tor
mW
/mK
2
Temperature K
Ca3Co4O9 Ca3(Bi2Te3)0.003Co4O9 Ca3(Bi2Te3)0.006Co4O9
Ca3(Bi2Te3)0.025Co4O9 Ca3(Bi2Te3)0.05Co4O9 Ca3(Bi2Te3) 0.1Co4O9

Chapter 3: Effect of Bismuth Telluride Addition on the Electrical Performance of Ca3Co4O9 Ceramics
61
a low electrical resistivity coupled with the enhanced Absolute Seebeck coefficient would
then lead to a high power factor. This also opens up the possibility of optimizing the
dopant in order to enhance the Absolute Seebeck coefficient. Determining whether the
presence of the bismuth or the telluride lead to the enhancement can be achieved by
isolating the dopants individually. To further investigate this Seebeck phenomenon at
room temperature bismuth was used to dope the Ca3Co4O9 ceramic and is detailed in
chapter 4. Bismuth’s micro- and nanostructures were analyzed to understand what was
responsible for this enhancement in Absolute Seebeck coefficient.

Chapter 3: Effect of Bismuth Telluride Addition on the Electrical Performance of Ca3Co4O9 Ceramics
62
3.5 References
1 The Elements of Group 16. Chemistry LibreTexts. UCDavis. University of California. 2017.
2 Gagnon, Steve. It’s Elemental: The Periodic Table of Elements. The Element Tellurium. Jefferson Lab. 2017
3 Guangkun Ren, Jinle Lan, Chengcheng Zeng, Yaochun Liu, Bin Zhan, Sajid Butt, Yuan-Hua Lin, and Ce-Wen Nan. High performance oxides-based thermoelectric materials. Journal of the Minerals, Metals & Materials Society. Vol.67, No.1, pp. 211-221, 2015.
4 Dambi Park, Sungjin Park, Kwangsik Jeong, Hong-Sik Jeong, Jea Yong Song & Mann-Ho Cho. Thermal and Electrical Conduction of Single-crystal Bi2Te3 Nanostructures gown using a one step process. Nature Scientific Reports. August 2015.
5 Weon Ho Shin, Kyunghan Ahn, Mahn Jeong, Jeong Seop Yoon, Jae min Song, Soonil Lee, Won Seon Seo, Young Soo Lim. Enhanced thermoelectric performance of reduced graphene oxide incorporated bismuth-antimony-telluride by lattice thermal conductivity reduction. Journal of Alloys and Compounds. Vol.718, pp.342-348, 2017.
6 Sang Il Kim, Kyu Hyoung Lee, Hyoun A Mun, Hyun Sik Kim, Sung Woo Hwang, Jong Wook Roh, Dae Jin Yang, Weon Ho Shin, Xiang Shu Li, Young Hee Lee, G. Jeffrey Snyder, Sung Wng Kim. Dense dislocation arrays embedded in grain boundaries for high-performance bulk thermoelectrics. Science. Vol. 348, Issue 6230, pp. 109-114, 2015.
7 Lina Cheng, Zhi-Gang Chen, Lei Yang, Guang Han, Hong-Yi Xu, G. Jeffrey Snyder, Gao-Qing Lu, and Jin Zou. T-Shaped Bi2Te3-Te Heteronanojunctions: Epitaxial Growth, Structural Modeling, and Thermoelectric Properties. The Journal of Physical Chemistry. Vol. 117, pp. 12458-12464, 2013.
8 Marat Gunes, Macit Ozenbas. Effect of grain size and porosity on phonon scattering enhancement of Ca3Co4O9. Journal of Alloys and Compounds Vol.626, pp.360-367, 2015.
9 Boyle, Cullen; Calvillo, Paulo; Chen, Yun; Barbero, Ever J.; McIntyre, Dustin. Grain boundary segregation and thermoelectric performance enhancement of bismuth doped calcium cobaltite. Journal of the European Ceramic Society 36(3):601-607 Elsevier 2016 0955-2219
10 Tao Wu, Trevor A. Tyson, Haiyan Chen, Jianming Bai, Hsin Wang and Cherno Jaye. A Structural Phase Transition in Ca3Co4O9 Associated with Enhanced High Temperature Thermoelectric Properties. American Physical Society. 2012
11 Quentin Lognoné, Franck Gascoin. On the effect of carbon nanotubes on the thermoelectric properties of n-Bi2Te2.4Se0.6 made by mechanical alloying. Journal of Alloys and Compounds. 635, pp. 107-111, 2015.
12 Yuzhuo Zhang, Hong Chen, Zhiliang Li, Ting Huang, Shuqi Zheng. Rational design and controlled synthesis of Te/Bi2Te3 heterostructure nanostring composites. Journal of Crystal Growth. 421, pp. 13-18, 2015.

Chapter 3: Effect of Bismuth Telluride Addition on the Electrical Performance of Ca3Co4O9 Ceramics
63
13 Michael P. Rowe, Li Qin Zhou, Debasish Banerjee, and Minjuan Zhang. Improvement
of the thermoelectric figure-of-merit of a doped telluride nanocomposite by combining phonon scattering with grain boundary-modifying Zn-containing nanostructures. Journal of Electronic Materials, Vol.44, No.1, pp.425-430, 2015.
14 T. Sun, H. H. Hng, Q. Y. Yan, and J. Ma. Enhanced high temperature thermoelectric properties of Bi-doped c-axis oriented Ca3Co4O9 thin films by pulsed laser deposition. AIP Journal of Applied Physics. 108, 083709. 2010.
15 Dabin Park, Hyun Ju, Jooheon Kim. Enhanced thermoelectric power factor and low thermal conductivity in one-dimensional Te/Ag2Te composites. Ceramics International. Vol.43, pp. 11156-11162, 2017.
16 M. Sabarinathan, M. Omprakash, S. Harish, M. Navaneethan, J. Archana, S. Ponnusamy, H. Ikeda, T. Takeuchi, C. Muthamizhchelvan, Y. Hayakawa. Enhancement of power factor by energy filtering effect in hierarchical BiSbTe3 nanostructures for thermoelectric applications. Applied Surface Science. Vol.418, pp.246-251, 2017.
17 Zhi-Lei Wang, Takahiro Akao. Tetsuhiko Onda, Zhong-Chun Chen. Microstructure and thermoelectric properties of Bi-Sb-Te bulk materials fabricated from rapidly solidified powders. Scripta Materialia. Vol.136, pp.111-114, 2017.
18 Jaoshan Hao, Qinglin He, Changqing Chen, Hongwei Sun, and Xing Hu. Textured structure and anisotropic thermoelectric properties of Ca2.7Bi0.3Co4O9 oxide prepared by conventional solid-state reaction. International Journal of Modern Physics B, Vol.23, No.1, pp.87-95, 2009.
19 Kenji Tanabe, Ryuji Okazaki, Hiroki Taniguchi, and Ichiro Terasaki. Optical conductivity of layered calcium cobaltate Ca3Co4O9. Journal of Physics: Condensed Matter. Vol.28, 2016.

Chapter 4: Improving the TE performance and crystal structure of Ca3Co4O9 ceramics through Bismuth Cation Substitution
64
Chapter 4:
Improving the TE performance and crystal
texture of Ca3Co4O9 ceramics through Bismuth
Cation Substitution
4.1 Introduction to Cation Substitution
Ion substitution is the exchange of ions with similar size and charge [1] Anion
substitution is difficult due to how strongly bonded the anions are. This is the motivation
for the extensive research into the use of cation substitution. The use of cation substitution
has been reported on vastly in the literature. It is arguably the most common and
successful approach to impurity doping. It is simple, straightforward, and achieves great
results. The substitution method uses a concentration “x” of a specific dopant, in the case
of this chapter, bismuth, that is then added into the of Ca3Co4O9 baseline. By subtracting
the same concentration from the Ca location two things happen. First, the stoichiometric
ratio is preserved and secondly the dopant is forced to go into the lattice in place of the
Ca vacancies. As mentioned this usually only works if the ionic radii and ionic charges
are similar enough in size and charge.
4.2 Background and motivation for Bismuth as a dopant in Ca3Co4O9
Bismuth has an unusually low toxicity for being such a heavy metal which allows it to
be commercially used in items such as cosmetics and medicine. [2] This same stability
and low toxicity means safer handling in the lab and in the environment. Bismuth is also

Chapter 4: Improving the TE performance and crystal structure of Ca3Co4O9 ceramics through Bismuth Cation Substitution
65
considered the most naturally occurring diamagnetic element; more diamagnetic than any
other metal. [2] Diamagnetism is a property of the material that allows it to create an
induced magnetic field in an opposite direction to that of an externally applied magnetic
field. [4] Superconductors are usually considered perfect diamagnets. This diamagnetic
property gives bismuth the ability to have one of the lowest thermal conductivities of all
metals. [4] This is advantageous when calculating its figure of merit.
Ca3Co4O9 ceramics doped with bismuth were shown to begin melting at sintering
temperatures of 1273 K; while, the undoped Ca3Co4O9 can be synthesized up to 1373 K
demonstrating that bismuth may form a liquid phase aiding in the sliding of grains and
densification of the material. Bismuth can then increase in size 3.32% upon solidification
increasing lattice parameters and further helping to densify the bulk sample to improve
grain connectivity and enhance carrier mobility thus reducing its electrical resistivity. [3,4,5]
Bismuth has been commonly shown to decrease electrical resistivity through this
increased carrier mobility as well as enhancing its Seebeck coefficient. [6,7] Increase in
grain growth due to partial substitution of bismuth for calcium ions contributes largely to
this increase in carrier mobility as well. [8] Siwen at al. confirm this grain growth and report
a dimensionless figure of merit of ~0.2 at 973 K for Ca2.5Bi0.5Co4O9, shown in figure 18,
through solid state reaction of powders in stoichiometric ratios and conventional pressing
and sintering. [9] Eight years after Siwen, Yuhen et al. reported a figure of merit of 0.25 at
973 K for bismuth doped Ca0.85Bi0.15Co4O9 prepared through sol-gel precursor powders
and spark plasma sintering (SPS). [7]

Chapter 4: Improving the TE performance and crystal structure of Ca3Co4O9 ceramics through Bismuth Cation Substitution
66
Figure 18 Temperature dependence of figure of merit for Ca3-xBixCo4O9+δ (x=0.0 and 0.5) [9]
Bismuth substitution has also been effective in decreasing oxygen deficiencies in the
system. [11] Replacing divalent Ca2+ ions with trivalent Bi3+ ions in the Ca2CoO3 insulating
layer causes bismuth to inject electrons in to the CoO2 conductive layer due to the charge
imbalance. An increase in oxygen content is then experienced in order to stabilize this
charge imbalance. This provides the hole carriers to the system, reducing the electrical
resistivity. [11] Since the hole carriers dominate the Ca3Co4O9 system, this scenario
contributes to a reduction in carrier density, n, playing a large role in increasing the
Seebeck coefficient as well. [11] Furthermore, according to W. Koshibae et al. the

Chapter 4: Improving the TE performance and crystal structure of Ca3Co4O9 ceramics through Bismuth Cation Substitution
67
substitution of Bi3+ is expected to lower the overall valence of cobalt, thus resulting in a
decrease in Co4+ concentration in exchange for the Co3+ valence state in the CoO2
conductive layer to cause an enhancement of the Seebeck coefficient. [10]
Masashi et al. reported on the increase in cell volume of Ca3Co4O9 with increased
doping of bismuth, confirming that not only does bismuth promote grain growth but it also
enters the lattice, upon doping, in place of calcium vacancies to increase the overall lattice
parameters. [11] By entering the lattice, bismuth stabilizes the crystal structure and
eliminates stacking faults improving grain connectivity by moderating the misfit
relationship between the insulating Ca2CoO3 and the conducting CoO2 layers. [11] This
improvement in grain connectivity causes a reduction to the electrical resistivity. Also,
relaxing the misfit lattice can shorten the phonon mean free path. [11] This lattice
relaxation, along with bismuth’s size and mass, are all known to reduce its thermal
conductivity, helping to contribute to a higher figure of merit. [6,7] This lattice parameter
increase is shown in figure 19.

Chapter 4: Improving the TE performance and crystal structure of Ca3Co4O9 ceramics through Bismuth Cation Substitution
68
Figure 19 Lattice parameters calculated by Rietveld analysis as a function of Bi composition b1 and b2 correspond to the b parameters of [Ca2CoO3] and [CoO2] layers,
respectively. [11]
Chapter 4: Improving the TE performance and crystal structure of Ca3Co4O9 ceramics through Bismuth Cation Substitution
69
Reports on bismuth doped calcium cobaltite single crystal have shown to improve
Ca3Co4O9’s figure of merit to 0.9 at 973 K. [12] However, there is a lack of information on
the doping of bismuth in polycrystalline bulk samples with the use of a sol-gel route with
conventional pressing and sintering methods. There is also no study on the correlation
between the microstructure and its properties.
This chapter focuses on the investigation into the possible Seebeck coefficient
enhancement while achieving a low electrical resistivity and thermal conductivity with
bismuth doping. X-ray diffraction patterns of single crystals prepared with partially bismuth
substituted Ca3Co4O9 reported by Masashi et al. displayed a secondary phase of
Bi2Ca2Co2Ox with the molar ratio of Ca:Bi:Co=2.5:0.5:4. [11] This secondary phase, most
likely due to the over doping of bismuth, can cause an increase in electrical resistivity
showing that a Ca:Bi ratio of 2.5:0.5 is most likely too large and proved to be a reference
point when choosing the doping concentrations used in this chapter.
4.3 Experimental Procedure
Ca3-xBixCo4O9 powders where x=0.0, 0.1, 0.2, 0.3, 0.4 were obtained through a sol-
gel route in which stoichiometric ratios of Ca(NO3)2•4H2O, Co(NO3)2•6H2O and
Bi(NO3)2•5H2O were mixed in deionized water. Ethylene glycol and polyethylene glycol
were used to aid polymerization of the solution and vary particle size. Lastly in the process
nitric acid was added to induce nitrate salts decomposition and facilitate new compound
formation. [12] The liquid solution was then submerged in a silicone oil bath on a hot plate
and mechanically stirred at 353 K for 3 hours to achieve the sol-gel state. The sol-gel was
then distributed to ceramic crucibles, loosely covered with aluminum foil, and put into a

Chapter 4: Improving the TE performance and crystal structure of Ca3Co4O9 ceramics through Bismuth Cation Substitution
70
box furnace with a ramp rate of 10 K per minute reaching a temperature of 773 K. The
powders were held there for 2 hours before cooling back down to room temperature at 10
K per minute. Holding this temperature for the allotted time ensures that any inorganic
material is removed from the material. The powders were deposited into a mortar where
they were manually ground via pestle and mortar for 20 minutes. After the powders have
been manually ground they were deposited in a tubular furnace where they were calcined
in an oxygen rich induced environment at 973 K for 4 hours, with a ramp rate of 10 K per
minute, to achieve the Ca3Co4O9 crystal lattice. The powders were then cooled down to
room temperature at a rate of 10 K per minute.
Two pellets were pressed, one to test the electrical properties and the other for the
thermal properties. The calcined powders were pressed uniaxially with 1 GPa of force
and held for 40 minutes at 423 K then allowed to cool back to 298 K. The pellets’ densities
were obtained before they were put in to a tubular furnace to be sintered. The sintering
process removes any extra moisture the pellet may contain and assures proper grain
alignment. Pellets were sintered in an oxygen rich induced environment with a ramp rate
of 10 K per minute and held at 1233 K for 9 hours. The pellets were then cooled back to
room temperature at a rate of 4 K per minute and once again the densities were taken.
Pellets were cut into a 2mm x 3.5mm rectangular shapes and inserted into a Linseis LSR
3-Seebeck machine, subjected to a low pressure helium, He, environment where the
pellet’s electrical resistivity and Absolute Seebeck Coefficient were simultaneously
determined by means of a dc four-probe method. Since helium is an inert gas it will not
react or interfere with the measurement. A second pellet was cut along a different axis
and inserted into the Linseis LFA 1000 machine to test its thermal conductivity. The pellet

Chapter 4: Improving the TE performance and crystal structure of Ca3Co4O9 ceramics through Bismuth Cation Substitution
71
was cut to be 2 mm thick and polished to a diameter of 11-13 mm. Any less than 11 mm
and there would be room for heat to escape the holder, any more than 13 mm and the
pellet would be too large for the holder. The thermal conductivity is calculated by the
equation
K=λCpρm (6)
Where λ is the thermal diffusity in meters squared per second (m2/s), Cp is the specific
heat capacity in joules per kilogram kelvin (J/kg•K), and ρm is the mass density in grams
per centimeter cubed (g/cm3). As stated in the first section, these are the three values
needed in order to obtain the materials’ ZT value. For bismuth substitution five different
chemistries were used. The first chemistry was the Ca3Co4O9 baseline and the other four
are dopings of bismuth in 0.1 gram increments; Ca3-xBixCo4O9 where x = 0.1, 0.2, 0.3,
and 0.4.
4.4 Experimental Results of Bismuth doped Ca3Co4O9 using cation substitution
4.4.1 Presence of bismuth in the lattice & at the grain boundary of Ca3Co4O9 ceramics
As figure 20 shows, the undoped sample starts at 315 K with an electrical resistivity
at around 70 µΩm and as the temperature increases to 1100 K so too does the resistivity,
to about 100 µΩm. This is characteristic of how a metal would act, increased resistivity
with increased temperature. As the doping concentration of bismuth is increased the
electrical resistivity steadily decreases in all temperature ranges. Doping up to x=0.3
proves to enhance grain growth, increase its grain anisotropy, along with improving its
crystal texture development. [12] The optimal resistivity occurs with a doping concentration
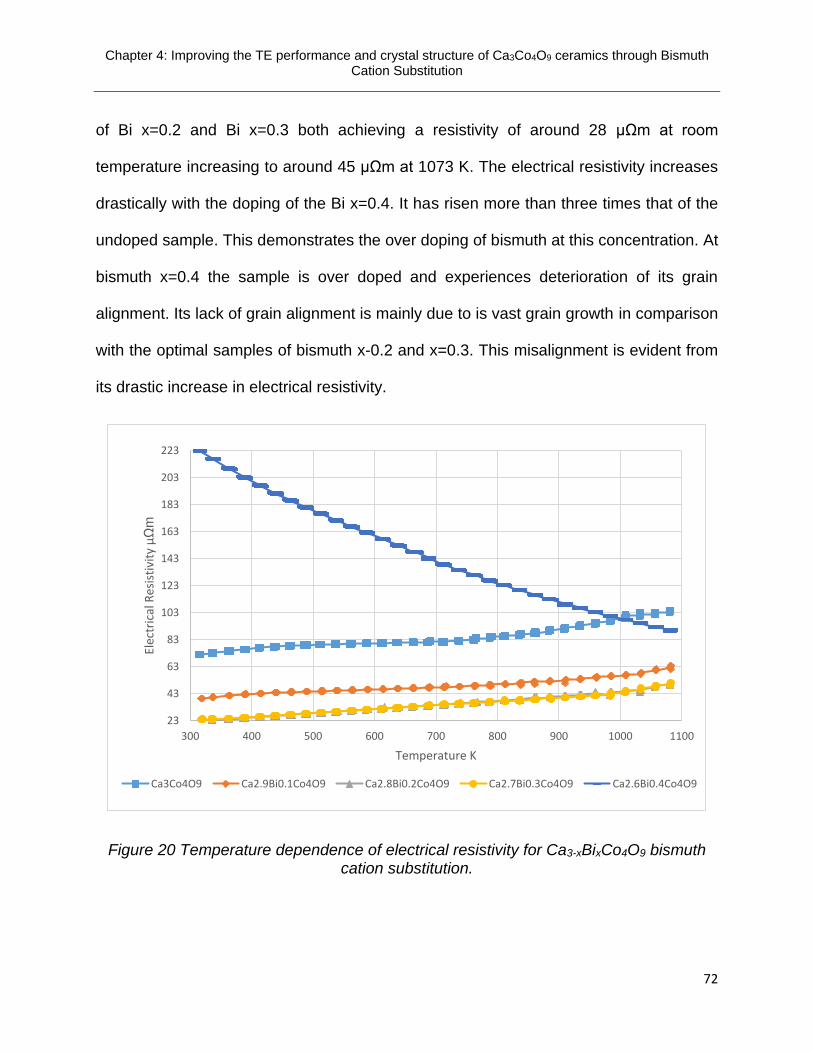
Chapter 4: Improving the TE performance and crystal structure of Ca3Co4O9 ceramics through Bismuth Cation Substitution
72
of Bi x=0.2 and Bi x=0.3 both achieving a resistivity of around 28 µΩm at room
temperature increasing to around 45 µΩm at 1073 K. The electrical resistivity increases
drastically with the doping of the Bi x=0.4. It has risen more than three times that of the
undoped sample. This demonstrates the over doping of bismuth at this concentration. At
bismuth x=0.4 the sample is over doped and experiences deterioration of its grain
alignment. Its lack of grain alignment is mainly due to is vast grain growth in comparison
with the optimal samples of bismuth x-0.2 and x=0.3. This misalignment is evident from
its drastic increase in electrical resistivity.
Figure 20 Temperature dependence of electrical resistivity for Ca3-xBixCo4O9 bismuth cation substitution.
23
43
63
83
103
123
143
163
183
203
223
300 400 500 600 700 800 900 1000 1100
Elec
tric
al R
esis
tivi
ty µ
Ωm
Temperature K
Ca3Co4O9 Ca2.9Bi0.1Co4O9 Ca2.8Bi0.2Co4O9 Ca2.7Bi0.3Co4O9 Ca2.6Bi0.4Co4O9

Chapter 4: Improving the TE performance and crystal structure of Ca3Co4O9 ceramics through Bismuth Cation Substitution
73
Figure 21 represents the Absolute Seebeck Coefficients of the different bismuth
dopings. It can be seen that as soon as the bismuth is introduced, the room temperature
Absolute Seebeck coefficient increases up 20-30 µV/K from the undoped Ca3Co4O9
sample. This shows that the Seebeck coefficient enhancement experienced in the Bi2Te3
set from chapter 3 was most likely responsible due to the existence of the bismuth. With
each increased concentration of Bismuth the room temperature Absolute Seebeck
Coefficients are greater than the last. This trend stays consistent up until its saturation
limit at around 150 µV/K. As the temperature increases to 1073 K so do the Seebeck
coefficients, with the exception of bismuth x=0.4 which succumbs to its large increase in
carrier concentration at roughly 650 K. This drop in Seebeck coefficient is highly indicative
of an over doped sample. The grain growth was too vast causing improper alignment and
drastically lowering carrier mobility in the sample.

Chapter 4: Improving the TE performance and crystal structure of Ca3Co4O9 ceramics through Bismuth Cation Substitution
74
Figure 21 Temperature dependence of absolute seebeck coefficient for Ca3-xBixCo4O9 bismuth cation substitution.
4.4.2 Power factor enhancement of Ca3Co4O9 through Bismuth Substitution of Ca
With increased doping the power factor shown in figure 22 increases as well. Both
bismuth x=0.2 and bismuth x=0.3 start off with a very high power factor of over 0.90W/mK2
at room temperature which is more than four times greater than the power factor (PF) of
the Ca3Co4O9 baseline sample. With a PF of ~0.73 W/mK2 at 1073 K it is almost three
times higher than the Ca3Co4O9 baseline. Bismuth x=0.4’s power factor however is lower
than that of the baseline in all temperature ranges. This is a perfect example of the roles
that the resistivity and Seebeck coefficient play in obtaining the power factor. The over
doped sample of bismuth x=0.4 has a very high resistivity at low temperatures which
offsets its seemingly good Seebeck coefficient at the same temperature thus giving it a
120
130
140
150
160
170
180
190
200
300 400 500 600 700 800 900 1000 1100
Ab
solu
te S
eeb
eck
Co
effi
cien
t µV
/K
Temperature K
Ca3Co4O9 Ca2.9Bi0.1Co4O9 Ca2.8Bi0.2Co4O9 Ca2.7Bi0.3Co4O9 Ca2.6Bi0.4Co4O9

Chapter 4: Improving the TE performance and crystal structure of Ca3Co4O9 ceramics through Bismuth Cation Substitution
75
low power factor. Although the bismuth x=0.4 resistivity drops consistently and
significantly as the temperature increases, its Absolute Seebeck coefficient falls off
drastically at 650 K being the major contributor for its poor power factor in the mid to high
temperature range. In order to obtain a consistent high power factor, both values must
yield good results throughout all temperatures ranges. This also explains the slight
decrease in power factor of all samples as well, with the exception of the over doped
sample. Even though all of their Absolute Seebeck coefficients steadily increase with
increasing temperature their resistivities increase slightly as well causing almost a
perfectly flat power factor. This rise is mainly due to the intrinsic nature of the resistivity
of a metal in general. [2] The highest power factors are for the bismuth x=0.2 and x=0.3
samples, at 973 K, with power factors of ~0.80 mW/mK2 and ~0.83 mW/mK2, respectively.
Both are nearly three times that of the undoped sample and are also higher than any
reportings for polycrystalline samples of Ca3Co4O9; comparable to that of the single
crystal’s power factor. [12]

Chapter 4: Improving the TE performance and crystal structure of Ca3Co4O9 ceramics through Bismuth Cation Substitution
76
Figure 22 Temperature dependence of power factor for Ca3-xBixCo4O9 bismuth cation substitution.
4.4.3 Microstructure of bismuth doped Ca3Co4O9
The alignment of grains can be seen in the Scanning Electron Microscope cross-
sectional images illustrated in figure 23 taken from the fractured surface of the pellets.
Larger grains can make it more difficult for the grains to properly align themselves in a
fashion that aids its electrical transport properties. Larger grains also mean less grain
boundaries and less opportunity for phonon scattering. Figure 23 shows the increased
improvement of the grain alignment with the increase in bismuth concentration from (a)
to (d) representing Ca3Co4O9, Ca2.9Bi0.1Co4O9, Ca2.8Bi0.2Co4O9, and Ca2.7Bi0.3Co4O9,
respectively. Image (e) and (f) show high and low magnification of the Ca2.6Bi0.4Co4O9
over doped sample. There is vast grain growth and misalignment among the crystal
0.06
0.16
0.26
0.36
0.46
0.56
0.66
0.76
0.86
0.96
300 400 500 600 700 800 900 1000 1100
Po
wer
Fac
tor
mW
/mK
2
Temperature K
Ca3Co4O9 Ca2.9Bi0.1Co4O9 Ca2.8Bi0.2Co4O9 Ca2.7Bi0.3Co4O9 Ca2.6Bi0.4Co4O9

Chapter 4: Improving the TE performance and crystal structure of Ca3Co4O9 ceramics through Bismuth Cation Substitution
77
texture of the sample. However, as mentioned, grain growth can have a positive effect on
the results as well. Ruoming et al. claimed that Ca3Co4O9 baseline has a Lotgering factor
of about ~0.74 but after doping with bismuth they achieved a value of around 0.9. [13] This
is due to the grain growth and alignment caused by the doping of bismuth which
significantly reduces the material’s electrical resistivity. At the doping level of Bi x=0.4 the
sample becomes over doped and the grain growth becomes too significant for the grains
to move or jitter as well during sintering in order to align themselves efficiently. This
causes misalignment in the grains and does not allow for smooth transport of the electron-
hole pair causing a significant increase in the electrical resistivity which was shown in
figure 20.
Figure 23 SEM cross-sectional view of undoped Ca3Co4O9 and doped Ca3-xBixCo4O9 with x=0.0, 0.1, 0.2, 0.3, 0.4. [12]

Chapter 4: Improving the TE performance and crystal structure of Ca3Co4O9 ceramics through Bismuth Cation Substitution
78
4.4.4 Nanostructure of bismuth doped Ca3Co4O9
Figure 24 shows the TEM nanostructure of the optimal sample of Ca2.7Bi0.3Co4O9.
Low magnification of the TEM diffraction contrast in image (a) shows a typical grain
boundary and the adjacent two grains. The pink and green arrows labeled C1 and C2
respectively indicate the different c-axis orientations of these two grains with a
misorientation angle of about 6°. Low magnification STEM Z-contrast from the same
grain boundary is indicated in image (b). High magnification STEM Z-contrast of that
same grain boundary shows two segregations sites in image (c). EDS point examinations
were conducted at eight different locations and are summarized and illustrated in table 1.
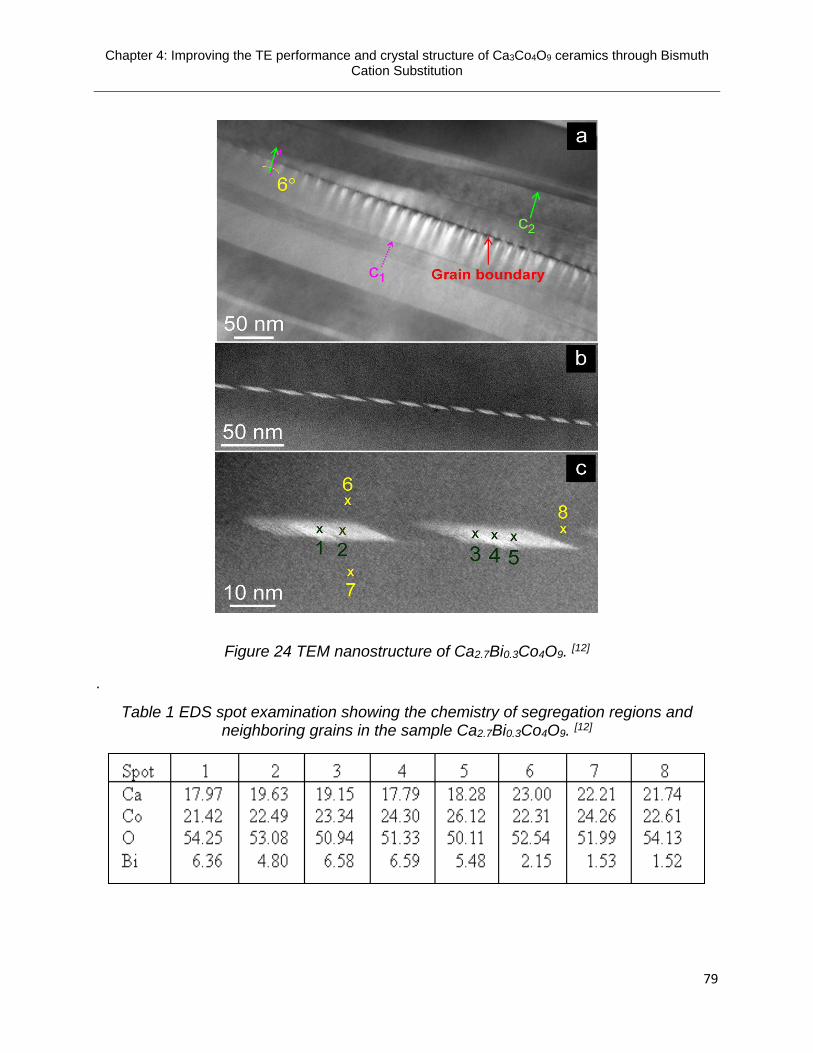
Chapter 4: Improving the TE performance and crystal structure of Ca3Co4O9 ceramics through Bismuth Cation Substitution
79
Figure 24 TEM nanostructure of Ca2.7Bi0.3Co4O9. [12]
.
Table 1 EDS spot examination showing the chemistry of segregation regions and neighboring grains in the sample Ca2.7Bi0.3Co4O9. [12]

Chapter 4: Improving the TE performance and crystal structure of Ca3Co4O9 ceramics through Bismuth Cation Substitution
80
Figure 25 shows TEM images of undoped and bismuth doped Ca3Co4O9. Image
(a) shows one Ca3Co4O9 grain boundary and its two neighboring grains with nano-lamella
morphologies. Image (b) shows the selected area diffraction pattern and indexing circled
red in image (a). Image (c) shows the magnified grain boundary from the yellow dotted
region framed in image (a). The nanostructure of Ca2.7Bi0.3Co4O9 is shown in image (d).
Figure 25 TEM images of undoped and bismuth doped Ca3Co4O9. [12]
4.4.5 Impact of sample density on thermal conductivity
The Ca3Co4O9 baseline has a thermal conductivity of 2.3 W/mK at 373 K dropping
to around 2 W/mK at 1073 K. It can be seen in figure 26 that upon doping with bismuth it

Chapter 4: Improving the TE performance and crystal structure of Ca3Co4O9 ceramics through Bismuth Cation Substitution
81
immediately reduces the conductivity to 2.1 W/mK at 373 K and drops below 1.9 W/mK
at 1073 K. This is due to the increase in density at the grain boundary. Although bismuth
mainly distributes itself directly into the grains it also deposits itself in the grain boundary
causing its density to increase. With bismuth x=0.3 the thermal conductivity is slightly
higher than that of the baseline. This is due to over doping and its grain growth which
affected its figure of merit. As the grain size increases, the lattice thermal conductivity
increases with it since larger grains mean fewer grain boundaries and weaker phonon
interface scattering. [14]
Figure 26 Temperature dependence for thermal conductivity of Ca3-xBixCo4O9 bismuth cation substitution.
1.8
1.9
2
2.1
2.2
2.3
2.4
2.5
300 400 500 600 700 800 900 1000 1100
Ther
mal
Co
nd
uct
ivit
y W
/mK
Temperature K
Ca3Co4O9 Ca2.9Bi0.1Co4O9 Ca2.8Bi0.2Co4O9 Ca2.7Bi0.3Co4O9 Ca2.6Bi0.4Co4O9

Chapter 4: Improving the TE performance and crystal structure of Ca3Co4O9 ceramics through Bismuth Cation Substitution
82
Bismuth x=0.4 has the highest thermal conductivity due to its significant increase
in density. As mentioned in equation 13 the pellet’s density is directly related to the
thermal conductivity and with a density of 4.80 g/cm3 for the bismuth x=0.4 sample this is
much greater than the 3.70 g/cm3 and 3.95 g/cm3 of the bismuth x=0.1 & x=0.2
respectively. The low densities of those specific samples reinforces the role that the
sample’s density plays in measuring its thermal conductivity.
4.4.6 Significance of low thermal conductivity for achieving the high Figure of Merit
The figure of merits of the undoped and bismuth doped Ca3Co4O9 samples are
represented in figure 27. The Ca3Co4O9 baseline has a figure of merit of about 0.03 at
373 K and increases to 0.15 at 1073 K. The doping of bismuth x=0.1 not only increases
the figure of from 0.03 to 0.08 at 373 K, almost 3 times that of the baseline, but its final
data point at 1073 K has kept this trend to best that of the Ca3Co4O9 baseline by over two
times its original value to achieve a ZT value of 0.33 at 1073 K.
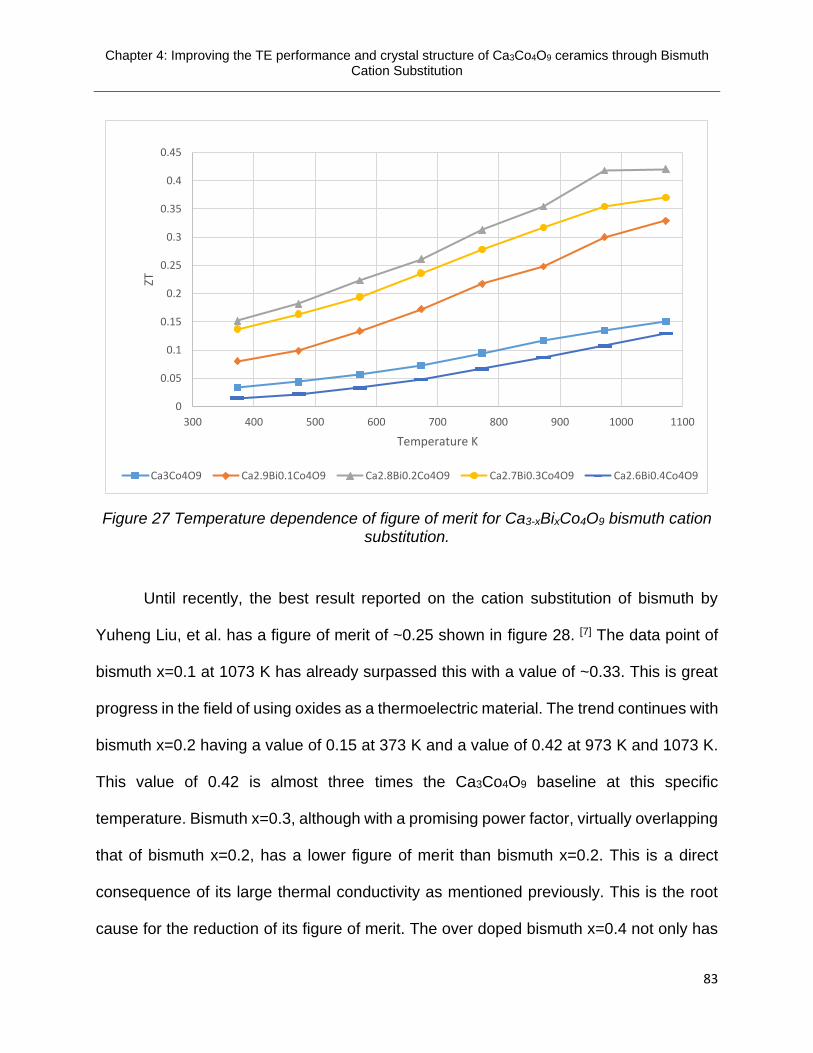
Chapter 4: Improving the TE performance and crystal structure of Ca3Co4O9 ceramics through Bismuth Cation Substitution
83
Figure 27 Temperature dependence of figure of merit for Ca3-xBixCo4O9 bismuth cation substitution.
Until recently, the best result reported on the cation substitution of bismuth by
Yuheng Liu, et al. has a figure of merit of ~0.25 shown in figure 28. [7] The data point of
bismuth x=0.1 at 1073 K has already surpassed this with a value of ~0.33. This is great
progress in the field of using oxides as a thermoelectric material. The trend continues with
bismuth x=0.2 having a value of 0.15 at 373 K and a value of 0.42 at 973 K and 1073 K.
This value of 0.42 is almost three times the Ca3Co4O9 baseline at this specific
temperature. Bismuth x=0.3, although with a promising power factor, virtually overlapping
that of bismuth x=0.2, has a lower figure of merit than bismuth x=0.2. This is a direct
consequence of its large thermal conductivity as mentioned previously. This is the root
cause for the reduction of its figure of merit. The over doped bismuth x=0.4 not only has
0
0.05
0.1
0.15
0.2
0.25
0.3
0.35
0.4
0.45
300 400 500 600 700 800 900 1000 1100
ZT
Temperature K
Ca3Co4O9 Ca2.9Bi0.1Co4O9 Ca2.8Bi0.2Co4O9 Ca2.7Bi0.3Co4O9 Ca2.6Bi0.4Co4O9

Chapter 4: Improving the TE performance and crystal structure of Ca3Co4O9 ceramics through Bismuth Cation Substitution
84
a low figure of merit but it actually drops below that of the pure baseline. This is caused
by its large grain size and poor alignment resulting in a high electrical resistivity and low
Absolute Seebeck coefficient in tandem with its high thermal conductivity.
Figure 28 Temperature dependence of the ZT values for undoped Ca3Co4O9 and (Ca0.95Bi0.05)3Co4O9 [7]
4.5 Summary of results for Bismuth cation substitution in Ca3Co4O9
Bismuth deposits itself at the grain interior to improve the crystal texture through
increased grain growth along with grain alignment. It also deposited itself at the grain
boundary causing segregation resulting in a carrier concentration reduction and

Chapter 4: Improving the TE performance and crystal structure of Ca3Co4O9 ceramics through Bismuth Cation Substitution
85
enhancement of the Absolute Seebeck coefficient. The segregation at the grain boundary
also helps to improve the crystal texture along with reducing the thermal conductivity. Low
electrical resistivities of around 23 µΩm were achieved through doping the Ca3Co4O9 with
bismuth. The optimal concentration was found to be bismuth x=0.2 mainly attributing its
high figure of merit due to its high power factor of ~0.77 mW/mK2 and its low thermal
conductivity of ~1.88 W/mK, both at 973 K. Bismuth x=0.3 still demonstrated a high power
factor but its figure of merit suffers due to its slight increase in thermal conductivity caused
by its increase in density. Bismuth x=0.4, the over doped sample, has both poor electrical
and thermal properties. Leading to a figure of merit lower than the pristine Ca3Co4O9.
Figure 29 shows a drawing to demonstrate where the bismuth deposits and how it effects
the grain alignment. The light red shows the presence of bismuth in the grains and the
dark red line indicates the bismuth enriched grain boundaries.
Figure 29 Microstructure drawing of undoped Ca3Co4O9 and Ca2.7Bi0.3Co4O9.

Chapter 4: Improving the TE performance and crystal structure of Ca3Co4O9 ceramics through Bismuth Cation Substitution
86
Analyzing bismuth’s role at the grain boundary motivates the possibility to
maximize the amount of segregation at the boundary. By using a non-stoichiometric
addition method, which will be explained in detail in the following chapter, an attempt to
force the bismuth solely to the grain boundary can be made in order to further enhance
the absolute Seebeck coefficient.

Chapter 4: Improving the TE performance and crystal structure of Ca3Co4O9 ceramics through Bismuth Cation Substitution
87
4.6 References
1 "Ionic substitution." A Dictionary of Earth Sciences. Encyclopedia.com. 28 Jul. 2017
2 Live Science Staff. Facts about Bismuth. September 5, 2013.
3 Gagnon, Steve. It’s Elemental: The Periodic Table of Elements. The Element Bismuth. Jefferson Lab. 2017
4 Boundless. "Diamagnetism and Paramagnetism." Boundless Chemistry Boundless, Invalid Date Invalid Date. Invalid Date. Retrieved 28 Jul. 2017
5 Haoshan Hao, Qinglin He, Changqing Chen, Hongwei Sun and Xing Hu. Textured structure and anisotropic thermoelectric properties of Ca2.7Bi0.3Co4O9 oxide prepared by conventional solid-state reaction. International Journal of Modern Physics B. Vol.23, No.1 pp.87-95, 2009.
6 Michitaka Ohtaki. Recent aspects of oxide thermoelectric materials for power generation from mid-to-high temperature heat source. Journal of the Ceramic Society of Japan 119 [11] 2011.
7 Yuheng Liu, Yuanhua Lin, Lei Jiang, Ce-Wen Nan, Zhijian Shen. Thermoelectric properties of Bi3+ substituted Co-based misfit-layered oxides. Journal of Electroceramics. Vol. 21, pp. 748-751, 2008.
8 Haoshan Hao, Limin Zhao and Xing Hu. Microstructure and Thermoelectric Properties of Bi- and Cu-Substituted Ca3Co4O9 Oxides. Journal of Materials Science and Technology. Vol.25. No.1, 2009.
9 Siwen Li, Ryoji Funahashi, Ichiro Matsubara, Kazuo Ueno, Satoshi Sodeoka, and Hiroyuki Yamada. Synthesis and Thermoelectric Properties of the New Oxide Materials Ca3-xBixCo4O9+δ (0.0<x<0.75). American Chemical Society. Chemistry of Materials. Vol.12, pp.2424-2427, 2000.
10 David Moser, Lassi Karvonen, Sascha Populoh, Matthias Trottmann, Anke Weidenkarr. Influence of the oxygen content on thermoelectric properties of Ca3-xBixCo4O9+δ system. Solid State Sciences. Vol. 13, Iss. 12, pp. 2160-2164, December 2011.
11 Masashi Mikami, Kanji Chong, Yuzuru Miyazaki, Tsuyoshi Kajitani, Takahiro Inoue, Satoshi Sodeoka and Ryoji Funahashi. Bi-Substitution Effects on Crystal Structure and Thermoelectric Properties of Ca3Co4O9 Single Crystals. Japanese Journal of Applied Physics. Vol. 45, No. 5A, pp. 4131-4136, 2006.
12 Boyle, Cullen; Calvillo, Paulo; Chen, Yun; Barbero, Ever J.; McIntyre, Dustin. Grain boundary segregation and thermoelectric performance enhancement of bismuth doped calcium cobaltite. Journal of the European Ceramic Society 36(3):601-607 Elsevier 2016 0955-2219
13 Ruomin Tian, Tianshu Zhang, Dewei Chu, Richard Donelson, Li Tao, Sean Li. Enhancement of high temperature thermoelectric performance in Bi, Fe co-doped layered oxide-based material Ca3Co4O9+δ. Journal of Alloys and Compounds. 615:311-315. July 4, 2014.

Chapter 4: Improving the TE performance and crystal structure of Ca3Co4O9 ceramics through Bismuth Cation Substitution
88
14 Murat Gunes, Macit Ozenbas. Journal of Alloys and Compounds. Vol.626, pp.360-367,
2015.
15 T. Sun, H. H. Hng, Q. Y. Yan, and J. Ma. Enhanced high temperature thermoelectric properties of Bi-doped c-axis oriented Ca3Co4O9 thin films by pulsed laser deposition. AIP Journal of Applied Physics. 108, 083709. 2010.
16 Zunyi Tian, Xiaohong, Wang, Jun Liu, Zhongjin Lin, Yangsen Hu, Yigui Wu, Chao Han, Zhiyu Hu. Power factor enhancement induced by Bi and Mn co-substitution in NaxCoO2 thermoelectric materials. Journal of Alloys and Compounds. 661, pp. 161-167, 2016.
17 Ankam Bhaskar, Z.-R. Lin, Chia-Jyi Liu. Thermoelectric properties of Ca2.95Bi0.05Co4-
xFexO9+δ (0<x<0.15). Energy Conversion and Management Vol.76, pp. 63-67, 2013.
18 K. Rubešová, T. Hlásek, V. Jakeš, Š. Huber, J. Hejtmánek, D. Sedmidubský. Effect of a powder compaction process on the thermoelectric properties of Bi2Sr2Co1.8Ox ceramics. Journal of the European Ceramic Society, Vol.35, pp.525-531, 2015.
19 Sajid Butt, Yaoyu Ren, Muhammad Umer Farooq, Bin Zhan, Rizwan Ur Rahman Sagar, Yuanhua Lin, Ce-Wen Nan. Enhanced thermoelectric performance of heavy-metals (M: Ba, Pb) doped misfit-layered ceramics: (Ca2-xMxCoO3)0.62 (CoO2). Energy Conversion and Management. Vol.83, pp.35-41, 2014.
20 Susumu Fujii and Masato Yoshiya. Manipulating thermal conductivity by interfacial modification of misfit-layered cobaltites Ca3Co4O9. Journal of Electronic Materials, Vol.45, No.3, pp.1217-1226. 2016.
21 J. C. Diez, E. Guilmeau, M. A. Madre, S. Marinel, S. Lemonnier, A. Sotelo. Improvement of Bi2Sr2Co1.8Ox thermoelectric properties by laser floating zone texturing. Solid State Ionics, Vol.180, pp.827-830, 2009.
22 J. J. Shen, X. X. Liu, T. J. Zhu, X. B. Zhao. Improved thermoelectric properties of La-doped Bi2Sr2Co2O9- layered misfit oxides. Journal of Materials Science. Vol.44, pp.1889-1893, 2009.
23 Kenji Tanabe, Ryuji Okazaki, Hiroki Taniguchi, and Ichiro Terasaki. Optical conductivity of layered calcium cobaltate Ca3Co4O9. Journal of Physics: Condensed Matter. Vol.28, 2016.
24 W. Koshibae, K. Tsutsui, and S. Maekawa. Thermopower in cobalt oxides. Physical Review B. Vol. 62, Num. 11, pp. 6869-6872. September 2000.

Chapter 5: The Versatility of Bismuth through Non-stoichiometric Addition of Ca3Co4O9
89
Chapter 5:
The Versatility of Bismuth doping through Non-stoichiometric Addition of Ca3Co4O9
5.1 Background and motivation for non-stoichiometric addition method
Until recently, the most common and possibly the only doping method reported on has
been that of cation substitution. Simply replacing specific ions of a baseline chemistry
with a series of dopants which would cause different kinds of defects, within the material,
leading to improved thermoelectric results. It was discovered, however, that in the event
of doping a chemistry set there are some advantages to not replacing any of the ions from
the baseline, rather adding to it and leaving the original chemistry untouched. Instead of
dictating where the dopant will go by forcing it into vacancies created in lattice, through
cation substitution, it allows the dopant to deposit itself where it so sees fit. Chapter four
uses bismuth as a dopant utilizing the substitution method. Bismuth depositing itself at
the grain interior and grain boundary allow it to be a great candidate for non-stoichiometric
addition.
Non-stoichiometric addition is the addition of a dopant into the Ca3Co4O9 without
subtracting any existing ions such as the calcium ions substituted in chapter 4. Instead of
subtracting the calcium, the Ca3Co4O9 chemistry will be untouched and just the specified
concentration of the bismuth will be added. This allows bismuth ions the freedom to
deposit themselves where they most naturally see fit which is where the energy is highest.
Despite being close in ionic size with calcium there will be no reduction of ions thus

Chapter 5: The Versatility of Bismuth through Non-stoichiometric Addition of Ca3Co4O9
90
presenting a greater amount of bismuth at the grain boundary in order to further enhance
the room temperature Seebeck coefficient while still having the opportunity to fill in any
calcium vacancies that may have occurred. By not preserving the original stoichiometry
the possibility for secondary phases to occur increases and was investigated as well.
5.2 Experimental Procedure
Ca3BiuCo4O9 powders where u=0.0, 0.01, 0.05, 0.1, 0.2, 0.25, 0.3, 0.35, 0.4 were
obtained through a sol-gel route in which non-stoichiometric ratios of Ca(NO3)2•4H2O,
Co(NO3)2•6H2O and Bi(NO3)2•5H2O were mixed in deionized water. Ethylene glycol and
polyethylene glycol were used to aid polymerization of the solution and to aid in particle
size. [1] Nitric acid was added to induce nitrate salts decomposition and facilitate new
compound formation. [2]The liquid solution was then submerged in a silicone oil bath on a
hot plate and mechanically stirred at 353 K for 3 hours to achieve the sol-gel state. The
sol-gel was then distributed to ceramic crucibles loosely covered with aluminum foil and
put into a box furnace with a ramp rate of 10 K per minute and held at 773 K for 2 hours
then cooled back to room temperature at a ramp rate of 10 K per minute. Holding the
temperature here, at 773 K, for the allotted time will ensure that any inorganic material is
removed from the material. The ashes were then hand milled for 20 minutes via pestle
and mortar. The powders were deposited in a tubular furnace where they were calcined
in an oxygen rich induced environment with a ramp rate of 10 K per minute and held at
973 K for 4 hours, to achieve the Ca3Co4O9 crystal lattice. The powders were then cooled
down to room temperature at a rate of 10 K per minute.

Chapter 5: The Versatility of Bismuth through Non-stoichiometric Addition of Ca3Co4O9
91
Two pellets were pressed, one to test its electrical properties and the other for its
thermal properties. The calcined powders were pressed uniaxially with 1 GPa of force
and held for 40 minutes at 423 K. The pellets’ densities were obtained before they were
put in to a tubular furnace to be sintered. The sintering process removes any extra
moisture the pellet may contain and assures proper grain alignment. Pellets were sintered
in an oxygen rich induced environment at 1233 K for 9 hours with a ramp rate of 10 K per
minute. It was then cooled back to room temperature at a rate of 4 K per minute and once
again the densities were taken. Pellets were cut into a 2 mm x 3.5 mm x 9 mm rectangular
shapes and inserted into a Linseis LSR 3-Seebeck machine, subjected to a low pressure
helium, He, environment where the pellet’s electrical resistivity and Absolute Seebeck
Coefficient were simultaneously determined by means of a dc four-probe method. Since
helium is an inert gas it will not react or interfere with the measurement. A second pellet
was cut along a different axis and inserted into the Linseis LFA 1000 machine to test its
thermal conductivity. The pellet was cut to be 2 mm thick and polished to a diameter of
11-13 mm. Any less than 11 mm and there would be room for heat to escape the holder,
any more than 13 mm and the pellet would be too large for the holder. The thermal
conductivity is calculated by the equation
K=λCpρm (13)
Where λ is the thermal diffusity in meters squared per second (m2/s), Cp is the specific
heat capacity in joules per kilogram kelvin (J/kg•K), and ρm is the mass density in grams
per centimeter cubed (g/cm3). As stated in the first section, these are the three values
needed in order to obtain the materials’ ZT value. For bismuth addition, nine different
chemistries were used. The first chemistry is the baseline of Ca3Co4O9 and the other eight

Chapter 5: The Versatility of Bismuth through Non-stoichiometric Addition of Ca3Co4O9
92
are dopings of bismuth; Ca3BiuCo4O9 where u = 0.01, 0.05, 0.1, 0.2, 0.25 0.3, 0.35 and
0.4.
5.3 Simultaneously doping the lattice and grain boundary
5.3.1 Increasing the carrier mobility through bismuth non-stoichiometric addition
Since bismuth 0.01 is such a small amount to dope with, it can be seen in figure 30
that the change in resistivity between the baseline and bismuth 0.01 is very trivial.
However, at bismuth 0.05 a jump in the trend can be seen. At room temperature, the
electrical resistivity of the bismuth 0.05 concentration is around 43 µΩm. Just below this,
following suit with the trend lies bismuth 0.1 at 39 µΩm. Unlike the baseline and bismuth
0.01’s electrical resistivity which increased from 70 µΩm to 100 µΩm a 30 µΩm jump,
bismuth 0.05 and bismuth 0.1’s resistivity only increases from around 40 µΩm at room
temperature to 60 µΩm at 1073 K which is only a 20 µΩm jump. The trend continues up
to bismuth 0.3 with each increased concentration having a lower resistivity than the last.
The room temperature electrical resistivities of bismuth 0.2, 0.25, and 0.3 are all between
17 and 21 µΩm and increase to between 40 and 49 µΩm at 1073 K. Although each
concentration increased in electrical resistivity from room temperature to 1073 K, it is
noticeable that with each increased amount of bismuth the resistivity starts off lower and
increases less. This trend insinuates that the addition of bismuth improves the grain
texture and size and aids in the alignment of the grains just as it has with the set utilizing
the cation substitution method. [3] Samples using the non-stoichiometric addition method
actually have a lower electrical resistivity than that of the cation substitution samples at
its optimum concentrations. The 0.35 and 0.4 content samples experience a significant
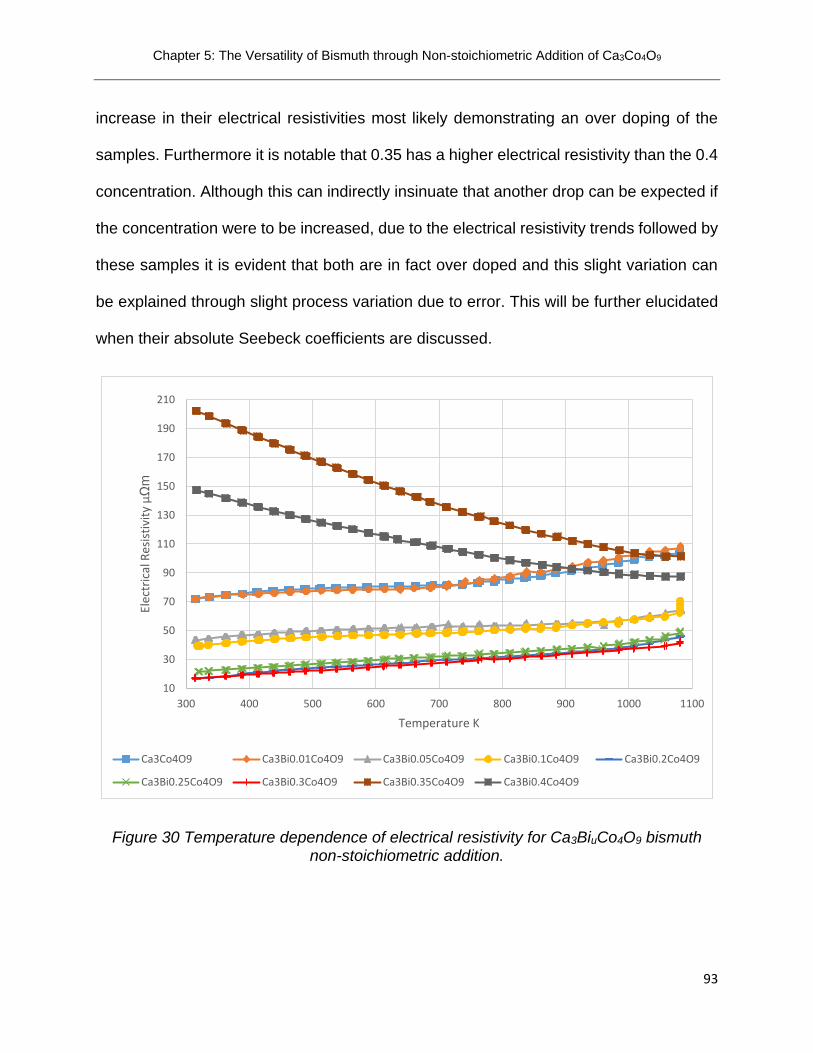
Chapter 5: The Versatility of Bismuth through Non-stoichiometric Addition of Ca3Co4O9
93
increase in their electrical resistivities most likely demonstrating an over doping of the
samples. Furthermore it is notable that 0.35 has a higher electrical resistivity than the 0.4
concentration. Although this can indirectly insinuate that another drop can be expected if
the concentration were to be increased, due to the electrical resistivity trends followed by
these samples it is evident that both are in fact over doped and this slight variation can
be explained through slight process variation due to error. This will be further elucidated
when their absolute Seebeck coefficients are discussed.
Figure 30 Temperature dependence of electrical resistivity for Ca3BiuCo4O9 bismuth non-stoichiometric addition.
10
30
50
70
90
110
130
150
170
190
210
300 400 500 600 700 800 900 1000 1100
Elec
tric
al R
esis
tivi
ty µ
Ωm
Temperature K
Ca3Co4O9 Ca3Bi0.01Co4O9 Ca3Bi0.05Co4O9 Ca3Bi0.1Co4O9 Ca3Bi0.2Co4O9
Ca3Bi0.25Co4O9 Ca3Bi0.3Co4O9 Ca3Bi0.35Co4O9 Ca3Bi0.4Co4O9

Chapter 5: The Versatility of Bismuth through Non-stoichiometric Addition of Ca3Co4O9
94
5.3.2 Improvement of grain alignment along with boundary segregation
Figure 31 shows grain development the from cross-sectional SEM images of
surface fractured pellets. Image (a) shows the undoped Ca3Co4O9 where (b), (c), (d), and
(e) show the 0.1, 0.2, 0.3 and 0.35 concentrations respectively. The improved grain
alignment is evident as the content of bismuth increases. The optimal concentration, of
0.3, shown in image (d) is in stark comparison with that of the undoped Ca3Co4O9 shown
in image (a), with its preferred alignment along the a- and b-plane. Image (e) shows a
glassy like crystal structure of the over doped Ca3Bi0.35Co4O9 sample with grains larger
than 20 µm and no preferred direction. This improved crystal texture in image (d) is
caused by the doping of bismuth into the Ca3Co4O9 lattice which improves its alignment
as bismuth increases to its optimal concentration of 0.3.
Figure 31 SEM cross-sectional view of undoped Ca3Co4O9 and doped Ca3BiuCo4O9 with u=0.0, 0.1, 0.2, 0.3, and 0.35.

Chapter 5: The Versatility of Bismuth through Non-stoichiometric Addition of Ca3Co4O9
95
Apparent in figure 32 is that once the bismuth is added to the baseline the Seebeck
coefficient increases anywhere from 20-30 µV/K at room temperature reaching a range
of 140-150 µV/K which is consistent with the findings of K. Rubešová et al. [4] This is, in
fact, greater than that experienced through the cation substitution method using the same
dopant. This increase is due to bismuth depositing itself and segregating at the grain
boundary as well as depositing itself at the grain. The unique thing about the addition
process is that the doping element is allowed to deposit itself where it sees fit, as opposed
to deliberately forcing it go a specific location.
Figure 32 Temperature dependence of absolute seebeck coefficient for Ca3BiuCo4O9 bismuth non-stoichiometric addition.
120
130
140
150
160
170
180
190
200
300 400 500 600 700 800 900 1000 1100
Ab
solu
te S
eeb
eck
Co
effi
cien
t µV
/K
Temperature K
Ca3Co4O9 Ca3Bi0.01Co4O9 Ca3Bi0.05Co4O9 Ca3Bi0.1Co4O9 Ca3Bi0.2Co4O9
Ca3Bi0.25Co4O9 Ca3Bi0.3Co4O9 Ca3Bi0.35Co4O9 Ca3Bi0.4Co4O9

Chapter 5: The Versatility of Bismuth through Non-stoichiometric Addition of Ca3Co4O9
96
Bismuth deposits itself at the grain, due to a similar ionic size to calcium, causing a
significant reduction in the electrical resistivity. [3,5] This can be shown via the PANalytical
XPert-Pro X-Ray Diffraction which used Cu K-alpha radiation with 45 kV tension and 40
mA of current at room temperature. Figure 33 is a graph of those results with figure 34
focusing in on the (004) peak clearly showing a shift in peak to a lower angle with
increasing bismuth. This means that the d-spacing between crystal planes must be
increasing, indicating a growth in lattice size. This is an indicator that the bismuth still
deposits itself into the lattice upon doping, even in a scenario where calcium atoms are
not being removed. It can also be seen that there is a presence of bismuth at the grain
boundary causing the segregation which manifests itself as an increase in the Absolute
Seebeck Coefficient. [3]
Figure 33 X-Ray Diffraction patterns of undoped and doped Ca3Co4O9.

Chapter 5: The Versatility of Bismuth through Non-stoichiometric Addition of Ca3Co4O9
97
Figure 34 (004) peak from X-Ray Diffraction patterns of undoped and doped Ca3Co4O9 powders.
Bismuth acts as a filter at the grain boundary to reduce the carrier concentration thus
enhancing the Seebeck Coefficient. [6] However, a decrease in carrier concentration
usually leads to an increase in electrical resistivity. [7,8] Both electrical properties can be
simultaneously improved with the help of its carrier mobility. [8] During substitution the
bismuth deposits itself at the calcium site increasing the carrier mobility. [2] Since bismuth
can deposit itself freely during addition some will still find its way to where there are any
calcium deficiencies and deposit itself there into the grain once again increasing the
carrier mobility, improving crystal texture and in turn reducing the electrical resistivity. [9]
This is why there is an increase in Seebeck coefficient at the grain boundary without
negatively affecting its electrical resistivity. [10]

Chapter 5: The Versatility of Bismuth through Non-stoichiometric Addition of Ca3Co4O9
98
However, there is an elegant balance to this method. Too large of a reduction to the
carrier concentration will eventually have an overall deleterious effect since at a certain
point this becomes too influential for the mobility to counterbalance. This is exactly why
in the over doped samples the electrical resistivity has a drastic increase in electrical
resistivity mirrored by a significant decrease in its Seebeck coefficient at high
temperatures. [2] The growth at the grain boundary dominates causing too large of a
reduction in carrier concentration. Highly doped materials tend to have a smaller mobility
and a smaller mean free time. [10,11] The mean free time is the time it takes for successive
impacts of particles and a smaller mean free time means more scattering and less
mobility.
Taking a closer look at the low temperature regime in figure 35 can further elucidate
the scenario and create a clearer mental image. Figure 35 (a) gives a closer look at the
electrical resistivity and 36 (b) gives a closer looks at the Absolute Seebeck Coefficients,
both in the low temperature regime. It can be seen that there are three main groupings of
the Absolute Seebeck Coefficients in figure 35 (b). The first is the baseline which has an
expected low Seebeck coefficient. The second grouping contains all of the dopings, up to
but not including the over doped samples, ranging from 139-149 µV/K. As stated earlier
the increase in Seebeck coefficient is due to the introduction of bismuth to the grain
boundary to decrease carrier concentration. Each successive increase in doping also
increases the Seebeck coefficient within its respective grouping. The third grouping
containing bismuth 0.35 and 0.4 dopings has the highest Seebeck coefficient in the low
temperature regime which proves that even at these high concentrations the carrier
concentration is still decreasing due to the bismuth at the grain boundary. Along with the

Chapter 5: The Versatility of Bismuth through Non-stoichiometric Addition of Ca3Co4O9
99
decrease in concentration there is also a decrease in mobility therefore it is at these
concentrations where the negative effects of the over doping become evident. By
examining figure 35 (a) it can be seen that it is at these concentrations that the electrical
resistivities make a massive leap due to the decrease in mobility and in turn will decrease
its overall power factor to the point where its large Seebeck coefficient cannot
compensate for this reduction in electrical resistivity.
Figure 35 (a) Temperature dependence of electrical resistivity and (b) absolute seebeck coefficient of Ca3BiuCo4O9 bismuth non-stoichiometric addition.
A low electrical resistivity of 17 µΩm and a vastly enhanced Absolute Seebeck
coefficient of 148 µV/K at 315 K give rise to a high power factor of 1.3 mW/mK2 which is
over seven times that of the 0.17 mW/mK2 power factor from the undoped Ca3Co4O9,
both shown in figure 36. It also achieves a power factor of ~0.94 mW/mK2 at 983 K which
is three time larger than the 0.35 mW/mK2 power factor from the undoped Ca3Co4O9,
allowing it to have one of the highest power factors across this temperature range.

Chapter 5: The Versatility of Bismuth through Non-stoichiometric Addition of Ca3Co4O9
100
Figure 36 Temperature dependence of the power factor for Ca3BiuCo4O9 bismuth non-stoichiometric addition.
5.3.3 Significance of Phonon Scattering and a small Mean Free Path (MFP)
The thermal conductivity is a less controllable parameter than the electrical
properties, as stated earlier, due to the Wiedemann-Franz Law. This is reflected in the
seemingly inconsistent jumps in thermal conductivity as the dopings are increased. The
reason for this is the coupling of the electron thermal conductivity and the lattice or phonon
thermal conductivity. The phonon thermal conductivity can be decreased by interface
phonon scattering at the grain boundaries which results in a decrease in phonon mean
free path. [1,10,12] As mentioned bismuth allows the Ca3Co4O9 to have a shorter mean free
path. Also a smaller grain size means more grains and in turn more grain boundaries and
a stronger phonon scattering at the boundaries. This is yet another reason why bismuth
0.06
0.26
0.46
0.66
0.86
1.06
1.26
1.46
300 400 500 600 700 800 900 1000 1100
Po
wer
Fac
tor
mW
/mK
2
Temperature K
Ca3Co4O9 Ca3Bi0.01Co4O9 Ca3Bi0.05Co4O9 Ca3Bi0.1Co4O9 Ca3Bi0.2Co4O9
Ca3Bi0.25Co4O9 Ca3Bi0.3Co4O9 Ca3Bi0.35Co4O9 Ca3Bi0.4Co4O9
Chapter 5: The Versatility of Bismuth through Non-stoichiometric Addition of Ca3Co4O9
101
is a good candidate for thermoelectric materials. Bismuth allows for grain growth in order
to enhance the electrical properties but does not grow to where it will negatively affect the
thermal properties. Defects such as impurities, point defects, and dislocations all
contribute to scattering at the boundaries as well. [1,12,13,14] The power factor of bismuth
0.4 was poor due to the grain growth and decrease in mobility and its thermal properties
would most likely be poor as well due to a higher density considering the density increases
with increasing amounts of bismuth. For this concentration only the electrical properties
were tested.
The doping of bismuth 0.01 was not enough to trigger the grain growth or have any
kind of presence at the grain boundary. It also did not affect the sample’s density to a
large extent so no significant results came from its thermal conductivity, causing it to be
very similar to the conductivity of that of the baseline. The doping of bismuth 0.05 is where
its first drop in thermal conductivity can be seen in figure 37, with bismuth 0.35 surprisingly
having the lowest conductivity. A lower density allows for a higher rate of phonon
scattering at the grain boundary which is responsible for its low thermal conductivity.
Although it has such a low thermal conductivity, coupled with its poor power factor it would
most likely not have a high figure of merit.

Chapter 5: The Versatility of Bismuth through Non-stoichiometric Addition of Ca3Co4O9
102
Figure 37 Temperature dependence of thermal conductivity for Ca3BiuCo4O9 bismuth non-stoichiometric addition.
5.3.4 Figure of merit of bismuth non-stoichiometric addition doped Ca3Co4O9
The power factor of the Ca3BiuCo4O9 samples increases with each sample of
increased bismuth concentration. This is due to the simultaneous decrease in electrical
resistivity caused by its grain growth, texture improvement, and grain alignment along
with its increase in the Absolute Seebeck Coefficient caused by the grain boundary
segregation. This trend continues up to and includes bismuth 0.3 which has the highest
power factor of ~0.94 mWm-1K-2 at 973 K. This is more than 3 times as high as the
baseline which is ~0.29 mWm-1K-2 at 973 K. The two over doped samples of bismuth 0.35
and 0.4 have a lower power factor than the baseline which is due to the drastic increase
in their electrical resistivities as mentioned earlier.
1.7
1.8
1.9
2
2.1
2.2
2.3
2.4
300 400 500 600 700 800 900 1000 1100
Ther
mal
Co
nd
uct
ivit
y W
/mK
Temperature K
Ca3Co4O9 Ca3Bi0.01Co4O9 Ca3Bi0.05Co4O9 Ca3Bi0.1Co4O9
Ca3Bi0.2Co4O9 Ca3Bi0.25Co4O9 Ca3Bi0.3Co4O9 Ca3Bi0.35Co4O9

Chapter 5: The Versatility of Bismuth through Non-stoichiometric Addition of Ca3Co4O9
103
The figure of merits shown in figure 38 demonstrate that the bismuth 0.3 doped sample
at the low temperature regime, specifically at 373 K, starts at ~0.19 which is higher than
the high temperature regime of the baseline and bismuth 0.01 at 1073 K, which are 0.15
and 0.18 respectively. The bismuth 0.3 doped sample continues to increase with
increasing temperature until it reaches a value of 0.45 at 973 K and 1073 K. This is 3
times higher than the 0.15 value of the undoped sample at the same temperature.
Figure 38 Temperature dependence of figure of merit for Ca3BiuCo4O9 bismuth non-stoichiometric addition.
5.4 Effects of processing parameters on electrical & thermal properties
The concentration with the best figure of merit was analyzed to see if its
thermoelectric properties can be further enhanced. The pressing parameters of the
0
0.05
0.1
0.15
0.2
0.25
0.3
0.35
0.4
0.45
0.5
300 400 500 600 700 800 900 1000 1100
ZT
Temperature K
Ca3Co4O9 Ca3Bi0.01Co4O9 Ca3Bi0.05Co4O9 Ca3Bi0.1Co4O9
Ca3Bi0.2Co4O9 Ca3Bi0.25Co4O9 Ca3Bi0.3Co4O9 Ca3Bi0.35Co4O9

Chapter 5: The Versatility of Bismuth through Non-stoichiometric Addition of Ca3Co4O9
104
bismuth 0.3 sample were varied as the fabrication process was held constant. The two
main experimental groups for this exercise were comparing cold pressing to hot pressing
(hot pressing was used for the set previously discussed in this chapter). During the cold
pressing procedure, pellets were pressed at 298 K for 10 minutes. The hot pressing
procedure was held at a temperature of 423 K for 40 minutes. This allows the ability of a
denser pellet since the heat can cause the forming of a liquid phase enabling the grains
to better align themselves. As mentioned, a higher density will usually enhance the
electrical properties but the thermal properties almost always suffer since they are directly
related to the density.
Within each pressing group, another parameter was varied in order to optimize
their results. Under the cold pressing condition, pellets were pressed at 0.5 GPa, 0.75
GPa and 1 GPa and under the hot pressing condition, pellets were pressed at 0.75 GPa
and 1 GPa. Different pressures will once again impact the pellets’ density. Since the
electrical and thermal properties are so intimately intertwined, mainly through their
density’s, there is hope to find the perfect balance of enhanced electrical properties
without adversely affecting the thermal and vice versa. By varying these pressing
parameters the hope is that the electrical and thermal properties will indeed find that
balance where the greatest figure of merit can be achieved.
5.4.1 Electrical performance of Ca3Bi3Co4O9 varying ceramic processing parameters
Increased pressing pressure yields a denser material and enhances the electrical
resistivity. The only sample that does not follow suit with this trend is the sample hot
pressed at 0.75 GPa which can be seen in figure 39. It actually has a lower electrical
resistivity at high temperatures than the pellet that was cold pressed at 1 GPa. This is

Chapter 5: The Versatility of Bismuth through Non-stoichiometric Addition of Ca3Co4O9
105
due to the heat applied during the pressing process. The heat created a liquid phase of
the bismuth in order to allow for better grain alignment giving it a higher density which
lead to a lower electrical resistivity. The pellet hot pressed at 0.75 GPa has a density of
4.25 g/cm3 while the cold pressed pellet pressed at 1 GPa has a density of 3.95 g/cm3.
This shows that the temperature of the pressing process effects the pellets density much
greater than the pressure at which it is pressed.
Figure 39 Temperature dependence of electrical resistivity for Ca3Bi0.3Co4O9 bismuth non-stoichiometric addition with pressing parameter variation.
The pellet pressed at 423 K with a pressure of 0.75 GPa achieves an electrical
resistivity of ~17 µΩm at 315 K, same as the two pellets pressed at 1 GPa. They begin to
differ at high temperatures where the pellet pressed with 0.75 GPa at 423 K and 1 GPa
at 423 K both achieve an electrical resistivity of ~36 µΩm at 985 K. If suffices to say that

Chapter 5: The Versatility of Bismuth through Non-stoichiometric Addition of Ca3Co4O9
106
by lowering the pressing pressure from 1 GPa to 0.75 GPa and maintaining the hot
pressing parameters there was very little variation. This is evident in figure 40 where cross
sectional SEM images were taken from fractured pellets. This shows little or no change
in texture or alignment from the sample pressed at 1 GPa image (d) to the one pressed
at 0.75 GPa image (e).
Figure 40 SEM cross-sectional view of undoped Ca3Co4O9 and doped Ca3BiuCo4O9 with u=0.0, 0.1, 0.2, 0.3, 0.3 (0.75 GPa), and 0.35.
The Absolute Seebeck coefficient is very much an intrinsic value meaning there
were no changes to the Seebeck coefficient since the chemistries were not varied in any
way. Since the samples’ Seebeck coefficients do not change the power factor will solely
depend on the variances in the samples’ electrical resistivities. Therefore the three
highest power factors are found in the two samples that were pressed at 1GPa and the
one hot pressed with 0.75 GPa of pressure; all having a power factor ranging from 0.9-
0.93 mW/mK2 at 973 K which can be seen from figure 41.

Chapter 5: The Versatility of Bismuth through Non-stoichiometric Addition of Ca3Co4O9
107
Figure 41 Temperature dependence of power factor for Ca3Bi0.3Co4O9 bismuth non-stoichiometric addition with pressing parameter variation.
Pellets were pressed for these three samples in order to analyze their thermal
properties and compare their figure of merits. The figure or merit is already known for
bismuth 0.3 hot pressed with 1 GPa so that will be used as the reference for their thermal
conductivities. The sample hot pressed at 0.75 GPa is significantly lower than the two
pressed at 1 GPa shown in figure 42. This is due to the lower pressing pressure leading
to a lower density. The lower density creates porosity causing more phonon scattering
events at the boundaries thus reducing the thermal conductivity. This density correlation
is demonstrated again with the cold pressed sample having a lower thermal conductivity
than the sample with the higher density due to hot pressing. As mentioned, the sample

Chapter 5: The Versatility of Bismuth through Non-stoichiometric Addition of Ca3Co4O9
108
cold pressed at 1 GPa had a density of 3.95 g/cm3 and the sample hot pressed at 1 GPa
had a density of 4.2 g/cm3.
Figure 42 Temperature dependence of thermal conductivity for Ca3Bi0.3Co4O9 bismuth non-stoichiometric addition with pressing parameter variation.
The figure of merit of the sample with the lowest thermal conductivity was found
and compared with the set discussed earlier in this chapter. Even though its electrical
properties were comparative to that of hot pressed 1 GPa, the thermal conductivity of the
pellet hot pressed at 0.75 GPa is significantly lower causing it to have a higher ZT than
the previous sample with the best results. Its figure of merit crests 0.5 in the high
temperature regime with 0.52 at 973 K and 1073 K respectively. This 0.5 mark is a
milestone as mentioned earlier since it now allows Ca3Co4O9 to be competitive with
materials such as SiGe. These results are shown in figure 43.

Chapter 5: The Versatility of Bismuth through Non-stoichiometric Addition of Ca3Co4O9
109
Figure 43 Temperature dependence of figure of merit for Ca3Bi0.3Co4O9 bismuth non-stoichiometric addition with pressing parameter variation.
5.5 Summary of results for bismuth non-stoichiometric addition of Ca3Co4O9
By comparing the optimal Ca3Bi0.3Co4O9 bismuth non-stoichiometric addition
results to the optimal Ca2.8Bi0.2Co4O9 bismuth cation substitution results it is evident that
with this particular dopant, addition proves to be the preferred method. Bismuth deposits
at the grain interior thus improving the crystal texture and aiding in grain growth along
with segregating at the grain boundary. This is the first time the grain boundary
segregation has been observed and investigated. It was shown from the X-Ray Diffraction
of the samples’ powders that bismuth enters the lattice and increases the lattice
parameters upon using the non-stoichiometric addition method.
0
0.1
0.2
0.3
0.4
0.5
0.6
300 400 500 600 700 800 900 1000 1100
ZT
Temperature K
Ca3Co4O9 Ca3Bi0.01Co4O9 Ca3Bi0.05Co4O9
Ca3Bi0.1Co4O9 Ca3Bi0.2Co4O9 Ca3Bi0.25Co4O9
Ca3Bi0.3Co4O9 Ca3Bi0.3Co4O9 (0.75GPa) Ca3Bi0.35Co4O9

Chapter 5: The Versatility of Bismuth through Non-stoichiometric Addition of Ca3Co4O9
110
After varying pressing parameters bismuth’s optimization was found at the bismuth
0.3 concentration with the pressing parameters set to 0.75 GPa for 40 minutes at 423 K.
This particular sample achieves a power factor of ~0.90 mW/mK2 and ~0.81 mW/mK2 and
a thermal conductivity of 1.71 W/mK and 1.74 W/mK both at 973 and 1073 K respectively.
This allows for a high dimensionless figure of merit of 0.52 at 973 K and 1073 K
respectively, which are both higher than any reportings on any polycrystalline dopants. At
bismuth 0.35 the sample becomes over doped and its electrical properties suffer
significantly causing over a 60% decrease in its dimensionless figure of merit. Figure 44
shows a drawing to demonstrate where the bismuth deposits and how it effects the grain
alignment. The light red shows the presence of bismuth in the grains and the dark red line
indicates the bismuth enriched grain boundaries.
The motivation behind this set was to segregate at the grain boundary exclusively.
As this chapter has detailed this was not the case. Due to the ionic size of bismuth being
as close as it is to that of calcium, it was able to replace any calcium deficiencies thus
doping the lattice. This prompts the idea that in order to assure the dopant will segregate
at the grain boundary it is crucial to choose a dopant with a significantly large enough
ionic radius that under no circumstance will it have the ability to replace the calcium ions.
This sparked the motivation to use barium as a dopant in the next chapter considering
barium has an ionic radius of 149 pm compared with calcium’s ionic radius of 117 pm.

Chapter 5: The Versatility of Bismuth through Non-stoichiometric Addition of Ca3Co4O9
111
Figure 44 Microstructure drawing of undoped Ca3Co4O9 and Ca2.7Bi0.3Co4O9.

Chapter 5: The Versatility of Bismuth through Non-stoichiometric Addition of Ca3Co4O9
112
5.6 References
1 Marat Gunes, Macit Ozenbas. Effect of grain size and porosity on phonon scattering enhancement of Ca3Co4O9. Journal of Alloys and Compounds Vol.626, pp.360-367, 2015.
2 Boyle, Cullen; Calvillo, Paulo; Chen, Yun; Barbero, Ever J.; McIntyre, Dustin. Grain boundary segregation and thermoelectric performance enhancement of bismuth doped calcium cobaltite. Journal of the European Ceramic Society 36(3):601-607 Elsevier 2016 0955-2219
3 Masashi Mikami, Kanju Chong, Yuzuru Miyazaki, Tsuyoshi Kajitani, Takahiro Inoue, Satoshi Sodeoka, and Ryoji Funahashi. Bi-Substitution effects on crystal structure and thermoelectric properties of Ca3Co4O9 single crystals. Japanese Journal of Applied Physics. Vol.45, No.5A, pp.4131-4136, 2006.
4 K. Rubešová, T. Hlásek, V. Jakeš, Š. Huber, J. Hejtmánek, D. Sedmidubský. Effect of a powder compaction process on the thermoelectric properties of Bi2Sr2Co1.8Ox ceramics. Journal of the European Ceramic Society, Vol.35, pp.525-531, 2015.
5 Sajid Butt, Yaoyu Ren, Muhammad Umer Farooq, Bin Zhan, Rizwan ur Rahman Sagar, Yuanhua Lin, Ce-Web Nan. Enhanced thermoelectric performance of heavy-metals (M: Ba, Pb) doped misfit-layered ceramics: (Ca2-xMxCoO3)0.62 (CoO2). Energy Conversion and Management. Vol.83, pp.35-41, 2014.
6 Calvillo, Paulo. Chen, Yun. Boyle, Cullen. Barnes, Paul. N. Song, Xueyan. Thermoelectric performance enhancement of calcium cobaltite through barium grain boundary segregation. Inorganic Chemistry. American Chemical Society Publications. September 11, 2015.
7 Tao Wu, Trevor A. Tyson, Haiyan Chen, Jianming Bai, Hsin Wang and Cherno Jaye. A structural phase transition in Ca3Co4O9 Associated with enhanced high temperature thermoelectric properties. Cornell University Library. April 15, 2012.
8 T. Takeuchi, T. Kondo, K. Soda, U. Mizutani, R. Funahashi, M. Shikano, S. Tsuda, T. Yokoya, S. Shin, T. Muro. Electronic structure and large thermoelectric power in Ca3Co4O9. Journal of Electron Spectroscopy and Related Phenomena. Vol.137-140, pp.595-599, 2004.
9 T. Sun, H. H. Hng, Q. Y. Yan, and J. Ma. Enhanced high temperature thermoelectric properties of Bi-doped c-axis oriented Ca3Co4O9 thin films by pulsed laser deposition. Journal of Applied Physics. Vol.108, 2010.
10 Guangkun Ren, Jinle Lan, Chengcheng Zeng, Yaochun Liu, Bin Zhan, Sajid Butt, Yuan-Hua Lin, and Ce-Wen Nan. High performance oxides-based thermoelectric materials. Journal of Minerals, Metals & Materials Society. Vol.67, No.1, pp.211-221, 2015.
11 Ruoming Tian, Tianshu Zhang, Dewei Chu, Richard Donelson, Li Tao, Sean Li. Enhancement of high temperature thermoelectric performance in Bi, Fe co-doped layered oxide-based material Ca3Co4O9+δ. Journal of Alloys and Compounds. Vol.615, pp.311-315, 2014.

Chapter 5: The Versatility of Bismuth through Non-stoichiometric Addition of Ca3Co4O9
113
12 Susumu Fujii and Masato Yoshiya. Manipulating thermal conductivity by interfacial
modification of misfit-layered cobaltites Ca3Co4O9. Journal of Electronic Materials, Vol.45, No.3, pp.1217-1226, 2016
13 Lijun Wu, Qingping Meng, Christian Jooss, Jin-Cheng Zheng, H. Inada, Dong Su, Qiang Li, and Yimei Zhu. Origin of phonon glass-electron crystal behavior in thermoelectric layered cobaltite. Advanced Functional Materials. Vol.23, pp.5728-5736, 2013.
14 Chong Xiao, Jie Xu, Boxiao Cao, Kun Li, Mingguang Kong, and Yi Xie, Solid-solutioned homojunction nanoplates with disordered lattice: a promising approach toward “phonon glass electron crystal” thermoelectric materials. Journal of the American Chemical Society. Vol.134, pp.7971-7977, 2012.
15 Haoshan Hao, Limin zhao, and Xing Hu. Microstructure and thermoelectric properties of Bi- and Cu-substituted Ca3Co4O9 oxides. Journal of Materials Science Technology., Vol.25, No.1, pp.105-108, 2009.
16 G. Constantinescu, Sh. Rasekh, M. A. Torres, M. A. Madre, A. Sotelo, J. C. Diez. Improvement of thermoelectric properties in Ca3Co4O9 ceramics by Ba doping. Journal of Materials Science., Vol.26, pp.3466-3473, 2015.
17 Majid Abdellahi, Hamid Ghayour, Maryam Bahmanpour. Effect of process parameters and synthesis method on the performance of thermoelectric ceramics: A novel simulation. Ceramics International. Vol.41, pp.6991-6998, 2015.
18 Kasper A. Borup, Johannes de Boor, Heng Wang, Fivos Drymiotis, Franck Gascoin, Xun Shu, Lidong Chen, Mikhail I. Fedorov, Eckhard Müller, Bo B. Iverson, and G. Jeffrey Snyder. Measuring thermoelectric transport properties of materials. Energy & Environmental Science. Vol.8, pp.423-435, 2015.
19 Haoshan Hao, Qinglin He, Changqing Chen, Hongwei Sun, and Xing Hu. Textured structure and anisotropic thermoelectric properties of Ca2.7Bi0.3Co4O9 oxide prepared by conventional solid-state reaction. International Journal of Modern Physics B, Vol.23, No.1, pp.87-95, 2009.
20 M. Sabarinathan, M. Omprakash, S. Harish, M. Navaneethan, J. Archana, S. Ponnusamy, H. Ikeda, T. Takeuchi, C. Muthamizhchelvan, Y. Hayakawa. Enhancement of power factor by energy filtering effect in hierarchical BiSbTe3 nanostructures for thermoelectric applications. Applied Surface Science. Vol418, pp.246-251, 2017.
21 Zhi-Lei Wang, Takahiro Akao, Tetsuhiko Onda, Zhong-Chun Chen. Microstructure and thermoelectric properties of Bi-Sb-Te bulk materials fabricated from rapidly solidified powders. Scripta Materialia. Vol.136, pp.111-114, 2017.
22 Kenji Tanabe, Ryuji Okazaki, Hiroki Taniguchi, and Ichiro Terasaki. Optical conductivity of layered calcium cobaltate Ca3Co4O9. Journal of Physics: Condensed Matter. Vol.28, 2016.
23 Zunyi Tian, Xiaohong Wang, Jun Liu, Zhongjin Lin, Yangsen Hu, Yigui Wu, Chao Han, Zhiyu Hu. Power factor enhancement induced by Bi and Mn co-substitution in NaxCoO2 thermoelectric materials. Journal of Alloys and Compounds. Vol.661, pp.161=167, 2016.
Chapter 5: The Versatility of Bismuth through Non-stoichiometric Addition of Ca3Co4O9
114
24 Siwen Li, Ryoji Funahashi, Ichiro Matsubara, Kazuo Ueno, Satoshi Sodeoka, and
Hiroyuki Yamada. Synthesis and Thermoelectric Properties of the New Oxide Materials Ca3-xBixCo4O9+δ (0.0<x<0.75). American Chemical Society. Chemistry of Materials. Vol.12, pp.2424-2427, 2000.
25 Ankam Bhaskar, Z.-R. Lin, Chia-Jyi Liu. Thermoelectric properties of Ca2.95Bi0.05Co4-
xFexO9+δ (0<x<0.15). Energy Conversion and Management Vol.76, pp. 63-67, 2013.

Chapter 6: Non-stoichiometric Addition of Barium to Enhance Seebeck Coefficient of Ca3Co4O9
115
Chapter 6:
Non-stoichiometric Addition of Barium to
Enhance Electrical Power Factor of Ca3Co4O9
6.1 Background and motivation for Barium as a dopant in Ca3Co4O9
Barium was identified in 1774 but it wasn’t until 1808 that English chemist Sir
Humphry Davy was able to isolate it through electrolysis. [1] Like most elements barium
was named after a Greek word and due to its high mass it was named after the word
barys, meaning heavy. [1] Barium is considered one of the alkaline-earth metals and is
soft and metallic. [2] It reacts with the oxygen in air, forming barium oxide, BaO, which is
why it is never found free in nature. [1] Barium has also been reported on in the past by
Zhang et al. and Lu et al. stating that barium has improved the thermoelectric properties
by decreasing their electrical resistivities and thermal conductivities. [3] Barium is also
known to have a very low electrical resistivity. Zhang et al. reported a ZT of 0.2 at 973 K
for Ca3Co4O9 doped with barium using the cation substitution method. [4] Using the cation
substitution as well, Constantinescu et al. reported a power factor of 0.29 mW/mK2 for
barium doped Ca3Co4O9. [5] All reports on barium to date utilize the cation substitution
method. This chapter details the investigation of doping Ca3Co4O9 with barium by means
of the non-stoichiometric addition method in order to segregate the grain boundary
knowing that barium’s 149 ρm ionic radius will not allow it to deposit itself in place of the
114 ρm calcium ions should there be any vacancies.
Chapter 6: Non-stoichiometric Addition of Barium to Enhance Seebeck Coefficient of Ca3Co4O9
116
6.2 Experimental Procedure
Ca3BauCo4O9 powders where u=0.0, 0.03, 0.05, and 0.07 were obtained through a
sol-gel route in which non-stoichiometric ratios of Ca(NO3)2•4H2O, Co(NO3)2•6H2O and
Ba(NO3)2 were mixed in deionized water. Ethylene glycol and polyethylene glycol were
used to aid polymerization of the solution and vary grain size. [6] Lastly, nitric acid was
added to induce nitrate salts decomposition and facilitate new compound formation. [7]
The liquid solution was then submerged in a silicone oil bath on a hot plate and
mechanically stirred at 353 K for 3 hours to achieve the sol-gel state. The sol-gel was
then distributed to ceramic crucibles loosely covered with aluminum foil and put into a box
furnace heated to 773 K with a ramp rate of 10 K per minute and held for 2 hours before
being cooled at a rate of 10 K per minute. Holding the temperature here, at 773 K, for the
allotted time will ensure that any inorganic material is removed from the material. The
ashes were then suspended in ethanol and ball milled for 20 minutes alternating between
1 minute of milling and 1 minute of resting in order to aid in the dissipation of heat. The
powders were deposited in a tubular furnace where they were calcined in an oxygen rich
induced environment with a ramp rate of 10 K per minute and held at 973 K for 4 hours,
to achieve the Ca3Co4O9 crystal lattice. The powders were then cooled down to room
temperature at a rate of 10 K per minute.
Two pellets were pressed, one to test its electrical properties and the other for its
thermal properties. The calcined powders were pressed uniaxially with 1 GPa of force
and held for 10 minutes at 298 K. The pellets’ densities were obtained before they were
put in to a tubular furnace to be sintered. The sintering process removes any extra
moisture the pellet may contain and assures proper grain alignment. Pellets were sintered

Chapter 6: Non-stoichiometric Addition of Barium to Enhance Seebeck Coefficient of Ca3Co4O9
117
in an oxygen rich induced environment with a ramp rate of 10 K per minute and held at
1233 K for 9 hours. It was then cooled back to room temperature at a rate of 4 K per
minute and once again the densities were taken. Pellets were cut into a 2 mm x 3.5 mm
x 9 mm rectangular shapes and inserted into a Linseis LSR 3-Seebeck machine,
subjected to a low pressure helium, He, environment where the pellet’s electrical
resistivity and Absolute Seebeck Coefficient were simultaneously determined by means
of a dc four-probe method. Since helium is an inert gas it will not react or interfere with
the measurement. A second pellet was cut along a different axis and inserted into the
Linseis LFA 1000 machine to test its thermal conductivity. The pellet was cut to be 2 mm
thick and polished to a diameter of 11-13 mm. Any less than 11 mm and there would be
room for heat to escape the holder, any more than 13 mm and the pellet would be too
large for the holder. The thermal conductivity is calculated by the equation
K=λCpρm (13)
Where λ is the thermal diffusity in meters squared per seconds (m2/s), Cp is the specific
heat capacity in joules per kilogram kelvin (J/kg•K), and ρm is the mass density in grams
per centimeter cubed (g/cm3). As stated in the first section, these are the three values
needed in order to obtain the materials’ ZT value. For barium addition, four different
chemistries were used. The first chemistry is the baseline of Ca3Co4O9 and the other
three are dopings of barium 0.03, 0.05, and 0.07.

Chapter 6: Non-stoichiometric Addition of Barium to Enhance Seebeck Coefficient of Ca3Co4O9
118
6.3 Effect of barium’s grain boundary segregation on the power factor
6.3.1 Increased electrical properties of Ca3Co4O9 through Ba addition
Low doping levels of barium demonstrate a higher electrical resistivity than the
undoped sample shown in figure 45. However, unlike the bismuth samples, the barium
samples show a trend that maintains a low electrical resistivity through all temperature
ranges. This causes the sample with the low doping of Ba 0.03 to achieve a lower
electrical resistivity than the undoped sample at mid and high temperature ranges. This
is due to barium being an alkaline-earth metal which acts more like a semi-conductor than
a metal. [8] The Ca3Co4O9 material demonstrates an immediate drop in electrical resistivity
at low temperatures with higher levels of barium doping. The sample Ca3Ba0.5Co4O9
demonstrates a room temperature resistivity of ~35 µΩm which is less than half that of
the baseline sample. As the baseline increases to almost 90 µΩm at 1081 K the sample
with optimal barium doping only increases to around 45 µΩm which once again is 50% of
the baseline.

Chapter 6: Non-stoichiometric Addition of Barium to Enhance Seebeck Coefficient of Ca3Co4O9
119
Figure 45 Temperature dependence of electrical resistivity for Ca3BauCo4O9 barium non-stoichiometric addition
Another benefit of using barium as a dopant is its ability to achieve a high Seebeck
coefficient in the low to mid temperature range shown in figure 46. It was mentioned in
the previous chapter that bismuth causes an increase in the Absolute Seebeck coefficient
at room temperature to a saturation level around 150 µV/K. Barium betters this by having
a room temperature Absolute Seebeck coefficient just shy of 170 µV/K, in all doping
levels, which is one of the highest reported for this material. [9] This “dramatic increase”
as it was referred to by Calvillo et al. has been attributed to the barium segregating at the
Ca3Co4O9 grain boundaries. [10] The barium deposited at the grain boundary acts as a
filter for the carrier concentration causing the enhancement in the absolute Seebeck
coefficient at room temperature.
30
40
50
60
70
80
90
100
300 400 500 600 700 800 900 1000 1100
Elec
tric
al R
esis
tivi
ty µ
Ωm
Temperature K
Ca3Co4O9 Ca3Ba0.03Co4O9 Ca3Ba0.05Co4O9 Ca3Ba0.07Co4O9

Chapter 6: Non-stoichiometric Addition of Barium to Enhance Seebeck Coefficient of Ca3Co4O9
120
Figure 46 Temperature dependence of absolute seebeck coefficient for Ca3BauCo4O9 barium non-stoichiometric addition.
The low electrical resistivity of ~35 µΩm coupled with the high Absolute Seebeck
coefficient of 167 µV/K, both at 315 K, combine to achieve a high power factor of 0.82
mW/mK2 at 315 K demonstrated in figure 47. These two parameters play a very similar
role through all temperature ranges. The Absolute Seebeck coefficient slowly increases
with temperature as the electrical resistivity slowly increases as well to obtain its highest
power factor of 0.85 mW/mK2 at 810 K. Both are achieved with the same concentration
of barium 0.05 and are over two times greater than the power factor of the baseline at the
respective temperatures.
130
140
150
160
170
180
190
200
300 400 500 600 700 800 900 1000 1100
Ab
solu
te S
eeb
eck
Co
effi
cien
t µV
/K
Temperature K
Ca3Co4O9 Ca3Ba0.03Co4O9 Ca3Ba0.05Co4O9 Ca3Ba0.07Co4O9

Chapter 6: Non-stoichiometric Addition of Barium to Enhance Seebeck Coefficient of Ca3Co4O9
121
Figure 47 Temperature dependence of power factor for Ca3BauCo4O9 barium non-stoichiometric addition.
6.3.2 Microstructure and nanostructure of Barium doped Ca3Co4O9
Figure 48 shows the cross-sectional SEM view for surface fractured pellets. As the
barium doping concentration increases from image (a) to (c) the grain alignment vastly
improves. Image (d) demonstrates the misalignment of grains in the over doped sample.
This shows that just like bismuth, barium has the ability to improve crystal texture through
grain alignment as well. The SEM image of the optimal concentration of Ca3Ba0.5Co4O9
illustrated in image (c) of figure 48 clearly demonstrates the vastly improved grain
alignment from the pure Ca3Co4O9 illustrated in image (a). However, unlike bismuth,
barium does not trigger near as much grain growth allowing the grains to compact more
easily giving it a much higher density than previous chemistry sets. The optimum bismuth
0.3
0.4
0.5
0.6
0.7
0.8
0.9
300 400 500 600 700 800 900 1000 1100
Po
wer
Fac
tor
mW
/mK
2
Temperature K
Ca3Co4O9 Ca3Ba0.03Co4O9 Ca3Ba0.05Co4O9 Ca3Ba0.07Co4O9

Chapter 6: Non-stoichiometric Addition of Barium to Enhance Seebeck Coefficient of Ca3Co4O9
122
cation substitution density was 3.95 g/cm3, the bismuth non-stoichiometric addition
density was 4.20 g/cm3 whereas the density of the optimal barium concentration is 4.51
g/cm3.
Figure 48 SEM cross-sectional view of undoped Ca3Co4O9 and doped Ca3BauCo4O9 with u=0.0, 0.01, 0.05, and 0.1. [10]
The samples were investigated by use of a transmission electron microscope TEM
as can be seen in figure 49. Image (a) shows two grains A and B where 12 different EDS
data points were taken. For this image a low magnification TEM image was taken. Table
2 details the atom percentage at each location demonstrating proof that barium is not
found at locations 1-4 and 9-12 which were all taken from inside the grain itself. In fact,
barium only deposits within the grain boundary which reinforces its ability to segregate at

Chapter 6: Non-stoichiometric Addition of Barium to Enhance Seebeck Coefficient of Ca3Co4O9
123
the boundary. Image (b) is a high resolution TEM image showing that there was no
secondary phase that had formed at the grain boundary. Images (c) and (e) show the
electron diffraction collected from grain A and B respectively while image (d) shows the
electron diffraction collected at the grain boundary between grains A and B.
Figure 49 Diffraction contrast images and the selected area diffraction patterns from the Ca3Ba0.05Co4O9 sample. [10]
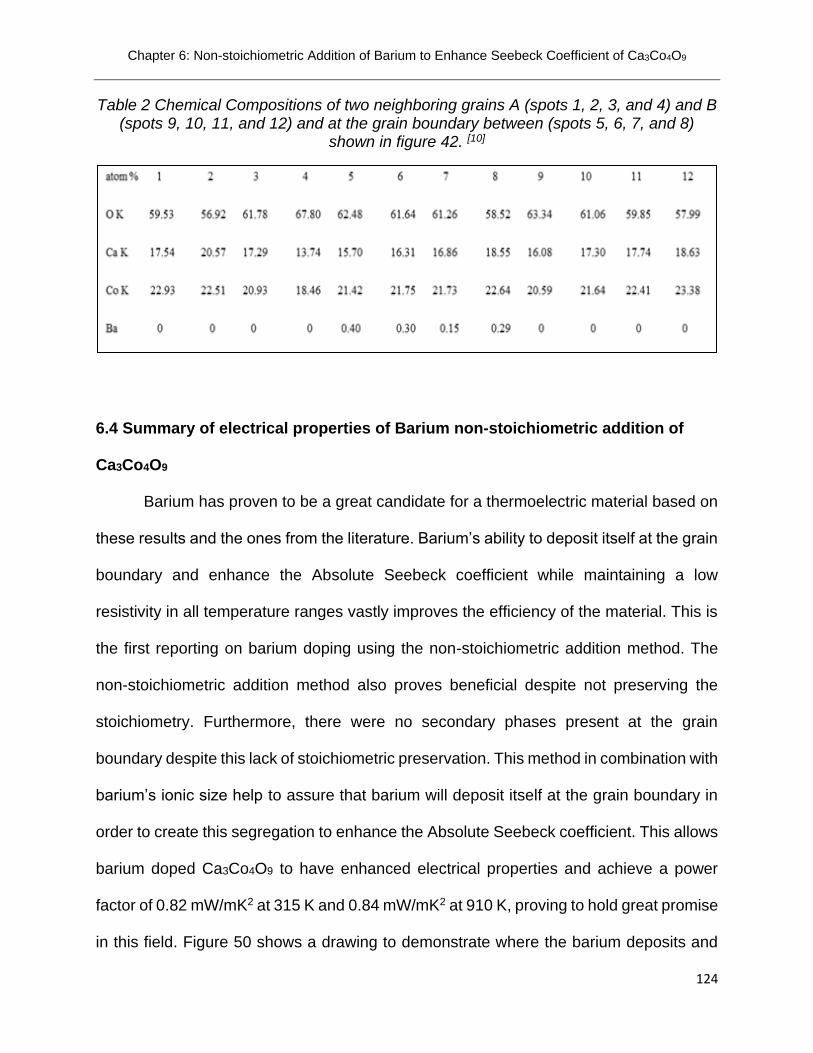
Chapter 6: Non-stoichiometric Addition of Barium to Enhance Seebeck Coefficient of Ca3Co4O9
124
Table 2 Chemical Compositions of two neighboring grains A (spots 1, 2, 3, and 4) and B (spots 9, 10, 11, and 12) and at the grain boundary between (spots 5, 6, 7, and 8)
shown in figure 42. [10]
6.4 Summary of electrical properties of Barium non-stoichiometric addition of
Ca3Co4O9
Barium has proven to be a great candidate for a thermoelectric material based on
these results and the ones from the literature. Barium’s ability to deposit itself at the grain
boundary and enhance the Absolute Seebeck coefficient while maintaining a low
resistivity in all temperature ranges vastly improves the efficiency of the material. This is
the first reporting on barium doping using the non-stoichiometric addition method. The
non-stoichiometric addition method also proves beneficial despite not preserving the
stoichiometry. Furthermore, there were no secondary phases present at the grain
boundary despite this lack of stoichiometric preservation. This method in combination with
barium’s ionic size help to assure that barium will deposit itself at the grain boundary in
order to create this segregation to enhance the Absolute Seebeck coefficient. This allows
barium doped Ca3Co4O9 to have enhanced electrical properties and achieve a power
factor of 0.82 mW/mK2 at 315 K and 0.84 mW/mK2 at 910 K, proving to hold great promise
in this field. Figure 50 shows a drawing to demonstrate where the barium deposits and
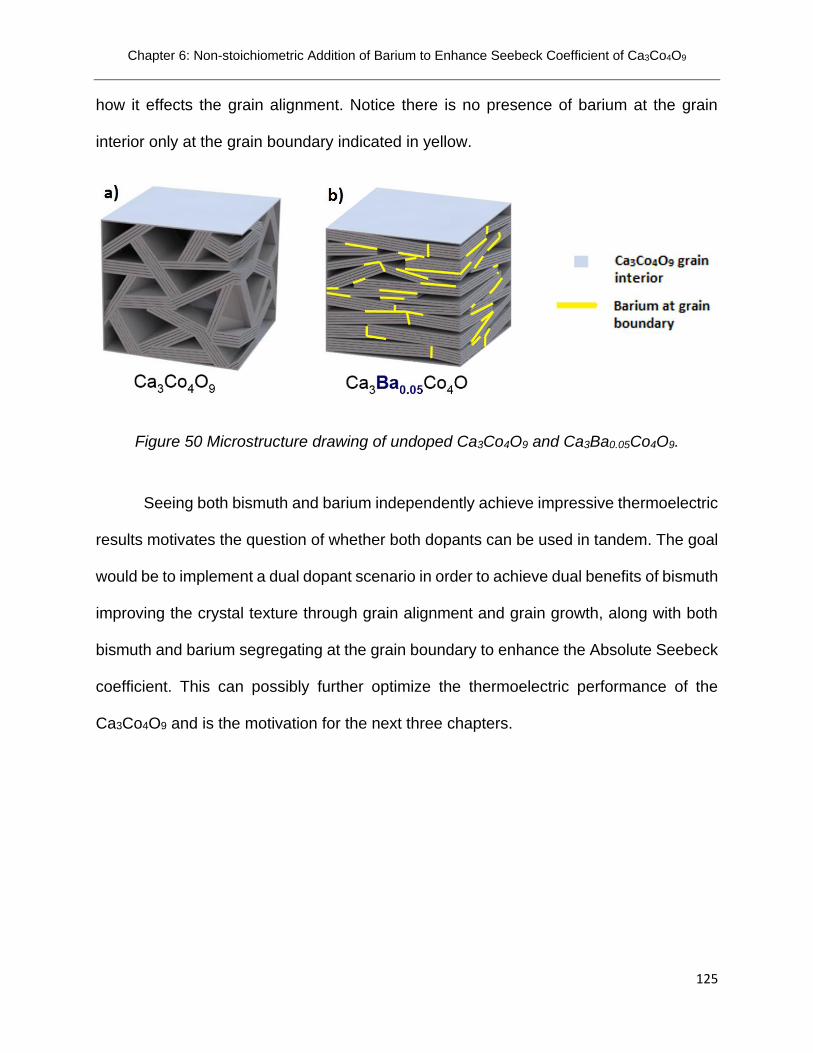
Chapter 6: Non-stoichiometric Addition of Barium to Enhance Seebeck Coefficient of Ca3Co4O9
125
how it effects the grain alignment. Notice there is no presence of barium at the grain
interior only at the grain boundary indicated in yellow.
Figure 50 Microstructure drawing of undoped Ca3Co4O9 and Ca3Ba0.05Co4O9.
Seeing both bismuth and barium independently achieve impressive thermoelectric
results motivates the question of whether both dopants can be used in tandem. The goal
would be to implement a dual dopant scenario in order to achieve dual benefits of bismuth
improving the crystal texture through grain alignment and grain growth, along with both
bismuth and barium segregating at the grain boundary to enhance the Absolute Seebeck
coefficient. This can possibly further optimize the thermoelectric performance of the
Ca3Co4O9 and is the motivation for the next three chapters.

Chapter 6: Non-stoichiometric Addition of Barium to Enhance Seebeck Coefficient of Ca3Co4O9
126
6.5 References
1 Gagnon, Steve. It’s Elemental: The Periodic Table of Elements. The Element Barium. Jefferson Lab. 2017
2 Winter, Mark. The University of Sheffield and WebElements Ltd, UK. 2017.
3 Sajid Butt, Yaoyu Ren, Muhammad Umer Farooq, Bin Zhan, Rizwan Ur Rahman Sagar, Yuanhua Lin, Ce-Wen Nan. Enhanced thermoelectric performance of heavy-metals (M: Ba, Pb) doped misfit-layered ceramics: (Ca2-xMxCoO3)0.62 (CoO2). Energy Conversion and Management Vol.83, pp.35-41, 2014.
4 Zhang Feipeng, Lu Qingmei, Li Tingzian, Zhang Xin, Zhang Jiuxing, Song Xiaoyan. Preparation and thermoelectric transport properties of Ba-, La- and Ag-doped Ca3Co4O9 oxide materials. Journal of Rare Earths, Vol.3 No.8, pp.778-783, 2013.
5 G. Constantinescu, Sh. Rasekh, M. A. Torres, M. A. Madre, A. Sotelo, J. C. Diez. Improvement of thermoelectric properties in Ca3Co4O9 ceramics by Ba doping. Journal of Materials Science: Materials Electron. Vol.26, pp. 3466-3473, 2015.
6 Marat Gunes, Macit Ozenbas. Effect of grain size and porosity on phonon scattering enhancement of Ca3Co4O9. Journal of Alloys and Compounds Vol.626, pp.360-367, 2015.
7 Boyle, Cullen; Calvillo, Paulo; Chen, Yun; Barbero, Ever J.; McIntyre, Dustin. Grain boundary segregation and thermoelectric performance enhancement of bismuth doped calcium cobaltite. Journal of the European Ceramic Society 36(3):601-607 Elsevier 2016 0955-2219
8 J. J. Shen, X. X. Liu, T. J. Zhu, X. B. Zhao. Improved thermoelectric properties of La-doped Bi2Sr2Co2O9- layered misfit oxides. Journal of Materials Science. Vol.44, pp.1889-1893, 2009.
9 K. Rubešová, T. Hlásek, V. Jakeš, Š. Huber, J. Hejtmánek, D. Sedmidubský. Effect of a powder compaction process on the thermoelectric properties of Bi2Sr2Co1.8Ox ceramics. Journal of the European Ceramic Society, Vol.35, pp.525-531, 2015.
10 Calvillo, Paulo. Chen, Yun. Boyle, Cullen. Barnes, Paul. N. Song, Xueyan. Thermoelectric performance enhancement of calcium cobaltite through barium grain boundary segregation. Inorganic Chemistry. American Chemical Society Publications. September 11, 2015.
Chapter 7: Non-Stoichiometric Dual Doping of Bismuth and Barium
127
Chapter 7:
Non-Stoichiometric dual doping of Bismuth and Barium
7.1 Motivation of introducing dual dopants using non-stoichiometric addition
This has been the first approach of dual doping to tune the lattice of the Ca3Co4O9
and the grain boundary simultaneously. It is also the first approach of dual doping using
the non-stoichiometric addition approach. After studying the effects of the non-
stoichiometric addition of barium it was found that the dopant deposits itself at the grain
boundary enhancing the Absolute Seebeck Coefficient. That coupled with the fact that
bismuth deposits itself into the lattice to effect the grain growth and at the grain boundary
to enhance the Absolute Seebeck coefficient allows for the possible simultaneous
enhancement of both the electrical resistivity and the Absolute Seebeck Coefficient
beyond what the other chemistries were capable of individually.
The next three chapters discuss the dual doping of two elements into the Ca3Co4O9
baseline. Two methods were investigated in order to compare the effects of cation
substitution versus non-stoichiometric addition. The two chemicals being used to dope
the Ca3Co4O9 were bismuth and barium. The non-stoichiometric addition of barium as a
doping agent was studied and analyzed in order to determine its efficiency. Barium was
found to enhance the Absolute Seebeck coefficient greatly at room temperature along
with maintaining a low electrical resistivity throughout all temperature ranges due to its
semi-conductive nature. Its Absolute Seebeck coefficient at low temperatures exceeded

Chapter 7: Non-Stoichiometric Dual Doping of Bismuth and Barium
128
that of Bismuth’s with Bismuth yielding a lower electrical resistivity. From this the two
dopings were used to analyze the efficiency of the bismuth and barium working in tandem.
This coupling allows the Bismuth to be utilized at the grain to trigger its growth and
alignment in order to obtain a low electrical resistivity while benefiting from having both
the bismuth and barium deposit themselves at the grain boundary in order to increase the
Absolute Seebeck coefficient. Although barium has a higher Absolute Seebeck coefficient
than bismuth at room temperature, bismuth’s Absolute Seebeck coefficient rises more
sharply causing them to be comparable at high temperatures. Barium’s semi-conductive
nature was also utilized to help maintain bismuth’s already low resistivity at room
temperature.
Chapter seven explores the dual doping of bismuth non-stoichiometric addition and
barium non-stoichiometric addition in tandem. Individually both were the optimal methods
for their respective sets. This set was not only compared with the Ca3Co4O9 baseline but
also to the non-stoichiometric addition method of bismuth doped alone. This was the
compare their dual nature directly to a set with similar chemistry. The addition of bismuth
0.3 was the optimal concentration; however, since the sample contains no vacancies it
has the potential to be over doped much quicker, so bismuth 0.2 was used as the starting
concentration.
7.2 Experimental Procedure
Ca3BiuBawCo4O9 powders, where u=0.0 & 0.2 and w=0.02, 0.05, 0.07 were obtained
through a sol-gel route in which non-stoichiometric ratios of Ca(NO3)2•4H2O,
Co(NO3)2•6H2O, Bi(NO3)2•5H2O and Ba(NO3)2 were mixed in deionized water. Ethylene

Chapter 7: Non-Stoichiometric Dual Doping of Bismuth and Barium
129
glycol and polyethylene glycol were used to aid polymerization of the solution and to aid
in particle size. [1] Lastly, nitric acid was added to induce nitrate salts decomposition and
facilitate new compound formation. [2]
The liquid solution was then submerged in a silicone oil bath on a hot plate and
mechanically stirred at 353 K for 3 hours to achieve the sol-gel state. The sol-gel was
then distributed to ceramic crucibles loosely covered with aluminum foil and put into a box
furnace with a ramp rate of 10 K per minute and held at 773 K for 2 hours then cooled at
10 K per minute. Holding the temperature here, at 773 K, for the allotted time will ensure
that any inorganic material is removed from the material. The ashes were then suspended
in ethanol and ball milled for 20 minutes alternating between 1 minute of milling and 1
minute of resting, in order to aid in the dissipation of heat. The powders were deposited
in a tubular furnace where they were calcined in an oxygen rich induced environment with
a ramp rate of 10 K per minute and held at 973 K for 4 hours, to achieve the Ca3Co4O9
crystal lattice. The powders were then cooled down to room temperature at a rate of 10
K per minute.
Two pellets were pressed, one to test its electrical properties and the other for its
thermal properties. The calcined powders were pressed uniaxially with 1 GPa of force
and held for 10 minutes at 298 K. The pellets’ densities were obtained before they were
put in to a tubular furnace to be sintered. The sintering process removes any extra
moisture the pellet may contain and assures proper grain alignment. Pellets were sintered
in an oxygen rich induced environment with a ramp rate of 10 K per minute and held at
1233 K for 9 hours then cooled at a rate of 4 K per minute and once again the densities
were taken. Pellets were cut into a 2 mm x 3.5 mm x 9 mm rectangular shapes and

Chapter 7: Non-Stoichiometric Dual Doping of Bismuth and Barium
130
inserted into a Linseis LSR 3-Seebeck machine, subjected to a low pressure helium, He,
environment where the pellet’s electrical resistivity and Absolute Seebeck Coefficient
were simultaneously determined by means of a dc four-probe method. Since helium is an
inert gas it will not react or interfere with the measurement. A second pellet was cut along
a different axis and inserted into the Linseis LFA 1000 machine to test its thermal
conductivity. The pellet was cut to be 2 mm thick and polished to a diameter of 11-13 mm.
Any less than 11 mm and there would be room for heat to escape the holder, any more
than 13 mm and the pellet would be too large for the holder.. The thermal conductivity is
calculated by the equation
K=λCpρm (13)
Where λ is the thermal diffusity in meters squared per seconds (m2/s), Cp is the specific
heat capacity in joules per kilogram kelvin (J/kg•K), and ρm is the mass density in grams
per centimeter cubed (g/cm3). As stated in the first section, these are the three values
needed in order to obtain the materials’ ZT value. Bismuth non-stoichiometric addition
has been reported on and a concentration of 0.2 was used and held constant throughout
the varied barium dopings. A non-stoichiometric addition method was used for varying
the doping concentrations of barium. Their chemistries are as follows: Ca3BiuBawCo4O9
where u = 0.0, 0.2 and w = 0.0, 0.002, 0.02, 0.05, and 0.07.
7.3 Finding a balance between carrier mobility & concentration through tuning
dopant concentration
Figure 51 shows that at low temperatures the electrical resistivities of the bismuth
barium dual doped samples were higher than that of bismuth 0.2 non-stoichiometric

Chapter 7: Non-Stoichiometric Dual Doping of Bismuth and Barium
131
sample alone. As the temperature increased this gap closed drastically with the
Ca3Bi0.2Ba0.02Co4O9 dual doped chemistry coming in just less than 10 µΩm higher than
the Ca3Bi0.2Co4O9 nonstoichiometric chemistry at 1080 K. This is largely due to the semi-
conductor characteristics that barium contributes to this chemistry. [3] As bismuth acts like
a metal and its electrical resistivity increases over temperature, the barium concentration
in the dual doped sample contributes to act more like a semi-conductor decreasing the
electrical resistivity with increasing temperature, allowing the gap to close. [3,4] The
Ca3Bi0.2Co4O9 non-stoichiometric chemistry shown in figure 51 is ~5 µΩm lower than its
Ca2.8Bi0.2Co4O9 cation substitution counterpart from chapter 4 across the whole
temperature spectrum. However, the electrical resistivities of the dual doped samples
were over 5 times larger than the Ca3Bi0.2Co4O9 non-stoichiometric chemistry.

Chapter 7: Non-Stoichiometric Dual Doping of Bismuth and Barium
132
Figure 51 Temperature dependence of electrical resistivity for Ca3BiuBawCo4O9 bismuth & barium non-stoichiometric addition where u=0.0, 0.02, 0.05, and 0.07.
Such an increase in electrical resistivity has to do with the over saturation of
dopants in the sample. The addition of both dopants simultaneously proved to over dope
the sample at low concentrations considering both dopants are predominantly depositing
themselves at the grain boundary. This most likely created a situation indicative of an
over doping at a much lower concentration than expected. Due to the reduction in
electrical resistivity there is either a drastic deficiency in carrier mobility, carrier
concentration or both. [5,6,7,8,9,10] Another probability is the formation of a secondary phase
at the grain boundary.
15
25
35
45
55
65
75
85
95
105
115
300 400 500 600 700 800 900 1000 1100
Elec
tric
al R
esis
tivi
ty µ
Ωm
Temperature K
Ca3Co4O9 Ca3Bi0.2Co4O9 Ca3Bi0.2Ba 0.005Co4O9
Ca3Bi0.2Ba 0.02Co4O9 Ca3Bi0.2Ba 0.05Co4O9 Ca3Bi0.2Ba 0.07Co4O9

Chapter 7: Non-Stoichiometric Dual Doping of Bismuth and Barium
133
Having both bismuth and barium deposit themselves at the grain boundary
simultaneously has proven to enhance the Absolute Seebeck coefficient beyond the
capabilities of bismuth non-stoichiometric addition alone as is evident from figure 52.
Barium’s semi-conductor characteristics allow the electrical resistivity to maintain a low
value all the way up to the high temperatures but the Absolute Seebeck coefficient now
suffers in this same temperature range. This decrease reiterates an increase in carrier
concentration at the grain boundary causing the reduced Absolute Seebeck Coefficient.
[5,6,11,14,12]
Figure 52 Temperature dependence of absolute seebeck coefficient for Ca3BiuBawCo4O9 bismuth & barium non-stoichiometric addition where u=0.0, 0.02, 0.05,
and 0.07.
120
130
140
150
160
170
180
190
200
300 400 500 600 700 800 900 1000 1100
Ab
solu
te S
eeb
eck
coef
fici
ent
µV
/K
Temperature K
Ca3Co4O9 Ca3Bi0.2Co4O9 Ca3Bi0.2Ba 0.005Co4O9
Ca3Bi0.2Ba 0.02Co4O9 Ca3Bi0.2Ba 0.05Co4O9 Ca3Bi0.2Ba 0.07Co4O9

Chapter 7: Non-Stoichiometric Dual Doping of Bismuth and Barium
134
For the electrical resistivity to decrease at high temperatures the way it
demonstrates here, there must have been an exceptional carrier mobility increase in order
to offset the carrier concentration decrease. [5,6,7, 10] Having both the bismuth and barium
deposit themselves at the grain boundary proved to decrease the carrier concentration.
[5,6,12] This is normally responsible for increasing the Absolute Seebeck coefficient but was
inferior compared to the drastic decrease in mobility causing a slower increase in the
Absolute Seebeck coefficient. This shows that one of the dopants were forced into the
lattice. In this case any competition at the grain boundary leads to barium depositing at
the boundary, due to its ionic size and inability to insert itself into the lattice. This leaving
bismuth to go to the grain interior over doping the lattice which is demonstrated through
their Absolute Seebeck coefficients in figure 52. [12,13,14]
High electrical resistivity could not offset the enhanced Absolute Seebeck
coefficient which then eventually lead to a power factor that was lower in the dual dopant
chemistries in comparison with the non-stoichiometric addition of bismuth. This can be
seen in figure 53 where the dual doped samples are only around 25% of the bismuth
doped sample at low temperatures.

Chapter 7: Non-Stoichiometric Dual Doping of Bismuth and Barium
135
Figure 53 Temperature dependence of power factor for Ca3BiuBawCo4O9 bismuth & barium non-stoichiometric addition where u=0.0, 0.02, 0.05, and 0.07.
7.4 Summary of results for doping Ca3Co4O9 using dual dopants Bismuth &
Barium through non-stoichiometric addition
The dual doping of bismuth and barium through non-stoichiometric addition to the
Ca3Co4O9 oxide was successful in enhancing the room temperature Absolute Seebeck
Coefficient to ~160 µV/K. However, due to over doping, the electrical resistivity suffered
and yielded a much greater value across all temperatures than it did for the optimal
samples of both the bismuth and barium non-stoichiometric addition methods individually.
As seen in figure 53 the Ca3Bi0.2Co4O9 sample had a power factor of 1.23 mW/mK2 at
315 K which is about 4 times greater than the 0.33 mW/mK2 power factor that the optimal
0.2
0.4
0.6
0.8
1
1.2
1.4
300 400 500 600 700 800 900 1000 1100
Po
wer
Fac
tor
mW
/mK
2
Temperature K
Ca3Co4O9 Ca3Bi0.2Co4O9 Ca3Bi0.2Ba 0.005Co4O9
Ca3Bi0.2Ba 0.02Co4O9 Ca3Bi0.2Ba 0.05Co4O9 Ca3Bi0.2Ba 0.07Co4O9

Chapter 7: Non-Stoichiometric Dual Doping of Bismuth and Barium
136
dual doped sample achieved at the same temperature. At 982 K the Ca3Bi0.2Co4O9
sample achieves a power factor of 0.89 mW/mK2 which is only about 50% higher than the
0.57 mW/mK2 power factor the dual doped sample achieved at the same temperature.
Despite having a higher electrical resistivity, the presence of the barium was able to
maintain its value across all temperatures which explains why the power factor was 25%
that of the optimal chemistry used in the bismuth non-stoichiometric addition set at low
temperatures and about 65% of the optimal chemistry at high temperatures. For this
reason more chemistries and concentrations of this set were tested to find the proper
doping levels in order to achieve the perfect balance in carrier mobility and carrier
concentration to enhance the Absolute Seebeck coefficient while achieving and
maintaining a low electrical resistivity.

Chapter 7: Non-Stoichiometric Dual Doping of Bismuth and Barium
137
7.5 References
1 Marat Gunes, Macit Ozenbas. Effect of grain size and porosity on phonon scattering enhancement of Ca3Co4O9. Journal of Alloys and Compounds Vol.626, pp.360-367, 2015.
2 Boyle, Cullen; Calvillo, Paulo; Chen, Yun; Barbero, Ever J.; McIntyre, Dustin. Grain boundary segregation and thermoelectric performance enhancement of bismuth doped calcium cobaltite. Journal of the European Ceramic Society 36(3):601-607 Elsevier 2016 0955-2219
3 J. J. Shen, X. X. Liu, T. J. Zhu, X. B. Zhao. Improved thermoelectric properties of La-doped Bi2Sr2Co2O9- layered misfit oxides. Journal of Materials Science. Vol.44, pp.1889-1893, 2009.
4 Live Science Staff. Facts about Bismuth. September 5, 2013.
5 Tao Wu, Trevor A. Tyson, Haiyan Chen, Jianming Bai, Hsin Wang and Cherno Jaye. A structural phase transition in Ca3Co4O9 Associated with enhanced high temperature thermoelectric properties. Cornell University Library. April 15, 2012.
6 T. Takeuchi, T. Kondo, K. Soda, U. Mizutani, R. Funahashi, M. Shikano, S. Tsuda, T. Yokoya, S. Shin, T. Muro. Electronic structure and large thermoelectric power in Ca3Co4O9. Journal of Electron Spectroscopy and Related Phenomena 137-140 2004 595-599. March 18, 2004.
7 Boyle, Cullen; Calvillo, Paulo; Chen, Yun; Barbero, Ever J.; McIntyre, Dustin. Grain boundary segregation and thermoelectric performance enhancement of bismuth doped calcium cobaltite. Journal of the European Ceramic Society 36(3):601-607 Elsevier 2016 0955-2219
8 Masashi Mikami, Kanju Chong, Yuzuru Miyazaki, Tsuyoshi Kajitani, Takahiro Inoue, Satoshi Sodeoka, and Ryoji Funahashi. Bi-Substitution effects on crystal structure and thermoelectric properties of Ca3Co4O9 single crystals. Japanese Journal of Applied Physics. Vol.45, No.5A, pp.4131-4136, 2006.
9 Sajid Butt, Yaoyu Ren, Muhammad Umer Farooq, Bin Zhan, Rizwan ur Rahman Sagar, Yuanhua Lin, Ce-Web Nan. Enhanced thermoelectric performance of heavy-metals (M: Ba, Pb) doped misfit-layered ceramics: (Ca2-xMxCoO3)0.62 (CoO2). Energy Conversion and Management. Vol.83, pp.35-41, 2014.
10 T. Sun, H. H. Hng, Q. Y. Yan, and J. Ma. Enhanced high temperature thermoelectric properties of Bi-doped c-axis oriented Ca3Co4O9 thin films by pulsed laser deposition. Journal of Applied Physics. Vol.108, 2010.
11 Calvillo, Paulo. Chen, Yun. Boyle, Cullen. Barnes, Paul. N. Song, Xueyan. Thermoelectric performance enhancement of calcium cobaltite through barium grain boundary segregation. Inorganic Chemistry. American Chemical Society Publications. September 11, 2015.

Chapter 7: Non-Stoichiometric Dual Doping of Bismuth and Barium
138
12 Guangkun Ren, Jinle Lan, Chengcheng Zeng, Yaochun Liu, Bin Zhan, Sajid Butt, Yuan-
Hua Lin, and Ce-Wen Nan. High performance oxides-based thermoelectric materials. Journal of Minerals, Metals & Materials Society. Vol.67, No.1, pp.211-221, 2015.
13 CrystalMaker Software Ltd. 2017.
14 Masashi Mikami, Kanju Chong, Yuzuru Miyazaki, Tsuyoshi Kajitani, Takahiro Inoue, Satoshi Sodeoka, and Ryoji Funahashi. Bi-Substitution effects on crystal structure and thermoelectric properties of Ca3Co4O9 single crystals. Japanese Journal of Applied Physics. Vol.45, No.5A, pp.4131-4136, 2006.
15 C. S. Huang, F. P. Zhang, X. Zhang, Q.M. Lu, J. X. Zhang, Z. Y. Liu. Enhanced thermoelectric figure of merit through electrical and thermal transport modulation by dual-doping and texture modulating for Ca3Co4O9+δ oxide materials. Journal of Alloys and Compounds. Vol.687, pp.87-94, 2016.
16 Ruoming Tian, Tianshu Zhang, Dewei Chu, Richard Donelson, Li Tao, Sean Li. Enhancement of high temperature thermoelectric performance in Bi, Fe co-doped layered oxide-based material Ca3Co4O9+δ. Journal of Alloys and Compounds. Vol.615, pp.311-315, 2014.
17 Q. M. Lu, J. X. Zhang, Q. Y. Zhang, Y. Q. Liu, and D. M. Liu. Improved thermoelectric properties of Ca3-xBaxCo4O9 (x=0~0.4) bulks by sol-gel and SPS method. 15th International Conference of Thermoelectrics. 2006.
18 G. Constantinescu, Sh. Rasekh, M. A. Torres, M. A. Madre, A. Sotelo, J. C. Diez. Improvement of thermoelectric properties in Ca3Co4O9 ceramics by Ba doping. Journal of Materials Science., Vol.26, pp.3466-3473, 2015.
18 Haoshan Hao, Limin Zhao, and Xing Hu. Microstructure and thermoelectric properties of Bi-and Cu-substituted Ca3Co4O9 oxides. Journal of Materials Science technology, Vol.25, pp.105-108, 2009.
19 Zunyi Tian, Xiaohong Wang, Jun Liu, Zhongjin Lin, Yangsen Hu, Yigui Wu, Chao Han, Zhiyu Hu. Power factor enhancement induced by Bi and Mn co-substitution in NaxCoO2 thermoelectric materials. Journal of Alloys and Compounds. Vol.661, pp.161-167, 2016.
20 Zhang Feipeng, Lu Qingmei, Li Tingxian, Zhang Xin, Zhang Jiuxing, Song Xiaoyan. Preparation and thermoelectric transport properties of Ba-, La-, and Ag- doped Ca3Co4O9 oxide materials. Journal of Rare Earths. Vol.31, No.8, pp.778-783, 2013.
21 Siwen Li, Ryoji Funahashi, Ichiro Matsubara, Kazuo Ueno, Satoshi Sodeoka, and Hiroyuki Yamada. Synthesis and thermoelectric properties of the new oxide materials Ca3-xBixCo4O9+δ (0.0<x<0.75). Chemical Material, Vol.12, pp.2424-2427, 2000.
22 Haoshan Hao, Qinglin He, ChangQing Chen, Hongwei Sun, and Xing Hu. Textured structure and anisotropic thermoelectric properties of Ca2.7Bi0.3Co4O9 oxide prepared by conventional solid-state reaction. International Journal of Modern Physics B. Vol.23, No.1, pp.87-95, 2009.
23 Ankam Bhaskar, Z. –R. Lin, Chia-Jyi Liu. Thermoelectric properties of Ca2.95Bi0.05Co4-
xFexO9+δ (0<x<0.15). Energy Conversion and Management. Vol.76, pp.63-67, 2013.
Chapter 8: Dual Doping Ca3Co4O9 through Cationic Substitution & Non-Stoichiometric Addition
139
Chapter 8:
Dual Doping Ca3Co4O9 through Cationic Substitution & Non-Stoichiometric Addition
8.1 Background and motivation for dual doping with cation substitution and non-
stoichiometric addition
Dual doping is not necessarily a new concept and it has been utilized and explored in
the last chapter through the non-stoichiometric addition method. However, there are no
reportings in the literatures on the dual doping while utilizing the cationic substitution and
non-stoichiometric addition in tandem. The last chapter discussed the dual doping of
bismuth and barium using the nonstoichiometric addition. This chapter explores the
combination of both the cationic substitution and nonstoichiometric addition. The
Ca3Co4O9 baseline was doped with a set concentration of bismuth by using the cation
substitution method where the bismuth atoms replace calcium atoms to improve crystal
texture. Barium utilizes the non-stoichiometric addition method to enhance the Absolute
Seebeck coefficient and maintain a low electrical resistivity. Since barium can only deposit
at the grain boundary it forces the bismuth to mainly deposit at the grain interior. This can
cause the sample to be easily over doped, which was seen in the last chapter. By using
cation substitution with the non-stoichiometric addition the calcium vacancies give the
bismuth a place to deposit lessening the possibility of over doping.
The best concentrations of bismuth cation substitution described in chapter 4 were
that of x=0.2 and x=0.3. Results from the previous chapter proved that this method has a

Chapter 8: Dual Doping Ca3Co4O9 through Cationic Substitution & Non-Stoichiometric Addition
140
great tendency to over dope the sample much easier due to the dual nature. For this
reason the lower of the two were used in this chapter as to not over dope the sample.
Also this provides a much more linear comparison between this chapter and last
considering the same bismuth concentration was used. Barium utilized the method of
non-stoichiometric addition once again with the same three concentrations used in
chapter 7, which were barium 0.02, 0.05 & 0.07, in order to find a trend and see if the
Absolute Seebeck Coefficient can be further enhanced thus improving the power factor
and overall efficiency.
8.2 Experimental Procedure
Ca3-xBixBauCo4O9 powders, where x=0.0 & 0.2 and u=0.0, 0.02, 0.05, 0.07 were
obtained through a sol-gel route in which stoichiometric ratios of Ca(NO3)2•4H2O,
Co(NO3)2•6H2O and Bi(NO3)2•5H2O were mixed with non-stoichiometric ratios of
Ba(NO3)2 in deionized water. Ethylene glycol and polyethylene glycol were used to aid
polymerization of the solution and to aid in particle size. [1] Lastly, nitric acid was added to
induce nitrate salts decomposition and facilitate new compound formation. [2]
The liquid solution was then submerged in a silicone oil bath on a hot plate and
mechanically stirred at 353 K for 3 hours to achieve the sol-gel state. The sol-gel was
then distributed to ceramic crucibles loosely covered with aluminum foil and put into a box
furnace with a ramp rate of 10 K per minute and held at 773 K for 2 hours then cooled at
a rate of 10 K per minute. Holding the temperature here, at 773 K, for the allotted time will
ensure that any inorganic material is removed from the material. The ashes were then
suspended in ethanol and ball milled for 20 minutes alternating between 1 minute of
Chapter 8: Dual Doping Ca3Co4O9 through Cationic Substitution & Non-Stoichiometric Addition
141
milling and 1 minute of resting in order to aid in the dissipation of heat. The powders were
deposited in a tubular furnace where they were calcined in an oxygen rich induced
environment with a ramp rate of 10 K per minute and held at 973 K for 4 hours, to achieve
the Ca3Co4O9 crystal lattice. The powders were then cooled down to room temperature
at a rate of 10 K per minute.
Two pellets were pressed, one to test its electrical properties and the other for its
thermal properties. The calcined powders were pressed uniaxially with 1 GPa of force
and held for 10 minutes at 298 K. The pellets’ densities were obtained before they were
put in to a tubular furnace to be sintered. The sintering process removes any extra
moisture the pellet may contain and assures proper grain alignment. Pellets were sintered
in an oxygen rich induced environment with a ramp rate of 10 K per minute and held at
1233 K for 9 hours. It was then cooled back to room temperature at a 4 K per minute and
once again the densities were taken. Pellets were cut into a 2 mm x 3.5 mm x 9 mm
rectangular shapes and inserted into a Linseis LSR 3-Seebeck machine, subjected to a
low pressure helium, He, environment where the pellet’s electrical resistivity and Absolute
Seebeck Coefficient were simultaneously determined by means of a dc four-probe
method. Since helium is an inert gas it will not react or interfere with the measurement. A
second pellet was cut along a different axis and inserted into the Linseis LFA 1000
machine to test its thermal conductivity. The pellet was cut to be 2 mm thick and polished
to a diameter of 11-13 mm. Any less than 11 mm and there would be room for heat to
escape the holder, any more than 13 mm and the pellet would be too large for the holder.
The thermal conductivity is calculated by the equation

Chapter 8: Dual Doping Ca3Co4O9 through Cationic Substitution & Non-Stoichiometric Addition
142
K=λCpρm (13)
Where λ is the thermal diffusity in meters per second (m2/s), Cp is the specific heat
capacity in joules per kilogram kelvin (J/kg•K), and ρm is the mass density grams per
centimeter cubed (g/cm3). As stated in the first section, these are the three values needed
in order to obtain the materials’ ZT value. Bismuth cation substitution has been reported
on and a concentration of 0.2 was used and held constant throughout the varied barium
dopings. A non-stoichiometric addition was used for varying the doping concentrations of
barium. Their chemistries are as follows: Ca3-xBixBauCo4O9 where x = 0.0, 0.2 and u =
0.0, 0.02, 0.05, and 0.07.
8.3 Comparison of Non-stoichiometric dual doping to Cation Substitution & Non-
stoichiometric dual doping
In the previous chapter it was shown how the semi-conductor nature of barium
allowed the electrical resistivity of the dual doped sample to be competitive with the
optimal bismuth non-stoichiometric addition sample at high temperatures, even though it
had a much lower electrical resistivity at lower temperatures. [3] The dual doped samples
in this chapter start off at low temperatures with an electrical resistivity relatively higher
but much closer to the sample doped with only bismuth using the cationic substitution
method alone which is evident from figure 54. This comparable electrical resistivity at low
temperatures allows these samples to achieve a similar electrical resistivity at the mid-
high temperature range and even surpass the bismuth sample beyond 900 K, due to the
ability of barium to act like a semi-conductor. This unique ability that barium has to
maintain a low electrical resistivity across all temperatures allows the addition of barium
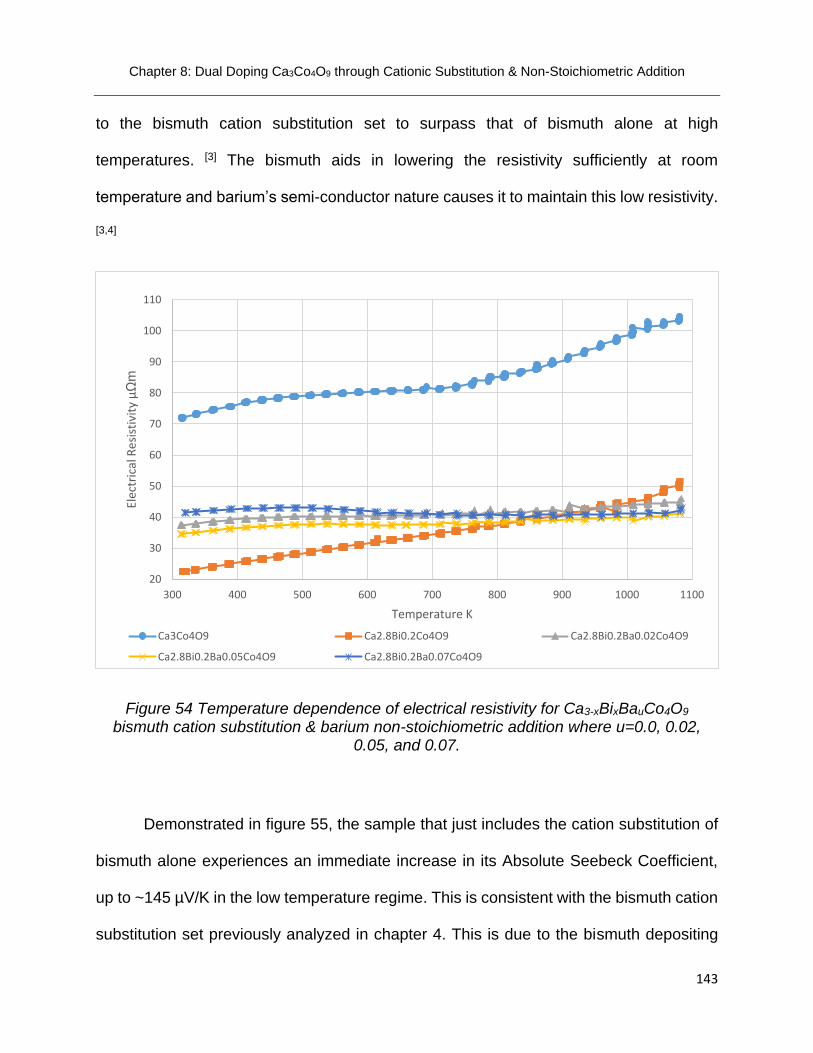
Chapter 8: Dual Doping Ca3Co4O9 through Cationic Substitution & Non-Stoichiometric Addition
143
to the bismuth cation substitution set to surpass that of bismuth alone at high
temperatures. [3] The bismuth aids in lowering the resistivity sufficiently at room
temperature and barium’s semi-conductor nature causes it to maintain this low resistivity.
[3,4]
Figure 54 Temperature dependence of electrical resistivity for Ca3-xBixBauCo4O9 bismuth cation substitution & barium non-stoichiometric addition where u=0.0, 0.02,
0.05, and 0.07.
Demonstrated in figure 55, the sample that just includes the cation substitution of
bismuth alone experiences an immediate increase in its Absolute Seebeck Coefficient,
up to ~145 µV/K in the low temperature regime. This is consistent with the bismuth cation
substitution set previously analyzed in chapter 4. This is due to the bismuth depositing
20
30
40
50
60
70
80
90
100
110
300 400 500 600 700 800 900 1000 1100
Elec
tric
al R
esis
tivi
ty µ
Ωm
Temperature K
Ca3Co4O9 Ca2.8Bi0.2Co4O9 Ca2.8Bi0.2Ba0.02Co4O9
Ca2.8Bi0.2Ba0.05Co4O9 Ca2.8Bi0.2Ba0.07Co4O9

Chapter 8: Dual Doping Ca3Co4O9 through Cationic Substitution & Non-Stoichiometric Addition
144
itself at the grain boundary and acting as a filter for the carrier concentration.[5,6,7] Once
the barium is introduced at the grain boundary this effect is further enhanced achieving a
room temperature Absolute Seebeck Coefficient of anywhere between 155-160 µV/K.
This shows that barium allows this material to have a much higher saturation level at the
grain boundary, predominantly due to the fact barium deposits itself wholly at the grain
boundary instead of both the boundary and the lattice as bismuth does. [7,8] The Absolute
Seebeck Coefficient increased with increasing temperature at a slow rate compared with
the sample of bismuth cation substitution alone. This slow increase that it experiences is
caused from the increase in carrier concentration which consequentially caused the
reduction in electrical resistivity as the temperature increases. [5,6]

Chapter 8: Dual Doping Ca3Co4O9 through Cationic Substitution & Non-Stoichiometric Addition
145
Figure 55 Temperature dependence of absolute seebeck coefficient for Ca2.8Bi0.2BauCo4O9 bismuth cation substitution & barium non-stoichiometric addition
where u=0.0, 0.02, 0.05, and 0.07.
The main motive behind this sample set was to increase the Absolute Seebeck
Coefficient, through grain boundary segregation, while maintaining a low electrical
resistivity, through grain texture and alignment. The Absolute Seebeck Coefficient,
although increased at low temperature with the presence of barium, did not compare to
that of the Ca2.8Bi0.2Co4O9 doping at high temperature. In fact, the semi-conductor nature
of the barium providing a low electrical resistivity at high temperatures was responsible
for allowing the dual doped set to have a competitive power factor of 0.80 mW/mK2 at 985
K with the Ca2.8Bi0.2Co4O9, which too had a power factor of 0.80 mW/mK2 at the same
temperature shown in figure 56.
120
130
140
150
160
170
180
190
200
300 400 500 600 700 800 900 1000 1100
Ab
solu
te S
eeb
eck
coef
fici
ent
µV
/K
Temperature K
Ca3Co4O9 Ca2.8Bi0.2Co4O9 Ca2.8Bi0.2Ba0.02Co4O9
Ca2.8Bi0.2Ba0.05Co4O9 Ca2.8Bi0.2Ba0.07Co4O9

Chapter 8: Dual Doping Ca3Co4O9 through Cationic Substitution & Non-Stoichiometric Addition
146
Figure 56 Temperature dependence of power factor for Ca2.8Bi0.2BauCo4O9 bismuth cation substitution & barium non-stoichiometric addition where u=0.0, 0.02, 0.05, and
0.07.
8.4 Summary of results for cation substitution & non-stoichiometric addition dual
doping of Ca3Co4O9
The dual doped samples achieved a low electrical resistivity of ~40 µΩm in all
temperature ranges. This low electrical resistivity coupled with an enhanced Absolute
Seebeck coefficient allowed for a high power factor of 0.84 mW/mK2 at 1010 K with the
optimal sample Ca2.8Bi0.2Ba0.05Co4O9. This overlaps the bismuth cation substitution
sample and is about three times greater than the 0.29 mW/mK2 power factor of the pure
Ca3Co4O9 at the same temperature. This was mainly due to the consistent low electrical
0.16
0.26
0.36
0.46
0.56
0.66
0.76
0.86
0.96
300 400 500 600 700 800 900 1000 1100
Po
wer
Fac
tor
mW
/mK
2
Temperature K
Ca3Co4O9 Ca2.8Bi0.2Co4O9 Ca2.8Bi0.2Ba0.02Co4O9
Ca2.8Bi0.2Ba0.05Co4O9 Ca2.8Bi0.2Ba0.07Co4O9
Chapter 8: Dual Doping Ca3Co4O9 through Cationic Substitution & Non-Stoichiometric Addition
147
resistivity across the whole temperature range, caused by the semi-conductive abilities
of barium, along with the increase in room temperature Absolute Seebeck coefficient,
caused by the grain boundary segregation of both dopants. Only the material’s electrical
properties were studied for this set since the power factor that was achieved was not
greater than that of the bismuth cation substitution alone.

Chapter 8: Dual Doping Ca3Co4O9 through Cationic Substitution & Non-Stoichiometric Addition
148
8.5 References
1 Marat Gunes, Macit Ozenbas. Effect of grain size and porosity on phonon scattering enhancement of Ca3Co4O9. Journal of Alloys and Compounds Vol.626, pp.360-367, 2015.
2 Boyle, Cullen; Calvillo, Paulo; Chen, Yun; Barbero, Ever J.; McIntyre, Dustin. Grain boundary segregation and thermoelectric performance enhancement of bismuth doped calcium cobaltite. Journal of the European Ceramic Society 36(3):601-607 Elsevier 2016 0955-2219
3 Masashi Mikami, Kanju Chong, Yuzuru Miyazaki, Tsuyoshi Kajitani, Takahiro Inoue, Satoshi Sodeoka, and Ryoji Funahashi. Bi-Substitution effects on crystal structure and thermoelectric properties of Ca3Co4O9 single crystals. Japanese Journal of Applied Physics. Vol.45, No.5A, pp.4131-4136, 2006.
4 Live Science Staff. Facts about Bismuth. September 5, 2013.
5 Tao Wu, Trevor A. Tyson, Haiyan Chen, Jianming Bai, Hsin Wang and Cherno Jaye. A structural phase transition in Ca3Co4O9 Associated with enhanced high temperature thermoelectric properties. Cornell University Library. April 15, 2012.
6 T. Takeuchi, T. Kondo, K. Soda, U. Mizutani, R. Funahashi, M. Shikano, S. Tsuda, T. Yokoya, S. Shin, T. Muro. Electronic structure and large thermoelectric power in Ca3Co4O9. Journal of Electron Spectroscopy and Related Phenomena. Vol.137-140, pp.595-599, 2004.
7 Guangkun Ren, Jinle Lan, Chengcheng Zeng, Yaochun Liu, Bin Zhan, Sajid Butt, Yuan-Hua Lin, and Ce-Wen Nan. High performance oxides-based thermoelectric materials. Journal of Minerals, Metals & Materials Society. Vol.67, No.1, pp.211-221, 2015.
8 Calvillo, Paulo. Chen, Yun. Boyle, Cullen. Barnes, Paul. N. Song, Xueyan. Thermoelectric performance enhancement of calcium cobaltite through barium grain boundary segregation. Inorganic Chemistry. American Chemical Society Publications. September 11, 2015.
9 T. Sun, H. H. Hng, Q. Y. Yan, and J. Ma. Enhanced high temperature thermoelectric properties of Bi-doped c-axis oriented Ca3Co4O9 thin films by pulsed laser deposition. Journal of Applied Physics. Vol.108, 2010.
10 Sajid Butt, Yaoyu Ren, Muhammad Umer Farooq, Bin Zhan, Rizwan ur Rahman Sagar, Yuanhua Lin, Ce-Web Nan. Enhanced thermoelectric performance of heavy-metals (M: Ba, Pb) doped misfit-layered ceramics: (Ca2-xMxCoO3)0.62 (CoO2). Energy Conversion and Management. Vol.83, pp.35-41, 2014.
11 Ruoming Tian, Tianshu Zhang, Dewei Chu, Richard Donelson, Li Tao, Sean Li. Enhancement of high temperature thermoelectric performance in Bi, Fe co-doped layered oxide-based material Ca3Co4O9+δ. Journal of Alloys and Compounds. Vol.615, pp.311-315, 2014.

Chapter 8: Dual Doping Ca3Co4O9 through Cationic Substitution & Non-Stoichiometric Addition
149
12 Q. M. Lu, J. X. Zhang, Q. Y. Zhang, Y. Q. Liu, and D. M. Liu. Improved thermoelectric
properties of Ca3-xBaxCo4O9 (x=0~0.4) bulks by sol-gel and SPS method. 15th International Conference of Thermoelectrics. 2006.
13 Ankam Bhaskar, Z. –R. Lin, Chia-Jyi Liu. Thermoelectric properties of Ca2.95Bi0.05Co4-
xFexO9+δ (0<x<0.15). Energy Conversion and Management. Vol.76, pp.63-67, 2013.
14 Haoshan Hao, Qinglin He, ChangQing Chen, Hongwei Sun, and Xing Hu. Textured structure and anisotropic thermoelectric properties of Ca2.7Bi0.3Co4O9 oxide prepared by conventional solid-state reaction. International Journal of Modern Physics B. Vol.23, No.1, pp.87-95, 2009.
15 Siwen Li, Ryoji Funahashi, Ichiro Matsubara, Kazuo Ueno, Satoshi Sodeoka, and Hiroyuki Yamada. Synthesis and thermoelectric properties of the new oxide materials Ca3-xBixCo4O9+δ (0.0<x<0.75). Chemical Material, Vol.12, pp.2424-2427, 2000.
16 Zhang Feipeng, Lu Qingmei, Li Tingxian, Zhang Xin, Zhang Jiuxing, Song Xiaoyan. Preparation and thermoelectric transport properties of Ba-, La-, and Ag- doped Ca3Co4O9 oxide materials. Journal of Rare Earths. Vol.31, No.8, pp.778-783, 2013.
17 Haoshan Hao, Limin Zhao, and Xing Hu. Microstructure and thermoelectric properties of Bi-and Cu-substituted Ca3Co4O9 oxides. Journal of Materials Science technology, Vol.25, pp.105-108, 2009.
18 G. Constantinescu, Sh. Rasekh, M. A. Torres, M. A. Madre, A. Sotelo, J. C. Diez. Improvement of thermoelectric properties in Ca3Co4O9 ceramics by Ba doping. Journal of Materials Science., Vol.26, pp.3466-3473, 2015.
19 C. S. Huang, F. P. Zhang, X. Zhang, Q.M. Lu, J. X. Zhang, Z. Y. Liu. Enhanced thermoelectric figure of merit through electrical and thermal transport modulation by dual-doping and texture modulating for Ca3Co4O9+δ oxide materials. Journal of Alloys and Compounds. Vol.687, pp.87-94, 2016.

Chapter 9: Optimization of Dual doping Ca3Co4O9 by Controlling Grain Growth & Texture while Enhancing Seebeck
150
Chapter 9:
Optimization of Dual Doping Ca3Co4O9 by Controlling Grain Growth & Texture while Enhancing Absolute Seebeck Coefficient
9.1 Motivation
In the last two chapters the dual doping method has been investigated with two
different approaches. The first was through non-stoichiometric addition of both dopants
and the second was through cationic substitution of one dopant and non-stoichiometric
addition of the second. The second approach seems to over dope less easily and holds
more promise. This is the method concentrated on and analyzed in this chapter. Chapter
8 showed that using Ca2.8Bi0.2BauCo4O9 concentration of bismuth caused mild over
doping. This lead to the motivation of this chapter where a lower concentration of bismuth
will be used. Therefore, the baseline was doped with a set concentration of bismuth by
using the cation substitution method as before, where the bismuth atoms will replace
calcium atoms. The concentration used was bismuth x=0.1 to avoid over doping. Barium
used the method of non-stoichiometric addition allowing it to deposit itself freely. Since
barium’s optimization was reached at barium 0.05 addition, the doping levels used for
barium were 0.02, 0.05, 0.07, and 0.1, in order to find a trend and see if the Absolute
Seebeck Coefficient can be further enhanced and grain texture improved thus enhancing
the power factor and overall efficiency.

Chapter 9: Optimization of Dual doping Ca3Co4O9 by Controlling Grain Growth & Texture while Enhancing Seebeck
151
9.2 Experimental Procedure
Ca3-xBixBauCo4O9 powders, where x=0.0 & 0.1 and u=0.0, 0.02, 0.05, 0.07 were
obtained through a sol-gel route in which stoichiometric ratios of Ca(NO3)2•4H2O,
Co(NO3)2•6H2O and Bi(NO3)2•5H2O were mixed with non-stoichiometric ratios of
Ba(NO3)2 in deionized water. Ethylene glycol and polyethylene glycol were used to aid
polymerization of the solution and to aid in particle size. [1] Lastly, nitric acid was added to
induce nitrate salts decomposition and facilitate new compound formation. [2]
The liquid solution was then submerged in a silicone oil bath on a hot plate and
mechanically stirred at 353K for 3 hours to achieve the sol-gel state. The sol-gel was then
distributed to ceramic crucibles loosely covered with aluminum foil and put into a box
furnace with a ramp rate of 10 K per minute and held at 773 K for 2 hours then cooled at
a rate of 10 K per minute. Holding the temperature here, at 773 K, for the allotted time will
ensure that any inorganic material is removed from the material. The ashes were then
suspended in ethanol and ball milled for 20 minutes alternating between 1 minute of
milling and 1 minute of resting in order to aid in the dissipation of heat. The powders were
deposited in a tubular furnace where they were calcined in an oxygen rich induced
environment with a ramp rate of 10 K per minute and held at 973 K for 4 hours, to achieve
the Ca3Co4O9 crystal lattice. The powders were then cooled down to room temperature
at a rate of 10 K per minute.
Two pellets were pressed, one to test its electrical properties and the other for its
thermal properties. The calcined powders were pressed uniaxially with 1 GPa of force

Chapter 9: Optimization of Dual doping Ca3Co4O9 by Controlling Grain Growth & Texture while Enhancing Seebeck
152
and held for 10 minutes at 298 K. The pellets’ densities were obtained before they were
put in to a tubular furnace to be sintered. The sintering process removes any extra
moisture the pellet may contain and assures proper grain alignment. Pellets were sintered
in an oxygen rich induced environment with a ramp rate of 10 K per minute and held at
1233 K for 9 hours. It was then cooled back to room temperature at 4 K per minute and
once again the densities were taken. Pellets were cut into a 2 mm x 3.5 mm x 9 mm
rectangular shapes and inserted into a Linseis LSR 3-Seebeck machine, subjected to a
low pressure helium, He, environment where the pellet’s electrical resistivity and Absolute
Seebeck Coefficient were simultaneously determined by means of a dc four-probe
method. Since helium is an inert gas it will not react or interfere with the measurement. A
second pellet was cut along a different axis and inserted into the Linseis LFA 1000
machine to test its thermal conductivity. The pellet was cut to be 2 mm thick and polished
to a diameter of 11-13 mm. Any less than 11 mm and there would be room for heat to
escape the holder, any more than 13 mm and the pellet would be too large for the holder.
The thermal conductivity is calculated by the equation
K=λCpρm (13)
Where λ is the thermal diffusity in meters squared per second (m2/s), Cp is the specific
heat capacity in joules per kilogram kelvin (J/kg•K), and ρm is the mass density in grams
per centimeter cubed (g/cm3). As stated in the first section, these are the three values
needed in order to obtain the materials’ ZT value. Bismuth cation substitution has been
reported on and a concentration of 0.1 was used and held constant throughout the varied

Chapter 9: Optimization of Dual doping Ca3Co4O9 by Controlling Grain Growth & Texture while Enhancing Seebeck
153
barium dopings. A non-stoichiometric addition method was used for varying the doping
concentrations of barium. Their chemistries are as follows: Ca3-xBixBauCo4O9 where x =
0.0, 0.1 and u = 0.0, 0.02, 0.05, 0.07, and 0.1.
9.3 Decreased electrical resistivity and enhanced thermoelectric properties of
Ca3Co4O9 induced by dual doping
9.3.1 Low electrical resistivity achieved through dual doping
It is clearly evident in figure 57 that the Ca2.9Bi0.1Ba0.07Co4O9 doped sample has a
significantly lower room temperature electrical resistivity than that of the Ca2.9Bi0.1Co4O9.
At 315 K the bismuth barium dual doped sample has an electrical resistivity of ~28 µΩm
whereas the Ca2.9Bi0.1Co4O9 is ~48 µΩm at the same temperature. As the bismuth cation
substitution sample increases in temperature its electrical resistivity experiences a large
increase as well, from ~48 µΩm up to ~74 µΩm at around 1080 K, yet the
Ca2.9Bi0.1Ba0.07Co4O9 sample only increases slightly from ~28 µΩm to ~38 µΩm. [3,4] This
low electrical resistivity can be attributed to the exceptionally low electrical resistivities
that bismuth and barium can achieve independently. This sample has a slightly higher
electrical resistivity than the bismuth x=0.2 in chapters 4 & 8 but the bismuth x=0.2 rises
from 22 µΩm to about 49 µΩm which is larger than the optimal dual doped sample with
the lower bismuth concentration.
All samples dual doped with bismuth and barium had a comparable or lower
electrical resistivity than the sample doped only through bismuth cation substitution, with
the exception of the over doped sample of Ca2.9Bi0.1Ba0.1Co4O9. Each dual doped sample

Chapter 9: Optimization of Dual doping Ca3Co4O9 by Controlling Grain Growth & Texture while Enhancing Seebeck
154
maintained this low electrical resistivity into the high temperatures as the sample doped
only with bismuth cation substitution continued to rise as the temperature increased. The
optimal concentration of Ca2.9Bi0.1Ba0.07Co4O9 shown in figure 57 achieved a low electrical
resistivity of 28 µΩm at 315 K and ~37 µΩm at 982 K which is 35% of that of the pure
undoped Ca3Co4O9.
Figure 57 Temperature dependence of electrical resistivity for Ca2.9Bi0.1BauCo4O9 bismuth cation substitution & barium non-stoichiometric addition where u=0.0, 0.02,
0.05, 0.07, and 0.1.
9.3.2 Fine tuning electrical resistivity and Seebeck coefficient through dual dopants.
Both the bismuth and the barium were able to act in concert to vastly improve the
Absolute Seebeck Coefficient of this material. When only bismuth is introduced the
27
37
47
57
67
77
87
97
107
117
300 400 500 600 700 800 900 1000 1100
Elec
tric
al R
esis
tivi
ty µ
Ωm
Temperature K
Ca3Co4O9 Ca2.9Bi0.1Co4O9 Ca2.9Bi0.1Ba0.02Co4O9
Ca2.9Bi0.1Ba0.05Co4O9 Ca2.9Bi0.1Ba0.07Co4O9 Ca2.9Bi0.1Ba0.1Co4O9

Chapter 9: Optimization of Dual doping Ca3Co4O9 by Controlling Grain Growth & Texture while Enhancing Seebeck
155
Absolute Seebeck coefficient increases to around 140 µV/k at 315 K. However, once the
barium is introduced the material experiences another, even greater, enhancement of its
Absolute Seebeck Coefficient above 160 µV/k at 315 K, due to its segregation at the grain
boundary. [5,6] The Absolute Seebeck coefficient in the high temperature range is also
comparable to that of the sample solely doped with bismuth cation substitution,
demonstrated in figure 58, whereas the dual doped samples, in previous chapters, had a
lower value than the bismuth alone. After increasing the barium’s levels to 0.1 it can be
seen that the Absolute Seebeck coefficient flattens out at around 600 K, which as
mentioned previously is indicative of over doping. This over doping is also demonstrated
by having a much larger resistivity trend than the rest of the samples.

Chapter 9: Optimization of Dual doping Ca3Co4O9 by Controlling Grain Growth & Texture while Enhancing Seebeck
156
Figure 58 Temperature dependence of absolute seebeck coefficient for Ca2.9Bi0.1BauCo4O9 bismuth cation substitution & barium non-stoichiometric addition
where u=0.0, 0.02, 0.05, 0.07, and 0.1
This low electrical resistivity and large Absolute Seebeck Coefficient achieved by
the optimal Ca2.9Bi0.1Ba0.07Co4O9 chemistry across all temperature ranges leads to an
enhanced power factor in all temperature ranges as well. The Ca2.9Bi0.1Ba0.07Co4O9
sample yields a high power factor of 0.93 mW/mK2 at 315 K and 0.94 mW/mK2 at 1005 K
both of which are nearly 5 times and over 3 times the pure undoped Ca3Co4O9 sample,
respectively. This is shown in figure 59 and is one of the highest power factors reported
on for this material.
120
130
140
150
160
170
180
190
300 400 500 600 700 800 900 1000 1100
Ab
solu
te S
eeb
eck
coef
fici
ent
µV
/K
Temperature K
Ca3Co4O9 Ca2.9Bi0.1Co4O9 Ca2.9Bi0.1Ba0.02Co4O9
Ca2.9Bi0.1Ba0.05Co4O9 Ca2.9Bi0.1Ba0.07Co4O9 Ca2.9Bi0.1Ba0.1Co4O9

Chapter 9: Optimization of Dual doping Ca3Co4O9 by Controlling Grain Growth & Texture while Enhancing Seebeck
157
Figure 59 Temperature dependence of power factor for Ca2.9Bi0.1BauCo4O9 bismuth cation substitution & barium non-stoichiometric addition where u=0.0, 0.02, 0.05, 0.07,
and 0.1.
9.4 Microstructure of dual doped Bismuth & Barium
9.4.1 Structure and lattice parameters
Figure 60 shows the X-Ray diffraction patterns obtained from ground powders
under ambient conditions. Table 3 shows the lattice parameters of these samples for their
different chemistries. The samples containing bismuth had shifted peaks to lower angles
indicating an increase in lattice parameters thus reassuring the entry of bismuth into the
lattice. Barium however, has little effect on the parameters as its concentration increases,
0.17
0.27
0.37
0.47
0.57
0.67
0.77
0.87
0.97
300 400 500 600 700 800 900 1000 1100
Po
wer
Fac
tor
mW
/mK
2
Temperature K
Ca3Co4O9 Ca2.9Bi0.1Co4O9 Ca2.9Bi0.1Ba0.02Co4O9
Ca2.9Bi0.1Ba0.05Co4O9 Ca2.9Bi0.1Ba0.07Co4O9 Ca2.9Bi0.1Ba0.1Co4O9

Chapter 9: Optimization of Dual doping Ca3Co4O9 by Controlling Grain Growth & Texture while Enhancing Seebeck
158
since it does not deposit into the grain interior, leaving the parameters to only deviate
based on the small variations of bismuth from sample to sample. These peaks in figure
60 can be indexed as the Ca3Co4O9 monoclinic structure with the x = 0.0, u=0.0 sample
showing little to no trace of Co3O4 which can be seen from the Co3O4 (311) peak indexed.
Figure 60 XRD powder diffraction patterns for the Ca3-xBixBauCo4O9 samples. [6]
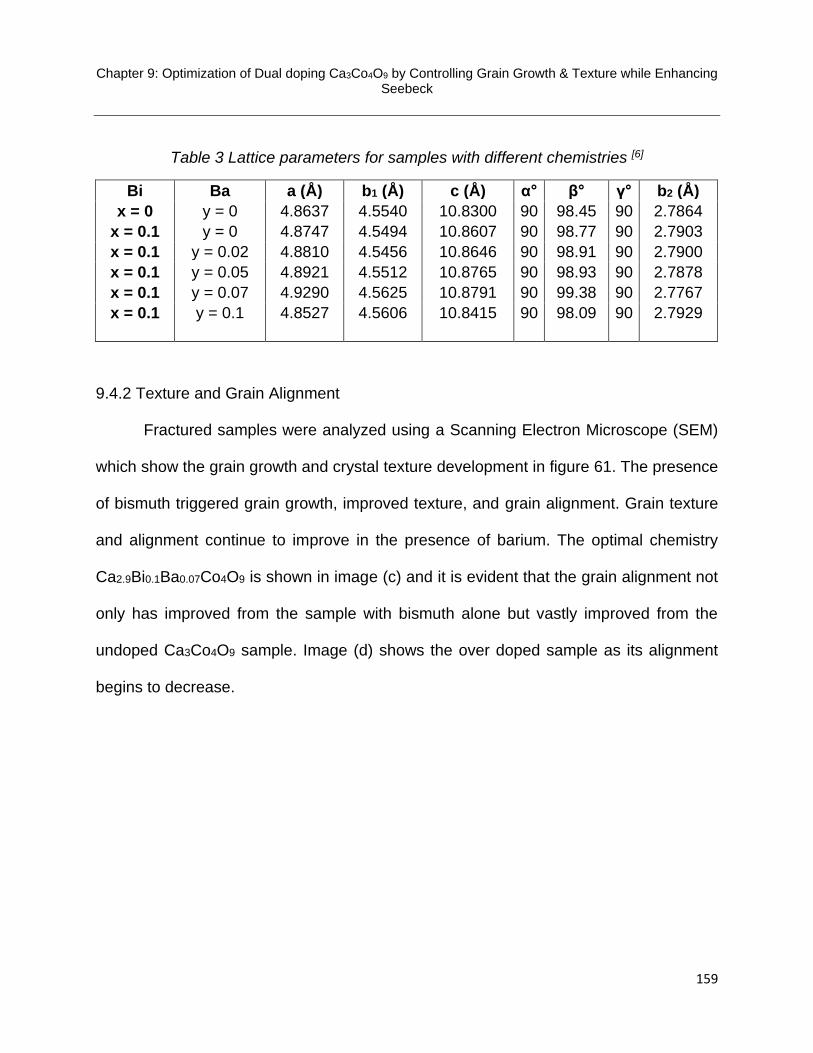
Chapter 9: Optimization of Dual doping Ca3Co4O9 by Controlling Grain Growth & Texture while Enhancing Seebeck
159
Table 3 Lattice parameters for samples with different chemistries [6]
Bi Ba a (Å) b1 (Å) c (Å) α° β° γ° b2 (Å)
x = 0 y = 0 4.8637 4.5540 10.8300 90 98.45 90 2.7864
x = 0.1 y = 0 4.8747 4.5494 10.8607 90 98.77 90 2.7903
x = 0.1 y = 0.02 4.8810 4.5456 10.8646 90 98.91 90 2.7900
x = 0.1 y = 0.05 4.8921 4.5512 10.8765 90 98.93 90 2.7878
x = 0.1 y = 0.07 4.9290 4.5625 10.8791 90 99.38 90 2.7767
x = 0.1 y = 0.1 4.8527 4.5606 10.8415 90 98.09 90 2.7929
9.4.2 Texture and Grain Alignment
Fractured samples were analyzed using a Scanning Electron Microscope (SEM)
which show the grain growth and crystal texture development in figure 61. The presence
of bismuth triggered grain growth, improved texture, and grain alignment. Grain texture
and alignment continue to improve in the presence of barium. The optimal chemistry
Ca2.9Bi0.1Ba0.07Co4O9 is shown in image (c) and it is evident that the grain alignment not
only has improved from the sample with bismuth alone but vastly improved from the
undoped Ca3Co4O9 sample. Image (d) shows the over doped sample as its alignment
begins to decrease.

Chapter 9: Optimization of Dual doping Ca3Co4O9 by Controlling Grain Growth & Texture while Enhancing Seebeck
160
Figure 61 SEM images showing crystal texture development of the Ca3Co4O9 samples with dual element doping of bismuth and barium simultaneously. [6]
To further elucidate this grain alignment concept, figure 62 shows the
microstructure progression from the undoped sample to that of the Ca2.9Bi0.1Ba0.07Co4O9.
It also demonstrates how the barium deposits at the grain boundary while bismuth
improved the crystal texture by entering the grains.

Chapter 9: Optimization of Dual doping Ca3Co4O9 by Controlling Grain Growth & Texture while Enhancing Seebeck
161
Figure 62 Microstructure drawing of undoped Ca3Co4O9 and Ca2.9Bi0.1Ba0.07Co4O9.
9.5 Nanostructure analysis of dual doped Bismuth & Barium through use of TEM
Transmission Electron Microscope (TEM) was used to explore the diffraction
contrast and gain knowledge of the chemical composition of the Ca2.9Bi0.1Co4O9 sample
detailed in figure 63. Image (a) shows the diffraction contrast of the Ca2.9Bi0.1Co4O9 cation
substitution sample. EDS values, shown in table 4, were taken from the points shown in
figure 63 image (a), once again demonstrating bismuth’s ability to deposit into the lattice
and at the grain boundary. Image (b) shows no evidence of a secondary phase and the
red arrow indicates the bismuth enriched grain boundary.

Chapter 9: Optimization of Dual doping Ca3Co4O9 by Controlling Grain Growth & Texture while Enhancing Seebeck
162
Figure 63 (a) Diffraction contrast image and (b) high resolution TEM from the Ca2.9Bi0.1Co4O9 sample. [6]
Table 4 Chemical compositions of two neighboring grains and grain boundary in between. [6]
Figure 64 (a) & (b) show the nanostructure of the lamellar of the
Ca2.9Bi0.1Ba0.07Co4O9 sample. EDS data, in table 5, shows that there is a depletion of
bismuth at the grain boundary. This is due to the presence of the barium. As the barium
concentration increases the grain boundary becomes more and more enriched with

Chapter 9: Optimization of Dual doping Ca3Co4O9 by Controlling Grain Growth & Texture while Enhancing Seebeck
163
barium and the bismuth depletes causing more to deposit into the lattice. Barium is also
not present anywhere in the grain interior. Image (b) shows no secondary phase at the
grain boundary plane. This is opposite to the intragrain lattice where the grain boundary
region experiences some lattice distortions. [6] This is most likely the direct result of the
presence of barium at the boundary. Image (c) is a high resolution TEM image also
showing no secondary phase at the grain boundary.
Figure 64 TEM images from the Ca2.9Bi0.1Ba0.07Co4O9 sample. [6]
Table 5 Chemical compositions of two neighboring grains and grain boundary in between for the Ca2.9Bi0.1Ba0.07Co4O9 sample. [6]
At% 1–1 1–2 1–3 2–1 2–2 2–3 3–1 3–2 3–3 4–1 4–2 4–3 5–1 5–2 5–3 6–1 6–2 6–3
O 67.9 62.7 58.0 68.2 59.7 62.5 66.5 67.0 62.1 68.8 65.3 60.0 65.8 64.2 59.5 59.6 63.0 60.9
Ca 13.3 10.2 16.6 13.2 2.5 12.0 14.6 11.6 15.2 13.1 12.4 13.5 14.9 8.4 12.6 18.0 8.2 13.8
Co 18.5 24.4 24.8 18.1 30.9 25.2 18.4 19.6 22.1 17.7 20.5 26.2 18.8 24.5 27.5 21.9 25.4 24.8
Ba 0.0 2.5 0.0 0.0 6.9 0.0 0.0 1.3 0.0 0.0 1.4 0.0 0.0 2.6 0.0 0.0 3.0 0.0
Bi 0.4 0.2 0.6 0.5 0.1 0.3 0.6 0.4 0.6 0.5 0.4 0.4 0.5 0.3 0.4 0.6 0.4 0.4

Chapter 9: Optimization of Dual doping Ca3Co4O9 by Controlling Grain Growth & Texture while Enhancing Seebeck
164
9.6 Calculating the thermal conductivities and ZT of dual doped Ca3Co4O9
Thermal conductivities of the two samples with the optimal power factor from figure
59 were tested and compared with those of the undoped Ca3Co4O9 and the
Ca2.9Bi0.1Co4O9 samples in figure 65. Barium has the tendency to vastly increase the
density of the bulk sample which in turn will decrease its thermal conductivity affecting its
otherwise high power factor. This high thermal conductivity keeps this material from
cresting the 0.5 figure of merit mark. The optimal sample of Ca2.9Bi0.1Ba0.07Co4O9 has a
thermal conductivity of 2.8 W/mK at 373 K and 2.2 W/mK at 1073 K both values of which
are higher than that of the pure undoped Ca3Co4O9. A high power factor allows this
material to yield a ZT of 0.41 and 0.45 at 973 K and 1073 K respectively shown in figure
66. This is a 60% increase from the Ca2.9Bi0.1Co4O9 sample doped only with bismuth
using the cation substitution method and 3 times higher than the undoped Ca3Co4O9
sample at 1073 K.

Chapter 9: Optimization of Dual doping Ca3Co4O9 by Controlling Grain Growth & Texture while Enhancing Seebeck
165
Figure 65 Temperature dependence of thermal conductivity for Ca2.9Bi0.1BauCo4O9 bismuth cation substitution and barium non-stoichiometric addition where u=0.0, 0.05,
and 0.07.
1.8
2
2.2
2.4
2.6
2.8
3
3.2
350 450 550 650 750 850 950 1050 1150
Ther
mal
Co
nd
uct
ivit
y W
/mK
Temperature K
Ca3Co4O9 Ca2.9Bi0.1Co4O9 Ca2.9Bi0.1Ba0.05Co4O9 Ca2.9Bi0.1Ba0.07Co4O9

Chapter 9: Optimization of Dual doping Ca3Co4O9 by Controlling Grain Growth & Texture while Enhancing Seebeck
166
Figure 66 Temperature dependence of figure of merit for Ca2.9Bi0.1BauCo4O9 bismuth cation substitution and barium non-stoichiometric addition where u=0.0, 0.05, and 0.07.
9.7 Summary of results for Ca3Co4O9 dual doping of bismuth cation substitution &
barium non-stoichiometric addition
The effects of dual doping Ca3Co4O9 with bismuth and barium on the electrical and
thermal properties were analyzed and reported. Powders were attained through a
combination of cationic substitution and non-stoichiometric ratios mixed through a
chemical sol-gel route. The powders were then uniaxially hot pressed and sintered to form
the polycrystalline bulk samples. The presence of bismuth at the grain causes the
electrical resistivity to decrease drastically at room temperature. Doping with barium
0.02
0.07
0.12
0.17
0.22
0.27
0.32
0.37
0.42
0.47
300 400 500 600 700 800 900 1000 1100
ZT
Temperature K
Ca3Co4O9 Ca2.9Bi0.1Co4O9 Ca2.9Bi0.1Ba0.05Co4O9 Ca2.9Bi0.1Ba0.07Co4O9

Chapter 9: Optimization of Dual doping Ca3Co4O9 by Controlling Grain Growth & Texture while Enhancing Seebeck
167
causes the resistivity to drop further and maintain their low resistivity well into the high
temperature regime. The dual doping of bismuth and barium allows the relaxation of the
commensurate alternate stacks of the CoO conductive layer and the CaCo2O3 insulating
layer causing this drastic decrease in electrical resistivity. [6]
Furthermore, the barium at the grain boundary along with the bismuth acting in
tandem as a filter to decrease the carrier mobility results in a large increase in a room
temperature Absolute Seebeck Coefficient. With the substitution of bismuth the room
temperature Absolute Seebeck Coefficient increases almost 14% from ~120 µV/K to ~140
µV/K. The synergistic effect of both at the grain boundary causes the room temperature
Absolute Seebeck Coefficient to increase 30% to ~160 µV/K. The power factor increases
when doped with bismuth and continues to increase with increasing barium up to u=0.07.
Bismuth and barium do not react at the boundary to co-segregate rather the enrichment
of barium aids in the depletion of bismuth at the boundary due to the difference in ionic
size. While bismuth’s 117 pm ionic radius tends to replace the 114 pm radius of calcium
ions in the lattice, barium, with an ionic radius of 149 pm, cannot and remains at the
boundary to enhance the Absolute Seebeck coefficient. The highest power factor
achieved is ~0.94 mWm-1K-1 at 1005 K which is one of the highest reported for doped
Ca3Co4O9. The same sample achieves a ZT of 0.45 at 1073 K.

Chapter 9: Optimization of Dual doping Ca3Co4O9 by Controlling Grain Growth & Texture while Enhancing Seebeck
168
9.8 References
1 Marat Gunes, Macit Ozenbas. Effect of grain size and porosity on phonon scattering enhancement of Ca3Co4O9. Journal of Alloys and Compounds Vol.626, pp.360-367, 2015.
2 Boyle, Cullen; Calvillo, Paulo; Chen, Yun; Barbero, Ever J.; McIntyre, Dustin. Grain boundary segregation and thermoelectric performance enhancement of bismuth doped calcium cobaltite. Journal of the European Ceramic Society 36(3):601-607 Elsevier 2016 0955-2219
3 Masashi Mikami, Kanju Chong, Yuzuru Miyazaki, Tsuyoshi Kajitani, Takahiro Inoue, Satoshi Sodeoka, and Ryoji Funahashi. Bi-Substitution effects on crystal structure and thermoelectric properties of Ca3Co4O9 single crystals. Japanese Journal of Applied Physics. Vol.45, No.5A, pp.4131-4136, 2006.
4 Live Science Staff. Facts about Bismuth. September 5, 2013.
5 Calvillo, Paulo. Chen, Yun. Boyle, Cullen. Barnes, Paul. N. Song, Xueyan. Thermoelectric performance enhancement of calcium cobaltite through barium grain boundary segregation. Inorganic Chemistry. American Chemical Society Publications. September 11, 2015.
6 Cullen Boyle, Liang Liang, Yun Chen, Jacky Prucz, Ercan Cakmak, Thomas R. Watkins, Edgar Lara-Curzio, Xueyan Song. Competing dopants grain boundary segregation and resultant Seebeck coefficient and power factor enhancement of thermoelectric calcium cobaltite ceramics. Ceramics International. Vol.43, Issue 14, pp.11523-11528, 2017.
7 Ruoming Tian, Tianshu Zhang, Dewei Chu, Richard Donelson, Li Tao, Sean Li. Enhancement of high temperature thermoelectric performance in Bi, Fe co-doped layered oxide-based material Ca3Co4O9+δ. Journal of Alloys and Compounds. Vol.615, pp.311-315, 2014.
8 Ankam Bhaskar, Z. –R. Lin, Chia-Jyi Liu. Thermoelectric properties of Ca2.95Bi0.05Co4-
xFexO9+δ (0<x<0.15). Energy Conversion and Management. Vol.76, pp.63-67, 2013.
9 Haoshan Hao, Limin Zhao, and Xing Hu. Microstructure and thermoelectric properties of Bi-and Cu-substituted Ca3Co4O9 oxides. Journal of Materials Science technology, Vol.25, pp.105-108, 2009.
10 Q. M. Lu, J. X. Zhang, Q. Y. Zhang, Y. Q. Liu, and D. M. Liu. Improved thermoelectric properties of Ca3-xBaxCo4O9 (x=0~0.4) bulks by sol-gel and SPS method. 15th International Conference of Thermoelectrics. 2006.
11 Haoshan Hao, Qinglin He, ChangQing Chen, Hongwei Sun, and Xing Hu. Textured structure and anisotropic thermoelectric properties of Ca2.7Bi0.3Co4O9 oxide prepared by conventional solid-state reaction. International Journal of Modern Physics B. Vol.23, No.1, pp.87-95, 2009.

Chapter 9: Optimization of Dual doping Ca3Co4O9 by Controlling Grain Growth & Texture while Enhancing Seebeck
169
12 Zhang Feipeng, Lu Qingmei, Li Tingxian, Zhang Xin, Zhang Jiuxing, Song Xiaoyan.
Preparation and thermoelectric transport properties of Ba-, La-, and Ag- doped Ca3Co4O9 oxide materials. Journal of Rare Earths. Vol.31, No.8, pp.778-783, 2013.
13 G. Constantinescu, Sh. Rasekh, M. A. Torres, M. A. Madre, A. Sotelo, J. C. Diez. Improvement of thermoelectric properties in Ca3Co4O9 ceramics by Ba doping. Journal of Materials Science., Vol.26, pp.3466-3473, 2015.
14 Siwen Li, Ryoji Funahashi, Ichiro Matsubara, Kazuo Ueno, Satoshi Sodeoka, and Hiroyuki Yamada. Synthesis and thermoelectric properties of the new oxide materials Ca3-xBixCo4O9+δ (0.0<x<0.75). Chemical Material, Vol.12, pp.2424-2427, 2000.
15 Zhang Feipeng, Lu Qingmei, Li Tingxian, Zhang Xin, Zhang Jiuxing, Song Xiaoyan.
16 T. Sun, H. H. Hng, Q. Y. Yan, and J. Ma. Enhanced high temperature thermoelectric properties of Bi-doped c-axis oriented Ca3Co4O9 thin films by pulsed laser deposition. Journal of Applied Physics. Vol.108, 2010.
17 Sajid Butt, Yaoyu Ren, Muhammad Umer Farooq, Bin Zhan, Rizwan ur Rahman Sagar, Yuanhua Lin, Ce-Web Nan. Enhanced thermoelectric performance of heavy-metals (M: Ba, Pb) doped misfit-layered ceramics: (Ca2-xMxCoO3)0.62 (CoO2). Energy Conversion and Management. Vol.83, pp.35-41, 2014.
18 Guangkun Ren, Jinle Lan, Chengcheng Zeng, Yaochun Liu, Bin Zhan, Sajid Butt, Yuan-Hua Lin, and Ce-Wen Nan. High performance oxides-based thermoelectric materials. Journal of Minerals, Metals & Materials Society. Vol.67, No.1, pp.211-221, 2015.
19 C. S. Huang, F. P. Zhang, X. Zhang, Q.M. Lu, J. X. Zhang, Z. Y. Liu. Enhanced thermoelectric figure of merit through electrical and thermal transport modulation by dual-doping and texture modulating for Ca3Co4O9+δ oxide materials. Journal of Alloys and Compounds. Vol.687, pp.87-94, 2016.
20 Zi-Hua Wu, Hua-Qing Xie, and Yong-Biao Zhai. Preparation and thermoelectric properties of co-doped ZnO synthesized by sol-gel. Journal of Nanoscience and nanotechnology. Vol.15, pp.3147-3150, 2015.

Chapter 10: Conclusion and Suggestions for Future Work
170
Chapter 10:
Conclusion and Suggestions for Future Work
10.1 Conclusion
To achieve a high efficiency in a thermoelectric material one must first find a way
to decouple the two electrical properties. These properties are the electrical resistivity and
the Absolute Seebeck Coefficient. Furthermore, according to the Wiedemann-Franz Law,
the thermal conductivity is inversely proportional to these as well. [1,2,3] As the electrical
resistivity is enhanced the thermal conductivity suffers. The literature made mention of a
Phonon Glass Electron Crystal (PGEC) theory stating that there is potential to create a
material that will simulate the phonon capabilities of a glass while carrying out the
electrical properties of a perfect crystal. [4,5] Scientist have yet to find the perfect PGEC.
The work in this dissertation shows great promise for the field of oxides as
thermoelectric material. Mainly since the decoupling of the electrical properties has been
achieved with great results and repeated through more than one different chemistry. It
has proven that the electrical conductivity and the Absolute Seebeck Coefficient can be
manipulated separately in order to enhance both. It is still uncertain how to intently
manipulate the thermal conductivity without directly lowering its density. Although, varying
pressing parameters proved to be successful in lowering thermal conductivity without
adversely affecting the electrical properties.
The two main new avenues of exploration utilized to achieve these results have
been through non-stoichiometric addition and the dual doping of Ca3Co4O9 in order to

Chapter 10: Conclusion and Suggestions for Future Work
171
engineer the grain boundary while fine tuning the electrical resistivity. In doing so there is
more control over where the dopant will deposit itself and how it will act to improve upon
the electrical properties, micro-, and nanostructures of the bulk samples based on the
properties of the dopant.
Chapter 3 demonstrates the Absolute Seebeck coefficient enhancement through
bismuth telluride. Chapter 4 detailed the ability to isolate the bismuth to dope the
Ca3Co4O9 with successful results of enhancing the Absolute Seebeck coefficient to ~150
µV/K at 315 K. Bismuth deposits into the lattice to improve crystal texture and grain
alignment causing a reduction in electrical resistivity while its presence at the grain
boundary allows for enhancement of the Absolute Seebeck coefficient. Prior to this
research the best figure of merit for bismuth cation substitution was reported by Ruomin
Tian, et al. with a value of 0.29 at 973 K. Through a sol-gel method and conventional
pressing and sintering it has now been enhanced to a value of 0.42 at 973 and 1073 K a
45% increase.
A non-stoichiometric approach was used in chapter 5 to dope the Ca3Co4O9 in
order to investigate whether the electrical properties can be further improved through this
alternative method. Processing parameters were also varied in order to control the pellet’s
density and obtain the optimum conditions for its thermal conductivity and to balance the
carrier mobility and concentration and achieve the best electrical properties. A figure of
merit of 0.52 at 973 and 1073 K was achieved for the Ca3Bi0.3Co4O9 chemistry pressed
at 0.75 GPa with a temperature of 423 K. Considering there has been no reports on the
non-stoichiometric addition method, comparing it to the cation substitution of bismuth
instead demonstrates an 80% increase at 973 K.
Chapter 10: Conclusion and Suggestions for Future Work
172
In order to further analyze the grain boundary segregation experienced in the
bismuth sets, barium was used to dope the Ca3Co4O9 in chapter 6 with this same non-
stoichiometric addition method. The motivation was to investigate a dopant that does not
have the ability to replace calcium deficiencies and deposits at the grain interior only. This
chemistry, like the last two, was also successful in enhancing the room temperature
Absolute Seebeck coefficient. Barium allowed for a higher saturation level than that of the
bismuth non-stoichiometric chemistry achieving a value of ~160 µV/K at 315 K. In
addition, barium, with its semi-conductor-like behavior, also aids in crystal texture
development improving grain alignment and connectivity allowing for very promising
electrical properties. A high power factor of 0.82 mW/mK2 at 315 K and 0.84 mW/mK2 at
910 K was achieved with a chemistry of Ca3Ba0.05Co4O9.
Dual doping the Ca3Co4O9 structure with bismuth and barium allowed for great
control over the electrical properties. The chemistry utilizing the cation substitution and
non-stoichiometric addition in tandem yielded a high power factor of 0.94 mW/mK2 at high
temperatures with the Ca2.9Bi0.1Ba0.07Co4O9 chemistry. Bismuth’s presence in the lattice
improved the crystal texture of the Ca3Co4O9 bulk sample by improving grain alignment
and connectivity along with triggering the grain growth. Bismuth’s presence at the grain
boundary enhanced the Absolute Seebeck coefficient at room temperature and the further
doping of barium continued to improve on the grain boundary segregation reaching a
value of ~165 µV/K at 315 K. There was no co-segregation at the boundary rather the
increasing presence of barium depleted the bismuth’s content at the boundary due to the
difference in ionic size. This can be seen in the progression of the microstructure
development illustrated in figure 67.

Chapter 10: Conclusion and Suggestions for Future Work
173
Figure 67 Microstructure development of undoped Ca3Co4O9, Ca2.7Bi0.3Co4O9, Ca3Ba0.05Co4O9, and Ca2.9Bi0.1Ba0.07Co4O9.
Figure 68 shows the comparison of the temperature dependence of the four best
power factors taken from this dissertation. This allows the direct comparison between the
doping of the Ca3Co4O9 with bismuth using the cation substitution and non-stoichiometric
addition methods shown in image a) and b). Due to bismuth’s unique ability to deposit
into the lattice in place of calcium vacancies and at the grain boundary, the non-
stoichiometric addition proves to be the more efficient method of the two. The cation
substitution method comes close to but never actually cresting a power factor of 1
mW/mK2 and maintains a consistent value of around 0.8 mW/mK2 through all temperature
ranges. The non-stoichiometric method reaches a power factor of 1.3 mW/mK2 at low
temperatures and maintains a value above 0.9 mW/mK2 through all temperature ranges.
The Ca3Co4O9 doped with barium utilizing the non-stoichiometric addition method
shown in image c) has a very similar trend to the bismuth cation substitution. It yields a
consistent trend with a value of around 0.8 mW/mK2 through all temperature ranges. The

Chapter 10: Conclusion and Suggestions for Future Work
174
dual doping of these two elements was not as straightforward as combining the best two
chemistries, along with the best two methods. Bismuth utilized the cation substitution
method so when barium enriched the grain boundaries bismuth was able to replace the
calcium vacancies thus reducing the chances of an over doped scenario. Ca3Co4O9
doped with bismuth cation substitution and barium non-stoichiometric addiction is shown
in image d) of figure 68. Although its highest power factor does not surpass that of the
bismuth non-stoichiometric addition alone, at low temperatures, it achieves similar values
throughout the rest of the temperature spectrum.

Chapter 10: Conclusion and Suggestions for Future Work
175
Figure 68 Comparisons of temperature dependence of power factor between a) Ca2.8Bi0.2Co4O9, b) Ca3Bi0.3Co4O9, c) Ca3Ba0.05Co4O9, and d) Ca2.9Bi0.1Ba0.07Co4O9.
Figure 69 shows the comparison of the temperature dependence of the four best
figure of merits taken from this dissertation. Image a) and b) show the direct comparison
of figure of merits between the Ca3Co4O9 doping of bismuth utilizing the cation
substitution and non-stoichiometric addition methods. Image b) shows an improvement
of figure of merit, from 0.42 in image a) to 0.45 in b), by using the non-stoichiometric
addition method. Both values were measured at 1073 K. This is further improved to 0.52
at 1073 K by varying the pressing parameters from 1 GPa to 0.75 GPa.

Chapter 10: Conclusion and Suggestions for Future Work
176
The Ca3Co4O9 doped with barium utilizing the non-stoichiometric addition method
shown in image c) was able to match this figure of merit with a value of 0.53 at 1073 K.
Although the dual doped set did not surpass the figure of merit of either the bismuth or
barium individual non-stoichiometric addition sets, due to its electrical results it holds
great promise. The bulk sample’s density caused the material to have a fairly large
thermal conductivity limiting its figure of merit to 0.45 at 1073 K.
Figure 69 Comparisons of temperature dependence of figure of merit between a) Ca2.8Bi0.2Co4O9, b) Ca3Bi0.3Co4O9, c) Ca3Ba0.05Co4O9, and d) Ca2.9Bi0.1Ba0.07Co4O9.
Chapter 10: Conclusion and Suggestions for Future Work
177
10.2 Suggestions for future work
This work leaves great hope within this specific field and topic. It motivates in the
search for other dopants that can potentially segregate at the boundary as bismuth and
barium both have already shown. It opens the door to finding a dopant that can hopefully
enhance the Absolute Seebeck coefficient beyond what barium has already done at low
temperatures and possibly allow it to exceed barium’s results at high temperatures. With
the ability of dual doping there is hope to continue to treat the electrical resistivity and
Absolute Seebeck coefficient as two separate entities when looking to alter their
properties. The next step for the optimal chemistry involved with the dual doping of
Ca3Co4O9 would be to vary the pressing parameters as was performed in chapter 5 in
regards to the bismuth non-stoichiometric addition chemistry set. By attempting to
maintain or improve the electrical properties there is the possibility of experiencing a
significant drop in thermal conductivity in the same way Ca3Bi0.3Co4O9 did, in order to
enhance its ZT above its already impressive value of 0.45 at 1073 K.
Although the electrical resistivities in this work have demonstrated very low values
there is always hope for further enhancement. This coupled with a high Absolute Seebeck
coefficient will yield a promising power factor. Lastly, learning how better to lower the
thermal conductivity without negatively effecting these electrical properties will continue
to aid in ZT enhancement. As the Wiedemann-Franz Law states as long as the lattice
thermal conductivity is lowered the electrical properties should have minimal effect on its
results. [1, 2, 3] This gives hope for this last parameter, the thermal conductivity, to help
achieve a desirable figure of merit. One that can allow this material to be used on a large
scale.

Chapter 10: Conclusion and Suggestions for Future Work
178
10.3 References
1 Guodong Tang, Wenchao Yang, Jianfeng Wen, Zhuangchun Wu, Cang Fan, zhihe Wang. Ultralow thermal conductivity and thermoelectric properties of carbon nanotubes doped Ca3Co4O9+δ. Ceramics International 41, pp. 961-965. September 15, 2014.
2 S. Demirel, E. Altin, E. Oz, S. Altin, A. Bayri. An enhancement ZT and spin state transition of Ca3Co4O9 with Pb doping. Journal of Alloys and Compounds 627, pp. 430-437, December 27, 2014.
3 A. Sotelo, F. M. Costa, N. M. Ferreira, A. Kovalevsky, M. C. Ferro, V. S. Amaral, J. S. Amaral, Sh. Rasekh, M. A. Torres, M. A. Madre, J. C. Diez. Tailoring Ca3Co4O9 microstructure and performances using a transient liquid phase sintering additive. Journal of the European Ceramic Society 36, pp. 1025-1032, November 30, 2015.
4 Materials Science. Division of Engineering & Applied Science. California Institute of Technology. 2017.
5 Chong Xiao, Jie Xu, Boxiao Cao, Kun Li, Mingguang Kong, and Yi Xie. Solid-solutioned homojunction nanoplates with disordered lattice: A promising approach toward “Phonon Glass Electron Crystal” thermoelectric materials. Journal of the American Chemical Society 134, pp. 7971-7977, April 23, 2012.

179
Publications
1. Cullen Boyle, Paulo Cavillo, Yun Chen, Ever J. Barbero, Dustin McIntyre, Xueyan
Song, “Grain Boundary Segregation and Thermoelectric Performance
Enhancement of Bismuth Doped Calcium Cobaltite”, Journal of the European
Ceramic Society, Vol. 36, Issue 3 (2016)-pp.601-607
2. Paulo Cavillo, Yun Chen, Cullen Boyle, Paul N. Barnes, and Xueyan Song,
“Thermoelectric Performance Enhancement of Calcium Cobaltite through Barium
Grain Boundary Segregation”, Inorganic Chemistry, 54 (2015) 9027-9032
3. Cullen Boyle, Liang Liang, Yun Chen, Jacky Prucz, Ercan Cakmak, Thomas R.
Watkins, Edgar Lara-Curzio, and Xueyan Song, “Competing Dopants Grain
Boundary Segregation and Resultant Seebeck Coefficient and Power Factor
Enhancement of Thermoelectric Calcium Cobaltite Ceramics”, Ceramics
International, (2017)
4. Cullen Boyle, Liang Liang, Cesar-Octavio Romo-De-La-Cruz, Robert Johnson,
Yun Chen, Jacky Prucz, Ercan Cakmak, Thomas R. Watkins, Edgar Lara-Curzio,
Xueyan Song, “Improving Thermoelectric Performance and Thermal Stability of
Ca3Co4O9 Ceramics through Sintering in Oxygen Atmosphere” (submitted)