enhanced nitrogen loss by eddy-induced vertical transport ... · the eastern tropical south pacific...
TRANSCRIPT

RESEARCH ARTICLE
Enhanced Nitrogen Loss by Eddy-Induced
Vertical Transport in the Offshore Peruvian
Oxygen Minimum Zone
Cameron M. Callbeck1*, Gaute Lavik1, Lothar Stramma2, Marcel M. M. Kuypers1, Laura
A. Bristow1
1 Department of Biogeochemistry, Max Planck Institute for Marine Microbiology, Bremen, Bremen, Germany,
2 Department of Physical Oceanography, GEOMAR Helmholtz Centre for Ocean Research Kiel, Schleswig-
Holstein, Germany
Abstract
The eastern tropical South Pacific (ETSP) upwelling region is one of the ocean’s largest
sinks of fixed nitrogen, which is lost as N2 via the anaerobic processes of anammox and
denitrification. One-third of nitrogen loss occurs in productive shelf waters stimulated by
organic matter export as a result of eastern boundary upwelling. Offshore, nitrogen loss
rates are lower, but due to its sheer size this area accounts for ~70% of ETSP nitrogen loss.
How nitrogen loss and primary production are regulated in the offshore ETSP region where
coastal upwelling is less influential remains unclear. Mesoscale eddies, ubiquitous in the
ETSP region, have been suggested to enhance vertical nutrient transport and thereby regu-
late primary productivity and hence organic matter export. Here, we investigated the impact
of mesoscale eddies on anammox and denitrification activity using 15N-labelled in situ incu-
bation experiments. Anammox was shown to be the dominant nitrogen loss process, but
varied across the eddy, whereas denitrification was below detection at all stations. Ana-
mmox rates at the eddy periphery were greater than at the center. Similarly, depth-inte-
grated chlorophyll paralleled anammox activity, increasing at the periphery relative to the
eddy center; suggestive of enhanced organic matter export along the periphery supporting
nitrogen loss. This can be attributed to enhanced vertical nutrient transport caused by an
eddy-driven submesoscale mechanism operating at the eddy periphery. In the ETSP region,
the widespread distribution of eddies and the large heterogeneity observed in anammox
rates from a compilation of stations suggests that eddy-driven vertical nutrient transport
may regulate offshore primary production and thereby nitrogen loss.
Introduction
Oceanic oxygen minimum zones (OMZ) typically occur in regions where upwelling of nutri-
ent rich waters fuels high surface primary productivity. The resulting export of organic matter
stimulates microbial respiration, and combined with poor regional ventilation creates low
PLOS ONE | DOI:10.1371/journal.pone.0170059 January 25, 2017 1 / 18
a1111111111
a1111111111
a1111111111
a1111111111
a1111111111
OPENACCESS
Citation: Callbeck CM, Lavik G, Stramma L,
Kuypers MMM, Bristow LA (2017) Enhanced
Nitrogen Loss by Eddy-Induced Vertical Transport
in the Offshore Peruvian Oxygen Minimum Zone.
PLoS ONE 12(1): e0170059. doi:10.1371/journal.
pone.0170059
Editor: Yiguo Hong, CAS, CHINA
Received: May 18, 2016
Accepted: December 28, 2016
Published: January 25, 2017
Copyright: © 2017 Callbeck et al. This is an open
access article distributed under the terms of the
Creative Commons Attribution License, which
permits unrestricted use, distribution, and
reproduction in any medium, provided the original
author and source are credited.
Data Availability Statement: Data are available
from the Pangaea database. CTD data https://doi.
pangaea.de/10.1594/pangaea.830245; Nutrient
data https://doi.pangaea.de/10.1594/pangaea.
857751; ADCP (horizontal velocities) data https://
doi.pangaea.de/10.1594/PANGAEA.861861;
Nitrogen loss rate measurement data https://doi.
pangaea.de/10.1594/PANGAEA.870514.
Funding: CMC, GL, LS, MMMK, LAB: DFG-funded
Sonderforschungsbereich 754 “Climate-
Biogeochemistry Interactions in the Tropical
Ocean” (www.sfb754.de); CMC, GL, MMMK, LAB:

oxygen concentrations [1]. Traditionally OMZ boundaries are defined by oxygen concentra-
tions of less than 20 μM [2], although, oxygen is regularly observed to be< 10 nM in these
regions [3, 4]. Under low oxygen concentrations the anaerobic processes anammox and deni-
trification contribute to nitrogen loss. Specifically, the former catalyzes the anaerobic oxidation
of ammonium with nitrite, while the latter is the stepwise reduction of nitrate to N2. An esti-
mated 30–50% of oceanic nitrogen loss occurs in OMZs, which represent roughly 0.1% of the
global ocean volume [5]. These regions are primarily located within the Arabian Sea, the Bay
of Bengal, off the coast of Namibia, the Eastern Tropical North Pacific, and the Eastern Tropi-
cal South Pacific (ETSP) [6]. In the majority of OMZ studies, anammox has been shown to be
the main sink of fixed inorganic nitrogen (NO3-, NO2
- and NH4+) [7–12]. The main source of
inorganic nitrogen substrates for anammox comes from the remineralization of organic matter
exported from the photic zone [13]. Based on in situ rate measurements, anammox activity is
strongest over the upper shelf where the input of organic matter is highest [8, 9, 13]. Therefore,
organic matter supply places constraints on nitrogen loss [13], which has been attributed to
coastal upwelling [1].
The offshore OMZ (defined as>600m water depth following Kalvelage et al., [13]), despite
having lower volumetric anammox rates (by an order of magnitude), accounts for two-thirds
of ETSP nitrogen loss [13]. These rates are heterogeneous and not evenly distributed across
the offshore ETSP region [13]. Consequently, there must be other mechanisms regulating
nitrogen loss and potentially export production in the offshore OMZ [14], where coastal
Ekman driven upwelling and the breaking of internal waves is less influential [15]. The most
compelling suggestion is mesoscale eddies, which occur at a large-scale (50–200 km diameter),
can persist for relatively long time periods (weeks to months), and are ubiquitous in the
marine environment [16–18].
Eddies mediate vertical advective transport of nutrients by Ekman and nonlinear Ekman
mechanisms. Ekman transport is primarily driven by the eddy-wind interaction and is stron-
gest in the eddy center [19, 20]. There are three main types of mesoscale eddies which can be
characterized by their isopycnal displacements and the direction of Ekman-driven transport in
the eddy center (Fig 1). In cyclonic eddies Ekman transport produces downwelling. In anticy-
clonic and anticyclonic mode-water eddies this generates upwelling [20–22], these two eddy
types are distinguished by their differences in isopycnal displacements. In contrast, nonlinear
Ekman transport is driven by the horizontal velocity of the eddy, and operates along density
fronts located on the eddy periphery, which is consistent across all eddy types [15, 17] (Fig 1).
Nonlinear Ekman transport is also termed submesoscale transport, because it occurs at scales
ranging from 0.1 to 10 km. In effect both Ekman and submesoscale vertical transport processes
bring nutrients from mid-depths up to sunlit surface waters [23], stimulating primary produc-
tion. Ekman upwelling within anticyclonic mode-water eddies has been used as a mechanism
to explain massive phytoplankton blooms reported in the North Atlantic and elsewhere [24,
25]. Eddy-induced enhancement of chlorophyll concentrations at the eddy periphery as a
result of submesoscale processes has also been observed [26–28]. Comparing the two vertical
pumping mechanisms, submesoscale velocities operating on the eddy periphery can reach 10–
100 m d-1, several orders of magnitude larger than velocities driven by Ekman transport occur-
ring in the eddy center (0.1–0.4 cm d-1) [24, 29, 30]. Additionally, submesoscale processes can
act to transport particulate organic carbon and oxygen downwards below the surface mixed
layer, referred to as subduction [15, 20, 31–33] and this has recently been suggested to play a
pivotal role in the ocean carbon pump [32]. Eddies are common throughout all major OMZs
[34, 35], but the extent of their regulation over regional chlorophyll and the impact of this on
nitrogen loss processes remains understudied.
Enhanced Nitrogen Loss by Eddy-Induced Vertical Transport
PLOS ONE | DOI:10.1371/journal.pone.0170059 January 25, 2017 2 / 18
Max Planck Society (www.mpg.de); CMC: Natural
Sciences and Engineering Research Council of
Canada (www.nserc-crsng.gc.ca). The funders had
no role in study design, data collection and
analysis, decision to publish, or preparation of the
manuscript.
Competing Interests: The authors have declared
that no competing interests exist.
To date, only a few studies have investigated the effect of eddies on nitrogen cycling pro-
cesses in OMZs. These studies have used time-integrated records of nitrogen loss, such as
natural abundance N-isotopes [14, 36], the nitrogen deficit (N�) [14, 37], and nitrite concen-
trations [36, 37]. All methods show signatures indicative of enhanced nitrogen loss and ele-
vated chlorophyll, in the center of anticyclonic mode-water eddies, and this is referred to as
the ‘hotspot’ theory [14, 36–38]. However, the current ‘hotspot’ theory is debated, because it
assumes these chemical signatures originated and were intensified by the eddy, as a result of
central Ekman upwelling [14, 36, 37]. This theory is contested, as it does not consider the eddy
formation history and exchange with surrounding water bodies [39]. A study tracking the
development of a coastal anticyclonic eddy in the ETSP region found that the eddy naturally
entraps coastal water signatures, including coastally derived N� [39]. As the eddy continued
developing, the signature was enhanced overtime by eddy-induced horizontal advective trans-
port, in effect pulling coastally derived N� inwards towards its center [39]. Given that the
coastal N� is typically higher than offshore waters [13], as the eddy propagated away from the
coast it retained an elevated coastal signature offshore [20, 39]. Thomsen et al., [39] highlight
that the accumulated biogeochemical signal preserves a record of water mass history, but does
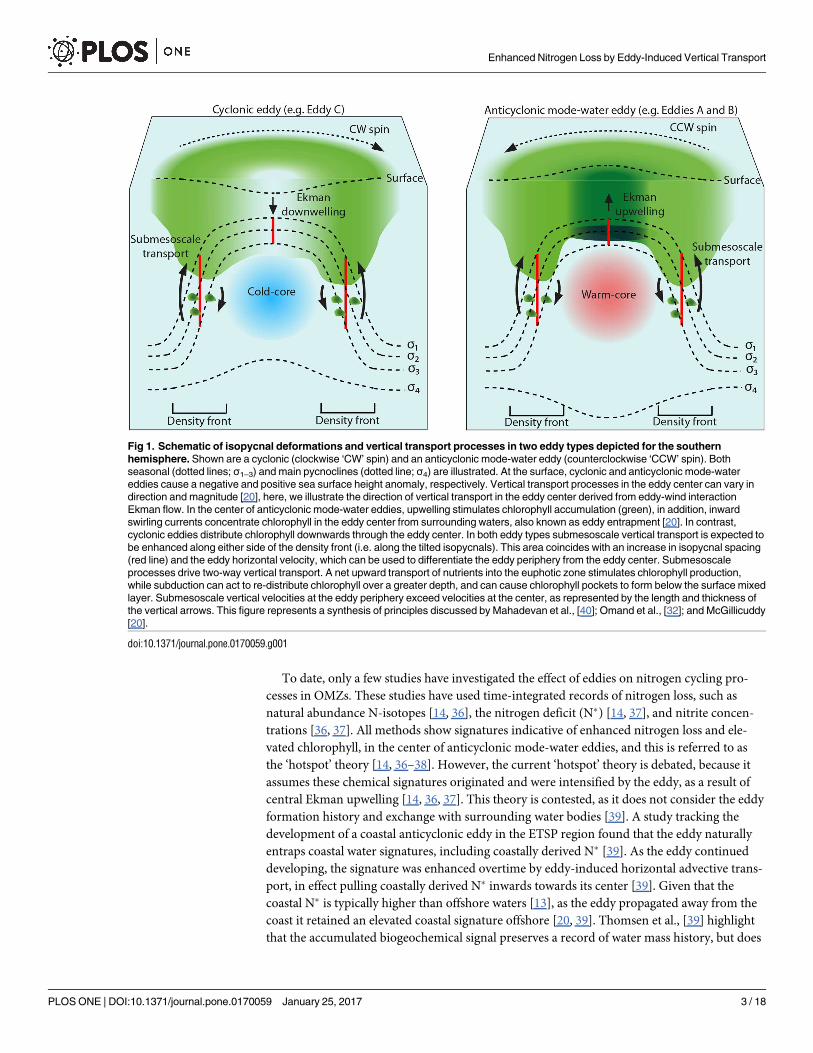
Fig 1. Schematic of isopycnal deformations and vertical transport processes in two eddy types depicted for the southern
hemisphere. Shown are a cyclonic (clockwise ‘CW’ spin) and an anticyclonic mode-water eddy (counterclockwise ‘CCW’ spin). Both
seasonal (dotted lines; σ1–3) and main pycnoclines (dotted line; σ4) are illustrated. At the surface, cyclonic and anticyclonic mode-water
eddies cause a negative and positive sea surface height anomaly, respectively. Vertical transport processes in the eddy center can vary in
direction and magnitude [20], here, we illustrate the direction of vertical transport in the eddy center derived from eddy-wind interaction
Ekman flow. In the center of anticyclonic mode-water eddies, upwelling stimulates chlorophyll accumulation (green), in addition, inward
swirling currents concentrate chlorophyll in the eddy center from surrounding waters, also known as eddy entrapment [20]. In contrast,
cyclonic eddies distribute chlorophyll downwards through the eddy center. In both eddy types submesoscale vertical transport is expected to
be enhanced along either side of the density front (i.e. along the tilted isopycnals). This area coincides with an increase in isopycnal spacing
(red line) and the eddy horizontal velocity, which can be used to differentiate the eddy periphery from the eddy center. Submesoscale
processes drive two-way vertical transport. A net upward transport of nutrients into the euphotic zone stimulates chlorophyll production,
while subduction can act to re-distribute chlorophyll over a greater depth, and can cause chlorophyll pockets to form below the surface mixed
layer. Submesoscale vertical velocities at the eddy periphery exceed velocities at the center, as represented by the length and thickness of
the vertical arrows. This figure represents a synthesis of principles discussed by Mahadevan et al., [40]; Omand et al., [32]; and McGillicuddy
[20].
doi:10.1371/journal.pone.0170059.g001
Enhanced Nitrogen Loss by Eddy-Induced Vertical Transport
PLOS ONE | DOI:10.1371/journal.pone.0170059 January 25, 2017 3 / 18
not necessarily indicate the presence of ongoing nitrogen loss activity. Likewise, the chloro-
phyll hotspot observed in anticyclonic mode-water eddies in the ETSP region and elsewhere,
conventionally attributed to stimulation induced by central Ekman upwelling [24], could alter-
natively have accumulated in the eddy center as a result of inward horizontal transport [15,
40]. In contrast, recent studies outside of OMZs highlight that the most prevalent nutrient
replenishment, and thereby stimulant of primary productivity, is occurring on the eddy
periphery due to submesoscale dynamics [15, 26, 40–42].
We investigated the spatial distribution of nitrogen loss rates and chlorophyll across meso-
scale eddies in the ETSP region. Specifically, we attempt to better resolve which vertical trans-
port mechanisms regulate nitrogen loss and chlorophyll concentrations within eddies. In this
study we provide the first in situ rate measurements of nitrogen loss across an eddy. Our analy-
sis further expands our understanding of system wide patterns of offshore chlorophyll and the
regulation of nitrogen loss as a result of the widespread distribution of eddies in the ETSP
region.
Results and Discussion
Eddy hydrodynamics and station definition
During the M90 research cruise in November 2012, eddies A, B and C, were readily observable
from satellite sea surface height altimetry (SSHA), and were sampled along the 16.45˚S transect
(Fig 2A). Eddies A, B and C extended vertically from surface waters down to between 600–950
m depth [37]. At the time of sampling, eddy A was still forming over the upper shelf, whereas
eddies B and C were detached from the coast and had propagated westward. Based on satellite
altimetry tracking, eddy A was the youngest, followed by eddies C and B at 2, 3 and 5 months
old, respectively [37]. Eddies A and B, based on isopycnal profiles were by definition anticy-
clonic mode-water eddies because they had uplifted seasonal pycnoclines and depressed main
pycnoclines, whereas eddy C was cyclonic because it had upward shoaling of both seasonal
and main pycnoclines ([24]; Figs 1 and 2B).
We define the location of our stations within the eddy according to two characteristic fea-
tures: horizontal velocities for transects across individual eddies, and isopycnal spacing for sys-
tem wide trends. 1) Horizontal velocities induced by the eddy vary across its diameter.
Inherently, the center of the eddy has low or near-stagnant horizontal velocities that increase
moving away in either direction from the center (Fig 2B). Horizontal velocities eventually
peak and then decrease at the outer limits of the eddy. Generally, the center exhibits flat isopyc-
nals that begin to tilt moving away in either direction from the center. The tilting of the isopyc-
nals, otherwise referred to as the density front, coincides with an increase in eddy horizontal
velocity (Fig 1). Unless specified we use the terms, “center” to describe the area of the eddy
having the lowest horizontal velocity, and “periphery” referring broadly to the density front,
which also coincides with higher eddy horizontal velocities. 2) For the analysis of system-wide
trends, and specifically when horizontal velocity data was unavailable, stations were instead
located according to the isopycnal spacing, following a similar concept as Strass [42]. In princi-
ple, on either side of each density front, isopycnals begin to flatten; notably, the center charac-
teristically exhibits a smaller distance between individual isopycnals than the eddy periphery
(Fig 1). Thereby, isopycnal spacing can be used to determine the relative location of sampled
stations within an eddy (i.e. periphery versus center). Here, we use reference isopycnals, 25.4
and 26.0 kg m-3, to calculate isopycnal spacing. Isopycnals 25.4 and 26.0 kg m-3 located near
the surface and oxycline, respectively, were chosen because they were representative of uplifted
seasonal pycnoclines in eddies A, B and C (Fig 2B).
Enhanced Nitrogen Loss by Eddy-Induced Vertical Transport
PLOS ONE | DOI:10.1371/journal.pone.0170059 January 25, 2017 4 / 18
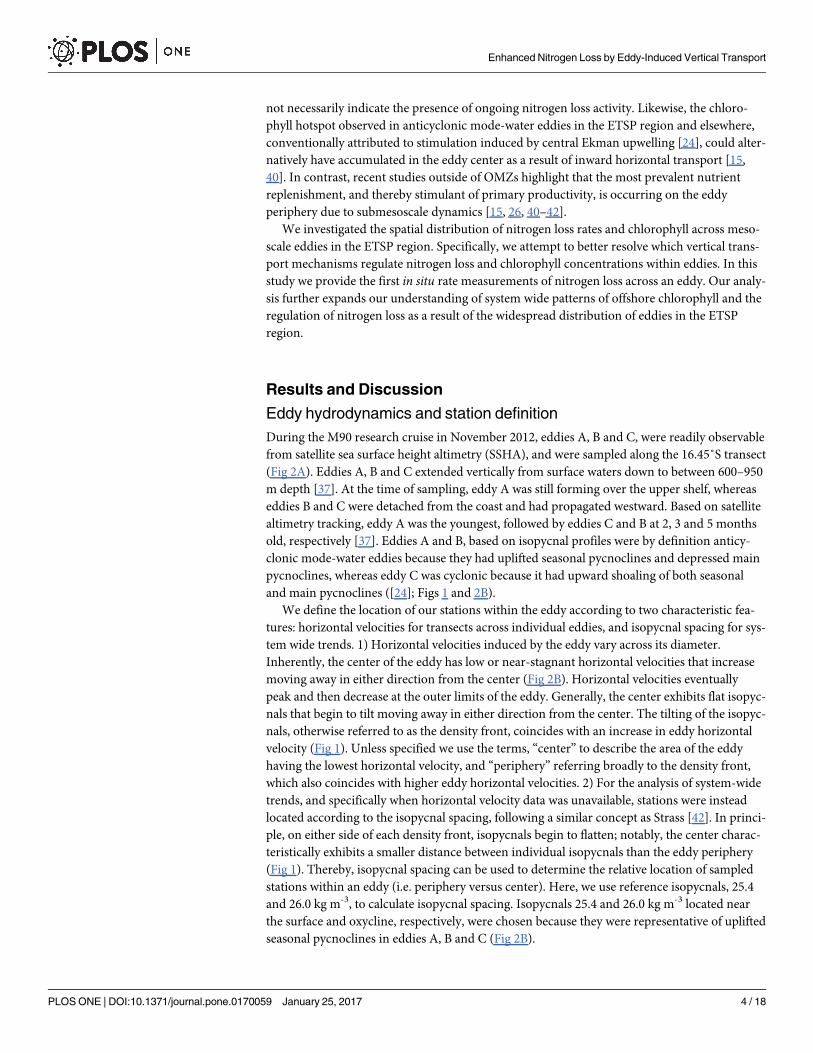
Fig 2. Distribution of anammox activity across eddies A, B and C in the ETSP region. (A) Sea surface height altimetry
(SSHA) of sampled eddies A, B and C during the M90 cruise, November 22nd, 2012. The approximate locations of sampled
stations within the eddy are shown, please note that the eddies propagated westward over the sampling period. Stations
sampled for nutrients only (open circles) and nutrients plus nitrogen loss rates (open triangles with station numbers) are
indicated. The red and blue dotted lines indicate transects sampled across eddies A, B and C, note that three defined
transects were performed across eddy A (T1a/b in blue and T2 in red). Transects shown in panels B-D represent red dotted
lines, whereas additional transects T1a (blue) are shown in S2–S3 Figs. (B) Horizontal velocity depth profiles are adapted
from Stramma et al., [37]. Isopycnal contours are indicated by black lines, while reference isopycnals 25.4 and 26.0 kg m-3 are
highlighted by black dotted lines. (C, D) Indicate volumetric and depth-integrated anammox rates for 15N-NH4+ experiments.
Enhanced Nitrogen Loss by Eddy-Induced Vertical Transport
PLOS ONE | DOI:10.1371/journal.pone.0170059 January 25, 2017 5 / 18

Distribution of chemical parameters
Eddies A, B and C penetrated vertically through the OMZ core, which was observed between
100 and 500 m depths, using a cutoff of 20 μM oxygen (S1 Fig). These eddies had a distinct
effect on the distribution of oxygen and nutrients (originally discussed by Stramma et al.,
[37]). For cyclonic eddy C, the center, had undetectable nitrite concentrations and an N� of
-17 μM (S2 Fig). Chlorophyll concentrations were between 2–2.5 μg L-1 from 20 to 40 m
depth, and oxygen concentrations were notably high, reaching more than 5 μM in the center
from 200–350 m depth (S2–S4 Figs). At the periphery, chlorophyll concentrations were slightly
lower (0.5–2 μg L-1) relative to the center, however, chlorophyll had a deeper penetration
(down to 150 m) through the water column along the density front (S3 Fig). Increases in
nitrite, N�, and a decrease in oxygen were observed moving away from the center along the
density front. Furthermore, elevated concentrations and low oxygen waters (<3 μM) were
observed over a larger depth range relative to the center. At the periphery, N� and nitrite con-
centrations were most pronounced, with values reaching -40 μM and 11 μM, respectively.
Here it is important to note that these parameters (N� and nitrite concentrations) are tradi-
tionally thought of as chemical signatures of active nitrogen loss, but it has been shown that no
quantitative correlation exists between them and ongoing nitrogen loss activity [8, 13, 43]. For
eddy C, Stramma et al., [37] attributed the increase in nitrite and N� occurring along the
periphery to an impinging anticyclonic eddy (seen in Fig 2A). An alternative interpretation is
that strong upward directed transport of nutrients along the density front stimulated primary
productivity, in agreement with modeling studies [40, 41]. The enhanced organic matter sup-
ply and subsequent remineralization decreased oxygen concentrations, and could potentially
promote nitrogen loss activity.
For anticyclonic mode-water eddies A and B, nutrient and oxygen distributions across the
eddy differed relative to eddy C. The center of eddy A had oxygen concentrations less than
3 μM between 140 and 400 m depth and a maximum chlorophyll concentration of 6.1 μg L-1 at
50 m depth (S2 and S3 Figs; Stramma et al., [37]). For eddy B, the maximum chlorophyll con-
centration was half that (2.5 μg L-1) of eddy A (S3 Fig), and oxygen-depleted (<3 μM) waters
at the center were observed between 200 and 400 m depth (S1 and S2 Figs; [37]). N� and nitrite
concentrations were most pronounced in the centers of eddies A and B, a strong contrast to
eddy C (S2 Fig; [37]). Eddies A and B, exhibited a strong N� between 175–250 m depth of
-30 μM, and nitrite concentrations up to 8 μM (S2 Fig). Moving away from the center of eddies
A and B there was a decrease in nitrite and N�concentrations, as well as an increase in oxygen
concentrations, indicating an opposite cross-eddy pattern between sampled cyclonic and anti-
cyclonic mode-water eddies. Maximum chlorophyll concentrations also decreased moving
towards the periphery, however, chlorophyll was distributed over a larger depth range, with
lateral intrusions and/or deep penetrating pockets of chlorophyll being observed along the
density front (S3 Fig; [37]). Similar features, occurring along the eddy periphery, have been
observed in anticyclonic eddies in the North Atlantic, which were indicative of eddy-induced
peripheral submesoscale transport processes [32]. In the study by Omand et al., [32] submesos-
cale vertical transport resulted in over half of the springtime bloom being exported below the
Error bars for depth-integrated anammox rates represent the standard error. BD indicates below the limit of detection.
Stations numbered in red (B0, B1, C0, and A0) were sampled in or near the eddy center while stations with black numbers
(C3, C2, C1, and A1) were sampled on the eddy periphery, identified according to eddy-induced horizontal velocities, density
fronts, and SSHA, shown in panels a and b. Note that the center of eddy C, based on SSHA and supported by horizontal
velocities, is at -16.25˚N, -80.38˚E 14 km northeast of station C0. Note that data from station C2 is not included in the transect
profiles shown in panel B (indicated by (C2)), but is shown in panels C, D. The coastal upwelling station is indicated by ‘A2’.
The vertical black dotted lines in panels C and D indicate the edge of the respective eddies.
doi:10.1371/journal.pone.0170059.g002
Enhanced Nitrogen Loss by Eddy-Induced Vertical Transport
PLOS ONE | DOI:10.1371/journal.pone.0170059 January 25, 2017 6 / 18

surface mixed layer. Subducted chlorophyll in eddies A and B along the periphery could be
considered evidence of active submesoscale driven transport, which may directly supply
organic matter for nitrogen loss processes in the OMZ. Moreover in the ETSP region and else-
where, submesoscale processes have been shown to introduce oxygen below the surface mixed
layer [32, 33]. Consequently this could potentially fuel microaerobic activity that has been
shown to be an important process in supplying ammonium for anammox bacteria [44].
Distribution of nitrogen loss rates
To determine anammox and denitrification activity across each eddy we performed incubation
experiments with 15N-NH4+ and 15N-NO2
- additions. Denitrification was below detection at
all of the stations, which is in line with previous studies in the ETSP region, which have shown
denitrification rates to be highly patchy [45]. Anammox activity dominated at the sampled sta-
tions, which is consistent with previous studies, suggesting anammox as the main microbial
nitrogen loss pathway in the ETSP region [9, 13]. Volumetric anammox rates from the two
incubation experiments were generally comparable to each other (S1 Fig). Over depth, the
highest volumetric anammox rates generally corresponded with both N� and nitrite maxi-
mums, which also corresponded to the depths just below where oxygen dropped below 20 μM.
Our volumetric anammox rates for two offshore stations and eddies A, B and C ranged from
below detection to 8 nM N d-1, and for the coastal station ranged from below detection to 57
nM N d-1 (S1 Fig). These are comparable to previously reported anammox rates for coastal
and offshore OMZ environments [9–13, 45]. Moreover, our volumetric rates followed the
same longitudinal trend as Kalvelage et al., [13] indicating highest anammox activity over the
shelf followed by a decrease of an order of magnitude at offshore stations. Although these volu-
metric rates are lower in the offshore OMZ, they exhibit large variability that is not related to
the distance from the shelf [13].
To compare anammox activity across each eddy we will focus on the maximal volumetric
and depth-integrated rates observed at each station, based on 15N-NH4+ incubations. For
cyclonic eddy C, rates of anammox activity varied across the eddy transect, in total four sta-
tions were available for comparison. The center station (C0), which had the lowest horizontal
velocity of the four stations, had non-detectable anammox activity (Fig 2C). The remaining
three stations were sampled along the density front. The second (C1) and third (C2) closest
stations to the center, located nearest to the highest horizontal velocity had anammox rates up
to 1.55 and 1.71 nM N d-1 at 150 m depth. At the station furthest from the center (C3), activity
increased to 2.11 nM N d-1, and had consistently high rates of 1.75 to 2.11 nM N d-1 between
100 and 200 m depth; this station corresponded to the outer edge of the density front where
horizontal velocities began to decrease. The same trend is further highlighted when looking at
the depth-integrated anammox rates, where we observed a transition from lowest to highest
anammox rates moving from the center towards the periphery of the eddy, 0.00 to 0.53 ± 0.04
mmol N m-2 d-1 (Fig 2D). These findings indicate a tendency for anammox activity to increase
moving away from the center across the eddy density front, and towards higher horizontal
velocities.
For anticyclonic mode-water near-coastal eddy A volumetric anammox rates increased
from 4.95 ± 0.50 nM N d-1 to 5.97 ± 0.50 nM N d-1, moving from the eddy center towards the
periphery (Fig 2C), suggesting no across-eddy differences. However, depth-integrated ana-
mmox rates show a pattern identical to that of eddy C with lower activity in the eddy center
(0.86 ± 0.05 mmol N m-2 d-1) relative to the periphery (1.12 ± 0.04 mmol N m-2 d-1; Fig 2D).
Elevated anammox activity at the periphery coincided with the strongest horizontal velocities
(Fig 2B). Anticyclonic mode-water eddy B, the weakest of the eddies based on its horizontal
Enhanced Nitrogen Loss by Eddy-Induced Vertical Transport
PLOS ONE | DOI:10.1371/journal.pone.0170059 January 25, 2017 7 / 18

velocity, had nitrogen loss rates up to 3.04 nM N d-1, at two stations in close proximity to the
eddy center (Fig 2B and 2C). With only center stations available it was not possible to deter-
mine if anammox rates were higher at the eddy periphery as observed for eddies A and C.
Though, depth-integrated anammox activity in the center of eddy B was similar to that of an
offshore station sampled at the same longitude (0.30 ± 0.02 and 0.39 ± 0.05 mmol N m-2 d-1
respectively, Fig 2D). This is notable, because the center of eddy B has previously been sug-
gested as a ‘hotspot’ for nitrogen loss due to its elevated concentrations of N� and nitrite [37],
but the direct measurements of ongoing activity measured here seem to disagree with this, as
anammox rates were not higher in the center of eddy B.
The centers of cyclonic and anticyclonic mode-water eddies exhibited differences not only
in nitrogen loss activity but also in nutrients. For cyclonic eddy C, anammox activity, nitrite,
N�, and chlorophyll were lower at the center compared to the centers of eddies A and B. This
difference in activity and nutrient distributions between eddies could potentially be explained
by the direction of Ekman driven vertical transport at the eddy center. Anticyclonic mode-
water eddies which produce upwelling would be expected to generate higher primary produc-
tion and thereby higher organic matter export in the center than cyclonic eddies which drive
nutrient downwelling [24]. Enhanced organic matter export could have fueled higher ana-
mmox activity in the centers of anticyclonic mode-water eddies A and B compared to cyclonic
eddy C. Moreover, in eddy C, downwelling of oxygenated waters may have ventilated the eddy
center, which could explain why oxygen concentrations never fell below 5 μM, while in eddies
A and B concentrations were generally below the detection limit (3 μM). Recent studies quan-
tifying the oxygen sensitivity of anammox have found 50% inhibition concentrations of 1 to
~10 μM oxygen [46, 47], which could be a potential explanation of why lower anammox activ-
ity was observed in the center of eddy C. Thus we suggest that the direction of Ekman driven
vertical transport in the center plays a role in regulating nitrogen loss by controlling export
production and oxygen supply.
While rates of nitrogen loss in the centers of eddies A and B were moderate, they were
lower or comparable to rates observed at the periphery or other offshore stations, despite hav-
ing elevated chlorophyll, N� and nitrite concentrations [37]. To date these enhanced chemical
signatures of nitrogen loss (N�, nitrite concentrations and natural abundance N-isotopes) have
been the basis for the hotspot theory, proposing Ekman upwelling as the main driver of nitro-
gen loss at the eddy center [14, 36, 37, 48]. However, as a consequence of how eddies form,
mixing with adjacent waters could explain the majority of the nutrient and low oxygen con-
centrations. Indeed, salinity characteristics in the centers of eddies A and B were of a similar
range to values measured for the coastal Peruvian-Chilean undercurrent (PCUC), ranging
between 34.8–35.9 from 50 to 200 m water depth [37]. The coastal PCUC waters can vary in
terms of nutrient chemistry, but generally have concentrations of nitrite, N�, and chlorophyll
ranging between 6–9 μM, -25-28 μM, >6 μg L-1, respectively [13, 37, 39], as well as oxygen
concentrations below 10 nM [3]. Conserved nutrient chemistry and salinity characteristics
between the centers of eddies A and B and the PCUC would suggest that nutrients in the cen-
ters of eddies A and B originated from the coast. A similar finding was reported for another
anticyclonic eddy occurring in the same region tracked over its formation history [39]. Thom-
sen et al [39], showed snapshots of nutrient concentrations before, during and after the eddy
formation to reveal increasing nitrite and N� concentrations in the eddy center and decreasing
oxygen over this period. After formation the eddy center had comparable nutrient concentra-
tions to the PCUC. Moreover nutrient gradients (nitrate, nitrite and oxygen) formed along iso-
pycnals between the eddy and the coast, diagnostic of eddy-induced horizontal advection [39].
In the ETSP region eddy-induced horizontal advection of coastal nutrients and productivity
offshore lowers the overall productivity of the coastal upwelling region [49].
Enhanced Nitrogen Loss by Eddy-Induced Vertical Transport
PLOS ONE | DOI:10.1371/journal.pone.0170059 January 25, 2017 8 / 18
Contrary to the hotspot theory, our findings show that nitrogen loss activity at the periph-
ery of eddies A and C is greater than activity at the eddy center (Fig 2). For eddy C, the increase
in anammox activity along the periphery was also paralleled by increases in nitrite, N�, and
chlorophyll as well as a decrease in oxygen concentrations [37]. Moreover, N2O, an intermedi-
ate of the denitrification pathway accumulated on the periphery of eddies A, B and C [38]. In
high-resolution eddy models the periphery is the site of enhanced vertical nutrient replenish-
ment, which by far exceeds vertical transport velocities induced by Ekman upwelling in the
eddy center [15, 40]. The horizontal velocity of the eddy drives submesoscale transport that is
predicted to occur along either side of the density front [15, 17]. Given that nitrogen loss is
correlated with organic matter export [13], our nitrogen loss rates support the idea that for
eddies A, and C the periphery is an important site supporting primary productivity and a sup-
ply of organic matter, which as a whole is driven by submesoscale transport, a previously
unrecognized process regulating nitrogen loss.
Large-scale trends: correlation of chlorophyll with eddy isopycnal
spacing
Isopycnal spacing, as previously mentioned, can be used to determine the relative position
within an eddy (Fig 1). In general, isopycnal spacing is smallest at the eddy center and
increases moving away in either direction along the density front (i.e. towards the eddy periph-
ery; Fig 1). Thereby, we can use the relationship between isopycnal spacing and chlorophyll to
identify patterns across an eddy. Additionally, isopycnal spacing conveys the approximate dis-
tance from the coast (plotted verses longitude in Fig 3A). Stations related to eddies A, B, and C
group successively along this trend line with coastal and offshore stations found at either longi-
tudinal extreme (R = 0.91, p < 0.05). This relationship with isopycnal spacing therefore pro-
vides an approximate location of the eddy across the longitudinal transect and the position
within an eddy i.e. center vs. periphery.
In high-resolution chlorophyll profiles, mesopelagic intrusions and deep pockets can be
seen extending into the surface mixed layer of all eddies, often occurring along the density
front [37] (S3 Fig). Therefore, chlorophyll was depth-integrated at each station because of its
broad vertical distribution. For offshore eddies C and B; depth-integrated chlorophyll was pos-
itively correlated with isopycnal spacing (Fig 3B; eddy C, R = 0.74, p< 0.05; eddy B, R = 0.67,
p< 0.05). Interestingly, if we include in our analysis a range of offshore stations sampled
along undefined transects past eddy B (Fig 3: grey circles), we find offshore stations produce a
similar pattern to eddy C and B, signifying higher overall chlorophyll content with increasing
isopycnal spacing (R = 0.87, p< 0.05). A different pattern emerged for the coastal anticyclonic
mode-water eddy A, where no relationship was found between depth-integrated chlorophyll
and isopycnal spacing. In other words no distinct pattern was observed in eddy A as stations
grouped tightly together indicating that chlorophyll was evenly distributed across both the
periphery and center of the mesoscale eddy (Fig 3B). Given the proximity of eddy A to the
coast and our current understanding of horizontal advection induced by eddies [39], the lack
of discernible difference in chlorophyll across eddy A could be ascribed to a masking effect
caused by coastal-derived chlorophyll.
Plotting depth-integrated chlorophyll as a function of distance from the center of eddies A,
B and C, based on SSHA also reveals depth-integrated chlorophyll to increase at the eddy
periphery (S4 Fig; R = 0.50, p< 0.05). Notably, however, SSHA is not necessarily congruent
with the subsurface properties of the eddy including the eddy horizontal velocity or isopycnal
spacing [37, 39]. Arguably the more robust and less subjective method is to analyze depth-inte-
grated chlorophyll as a function of isopycnal spacing. The finding of enhanced chlorophyll
Enhanced Nitrogen Loss by Eddy-Induced Vertical Transport
PLOS ONE | DOI:10.1371/journal.pone.0170059 January 25, 2017 9 / 18

Fig 3. Relationship between isopycnal spacing and chlorophyll. (A) Correlation of isopycnal spacing
versus longitude for eddies A (green), B (blue), and C (red), alongside coastal upwelling stations (orange) and
offshore stations extending past eddy B (grey). (B) Correlation of isopycnal spacing versus depth-integrated
chlorophyll. Chlorophyll at all stations was depth-integrated down to 300 m depth, except for coastal stations
which were depth-integrated down to 200 m. Dotted linear regression lines indicate eddy specific trends (RC =
eddy C, RB = eddy B and Roff = offshore). Pearson correlation values are indicated in each panel (p-values).
doi:10.1371/journal.pone.0170059.g003
Enhanced Nitrogen Loss by Eddy-Induced Vertical Transport
PLOS ONE | DOI:10.1371/journal.pone.0170059 January 25, 2017 10 / 18

along the density front in this study (Fig 3 and S4 Fig), is also in agreement with high-resolu-
tion modeling studies, which demonstrate that submesoscale dynamics operate non-uniformly
along the eddy density front creating pockets of upwelling and subduction [15, 17, 30, 40, 41].
An observational study by Strass, [42] has shown in a 2000 km transect across the North Atlan-
tic a tendency for higher chlorophyll along the eddy density front where isopycnal spacing was
largest and conversely lower chlorophyll concentrations when spacing was smallest. Evidence
in this study indicates that peripheral chlorophyll extends deeper into the OMZ than at the
center, as demonstrated by the appearance of lateral intrusions and deep chlorophyll pockets
observed in eddy transect profiles ([37]; S3 Fig). Submesoscale processes may likewise play an
important role in actively supplying organic matter in the offshore OMZ [33].
In addition to the coastally derived chlorophyll background (e.g. eddy C versus eddy A) our
data further suggests that submesoscale peripheral processes have the potential to generate
new chlorophyll. If we use chlorophyll as a proxy for primary production, then enhanced
organic matter at the periphery, exported as either sinking particles or by subduction, could
fuel measured anammox activity (Fig 3 and S3 Fig). Unfortunately, there is insufficient data
available to perform a similar comparison of isopycnal spacing with depth-integrated ana-
mmox rates. Nevertheless, the relationship of chlorophyll with isopycnal spacing established
over a large number of offshore stations, including stations sampled along undefined transects
past eddy B is intriguing (Fig 3B). Why this holds could be attributed to the ubiquity of meso-
scale eddies and submesoscale fronts, which have been shown to cause enhanced vertical trans-
port in ETSP waters [33]. The combination of these processes, and their influence over vertical
transport, could strongly regulate the distribution of chlorophyll in the ETSP region and
thereby microbial nitrogen loss processes.
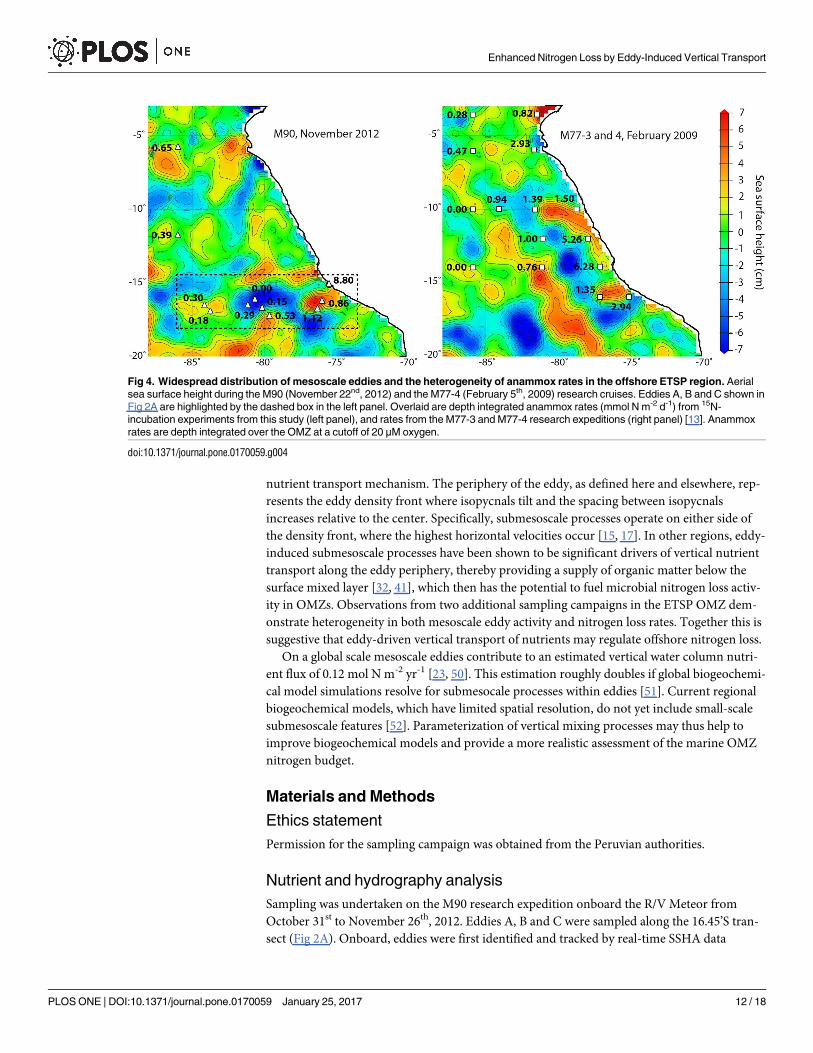
Aerial sea surface height analysis highlights the widespread distribution of mesoscale eddies
in the ETSP region. If we overlay depth-integrated anammox rates over sea surface height for
stations sampled across eddies A, B and C, we find that nitrogen loss is heterogeneous (Fig 4).
Similar heterogeneity in both nitrogen loss rates and the distribution of eddies was observed in
previous ETSP sampling campaigns in January and February 2009 (Fig 4; M77-3 and -4; [13]),
suggesting that eddies may drive much of the vertical nutrient transport and thereby primary
productivity in the offshore OMZ. Previous studies in the ETSP region and elsewhere have
shown that submesoscale transport is an important process, not only fueling enhanced pri-
mary productivity [40, 41], but also contributing to the subduction of organic matter below
the surface mixed layer [32, 33]. Based on our findings we suggest that eddy-driven submesos-
cale vertical transport of nutrients and organic matter may be a major regulator of offshore
ETSP nitrogen loss, which by volume represents the largest regional sink of fixed nitrogen.
Summary and Conclusions
In this study we provide the first rate measurements of nitrogen loss processes across cyclonic
and anticyclonic mode-water eddies in the ETSP. Contrary to the recent ‘hotspot’ studies,
which have suggested that the highest activity occurs in the eddy center [14, 36–38, 48], our15N-labelling incubation experiments revealed that nitrogen loss activity was greatest at the
periphery of mesoscale eddies. Although, highest chlorophyll concentrations were observed in
the center [37], depth-integrated chlorophyll content was also highest at the eddy periphery.
The observed lateral intrusions and deep chlorophyll pockets occurring along the eddy periph-
ery [37], suggest that this area of the eddy was active in the generation and export of organic
matter, in agreement with modeling studies [40, 41].
Our findings, which indicate enhanced anammox activity and chlorophyll along the eddy
periphery, appear to be consistent with these features being regulated by a submesoscale
Enhanced Nitrogen Loss by Eddy-Induced Vertical Transport
PLOS ONE | DOI:10.1371/journal.pone.0170059 January 25, 2017 11 / 18
nutrient transport mechanism. The periphery of the eddy, as defined here and elsewhere, rep-
resents the eddy density front where isopycnals tilt and the spacing between isopycnals
increases relative to the center. Specifically, submesoscale processes operate on either side of
the density front, where the highest horizontal velocities occur [15, 17]. In other regions, eddy-
induced submesoscale processes have been shown to be significant drivers of vertical nutrient
transport along the eddy periphery, thereby providing a supply of organic matter below the
surface mixed layer [32, 41], which then has the potential to fuel microbial nitrogen loss activ-
ity in OMZs. Observations from two additional sampling campaigns in the ETSP OMZ dem-
onstrate heterogeneity in both mesoscale eddy activity and nitrogen loss rates. Together this is
suggestive that eddy-driven vertical transport of nutrients may regulate offshore nitrogen loss.
On a global scale mesoscale eddies contribute to an estimated vertical water column nutri-
ent flux of 0.12 mol N m-2 yr-1 [23, 50]. This estimation roughly doubles if global biogeochemi-
cal model simulations resolve for submesocale processes within eddies [51]. Current regional
biogeochemical models, which have limited spatial resolution, do not yet include small-scale
submesoscale features [52]. Parameterization of vertical mixing processes may thus help to
improve biogeochemical models and provide a more realistic assessment of the marine OMZ
nitrogen budget.
Materials and Methods
Ethics statement
Permission for the sampling campaign was obtained from the Peruvian authorities.
Nutrient and hydrography analysis
Sampling was undertaken on the M90 research expedition onboard the R/V Meteor from
October 31st to November 26th, 2012. Eddies A, B and C were sampled along the 16.45’S tran-
sect (Fig 2A). Onboard, eddies were first identified and tracked by real-time SSHA data
Fig 4. Widespread distribution of mesoscale eddies and the heterogeneity of anammox rates in the offshore ETSP region. Aerial
sea surface height during the M90 (November 22nd, 2012) and the M77-4 (February 5th, 2009) research cruises. Eddies A, B and C shown in
Fig 2A are highlighted by the dashed box in the left panel. Overlaid are depth integrated anammox rates (mmol N m-2 d-1) from 15N-
incubation experiments from this study (left panel), and rates from the M77-3 and M77-4 research expeditions (right panel) [13]. Anammox
rates are depth integrated over the OMZ at a cutoff of 20 μM oxygen.
doi:10.1371/journal.pone.0170059.g004
Enhanced Nitrogen Loss by Eddy-Induced Vertical Transport
PLOS ONE | DOI:10.1371/journal.pone.0170059 January 25, 2017 12 / 18

obtained from AVISO satellite altimetry. Transects through these eddies were made according
to SSHA data. Horizontal velocities of the eddy were measured by acoustic Doppler current
profiling (ADCP). A 75 and 38 kHz ADCP systems measured velocities down to 700 and 1200
m depth, respectively, detailed by Stramma et al., [37]. In this study we define eddy boundaries
according to ADCP profiles and not specifically by SSHA.
Complete details of methods used to measure and analyze eddy nutrient chemistry are
described elsewhere [37]. Briefly, a Seabird CTD-rosette equipped with 10L Niskin bottles was
used to sample waters at depth. Chlorophyll, temperature, salinity, and oxygen were recorded
by CTD sensors on both up and down casts. The oxygen sensor was calibrated by Winkler
titration [53], with a detection limit of approximately 3 μM. Chlorophyll was calibrated
according to the company specifications, with sensitivity down to 0.025 μg L-1. No shipboard
chlorophyll calibration was applied, because of this, Stramma et al., [37] note that absolute
numbers may have uncertainties; nevertheless, gradient trends observed across the eddy are
accurate. Nutrient samples were taken to measure nitrate, nitrite, and phosphate onboard by a
QuAAtro auto-analyzer (Seal Analytical), with precisions of ± 0.1 μmol L-1, ± 0.1 μmol L-1,
and ± 0.02 μmol L-1, respectively. The N�, commonly used as a general measure of nitrogen
loss, estimates from a given water mass chemistry the deviation of inorganic nitrogen pools
from Redfield stoichiometry, was calculated according to the following equation N� = (NO3- +
NO2-) − 16PO4
3- (originally defined by [54], later modified by [14, 37]).
15N incubation experiments
In situ 15N-labelling incubation experiments were performed according to Holtappels et al.,
[55]. In brief, waters were sampled directly from the Niskin bottle into 250 mL glass serum
bottles. Bottles were overflowed 2–3 times their volume and sealed headspace free with a butyl
rubber stopper, that had been stored under helium for 2 days prior to use, to avoid oxygen
contamination. Once filled, glass serum bottles were stored at in situ temperature in the dark
until all depths were sampled. Each serum bottle was purged for a total of 15 min with helium;15N-labeled isotopes were added with a gas-tight syringe after 5 min of purging to allow mix-
ing. The experiments included the following additions: exp1: 15N-NO2- + 14N-NH4
+, and
exp2: 15N-NH4+ + 14N-NO2
-. The concentration of added substrates was 5 μM. After degas-
sing, exetainers (12 mL, Labco, UK) were filled off and capped headspace free. Caps were
degassed with a vacuum, followed by purging with helium three times and then stored 2–3
days before use, to reduce oxygen contamination [56]. Samples were incubated in the dark at
in situ temperature. Exetainers were terminated at 0, 6, 12, 24 and 48 hours with 100 μL HgCl2
after inserting a 2 mL helium headspace. Terminated samples were stored in the dark at ambi-
ent temperature cap side down until further processing.
Isotope products 14N15N and 15N15N were measured by a gas-chromatography isotope-
ratio mass spectrometer (GC-IRMS; VG Optima, Manchester, UK). The rates of N2 produc-
tion from 15N-NH4+ and 15N-NO2
- incubation experiments were determined from the slope
of the linear regression as a function of time. Anammox and denitrification rates were calcu-
lated according to the equations of Thamdrup and Dalsgaard, [57]. A t-test was used to deter-
mine whether rates were significantly different from zero (p< 0.05). Detection limits were
estimated from the median of the standard error of the slope, multiplied by the t-value for
p = 0.05, thus the detection limits for anammox were 0.68 and 0.66 nM N d-1 for 15N-NH4+
and 15N-NO2- incubation experiments, respectively. The majority of our analysis is based on
the 15N-NH4+ incubations, due to the potential caveats of using 15N-NO2
- to determine ana-
mmox rates; nitrogen isotope exchange between the nitrate and nitrite pools [58], and ‘nitrite
shunting’ [59].
Enhanced Nitrogen Loss by Eddy-Induced Vertical Transport
PLOS ONE | DOI:10.1371/journal.pone.0170059 January 25, 2017 13 / 18

Anammox rates were depth integrated from the base of the upper oxycline down to the bot-
tom oxycline (using an oxygen cutoff of 20 μM), analogous to depth integrated rates reported
by Kalvelage et al., [13]. At all offshore stations chlorophyll was depth-integrated down to 300
m depth, which was the deepest depth reported for anammox activity in eddies A and C. At
coastal stations chlorophyll was depth-integrated down to 200 m. Isopycnal spacing was calcu-
lated for each station by subtracting the distance between reference densities 25.4 and 26.0 kg
m-3. Pearson correlation statistics were applied to determine if relationships were significant
(p< 0.05).
Supporting Information
S1 Fig. Depth profiles of anammox activity, nutrient, and oxygen concentrations at sta-
tions sampled within eddies A, B and C, and two offshore stations. The location of stations
is indicated in Fig 2A and S1 Table. Anammox activity for 15N-NH4+ and 15N-NO2
- experi-
ments are indicated in separate panels. For stations B0 and B1 (eddy B) anammox rates from15N-NO2
- experiments were not determined. Error bars for anammox rates represent the stan-
dard error. The N-deficit was calculated according to Stramma et al., [37], see material and
methods section.
(TIF)
S2 Fig. Distribution of oxygen, N�, and nutrients across eddies A, B and C in the ETSP
region. The cross eddy transects are shown in Fig 2A. Note that both oxygen, N�, and nutri-
ents transects of eddy A are indicated (see Fig 2A for transect stations: T1a (blue dotted lines)
and T2 (red dotted lines)). Stations numbered in red (B0, B1, C0, and A0) were sampled in the
eddy center while stations with black numbers (C3, C2, C1, and A1) were sampled on the eddy
periphery, identified according to eddy-induced horizontal velocities and density fronts,
shown in Fig 2. Note that data from station C2 is not included in the transect profiles shown
(indicated by (C2)). The coastal upwelling station is indicated by ‘A2’. The vertical black dotted
lines in panels A-D represent the outer periphery of the respective eddies. Data shown is
adapted from Stramma et al., [37].
(TIF)
S3 Fig. Distribution of chlorophyll across eddies A, B and C in the ETSP region. The cross
eddy transects are shown in Fig 2A. Note that both chlorophyll transects of eddy A are indi-
cated (see Fig 2A for transect stations: T1a (blue dotted lines) and T2 (red dotted lines)). Sta-
tions numbered in red (B0, B1, C0, and A0) were sampled in the eddy center while stations
with black numbers (C3, C2, C1, and A1) were sampled on the eddy periphery, identified
according to eddy-induced horizontal velocities and density fronts, shown in Fig 2. Note that
data from station C2 is not included in the transect profiles shown (indicated by (C2)). The
coastal upwelling station is indicated by ‘A2’. The vertical black dotted lines in each panel rep-
resent the outer periphery of the respective eddies. Data shown is adapted from Stramma et al.,
[37].
(TIF)
S4 Fig. Distribution of depth-integrated chlorophyll across eddies A, B and C in the ETSP
region based on satellite sea surface height altimetry (SSHA). (A) Aerial SSHA snapshot of
eddies A, B and C. The eddy center is marked by the red cross, determined based on SSHA
and the stations indicated are the same stations as those used in Fig 3 (offshore stations are not
included). Note that eddy A is subdivided into three distinct transects (T1a/b and T2), with
transects 1 and 2 having a different eddy center (red cross) as the transects were sampled
approximately 5 days apart, and the eddy had propagated westward during this time. (B)
Enhanced Nitrogen Loss by Eddy-Induced Vertical Transport
PLOS ONE | DOI:10.1371/journal.pone.0170059 January 25, 2017 14 / 18
Depth-integrated chlorophyll plotted as a function of distance from the eddy center. Depth-
integrated chlorophyll of stations located a similar distance from the center (±2 km) were aver-
aged, as indicated by the error bars (the standard error is shown). The overlaid dotted lines
indicate the average depth-integrated chlorophyll for the eddy center, periphery and outside
the eddy. Chlorophyll at all stations was depth-integrated down to 300 m depth, except for
coastal stations which were depth-integrated down to 200 m. Plotting depth-integrated chloro-
phyll in panel B as a function of distance from the eddy center for all eddy stations (excluding
the outside eddy stations) indicates a significant positive correlation (R = 0.50, p< 0.05).
(TIF)
S1 Table. List of stations sampled for anammox rates during the M90 research cruise
November 2012.
(PDF)
Acknowledgments
We thank the Peruvian authorities for access to national waters as well as the crew of the RV
Meteor for assistance onboard the M90 research expedition as well as co-chief scientist M.
Frank. We would also like to thank C. Schelten for administrative support; technical assistance
by T. Kalvelage; proof reading of the manuscript by H. Marchant and the editor and two anon-
ymous reviewers for constructive feedback.
Author Contributions
Conceptualization: CMC GL LS MMMK LAB.
Data curation: CMC LS.
Formal analysis: CMC GL LAB.
Funding acquisition: MMMK.
Investigation: CMC.
Project administration: LS MMMK.
Resources: LS MMMK.
Supervision: GL MMMK LAB.
Visualization: CMC.
Writing – original draft: CMC.
Writing – review & editing: GL LS MMMK LAB.
References1. Karstensen J, Stramma L, Visbeck M. Oxygen minimum zones in the eastern tropical Atlantic and
Pacific oceans. Progress in Oceanography. 2008; 77(4):331–50.
2. Lam P, Kuypers MM. Microbial nitrogen cycling processes in oxygen minimum zones. Ann Rev Mar Sci.
2011; 3:317–45. doi: 10.1146/annurev-marine-120709-142814 PMID: 21329208
3. Tiano L, Garcia-Robledo E, Dalsgaard T, Devol AH, Ward BB, Ulloa O, et al. Oxygen distribution and
aerobic respiration in the north and south eastern tropical Pacific oxygen minimum zones. Deep Sea
Research Part I: Oceanographic Research Papers. 2014; 94:173–83.
Enhanced Nitrogen Loss by Eddy-Induced Vertical Transport
PLOS ONE | DOI:10.1371/journal.pone.0170059 January 25, 2017 15 / 18

4. Thamdrup B, Dalsgaard T, Revsbech NP. Widespread functional anoxia in the oxygen minimum zone
of the Eastern South Pacific. Deep Sea Research Part I: Oceanographic Research Papers. 2012;
65:36–45.
5. Codispoti LA, Brandes JA, Christensen JP, Devol AH, Naqvi SWA, Paerl HW, et al. The oceanic fixed
nitrogen and nitrous oxide budgets: Moving targets as we enter the anthropocene? Scientia Marina.
2001; 65(S2):85–105.
6. Ulloa O, Canfield DE, DeLong EF, Letelier RM, Stewart FJ. Microbial oceanography of anoxic oxygen
minimum zones. Proceedings of the National Academy of Sciences of the United States of America.
2012; 109(40):15996–6003. doi: 10.1073/pnas.1205009109 PMID: 22967509
7. Kuypers MM, Lavik G, Woebken D, Schmid M, Fuchs BM, Amann R, et al. Massive nitrogen loss from
the Benguela upwelling system through anaerobic ammonium oxidation. Proceedings of the National
Academy of Sciences of the United States of America. 2005; 102(18):6478–83. doi: 10.1073/pnas.
0502088102 PMID: 15843458
8. Jensen MM, Lam P, Revsbech NP, Nagel B, Gaye B, Jetten MS, et al. Intensive nitrogen loss over the
Omani Shelf due to anammox coupled with dissimilatory nitrite reduction to ammonium. The ISME jour-
nal. 2011; 5(10):1660–70. doi: 10.1038/ismej.2011.44 PMID: 21509044
9. Hamersley MR, Lavik G, Woebken D, Rattray JE, Lam P, Hopmans EC, et al. Anaerobic ammonium
oxidation in the Peruvian oxygen minimum zone. Limnology and Oceanography. 2007; 52(3):923–33.
10. Lam P, Lavik G, Jensen MM, van de Vossenberg J, Schmid M, Woebken D, et al. Revising the nitrogen
cycle in the Peruvian oxygen minimum zone. Proceedings of the National Academy of Sciences of the
United States of America. 2009; 106(12):4752–7. doi: 10.1073/pnas.0812444106 PMID: 19255441
11. Thamdrup B, Dalsgaard T, Jensen MM, Ulloa O, Farıas L, Escribano R. Anaerobic ammonium oxidation
in the oxygen-deficient waters off northern Chile. Limnology and Oceanography. 2006; 51(5):2145–56.
12. Galan A, Molina V, Thamdrup B, Woebken D, Lavik G, Kuypers MMM, et al. Anammox bacteria and the
anaerobic oxidation of ammonium in the oxygen minimum zone off northern Chile. Deep Sea Research
Part II: Topical Studies in Oceanography. 2009; 56(16):1021–31.
13. Kalvelage T, Lavik G, Lam P, Contreras S, Arteaga L, Loscher CR, et al. Nitrogen cycling driven by
organic matter export in the South Pacific oxygen minimum zone. Nature Geosci. 2013; 6(3):228–34.
14. Altabet MA, Ryabenko E, Stramma L, Wallace DWR, Frank M, Grasse P, et al. An eddy-stimulated hot-
spot for fixed nitrogen-loss from the Peru oxygen minimum zone. Biogeosciences. 2012; 9(12):4897–
908.
15. Mahadevan A. The impact of submesoscale physics on primary productivity of plankton. Annual Review
of Marine Science. 2016; 8(1):161–84.
16. Chelton DB, Schlax MG, Samelson RM, de Szoeke RA. Global observations of large oceanic eddies.
Geophysical Research Letters. 2007; 34(15).
17. Klein P, Lapeyre G. The oceanic vertical pump induced by mesoscale and submesoscale turbulence.
Annual Review of Marine Science. 2009; 1(1):351–75.
18. Johannessen JA, Shuchman RA, Digranes G, Lyzenga DR, Wackerman C, Johannessen OM, et al.
Coastal ocean fronts and eddies imaged with ERS 1 synthetic aperture radar. Journal of Geophysical
Research: Oceans. 1996; 101(C3):6651–67.
19. Niiler PP. On the Ekman divergence in an oceanic jet. Journal of Geophysical Research. 1969; 74
(28):7048–52.
20. McGillicuddy DJ. Mechanisms of physical-biological-biogeochemical interaction at the oceanic meso-
scale. Annual Review of Marine Science. 2016; 8(1):125–59.
21. Gaube P, Chelton DB, Samelson RM, Schlax MG, O’Neill LW. Satellite observations of mesoscale
eddy-induced Ekman pumping. Journal of Physical Oceanography. 2015; 45(1):104–32.
22. Gaube P, Chelton DB, Strutton PG, Behrenfeld MJ. Satellite observations of chlorophyll, phytoplankton
biomass, and Ekman pumping in nonlinear mesoscale eddies. Journal of Geophysical Research:
Oceans. 2013; 118(12):6349–70.
23. McGillicuddy DJ, Robinson AR, Siegel DA, Jannasch HW, Johnson R, Dickey TD, et al. Influence of
mesoscale eddies on new production in the Sargasso Sea. Nature. 1998; 394(6690):263–6.
24. McGillicuddy DJ, Anderson LA, Bates NR, Bibby T, Buesseler KO, Carlson CA, et al. Eddy/wind snter-
actions stimulate extraordinary mid-ocean plankton blooms. Science. 2007; 316(5827):1021–6. doi: 10.
1126/science.1136256 PMID: 17510363
25. Li J, Qi Y, Jing Z, Wang J. Enhancement of eddy-Ekman pumping inside anticyclonic eddies with wind-
parallel extension: Satellite observations and numerical studies in the South China Sea. Journal of
Marine Systems. 2014; 132:150–61.
Enhanced Nitrogen Loss by Eddy-Induced Vertical Transport
PLOS ONE | DOI:10.1371/journal.pone.0170059 January 25, 2017 16 / 18

26. Mizobata K, Saitoh SI, Shiomoto A, Miyamura T, Shiga N, Imai K, et al. Bering Sea cyclonic and anticy-
clonic eddies observed during summer 2000 and 2001. Progress in Oceanography. 2002; 55(1–2):65–
75.
27. Levy M, Klein P. Does the low frequency variability of mesoscale dynamics explain a part of the phyto-
plankton and zooplankton spectral variability? Proceedings of the Royal Society of London A: Mathe-
matical, Physical and Engineering Sciences. 2004; 460(2046):1673–87.
28. Kahru M, Mitchell BG, Gille ST, Hewes CD, Holm-Hansen O. Eddies enhance biological production in
the Weddell-Scotia Confluence of the Southern Ocean. Geophysical Research Letters. 2007; 34(14):
L14603.
29. Ledwell JR, McGillicuddy DJ Jr, Anderson LA. Nutrient flux into an intense deep chlorophyll layer in a
mode-water eddy. Deep Sea Research Part II: Topical Studies in Oceanography. 2008; 55(10–
13):1139–60.
30. Martin AP, Richards KJ. Mechanisms for vertical nutrient transport within a North Atlantic mesoscale
eddy. Deep Sea Research Part II: Topical Studies in Oceanography. 2001; 48(4–5):757–73.
31. Fielding S, Crisp N, Allen JT, Hartman MC, Rabe B, Roe HSJ. Mesoscale subduction at the Almeria—
Oran front: Part 2. Biophysical interactions. Journal of Marine Systems. 2001; 30(3–4):287–304.
32. Omand MM, D’Asaro EA, Lee CM, Perry MJ, Briggs N, Cetinić I, et al. Eddy-driven subduction exports
particulate organic carbon from the spring bloom. Science. 2015; 348(6231):222–5. doi: 10.1126/
science.1260062 PMID: 25814062
33. Thomsen S, Kanzow T, Colas F, Echevin V, Krahmann G, Engel A. Do submesoscale frontal processes
ventilate the oxygen minimum zone off Peru? Geophysical Research Letters. 2016; 43(15):8133–42.
34. Chaigneau A, Gizolme A, Grados C. Mesoscale eddies off Peru in altimeter records: Identification algo-
rithms and eddy spatio-temporal patterns. Progress in Oceanography. 2008; 79(2–4):106–19.
35. Chaigneau A, Eldin G, Dewitte B. Eddy activity in the four major upwelling systems from satellite altime-
try (1992–2007). Progress in Oceanography. 2009; 83(1–4):117–23.
36. Bourbonnais A, Altabet MA, Charoenpong CN, Larkum J, Hu H, Bange HW, et al. N-loss isotope effects
in the Peru oxygen minimum zone studied using a mesoscale eddy as a natural tracer experiment.
Global Biogeochemical Cycles. 2015; 29(6):793–811.
37. Stramma L, Bange HW, Czeschel R, Lorenzo A, Frank M. On the role of mesoscale eddies for the bio-
logical productivity and biogeochemistry in the eastern tropical Pacific Ocean off Peru. Biogeosciences.
2013; 10(11):7293–306.
38. Loscher CR, Bourbonnais A, Dekaezemacker J, Charoenpong CN, Altabet MA, Bange HW, et al. N2
fixation in eddies of the eastern tropical South Pacific Ocean. Biogeosciences Discuss. 2015; 13:2889–
2899.
39. Thomsen S, Kanzow T, Krahmann G, Greatbatch RJ, Dengler M, Lavik G. The formation of a subsur-
face anticyclonic eddy in the Peru-Chile Undercurrent and its impact on the near-coastal salinity, oxy-
gen, and nutrient distributions. Journal of Geophysical Research: Oceans. 2016:476–501.
40. Mahadevan A, Thomas LN, Tandon A. Comment on "Eddy/wind interactions stimulate extraordinary
mid-ocean plankton blooms". Science. 2008; 320(5875):448.
41. Brannigan L. Intense submesoscale upwelling in anticyclonic eddies. Geophysical Research Letters.
2016; 43(7): 3360–3369.
42. Strass VH. Chlorophyll patchiness caused by mesoscale upwelling at fronts. Deep Sea Research Part
A Oceanographic Research Papers. 1992; 39(1):75–96.
43. Lam P, Jensen MM, Kock A, Lettmann KA, Plancherel Y, Lavik G, et al. Origin and fate of the secondary
nitrite maximum in the Arabian Sea. Biogeosciences. 2011; 8(6):1565–77.
44. Kalvelage T, Lavik G, Jensen MM, Revsbech NP, Loscher C, Schunck H, et al. Aerobic microbial respi-
ration in oceanic oxygen minimum zones. PloS one. 2015; 10(7):e0133526. doi: 10.1371/journal.pone.
0133526 PMID: 26192623
45. Dalsgaard T, Thamdrup B, Farıas L, Revsbech NP. Anammox and denitrification in the oxygen mini-
mum zone of the eastern South Pacific. Limnology and Oceanography. 2012; 57(5):1331–46.
46. Dalsgaard T, Stewart FJ, Thamdrup B, De Brabandere L, Revsbech NP, Ulloa O, et al. Oxygen at nano-
molar levels reversibly suppresses process rates and gene expression in anammox and denitrification
in the oxygen minimum zone off northern Chile. mBio. 2014; 5(6).
47. Kalvelage T, Jensen MM, Contreras S, Revsbech NP, Lam P, Gunter M, et al. Oxygen sensitivity of
anammox and coupled N-cycle processes in oxygen minimum zones. PloS one. 2011; 6(12):e29299.
doi: 10.1371/journal.pone.0029299 PMID: 22216239
Enhanced Nitrogen Loss by Eddy-Induced Vertical Transport
PLOS ONE | DOI:10.1371/journal.pone.0170059 January 25, 2017 17 / 18

48. Arevalo-Martınez DL, Kock A, Loscher CR, Schmitz RA, Stramma L, Bange HW. Influence of meso-
scale eddies on the distribution of nitrous oxide in the eastern tropical South Pacific. Biogeosciences
Discuss. 2016; 13:1105–1118.
49. Gruber N, Lachkar Z, Frenzel H, Marchesiello P, Munnich M, McWilliams JC, et al. Eddy-induced reduc-
tion of biological production in eastern boundary upwelling systems. Nature Geosci. 2011; 4(11):787–
92.
50. McGillicuddy DJ, Anderson LA, Doney SC, Maltrud ME. Eddy-driven sources and sinks of nutrients in
the upper ocean: Results from a 0.1˚ resolution model of the North Atlantic. Global Biogeochemical
Cycles. 2003; 17(2):1035.
51. Lapeyre G, Klein P. Impact of the small-scale elongated filaments on the oceanic vertical pump. Journal
of Marine Research. 2006; 64(6):835–51.
52. Nagai T, Gruber N, Frenzel H, Lachkar Z, McWilliams JC, Plattner G-K. Dominant role of eddies and fil-
aments in the offshore transport of carbon and nutrients in the California Current System. Journal of
Geophysical Research: Oceans. 2015; 120(8):5318–41.
53. Winkler LW. Die Bestimmung des im Wasser gelosten Sauerstoffes. Berichte der deutschen che-
mischen Gesellschaft. 1888; 21(2):2843–54.
54. Gruber N, Sarmiento JL. Global patterns of marine nitrogen fixation and denitrification. Global Biogeo-
chemical Cycles. 1997; 11(2):235–66.
55. Holtappels M, Lavik G, Jensen MM, Kuypers MMM. Chapter ten—15N-labeling experiments to dis-
sect the contributions of heterotrophic denitrification and anammox to nitrogen removal in the OMZ
waters of the ocean. In: Martin GK, editor. Methods in Enzymology. Volume 486: Academic Press;
2011. p. 223–51.
56. De Brabandere L, Thamdrup B, Revsbech NP, Foadi R. A critical assessment of the occurrence and
extend of oxygen contamination during anaerobic incubations utilizing commercially available vials.
Journal of microbiological methods. 2012; 88(1):147–54. doi: 10.1016/j.mimet.2011.11.001 PMID:
22101311
57. Thamdrup B, Dalsgaard T. Production of N2 through Anaerobic ammonium oxidation coupled to nitrate
reduction in marine sediments. Applied and environmental microbiology. 2002; 68(3):1312–8. doi: 10.
1128/AEM.68.3.1312-1318.2002 PMID: 11872482
58. Brunner B, Contreras S, Lehmann MF, Matantseva O, Rollog M, Kalvelage T, et al. Nitrogen isotope
effects induced by anammox bacteria. Proceedings of the National Academy of Sciences. 2013;
110(47):18994–9.
59. De Brabandere L, Canfield DE, Dalsgaard T, Friederich GE, Revsbech NP, Ulloa O, et al. Vertical parti-
tioning of nitrogen-loss processes across the oxic-anoxic interface of an oceanic oxygen minimum
zone. Environmental microbiology. 2014; 16(10):3041–54. doi: 10.1111/1462-2920.12255 PMID:
24118779
Enhanced Nitrogen Loss by Eddy-Induced Vertical Transport
PLOS ONE | DOI:10.1371/journal.pone.0170059 January 25, 2017 18 / 18