engineering static and dynamic control of microbial
TRANSCRIPT

ENGINEERING STATIC AND DYNAMIC CONTROL OF MICROBIAL BIOSYNTHETIC
PATHWAYS IN ESCHERICHIA COLI
by
YAPING YANG
(Under the Direction of Yajun Yan)
ABSTRACT
In metabolic engineering, control of native metabolism is significant when optimizing
strains for overproduction of the desired compounds in the selected host strains. However, for
many central metabolic pathway genes, static knockout strategies result in poor cell growth and
gene expression. To address this problem, we have engineered antisense RNAs to achieve
conditionally static repression of multiple genes in fatty acid biosynthesis pathway to increase
the malonyl-CoA pool and improve the bioproduction of malonyl-CoA-derived compounds.
Inspired from naturally-existed dynamic regulatory systems, we engineered an artificial dynamic
control network to dynamically regulate the exogenous pathways and the endogenous metabolic
network in an orthogonal manner, permitting maximum utilization of carbon source.
Furthermore, we anchored this dynamic control system into the muconic acid (MA) biosynthesis
pathway to test its applicability. This research provided a proof-of concept demonstrating static
and dynamic control of the gene expression, enriched new yield optimization approvals and
supplied a theoretical basis for biosynthesis research.
INDEX WORDS: Metabolic engineering; Static control; asRNA; Dynamic control network

ENGINEERING STATIC AND DYNAMIC CONTROL OF MICROBIAL BIOSYNTHETIC
PATHWAYS IN ESCHERICHIA COLI
by
YAPING YANG
B.E., Tianjin University of Science and Technology, China, 2008
M.S., Nankai University, China, 2012
A Dissertation Submitted to the Graduate Faculty of The University of Georgia in Partial
Fulfillment of the Requirements for the Degree
DOCTOR OF PHILOSOPHY
ATHENS, GEORGIA
2017

© 2017
Yaping Yang
All Rights Reserved
ENGINEERING STATIC AND DYNAMIC CONTROL OF MICROBIAL BIOSYNTHETIC
PATHWAYS IN ESCHERICHIA COLI
by
YAPING YANG
Major Professor: Yajun Yan
Committee: William B Whitman
Williams Kisaalita
James Kastner
Electronic Version Approved:
Suzanne Barbour
Dean of the Graduate School
The University of Georgia
December 2017

iv
DEDICATION
I would like to dedicate to this dissertation to my husband Hongfei Yan and my daughter Caitlin
Y Yan.

v
ACKNOWLEDGEMENTS
I would like to express my sincere gratitude to my major professor Dr. Yajun Yan, who guides
me to form the rigorous research attitude and conducts me the most comprehensive technical
training and the in-depth brainstorming. With his profound knowledge and extreme patience, he
led me out of every research bottleneck and encouraged me to continue my research work during
my Ph.D. period. Without his guidance, this dissertation would not have been possible.
I sincerely thank my committee members, Dr. William B Whitman, Dr. Williams Kisaalita
and Dr. Jim Kastner for their guidance and encouragement in carrying out this project.
I also wish to express my gratitude to all the lab members who rendered their help during my
research.
Finally, I want to thank my family for their selfless support.

vi
TABLE OF CONTENTS
Page
ACKNOWLEDGEMENTS .................................................................................................v
LIST OF TABLES ........................................................................................................... viii
LIST OF FIGURES ........................................................................................................... ix
CHAPTER
1 INTRODUCTION .............................................................................................1
2 REGULATING MALONYL-COA METABOLISM SYNTHETIC
ANTISENSE RNAS FOR ENHANCED BIOSYNTHESIS OF NATURAL
PRODUCTS .......................................................................................................5
2.1 Abstract ..................................................................................................6
2.2 Introduction ............................................................................................6
2.3 Materials and Methods .........................................................................10
2.4 Results ..................................................................................................20
2.5 Discussion ............................................................................................31
3 ANTISENSE RNA ELEMENTS FOR DOWNREGULATINF EXPRESSION
....................................................................................................................34
3.1 Abstract ................................................................................................35
3.2 Introduction ..........................................................................................35
3.3 Materials ..............................................................................................38
3.4 Methods................................................................................................40

vii
3.5 Notes ....................................................................................................48
4 ESTABLISHMENR OF AN ARTIFICIAL DYNAMIC REGULATORY
NETWORK AND ITS APPLICATION IN METABOLIC ENGINEERING 51
4.1 Abstract ................................................................................................53
4.2 Introduction ..........................................................................................53
4.3 Methods and Materials .........................................................................57
4.4 Results ..................................................................................................63
4.5 Discussion ............................................................................................80
5 SUPPORTING INFORMATION ...................................................................82
6 CONCLUSION ................................................................................................85
REFERENCES ..................................................................................................................88

viii
LIST OF TABLES
Page
Table 2.1: Strains and plasmids used in Chapter 2 ............................................................14
Table 2.2: Effect of down-regulated fab genes on 4-hydroxycoumarin production ..........30
Table 3.1: Primer sequences for cloning and qRT-PCR analysis in chapter 3 ..................39
Table 3.2: A detailed calculation process of relative gene expression by 2−ΔΔCt method ..50
Table 4.1: Strains and plasmids used in Chapter 4 ............................................................59

ix
LIST OF FIGURES
Page
Figure 2.1: Engineering of E. coli malonyl-CoA metabolic pathways ..............................11
Figure 2.2: Interference efficiencies of asRNAs with varied loop lengths and relative
abundance ........................................................................................................22
Figure 2.3: Effects of the fabD asRNA at translational and post-transcriptional levels ....24
Figure 2.4: Intracellular concentrations of malonyl-CoA ..................................................26
Figure 2.5: Heterologous production of malonyl-CoA derived compounds with and
without the effects of asRNAs ........................................................................28
Figure 3.1: The stem-loop scaffold and asRNA interference mechanism .........................37
Figure 3.2: The plasmid construction of pZE-PT-asfabD .................................................42
Figure 4.1: The scheme of artificial dynamic regulatory network .....................................56
Figure 4.2: The scheme of applying the dynamic regulatory network to the MA
biosynthesis pathway .....................................................................................57
Figure 4.3: The schematic of promoter-regulatory system responsive to MA. .................64
Figure 4.4: Characterization of a MA-mediated promoter-regulatory system to
dynamically modulate the expression of eGFP. .............................................66
Figure 4.5: Dynamic down-regulation by integrating RNAi with the MA promoter-
regulator. .........................................................................................................68
Figure 4.6: Prototyping sensor-regulator and RNAi based dynamic control network. .....69
Figure 4.7: MA production behavior by dynamic MA biosensor mediated up-regulation

x
in wild type strain E. coli BW25113/F’. .........................................................71
Figure 4.8: MA production behavior by dynamic MA biosensor mediated down-regulation
in wild type strain E. coli BW25113/F’. ..........................................................73
Figure 4.9: Identification of cell growth-dependent genes by knocking out genes pykF,
pykF and ppc individually and combinatorically. ...........................................75
Figure 4.10: MA production behavior by dynamic MA biosensor mediated down-
regulation. ......................................................................................................76
Figure 4.11: MA production behavior by dynamic MA biosensor mediated up-regulation
……………………........................................................................................78
Figure 4.12: MA production behavior of simultaneous up- and down-regulation mediated
by dynamic MA biosensor. ............................................................................79
Figure 5.1: Development of hybrid promoters responsive to muconic acid (MA).. ..........82
Figure 5.2: The effect of CatR abundance on the PMA dynamic range ..............................83

1
CHAPTER 1
INTRODUCTION
Cellular metabolism in microbes is a tightly regulated metabolic network. By monitoring the
needs and surpluses among different metabolic pathways, microorganisms can globally control
carbon flow to maintain the cell growth in an economical and effective mode1. Further
understanding of the metabolic regulation mechanisms has enabled researchers to manipulate
and redesign the intrinsic metabolic network toward a defined objective, such as overproducing
the desired compounds2. A number of permanent genetic modification strategies have been
commonly used to improve the microbial producers, such as overexpressing rate-limiting
enzymes, deleting competing pathways and eliminating undesired endogenous regulations3-5.
While these strategies have achieved desired success, the production efficiency of microbial
producers is frequently compromised due to unexpected metabolic imbalance. For example,
maximizing the product pathway flux can drain the metabolites from the biomass synthesis to the
production of desired compounds, leading to slow growth rates. To balance metabolic pathways,
some other static fine-tuning strategies are developed by adjusting gene copy numbers, tuning
promoter strengths, changing RBS sites, optimizing operon organizations and localizing enzymes
by protein scaffolds or compartmentalization, etc5-8. Even though these strategies are proven
effective, the static control is usually manipulated for a specific condition. Any cellular and
environmental changes may influence microbial production due to the lack of dynamic response
to cellular and environmental changes9.

2
Compared with the static control, native metabolic pathways use dynamic regulatory networks
to respond to the changing psychological or environmental conditions by altering fluxes in real-
time10. Inspired by the mechanism of natural metabolism, researchers have begun to adopt
dynamic regulatory machinery to design the engineered microbes for the production of value-
added chemicals. So far, only a few successful cases has been reported. For instance, Farmer and
Liao firstly reported the development of a promoter-regulator system which can sense acetyl
phosphate, an indirect indicator of the excess glycolytic flux in E. coli11. This system could
dynamically upregulate the expression of two genes (pps and idi), allowing the carbon flux to be
rerouted to lycopene biosynthesis. Recently, Keasling et al. engineered a promoter-regulator
system which could sense the key intermediate (oleic acid) and was used to dynamically control
ethanol biosynthesis, fatty acid biosynthesis, and esterification modules, resulting in the increase
of biodiesel production in E. coli12. Similarly, Koffas et al. developed a promoter-regulator
system which could sense malonyl-CoA, a key metabolite in the fatty acid biosynthesis pathway,
to dynamically control the production of the fatty acid-derived compounds13. Conclusively, these
demonstrated applications applied a sensor regulator to control the pathway genes. When the
metabolites accumulated, they were sensed as signal to up-regulate the desired pathway genes.
These strategies have exhibited effectiveness in alleviating metabolic imbalances, however,
some limitations still exist. First, the promoter-mediated regulation systems are mono-functional,
which usually allows effective up-regulation but less efficient down-regulation. Second, the
reported dynamic regulations were limited to the pathway enzymes under the control of
responsive promoters. They cannot control the host cells’ native genes located on the
chromosome where down-regulation is needed. Additionally, the physiological changes of host
cells at the early stage of cell growth were not taken into consideration in previous dynamic

3
regulation designs. In fermentation processes, cells usually experience a lag phase after
inoculation into the fermentation media. This transitional period prepares the cells for
exponential growth. The overexpression of heterologous enzymes at an early stage of cell growth
and/or deletion of native genes frequently leads to significant growth retardation and inhibition
because engineered pathways compete with native metabolism for the limited cell resources14.
Poor cell adaption into the fermentation media may exert significant negative effects in the entire
microbial production process15. Thus, an ideal manipulation strategy is to maintain native
metabolism intact and keep exogenous pathway enzymes being turned off during the cell lag
phase, allowing host cells to adapt to the fermentation environment undisturbedly. As cells get
adapted and enter the exponential phase, we expect the expression of heterologous enzymes to be
turned up gradually to a high level and the native competing pathways to be turned down so that
maximal carbon flow is directed to the target product.
The following chapters present two cases of engineering static and dynamic control of
microbial biosynthesis pathways to enhance bioproduction in E. coli. In chapter 2, we engineered
antisense RNA strategy to achieve static repression of multiple genes in fatty acid biosynthesis
pathway to increase malonyl-CoA pool and improve malonyl-CoA based bioproduction. Based
on the robust performance of asRNA strategy in repressing gene expression, in chapter 3, we
report a standard protocol of asRNA design and provide valuable notes in the further
experimental operation to guide peer researchers. In chapter 4, we describe an artificial dynamic
control network to dynamically regulate the exogenous pathways and the endogenous metabolic
network in an orthogonal manner, permitting maximum utilization of carbon source.
Furthermore, we use the muconic acid (MA) biosynthesis pathway as a proof-of-concept
demonstration to test the applicability of such an artificial regulatory network and significantly

4
enhance the muconic acid production to 1.8 g/L, which is substantially higher than the static
controls. These chapters are relatively independent with each other. Each work includes the
design, validation and optimization of a control system to improve its applicability in the
artificial biosynthesis pathway and improve the relative bioproduction. This research provides
static and dynamic control of the gene expression, enriched new yield optimization approvals
and supplied a theoretical basis for biosynthesis research.

5
CHAPTER 21
REGULATING MALONYL-COA METABOLISM VIA SYNTHETIC ANTISENSE RNAs
FOR ENHANCED BIOSYNTHESIS OF NATURE PRODUCTS
1 Yaping Yang1, Yuheng Lin1, Lingyun Li, Robert J. Linhardt, Yajun Yan. 2015. Metabolic
Engineering. 29: 217-226.
Reprinted here with permission of the publisher.
6
2.1 Abstract
Malonyl-CoA is the building block for fatty acid biosynthesis and also a precursor to
various pharmaceutically and industrially valuable molecules, such as polyketides and
biopolymers. However, intracellular malonyl-CoA is usually maintained at low levels, which
poses great challenges to efficient microbial production of malonyl-CoA derived molecules.
Inactivation of the malonyl-CoA consumption pathway to increase its intracellular availability is
not applicable, since it is usually lethal to microorganisms. In this work, we employ synthetic
antisense RNAs (asRNAs) to conditionally down-regulate fatty acid biosynthesis and achieve
malonyl-CoA enrichment in Escherichia coli. The optimized asRNA constructs with a loop-stem
structure exhibit high interference efficiency up to 80%, leading to a 4.5-fold increase in
intracellular malonyl-CoA concentration when fabD gene expression is inhibited. Strikingly, this
strategy allows the improved production of natural products 4-hydroxycoumarin, resveratrol, and
naringenin by 2.53-, 1.70-, and 1.53-fold in E. coli, respectively. In addition, down-regulation of
other fab genes including fabH, fabB, and fabF also leads to remarkable increases in 4-
hydroxycoumarin production. This study demonstrates a novel strategy to enhance intracellular
malonyl-CoA and indicates the effectiveness of asRNA as a powerful tool for use in metabolic
engineering.
2.2 Introduction
Malonyl-CoA is a universal building block not only for fatty acid biosynthesis, but also for
the formation of a variety of natural products, such as coumarins, stilbenes, flavonoids and
tetracyclines 1, which have been broadly used as pharmaceuticals and nutraceuticals with various
health promoting effects. These compounds are usually generated as secondary metabolites in

7
plants or microorganisms by polyketide synthases (PKSs) through the repeated condensation of
various numbers of malonyl-CoA(s) to different starter molecules 17-21. For example, 4-
hydroxycoumarin, a direct precursor to the widely used anticoagulant warfarin, can be
biosynthesized through the condensation of one molecule of malonyl-CoA with salicoyl-CoA;
while the formation of naringenin (the gateway molecule to flavonoids) and resveratrol (a
representative of stilbene polyphenols) involves the condensation of three malonyl-CoA
molecules with p-coumaroyl-CoA 17-19, 22. Additionally, tetracyclines and doxorubicin, type II
polyketides functioning as potent antibiotics and anti-cancer drugs, require eight and nine
malonyl-CoA units for their biosynthesis, respectively 17, 19.
Due to the intrinsic disadvantages associated with their natural producers, such as low
productivity, low growth rate, high cultivation cost, and lack of facile genetic tools, growing
attention has been placed on developing heterologous microbial cell factories towards
economically viable production of these compounds. So far, Escherichia coli is still the most
preferred host microorganism because of its favorable fermentation properties and ease of
genetic manipulation 23. In fact, many malonyl-CoA derived natural products have been
successfully produced by metabolically engineered E. coli, such as 4-hydroxycoumarin,
resveratrol, naringenin, phloroglucinol, 7-O-methyl aromadendrin, genistein, and daidzein 17-19,
24-26. In addition, a malonyl-CoA dependent pathway has been constructed for the production of
3-hydroxyproionic acid, an industrially valuable molecule ranked among top of the platform
chemicals derived from biomass 27.
However, intracellular malonyl-CoA concentration is usually tightly regulated and maintained
at very low levels, which poses great limitation in the productivity of malonyl-CoA derived
molecules 28. Therefore, enrichment of intracellular malonyl-CoA pool is of paramount

8
importance for their efficient production. In E. coli, malonyl-CoA level is directly determined by
the balance of the upstream biosynthesis pathway and the downstream consumption pathway
towards fatty acid biosynthesis (Figure 2.1a). Previous efforts to improve malonyl-CoA
availability were mainly focused on engineering the upstream pathway, such as over-expression
of acetyl-CoA carboxylase (ACC) to increase the conversion of acetyl-CoA into malonyl-CoA 13,
29, over-expression of acetyl-CoA synthase to enhance acetyl-CoA supply, and deleting acetyl-
CoA consumption pathways involved in ethanol and acetate production 30. In contrast, few
efforts have been made in engineering the malonyl-CoA consumption pathway, since
inactivation of fatty acid biosynthesis through conventional gene knockout strategies is usually
lethal to host cells 31. Only limited attempts have been reported to use certain antibiotics to
inhibit fatty acid biosynthesis. For example, cerulenin, a specific inhibitor to the β-ketoacyl-acyl
carrier protein synthases (KAS) I and II (FabB and FabF) 32, has been employed to improve the
production of polyketides 21, 23, 33. However, the use of such antibiotics is usually very costly and,
thus, infeasible for application in large-scale production. Here we develop a powerful and
inexpensive strategy using antisense RNAs instead of antibiotics to conditionally inhibit fatty
acid biosynthesis and reduce undesired malonyl-CoA consumption to overcome this limitation.
Antisense RNAs (asRNAs) are single-stranded RNAs that can complementarily pair with their
target mRNA and inhibit gene expression 34. In plants and yeast, they have been exploited and
they exhibit bright prospects as an essential tool to make up the shortcomings of conventional
gene knockout strategies 35, 36. However, in bacteria, even though small regulatory RNAs
(srRNAs) have been reported, the application of naturally existing asRNAs on the regulation of
gene expression has been limited 37, 38. Most reports focus on the design of artificial, synthetic
asRNAs and their use in identifying functional genes 39, verifying antibacterial mechanisms 40,

9
changing antibiotic susceptibility 41, examining rate-limiting genes 42, and regulating gene
expression as a riboswitch 43. Despite these exciting achievements, only a few studies have been
reported on the metabolic engineering application of asRNAs. Lee’s group successfully screened
and utilized asRNAs to target 130 library genes, and dramatically improved tyrosine and
cadaverine production. Based on the effectiveness of the Hfq scaffold protein, this asRNA
structure was expected to be exploited as a tool to modulate gene expression in E. coli 44, 45.
Prather’s group reported the engineering of asRNAs as a metabolite valve to dynamically control
central carbon 46. Another study investigated the use of asRNA (RyhB) to improve succinate
production in E. coli 47.
In this work, we further explore and expand the application of asRNAs to target the genes and
pathways that are essential for cell viability. We employ an artificial loop-stem scaffold carrying
asRNAs and develop them as a tool for down-regulating genes involved in fatty acid
biosynthesis. Optimization of asRNA binding lengths results in high interference efficiency (up
to 80% inhibition of target gene expression). The engineered E. coli strain with fabD interfered
by its asRNA asfabD(100) shows a 4.5-fold increase in intracellular malonyl-CoA concentration.
On this basis, the biosynthetic pathways of 4-hydroxycoumarin, resveratrol, and naringenin are
introduced into the fabD-interfered strain, which leads to significant improvement in their
production. In addition, other critical genes involved in fatty acid biosynthesis fabH, fabF, fabB
are also targeted with their respective asRNAs, leading to the enhanced production of malonyl-
CoA derived 4-hydroxycoumarin as well. This work demonstrates an effective strategy to
enhance malonyl-CoA availability and suggests the great potential of asRNAs for metabolic
engineering use, especially for down-regulating the expression of those genes that are essential
for cell viability.

10
2.3 Materials and Methods
2.3.1 Experimental materials
Luria-Bertani (LB) medium was used to grow E. coli cells for plasmid construction, propagation
and inoculum preparation. The biosynthesis medium M9Y contains (per liter): glycerol (20 g),
yeast extract (5 g), NH4Cl (1 g), Na2HPO4 (6 g), KH2PO4 (3 g), NaCl (0.5 g), MgSO4·7H2O (2
mmol), CaCl2·2H2O (0.1mmol) and vitamin B1 (1.0 mg). Ampicillin (100 mg/L), kanamycin (50
mg/L), and/or chloramphenicol (34 mg/L) were added to cultures when necessary. E. coli strain
XL1-Blue was used for plasmid propagation and gene cloning; BW25113 was used as the host
strain for the biosynthesis of 4-hydroxycoumarin, resveratrol and naringenin. Plasmids pZE12-
luc, pCS27 and pSA74 are high, medium, and low-copy number plasmids employed for gene
cloning, protein expression and pathway assembly in this work 48-50. Table 2.1 lists the strains
and plasmids used in this study.
eGFP cDNA (GenBank accession number U55762) was a kind gift from Dr. Gang Cheng
group at the Chemical and Biomolecular Engineering Department of University of Akron (OH).
The cDNAs of 4CL2 from Petroselinum crispum, STS from Vitis vinifera, CHI from Medicago
sativa and CHS from Petunia hybrida were generous gifts from Dr. Koffas group at Rensselaer
Polytechnic Institute (NY) 51-55.
Phusion High-Fidelity DNA polymerase, DNase I, restriction endonucleases, Quick Ligation
Kit and Protoscript II first strand cDNA synthesis kit were purchased from New England Biolabs
(Beverly, MA, USA). Zyppy™ Plasmid Miniprep Kit, Zymoclean™ Gel DNA Recovery Kit,

11
Figure 2.1 Engineering of E. coli malonyl-CoA metabolic pathways. (a) Malonyl-CoA
metabolic networks. fabD, encoding malonyl-CoA: ACP transacylase; fabH, encoding β-

12
ketoacyl-ACP synthase III; fabB, encoding β-ketoacyl-ACP synthase I; fabF, encoding β-
ketoacyl-ACP synthase II. (b) asRNA interference mechanism. (1) Generation of mature asRNA
from DNA (2) Binding of asRNA to its target mRNA. (3) Degradation of target mRNA. (c)
malonyl-CoA fluxes into different polyketide pathways.
and DNA Clean & Concentrator™-5 were purchased from Zymo Research (Irvine, CA, USA).
PureLink RNA Mini Kit was purchased from Invitrogen (Carlsbad, CA, USA). FastStart
Universal SYBR Green Master (ROX) was purchased from Roche (Basel, Switzerland).
Malonyl-CoA, [13C3] -malonyl-CoA and p-coumaric acid, were purchased from Sigma (St.
Louis, MO, USA). 4-Hydroxycoumarin was purchased from ACROS ORGANICS (Bridgewater,
NJ, USA). Resveratrol was purchased from Tokyo Chemical Industry (Portland, OR, USA).
Naringenin was purchased from MP Biomedicals (Santa Ana, CA, USA).
2.3.2 Construction of plasmids
For the eGFP assays, to generate eGFP expression plasmids, the egfp gene was PCR-amplified
and subcloned into pZE12-luc between Acc651 and XbaI, yielding pZE-eGFP. Likewise, the
amplified egfp gene was subcloned into pCS27 and pSA74 between Acc651 and SalI, resulting
pCS-eGFP and pSA-eGFP, respectively. The fabD gene with its native RBS was PCR-amplified
from E. coli MG1655 genomic DNA to produce the DNA sequence of rfabD. The DNA
sequence of the fusion protein FabD/eGFP with fadD’s native RBS was generated by SOE-PCR
and cloned into pCS27 and pSA74 using BsiWI and BamHI, yielding pCS-RfabD/eGFP and
pSA-RfabD/eGFP, respectively. We constructed a parent plasmid pZE-PT. The PT template
13
consists of two inverted repeat DNA sequences (38 bp) termed PT1 and PT2 with a random
DNA sequence between them 34 to facilitate the construction of the plasmids used to produce
asRNAs. The random DNA sequence contains two designed restriction sites Acc651 and BamHI
to facilitate the insertion of different DNA sequences of asRNAs. The PT template was cloned
into the above two plasmids using ApoI and XbaI, yielding pZE-PT and pSA-PT, respectively, to
introduce the whole PT template into pZE12-luc and pSA74. The 100, 150, 200 and 300 bp
DNA sequences of egfp asRNAs were cloned into pZE-PT using Acc651 and BamHI, resulting
pZE-aseGFP(100), pZE-aseGFP(150), pZE-aseGFP(200) and pZE-aseGFP(300), respectively, to
generate egfp asRNA synthesis plasmids. Similarly, plasmids pSA-aseGFP(100), pSA-
aseGFP(150), pSA-aseGFP(200) and pSA-aseGFP(300) were generated by using the same
cloning strategy. The 100 and 150 bp DNA fragments of fabD asRNAs were cloned into pZE-PT
using Acc651 and BamHI, resulting pZE-asfabD(100), pZE-asfabD(150), respectively, to
generate the fabD asRNA synthesis plasmids. Similarly, plasmids pZE-asfabH(100), pZE-
asfabH(150), pZE-asfabB(100), pZE-asfabB(150), pZE-asfabF(100) and pZE-asfabF(150) were
generated by using the same cloning strategy. The asfabH(100) operon was similarly subcloned
into pZE-asfabD(100) using SpeI and SacI, yielding pZE-asfabD(100)-asfabH(100).
For 4-hydroxycoumarin biosynthesis, the DNA fragments entC-pchB and pqsD-sdgA were
amplified from our previous constructed plasmids pZE-EntC-PchB and pCS-PqsD-SdgA 22.
Then the amplified DNA fragments were subcloned into pCS27 to form one operon through
three-piece ligation using Acc651, NdeI and XbaI, yielding plasmid pCS-EPPS. For resveratrol
biosynthesis, the genes of 4CL2 and STS were cloned into plasmid pCS27 as one operon using
Acc651, BglII, and BamHI, generating pCS-STS-4CL. For naringenin biosynthesis, the gene of
4CL2 was cloned into pCS27 using BglII and Acc651, resulting pCS-4CL. Similarly, the genes

14
of CHI and CHS were cloned as one operon into pCS27 using restriction sites NdeI and BsiWI,
yielding pCS-CHI-CHS. The chi-chs operon was then subcloned into pCS-4CL using SacI and
SpeI, generating pCS-CHI-CHS-4CL.
Table 2.1 Strains and plasmids used in Chapter 2
Strain Genotype Source
XL1-blue recA1 endA1 gyrA96 thi-1 hsdR17 supE44 relA1 lac
[F׳ proAB lacIqZ∆M15 Tn10 (Tetr)]
Stratagene
BW25113 rrnBT14 ΔlacZWJ16 hsdR514 ΔaraBADAH33
ΔrhaBADLD78
CGSC
Plasmids Description Reference
pZE12-luc PLlacO1, colE ori, Ampr Lutz and Bujard (1997)
pCS27 PLlacO1, P15A ori, Kanr Shen and Liao (2008)
pSA74 PLlacO1, pSC101 ori, Cmr Huo et al.(2011)
pZE-eGFP pZE12-luc harboring egfp This study
pCS-eGFP pCS27 harboring egfp This study
pSA-eGFP pSA74 harboring egfp This study
pZE-PT pZE12-luc harboring PT template This study
pSA-PT pSA74 harboring PT template This study
pZE-aseGFP(100) pZE-PT harboring 100bp aseGFP DNA This study
pZE-aseGFP(150) pZE-PT harboring 150bp aseGFP DNA This study
pZE-aseGFP(200) pZE-PT harboring 200bp aseGFP DNA This study
pZE-aseGFP(300) pZE-PT harboring 300bp aseGFP DNA This study
pSA-aseGFP(100) pSA-PT harboring 100bp aseGFP DNA This study
pSA-aseGFP(150) pSA-PT harboring 150bp aseGFP DNA This study
pSA-aseGFP(200) pSA-PT harboring 200bp aseGFP DNA This study
pSA-aseGFP(300) pSA-PT harboring 300bp aseGFP DNA This study

15
pCS-RfabD/eGFP
pCS27 harboring fabD with its native RBS fused with
egfp
This study
pSA-RfabD/eGFP
pSA74 harboring fabD with its native RBS fused with
egfp
This study
pZE-asfabD(100) pZE-PT harboring 100bp asfabD DNA This study
pZE-asfabD(150) pZE-PT harboring 150bp asfabD DNA This study
pCS-EPPS
pCS27 harboring entC, pchB, pqsD and sdgA in one
operon
This study
pCS-4CL pCS27 harboring 4cl2 gene from P. crispum This study
pCS-STS-4CL
pCS27 harboring sts from V. vinifera and 4cl2 from P.
crispum in one operon
This study
pCS-CHI-CHS
pCS27 harboring chi from M. sativa and chs from P.
hybrida in one operon,
This study
pCS-CHI-CHS-4CL
pCS27 harboring chi from M. sativa and chs from P.
hybrida in one operon, and 4cl2 from P. crispum in
the other operon
This study
pZE-asfabH(100) pZE-PT harboring 100bp asfabH DNA This study
pZE-asfabH(150) pZE-PT harboring 150bp asfabH DNA This study
pZE-asfabB(100) pZE-PT harboring 100bp asfabB DNA This study
pZE-asfabB(150) pZE-PT harboring 150bp asfabB DNA This study
pZE-asfabF(100) pZE-PT harboring 100bp asfabF DNA This study
pZE-asfabF(150) pZE-PT harboring 150bp asfabF DNA This study
pZE-asfabD(100)-
asfabH(100)
pZE-PT harboring 100bp asfabD DNA and 100bp
asfabH with two operons
This study

16
2.3.3 Fluorescence Assay
The analysis of interference efficiency was performed by measuring the fluorescence intensity
using BioTek micro-plate reader. The transformants of E. coli BW25113 containing egfp asRNA
synthesis plasmids and eGFP expression plasmids and the transformants containing fadD asRNA
synthesis plasmids and RFabD-eGFP expression plasmids were cultured in 3.5 ml LB medium
with appropriate antibiotics at 37 °C and 290 rpm for 5 h. Then 2% cultures were transferred into
baffled flasks containing 15 ml of M9Y media with 1 mM IPTG at 30 °C and 290 rpm. At 6 h,
12 h and 18 h, 1 ml aliquots of cell culture were taken and centrifuged at 10000 rpm, 4 °C for 1
min. The cell pellets were re-suspended in 1 ml of deionized water. Cell cultures (200 μl) were
transferred into a black 96-well plate (BRAND plates) and analyzed for eGFP fluorescence
intensity using excitation filter of 520 nm, and emission filter of 485 nm. The eGFP fluorescence
intensity of each sample was normalized against its OD600 and background cell fluorescence was
subtracted. Mean values for each sample was obtained from three independent measurements.
The reading type was set as endpoint mode 56.
2.3.4 Quantitative real-time PCR Analysis
All the transformants of E. coli BW25113 containing pZE-PT or pZE-asfabD(100) were
cultured in 3.5 ml LB medium with appropriate antibiotics at 37 °C and 290 rpm for 5 h. Then
2% cultures were transferred into baffled flasks containing 15 ml of M9Y media with 1 mM
IPTG at 30 °C and 290 rpm. After 12 h, 500 µl cell cultures were taken and centrifuged at 10000
rpm and 4°C for 1 min. The total RNAs were isolated from the above cell pellets using the
PureLink RNA Mini Kit. In this process, all the total RNA samples were treated with DNase I to
remove the genomic DNA completely. cDNAs were synthesized from 600 ng of heat-denatured

17
total RNAs using Protoscript II first strand cDNA synthesis kit. qRT-PCR with 12 ng cDNAs
was performed using the iQTM SYBR Green Supermix (Bio-Rad) and FastStart Universal
SYBR Green Master in 20 µl reaction volume (at least in triplicate) under the following cycling
conditions: 95°C for 30 s; 95°C for 10 min; followed by 45 cycles of 95 °C for 15 s; 58 °C for 30
s; 72 °C for 20 s. As a normalizer gene, 16sRNA was amplified with primers (F-5’-
GCTCGTGTTGTGAAATGTT, R-5’-TGTAGCCCTGGTCGTAAGG) and the product size was
150 bp. The fabD gene fragment was amplified with primers (F-5’-
TGAAGAACTGAATAAAACC, R-5’-GCAATAGACGCATCATCCA) and the product size
was 274 bp. The specificity of fabD primers was confirmed using a BLAST analysis against the
NCBI genome database. The integrities of the obtained products were verified by gel
electrophoresis on 2% agarose (in 1× TAE buffer) gels. In addition, a melting curve analysis was
carried out for each reaction under the following condition: 55°C to 95 °C; 0.5 °C/read; 1 s hold;
72 °C for 10 min. The relative quantification of gene expression between the E. coli BW25113
containing plasmid pZE-asfabD(100) and the strain containing plasmid pZE-PT was calculated
by the 2−ΔΔCt approximation method 58.
2.3.5 Extraction of intracellular malonyl-CoA
All the transformants of E. coli BW25113 containing pZE-PT or pZE-asfabD(100) were
cultured in 3.5 ml LB medium with appropriate antibiotics at 37 °C and 290 rpm for 5 h. Then
2% cultures were transferred into baffled flasks containing 50 ml of M9Y media with 1 mM
IPTG at 30 °C and 290 rpm. After 6 h and 12 h, 20.5 ml and 10.5 ml cell cultures were taken and
chilled on ice, respectively. Then the cultures were centrifuged at 6000 rpm and 4°C for 8 min.
The supernatants were discarded and the cell pellets were individually re-suspended in 1 ml of

18
6% perchloric acid (0.125 ml/mg cell) to facilitate cell lysis. Each of the lysed cell suspension
was then neutralized with 3 M potassium carbonate (0.3 ml/ml cell lysate). Additionally, 700
ng/ml of [13C3]-malonyl-CoA was spiked into the above mixtures as internal standard and
centrifuged at 6000 rpm and 4°C for 8 min. Then, 1.5 ml of supernatant was loaded into a solid-
phase extraction column (Sep-Pak C18 Plus Short Cartridge, Waters, WAT020515) pre-
conditioned with 2 ml methanol and 2 ml formic acid (pH 3.0), respectively 58, 59. The loaded
column was then washed with 2 ml water and eluted with 1 ml methanol. The eluted samples
were dried under a nitrogen stream at 4 °C and dissolved with 150 μl of 0.1% formic acid in 10
mM ammonium acetate/methanol (80:20) for LC/MS/MS 60. Dry cell weight was calculated
according to the empirical rule that 1 OD600 = 0.36 g/L 61.
2.3.6 LC-MS/MS analysis of malonyl-CoA.
Sample analysis was performed with a LC-MS/MS system using an Agilent 1200 (Agilent
Technologies, Santa Clara, CA, USA) separation module connected directly to a Thermo TSQ
Ultra triple quadrupole MS system (Thermo Fisher Scientific, San Jose, CA. USA). A 100 × 2.1
mm C18 reverse-phase HPLC column (Thermo Fisher Scientific, San Jose, CA. USA) was used
to perform HPLC separation. The analytes were eluted at a flow rate of 250 μl/min with a
gradient of 25 mM ammonium acetate (mobile phase A) and 25 mM ammonium acetate in 90%
acetonitrile (mobile phase B). Agilent 1200 HPLC binary pump was used to deliver the gradient
from 2 to 20 % B over 15 min at a flow rate of 250 μl/min after injecting the samples. The
column effluent was directed to Thermo TSQ MS instrument working on ESI positive mode with
SRM (selected ion monitor) setting. The instrument was tuned and SRM conditions were
optimized by the direct infusion of a solution of standard malonyl-CoA (100 μM) in the ESI ion

19
source with the same mobile phase used for HPLC separation. The transitions (m/z parent → m/z
daughter) for the malonyl-CoA were as follows: (1) malonyl-CoA, 854→347; (2) [13C3]-
malonyl-CoA, 857→350. The ratio of measured peak area of malonyl-CoA to the peak area of
internal standard ([13C3]-malonyl-CoA) was used for relative quantification.
2.3.7 HPLC-quantitative analysis.
Both the standards and samples were quantitatively analyzed by HPLC (Dionex Ultimate 3000)
with a reverse-phase ZORBAX SB-C18 column and an Ultimate 3000 Photodiode Array
Detector. All the transformants used for the biosynthesis of 4-hydroxycoumarin, resveratrol and
naringenin were cultured in 3.5 ml LB medium with appropriate antibiotics at 37°C and 290 rpm
for 5 h, then 2% cultures were transferred into baffled flasks containing 15 ml M9Y media with 1
mM IPTG (for resveratrol and naringenin biosynthesis, 1 mM p-coumaric acid were added) at
30 °C and 290 rpm. After 24 h, 1 ml cultures were taken to measure OD600 values and analyze
the products by HPLC.
For the 4-hydroxycoumarin HPLC analysis, solvent A was 0.1% (vol/vol) formic acid in water
and solvent B was 100% methanol. The gradient was at a flow rate of 1 ml/min: 20-80% solvent
B for 18 min, 80-20% solvent B for 1min and 20% solvent B for additional 4 min. The 4-
hydroxycoumarin peak eluted at 11.69 min with this program. For resveratrol and naringenin
analysis, solvent A was 0.1% (vol/vol) formic acid in water and solvent B was 100% acetonitrile.
The gradient was 30% solvent B for 15 min at a flow rate of 1 ml/min. The resveratrol and
naringenin peaks appeared at 4.25 and 8.89 min, respectively. Quantification was based on the
peak area in reference to the commercial standards. 4-Hydroxycoumarin and naringenin were
detected and quantified by monitoring absorbance at 285 nm. The resveratrol was detected and

20
quantified by monitoring absorbance at 310 nm. Samples containing over 100 mg/L of products
were diluted before running HPLC to maintain a linear concentration–peak area relationship.
2.4 Results
2.4.1 Development of asRNA tool and characterization of its properties
Sufficient and controllable interference efficiency is a prerequisite for the application of
asRNAs in genetic manipulation. Among all the factors that may affect interference efficiency,
asRNA stability was primarily taken into consideration. Previous studies have shown that
improvement in asRNA stability can lead to enhanced interference efficiency. It has been
reported that the stem-loop structure can significantly enhance its stability and increase the
asRNA lifetime 35. In this work, we employed this structure as a scaffold to develop the asRNA
tool. We constructed a plasmid carrying two inverted repeat sequences and then inserted the
DNA fragment corresponding to the asRNA between them to generate this stem-loop structure.
When transcribed into RNA in E. coli, the two inverted repeats would complementarily pair with
each other and form a double-strand stem structure termed as paired termini (PT); meanwhile the
interposed RNA sequence would form the loop (Figure 2.1b). We employed the enhanced green
fluorescence protein (eGFP) as a reporter to test the interference efficiency of the above asRNA
structure.
The translation initiation region on mRNA covering the ribosome binding site (RBS) and start
codon has been reported to be an ideal target for asRNA-mediated gene silencing 34, 62. In this
work, we still selected this target region but further studied the effect of asRNA loop length on
interference efficiency. Four asRNAs with various loop lengths (100, 150, 200 and 300 nt)
complementary to eGFP mRNA were selected, all of which initiate from the -20 nt upstream the

21
RBS. Initially, we employed a high-copy-number (50-70) plasmid pZE-aseGFP for asRNA
generation, and a low-copy-number (10-12) plasmid pSA-eGFP for the reporter eGFP
expression. When the two plasmids were co-transferred into E. coli, the asRNAs with different
lengths exhibited varied interference efficiencies. The construct with a 100-nt loop decreased the
eGFP fluorescence intensity by about 80% during 6-24 h, compared with the RNA scaffold
without the loop; while the interference efficiencies of the asRNAs with 150-, 200- and 300-nt
loops were 44, 50 and 38 % on average, respectively (Figure 2.2). These results suggested that
longer asRNA sequences do not necessarily lead to higher interference efficiencies. In addition,
we observed that the interference efficiencies at 3 h were slightly higher than those after 6 h for
all loop lengths.
Furthermore, we also examined the effect of the relative abundance between asRNAs and their
target mRNAs on the interference efficiencies. When we continued using the high-copy-number
plasmid for asRNA generation, but employed a medium-copy-number (20-30) plasmid pCS-
eGFP instead of the low-copy-number plasmid to express the reporter eGFP, the interference
efficiency of the 100-nt asRNA decreased from 80% to 65%; while no significant change in
interference efficiency was observed for other lengths. Interestingly, when we used a low-copy-
number plasmid (10-12) pSA-aseGFP for asRNA synthesis but a high-copy-number plasmid for
eGFP expression, the interference efficiencies for all the asRNAs fell below 20%. These results
indicated that high abundance of asRNAs relative to their target mRNAs is critical to achieve
high interference efficiency. It is also reasonable to conclude that asRNAs generated with high-
copy-number plasmids should be more efficient in down-regulating the expression of
chromosomal genes.

22
Figure 2.2 Interference efficiencies of asRNAs with varied loop lengths and relative abundance.
(a) eGFP expression (low copy) interfered by asRNAs (high copy) with 100, 150, 200 and 300-nt

23
loop lengths. (b) eGFP expression (medium copy) interfered by asRNAs (high copy). (c) eGFP
expression (high copy) interfered by asRNAs (low copy). We set the relative fluorescence
intensity of the negative control strains carrying pZE-PT or pSA-PT as 1.0 (or 100%) for each
time point. Interference efficiency (%) = 100% – relative fluorescence intensity. All the data
points were normalized by their respective OD600 values. The results were generated from three
independent experiments.
2.4.2 Design and characterization of asRNAs targeting fabD
In the fatty acid biosynthesis, several genes, such as fabD, fabF and fabB are involved in
malonyl-CoA consumption. Particularly, the malonyl-CoA: ACP transacylase encoded by fabD
is the first step for malonyl-CoA consumption, leading to the generation of malonyl-ACP.
Previous studies have reported that the genetic inactivation of gene fabD was lethal for cells 28.
In this study, we first targeted this gene to demonstrate the effectiveness of asRNAs on the
repression of fatty acid biosynthesis and enrichment of cellular malonyl-CoA. However, to
facilitate the measurement of fabD interference, we constructed a FabD/eGFP fusion protein,
which can indicate the expression level of gene fabD through fluorescence signal monitoring.
We introduced the native RBS of fabD upstream the FabD/eGFP gene and cloned them into a
low-copy-number plasmid pSA74, yielding pSA-RfabD/eGFP to better simulate the expression
of chromosomal genes. However, the FabD/eGFP fusion protein expressed by this low-copy
plasmid showed very weak fluorescence signal, which was inconvenient for measurement due to
the sensitivity limit of the detection device. Thus, we shifted to a medium-copy plasmid pCS-
RfabD/eGFP for expressing the fusion protein instead of pSA-RfabD/eGFP (Figure 2.3a).
Meanwhile, we designed asfabD targeting the RBS and coding region of fabD mRNA and

24
generate it with a high copy number plasmid pZE-asfabD(100). When pZE-asfabD(100) and
pCS-RfabD/eGFP were co-transferred into E. coli, the green fluorescence intensity decreased by
58.8% (Figure 2.3b) compared with the control strain carrying pZE-PT and pCS-RfabD/eGFP,
indicating that the developed asRNA tool is applicable for the fabD interference.
Figure 2.3 Effects of the fabD asRNA at translational and post-transcriptional levels. (a)
Schematic representation of plasmid construction. (1) FabD/eGFP fusion protein expressed by a
medium-copy-number plasmid. (2) Negative control plasmid only containing the stem structure
(PT sequences) without asRNA loop. (3) asRNA generating plasmid containing the fabD asRNA
with a 100-nt loop; (b) Fluorescence intensity of FabD/eGFP fusion protein interfered by
asfabD(100). The results were generated from three independent experiments; (c) Relative
mRNA level of gene fabD in E. coli strains. For the negative controls, three different
transformants were used; for the samples, five different transformants were used. For each
transformant, qRT-PCR was repeated for three times. For each transcript of gene fabD in all

25
samples and negative controls, the values are normalized to the internal control (16srRNA). *: p
= 0.04 was analyzed by unpaired, one-tailed Student’s t test.
2.4.3 The effect of asfabD interference at transcriptional and metabolite level
Previous studies indicated that asRNA may not only function at the translational level, but also
repress gene transcription or trigger mRNA degradation 63. We introduced pZE-asfabD(100) into
wild-type E .coli and performed real-time PCR to detect the variation of the fabD mRNA level to
verify whether the fabD expression was interfered before translation. As shown in Figure 2.3c,
the relative mRNA levels of gene fabD (from five transformants) were remarkably reduced at 12
h, compared with those of the control strain carrying pZE-PT, (from three transformants),
indicating that the asfabD can cause the decrease of intracellular fabD mRNA abundance. We
detected malonyl-CoA concentration by LC-MS/MS to further investigate whether the down-
regulated expression of gene fabD can result in the enrichment of cellular malonyl-CoA. As
shown in Figure 2.4, the engineered strain carrying pZE-asfabD(100) showed 4.37 and 4.52-fold
increases in malonyl-CoA concentration at 6 h and 12 h, respectively, compared with the control
strain with pZE-PT. The results above clearly demonstrate that asRNA-mediated down-
regulation of fabD gene expression occurred at post-transcriptional and translational level, the
overall effect of which is the repression of fatty acid biosynthesis and the enrichment of malonyl-
CoA.

26
Figure 2.4 Intracellular concentrations of malonyl-CoA. Light blue: strain expressing null
asRNAs (negative control). Dark blue: the strain expressing fabD asRNA with a 100-nt loop.
DCW: dry cell weight. The results were generated from three independent experiments.
2.4.4 Production enhancement of malonyl-CoA derived molecules by asfabD interference
We firstly used the biosynthesis of 4-hydroxycoumarin, a pathway well established in our
previous work 22, as a demonstration to examine if the enriched malonyl-CoA pool can be
redirected into desired pathways. Four pathway genes encoding EntC, PfPchB, PqsD and SdgA
were consecutively cloned as an operon in a medium-copy-number plasmid pCS-EPPS (Figure
2.5a). When pCS-EPPS and pZE-asfabD(100) were simultaneously introduced into E. coli
BW25113, the resulting strain produced 270.85 mg/L of 4-hydroxycoumarin at 24 h. In contrast,
the control strain BW25113 carrying pCS-EPPS and pZE-PT (a backbone plasmid without
asRNA loop) was only able to produce 106.95 mg/L 4-hydroxycoumarin, indicating that
inhibition of fabD expression by asRNA led to a 2.53-fold increase in the 4-hydroxycoumarin

27
titer (Figure 2.5b). In addition, we observed that the fabD down-regulated strain did not show
obvious growth retardation (Table 2.2).
Two other established pathways leading to the biosynthesis of model polyketides resveratrol
and naringenin were also tested to further verify the effect of the down-regulated fabD
expression on the production of other malonyl-CoA derived molecules. Previous studies reported
that over-expression of 4-coumarate:CoA ligase (4CL) and stilbene synthesis (STS) in E. coli led
to the production of resveratrol from p-coumaric acid; while the production of naringenin
requires the expression of 4CL, chalcone synthase (CHS) and chalcone isomerase (CHI) 20, 21.
Therefore, we constructed two plasmids pCS-STS-4CL and pCS-CHI-CHS-4CL to express the
genes involved in resveratrol and naringenin biosynthesis, respectively. When these two
plasmids were separately co-transferred with the control plasmid pZE-PT into E. coli, the titers
of resveratrol and naringenin achieved 158.22 and 59.58 mg/L, respectively. In contrast, when
the pCS-STS-4CL was co-transformed with pZE-asfabD(100), the resveratrol titers achieved
268.20 mg/L, a 1.70-fold increase compared with the control strain (Figure 2.5c); while
naringenin titer for the strain carrying pCS-CHI-CHS-4CL and pZE-asfabD(100) was 91.31
mg/L, representing a 1.53-fold improvement (Figure 2.5d). All the significant titer improvements
for these three heterologous products demonstrate that asRNAs have been developed as a
powerful tool to inhibit essential genes.

28
Figure 2.5 Heterologous production of malonyl-CoA derived compounds with and without the
effects of asRNAs. (a) Schematic representation of plasmid construction. (1) Negative control
plasmid. (2) asRNA generating plasmid. (3) The plasmid carrying 4-hydroxycoumarin
biosynthetic genes. (4) The plasmid carrying resveratrol biosynthetic genes. (5) The plasmid
carrying naringenin biosynthetic genes. (b) 4-hydroxycoumarin titers; (c) resveratrol titers; (d)
naringenin titers. The results were generated from three independent experiments.
2.4.5 Effects of other down-regulated fab genes on 4-HC pathway
In addition to fabD, we also examined the effect of the down-regulation of other fab genes
including fabB and fabF and fabH on 4-HC biosynthesis. As shown in the Figure 1a, β-oxoacyl-
ACP synthase I (KAS I) encoded by gene fabB catalyze the repeated condensation of malonyl-
ACP to form β-oxoacyl-ACP; while KAS II encoded by fabF is an isoenzyme of KAS I, which
is also responsible for the elongation of fatty acid chains 64, 65. Since both of these consume the
intermediate downstream of malonyl-CoA, we further selected these two targets for asRNA

29
interference study. Using similar approaches, we constructed two plasmids pZE-asfabB(100) and
pZE-asfabF(100) to generate the asRNAs with 100-nt loops targeting fabB and fabF,
respectively. When pZE-asfabB(100) and pZE-asfabF(100) were separately transferred with
pCS-EPPS carrying 4-hydroxycoumarin biosynthetic genes into E. coli, as shown in Table 2.2,
4-hydroxycoumarin was produced at the titers of 116.95 and 173.66 mg/L, representing a 1.09-
fold and a 1.62-fold increase, respectively, compared with the control strain without asRNA
interference (106.95 mg/L, see section 2.3.4). Apparently, the repression of fabB and fabF is not
as efficient as that of fabD. However, we observed that the fabB and fabF-interfered strains
showed obvious growth retardation compared with the fabD-interfered strain during the early
stage of cultivation (data not shown). We speculated that the interference efficiency of the
asRNAs with 100-nt loops might be excessively high for fabB and fabF repression, which is
harmful to normal cell growth. We employed weaker asRNAs with 150-nt instead of 100-nt
lengths to verify this hypothesis. As shown in Table 2.2, the strains with fabB and fabF
interfered by the asRNAs with 150-nt loops showed a 1.79-fold and a 2.49-fold increase in 4-
hydroxycoumarin titers, respectively, much higher than those by the asRNAs with 100-nt loops.
In addition, 3-ketoacyl-ACP synthase III encoded by fabH was also tested. Employment of the
asRNAs with 100 and 150-nt loops led to a 1.86-fold and a 2.12-fold increase in 4-
hydroxycoumarin production, respectively, showing a similar trend to fabB and fabF
interference. Based on these results, we conclude that high interference efficiency on the fatty
acid biosynthesis is not always beneficial for the production of malonyl-CoA derived
compounds. Balanced allocation of malonyl-CoA between cell growth and heterologous
molecules production is desirable to prevent the impairment of cell viability.

30
Table 2.2 Effect of down-regulated fab genes on 4-hydroxycoumarin production
Negative Control OD600 4-HC Titers(mg/L) Fold
pZE-PT + pCS-EPPS 9.33 ± 0.11 106.95 ± 0.13 1.00
Loop size = 100nt OD600 4-HC Titers(mg/L) Fold
pZE-asfabH + pCS-EPPS 8.71 ± 0.13 199.43 ± 9.78 1.86
pZE-asfabF + pCS-EPPS 8.01 ± 0.88 173.66 ± 10.86 1.62
pZE-asfabB + pCS-EPPS 8.74 ± 0.29 116.95 ± 15.90 1.09
pZE-asfabD + pCS-EPPS 9.34 ± 0.96 270.85 ± 7.85 2.53
pZE-asfabD-asfabH + pCS-EPPS 8.71 ± 0.13 235.22 ± 7.25 2.20
Loop size = 150nt OD600 4-HC Titers(mg/L) Fold
pZE-asfabH + pCS-EPPS 10.02 ± 0.05 226.23 ± 1.99 2.12
pZE-asfabF + pCS-EPPS 8.63 ± 0.07 266.41 ± 7.00 2.49
pZE-asfabB + pCS-EPPS 8.78 ± 0.29 191.91 ± 20.5 1.79
pZE-asfabD + pCS-EPPS 8.14 ± 0.18 212.34 ± 7.36 1.99
All data are reported as mean ± s.d. from three independent experiments.
In addition to targeting single genes, we also explored the simultaneous interference of two
genes by asRNAs to investigate whether the effect of malonyl-CoA enrichment can be
accumulated. As shown in Table 2.2, interferences of single genes fabD and fabH by the asRNAs
with 100-nt loops are among the most efficient ones in improving 4-hydroxycoumarin
production. Therefore, we constructed a plasmid pZE-asfabD(100)-asfabH(100) to generate the
asRNAs with 100-nt loops targeting fabD and fabH simultaneously. When it was transferred into
E. coli together with pCS-EPPS, we observed a 2.20-fold increase in 4-hydroxycoumarin
production compared with the control strain without asRNA interference, which is slightly lower
than the strain with only fabD interfered (2.53-fold). These results suggested that fabD is the
most desired target to inhibit the malonyl-CoA consumption. Additional interference of other fab
genes may not further improve the titers of malonyl-CoA derived compounds significantly.

31
2.5 Discussion
Gene knock-out strategy has been playing a significant role in charactering gene functions or
engineering cells for desirable metabolic properties 66. However, this strategy is usually limited
to those genes that are not essential for cell growth. Alternatively, asRNA has been exploited to
overcome this limitation by conditionally down-regulating the expression of essential target
genes. Through binding to the translation initiation region (e.g. RBS and start codon) of target
mRNA, a reversible steric effect leads to a knockdown regulation by blocking the ribosome
reading through mRNA and inhibiting the translation of the corresponding genes 68. This
property promoted us to investigate the factors critical for interference efficiency and strategies
to control the efficiency.
In this study, we employed an artificial stem-loop structure to improve the stability of asRNA,
then optimized its loop size to achieve the fine-tuning of its interference efficiency. We observed
from the results that shorter asRNAs exhibited higher interference efficiency within the range of
100-300 nt. We speculated that the longer loops might form more complicated secondary
structures that weaken their binding to target mRNAs or decrease the asRNA stability.
Additionally, we observed that higher relative abundance of asRNA over its target gene was
critical to achieve high interference efficiency (Figure 2.2). Based on the generalized rules, we
applied asRNAs to interfere fatty acid biosynthesis genes. We evaluated its interference
efficiency and demonstrated its effect at transcriptional, translational and metabolic levels
through real-time PCR, eGFP fusion protein reporter and LC/MS/MS, respectively. In practice,
the single interference of fabD led to a 4.52-fold increase in intracellular malonyl-CoA
concentration, demonstrating the effectiveness of the fabD asRNA. Then, we introduced the
designed fabD asRNA into three heterologous pathways of malonyl-CoA derived natural

32
products and achieved 2.53-fold, 1.70-fold and 1.53-fold increases in 4-hydroxycoumarin,
resveratrol and naringenin production, respectively. Apparently, the titers of these compounds
were not increased as much as the level of malonyl-CoA, which may be explained by the
following two reasons. On one hand, the enriched malonyl-CoA might have saturated the
heterologous enzymes; on the other hand, these pathways involve other precursors (e.g. salicoyl-
CoA and p-coumaroyl-CoA), which may also be determinative factors for production.
We used the biosynthesis of 4-hydroxycoumarin as a model system, and targeted other genes
directly and/or indirectly related to malonyl-CoA consumption with asRNAs to further
investigate this strategy. As shown in Table 2.2, in addition to gene fabD, interference of other
genes such as fabB, fabF and fabH also led to significant improvements in 4-hydroxycoumarin
production. However, the interference efficiency has varied effects on the different fab genes.
For example, the interference of gene fabD with the asRNAs with 100 and 150-nt loops showed
similar results; while for fabB, fabF and fabH, the asRNAs with 150-nt loops were obviously
advantageous than the asRNAs with 100-nt loops. Meanwhile, we observed growth retardation
for strains with genes fabB, fabF and fabH interfered by the asRNAs with 100-nt loops,
indicating that excessively strong inhibition of these genes may impair cell viability. Based on
the analysis above, we conclude that high interference efficiency is not always necessary to
achieve high titers. A balanced allocation of malonyl-CoA between necessary cell growth and
heterologous production is critical to maintain the desired viability of the microbial cell factories
and achieve the most efficient production. Therefore, asRNA design and interference efficiency
should be further investigated to provide more controllable tools for metabolic engineering use.
As we were preparing this manuscript, the use of antisense RNA strategy to enhance the
production of naringenin was reported 68. Compared with this work which focused on a single

33
target product, we have demonstrated that regulating malonyl-CoA using antisense RNA can be
a platform technology for improving the production of a variety of molecules (e.g. 4-HC,
resveratrol and naringenin) derived from malonyl-CoA. In addition, we conducted a more
systematic study on the effect of down-regulating several fatty acid biosynthesis genes on the
enrichment of intercellular malonyl-CoA. Overall, this work demonstrates that antisense RNA is
a promising genetic tool to increase microbial production of economically and pharmaceutically
valued compounds.

34
CHAPTER 31
ANTISENSE RNA ELEMENTS FOR DOWNREGULATING EXPRESSION
1 Yaping Yang, Jian Wang, Ruihua Zhang, Yajun Yan. 2015. Submitted to Methods in
Molecular Biology, 12/30/16.

35
3.1 Abstract
Antisense RNA (asRNA) technology is an important tool for downregulating gene expression.
When applying this strategy, the asRNA interference efficiency is determined by several
elements including scaffold design, loop size, and relative abundance. Here, we take the
Escherichia coli gene fabD encoding malonyl-CoA-[acyl-carrier-protein] transacylase as an
example to describe the asRNA design with reliable and controllable interference efficiency.
Real-time PCR and fluorescence assay methods are introduced to detect the interference
efficiency at RNA level and protein level, respectively.
Keywords asRNA, scaffold design, loop size, relative abundance, interference efficiency
detection, gene fabD
3.2 Introduction
Antisense RNA (asRNA) mediated gene silencing has been extensively utilized as a critical
tool to control gene expression without any genomic modification of the target gene 68-70.
Through base pairing between designed asRNA and target mRNA, the resulting double strand
RNA (dsRNA) can inhibit translation initiation by steric hindrance and trigger degradation of the
target mRNA by dsRNA-specific RNases (see Figure 3.1(c)) 40,71,72. There are advantages of
employing the asRNA strategy. Unlike the traditional gene knockout strategy for disrupting gene
expression, the asRNA triggered gene downregulation still maintains the cell viability. The
plasmids for asRNA expression can be easily constructed, conditionally controlled by various
promoters, and designed to target several genes simultaneously. However, the asRNA-mediated
gene inhibition requires continuous presence of abundant asRNA molecules. Thus, the reliable
supply and stability of asRNA are prerequisite for this strategy to be applied efficiently in genetic

36
manipulations. The asRNA interference efficiency is mainly affected by several factors, among
which asRNA stability is the primary player 73, 74. Previous reports have shown that asRNA
scaffold was beneficial to asRNA stability, like Hfq protein-assisted asRNA scaffold showed an
increased lifetime and effectiveness in target binding 44,75. A stem-loop asRNA scaffold also
exhibited a prolonged half-life and efficient target recognition without the involvement of any
protein 35 (see Figure 3.1). For this stem-loop scaffold, two 38 bp inverted repeats were the
essential parts to maintain the asRNA stability 66 (see Figure 3.1(b)). Herein, we create an
efficient method to assemble the basic stem-loop scaffold with a random DNA fragment. By
replacing the random DNA fragment with a specific sequence complementary to the translation
initiation region of any target gene, various new artificial regulatory asRNAs would be created 16.
Another strategy to improve asRNA interference efficiency is to optimize the asRNA loop size.
Our previous work reported that interference efficiency was negatively correlated with the
asRNA loop size and asRNA with 100-nt loop length conducted up to 80 % interference
efficiency 16. To simplify the experimental operation as well as to ensure high interference
efficiency, we recommend 100-nt as the primary choice for the asRNA loop design 16. Finally,
the relative asRNA abundance is crucial to enhance interference efficiency 35, 76. The excess
intracellular asRNAs enable an efficient competition over ribosome to sequester target mRNAs.
Thus, we recommend constructing asRNAs on the high copy number plasmid or under control of
strong promoters. real-time quantitative PCR and eGFP fluorescence assay are performed to
detect the interference efficiency at RNA level and protein level. Here, by taking Escherichia
coli malonyl-CoA-[acyl-carrier-protein] transacylase gene fabD as an example, we demonstrate
the asRNA design with reliable and controllable interference efficiency.

37
Figure 3.1 The stem-loop scaffold and asRNA interference mechanism. (a) The DNA sequence
of two 38 bp inverted repeats. (b) asfabD scaffold. When asfabD is transcribed in E. coli, the two
PT would complementarily pair with each other and generate a double-strand stem structure,
meanwhile the interposed asfabD sequence would form the loop. (c) asRNA interference
mechanism. When asRNA complementarily binds to target mRNA, the resulting double strand
RNA (dsRNA) will trigger degradation of the target mRNA or block translation initiation by
steric hindrance.

38
3.3 Materials
Prepare all solutions by deionized water (diH2O) and analytical grade reagents. Autoclave all
solutions at 121 ℃ for 20 min. Prepare and store all reagents at room temperature (unless
specified otherwise).
3.3.1 Construction of asRNA interference plasmids
1. Backbone plasmids: high copy number plasmid pZE12-luc and low copy number plasmid
pSA74.
2. Polymerase chain reaction (PCR): Genomic DNA of E. coli BW25113, primers (see
Table 3.1), Phusion High-Fidelity DNA polymerase, 10×buffer, DMSO (if necessary)
3. Restriction endonucleases: EcoRI, Acc65I, BamHI, XbaI, SphI, SpeI..
4. Tris-acetate-EDTA (TAE) Buffer (50×): 242 g Tris free base, 18.61 g disodium EDTA,
57.1 ml glacial acetic acid and diH2O to a final volume of 1 liter.
5. 0.8 % agarose gel: 0.8 g agarose in 100 ml TAE buffer.
6. DNA ladder: Generuler 1kb DNA ladder.
7. All kits for gene cloning: PCR purification kit, Gel DNA recovery kit, Quick ligation kit,
Plasmid miniprep kit.
8. Competent cells: E. coli XL-Blue and BW25113.
9. LB medium: 10 g tryptone, 5 g yeast extract and 10 g NaCl in diH2O to a final volume of
1 liter.
10. Agar plates: each 9 cm diagram petri dish contains 10 ml LB medium containing 1.5 %
agar.
11. Antibiotics: ampicillin (100 mg/L), chloramphenicol (34 mg/L)
3.3.2 Fluorescence Assay

39
1. eGFP cDNA.
2. Inducer: 0.5 M isopropyl β-D-1-thiogalactopyranoside (IPTG).
3. Black 96-well plate with clear bottom.
4. BioTek plate reader.
Table 3.1 Primer sequences for cloning and Qrt-PCR analysis in chapter 3
Primers Primer Sequence (5’-3’)
1 AAAAAgaattcAggaggaaTTaaccaTgcagTggTggTggTggTggTgGGTACCgatatc
2 aaaaaGcatgccatggcggccgcaagcttgatatcGGTACCcAccAccAccAccAccAc
3 AAAAAgcatgCgatatcaagcttgcggccgccatggatccCaccaccaccaccaccacTg
4 AAAAAtctagaAggAggAAttAAccAtgcAgtggtggtggtggtggtGggatccatggcg
5 AAAAAGGTACCCCGCCATATCAGCCAGCATTCCAAC
6 AAAAAGGATCCAGTTGGTTCTGCTTGAAGCCTTTGG
7 GCTCGTGTTGTGAAATGTT
8 TGTAGCCCTGGTCGTAAGG
9 TGAAGAACTGAATAAAACC
10 GCAATAGACGCATCATCCA
11 aaaaaggtaccAACTCGGTATGTCTATGGATAATGTC
12 ACAGCTCCTCGCCCTTGCTCACAAGCTCGAGCGCCGCTGCCATC
13 GATGGCAGCGGCGCTCGAGCTTGTGAGCAAGGGCGAGGAGCTGT
14 aaaaaggatccTTACTTGTACAGCTCGTCCATGCCGAG
3.3.2.1 Quantitative real-time (qRT) PCR Analysis
All materials should be RNase-free in this section. All solutions are prepared by RNase-free
water and containers.
1. Total RNA isolation: RNA purification kit, RNase-free pipette tips, RNase free water, 1.5
ml RNase-free microcentrifuge tubes, micro tube homogenizer system, DNase I, 2-
mercaptoethanol, 100 % ethanol, 10 % SDS (0.5 μl/sample), Lysozyme solution (100
μl/sample): 10 mM Tris-HCL (pH 8.0), 0.1 mM EDTA, 10 mg/ml lysozyme, Lysis buffer:
before beginning of the lysis and homogenization steps, prepare a fresh amount of lysis
buffer (10 μl 2-mercaptoethanol/1 ml lysis buffer). Use 350 μl fresh lysis buffer for 1 ×

40
109 bacterial cells.
1. The cDNA synthesis: Primers (see Table 3.1), Protoscript II first strand cDNA synthesis
kit, sterile aerosol pipet tips, RNase free water.
2. qRT-PCR: primers (see Table 3.1), FastStart Universal SYBR Green Master, 8 strip tube.
3. The required equipment: NanoDrop 2000c UV-Vis Spectrophotometer, iQTM SYBR
Green Supermix.
4. M9Y medium: 10 g glucose, 6 g Na2HPO4, 0.5 g NaCl, 3 g KH2PO4, 1 g NH4Cl, 1 mM
MgSO4 (final concentration), 0.1 mM CaCl2 (final concentration), 2 g yeast extract, 2 g
sodium citrate, and 100 mg serine dissolved in diH2O with a final volume of 1 liter.
3.4 Methods
3.4.1 Construction of the stem-loop scaffold carrying asRNA
3.4.1.1 Construct parent plasmid pZE-PT (see Figure 3.2, Note 3.5.1):
1. Amplify the DNA fragment 1 by PCR reaction. Dilute primer 1 and 2 using diH2O to 1 μM.
Prepare the PCR mixture (50 μl) using Phusion High-Fidelity DNA polymerase as following:
diH2O: 30.5 μl, 10×buffer: 10 μl, 2 mM dNTP: 5 μl, primer 1&2: 2 μl (each), Enzyme: 0.5
μl. During this mixture, primer 1 and 2 serve as both primers and template. The PCR product
of DNA fragment 1 is 85 bp (see Note 3.5.2). The PCR program is: pre-denaturation at 98 ℃
for 3 min, 30 cycles of 98 ℃ for 30 sec, 60 ℃ for 30 sec and 72 ℃ for 20 sec, then extension
at 72 ℃ for another 5 min, followed by cooling down to 16 ℃.
2. Amplify the DNA fragment 2 by PCR reaction using primer 3 and 4. The procedures are
the same as 3.4.1.1.1. The PCR product of DNA fragment 2 is 85 bp (see Note 3.5.2).

41
3. Purify DNA fragment 1 and 2 using PCR purification kit. Add 100 μl binding buffer into
each 50 μl DNA fragment. Mixed by pipette. Transfer the mixture into a spin column with a
collection tube. After 1 min, centrifuge the spin column at 8,000 rpm for 1 min. Add 200 μl
wash buffer into the spin column. Then centrifuge at 12,000 rpm for 30 sec. Transfer column
to a 1.5 ml centrifuge tube. After 1 min, add 30 μl diH2O to elute the DNA from the spin
column (see Note 3.5.3).
4. Prepare a mixture of enzyme digestion as following. For DNA fragment 1 and 2:
diH2O: 17 μl, DNA: 15 μl, 10×buffer: 4 μl, enzymes (see Note 3.5.4): 2 μl (each), total
volume: 40 μl. For plasmid pZE-luc: diH2O: 26 μl, DNA: 6 μl, Buffer: 4 μl, Enzymes (see
Note 3.5.4): 2 μl (each), total volume: 40 μl. Incubate the digested mixture at 37 ℃ for 2-4
hrs in a water bath.
5. Purify the digested products. For DNA fragment 1 and 2: we use the same method as
3.4.1.1.3 and 6 μl diH2O is added for elution. For plasmid pZE-luc: load digested product
into a 0.8 % agarose gel. Run the gel in the 1×TAE buffer using 100 constant voltage for 20
min. Observe the gel under low UV. Cut the gel containing target fragment, and place it in a
centrifuge tube and purified the DNA using gel DNA recovery kit. Add ADB buffer (300
μl/100 mg, the volume of buffer over the weight
of agarose) into the centrifuge tube. Melt the gel at 55 ℃ for 5 min in a water bath. After the
gel completely melts, place it in a spin column with a collection tube. The next step is the
same as 3.4.1.1.3. But we add 6 μl diH2O for elution.

42
Figure 3.2 The plasmid construction of pZE-PT-asfabD. DNA fragment 1 and DNA
fragment 2 were inserted into pZE-luc in between EcoRI and SphI, SphI and XbaI
respectively, to generate parent plasmid pZE-PT. The DNA sequence of asfabD was inserted
into plasmid pZE-PT in between Acc65I and BamHI to produce pZE-PT-asfabD.
6. Prepare a ligation mixture. DNA fragment 1 and 2: 5 μl (each), plasmid pZE-luc: 2 μl,
2×ligation buffer: 13 μl, ligase: 1 μl, total volume: 26 μl. Wait for 20 min at room
temperature and then proceed for transformation.

43
7. Transfer all the reaction mixture of ligation into 50 μl chemical competent cell E. coli XL-
Blue. Keep on ice for 20 min. Then heat shock at 42 ℃ for 90 sec. Keep on ice for 2 min.
Add 1 ml LB medium into the mixture.
8. Put the culture into the shaker for 40 min at 37 ℃. Centrifuge the culture at 4,000 rpm for
3 min. Discard the supernatant and resuspend the cell pellet in 100 μl LB medium. Spread
them on the LB agar plate containing 100 mg/L ampicillin. Incubate the plate overnight at 37
℃.
9. Pick three transformants and incubate them into 3 ml LB liquid broth at 37 ℃ for 12 hrs.
10. Collect the cell by centrifuge at 12,000 rpm for 1 min. Extract the plasmid by plasmid
miniprep kit. Add 50 μl diH2O to elute the plasmid DNA.
11. Verify the plasmids by SpeI and SphI. Prepare mixture of enzyme digestion as following:
diH2O: 6 μl, DNA: 2 μl, 10×buffer: 1 μl, enzymes: 0.5 μl (each), total volume: 10 μl (see
Note 3.5.5).
3.4.1.2 Construct parent plasmid pZE-PT-asfabD (see Note 3.5.6):
1. Amplify the gene asfabD by PCR reaction. Dilute primer 5 and 6 using diH2O to 1 μM.
Prepare the PCR mixture (50 μl) using Phusion High-Fidelity DNA polymerase as following:
diH2O: 31.5 μl, 10×buffer: 10 μl, 2 mM dNTP: 5 μl, primer 5 and 6: 1 μl (each), genomic
DNA: 1 μl, enzyme: 0.5 μl. The PCR product is 100 nt (see Note 3.5.7).
2. Purify the DNA product using the same method as 3.4.1.1.3. Add 30 μl diH2O for elution.
3. Prepare digestion mixture. For DNA fragment asfabD: diH2O: 17 μl, DNA: 15 μl,
10×buffer: 4 μl, enzymes: 2 μl (each), total volume: 40 μl. For parent plasmid pZE-PT:
diH2O: 26 μl, DNA: 6 μl, 10×buffer: 4 μl, enzymes: 2 μl (each), total volume: 40 μl. Incubate
the digested mixture at 37 ℃ for 2-4 hrs in a water bath(see Note 3.5.8).

44
4. Purify the digested product. For DNA fragment asfabD: we use the same method as
3.4.1.1.3. But, we add 6 μl diH2O for elution. For parent plasmid pZE-PT: we used the same
method as 3.4.1.1.5, but we add 6 μl diH2O for elution.
5. Prepare ligation mixture. DNA fragment asfabD: 4 μl, plasmid pZE-PT: 1 μl, 2×ligation
buffer: 5.5 μl, Quick DNA ligase: 0.5 μl, total volume: 11 μl. Place the reaction tube at room
temperature for 20 min.
6. Heat-shock transformation and plasmid verification of pZE-PT-asfabD. We used the same
method from 3.4.1.1.7 to 3.4.1.1.11.
3.4.2 Interference efficiency detection
3.4.2.1 Direct detection method- qRT PCR (see Note 3.5.9)
1. Transform the plasmid pZE-PT-asfabD into the target strain E. coli BW25113. Transform
the parent plasmid pZE-PT into the target strain E. coli BW25113 as a negative control
(see Note 3.5.10). Pick three transformants of pZE-PT-asfabD and pZE-PT from the
overnight plates, respectively. Incubate these transformants in 3.5 ml LB medium
containing ampicillin (100 mg/L) at 37 °C and 290 rpm for 5 hrs.
2. Transfer 2 % cultures into baffled flasks containing 15 ml of M9Y media with 1 mM
IPTG at 30 °C and 290 rpm.
3. After 12 hrs, take 500 µl cell cultures and centrifuge at 12,000 rpm for 1 min at 4 °C to
pellet cells. Discard the supernatant (see Note 3.5.11).
Total RNA purification process:
4. Add 100 μl lysozyme solution (see materials 3.2.3.1) to the cell pellet and resuspend by
vortexing.
5. Add 0.5 μl 10 % SDS solution. Vortex to mix well.

45
6. Wait for 5 min at room temperature. Add 350 μl lysis bufer with prepared 2-
mercaptoethanol (see materials 3.2.3.1). Vortex to mix well.
7. Homogenize the cell lysate: transfer the lysate to a 1.5 ml RNase-free microcentrifuge
tube and homogenize using an micro tube homogenizer system with sterile micro-pestle
for at least 45 seconds. Centrifuge the homogenate at 3,000 rpm for 5 min at room
temperature, then transfer the supernatant to clean RNase-free microcentrifuge tube.
8. Add 250 µl 100 % ethanol to each volume of bacterial cell homogenate. Vortex to mix
completely to disperse any visible precipitate that may form after adding ethanol.
9. Transfer the sample (including any remaining precipitate) to a spin column with a
collection tube. Centrifuge at 12,000 rpm for 15 sec at room temperature. Descard the
flow-trough.
10. Prepare DNase I reaction mixture for on-column treatment as following: 10 × DNase I
reaction buffer: 8 μl, resuspended DNase I (3U/μl): 10 μl, RNase-free water: 62 μl, final
volume: 80 μl. Add the 80 μl DNase mixture directly onto the surface of the spin column.
Incubate at room temperature for 15 min.
11. Add 350 μl Wash buffer I to the spin column. Centrifuge at 12, 000 rpm for 15 sec at
room temperature. Discard the flow-through.
12. Add 500 μl Wash buffer II with ethanol to the spin column. Centrifuge at 12,000 rpm for
15 sec at room temperature. Discard the flow-through. Repeat this step.
13. Centrifuge the spin column at 12,000 rpm for 1 min. Insert the spin column into a new
collection tube. Add 30 μl RNase-free water into the center of the spin column.
14. Incubate at room temperature for 1 min. Centrifuge spin column and collection tube at
12,000 rpm and room temperature for 1 min.

46
15. Analyzing RNA concentration and quality by Nanodrop (see Note 3.5.12).
First Strand cDNA synthesis:
16. Dilute the denatured RNA to 600 ng/µl. Mix RNA sample and primer in a sterile RNase-
free microfuge tube as following: Template RNA: 1 µl, d(T)23VN (50 µM):2 µl, RNase-
free H2O: 5 µl. Total volume is 8 µl. Denature sample RNA and primer d(T)23VN at 65 ℃
for 5 min. Spin briefly and put on ice imediately.
17. Add the following components: 2 × Protoscript II reaction mix: 10 µl, 10 × Protoscript II
enzyme mix: 2 µl. Incubate the 20 µl cDNA synthesis reaction at 42 ℃ for 1 hrs.
Inactivate the enzyme at 80 ℃ for 5 min. (see Note 3.5.13).
qRT-PCR reaction:
18. Dilute the cDNA to 12 ng/µl. Dilute the primers to 30 µM. In a 1.5 ml reaction tube on
ice, prepare the PCR mixture as following: FastStart SYBR Green Master (ROX): 25 µl,
primers (30 µM): 0.5 µl(each), diH2O: 22 µl. Total volume is 45 µl. Mix the solutions
carefully by pipetting it up and down. Do not vortex.
19. Pipet 24 µl PCR mix into each PCR reaction vessel. Add 1 µl of template DNA. Mix
carefully by pipetting up and down. Seal the tubes with clear tube caps. Keep triplicate
for each sample. We choose 16S RNA as a normalizer gene from E. coli. By using the
primer 7 and 8, the product size of 16S RNA is 150 bp. The product size of target gene
fabD is 274 bp when using primer 9 and 10 (see Note 3.5.14). Set the cycling conditions
as following: 95 °C for 30 sec; 95 °C for 10 min; followed by 45 cycles of 95 °C for 15
sec; 58 °C for 30 sec; 72 °C for 20 sec (see Note 3.5.15).
20. Conduct a melting curve analysis for each reaction using the following condition: 55 °C
to 95 °C; 0.5 °C/read; 1 sec hold; 72 °C for 10 min (see Note 3.5.16).

47
21. Calculate the relative gene expression by the 2−ΔΔCt approximation method (see Note
3.5.17).
3.4.2.2 Indirect detection method-fluorescence assay (see Note 3.5.18)
Construct plasmid pSA-pfabD/egfp (see Note 3.5.19):
22. Amplify gene pfabD and gene egfp by PCR reaction. All procedures are the same as
3.4.1.2.1. Use primer 11 and 12 to amplify gene pfabD. Use primer 13 and 14 to amplify
egfp. Purify the PCR product by gel recovery kit. The procedures are the same as
3.4.1.1.5. Add 40 μl diH2O for elution (see Note 3.5.19).
23. Overlap extension PCR for pfabD/egfp. Dilute PCR product of pfabD and egfp by 5 folds,
respectively. Prepare the PCR mixture (50 μl) using Phusion High-Fidelity DNA
polymerase as following: diH2O: 31.5 μl, 10×buffer: 10 μl, 2 mM dNTP: 5 μl, primer
11&14: 1 μl (each), diluted pfabD and egfp: 1 μl (each), enzyme: 0.5 μl. Purify the PCR
product by gel recovery kit. The procedures are the same as 3.3.3.1.5. Add 30 μl diH2O
for elution from the spin column.
24. Prepare digestion mixture. For DNA fragment pfabD/egfp: diH2O: 22 μl, DNA: 10 μl,
10×buffer: 4 μl, enzymes: 2 μl (each) (see Note 3.5.20), total volume: 40 μl. For plasmid
pSA74: diH2O: 26 μl, DNA: 6 μl, 10×buffer: 4 μl, Enzymes: 2 μl (each), total volume: 40
μl. Incubate the digested mixture at 37 ℃ for 2-4 hrs in a water bath.
25. The following cloning procedures are the same from 3.4.1.1.5 to 3.4.1.1.11.
Fluorescence Assay
26. Co-transform two plasmids pZE-PT-asfabD and pSA-pfabD/egfp into target strain E. coli
BW25113. Co-transform the parent plasmid pZE-PT with pSA-pfabD/egfp into E. coli
BW25113 as a negative control (see Note 3.5.21).

48
Inoculate three transformants of each strain into 3.5 ml LB medium with Ampicillin (100
mg/L) and chloramphenicol (34 mg/L), respectively at 37 °C and 290 rpm for 5 hrs.
27. Transfer 2 % cultures into a black 96-well plate with clear bottom containing 200 μl LB
medium with 1mM IPTG. eGFP fluorescence is monitored by spectrometer (Biotek) with
a time duration of 24 hrs. Set the conditions as following: Temperature: Setpoint 37 °C;
Start Kinetic [Run 24:00:00, Interval 0:20:00], Shake: Medium for 16:30, Read: (A) 600,
Read: (F) 485/20nm, 528/20nm; End Kinetic. Set the reading type as endpoint mode. (see
Note 3.5.22).
28. Subtract the background cell fluorescence of each sample and normalize the eGFP
fluorescence intensity of each sample against its OD600.
3.5 Notes
1. To keep a high abundance of asRNAs, we utilized high copy number plasmid pZE-luc for
the construction of asRNA plasmid. Parent plasmid pZE-PT consisting of a random DNA
sequence in between the two PT sequences, which serves as the basis for constructing
various asRNA scaffold plasmids (see Figure 3.1(a)).
2. Since the inverted repeat sequences are consisted of GC-rich nucleotides, the whole PT
sequence is hard to be amplified by overlap extension PCR. Thus, we divided the whole
PT sequence into two part including DNA fragment 1 and DNA fragment 2 (see Figure
3.2).
3. Since the size of DNA fragment 1 and 2 is small, we use 30 μl diH2O to elute DNA
product to increase the recovery efficiency.
4. We use enzymes EcoRI and Acc65I to digest DNA fragment 1 and use enzymes BamHI

49
and XbaI to digest DNA fragment 2. For the pZE-luc plasmid, we use enzymes EcoRI
and XbaI for the digestion.
5. When verifing the plasmid, we recommend that the two chosen enzyme restriction sites
are located in plasmid and the target DNA, respectively
6. By replacing target-binding sequence, we can generate various new synthetic asRNAs.
7. Primer 5 is reversely complementary to the target gene fabD starting from the +30 nt
coding region. Primer 6 is identical to the target gene fabD starting from -70 nt ahead of
the coding region.
8. We use enzymes Acc65I and BamHI to digest asfabD fragment and plasmid pZE-PT.
9. Since asRNA triggered mRNA degradation is the main mechanism of asRNA inhibition,
the real-time PCR is the direct method for the identification of interference efficiency at
the RNA level.
10. The strain containing plasmid pZE-PT would show higher mRNA concentration of fabD
than the strain containing plasmid pZE-PT-asfabD.
11. For better results, the cells in log-phase growth are optimal to isolate RNA. To prevent
RNA degradation, it is important to disrupt the cells fast and completely.
12. Before each experiment, clean your bench and relative equipment by 70 % ethanol.
During total RNA isolation process, please always wear a mask and frequently replace
gloves to avoid RNA contamination or degradation. The ratio of OD260/280 is used to
measure RNA purity. An OD260/280 >1.8 indicates that RNA is reasonably clean of
proteins and other UV chromophores that could negatively affect the stability of the
stored RNA.
13. After quantifying the total RNA concentration, we dilute each sample to the same

50
concentration. Then, we take the same volume of total RNA as the template for the cDNA
synthesis in the next step. Heat denaturation of the total RNA is required to open the
secondary structure which may impede long cDNA synthesis. .
14. When designing real-time PCR primers for target genes, it is necessary to confirm the
primer specificity by the BLAST analysis against the NCBI genome database. To avoid
nonspecific bands of the target gene, at least one designed primer should be uniquely
homologous to the genomic DNA.
15. It is optional to verify the integrities of the obtained products by gel electrophoresis.
16. Melting curve analysis is necessary and important to assess the specificity of the real-
time PCR products. A bi-peak curve indicates a contamination from genomic DNA. A
peak in the blank control indicated a contamination from the diH2O or reagent.
17. We provide an example to describe the detailed calculation process of relative gene
expression (see Table 3.2) 83. Use one-tailed unpaired student's T-Test to evaluate the
difference between control group and sample group by formula =T. TEST ( Data1
(control), Data 2 (sample), 1, 3). 1 means one-tail t-test. 3 means two sample unequal
variance.
Table 3.2 A detailed calculation process of relative gene expression by 2−ΔΔCt method
Reference gene 16S RNA (Ct) Target gene (Ct)
C1 19.79 19.67 18.92 23.34 23.32 22.70
C2 17.56 17.92 17.35 21.20 22.9 23.1
C3 17.35 17.22 17.14 21.53 21.61 21.57
S1 17.85 17.26 17.30 23.14 23.79 23.97
S2 18.52 18.98 18.31 24.84 24.36 24.84
S4 17.72 16.96 17.53 23.97 24.08 24.13
Avg.(R) Avg.(T) △Ct △△Ct 2-△△Ct Avg. SD
C1 19.46 23.12 3.66 -0.90 1.87 1.01 0.22

51
C2 17.61 22.40 4.79 0.23 0.85
C3 17.24 21.57 4.33 -0.23 1.17
S1 17.47 23.63 6.16 1.60 0.33 0.30 0.06
S2 18.60 24.68 6.08 1.52 0.35
S4 17.40 24.06 6.66 2.10 0.23
T.TEST (C2:C3, S1:S3, 1, 3) 0.06
18. Fluorescence assay is an alternative detection method of asRNA interference efficiency to
save experimental cost. By constructing a pfabD/egfp fusion protein with a low copy
number plasmid, we detect the expression level of gene fabD by monitoring fluorescence
signal. However, since the fusion protein is constructed in a plasmid, it is not a direct
method to detect asRNA interference efficiency.
19. To maximally simulate the expression of chromosomal genes, we keep the native
promoter for gene fabD and termed pfabD. Remove stop codon of gene pfabD and start
codon of gene egfp when designing the overlap extension PCR primers.
20. We use enzymes Acc65I and BamHI to digest pfabD/egfp fragment and plasmid pSA74.
21. The strain containing parent plasmid pZE-PT and pSA-pfabD/egfp would show higher
fluorescence intensity than the strain containing asRNA plasmid pZE-PT-asfabD and
pSA-pfabD/egfp.
22. The procedures were applied for real-time monitoring of fluorescence intensity and
OD600 by Gene5 software in BioTek plate reader.

52
CHAPTER 41
ESTABLISHMENT OF AN ARTIFICIAL DYNAMIC REGULATORY NETWORK AND ITS
APPLICATION IN METABOLIC ENGINEERING
1 Yaping Yang, Yuheng Lin, Jian Wang, Yifei Wu, Mengyin Cheng, Ruihua Zhang, Yajun Yan.
2017. To be submitted to Nature.

53
4.1 Abstract
Dynamic pathway regulation is a potential strategy to maximize the metabolic flux through
exogenous pathways while maintaining the balanced state of the microbial host’s native
metabolism. However, the current studies mainly focused on dynamically regulating expression
of exogenous pathway genes. Little research report dynamically control of the endogenous
competing pathways, especially the essential pathways for cell growth to rewire the metabolic
flux towards the target compounds. To address this issue, we designed and established an
artificial dynamic regulatory network and demonstrated its effectiveness in improving the
biosynthesis of a widely-used platform chemical muconic acid in Escherichia coli. Based on a
promoter-regulatory system responsive to the generated muconic acid in combination with
interference antisense RNA, this system achieved simultaneous up-and-down regulation in an
orthogonal manner. With this system, the titer of muconic acid was elevated to the highest level
(1.8 g/L) so far observed for this pathway. This artificial regulatory network provided a
promising framework to autonomously up-regulate the desirable pathway genes and down-
regulate the native competing pathway genes responsive to the changing cellular physiological
state for optimal microbial production.
4.2 Introduction
Microbial-based metabolic engineering has been extensively utilized for green production of
high-value chemicals such as biofuels, biopolymers, nutraceuticals and pharmaceuticals77. A
fundamental goal of metabolic engineering is to maximize the productivities, yields or titers of
desired compounds in microbial hosts. Microorganisms are sophisticated and finely tuned cell
factories, and their natural metabolisms are composed of not only enzymatic catalyzed

54
biochemical reactions but also stringent dynamic regulation on multi-levels epigenetic,
transcriptional, translational and allosteric 78. Via monitoring the states and surpluses within
different metabolic networks, microorganisms can balance the catabolism and anabolism,
permitting a well-tuned balance of cellular maintenance and metabolites formation79. In most
cases, however, metabolic engineering induced perturbations to natural metabolism will lead to
metabolic imbalances, which include but are not limited to: (1) drain intracellular metabolites
due to overexpression of exogenous pathways or systematic deletions of endogenous pathways;
(2) cell toxicity ascribed to expression of toxic enzymes, interference of essential metabolite
pools or generation of toxic intermediates; (3) cellular resource burdens steming from unbiased
or deregulated expression of a large number of heterologous enzymes. The direct outcome of
metabolic imbalance is impairment of biomass formation and thereafter compromised product
formation.
To address these issues, current advances in metabolic engineering are mostly focused on
static optimization of exogenous pathways. These strategies include modulating enzyme
expression levels via promoter or ribosome binding site engineering, increasing catalytic
turnover of enzymes via protein engineering, colocalizing pathway enzymes via synthetic protein
scaffolds or compartmentalization7,80-84. Alternatively, more viable dynamic optimizations via
signaling native intracellular intermediates by cognate biosensors have been exploited to mimic
natural dynamic regulations and achieved control over metabolic pathways. Limited proof-of-
concept demonstrations have been conducted in E. coli by acetyl phosphate biosensor mediated
control of the engineered lycopene biosynthesis11, fatty acid/acyl-CoA (FA/acyl-CoA) biosensor
mediated regulation of biodiesel production12 and malonyl-CoA sensor mediated regulation of
fatty acids biosynthesis13. Intermediate-dependent dynamic control permitted alleviation of

55
metabolic imbalances and real-time alterations of carbon fluxes in response to intermediate
fluctuation, which however, are endowed with intrinsic drawbacks including (1) limited dynamic
sensitivity or range10, (2) production lagging elicited by inevitable oscillation of intracellular
intermediates13 and (3) undermined robustness and sustainability in production. Yet the simple
dynamic coupling of exogenous pathways to intermediate levels were mostly monofunctional
and suboptimal because of the biased biomass formation over production.
In the present study, we sought to reconstitute and functionalize a ubiquitous dynamic system
based on end-product biosensors that broadly exist in different microbial contexts, and
investigated its potency and applicability in metabolic engineering. The multi-task modulation
nature of this system enables switching on biosynthetic routes of desired products and switching
off competing pathways in a reciprocal and escalating fashion, so as to achieve an autonomous
and optimal tradeoff between growth-sustainment and product-formation. The developed control
elements consist of sensor-regulator and RNA interference technique. The sensor-regulator
triggers gene expression by sensing cellular metabolites, which provides the up-regulation
function. When this function is used to initiate antisense RNA (asRNA) synthesis for repressing
different target gene expression, the opposite function, orthogonal down-regulation, can be
realized simultaneously (Figure 4.1). To validate the design of such an end product-oriented
dynamic system, we

56
Figure 4.1 The scheme of artificial dynamic regulatory network
constructed and characterized on a noncognate muconic acid (MA)-mediated promoter-
regulatory system in E. coli and developed a prototype of the dynamic regulatory network to
control the expression of different fluorescence proteins for testing (Figure 4.2). The expected
logic control should be like this: first, the end product MA served as the inducer in the system;
second, at the beginning, the system was focused on the cell growth; third, when the cell growth
was not the dominate factor, the secondary metabolite formed and MA accumulated; finally, the
accumulated MA would serve as signal to up-regulate the upstream EP module genes and down-
regulate the competing pathway genes to redirect the carbon source from the TCA cycle to the
MA biosynthesis pathway. Based on a promoter-regulator system responsive to generated MA,
this system was combined with interference antisense RNA (asRNA) to achieve simultaneous up
and down regulation.

57
Figure 4.2 The scheme of applying the dynamic regulatory network to the MA biosynthesis
pathway.
4.3 Methods and Materials
4.3.1 Experimental materials
Luria-Bertani (LB) medium was used for E. coli inoculation and plasmid propagation. The
minimum medium M9Y contains (per liter): glycerol (15 g), yeast extract (5 g), NH4Cl (1 g),
Na2HPO4 (6 g), KH2PO4 (3 g), NaCl (0.5 g), MgSO4·7H2O (2 mmol), CaCl2·2H2O (0.1 mmol)
and vitamin B1 (1.0 mg). 100 mg/L of ampicillin, 50 mg/L of kanamycin and/or 34 mg/L of
chloramphenicol were added to the medium when necessary. The E. coli strain XL1-Blue was

58
used as the host strain for plasmid construction, and strain BW25113/F’ was used for the
biosynthesis of muconic acid. Plasmids pZE12-luc, pCS27 and pSA74 are respectively the high,
medium and low copy number plasmids employed for pathway assembly in this work (see Table
3.1 for a list of all strains and plasmids used in this study).
PMA promoter and catR gene (GenBank accession number SKC04124.1) were from P. putida
KT2440 purchased from ATCC (ATCC number: 47054D-5). RFP gene (GenBank accession
number AMO27245.1) was a kind gift from Dr. Gang Cheng group at the Chemical and
Biomolecular Engineering Department of University of Akron (OH, USA).
Phusion High-Fidelity DNA polymerase, DNase I, restriction endonucleases and Quick
Ligation Kit were purchased from New England Biolabs (Beverly, MA, USA). Zyppy™ Plasmid
Miniprep Kit, Zymoclean™ Gel DNA Recovery Kit, and DNA Clean & Concentrator™-5 were
purchased from Zymo Research (Irvine, CA, USA). Muconic acid standard was purchased from
ACROS ORGANICS (Bridgewater, NJ, USA).
4.3.2 Strain construction
To create the E. coli strain YYP1 that was chromosomally integrated with an eGFP gene, the
PLlacO-1-eGFP cassette was amplified from pZE-pPLlacO-1-eGFP and inserted into the E. coli
BW25113/F’ genome between the nupG and speC loci via Red recombination method85, 86 (see
Table 4.1 for a list of all strains used in this study). E. coli BW25113/F’ knockout derivatives
YYP2 (ΔpykFΔpykA) and YYP3 (ΔpykFΔpykAΔppc) were created via P1 phage transduction
method ( https://openwetware.org/wiki/Sauer:P1vir_phage_transduction).

59
Table 4.1 Strains and plasmids used in Chapter 4
Strain Genotype Source
E. coli XL1-Blue
recA1 endA1 gyrA96 thi-1 hsdR17 supE44 relA1
lac[F'proAB lacIqZΔM15 Tn10 (Tetr)]
Stratagene
E. coli BW25113/F'
rrnBT14 ΔlacZWJ16 hsdR514 ΔaraBADAH33
ΔrhaBADLD78
This study
YYP1
E. coli BW25113/F' integrated with PLlacO-1-eGFP
cassette between nupG and speC loci
This study
YYP2 E. coli BW25113/F' with pykF and pykA disrupted This study
YYP3 YYP2 with ppc disrupted This study
Plasmid Description Source
pZE12-luc PLlacO-1, colE ori, luc, Ampr Lin87
pCS27 PLlacO-1, P15A ori, Kanr Lin87
pSA74 PLlacO-1, pSC101 ori, Cmr Lin87
pZE-pPLlacO-1-PT
pZE12-luc harboring PT sequence under the control
of PLlacO-1 promoter
Yang16
pZE-pPMA-PT
pZE12-luc harboring PT sequence under the control
of PMA promoter
This study
pZE-pPLlacO-1-eGFP pZE12-luc harboring PLlacO-1-eGFP Yang16
pZE-pPMA-eGFP pZE12-luc harboring PMA-eGFP This study
pSA-pPlpp-CatR
pSA74 harboring CatR under the control of Plpp
promoter
This study
pZE-pPMA-eGFP-pPlpp-CatR pZE12-luc harboring PMA-eGFP and Plpp-CatR This study
pZE-pPMA-asegfp(100)
pZE-pPMA-PT harboring 100 bp asegfp DNA under
the control of PMA promoter
This study
pCS-pPMA-RFP pCS27 harboring PMA-RFP This study
pZE-pPLlacO-1-EP pZE12-luc harboring entC and pchB under the Lin87

60
control of PLlacO1 promoter
pSA-pPLlacO-1-NC
pSA74 harboring nahGopt and catA under the
control of PLlacO-1 promoter
Lin87
pZE-pPMA-EP pZE12-luc harboring PMA-EP This study
pSA-pPLlacO-1-NC-pPlpp-CatR pSA74 harboring PLlacO-1-NC and Plpp-CatR This study
pZE-pPLlacO-1-EP-pPMA-aspykF(100)-
pPMA-aspykA(100)
pZE12-luc harboring PLlacO-1-EP, PMA-aspykF(100)
and PMA-aspykA(100)
This study
pZE-pPLlacO-1-EP-pPLlacO1-
aspykF(100)-pPLlacO-1-aspykA(100)
pZE12-luc harboring PLlacO-1-EP, PLlacO1-
aspykF(100) and PLlacO-1-aspykA(100)
This study
pZE-pPMA-EP-pPMA-aspykF(100)-
pPMA-aspykA(100)
pZE12-luc harboring PMA-EP, PMA-aspykF(100)
and PMA-aspykA(100)
This study
4.3.2 DNA manipulation
For initial characterization of the PMA promoter regulatory system, the PMA promoter sequence
was amplified from genomic DNA of P. putida KT2440 and used to replace the PLlacO-1 promoter
of pZE-pPLlacO-1-eGFP using XhoI and EcoRI to generate pZE-pPMA-eGFP. Likewise, the catR
gene was amplified from P. putida KT2440 and used to replace the eGFP of pSA-pPlpp-eGFP
using BsrGI and BamHI to generate pSA-pPlpp-CatR. The Plpp-CatR operon was amplified and
cloned into pZE-pPMA-eGFP between SpeI and SacI, yielding pZE-pPMA-eGFP-pPlpp-CatR.
Similarly, a parent plasmid pZE-pPMA-PT was generated from pZE-pPLlacO-1-PT by replacing the
PLlacO-1 promoter with PMA promoter using XhoI and EcoRI. The 100 bp DNA sequence of egfp
asRNA was cloned into pZE-pPMA-PT using Acc651 and BamHI, resulting pZE-pPMA-
asegfp(100) as asRNA synthesis plasmid. The rfp gene was used to replace eGFP of pZE-pPMA-
61
eGFP using Acc651 and XbaI to generate pZE-pPMA-RFP. The PMA-RFP operon was subcloned
and inserted into pCS27 using SpeI and SacI, yielding pCS-pPMA-RFP.
To generate pZE-pPMA-EP, the entC-pchB operon was amplified from previously constructed
plasmid pZE-pPLlacO-1-EP6 and was used to replace eGFP of pZE-pPMA-eGFP between Acc651
and XbaI. The Plpp-CatR operon was cloned into a previously constructed plasmid pSA-pPLlacO-1-
NC using SpeI and SacI, yielding pSA-pPLlacO-1-NC-pPlpp-CatR. The 100 bp DNA sequences of
pykF and pykA asRNAs were cloned into pZE-pPMA-PT using Acc651 and BamHI, resulting
pZE-pPMA-aspykF(100) and pZE-pPMA-aspykA(100), respectively. The PMA-aspykF(100) and
PMA-aspykA(100) operons were cloned into plasmid pZE-pPLlacO-1-EP using SpeI, NheI, and SacI,
yielding plasmid pZE-pPLlacO-1-EP-pPMA-aspykF(100)-pPMA-aspykA(100). Similarly, the plasmid
pZE-pPLlacO-1-asppc(100) and pZE-pPMA-asppc(100) were generated. The PLlacO-1-asppc(100)
and PMA-asppc(100) operons were cloned into pZE-pPLlacO-1-EP or pZE-pPMA-EP using SpeI and
SacI, yielding pZE-pPLlacO-1-EP-pPLlacO-1-asppc(100), pZE-pPLlacO-1-EP-pPMA-asppc(100), and
pZE-pPMA-EP-pPMA-asppc(100).
4.3.4 Culturing conditions
For muconic acid bioproduction, all transformants of BW25113/F’ or its knockout mutants
were cultured in 3.5 ml LB medium with appropriate antibiotics at 37 ℃ and 290 rpm for 7 hrs.
Then 2% cultures were transferred into 125-ml baffled flasks containing 20 ml of M9Y media
and cultivated at 30 ℃ shaker and 290 rpm for 48 hrs. When needed, isopropyl β-D-1-
thiogalactopyranoside (IPTG) was added to the medium during culture transfer with a final
concentration of 0.5 mM. 1 ml culture was sampled to measure cell optical density at 600 nm
(OD600) and analyze the products by HPLC every 8 hrs.

62
4.3.5 HPLC-quantitative analysis
Both the standards and samples were analyzed and quantified by reverse phase HPLC (Dionex
Ultimate 3000) equipped with a ZORBAX SB-C18 column and an Ultimate 3000 photodiode
array detector. Solvent A was water with 0.1% formic acid, and solvent B was methanol. The
column temperature was set to 28 ℃. The HPLC program was set at a flow rate of 1 ml/min with
gradient concentration: 5-50% solvent B for 15 min, 50-5% solvent B for 1 min, and 5% solvent
B for an additional 4 min. Quantification of muconic acid was based on the peak areas at
absorbance of 260 nm.
4.3.6 Fluorescence assay
For fluorescence assay E. coli BW25113/F’ transformants containing eGFP or RFP expression
plasmids were cultured in 3.5 ml LB medium with appropriate antibiotics at 37 ℃ and 290 rpm
for 7 hrs. Then 2% cultures (4 μl) were transferred into a black 96-well plate with clear bottom
(BRAND plates) containing 200 μl of LB media with various concentrations of muconic acid (0
mM, 0.2 mM, 1 mM, 5 mM) and appropriate antibiotics. The plate was incubated in the Synergy
HT (BioTek) plate reader with medium continuous shaking at 37 °C for 24 hrs. Cell optical
density was measured at OD600 and fluorescence intensity was recorded using the following
parameters.The eGFP fluorescence intensity was detected by an excitation filter of 485/20 nm
with an emission filter of 528/20 nm. The RFP fluorescence intensity was detected by excitation
filter of 530/25 nm with an emission filter of 590/35 nm. The measurement interval was set to be
20 min for each sample. The eGFP or RFP fluorescence intensity of each sample was obtained
from three independent measurements and subtracted with the background cell fluorescence of
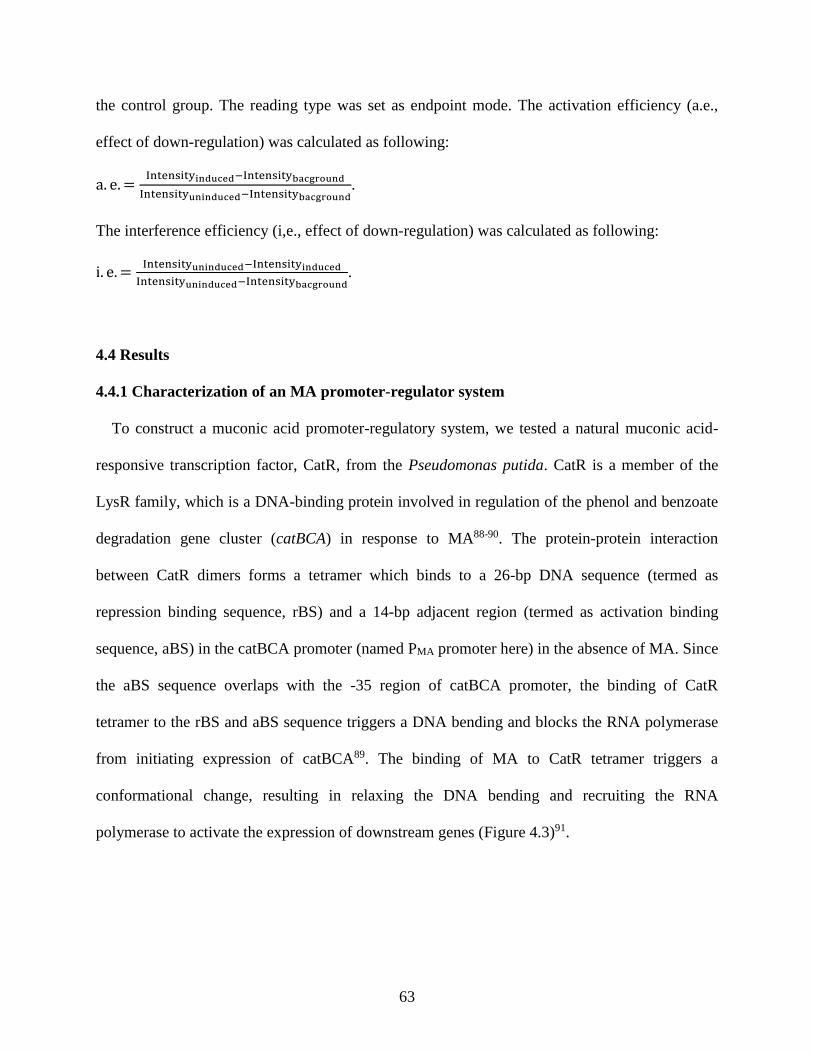
63
the control group. The reading type was set as endpoint mode. The activation efficiency (a.e.,
effect of down-regulation) was calculated as following:
a. e. =Intensityinduced−Intensitybacground
Intensityuninduced−Intensitybacground.
The interference efficiency (i,e., effect of down-regulation) was calculated as following:
i. e. =Intensityuninduced−Intensityinduced
Intensityuninduced−Intensitybacground.
4.4 Results
4.4.1 Characterization of an MA promoter-regulator system
To construct a muconic acid promoter-regulatory system, we tested a natural muconic acid-
responsive transcription factor, CatR, from the Pseudomonas putida. CatR is a member of the
LysR family, which is a DNA-binding protein involved in regulation of the phenol and benzoate
degradation gene cluster (catBCA) in response to MA88-90. The protein-protein interaction
between CatR dimers forms a tetramer which binds to a 26-bp DNA sequence (termed as
repression binding sequence, rBS) and a 14-bp adjacent region (termed as activation binding
sequence, aBS) in the catBCA promoter (named PMA promoter here) in the absence of MA. Since
the aBS sequence overlaps with the -35 region of catBCA promoter, the binding of CatR
tetramer to the rBS and aBS sequence triggers a DNA bending and blocks the RNA polymerase
from initiating expression of catBCA89. The binding of MA to CatR tetramer triggers a
conformational change, resulting in relaxing the DNA bending and recruiting the RNA
polymerase to activate the expression of downstream genes (Figure 4.3)91.

64
Figure 4.3 The schematic of promoter-regulatory system responsive to MA.
To express catR in E. coli, gene catR was inserted into the high-copy number plasmid pZE12-
luc under control of a constitutive promoter Plpp, resulting in pZE-pPlpp-CatR. Then, we created a
reporter system by inserting the 40-bp CatR binding sequence (rBS and aBS) ahead of egfp gene
encoding an enhanced green fluorescence protein, resulting in pZE-pPMA-egfp-pPlpp-CatR
(Figure 4.4a). In the absence of MA, CatR is expected to block the RNA polymerase by binding
to the PMA promoter, turning off egfp transcription. When MA is present, formation of CatR-rBS-
aBS complex is expected to recruit RNA polymerase, initiating egfp transcription (Figure 4.4a).
We firstly evaluated the dynamic range of CatR-PMA promoter regulatory system. When
exogenously fed with MA, E. coli BW25113/F’ containing pZE-pPMA-egfp-pPlpp-CatR showed
MA-dependent activation of fluorescence over a broad concentration range from 0.2 mM to 5
mM, whereas no induction of PMA promoter activity was observed in the absence of MA (Figure
4.4b). Especially, a 22-fold fluorescence change was observed upon addition of 5 mM MA, even

65
greater than the 17-fold fluorescence change of the egfp expression under the control of PLlacO-1
promoter on the high copy number plasmid pZE-pPLlacO-1-eGFP when induced by 0.5 mM IPTG
(Figure 4.4b). This indicated that PMA promoter was sensitive and robust to MA induction.
To validate if the changed promoter recognition element or promoter spacer may expand the
dynamic range92, we designed and constructed several mutated or hybrid promoters by changing
the sequence between -35 and -10 regions of the wild type PMA promoter. We mutated A at the -
12 position of the wild type PMA promoter into T based on the report that this mutation was able
to greatly improve the promoter strength92, resulting in promoter Pmut(12AT). By replacing the -35
and -10 regions of the wild type PMA promoter with those of PLlacO-1, which is a strong promoter
used in E. coli 48, we generated a hybrid promoter named Phyb(-35,-10). In addition, another hybrid
Phyb(Llac) promoter was created by completely replacing the promoter sequence region of the wild
type PMA promoter with the sequence spanning from the transcription start point to the -35 region
in PLlacO-1 promoter. However, based on the result of eGFP fluorescence assay, these mutated or
hybrid promoter-regulators showed similar dynamic range even lower sensitivity than the wild
type PMA promoter (see supporting information, Figure 5.1b to 5.1e). Thus, we chose the wild
type PMA promoter for the following study.
To test the contribution of CatR abundance on the PMA promoter induction93, we amplified and
inserted pPlpp-CatR into a low-copy number plasmid pSA74 (pSA-pPlpp-CatR) (see supporting
information Figure 5.2). Based on the result of eGFP fluorescence assay, the PMA promoter
exhibited similar up-regulation activity when CatR was either on high- or low-copy number
plasmid, indicating that low expression of CatR was enough for the stringent control of PMA
promoter and providing desired dynamic response.

66
Figure 4.4 Characterization of a MA-mediated promoter-regulatory system to dynamically
modulate the expression of eGFP. (a) The schematic of MA responsive reporter system with PMA
promoter sequence. (b) The effect of up-regulation of MA biosensor in response to exogenous
muconic acid. 1% of overnight culture of E. coli harboring plasmid (pZE-pPMA-eGFP-pPlpp-CatR
or pZE-pPLlacO-1-eGFP-pPlpp (negative control)) was transferred into 200uL LB medium. Various
amounts of MA or 0.5 mM IPTG (NC) were added to culture as indicated. Fluorescence was

67
measured at each 40 min during 24 hrs. Data represented the average of three biological
replicates, and error bars represented s.d.
4.4.2 Dynamic down-regulation by integrating RNAi with the MA promoter-regulator
RNAi is an effective technique to repress gene expression. Through exogenously introducing
the asRNAs into the host system, the asRNAs are able to regulate the expression of the target
chromosomal and plasmid-carried genes by RNA-RNA interaction in the post-transcriptional
level 42. Without any DNA sequence modification of the target genes, the RNAi can be flexibly
implemented to control multiple targets simultaneously, especially those are essential to cell
viability16, 67. Thus, we integrated RNAi with the MA promoter-regulator to achieve dynamic
down-regulation. We have developed asRNAs to conditionally down-regulate the fatty acid
biosynthesis to enhance fatty acid derived compounds in our previous study16. The constructed
asRNAs had a stem-loop structure, in which a pair of 38-nt inverted repeat sequences form the
stem to stabilize the design and an RNA fragment forms the loop to target a specific region of
mRNA. We had demonstrated that the asRNAs with 100-nt loops binding to the mRNA
translation initiation regions covering RBS and start codon provided the superior down-
regulation effects16. Thus, we kept this design in this study.
To enable down-regulation of any gene in response to MA, we placed asRNA of target genes
under control of CatR-PMA system. First, we created a reporter strain E. coli YYP1 in which
PLlacO-1-eGFP cassette was chromosomally integrated between nupG and speC loci. Next, we
designed a 100 nt anti-egfp asRNA (asegfp) targeting the RBS and coding region of egfp and
inserted it into pZE12-luc under the control of PMA promoter (pZE-pPMA-asegfp(100)). When E.
coli YYP1 was co-transformed with pZE-pPMA-asegfp(100) and pSA-pPlpp-CatR, the eGFP

68
fluorescence intensity decreased by 0%, 6.2%, 40.6%, and 67.0% when titrating with different
concentration of MA (0 mM, 0.2 mM, 1.0 mM, and 5.0 mM) (Figure 4.5). The result indicated
that MA induced up-regulation can be transduced into down-regulation through asRNA
interference in a dose-dependent manner.
Figure 4.5 Dynamic down-regulation by integrating RNAi with the MA promoter-regulator. (a)
The schematic of MA responsive sensor-regulator and RNAi based dynamic down-regulation.
(b)The effect of down-regulation of MA biosensor in response to exogenous MA.
4.4.3 Prototyping sensor-regulator and RNAi based dynamic control network
Next, to mimic the naturally existing dynamic regulation system, we attempted to implement
CatR-PMA system for simultaneous up- and down-regulation in an orthogonal manner. As the
construct of this prototype, the regulator protein CatR was constitutively expressed by plasmid
pSA-pPlpp-CatR, the reporter rfp gene was placed under control of PMA promoter in plasmid
pCS-pPMA-RFP as the reporter of the up-regulation function; while the antisense asegfp was also

69
placed under the control of PMA promoter in plasmid pZE-pPMA-asegfp(100) to target the
chromosomal egfp gene in the E. coli strain YYP1, which was used as the reporter of the down-
regulation function. When titrating with different concentration of MA (0 mM, 0.2 mM, 1.0 mM,
and 5.0 mM), the built prototype system exhibited simultaneous and orthogonal up-regulation
and down-regulation in a dose-dependent manner. Particularly, compared with the control strain
without MA as inducer, 2.0-, 8.6-, 11.1-fold up-regulation (Figure 4.6a) and 0.27-, 0.48-, 0.60-
Figure 4.6 Prototyping sensor-regulator and RNAi based dynamic control network. (a) The
schematic of bifunctional up-regulation and down-regulation. (b-c) The effect of simultaneous
up- and down-regulation of MA biosensor in response to exogenous MA.

70
fold down-regulation (Figure 4.6b) were achieved at 24 hours with 0.2 mM, 1.0 mM, 5.0 mM of
MA. In general, the constructed dynamic control network in this prototype system was able to
achieve similar sensitivity and dynamic responses for both up-regulation and down-regulation
functions by sensing the same inducing compound. Overall, the results confirmed the bi-function
of the designed dynamic control network at translational level.
4.4.4 Applying dynamic control network to MA biosynthesis - up regulation in wild type
strain
After validating the regulation capability of CatR-PMA promoter system, we first sought to
anchor it to control the metabolic pathway of MA in E. coli. We previously developed a MA
biosynthetic pathway initiated from the shikimate pathway intermediate chorismate that
contained two modules. The upstream EP module is responsible for salicylate (SA) biosynthesis
catalyzed by isochorismate synthase (EntC) and isochorismate pyruvate lyase (PfPchB), and the
downstream NC module is responsible for bioconversion of SA to MA catalyzed by salicylate 1-
monoxygenase (NahGopt) and catechol 1,2-dioxygenase (CatA)5 (Figure 4.2). Modular
optimization has demonstrated that high level expression of EP module on pZE12-luc (pZE-EP)
and low expression of NC module on pSA74 (pSA-NC) maximized MA production, suggested
the relatively high activity of NC module. To render MA biosensor mediated auto-induction, we
created two plasmids with the EP module under control of PMA promoter on pZE12-luc and the
NC module under the control of PLlacO-1 promoter on pSA-pPlpp-CatR, namely pZE-pPMA-EP and
pSA-pPLlacO-1-NC-pPlpp-CatR. When co-transferred into wild type E. coli BW25113/F’, the
resultant strain produced MA with a maximum titer of 290 mg/L at 48 h without IPTG induction.
In contrast, the control strain BW25113/F’ harboring pZE-pPLlacO-1-EP and pSA-pPLlacO-1-NC-

71
pPlpp-CatR only produced 49 mg/L MA without IPTG induction. These results indicated that MA
biosensor mediated up-regulation on EP module led to a 5.87-fold increase of MA titer than
leaky expression of EP module in the same genetic background and environmental conditions
(Figure 4.7).
Figure 4.7 MA production behavior by dynamic MA biosensor mediated up-regulation in wild
type strain E. coli BW25113/F’. The productivity (cell density and MA titers) of E. coli strain
BW25113/F’ containing PMA promoter mediated EP module (pPMA-EP) and control strain E. coli
BW25113/F’ containing PLlacO-1 promoter mediated EP module (pPLlacO-1-EP) were monitored
every 8 hrs in M9 medium containing 15 g/L glycerol.
4.4.5 Applying dynamic control network to MA biosynthesis - down regulation in wild type
strain
On the basis of the effectively dynamic up-regulation on the MA production, we next
validated the dynamic down-regulation effect on the MA production by employing the MA-

72
induced asRNA interference on this system to redirect carbon flux to the shikimate pathway.
Starting from the condensation of phosphoenolpyruvate (PEP) and erythrose 4-phosphate (E4P),
shikimate pathway was restricted by the PEP availability (3%) due to the existence of various
competing pathways, including the PTS sugar transport system (50%), glycolysis (15%),
peptidoglycan synthesis (16%) and anapleurotic pathway (16%)94. During glycolysis, PEP flows
into TCA cycle mainly by two pathways, PykA and PykF catalyzed conversion to pyruvate and
then decarboxylated to acetyl-CoA, and Ppc catalyzed carboxylation to OAA (Figure 2a). To
render MA biosensor mediated accumulation of intracellular PEP, we first designed asRNAs
targeting pykA and pykF, put them under the control of PMA promoter respectively and introduced
them into the plasmid pZE-pPLlacO-1-EP, generating plasmid pZE-pPLlacO-1-EP-pPMA-
aspykA(100)-pPMA-aspykF(100). When it was transferred into E. coli BW25113/F’ with plasmid
pSA-pPLlacO-1-NC-pPlpp-CatR, the resultant strain produced 131mg/L of MA at 48h without IPTG
induction, which was 2.65-fold increase compared with that (49 mg/L) of the control strain
without the MA induced dynamic control function. It also exhibited a similar trend of cell growth
comparing with the control strain (Figure 4.8). These results showed that MA-induced up-
regulation can be efficiently transduced into down-regulation by the coupled RNAi at the
metabolic level, leading to better MA biosynthesis. The similar growth profile demonstrated that
introduction of the genetic parts necessary for the down-regulation function did not cause any
significant stress to cell growth. Next, we identified if the dynamic down-regulation would
perform better than the static knockout group. Thus, we disrupted gene pykA and pykF from
strain BW25113/F’, generating permanent static knockout strain YYP2. Surprisingly, YYP2
carrying pZE-pPLlacO-1-EP and pSA-pPLlacO-1-NC-pPlpp-CatR produced 288 mg/L MA at 48 hrs
without IPTG induction, which was almost 2.2-fold higher than the titer (130.7 mg/L) of the

73
strain with dynamic down-regulation. produced by the double knockout strain YYP4 carrying
pZE-pPLlacO-1-EP and pSA-pPLlacO-1-NC-pPlpp-CatR (Figure 4.8). These results directly pointed
that the dynamic down-regulation even performed worse than the corresponding static knockout
strain. To further identify the reason, we further checked the growth profile of the YY2 based
MA-producing strain and found that static knockout strain exhibited even higher end-point cell
density and longer growth phase. These results implied that dynamic control of cellular
metabolism was not necessarily better than the corresponding static control if the static control
did not bring any negative impact on the cellular metabolism or cell growth.
Figure 4.8 MA production behavior by dynamic MA biosensor mediated down-regulation in
wild type strain E. coli BW25113/F’. The productivity (cell density and MA titers) of E. coli
strain BW25113/F’ containing PLlacO-1 promoter mediated EP module (pPLlacO-1-EP, in E. coli
BW25113/F’) and PMA promoter mediated aspykF and aspykA (pPLlacO-1-EP, PMA-aspykF-PMA-
aspykA in E. coli BW25113/F’), as well as control strain YYP2 with pykFpykA knockout

74
(pPLlacO-1-EP, in E. coliΔpykAΔpykF BW25113/F’) were monitored every 8 hrs in M9 medium
containing 15 g/L glycerol.
4.4.6 Applying dynamic control network to MA biosynthesis - effect of knockouts on cell
growth
To verify the importance of each gene for the cell growth, we knocked out all three genes
individually and combinatorically. When the gene pykA was deleted, no significant growth
retardation was observed when compared with the wild type strain (Figure 4.9). However, when
the gene pykF was deleted, the cell density was even higher than the wild type strain and gene
pykA knockout strains in late lag phase. When knocking out both pykA and pykF, the resultant
strain showed a longer lag phase with higher end-point cell density than the wild type strain,
which was consistent with the above growth profile during MA biosynthesis. However, when
disrupting ppc alone, the cell density was greatly decreased by 2-fold than the wild type strain.
Further disrupting pykA and pykF in the ppc knockout strain slightly restored the cell growth, but
also showed significant growth retardation compared with the wild type strain (Figure 4.9).
These results indicated that gene ppc is responsible for the major PEP consumption. Its
disruption would introduce undesired burden to cellular metabolism by limiting the carbon
source for cell growth.

75
Figure 4.9 Identification of cell growth-dependent genes by knocking out genes pykF, pykF and
ppc individually and combinatorically. All the above data represented the average of three
biological replicates, and error bars represented s.d.
4.4.7 Applying dynamic control network to MA biosynthesis - down regulation of ppc in
ΔpykA ΔpykF strain
Based on the above results, we hypothesized that dynamic down-regulation of ppc instead of
static control by permanent disruption would render the biological robustness to host by
alleviating the metabolism stress and then support better MA biosynthesis. To verify this
hypothesis, strain YYP2 (BW25113/F’ containing ΔpykA and ΔpykF) would serve as the host
strain for MA biosynthesis and gene ppc was left as the dynamic down-regulation target. When
pZE-pPLlacO-1-EP-pPMA-asppc (100) and pSA-pPLlacO-1-NC-pPlpp-CatR were co-transferred into
strain YYP2, the resulting strain produced 1282 mg/L MA at 48h without IPTG induction. As the
control, we conducted the MA biosynthesis in strain YYP2 with pPLlacO-1-asppc (100), which

76
provided a low-level static inhibition of ppc through leaking expression. Particularly, we also
introduced the MA biosynthesis in strain YYP2 with Δppc (YYP3) and without carrying pPMA-
asppc (100), which provided a high-level static down-regulation. As the result in Figure 4.10,
these two strains produced 484 mg/L and 114 mg/L MA, which were 2.7-fold and 11.2-fold less
than the dynamic down-regulation strain containing pPMA-asppc (100) (Fig 4.10a). To further
Figure 4.10 MA production behavior by dynamic MA biosensor mediated down-regulation. (a)
The productivity (cell density and MA titers) of dynamic down-regulation strain (pPLlacO-1-EP,
pPMA-asppc, in E. coliΔpykFΔpykA BW25113/F’), the static knockout strain (pPLlacO-1-EP, in
E. coliΔpykFΔpykAΔppc BW25113/F’), and the static inhibition strain containing PLlacO-1
promoter mediated asppc (pPLlacO-1-EP, pPLlacO-1-asppc, in E. coliΔpykFΔpykA BW25113/F’)
were monitored every 8 hrs in M9 medium containing 15 g/L glycerol. (b) was sequentially
corresponded with (a) by inducing 0.5mM IPTG. All the above data represented the average of
three biological replicates, and error bars represented s.d.

77
compare the robustness of these strains, we also investigated the MA biosynthesis with the
presence of sufficient IPTG (0.5 mM) which enabled fully expressed MA biosynthesis pathway
(EP and NC module) in all strains and fully expressed asppc in the control strain containing
pPLlacO-1-asppc (100) as a moderate static inhibition. As the results (Figure 4.10b), the control
strain with moderate-level static inhibition produced 331 mg/L MA and the one with Δppc
produced even less (141 mg/L), while the strain with dynamic control still performed 1264 mg/L
MA, which showed 3.82-fold and 8.96-fold increases compared to the control strains.
Furthermore, in addition, in the both conditions (with or without IPTG), we observed that the
dynamic down-regulation system was able to improve the cell growth compared with the control
strain containing Δppc and provided longer growth phase compared both control strains.
4.4.8 Applying dynamic control network to MA biosynthesis - up regulation in ΔpykA
ΔpykF strain
To validate the effect of the MA biosensor mediated up-regulation in the same background
strain YYP2, the plasmids pZE-pPMA-EP and pSA-pPLlacO-1-NC-pPlpp-CatR were co-transformed
into E. coli YYP2, the resultant strain obtained 1157 mg/L at 48 h without IPTG induction,
which was 3.7-fold increase compared with the control strain YYP2 (316 mg/L) containing the
plasmids pZE-pPLlacO-1-EP and pSA-pPLlacO-1-NC-pPlpp-CatR (Figure 4.11a). Similarly, when
both the strains were induced with 0.5 mM IPTG, the resultant strain obtained 2.65-fold
increase (1044 mg/L V.S. 395 mg/L) of MA production comparing to the PLlacO-1-EP mediated
control strain (Figure 4.11b). Notably, the dynamic up-regulation extended the growth phase at
both conditions with or without IPTG, although less cell density was reached. These results

78
reconfirmed that the increased MA production was due to the dynamic up-regulation of EP
module.
Figure 4.11 MA production behavior by dynamic MA biosensor mediated up-regulation. (a) The
productivity (cell density and MA titers) of dynamic up-regulation strain (pPMA-EP, in E. coliΔ
pykFΔpykABW25113/F’), the static strain (pPLlacO-1-EP, in E. coliΔpykFΔpykABW25113/F’)
were monitored every 8 hrs in M9 medium containing 15 g/L glycerol. (b) was sequentially
corresponded with (a) by inducing 0.5mM IPTG. All the above data represented the average of
three biological replicates, and error bars represented s.d.
4.4.9 Applying dynamic control network to MA biosynthesis – bi-functional regulation in
ΔpykA ΔpykF strain
Given the success in the MA responsive promoter driven up-regulation of metabolic pathway
on plasmid and down-regulation of competing pathway on genome, in the next step, we
combined up- and down-regulation to develop the artificial dynamic regulatory network in E.
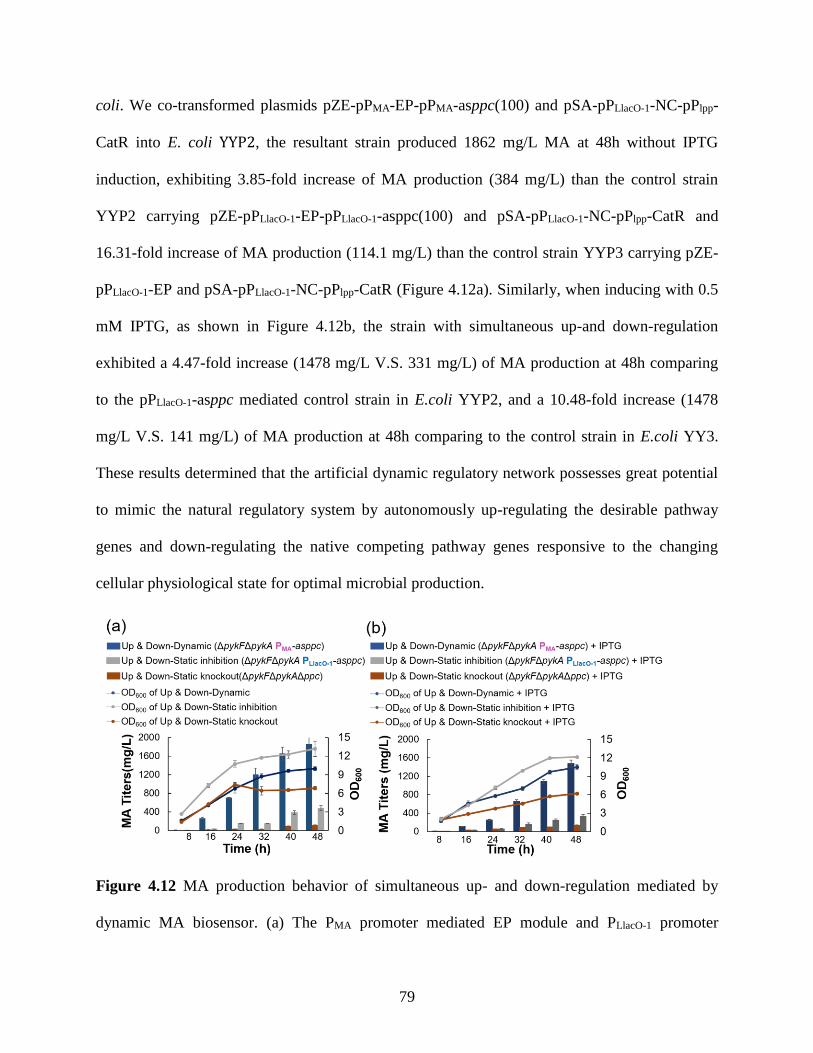
79
coli. We co-transformed plasmids pZE-pPMA-EP-pPMA-asppc(100) and pSA-pPLlacO-1-NC-pPlpp-
CatR into E. coli YYP2, the resultant strain produced 1862 mg/L MA at 48h without IPTG
induction, exhibiting 3.85-fold increase of MA production (384 mg/L) than the control strain
YYP2 carrying pZE-pPLlacO-1-EP-pPLlacO-1-asppc(100) and pSA-pPLlacO-1-NC-pPlpp-CatR and
16.31-fold increase of MA production (114.1 mg/L) than the control strain YYP3 carrying pZE-
pPLlacO-1-EP and pSA-pPLlacO-1-NC-pPlpp-CatR (Figure 4.12a). Similarly, when inducing with 0.5
mM IPTG, as shown in Figure 4.12b, the strain with simultaneous up-and down-regulation
exhibited a 4.47-fold increase (1478 mg/L V.S. 331 mg/L) of MA production at 48h comparing
to the pPLlacO-1-asppc mediated control strain in E.coli YYP2, and a 10.48-fold increase (1478
mg/L V.S. 141 mg/L) of MA production at 48h comparing to the control strain in E.coli YY3.
These results determined that the artificial dynamic regulatory network possesses great potential
to mimic the natural regulatory system by autonomously up-regulating the desirable pathway
genes and down-regulating the native competing pathway genes responsive to the changing
cellular physiological state for optimal microbial production.
Figure 4.12 MA production behavior of simultaneous up- and down-regulation mediated by
dynamic MA biosensor. (a) The PMA promoter mediated EP module and PLlacO-1 promoter

80
mediated asppc (pPLlacO-1-EP, PMA-asppc) were combined and expressed into the strain YYP2 (E.
coliΔpykAΔpykFBW25113/F’). The productivity (cell density and MA titers) of this generated
strain was compared with the static knockout strain (pPLlacO-1-EP, in E. coliΔpykFΔpykAΔppc
BW25113/F’) and the static inhibition strain containing PLlacO-1 promoter mediated asppc
(pPLlacO-1-EP, pPLlacO-1-asppc in E. coliΔpykFΔpykA BW25113/F’) every 8 hrs in M9 medium
containing 15 g/L glycerol. (b) was sequentially corresponded with the (a) with 0.5mM IPTG
induction. All the above data represented the average of three biological replicates, and error bars
represented s.d.
4.5 Discussion
In summary, to blend in cellular complexity and achieve metabolic balance, we constructed a
dynamic regulation system in E. coli by exploiting a noncognate muconic acid biosensor CatR
that allowed MA dose-dependent up-regulation of plasmid-borne metabolic pathways and
downregulation of chromosomal competing pathways. When implemented in E. coli cells, we
observed mildly compromised cell growth but significantly enhanced bioproduction of muconic
acid (1.8 g/L), which is substantially higher than static control by IPTG-induced system in either
wild type or knockout strains. Given multiple competing pathways involved, knocking out of
non-essential genes (pykA and pykF) and dynamic knocking down of essential genes (ppc) that
are coupled to cell growth simultaneously restored cell growth and redistributed carbon fluxes to
MA in a growth-dependent manner. Sustainable accumulation of end-products would potentially
afford optimal production by redirecting carbon sources to MA that could otherwise be used for
biomass. Particularly, introduction of end-product biosensors mediated up-regulation and asRNA
interference could serve as a general paradigm of dynamic push and pull, and holds great

81
promise for broad utilities of dynamic control systems in metabolic engineering. Other newly
well-documented repression methods like programable CRISPRi and protein degradation could
be anchored in dynamic control systems. This study also underscores some important issues for
applicability of dynamic control systems, like efficient biosynthetic routes and no intermediate
accumulation or rate-limiting steps. As we demonstrated here, optimization of EP and NC
module permitted carbon fluxes channeling into muconic acid, even without enhancing shikimate
pathway genes. Applications of dynamic control systems would potentially develop high-
performance microbial strains with autonomous production behaviors95.

82
CHAPTER 5
SUPPORTING INFORMATION OF CHAPTER 4
Figure 5.1 Development of hybrid promoters responsive to muconic acid (MA). (a) Design of
the hybrid PMA promoters. The DNA sequence in the purple boxes contained the CatR repression
binding site (rBS) and activation binding site (aBS). The sequences in red indicated the −35 and
−10 regions of the wild type PMA promoter. Transcript start sites were colored pink and pointed
by blue arrow. Pmut(12AT) represented a mutated T from A at the -12 position of wild type PMA
promoter. Phyb(-35,-10) represented the replaced -35 and -10 regions of the wild type PMA promoter

83
with those of PLlacO-1. Phyb(Llac) represented the completely replaced promoter sequence of the wild
type PMA promoter by PLlacO-1 promoter sequence spanning from -35 to -10 region. Ribosome
binding sites were colored in Blue. (b-e) Dosage response of the developed MA biosensors to
exogenous MA. Biosensor plasmids pZE-pPMA(wt)-eGFP-pPlpp-CatR (b), pZE-pPmut(12AT)-eGFP-
pPlpp-CatR (c), pZE-pPhyb(-35,-10)-eGFP-pPlpp-CatR (d) and pZE-pPhyb(Llac)-eGFP-pPlpp-CatR (e)
were transformed into E. coli BW25113/F’, respectively. Various amounts of MA were added
into the medium before the inoculation, and eGFP fluorescence was measured after incubation at
37 °C and 290 rpm for 24 hrs.
Figure 5.2 The effect of CatR abundance on the PMA dynamic range. (a) The Plpp-CatR and PMA-
eGFP cassettes were expressed in the same high copy number plasmid pZE12-luc. (b) The Plpp-
CatR cassette was expressed separately in a low copy number plasmid pSA74. 2 % of overnight
culture of E. coli BW25113/F’ harboring various plasmids was inoculated into 200 uL LB
medium. MA was titrated with different concentration (0, 0.2, 1.0, 5.0 mM). Plac represented the
E. coli BW25113/F’ harboring pZE-pPLlacO-1-eGFP induced with 0.5mM IPTG and the eGFP
intensity was served as positive control. The NC represented the E. coli BW25113/F’ harboring
empty pZE-luc12 and the eGFP intensity was served as negative control. Fluorescence was

84
measured at each 20 min at 37 °C for 24 hrs. Data were obtained from the average of three
biological replicates, and error bars represented standard deviations.
85
CHAPTER 6
CONCLUSION
In conclusion, we have shown how to engineer the static and dynamic control of the microbial
biosynthesis pathways to improve the desired production. Some of the results showed that
dynamic control strategy has potential to be applied into other biosynthesis pathways to increase
the production of desired compounds. Among these studies, we will discuss the relative
applicability as following:
Firstly, to break the metabolic homeostasis in the host cells, people have developed a series of
static control approaches in the genome level to constrain the endogenous metabolism and
overproduce the heterologous biosynthesis pathways such as Multiplex Automated Genome
Engineering (MAGE), its derivatives Microarray oligonucleotide-MAGE (MO-MAGE)96,
Coselection MAGE (CoS-MAGE)97, Conjugative Assembly Genome Engineering (CAGE)98, 99,
and clustered regularly interspaced palindromic repeats (CRISPR)/Cas9-mediated gene deletion
and integration100. Even though these strategies have proven effective and reduced the required
labor and time for engineering microbes with multiple genome manipulations, the lethal effect of
knockout strategy on the essential genes which are critical for cell viability and active growth,
greatly limits the cell growth and protein expression. Thus, it is important to develop the
heterologous genetic regulators and apply them into the static pathway control. The previous
studies have reported some successful applications, such as hfq-mediated RNAi44 and dCas9-
mediated gene inhibition101. However, these methods inevitably introduced a foreign protein to
assist the asRNAs to recognize the target genes, resulting in a complex genetic manipulation.

86
Thus, in our studies, we reported a simple asRNA design to achieve controllable inhibition
efficiency by changing the asRNA binding length, the asRNA recognition sites and asRNA
abundance. Compared with the previous studies, our approach was easier to operate because of
its smaller size, fewer elements and comparable inhibition efficiency. These advantages were
also important in the design of the dynamic control network.
Secondly, even though the developed static control strategies have achieved critical success on
alleviating the metabolic imbalance and improveing heterologous production, these static
controls on enzyme levels still exhibited disadvantages on the inability to sense perturbations and
adjust unfavorable metabolic states toward the designed goal92. Comparing with the static
control, native metabolic pathways generally use dynamic regulatory networks to compensate the
changed conditions by altering fluxes14. Thus, engineering dynamic control system represents a
new frontier of metabolic engineering and synthetic biology. However, as we discussed in the
previous chapters, the previously demonstrated applications were mainly mono-functional
regulation system with only up-regulation or only down-regulation. Their regulation mainly took
place on the transcriptional level. Compared with the previous design, we applied a sensor-
regulator to control both the desired pathway genes and designed asRNAs. When the metabolites
accumulated, it would be sensed by the system and triggered the desired pathway genes to
achieve up-regulation function. When this up-regulation was used to synthesize asRNAs, the
activated asRNAs would inhibit the multiple competing pathway genes to achieve down-
regulation function (Figure 2). Thus, our dynamic control network was a multi-functional
regulation system. And it also performed a simultaneous up-regulation and down-regulation in
an orthogonal manner. Furthermore, in our engineered system provided a prototype of dynamic

87
control network, other down-regulation approaches such as dCas9 strategy, can be introduced
into this system to program diversity of dynamic effects.
Finally, based on the result in the chapter 4, the effect of dynamic control system on
improving the microbial production was not necessary better than the static knockout strain. The
dynamic control system only exhibited effective when the corresponding static control approach
have negative impacts on the central cellular metabolism. Particularly, this work also improved
our understanding of the role of the PEP metabolic node in the cellular metabolism. The previous
report demonstrated that the ppc knockout strain didn’t show improved production when PEP as
the precursor of desired pathway. Here, we demonstrated that the dynamic control on the PEP
metabolic node could achieve autonomously intelligent distribution of carbon flux from the
biomass synthesis to the microbial production by sensing the intracellular metabolites. This
finding can also be extended to enhance the biosynthesis of shikimate pathway derived products
and other PEP-dependent compounds.

88
REFERENCES
1. Solomon, K.V., Moon, T.S., Ma, B., Sanders, T.M. & Prather, K.L. Tuning primary
metabolism for heterologous pathway productivity. ACS synthetic biology 2, 126-135
(2013).
2. Feist, A.M., Herrgard, M.J., Thiele, I., Reed, J.L. & Palsson, B.O. Reconstruction of
biochemical networks in microorganisms. Nature reviews. Microbiology 7, 129-143
(2009).
3. Lutke-Eversloh, T. & Stephanopoulos, G. Combinatorial pathway analysis for improved
L-tyrosine production in Escherichia coli: identification of enzymatic bottlenecks by
systematic gene overexpression. Metabolic engineering 10, 69-77 (2008).
4. Blankschien, M.D., Clomburg, J.M. & Gonzalez, R. Metabolic engineering of
Escherichia coli for the production of succinate from glycerol. Metabolic engineering 12,
409-419 (2010).
5. Lin, Y., Sun, X., Yuan, Q. & Yan, Y. Extending shikimate pathway for the production of
muconic acid and its precursor salicylic acid in Escherichia coli. Metabolic engineering
23, 62-69 (2014).
6. Lin, Y., Shen, X., Yuan, Q. & Yan, Y. Microbial biosynthesis of the anticoagulant
precursor 4-hydroxycoumarin. Nat Commun 4, 2603 (2013).
7. Salis, H.M., Mirsky, E.A. & Voigt, C.A. Automated design of synthetic ribosome binding
sites to control protein expression. Nature biotechnology 27, 946-950 (2009).
8. Hammer, K., Mijakovic, I. & Jensen, P.R. Synthetic promoter libraries--tuning of gene
expression. Trends in biotechnology 24, 53-55 (2006).
9. Schuetz, R., Zamboni, N., Zampieri, M., Heinemann, M. & Sauer, U. Multidimensional
optimality of microbial metabolism. Science 336, 601-604 (2012).
10. Wegner, A., Meiser, J., Weindl, D. & Hiller, K. How metabolites modulate metabolic
flux. Current opinion in biotechnology 34, 16-22 (2015).
11. Fung, E. et al. A synthetic gene-metabolic oscillator. Nature 435, 118-122 (2005).
12. Zhang, F., Carothers, J.M. & Keasling, J.D. Design of a dynamic sensor-regulator system
for production of chemicals and fuels derived from fatty acids. Nat Biotechnol 30, 354-
359 (2012).
13. Xu, P., Li, L.Y., Zhang, F.M., Stephanopoulos, G. & Koffas, M. Improving fatty acids
production by engineering dynamic pathway regulation and metabolic control. P Natl
Acad Sci USA 111, 11299-11304 (2014).
14. Holtz, W.J. & Keasling, J.D. Engineering static and dynamic control of synthetic
pathways. Cell 140, 19-23 (2010).
15. Zhang, A. & Yang, S.T. Engineering Propionibacterium acidipropionici for enhanced
propionic acid tolerance and fermentation. Biotechnol Bioeng 104, 766-773 (2009).
16. Yang, Y., Lin, Y., Li, L., Linhardt, R.J. & Yan, Y. Regulating malonyl-CoA metabolism
via synthetic antisense RNAs for enhanced biosynthesis of natural products. Metab Eng
29, 217-226 (2015).
89
17. Han, A.R. et al. Development of a Streptomyces venezuelae-based combinatorial
biosynthetic system for the production of glycosylated derivatives of doxorubicin and its
biosynthetic intermediates. Applied and environmental microbiology 77, 4912-4923
(2011).
18. Olano, C., Mendez, C. & Salas, J.A. Molecular insights on the biosynthesis of antitumour
compounds by actinomycetes. Microb Biotechnol 4, 144-164 (2011).
19. Griffin, M.O., Fricovsky, E., Ceballos, G. & Villarreal, F. Tetracyclines: a pleitropic
family of compounds with promising therapeutic properties. Review of the literature. Am
J Physiol Cell Physiol 299, C539-548 (2010).
20. Yan, Y., Li, Z. & Koffas, M.A. High-yield anthocyanin biosynthesis in engineered
Escherichia coli. Biotechnology and bioengineering 100, 126-140 (2008).
21. Leonard, E. et al. Strain improvement of recombinant Escherichia coli for efficient
production of plant flavonoids. Mol Pharm 5, 257-265 (2008).
22. Dahl, R.H. et al. Engineering dynamic pathway regulation using stress-response
promoters. Nature Biotechnology 31, 1039-+ (2013).
23. Xu, P. et al. Modular optimization of multi-gene pathways for fatty acids production in E.
coli. Nat Commun 4, 1409 (2013).
24. Zha, W., Rubin-Pitel, S.B., Shao, Z. & Zhao, H. Improving cellular malonyl-CoA level in
Escherichia coli via metabolic engineering. Metabolic engineering 11, 192-198 (2009).
25. Koirala, N., Pandey, R.P., Van Thang, D., Jung, H.J. & Sohng, J.K. Glycosylation and
subsequent malonylation of isoflavonoids in E. coli: strain development, production and
insights into future metabolic perspectives. J Ind Microbiol Biotechnol (2014).
26. Malla, S., Koffas, M.A., Kazlauskas, R.J. & Kim, B.G. Production of 7-O-methyl
aromadendrin, a medicinally valuable flavonoid, in Escherichia coli. Applied and
environmental microbiology 78, 684-694 (2012).
27. Rathnasingh, C. et al. Production of 3-hydroxypropionic acid via malonyl-CoA pathway
using recombinant Escherichia coli strains. J Biotechnol 157, 633-640 (2012).
28. Janssen, H.J. & Steinbuchel, A. Fatty acid synthesis in Escherichia coli and its
applications towards the production of fatty acid based biofuels. Biotechnol Biofuels 7, 7
(2014).
29. Lussier, F.X., Colatriano, D., Wiltshire, Z., Page, J.E. & Martin, V.J. Engineering
microbes for plant polyketide biosynthesis. Comput Struct Biotechnol J 3, e201210020
(2012).
30. Causey, T.B., Shanmugam, K.T., Yomano, L.P. & Ingram, L.O. Engineering Escherichia
coli for efficient conversion of glucose to pyruvate. Proceedings of the National Academy
of Sciences of the United States of America 101, 2235-2240 (2004).
31. Cronan, J.E. & Thomas, J. Bacterial fatty acid synthesis and its relationships with
polyketide synthetic pathways. Methods Enzymol 459, 395-433 (2009).
32. Davis, M.S., Solbiati, J. & Cronan, J.E., Jr. Overproduction of acetyl-CoA carboxylase
activity increases the rate of fatty acid biosynthesis in Escherichia coli. The Journal of
biological chemistry 275, 28593-28598 (2000).
33. Santos, C.N., Koffas, M. & Stephanopoulos, G. Optimization of a heterologous pathway
for the production of flavonoids from glucose. Metabolic engineering 13, 392-400
(2011).

90
34. Nakashima, N., Tamura, T. & Good, L. Paired termini stabilize antisense RNAs and
enhance conditional gene silencing in Escherichia coli. Nucleic acids research 34, e138
(2006).
35. Henz, S.R. et al. Distinct expression patterns of natural antisense transcripts in
Arabidopsis. Plant Physiol 144, 1247-1255 (2007).
36. Scalcinati, G. et al. Dynamic control of gene expression in Saccharomyces cerevisiae
engineered for the production of plant sesquitepene alpha-santalene in a fed-batch mode.
Metabolic engineering 14, 91-103 (2012).
37. Storz, G., Vogel, J. & Wassarman, K.M. Regulation by small RNAs in bacteria:
expanding frontiers. Mol Cell 43, 880-891 (2011).
38. Thomason, M.K. & Storz, G. Bacterial Antisense RNAs: How Many Are There, and
What Are They Doing? Annual Review of Genetics, Vol 44 44, 167-188 (2010).
39. Wang, B. & Kuramitsu, H.K. Inducible antisense RNA expression in the characterization
of gene functions in Streptococcus mutans. Infect Immun 73, 3568-3576 (2005).
40. Ji, Y. et al. Validation of antibacterial mechanism of action using regulated antisense
RNA expression in Staphylococcus aureus. FEMS Microbiol Lett 231, 177-184 (2004).
41. Sharma, V., Sakai, Y., Smythe, K.A. & Yokobayashi, Y. Knockdown of recA gene
expression by artificial small RNAs in Escherichia coli. Biochem Biophys Res Commun
430, 256-259 (2013).
42. Tummala, S.B., Welker, N.E. & Papoutsakis, E.T. Design of antisense RNA constructs
for downregulation of the acetone formation pathway of Clostridium acetobutylicum. J
Bacteriol 185, 1923-1934 (2003).
43. Mellin, J.R. et al. A riboswitch-regulated antisense RNA in Listeria monocytogenes.
Proceedings of the National Academy of Sciences of the United States of America 110,
13132-13137 (2013).
44. Na, D. et al. Metabolic engineering of Escherichia coli using synthetic small regulatory
RNAs. Nat Biotechnol 31, 170-174 (2013).
45. Yoo, S.M., Na, D. & Lee, S.Y. Design and use of synthetic regulatory small RNAs to
control gene expression in Escherichia coli. Nature Protocols 8, 1694-1707 (2013).
46. Solomon, K.V., Sanders, T.M. & Prather, K.L. A dynamic metabolite valve for the
control of central carbon metabolism. Metabolic engineering 14, 661-671 (2012).
47. Kang, Z., Wang, X., Li, Y., Wang, Q. & Qi, Q. Small RNA RyhB as a potential tool used
for metabolic engineering in Escherichia coli. Biotechnol Lett 34, 527-531 (2012).
48. Lutz, R. & Bujard, H. Independent and tight regulation of transcriptional units in
Escherichia coli via the LacR/O, the TetR/O and AraC/I1-I2 regulatory elements. Nucleic
Acids Res 25, 1203-1210 (1997).
49. Shen, C.R. & Liao, J.C. Metabolic engineering of Escherichia coli for 1-butanol and 1-
propanol production via the keto-acid pathways. Metabolic engineering 10, 312-320
(2008).
50. Huo, Y.X. et al. Conversion of proteins into biofuels by engineering nitrogen flux. Nat
Biotechnol 29, 346-U160 (2011).
51. Leonard, E., Chemler, J., Lim, K.H. & Koffas, M.A. Expression of a soluble flavone
synthase allows the biosynthesis of phytoestrogen derivatives in Escherichia coli. Applied
microbiology and biotechnology 70, 85-91 (2006).

91
52. Lim, C.G., Fowler, Z.L., Hueller, T., Schaffer, S. & Koffas, M.A. High-yield resveratrol
production in engineered Escherichia coli. Applied and environmental microbiology 77,
3451-3460 (2011).
53. Leonard, E., Yan, Y.J. & Koffas, M.A.G. Functional expression of a P450 flavonoid
hydroxylase for the biosynthesis of plant-specific hydroxylated flavonols in Escherichia
coli. Metabolic engineering 8, 172-181 (2006).
54. Yan, Y., Chemler, J., Huang, L., Martens, S. & Koffas, M.A. Metabolic engineering of
anthocyanin biosynthesis in Escherichia coli. Applied and environmental microbiology
71, 3617-3623 (2005).
55. Yan, Y.J., Kohli, A. & Koffas, M.A.G. Biosynthesis of natural flavanones in
Saccharomyces cerevisiae. Applied and environmental microbiology 71, 5610-5613
(2005).
56. Rapp, M. et al. Experimentally based topology models for E-coli inner membrane
proteins. Protein Sci 13, 937-945 (2004).
57. Livak, K.J. & Schmittgen, T.D. Analysis of relative gene expression data using real-time
quantitative PCR and the 2(-Delta Delta C(T)) Method. Methods 25, 402-408 (2001).
58. Xu, P. et al. Design and kinetic analysis of a hybrid promoter-regulator system for
malonyl-CoA sensing in Escherichia coli. ACS Chem Biol 9, 451-458 (2014).
59. Minkler, P.E., Kerner, J., Kasumov, T., Parland, W. & Hoppel, C.L. Quantification of
malonyl-coenzyme A in tissue specimens by high-performance liquid
chromatography/mass spectrometry. Anal Biochem 352, 24-32 (2006).
60. Onorato, J.M. et al. Liquid-liquid extraction coupled with LC/MS/MS for monitoring of
malonyl-CoA in rat brain tissue. Anal Bioanal Chem 397, 3137-3142 (2010).
61. Patnaik, R., Roof, W.D., Young, R.F. & Liao, J.C. Stimulation of glucose catabolism in
Escherichia coli by a potential futile cycle. Journal of bacteriology 174, 7527-7532
(1992).
62. Crosby, H.A., Rank, K.C., Rayment, I. & Escalante-Semerena, J.C. Structure-guided
expansion of the substrate range of methylmalonyl coenzyme A synthetase (MatB) of
Rhodopseudomonas palustris. Applied and environmental microbiology 78, 6619-6629
(2012).
63. Shi, S., Chen, Y., Siewers, V. & Nielsen, J. Improving production of malonyl coenzyme
A-derived metabolites by abolishing Snf1-dependent regulation of Acc1. MBio 5,
e01130-01114 (2014).
64. Lee, S., Lee, S., Yoon, Y.J. & Lee, J. Enhancement of long-chain fatty acid production in
Escherichia coli by coexpressing genes, including fabF, involved in the elongation cycle
of fatty acid biosynthesis. Appl Biochem Biotechnol 169, 462-476 (2013).
65. Price, A.C. et al. Inhibition of beta-ketoacyl-acyl carrier protein synthases by
thiolactomycin and cerulenin. Structure and mechanism. The Journal of biological
chemistry 276, 6551-6559 (2001).
66. Nakashima, N. & Tamura, T. Conditional gene silencing of multiple genes with antisense
RNAs and generation of a mutator strain of Escherichia coli. Nucleic acids research 37,
e103 (2009).
67. Wu, J.J., Yu, O., Du, G.C., Zhou, J.W. & Chen, J. Fine-Tuning of the Fatty Acid Pathway
by Synthetic Antisense RNA for Enhanced (2S)-Naringenin Production from L-Tyrosine
in Escherichia coli. Applied and environmental microbiology 80, 7283-7292 (2014).

92
68. Weintraub, H., Izant, J.G. & Harland, R.M. Anti-Sense Rna as a Molecular Tool for
Genetic-Analysis. Trends Genet 1, 22-25 (1985).
69. Chen, G.Z., Patten, C.L. & Schellhorn, H.E. Controlled expression of an rpoS antisense
RNA can inhibit RpoS function in Escherichia coli. Antimicrob Agents Ch 47, 3485-3493
(2003).
70. Yin, D.Z. & Ji, Y.D. Genomic analysis using conditional phenotypes generated by
antisense RNA. Curr Opin Microbiol 5, 330-333 (2002).
71. Rasmussen, L.C.V., Sperling-Petersen, H.U. & Mortensen, K.K. Hitting bacteria at the
heart of the central dogma: sequence-specific inhibition. Microb Cell Fact 6 (2007).
72. Carpousis, A.J. Degradation of targeted mRNAs in Escherichia coli: regulation by a
small antisense RNA. Gene Dev 17, 2351-2355 (2003).
73. Wagner, E.G.H., Altuvia, S. & Romby, P. Antisense RNAs in bacteria and their genetic
elements. Adv Genet 46, 361-398 (2002).
74. Tilley, L.D. et al. Gene-specific effects of antisense phosphorodiamidate morpholino
oligomer-peptide conjugates on Escherichia coli and Salmonella enterica serovar
typhimurium in pure culture and in tissue culture. Antimicrob Agents Ch 50, 2789-2796
(2006).
75. Ross, J.A., Ellis, M.J., Hossain, S. & Haniford, D.B. Hfq restructures RNA-IN and RNA-
OUT and facilitates antisense pairing in the Tn10/IS10 system. Rna 19, 670-684 (2013).
76. Cruz, C. & Houseley, J. Endogenous RNA interference is driven by copy number. Elife 3
(2014).
77. Liu, D., Xiao, Y., Evans, B.S. & Zhang, F. Negative feedback regulation of fatty acid
production based on a malonyl-CoA sensor-actuator. ACS synthetic biology 4, 132-140
(2015).
78. Collier, J. Epigenetic regulation of the bacterial cell cycle. Current opinion in
microbiology 12, 722-729 (2009).
79. Berkhout, J., Bruggeman, F.J. & Teusink, B. Optimality principles in the regulation of
metabolic networks. Metabolites 2, 529-552 (2012).
80. Avalos, J.L., Fink, G.R. & Stephanopoulos, G. Compartmentalization of metabolic
pathways in yeast mitochondria improves the production of branched-chain alcohols.
Nature biotechnology 31, 335-341 (2013).
81. Castellana, M. et al. Enzyme clustering accelerates processing of intermediates through
metabolic channeling. Nature biotechnology 32, 1011-1018 (2014).
82. Dueber, J.E. et al. Synthetic protein scaffolds provide modular control over metabolic
flux. Nature biotechnology 27, 753-759 (2009).
83. Zhang, K., Sawaya, M.R., Eisenberg, D.S. & Liao, J.C. Expanding metabolism for
biosynthesis of nonnatural alcohols. Proceedings of the National Academy of Sciences
105, 20653-20658 (2008).
84. Alper, H., Fischer, C., Nevoigt, E. & Stephanopoulos, G. Tuning genetic control through
promoter engineering. Proceedings of the National Academy of Sciences of the United
States of America 102, 12678-12683 (2005).
85. Thomason, L.C., Costantino, N. & Court, D.L. E. coli genome manipulation by P1
transduction. Current protocols in molecular biology Chapter 1, Unit 1 17 (2007).
86. Doublet, B. et al. Antibiotic marker modifications of lambda Red and FLP helper
plasmids, pKD46 and pCP20, for inactivation of chromosomal genes using PCR products
in multidrug-resistant strains. J Microbiol Meth 75, 359-361 (2008).

93
87. Lin, Y., Sun, X., Yuan, Q. & Yan, Y. Combinatorial biosynthesis of plant-specific
coumarins in bacteria. Metab Eng 18, 69-77 (2013).
88. Chugani, S.A., Parsek, M.R. & Chakrabarty, A.M. Transcriptional repression mediated
by LysR-type regulator CatR bound at multiple binding sites. J Bacteriol 180, 2367-2372
(1998).
89. Parsek, M.R., Kivisaar, M. & Chakrabarty, A.M. Differential DNA Bending Introduced
by the Pseudomonas-Putida Lysr-Type Regulator, Catr, at the Plasmid-Borne Pheba and
Chromosomal Catbc Promoters. Molecular microbiology 15, 819-828 (1995).
90. Parsek, M.R., Ye, R.W., Pun, P. & Chakrabarty, A.M. Critical Nucleotides in the
Interaction of a Lysr-Type Regulator with Its Target Promoter Region - Catbc Promoter
Activation by Catr. J Biol Chem 269, 11279-11284 (1994).
91. Chugani, S.A. et al. Activation of the catBCA promoter: Probing the interaction of CatR
and RNA polymerase through in vitro transcription. Journal of bacteriology 179, 2221-
2227 (1997).
92. Hook-Barnard, I.G. & Hinton, D.M. The promoter spacer influences transcription
initiation via sigma(70) region 1.1 of Escherichia coli RNA polymerase. P Natl Acad Sci
USA 106, 737-742 (2009).
93. Rugbjerg, P., Gence, H.J., Jensen, K., Sarup-Lytzen, K. & Sommer, M.O.A. Molecular
Buffers Permit Sensitivity Tuning and Inversion of Riboswitch Signals. ACS synthetic
biology 5, 632-638 (2016).
94. Gosset, G. Improvement of Escherichia coli production strains by modification of the
phosphoenolpyruvate: sugar phosphotransferase system. Microbial Cell Factories 4, 1
(2005).
95. Lin, Y.H., Sun, X.X., Yuan, Q.P. & Yan, Y.J. Combinatorial biosynthesis of plant-
specific coumarins in bacteria. Metabolic engineering 18, 69-77 (2013).
96. Bonde, M.T. et al. Direct Mutagenesis of Thousands of Genomic Targets Using
Microarray-Derived Oligonucleotides. Acs Synth Biol 4, 17-22 (2015).
97. Wang, H.H. et al. Genome-scale promoter engineering by coselection MAGE. Nat
Methods 9, 591-+ (2012).
98. Ma, N.J., Moonan, D.W. & Isaacs, F.J. Precise manipulation of bacterial chromosomes
by conjugative assembly genome engineering. Nature Protocols 9, 2285-2300 (2014).
99. Isaacs, F.J. et al. Precise Manipulation of Chromosomes in Vivo Enables Genome-Wide
Codon Replacement. Science 333, 348-353 (2011).
100. Jinek, M. et al. A programmable dual-RNA-guided DNA endonuclease in adaptive
bacterial immunity. Science 337, 816-821 (2012).
101. Cress, B.F. et al. CRISPathBrick: Modular Combinatorial Assembly of Type II-A
CRISPR Arrays for dCas9-Mediated Multiplex Transcriptional Repression in E-coli. Acs
Synth Biol 4, 987-1000 (2015).
102. Cress, B.F., Trantas, E.A., Ververidis, F., Linhardt, R.J. & Koffas, M.A. Sensitive cells:
enabling tools for static and dynamic control of microbial metabolic pathways. Current
opinion in biotechnology 36, 205-214 (2015).