engineering fundamentals and problem solving,...
TRANSCRIPT
9/25/2017
1
Engineering Fundamentals and Problem Solving, 6e
Chapter 5
Representation of Technical Information
Engineering: Fundamentals and Problem Solving, 6e
Eide Jenison Northup Mickelson
Copyright © 2012 by The McGraw-Hill Companies, Inc. All rights reserved.
Chapter Objectives1. Recognize the importance of collecting, recording,
plotting, and interpreting technical data for engineering analysis and design
2. Put into practice methods for graphical presentation of scientific data and graphical analysis of plotted data
3. Develop the ability to graph data using uniform and nonuniform scales
4. Apply methods of selected points and least squares for determining the equation that gives the best-fit line to the given data
5. Determine the most appropriate family of curves (linear, power, or exponential) that gives the best fit to the given data
2

9/25/2017
2
Engineering: Fundamentals and Problem Solving, 6e
Eide Jenison Northup Mickelson
Copyright © 2012 by The McGraw-Hill Companies, Inc. All rights reserved.
3
1. Select the type of graph paper• rectangular [aka rectilinear]• semilog• log-log)
and appropriate grid spacing forthe given data.
2. Choose the location of the horizontal and vertical axes.
3. Determine the scale units (range) for each axis
4. Graduate and calibrate the axesusing the 1, 2, 5 rule.
5. Identify each axis completely.
General Graphing Procedures
Engineering: Fundamentals and Problem Solving, 6e
Eide Jenison Northup Mickelson
Copyright © 2012 by The McGraw-Hill Companies, Inc. All rights reserved.
6. Plot points and use permissiblesymbols.
7. Double check any point thatdeviates from the line.
8. Draw the curve or curves.
9. Identify each curve, add title, and include other necessarynotes.
10. Darken lines for good reproduction.
4
General Graphing Procedures-cont’d
9/25/2017
3
Engineering: Fundamentals and Problem Solving, 6e
Eide Jenison Northup Mickelson
Copyright © 2012 by The McGraw-Hill Companies, Inc. All rights reserved.
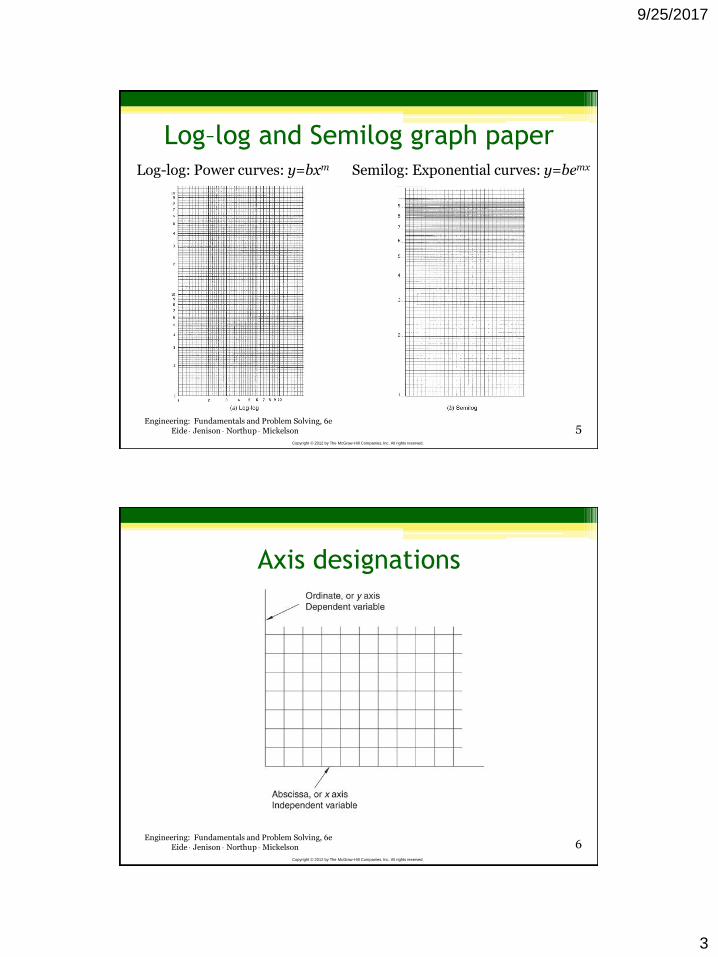
Log–log and Semilog graph paper
5
Log-log: Power curves: y=bxm Semilog: Exponential curves: y=bemx
Engineering: Fundamentals and Problem Solving, 6e
Eide Jenison Northup Mickelson
Copyright © 2012 by The McGraw-Hill Companies, Inc. All rights reserved.
Axis designations
6
9/25/2017
4
Engineering: Fundamentals and Problem Solving, 6e
Eide Jenison Northup Mickelson
Copyright © 2012 by The McGraw-Hill Companies, Inc. All rights reserved.
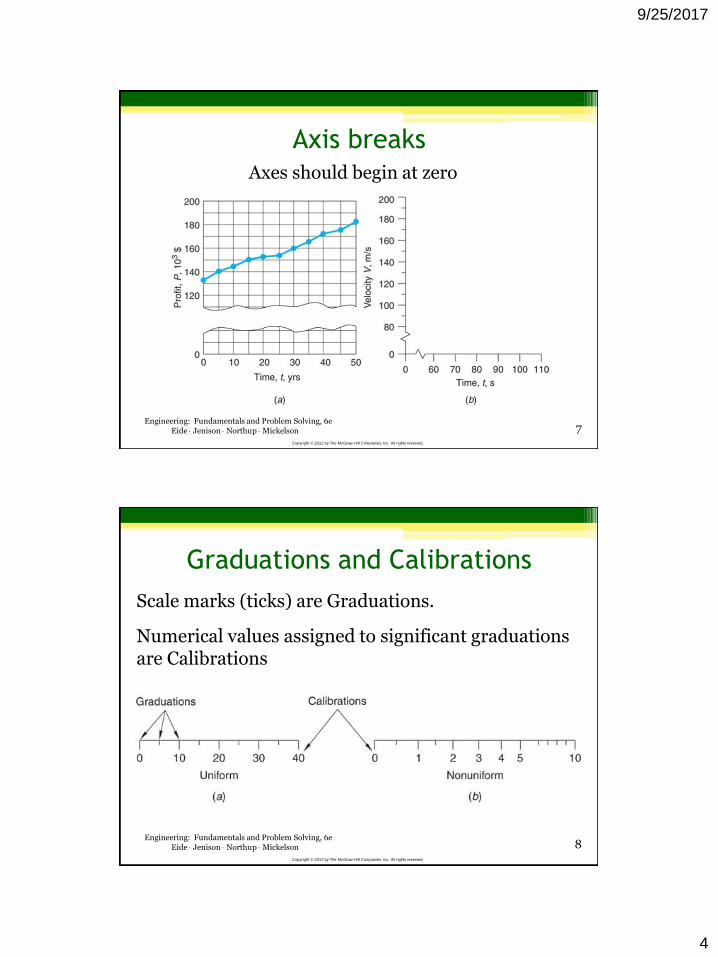
Axis breaks
7
Axes should begin at zero
Engineering: Fundamentals and Problem Solving, 6e
Eide Jenison Northup Mickelson
Copyright © 2012 by The McGraw-Hill Companies, Inc. All rights reserved.
Graduations and Calibrations
8
Scale marks (ticks) are Graduations.
Numerical values assigned to significant graduations are Calibrations

9/25/2017
5
Engineering: Fundamentals and Problem Solving, 6e
Eide Jenison Northup Mickelson
Copyright © 2012 by The McGraw-Hill Companies, Inc. All rights reserved.
1, 2, 5 Rule
The smallest division of the axis should be a positive or negative integer power of 10 times 1, 2, or 5.
9
Engineering: Fundamentals and Problem Solving, 6e
Eide Jenison Northup Mickelson
Copyright © 2012 by The McGraw-Hill Companies, Inc. All rights reserved.
Axis Labeling
The axis label should contain the name of the variable, its symbol, and its units.
10

9/25/2017
6
Engineering: Fundamentals and Problem Solving, 6e
Eide Jenison Northup Mickelson
Copyright © 2012 by The McGraw-Hill Companies, Inc. All rights reserved.
Calibrating log scales
11
Preferred method of calibrating log scales uses powers of 10 on major graduations
Engineering: Fundamentals and Problem Solving, 6e
Eide Jenison Northup Mickelson
Copyright © 2012 by The McGraw-Hill Companies, Inc. All rights reserved.
Plotting data points
12
Observed:
• Data points connected by straight irregular line segments.
• Line does not penetrate circles
Empirical:
• Interpretation of what occurs between data points.
• Smooth line fitted to the data points.
• Data may or may not fall on curve.
Theoretical:
• Graph of an equation.
• Smooth and without symbols.
• Every point is a data point.

9/25/2017
7
Engineering: Fundamentals and Problem Solving, 6e
Eide Jenison Northup Mickelson
Copyright © 2012 by The McGraw-Hill Companies, Inc. All rights reserved.
Graph key
13
•Defines symbols and line types.
•On a portion of the grid.
•Enclosed in a border.
Engineering: Fundamentals and Problem Solving, 6e
Eide Jenison Northup Mickelson
Copyright © 2012 by The McGraw-Hill Companies, Inc. All rights reserved.
Method of selected points for linear
equations1. Plot the data on rectangular
paper, draw in best straight line to fit plotted points
2. Select 2 points on the line (not necessarily data points) and record their values
3. Substitute points into the linear equation y=mx+b
4. Solve for m and b
5. Chose a third point on the line to verify the equation
14

9/25/2017
8
Engineering: Fundamentals and Problem Solving, 6e
Eide Jenison Northup Mickelson
Copyright © 2012 by The McGraw-Hill Companies, Inc. All rights reserved.
Example Problem 1
The velocity of an experimental automobile is measured at specified time intervals. Determine the equation of a straight line constructed through the points recorded in the following table.
Time, t, s 0 5 10 15 20 25 30 35 40
Velocity, V, m/s
24 33 62 77 105 123 151 170 188
15
Engineering: Fundamentals and Problem Solving, 6e
Eide Jenison Northup Mickelson
Copyright © 2012 by The McGraw-Hill Companies, Inc. All rights reserved.
Procedure:
• Plot data on rectangular graph paper.
• Select two points on the line, A(t1, V1) and B(t2, V2), and record the values of these points.
16
Example Problem 1 – cont’d

9/25/2017
9
Engineering: Fundamentals and Problem Solving, 6e
Eide Jenison Northup Mickelson
Copyright © 2012 by The McGraw-Hill Companies, Inc. All rights reserved.
Procedure:
• Plot data on rectangular graph paper.
• Select two points on the line, A(t1, V1) and B(t2, V2), and record the values of these points.
A(10, 60)
B(35, 165)
17
Example Problem 1 – cont’d
Engineering: Fundamentals and Problem Solving, 6e
Eide Jenison Northup Mickelson
Copyright © 2012 by The McGraw-Hill Companies, Inc. All rights reserved.
• Substitute the points A and B into V = mt + b.
60 = m(10) + b
165 = m(35) + b
• Solve the equations for m and b giving:
V = 4.2t + 18
18
Example Problem 1 – cont’d

9/25/2017
10
Engineering: Fundamentals and Problem Solving, 6e
Eide Jenison Northup Mickelson
Copyright © 2012 by The McGraw-Hill Companies, Inc. All rights reserved.
Method of selected points for power
curves1. Plot the data on log-log paper,
draw in best straight line to fit plotted points
2. Select 2 points on the line (not necessarily data points) and record their values
3. Substitute points into the power equation log y = m log x + log b,
4. Solve for m and b
5. Chose a third point on the line to verify the equation
20
Engineering: Fundamentals and Problem Solving, 6e
Eide Jenison Northup Mickelson
Copyright © 2012 by The McGraw-Hill Companies, Inc. All rights reserved.
Method of selected points for
exponential curves1. Plot the data on semilog paper,
draw in best straight line to fit plotted points
2. Select 2 points on the line (not necessarily data points) and record their values
3. Substitute points into the exponential equation log y = mx log e + log b,
4. Solve for m and b
5. Chose a third point on the line to verify the equation
21

9/25/2017
11
Engineering: Fundamentals and Problem Solving, 6e
Eide Jenison Northup Mickelson
Copyright © 2012 by The McGraw-Hill Companies, Inc. All rights reserved.
Example Problem 2
A solid object is dropped from a tall building, and the values, time versus distance are as recorded in the table below.
22
Engineering: Fundamentals and Problem Solving, 6e
Eide Jenison Northup Mickelson
Copyright © 2012 by The McGraw-Hill Companies, Inc. All rights reserved.
Procedure:
• Plot the data on log-log paper.
• Select two points on the line.
A(1.5,11)
B(6,175)
23
Example Problem 2 - cont’d
9/25/2017
12
Engineering: Fundamentals and Problem Solving, 6e
Eide Jenison Northup Mickelson
Copyright © 2012 by The McGraw-Hill Companies, Inc. All rights reserved.
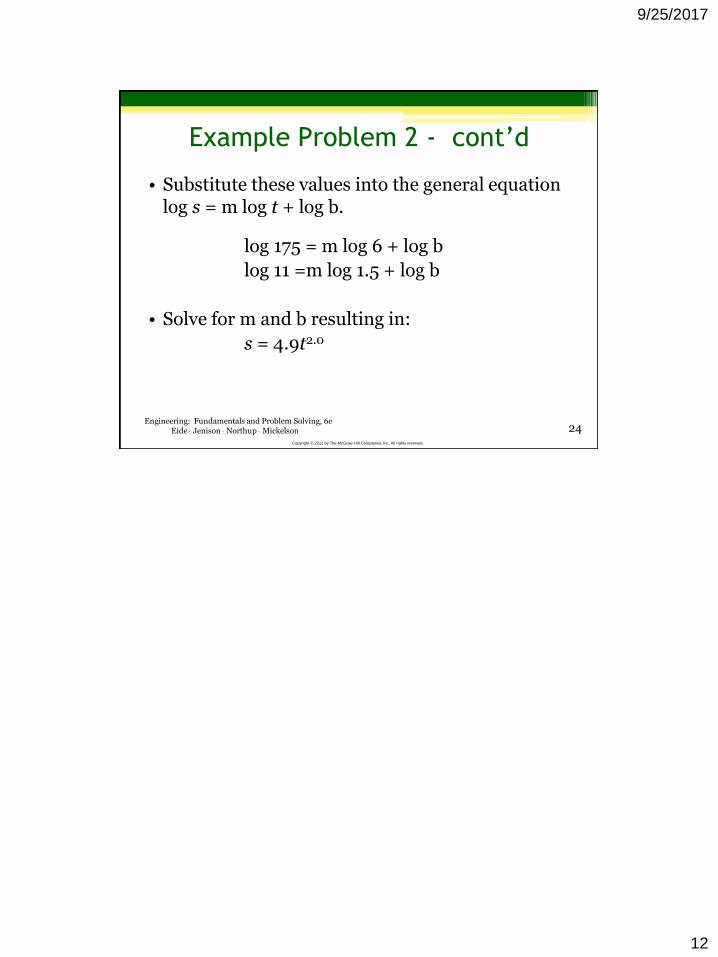
• Substitute these values into the general equation log s = m log t + log b.
log 175 = m log 6 + log b
log 11 =m log 1.5 + log b
• Solve for m and b resulting in:
s = 4.9t2.0
24
Example Problem 2 - cont’d