engineering fracture mechanics - portalsaberlivre.com.br · clactec – instituto de tecnologia...
TRANSCRIPT

Engineering Fracture Mechanics 162 (2016) 232–255
Contents lists available at ScienceDirect
Engineering Fracture Mechanics
journal homepage: www.elsevier .com/locate /engfracmech
Analytical fractal model for rugged fracture surface of brittlematerials
http://dx.doi.org/10.1016/j.engfracmech.2016.05.0150013-7944/� 2016 Elsevier Ltd. All rights reserved.
⇑ Corresponding author.E-mail addresses: [email protected] (L.M. Alves), [email protected] (A.L. Chinelatto), [email protected] (L.A. de La
Lucas M. Alves a,⇑, A.L. Chinelatto b, Edson Cezar Grzebielucka b, Eduardo Prestes b,L.A. de Lacerda c
aGTEME – Grupo de Termodinâmica, Mecânica e Eletrônica dos Materiais, Departamento de Engenharia de Materiais, Setor de Ciências Agrárias e deTecnologia, Universidade Estadual de Ponta Grossa, Av. Gal. Carlos Calvalcanti, 4748, Campus UEPG/Bloco CIPP – Uvaranas, Ponta Grossa, PR CEP. 84030.900, BrazilbDepartamento de Engenharia de Materiais, Setor de Ciências Agrárias e de Tecnologia, Universidade Estadual de Ponta Grossa, Av. Gal. Carlos Calvalcanti, 4748,Campus UEPG/Bloco CIPP – Uvaranas, Ponta Grossa, PR CEP. 84030.900, Brazilc LACTEC – Instituto de Tecnologia para o Desenvolvimento, Universidade Federal do Paraná - PPGMNE, Centro Politécnico da Universidade Federal do Paraná,Cx. P. 19067, Curitiba, PR, Brazil
a r t i c l e i n f o a b s t r a c t
Article history:Received 28 August 2015Received in revised form 15 May 2016Accepted 17 May 2016Available online 26 May 2016
Keywords:Fractal dimensionFracture profileMortarHeavy clayRoughnessSelf-affine surface
The fractal modeling of a rugged fracture surface has received different purposes. Howevernone definitive model for the most of materials has been reached. Therefore, a general self-affine fractal model is proposed for fracture surfaces and applied to heavy clay and mortar.An analytical expression for the rugged crack length is obtained for application on fractalfracture mechanics. Stereoscopic images are obtained for each tested specimens. Imageprocessing filters are used to extract the rugged profile of the cracks. The box-countingand sand-box methods are used on the crack profile to obtain the local and the globalroughness exponents. Specimens prepared under different conditions validated the model.Mortars and heavy clay specimens were characterized by measuring their modulus of rup-ture and the rugged crack profile under 3-point bending tests. A good agreement betweenthe model and the experimental results was observed. A strong correlation between thefractal dimension and the sintering temperature for heavy clay specimens was verified.The results also showed that the increasing rugged crack length of the profile of the frac-tured mortar specimens is well correlated with the increase in water/cement ratio. Theseresults validate the application of the proposed model for estimating the fracture strengthof brittle materials.
� 2016 Elsevier Ltd. All rights reserved.
1. Introduction
The fracture surface is a record of the information left by the fracture process. Generally, the rugged fracture surface pro-file has fractal geometry, so it is possible to establish a relationship between its topology and physical quantities of the frac-ture mechanics using fractal characterization techniques. However, the classical fracture mechanics (CFM) was developedidealizing a flat, smooth, and regular fracture surface, as the geometry of crack surfaces is usually rugged and cannot beeasily described by the Euclidean geometry [1]. In this sense, the mathematical basis of CFM considers an energeticequivalent between the rugged and the projected fracture surfaces [2]. Besides the mathematical complexity, part of this
cerda).

Nomenclature
Latin characters0 index to denote measurements taken on the projected planea minimal area of fracture surfaceDA area of fracture surfaceA1;A2;A3;Ar1; . . . ;Ar30 mortar and ceramic samplesB1;B2;B3;Br1; . . . ;B30 mortar and ceramic samplesC1;C2;C3;Cr1; . . . ;Cr30 mortar and ceramic samplesd infinitesimal incrementD1;D2;D3;Dr1; . . . ;Dr30 mortar and ceramic samplesDB fractal box dimensionDf fractal dimensionDD divider dimensionDBC fractal dimension measured by box-counting methode0 fractal cell size or minimal crack length in transversal directionE elastic or Young’ s modulusE0 crack length measured in transversal directionDE0 variation of crack length measured in transversal directionf general functionsg general functions or subscript index for global quantityG elastic energy release rateh0 fractal cell size or minimal crack length in vertical directionH Hurst’s exponentH0 plane projected crack heightDH0 variation in the plane projected crack heightK multiplicative factorKx multiplicative factor in x-directionKy multiplicative factor in y-directionl subscript index for local quantityL rugged crack lengthLBC rugged crack length measured by box-counting methodlx; ly; lz rulers length or scale in the x-direction, y-direction, z-direction, respectivelyl0 fractal cell size or minimal crack length in propagation directionL0 plane projected crack length measured in propagation directionL0S saturation plane projected crack length measured in propagation directionL0C Griffith’s critical crack lengthDL rugged crack lengthDL0 distance between two points of the crack (the projected length of the crack)DL0C critical crack lengthNL number of units of the crack length in longitudinal or propagation directionNT number of units of the crack length in transversal directionNV number of units of the crack length in vertical or height directionNx number of units of the crack length in the growth directionNy number of units of the crack length in the perpendicular directionsat subscript index indicate saturationY0 shape functionx; y; z spatial coordinatesDx; Dy; Dz, incremental measure length in x-direction, y-direction, z-directionDzx; Dzy fluctuation or roughness mean squares or incremental measure of crack height in x-direction, y-direction,
respectivelyw width of specimen test
Greek lettersb� exponentd incremental measure@ partial derivativeeL; eT horizontal and vertical scale of the fractal scalingce; cp elastic and plastic specific energy surface, respectivelykx amplification factor scale in x-direction
L.M. Alves et al. / Engineering Fracture Mechanics 162 (2016) 232–255 233

ky amplification factor scale in y-direction,n local roughnessfg ; fl global and local roughness exponent, respectivelyfx; fy roughness exponent in x-direction, y-direction, respectivelyrf fracture stresst dynamic roughness exponentv Poisson’s ratio
234 L.M. Alves et al. / Engineering Fracture Mechanics 162 (2016) 232–255
background is associated with the difficulties of making an accurate measurement of the real fracture area. Although thereare several methods capable of quantifying the fracture area, the results are dependent on the size of the ruler of measure-ment [3], which did not contribute for its insertion in the CFM in the past.
With the increasing interest in fractal theory, it became possible to describe and quantify almost any apparently irregularstructure in nature [4]. In fact, many theories based on Euclidean geometry are being reviewed. It has been experimentallyproved that fracture surfaces have fractal scaling, so the fracture mechanics is one of the scientific areas included in thiscontext.
The work herein deals with the mathematical description of the roughness of cracks in the fracture mechanics, using thefractal geometry to model its irregular profiles. Considering that the fracture surface is a record of the information left by thefracture process, it may be possible to establish a relationship between the topology of this surface and the physical quan-tities of the fracture mechanics using fractal characterization techniques. Mandelbrot et al. [5] developed the ‘‘Island Slit”method by searching for correlations between fractal dimensions and well-known physical quantities of fracture mechanics.Following this pioneering work, other authors also made theoretical and geometrical considerations with a similar purpose[6–14], as described briefly below.
1.1. Brief review of fractal scaling models of fracture surfaces
Mosolov [15] and Borodich [14] were the pioneers to associate the strain with the surface energies involved in the frac-ture process with the roughness exponents of the surfaces produced during the breaking process and the splitting of thecrack surfaces. They related these quantities using the singularity exponent of the stress field at the crack tip and the frac-tionary dependence of the fractal scaling exponent in fracture surfaces, postulating the equivalence between the changes inthe strain and the surface energies. Bouchaud and Bouchaud [16] proposed an alternative model from Mosolov [15] whoshowed fracture parameters in terms of the height fluctuations of the rugged fracture surfaces, whose fluctuations are per-pendicular to the crack propagation direction. Bouchad proved the relation between the fracture critical parameters as frac-ture toughness KIC and the relative fluctuations in the height of the rugged surface. The universality of the roughnessexponent for fracture surfaces had been assumed, as it did not depend on the type of material tested [17]. However, thisassumption generated a lot of controversy [18], which led to the discovery of anomalies [19] in the scaling exponents forthe local and the global scales in the fracture surfaces of brittle materials.
Family and Vicsek [20] and Barabási and Stanley [21] showed a fractal scaling model for rugged surfaces formed in bal-listic deposition films. This fractal scaling model was an inspiration for subsequent models of fractal surfaces present in otherphenomenologies. Since then, the modeling of fracture surfaces was done based on the models of Family and Vicsek [22],receiving different supplements [19,23,24]. Based on this work, López and Schmittbuhl [25] proposed an analogous modelfor the fracture surfaces, which accounted for anomalies in the fractal scaling, with critical crossover dimensions for the tran-sition in the roughness behavior of these surfaces in brittle materials. Morel et al. [26] observed experimental anomalies inthe roughness of wood fracture surfaces, and using the fractal model of López et al. [19], they determined the roughness andthe dynamic exponent values. They also showed that the anomalies could only be explained by a dynamic scaling fractalmodel involving local and global roughness exponents [25].
From the initial ideas of López and Schmittbuhl [25] and following their fundamental hypothesis, Morel et al. [27] pro-posed a G–R curve model for fracture surfaces in wood. Morel applied this model to describe the relief presented by therugged fracture surfaces whose topology is characterized by local and global roughness exponents, relating them with thebehavior of the elastic energy release rate and fracture resistance, called ‘‘G–R curve” [28] for a brittle material. He gener-alized the López and Schmittbuhl model including situations that have size effect [27].
This present work presents a generalization of the previous models, elaborating a fractal scaling in the longitudinal direc-tion similar to that in the transversal direction for the crack propagation direction in a coherent way. The fractal surfacesalways exceeds the Euclidean dimensions of its projection and does not fulfill the immediately superior Euclidean dimen-sions in which it is immersed. For instance, a fracture profile has a fractal dimension in the interval 1 6 D 6 2, so it exceedsthe dimensions of a smooth line, but it does not fulfill those of a smooth surface. Morel et al. [24] shows that the fractal nat-ure of a fluctuation Dz in a direction must be scaled using lengths and parameters of the same direction, although there canbe other factors related to the perpendicular direction that can be coupled to the model. In this sense, it is adopted the fol-lowing relationship for the roughness mean square Dzx lx; xð Þ and Dzy ly; y
� �in the transversal and longitudinal directions,
respectively:

L.M. Alves et al. / Engineering Fracture Mechanics 162 (2016) 232–255 235
Dzx lx; xð Þ ¼ Dxfg�fl lflx if lx � Dx
Dxfg if lx � Dx
(
Dzy ly; y� � ¼ Dy
fg�flt lfly if ly � Dy
Dyfgt if ly � Dy
8<:
: ð1Þ
where x; y are the coordinates, lx; ly are the used ruler lengths, Dx;Dy is the interval of measure of roughness, Dzx;Dzy is theheight variation in the transversal and longitudinal directions on the fracture surface respectively, and fg ; fl; t are the global,local and dynamic roughness exponents, respectively.
It is also shown that from a general and analytical definition of a rugged surface, whose height z ¼ f x; yð Þ is a fluctuationfunction of the coordinates of the mean plane of the projected surface, it is possible to establish a general expression thatinvolves the local and the global self-affine fractal scaling for the rugged fracture surface.
Many researchers have developed fractal models for the fracture surface, by employing the roughness dimension andintroducing it to the CFM [16,29–32]. In particular, the work of Alves [32] introduced a self-affine fractal model of a fracturesurface in the mathematical formalism of the CFM through a local roughness derivative term. However, it lacked a moredetailed explanation about the origin of that model. It is shown in the present paper the basic mathematical premises of thisself-affine fractal model derived from Voss [33], who presented a fractal description for the noise in Brownian motions. Tocalculate the rugged dimensions and define the model, the ‘‘box-counting” method is used [34]. A general expression for therugged crack length as a function of the projected length and fractal dimensions is shown. Also, a roughness expression isderived, which can be directly introduced into classical fracture mechanics.
Despite the generality of the model presented in the work herein, applications were focused on brittle material and exper-imental tests were carried out for its validation. Mortar and heavy clay specimens were prepared under different conditions andcharacterized by measuring their modulus of rupture and the rugged crack profile after a 3-point bending test. Obtained resultsshowed that the fractal dimension was capable of representing the roughness of the fracture surface of the different materials. Astrong correlation between the Lipfshit–Hölder exponent for the longitudinal and the vertical directions, and the sintering tem-perature were verified on the heavy clay material. The results also showed that the increasing rugged crack length of the profileof the fractured mortar specimens is well correlated with the increasing water/cement ratio. Overall, the application of the pro-posed self-affine fractal model was validated for estimating the fracture strength of brittle materials.
2. Analytical model for rough surfaces
Consider a rough surface z ¼ f x; yð Þ, as shown in Fig. 1.The area DA of the surface can be parameterized and calculated from Greenberg [35],
DA ¼Z DE0þdE0
DE0
Z DL0þdL0
DL0
ffiffiffiffiffiffiffiffiffiffiffiffiffiffiffiffiffiffiffiffiffiffiffiffiffiffiffiffiffiffiffiffiffiffiffiffiffiffiffiffiffiffiffiffi1þ @f
@x
� �2
þ @f@y
� �2s
dxdy: ð2Þ
If this rough surface is discretized with a mesh lx by ly elements with l0 6 lx 6 dL0 and e0 6 ly 6 dE0, a box-counting methodcan be used to define a relationship between the surface height fluctuations and the area within the limits dL0 and dE0. Thus,for a non-differentiable rough surface the rough area can be approximately calculated from the following:
DA ffiZ DE0þdE0
DE0
Z DL0þdL0
DL0
ffiffiffiffiffiffiffiffiffiffiffiffiffiffiffiffiffiffiffiffiffiffiffiffiffiffiffiffiffiffiffiffiffiffiffiffiffiffiffiffiffiffiffiffiffiffiffiffiffiffiffiffiffiffiffiffiffiffiffiffiffiffiffiffiffiffiffiffiffi1þ Dzx x; yð Þ
lx
� �2
þ Dzy x; yð Þly
� �2s
dxdy ð3Þ
since @f@x ffi Dzx
Dx and @f@y ffi Dzy
Dy .
The area da of each projected element lx by ly is given by the following:
da � lxly
ffiffiffiffiffiffiffiffiffiffiffiffiffiffiffiffiffiffiffiffiffiffiffiffiffiffiffiffiffiffiffiffiffiffiffiffiffiffiffiffiffiffiffiffi1þ Dzx
lx
� �2þ Dzy
ly
� �2s¼ lxlyn ð4Þ
It is observed that the term n ¼ da=lxly represents the local roughness of the rugged surface and the whole area DA is given by,
DA �XNy
j¼1
XNx
i¼1
daij ¼ dL0dE01
NxNy
XNy
j¼1
XNx
i¼1
nij
" #ð5Þ
with Nx ¼ dL0lx
and Ny ¼ dE0ly.
Analogously, the length of a rough profile can be calculated with
DL �XNx
i¼1
dli ¼ dL01Nx
XNx
i¼1
ni
" #ð6Þ
which is a function of the projected length dL0 in the Euclidean space.

Fig. 1. (a) Generic rough surface z = f(x,y); (b) close view of the rough surface limited by dL0 and dE0.
236 L.M. Alves et al. / Engineering Fracture Mechanics 162 (2016) 232–255
3. The self-affine fractal model of a rugged fracture surface
Fracture surfaces are considered fractal objects with statistical invariance by scale transformation (self-similarity or self-affinity). A fractal is an object whose measure of geometrical extension depends on the size of the measurement ruler andhas a so-called Hausdorff–Besicovitch dimension [21,36–39].
Consider now a generic rugged fracture surface (Fig. 1) with self-affine properties [4,17]. As its morphology can be char-acterized by its fractal nature [5,8,14,40], a scale transformation along the orthogonal directions x and y with scale factors kxand ky, respectively, results in the following mathematical relationship:
zðkxx; kyyÞ ¼ kfxx kfyy zðx; yÞ ð7Þ
where fx is the roughness exponent of the surface in direction x and fy is the rough exponent of the surface in direction y. Theself-affinity property allows formulation of Eq. (7) in an uncoupled form and in each perpendicular direction, one has thefollowing:
zxðkxx; yÞ ¼ kfxx zðx; yÞzyðx; kyyÞ ¼ k
fyy zðx; yÞ
ð8Þ
3.1. Computing the area of the rugged fracture surface
The height fluctuations Dz x; yð Þ of the fracture surface can be correlated with their fractal behavior in a window of obser-vation in directions x and y in the following manner,
Dzxðkxx; yÞ ¼ kfxx Dzðx; yÞDzyðx; kyyÞ ¼ k
fyy Dzðx; yÞ
ð9Þ
To calculate the area effectively, it is useful to uncouple the mutual dependence of the transversal and the longitudinalfractal properties of the height fluctuations. The following general scaling relationships for the height fluctuations are pro-posed, dividing Eq. (9) by the unit scale sizes lx and ly, respectively, one obtains
Dzx lx ;xð Þlx
� Dz kfxxlx¼ Dz
lxDxlx
fx
Dzy ly ;yð Þly
� Dzkfyy
ly¼ Dz
lyDyly
fyð10Þ

Fig. 2. The changing fractal dimension of a fracture profile of a brittle material.
L.M. Alves et al. / Engineering Fracture Mechanics 162 (2016) 232–255 237
3.2. Local and global roughness dimensions
Measurements of the fractal dimension Df of a fracture surface profile in a brittle material with the sand-box method [41]show an asymptotic behavior with the growing crack length L0. Fig. 2 shows this behavior, where the fractal dimensiondecreases from an initial local value Df > 1 with L0 � L0S and L0S being the saturation length, to a global value Df � 1 forL0 � L0S. In this sense, the rough length L of the profile is not dependent on the measuring scale lx when L0 � L0S, being closerin size to the projected length L � L0 [25].
To cope with this behavior, Eqs. (10) can be adapted according to these intervals, and the roughness fluctuations in thetransversal and the longitudinal directions [24,26,27] are, respectively, given by
Dzx lx; xð Þ ffi Ky
Dxlx
fxif x � xsat
Dxlx
fgxif x � xsat
8><>: ð11Þ
Dzy ly; y� � ffi Kx
Dyly
fyif y � ysat
Dyly
fgyif y � ysat
8><>: : ð12Þ
where Kx;Ky are functions that relates the interaction of the roughness of one direction to another direction. Note the crossterms in this equation where the roughness in one direction affects the roughness in the other direction. Although the modelseparates contributions from every direction, the fracture occurs at the same time in both directions. Thus the fibers or par-ticles in the microstructure to break up, suffer local strains that have normal and tangential components affecting perpen-dicular directions. fgx and fgy are the global rough fractal exponents in directions x and y, respectively.
3.3. Relationship between transversal and longitudinal roughness exponents
As the self-affine crack presents rough exponents with local and global aspects, the following expressions can be used toaccount for the roughness transition from local to global scales in x and y directions [24,26,27].
fx ¼ fgx � flx ð13Þ
fy ¼ fgy � fly ð14Þ
Considering, for example, that the crack propagates in y direction, the rough exponent fy differs from fx by a dynamic factor1=t [22],
1 $ t
238 L.M. Alves et al. / Engineering Fracture Mechanics 162 (2016) 232–255
fy ¼ fx=t ¼ b� ð15Þ
where b� characterizes crack propagation in y direction along time.Thus, Eqs. (11) and (12) become,
Dzx lx; xð Þ ffi Ky
Dxlx
fgx�flxð Þif x � xsat
Dxlx
fgxif x � xsat
8>><>>: ð16Þ
Dzy ly; y� � ffi Kx
Dyly
fgy�flyð Þif y � ysat
Dyly
fgyif y � ysat
8>><>>: ð17Þ
3.4. Defining the quantities Kx and Ky
The dependency of quantities Kx and Ky must be analyzed. In isotropic materials, the functions that define the self-affinefractal scaling have the same nature in the transversal and the longitudinal directions. Therefore, the height fluctuations aredefined by isomorphic1 functions in both directions, and
@f@x
$ @f@y
ð18Þ
which results in,
Ky
lxDxlx
fgx�flxð Þ $ Kxly
Dyly
fgx�flxð Þt
if DA0 � DA0sat
Ky
lxDxlx
fgx $ Kxly
Dyly
fgxt
if DA0 � DA0sat
ð19Þ
Assuming the scale relationship used by Morel et al. [24,26–28],
Dxlx
� �¼ Dy
ly
� �1t
ð20Þ
Based on Eq. (19), it is possible to express Kx and Ky as functions of the same scaling factors and roughness exponents suchas,
Kx ¼ K Dxlx
fgx�flxð Þ
Ky ¼ K Dyly
fgx�flxð Þt
ð21Þ
where K is a scaling ratio defined in the z direction.Substituting Eq. (21) in Eqs. (16) and (17), one has,
Dzx lx; xð Þ ffi KDyly
� � fgx�flxð Þt
Dxlx
fgx�flxð Þif x � xsat
Dxlx
fgxif x � xsat
8>><>>: ð22Þ
and
Dzy ly; y� � ffi K
Dxlx
� � fgx�flxð Þ Dyly
fgx�flxð Þt
if y � ysat
Dyly
fgyt
if y � ysat
8>><>>: ð23Þ
3.5. Computing the K factor
Consider a section of a rough fracture surface as illustrated in Fig. 3.
his symbol is used to denote isomorphic functions.

Fig. 3. Scheme of a window lx; ly on a rough fracture surface showing the minimal crack lengths e0; l0 for the transversal and the longitudinal directions.
L.M. Alves et al. / Engineering Fracture Mechanics 162 (2016) 232–255 239
Height fluctuations also depend on the scaling of vertical direction, suggesting that K depends on scaling between direc-tions z and x and directions z and y of the crack. In this way, to calculate K ¼ f h0;DH0ð Þ as a power law function of parametersin directions x; y, and z, one must analyze the crack profile on the planes xz or yz, as illustrated in Fig. 4.
Considering square units with sizes l0 h0, covering the crack length DL0 within the area DL0 DH0, and e0 h0, coveringthe crack thickness DE0 within the area DE0 DH0, the number of necessary units to cover the self-affine profile in eachdirection is obtained from,
Fig. 4.FAMILY
NL ¼ NV e�flyL ðlongitudinalÞ ð24Þ
NT ¼ NV e�flxT ðtransversalÞ ð25Þ
where NV is the number of minimal boxes on the z-perpendicular direction to the plane of the crack. flx; fly is the local rough-ness exponent, related to the called divider dimension as fl ¼ 1
DD[42], DE0 is the transversal projection of the crack, DH0 is its
vertical projection, eT and eL are the transversal and the longitudinal scale factors, and e0 6 lx 6 DE0 and l0 6 ly 6 DL0.
Self-affine fractal of Weierstrass–Mandelbrot, where eek ¼ 1=4, Dx = 1.5, and H ¼ 0:5, is used to represent a fracture profile. Source: Modified fromand VICSEK [20, p. 7].

240 L.M. Alves et al. / Engineering Fracture Mechanics 162 (2016) 232–255
Taking a cut plane of the fracture surface in the longitudinal direction the profile of Fig. 4 is obtained. In the profile shownin Fig. 4, the basic measuring units l0, and h0 are different in the longitudinal y, and the vertical z directions, respectively.
If h0 is the minimum scaling factor in vertical direction, one has,
NV ¼ DH0
h0
� �ðverticalÞ ð26Þ
Choosing eL ¼ eT and NL ¼ NT for counting the number of cells in the profile at the xz and the yz planes, one has
DH0
h0
� � e�fly
L ¼ DH0
h0
� � e�flx
T ð27Þ
or
DH0
h0
� � l0
DL0
� ��fly
¼ DH0
h0
� � e0
DE0
� ��flx
ð28Þ
Thus,
l0DL0
� �¼ e0
DE0
� �flxfly ð29Þ
For each xz and yz plane across the crack surface, there is a projected crack profile. The number of cells covered by thefractal scaling in each of these planes in the horizontal and the vertical directions is given by,
NxzL ffi DL0
l0
fy
NxzV ffi DH0
h0
9>=>;
DL0l0
� �fy
ffi DH0
h0
� �ð30Þ
and
NyzT ffi DE0
e0
fx
NyzV ffi DH0
h0
9>=>;
DE0
e0
� �fx
ffi DH0
h0
� �; ð31Þ
respectively. From Eqs. (30) and (31) and t ¼ fx=fy, one has,
DL0l0
fy ffi DH0h0
DE0e0
fx ffi DH0h0
9>=>;
DL0l0
� �1=t
ffi DE0
e0
� �ð32Þ
which is equivalent to Eq. (20). Therefore, from Eq. (31) for K � h0, one has
K ¼ DH0e0DE0
� ��flx
ð33Þ
Substituting Eq. (33) in Eqs. (22) and (23), one can now drop the x subscript of all equations. Therefore the height fluc-tuations are as follows:
@f@x ffi Dzx
lx¼ DH0
lxe0DE0
fl Dxlx
fg�flð Þ Dyly
fg�flð Þt
if x � xsat
@f@x ffi Dzx
lx¼ DH0
lxe0DE0
fl Dxlx
fg Dyly
fg�flð Þt
if x � xsat
8>>><>>>:
ð34Þ
and
@f@y ffi Dzy
ly¼ DH0
lye0DE0
fl Dxlx
fg�flð Þ Dyly
fg�flð Þt
if y � ysat
@f@y ffi Dzy
ly¼ DH0
lye0DE0
fl Dxlx
fg�flð Þ Dyly
fgt
if y � ysat
8>><>>: ð35Þ
Substituting Eqs. (34) and (35) in Eq. (3) for lx ¼ e0 and ly ¼ l0, the area DA is given by:
DA ¼
R DE0þdE0DE0
R DL0þdL0DL0
ffiffiffiffiffiffiffiffiffiffiffiffiffiffiffiffiffiffiffiffiffiffiffiffiffiffiffiffiffiffiffiffiffiffiffiffiffiffiffiffiffiffiffiffiffiffiffiffiffiffiffiffiffiffiffiffiffiffiffiffiffiffiffiffiffiffiffiffiffiffiffiffiffiffiffiffiffiffiffiffiffiffiffiffiffiffiffiffiffiffiffiffiffiffiffiffiffiffiffiffiffiffiffiffiffiffi1þ DH0
l0
2þ DH0
e0
2� �
e0DE0
2fl Dxe0
2 fg�flð Þ Dyl0
2 fg�flð Þt
sdxdy if DA0 � DA0sat
R DE0þdE0DE0
R DL0þdL0DL0
ffiffiffiffiffiffiffiffiffiffiffiffiffiffiffiffiffiffiffiffiffiffiffiffiffiffiffiffiffiffiffiffiffiffiffiffiffiffiffiffiffiffiffiffiffiffiffiffiffiffiffiffiffiffiffiffiffiffiffiffiffiffiffiffiffiffiffiffiffiffiffiffiffiffiffiffiffiffiffiffiffiffiffiffiffiffiffiffiffiffiffiffiffiffiffiffiffiffiffiffi1þ DH0
l0
2þ DH0
e0
2� �
e0DE0
2fl Dxe0
2 fg�flð Þ Dyl0
2fgt
sdxdy if DA0 � DA0sat
8>>>>><>>>>>:
ð36Þ

L.M. Alves et al. / Engineering Fracture Mechanics 162 (2016) 232–255 241
This equation is in agreement with the model presented by Morel et al. [24] and can be seen as ageneralization.
Alternatively, Eq. (36) for the rugged area can be rewritten like,
DA ¼DA0
ffiffiffiffiffiffiffiffiffiffiffiffiffiffiffiffiffiffiffiffiffiffiffiffiffiffiffiffiffiffiffiffiffiffiffiffiffiffiffiffiffiffiffiffiffiffiffiffiffiffiffiffiffiffiffiffiffiffiffiffiffiffiffiffiffiffiffiffiffiffiffiffiffiffiffiffiffiffiffiffiffiffiffiffiffiffiffiffiffiffiffiffiffiffiffiffiffiffiffiffiffiffiffiffiffiffiffiffiffiffi1þ DH0
l0
2þ DH0
e0
2� �
e0DE0
2fl DE0e0
2 fg�flð Þ DL0l0
2 fg�flð Þt
sif DA0 � DA0sat
DA0
ffiffiffiffiffiffiffiffiffiffiffiffiffiffiffiffiffiffiffiffiffiffiffiffiffiffiffiffiffiffiffiffiffiffiffiffiffiffiffiffiffiffiffiffiffiffiffiffiffiffiffiffiffiffiffiffiffiffiffiffiffiffiffiffiffiffiffiffiffiffiffiffiffiffiffiffiffiffiffiffiffiffiffiffiffiffiffiffiffiffiffiffiffiffiffiffiffiffiffiffiffiffiffi1þ DH0
l0
2þ DH0
e0
2� �
e0DE0
2fl DE0e0
2 fg�flð Þ DL0l0
2fgt
sif DA0 � DA0sat
8>>>>><>>>>>:
ð37Þ
3.6. Crack profile model
For the analysis of a crack profile DE0 ffi e0, Eq. (37) becomes:
DL ¼DL0
ffiffiffiffiffiffiffiffiffiffiffiffiffiffiffiffiffiffiffiffiffiffiffiffiffiffiffiffiffiffiffiffiffiffiffiffiffiffiffiffiffiffiffiffiffiffiffiffiffiffiffiffiffiffiffiffiffiffiffiffiffiffiffiffiffiffiffiffiffi1þ DH0
l0
2þ DH0
e0
2� �
DL0l0
2 fg�flð Þt
sif DL0 � DL0s
DL0
ffiffiffiffiffiffiffiffiffiffiffiffiffiffiffiffiffiffiffiffiffiffiffiffiffiffiffiffiffiffiffiffiffiffiffiffiffiffiffiffiffiffiffiffiffiffiffiffiffiffiffiffiffiffiffiffiffiffiffiffiffiffiffi1þ DH0
l0
2þ DH0
e0
2� �
DL0l0
2fgt
sif DL0 � DL0s
8>>>>><>>>>>:
ð38Þ
Observe that the lengths DL0 and DH0 are not necessarily equal and correspond to the projected lengths of the crack, in thehorizontal and the vertical directions, respectively.
To describe a growing crack, one can define a fixed origin coincident with the crack onset at the left (or right) side of thecounting box. The size of the counting box can be adjusted to cover the growing crack. This is the basis of the sand-boxmethod [41] for crack length measurement. Mathematically, this is defined with DL ¼ L; DL0 ¼ L0 and the rugged lengthis given by,
L ¼L0
ffiffiffiffiffiffiffiffiffiffiffiffiffiffiffiffiffiffiffiffiffiffiffiffiffiffiffiffiffiffiffiffiffiffiffiffiffiffiffiffiffiffiffiffiffiffiffiffiffiffiffiffiffiffiffiffiffiffiffiffiffiffiffiffiffiffiffi1þ DH0
l0
2þ DH0
e0
2� �
L0l0
2 fg�flð Þt
sif L0 � L0s
L0
ffiffiffiffiffiffiffiffiffiffiffiffiffiffiffiffiffiffiffiffiffiffiffiffiffiffiffiffiffiffiffiffiffiffiffiffiffiffiffiffiffiffiffiffiffiffiffiffiffiffiffiffiffiffiffiffiffiffiffiffiffi1þ DH0
l0
2þ DH0
e0
2� �
L0l0
2fgt
sif L0 � L0s
8>>>>><>>>>>:
ð39Þ
Applying the logarithm on the both sides of Eq. (39) one obtains an expression that relates the fractal dimension to the pro-jected crack length:
Df � ln L=l0ð Þln L0=l0ð Þ ¼
1þ 12
ln 1þ DH0l0
2
þ DH0e0
2� �
L0l0
2 fg�flð Þt
( )ln L0
if L0 � L0s
1þ 12
ln 1þ DH0l0
2
þ DH0e0
2� �
L0l0
2fgt
( )ln L0
if L0 � L0s
8>>>>>>><>>>>>>>:
ð40Þ
It is important to point out that DL0 denotes the projected distance between two points of the crack (the projected cracklength) and l0 is the minimum possible length of a microcrack, which defines the scale l0=L0 under which the crack profile isscrutinized.
Fig. 5 shows the influence of the height DH0 of the box on the rugged crack length measure, as a function of the projectedlength L0, for L0 � L0S and characteristic values for the parameters fl ¼ 0:8; fg ¼ 1:2; t ¼ 4:0, and l0 ¼ 0:1. Considering afixed roughness exponent fl ¼ 0:8, a linear relationship between L and L0 is seen in lower boxes DH0 ! 0ð Þ, while in higherboxes DH0 ! 1ð Þ a nonlinear one is observed.
Fig. 6 shows the influence of the roughness dimension of the rugged crack length, as a function of the projected length L0.Observe that for fl ! 1, which corresponds to a flatter profile, the relationship between the rugged and the projected lengthsis more linear. Whereas for fl ! 0, corresponding to a more rugged profile, the relationship between the rugged and the pro-jected lengths is increasingly nonlinear.
In near-flat cracks, the box height can be chosen as DH0 ¼ l0 ¼ e0, and Eq. (39) simplifies to,
L ¼L0
ffiffiffiffiffiffiffiffiffiffiffiffiffiffiffiffiffiffiffiffiffiffiffiffiffiffiffiffiffiffiffi1þ 2 L0
l0
2 fg�flð Þt
sif L0 � L0s
L0
ffiffiffiffiffiffiffiffiffiffiffiffiffiffiffiffiffiffiffiffiffiffiffiffiffi1þ 2 L0
l0
2fgt
sif L0 � L0s
8>>>>><>>>>>:
ð41Þ

Fig. 5. Rugged length, L as a function of the projected length, L0 and the varying the box height, DH0, width l0 ¼ 0:1, representing the box height (rectangularbox DL0 – DH0Þ with local roughness dimension, fl ¼ 0:8, global roughness dimension fg ¼ 1:2, and dynamic exponent, t ¼ 4:0.
Fig. 6. Rugged length L as a function of the projected length L0 and the varying the local roughness dimension, fl representing the box height for flat crackswith rectangular boxes DH0 ¼ 1:0; l0 ¼ 0:1, global roughness dimension, fg ¼ 1:2, and dynamic exponent, t ¼ 4:0.
242 L.M. Alves et al. / Engineering Fracture Mechanics 162 (2016) 232–255
In analogous way to the case of Eq. (39), i.e., applying the logaritm on the both sides of Eq. (41) one obtains an expressionthat relates the fractal dimension to the projected crack length,
Df � ln L=l0ð Þln L0=l0ð Þ ¼
1þ 12
ln 1þ2L0l0
2 fg�flð Þt
" #
ln L0if L0 � L0s
1þ 12
ln 1þ2L0l0
2fgt
" #
ln L0if L0 � L0s
8>>>>>>>><>>>>>>>>:
ð42Þ
In the study of a self-affine fractal, two limits can be verified. The first is called ‘‘local limit,” when the height of the boxesis increased compared to its length DH0 ! L0ð Þ. The second is the ‘‘global limit,” when the height of the boxes is small com-pared to its length ðDH0 ! h0Þ. These limits are presented as follows.

L.M. Alves et al. / Engineering Fracture Mechanics 162 (2016) 232–255 243
3.7. Case 1: The initial apparent self-similar limit of the local fractality
The local self-similar limit of the crack fractal measure can be obtained from Eq. (39), considering DH0 ¼ L0 � l0,
L ffi L0l0L0
� �1� fg�flð Þt
ð43Þ
It is a self-similar relationship between the projected crack length Lo and the height ho of the unit box. This expression showsthat all self-affine crack fractals can represent a local self-similarity when the square areas L0 L0 are considered instead ofthe rectangular ones L0 DH0. This is commonly observed in the onset of cracks [12,13,43], where one can extract the fol-lowing result,
L
Lfg�flð Þt
0
ffi lfg�flð Þt �1
0 ¼ cte ð44Þ
which is a constant relationship between the micro- and macroscales.This equation is analogous to the self-similar mathematical relationship described by different authors [7–9,14,44].
3.8. Case 2: The global self-affine limit of the fractality
On the other side, the global self-affine limit of the crack fractal measure can be obtained from Eq. (39), consideringDH0 ¼ l0 � L0,
L ffi L0 ð45Þ
Ductile materials presenting a higher fractality possess a crack profile that can be better adjusted by Eq. (43), while brittlematerials presenting a lower fractality are better adjusted by Eq. (45), which is closer to the classical fracture mechanicsmodel with a flat fracture profile.
3.9. The roughness of a fracture profile
The classical definition of roughness in the fracture mechanics is given by n ¼ L=L0 [2,3]. Alternatively, a local roughness isdefined in this work considering a limiting approach for the counting box dimensions,
n � limDL0!l0
LðL0 þ DL0Þ � LðL0ÞDL0
ð46Þ
In practice, Eq. (46) can be seen as the derivative of the rugged length L ¼ f L0ð Þwith respect to its projected length Lo, writtenas
n � dLdL0
ð47Þ
This definition provides a full characterization of fractal profiles and can be useful to describe the crack growth phenomena.Eq. (47) can be used to calculate the local roughness of the profile, if an expression that relates the rugged length L to theprojected length L0 is known. For instance, for the monofractal case with a square counting box, the measure of the ruggedcrack length is given by Eq. (39). Therefore, the expression for the local roughness is given by,
n ¼
ffiffiffiffiffiffiffiffiffiffiffiffiffiffiffiffiffiffiffiffiffiffiffiffiffiffiffiffiffiffiffiffiffiffiffiffiffiffiffiffiffiffiffiffiffiffiffiffiffi1þ DH0
l0
� �2 L0l0
� �2 fg�flð Þt
vuut þDH0l0
2L0l0
2 fg�flð Þt
ffiffiffiffiffiffiffiffiffiffiffiffiffiffiffiffiffiffiffiffiffiffiffiffiffiffiffiffiffiffiffiffiffiffiffiffiffiffiffiffiffiffi1þ DH0
l0
2L0l0
2 fg�flð Þt
s fg � fl� �
tP 1 ð48Þ
or simply
n ¼1þ fg�flð Þ
t þ 1� �
DH0l0
2L0l0
2 fg�flð Þt
ffiffiffiffiffiffiffiffiffiffiffiffiffiffiffiffiffiffiffiffiffiffiffiffiffiffiffiffiffiffiffiffiffiffiffiffiffiffiffiffiffiffi1þ DH0
l0
2L0l0
2 fg�flð Þt
s P 1 ð49Þ
4. Materials and methodology
The mortar and heavy clay brittle specimens were prepared under different conditions and molded and tested in labora-tory to obtain the rugged fracture surfaces. The specimens were characterized by measuring their modulus of rupture under3-point bending tests.

244 L.M. Alves et al. / Engineering Fracture Mechanics 162 (2016) 232–255
4.1. Mortar specimens
To prepare the mortar specimens, Portland cement ASTM type V (high initial resistance) and natural sand with controlledgrain sizes [45] were used. The Portland cement ASTM was used to compare the results obtained in the work herein with thevalues obtained by other authors in the technical literature [31]. Four weight proportions of cement, sand, and water c=s=wð Þwere applied, as shown in Table 1. It can be seen that from types A to D that water/cement and sand/cement ratios increase.Twelve specimens in total with standard sizes ð40 40 160 mmÞ were prepared according to ASTM C 348 [46] and mixedaccording to ASTM C 305 [47].
For the specimens of Table 1, the relative content of cement was decreasing from A to D, while the proportion of waterwas increased. That was made to compensate the increase in surface area of sand excess in order to get an effect in porosityto obtain a more rugged surface in the fracture testing.
After seven days of curing, 3-point bending tests were carried out using an EMIC DL10000 to evaluate their modulus ofrupture. Those results are shown in Table 2.
4.2. Heavy clay specimens
A homogenized dry clay powder with 5% added water was used to prepare ninety heavy clay specimens in total of dimen-sions 60:2 20:3 mm and thickness of 4 mm, approximately. This thickness was a result of a conforming process of nearly8.5 g of clay under compressive forces applied in two stages – an initial load of 20 kN, followed by a period of rest and a finalload of 30 kN. After that, the specimens were dried along one day and sinterized for two hours in an electrical furnace undertemperatures of 800, 900 and 1000 �C (see Table 3).
After sintering, the specimens were weighed, and their dimensions were measured, and taken for the 3-point bendingtests. Their average modulus of rupture is shown in Table 4.
Table 1Weight proportions of cement, sand and water used for molding the mortarspecimens.
Mortar type Weight proportion c/s/w Number of specimens
A1, A2, A3 1:1:0.30 3B1, B2, B3 1:2:0.45 3C1, C2, C3 1:3:0.60 3D1, D2, D3 1:4:0.75 3
Table 2Average modulus of rupture of mortar specimens obtained after seven dayscuring.
Modulus of rupture (MPa)
Mortar type Number of specimens Average stress Error
A1, A2, A3 3 9.6 ±0.7B1, B2, B3 3 7.8 ±0.9C1, C2, C3 3 6.3 ±0.2D1, D2, D3 3 4.6 ±0.5
Table 3Heavy clay specimens prepared with different sintering temperatures.
Specimen type Sintering temperature (�C) Number of specimens
Ar1;Ar2; . . .Ar30 800 30Br1;Br2; . . .Br30 900 30Cr1;Cr2; . . .Cr30 1000 30
Table 4Average modulus of rupture of heavy clay specimen types.
Modulus of rupture (MPa)
Specimen type Number of specimens Average stress Error
Ar1;Ar2; . . .Ar30 30 2.0 ±0.2Br1;Br2; . . .Br30 30 4.2 ±1.3Cr1;Cr2; . . .Cr30 30 9.0 ±1.0

L.M. Alves et al. / Engineering Fracture Mechanics 162 (2016) 232–255 245
4.3. Crack profiles
After the rupture tests, the fractured surfaces of the specimens were selected for digital imaging with an optical stereomi-croscope (Leica MZ6) connected to a digital CCD camera (KODO KC-512NT). For each fractured side of each specimen, a com-plete fracture surface image was formed by juxtaposing the images. Through software analysis (MOCHA Image Analysisv1.2.10) the crack boundary profiles were obtained. Figs. 7–10 show the crack profiles from specimens mortar D2 side 1,mortar D2 side 2, heavy clay Ar8, and heavy clay Br3, respectively.
The fracture surfaces were digitalized and characterized with the box-counting and sand-box methods to obtain the localand the global roughness exponents. It can be seen that all profiles can be well covered by a rectangular box for the appli-cation of the box-counting method. The bottom side of the box (L0Þ represents the thickness of each specimen. The ruggedprofile length and other model parameters were calculated after fitting the analytical expression.
5. Experimental results
The proposed fractal model was used to describe the roughness of ruptured mortar and heavy clay specimens.The following specimens had their two sides modeled: mortars A2;B2;C1;D2 and heavy clay Ar8;Br3;Cr25. For each pro-
file, the roughness dimensions were obtained applying the box-counting and sand-box methods and fitting the proposedmonofractal model given by Eq. (39). These results are listed in Table 5, represented by DBC ; LBC ; L0; L0s and Table 6 repre-
Fig. 7. Fracture profile of mortar specimen D2 – side 1: digital images side by side and crack profile from processed image with a comparative total rulerlength equal to 1.0 mm.
Fig. 8. Fracture profile of mortar specimen D2 – side 2: digital images side by side and crack profile from processed image with a comparative total rulerlength equal to 1.0 mm.

Fig. 9. Fracture profile of heavy clay specimen Ar8: digital images side by side and crack profile from the processed image with a comparative total rulerlength equal to 1.0 mm.
246 L.M. Alves et al. / Engineering Fracture Mechanics 162 (2016) 232–255
sented by DH0; l0; fl; fg ; b� and t. The fitting parameters L0 ffi 40 mm for mortar and L0 ffi 4 mm for heavy clay ceramic, l0 and fl
in Eq. (39) are also shown in Table 6.Despite the different roles in the morphological description of the fracture surface in x and y directions, experimental
measurements showed that the roughness in these two directions has similar scaling properties for very different materials[48]. A unique roughness exponent is then generally considered and it has been claimed that it has a universal value offl ¼ 0:8 [17]. This behavior has been confirmed for a large variety of experimental situations [23,49]. However, other studieshave also shown that a different value for fl ¼ 0:5 may be applicable [50–52]. These two values of the roughness exponentare connected to the length scale at which the crack is examined. In particular, at small length scales, one observes a rough-ness exponent fl ¼ 0:5, whereas at large length scales, the larger value fl ¼ 0:8 is found. Results presented in Table 6 showrough exponent values between 0.59 and 0.99.
The value of l0 for mortar D2 specimen is very small because its roughness global dimension is very next of unity. Thismeans that the crack profile is almost a straight line. In this case a straight line can be scrutinized by any l0 value that isinfinitely small.
Fig. 11 shows the asymptotic behavior of the fractal dimension with the growing crack length L0, measured with sand-boxmethod. The local L0 � L0S and global L0 � L0S ranges are depicted in the figure.
In Figs. 12 and 13, a good agreement is observed in the curve fitting of Eq. (40) to the fractal analyses of the mortar spec-imen A2 side1 and the heavy clay specimen A8, respectively.
In Figs. 14 and 15, a good agreement is observed in the curve fitting of Eq. (39) to the fractal analyses of the mortar spec-imen A2 side1 and the heavy clay specimen Ar8, respectively.
In Figs. 16 and 17, a comparison of the rugged length L projected length L0 of each crack profile is made for mortars andheavy clay, respectively.
The general behavior is consistent within each group of results. This trend is observed in the LBC=L0 ratios in Table 5.In Fig. 18, the local roughness dL=dL0 was plotted versus the square value of the modulus of rupture r2
f , for the mortarspecimens. A linear trend can be observed where the values plotted are correlated for a R-square correlation coefficient of0.7012.

Table 5Results from fractal analysis using box-counting method of brittle specimens.
Specimen DBC LBC (mm) L0 (mm) LBC=L0 L0s (mm)
Mortar A2 side 1 1.0500 ± 0.0001 59.2064 ± 0.0001 37.2288 ± 0.0001 1.59034 3.616 ± 0.001Mortar A2 side 2 1.0534 ± 0.0001 61.0022 ± 0.0002 39.1765 ± 0.0006 1.55711 3.0123 ± 0.0003Mortar B2 side 1 1.0431 ± 0.0005 65.8381 ± 0.0003 38.2453 ± 0.0001 1.72147 8.5710 ± 0.0003Mortar B2 side 2 1.0380 ± 0.0001 58.5383 ± 0.0002 37.8984 ± 0.0001 1.54461 8.7261 ± 0.0003Mortar C1 side 1 1.0607 ± 0.0003 67.1098 ± 0.0008 35.3309 ± 0.0008 1.89947 9.9510 ± 0.0006Mortar C1 side 2 1.0504 ± 0.0001 72.9876 ± 0.0004 40.0000 ± 0.0003 1.82469 13.700 ± 0.001Mortar D2 side 1 1.0240 ± 0.0002 69.3074 ± 0.0003 40.0000 ± 0.0003 1.73269 12.1460 ± 0.0004Mortar D2 side 2 1.0514 ± 0.0001 73.6647 ± 0.0005 38.3006 ± 0.0005 1.92333 8.2860 ± 0.0002Heavy clay Ar8 1.1511 ± 0.0004 11.4017 ± 0.0003 3.5490 ± 0.0004 3.21282 0.5400 ± 0.0004Heavy clay Br3 1.2292 ± 0.0001 12.7726 ± 0.0002 3.950 ± 0.001 3.23357 0.0728 ± 0.0001Heavy clay Cr25 1.1627 ± 0.0001 13.7940 ± 0.0008 3.7148 ± 0.0004 3.71326 0.7232 ± 0.0003
Fig. 10. Fracture profile of heavy clay specimen Br3: digital images side by side and crack profile from the processed image with a comparative total rulerlength equal to 1.0 mm.
L.M. Alves et al. / Engineering Fracture Mechanics 162 (2016) 232–255 247
In Fig. 19 it is shown the increasing water/cement ratio in the mortar specimens in function of the decreasing modulus ofrupture. Comparing this result with Fig. 18 it is observed that the water/cement ratio affects directly the roughness of thefracture profile. The nonlinear fitting of this curve shown a result given by the following equation:
r2f ¼ r2
f0e�ax ð50Þ
where r2f ¼ 237:59 ðGPa2Þ, a ¼ �3:1205 and x = water/cement ratio for a R-square correlation coefficient value of 0.9515.
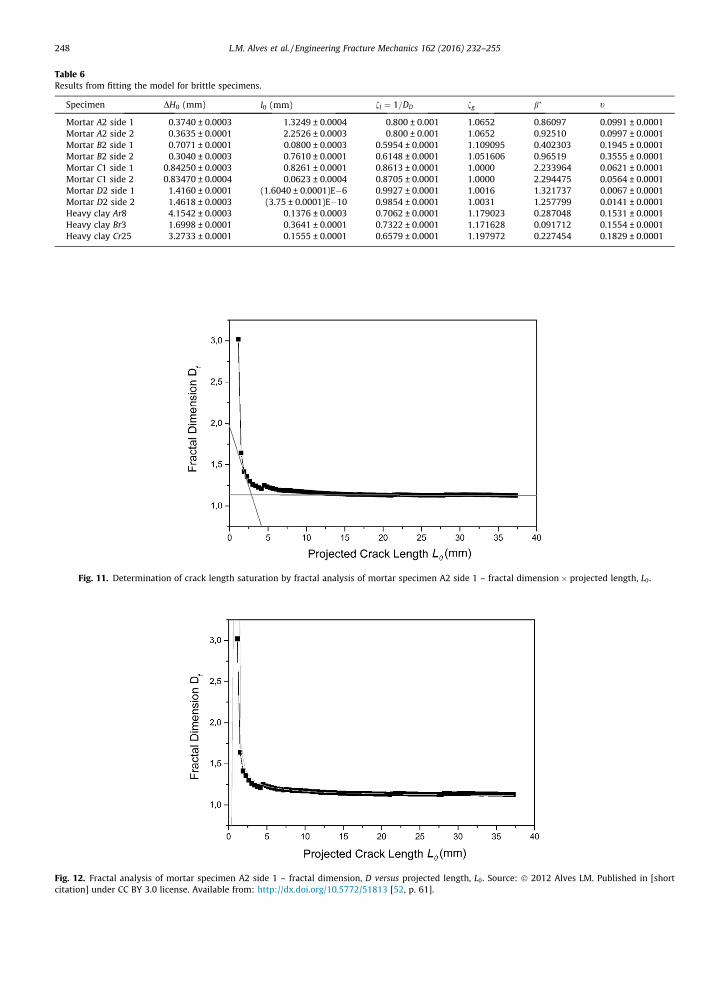
Table 6Results from fitting the model for brittle specimens.
Specimen DH0 (mm) l0 (mm) fl ¼ 1=DD fg b� t
Mortar A2 side 1 0.3740 ± 0.0003 1.3249 ± 0.0004 0.800 ± 0.001 1.0652 0.86097 0.0991 ± 0.0001Mortar A2 side 2 0.3635 ± 0.0001 2.2526 ± 0.0003 0.800 ± 0.001 1.0652 0.92510 0.0997 ± 0.0001Mortar B2 side 1 0.7071 ± 0.0001 0.0800 ± 0.0003 0.5954 ± 0.0001 1.109095 0.402303 0.1945 ± 0.0001Mortar B2 side 2 0.3040 ± 0.0003 0.7610 ± 0.0001 0.6148 ± 0.0001 1.051606 0.96519 0.3555 ± 0.0001Mortar C1 side 1 0.84250 ± 0.0003 0.8261 ± 0.0001 0.8613 ± 0.0001 1.0000 2.233964 0.0621 ± 0.0001Mortar C1 side 2 0.83470 ± 0.0004 0.0623 ± 0.0004 0.8705 ± 0.0001 1.0000 2.294475 0.0564 ± 0.0001Mortar D2 side 1 1.4160 ± 0.0001 (1.6040 ± 0.0001)E�6 0.9927 ± 0.0001 1.0016 1.321737 0.0067 ± 0.0001Mortar D2 side 2 1.4618 ± 0.0003 (3.75 ± 0.0001)E�10 0.9854 ± 0.0001 1.0031 1.257799 0.0141 ± 0.0001Heavy clay Ar8 4.1542 ± 0.0003 0.1376 ± 0.0003 0.7062 ± 0.0001 1.179023 0.287048 0.1531 ± 0.0001Heavy clay Br3 1.6998 ± 0.0001 0.3641 ± 0.0001 0.7322 ± 0.0001 1.171628 0.091712 0.1554 ± 0.0001Heavy clay Cr25 3.2733 ± 0.0001 0.1555 ± 0.0001 0.6579 ± 0.0001 1.197972 0.227454 0.1829 ± 0.0001
Fig. 11. Determination of crack length saturation by fractal analysis of mortar specimen A2 side 1 – fractal dimension projected length, L0.
Fig. 12. Fractal analysis of mortar specimen A2 side 1 – fractal dimension, D versus projected length, L0. Source: � 2012 Alves LM. Published in [shortcitation] under CC BY 3.0 license. Available from: http://dx.doi.org/10.5772/51813 [52, p. 61].
248 L.M. Alves et al. / Engineering Fracture Mechanics 162 (2016) 232–255

Fig. 13. Fractal analysis of heavy clay specimen Ar8 side 1 – fractal dimension, D versus projected length, L0. Source: � 2012 Alves LM. Published in [shortcitation] under CC BY 3.0 license. Available from: http://dx.doi.org/10.5772/51813 [52, p. 61].
Fig. 14. Fractal analysis of mortar specimen A2 side 1 – rugged length, L versus projected length, L0. Source: � 2012 Alves LM. Published in [short citation]under CC BY 3.0 license. Available from: http://dx.doi.org/10.5772/51813 [52, p. 61].
L.M. Alves et al. / Engineering Fracture Mechanics 162 (2016) 232–255 249
6. Discussion
6.1. The relation with the Lopez–Morel fractal model of fracture surface
Morel et al. [24,26–28] describe the variations of roughness with the distance x measured from the notch in the transver-sal direction to the crack propagation. In fact, observing the microstructural aspects of rugged fracture surfaces of woodsused in their work [53], it appears as a ‘‘wave beach” or as a ‘‘brazilian roof,” where in the direction of crack propagationthere are almost no fluctuations in the height of the rugged surface. In spite of this fact, to adapt his scaling to the experi-mental reality, prefactors A and Bwere presented whose nature depends on the material and are obtained by fitting of exper-imental curves. This means that if the material to be modeled presents fluctuations of height in the growth direction, theseprefactors must be explained mathematically in terms of the relations of fractal scaling for the distances of rugged length in

Fig. 15. Fractal analysis of heavy clay specimen Ar8 – rugged length, L versus projected length, L0. Source: � 2012 Alves LM. Published in [short citation]under CC BY 3.0 license. Available from: http://dx.doi.org/10.5772/51813 [52, p. 61].
Fig. 16. Comparative plot of the rugged crack length, L projected crack length, L0 for the sides A and B among main mortars specimen profiles.
250 L.M. Alves et al. / Engineering Fracture Mechanics 162 (2016) 232–255
the direction parallel to the crack growth. The model represents the dependencies in the transversal x and the longitudinal ydirections in a unique mathematical term.
However, for materials such as glass, alumina and mortar, that present fluctuations in the transversal and the longitudinaldirections, the model cannot portray authentically the fluctuations in the height observed in the fracture surface of thesematerials in both directions.
The work herein, it has been shown that the dependence of the fluctuations in the height Dz x tð Þ; y tð Þð Þ can be decoupledand written in a simple way as,
Dz x tð Þ; y tð Þð Þ ¼ f x tð Þð Þ g y tð Þð Þ ð51Þ
without changes in the final result and obtaining the Morel’s model [24,26–28] as a particular case.From Eq. (36), it is possible to reduce dimensionally the model of a fracture surface proposed by Morel et al. [24,26–28] toa fracture profile model, neglecting the fluctuations of the roughness in the transversal crack propagation direction, as in thecase of wood fracture surfaces considering a fracture propagation in the transversal direction to the fibers. In that case thefracture surface is given by:

Fig. 17. Comparative plot of the rugged crack length, L projected crack length, L0 among main heavy clay specimen profiles.
Fig. 18. Plot of square of modulus of rupture versus the derivative of the rugged crack length, dL=dL0.
L.M. Alves et al. / Engineering Fracture Mechanics 162 (2016) 232–255 251
DA ¼R DE0þdE0DE0
R DL0þdL0DL0
ffiffiffiffiffiffiffiffiffiffiffiffiffiffiffiffiffiffiffiffiffiffiffiffiffiffiffiffiffiffiffiffiffiffiffiffiffiffiffiffiffiffiffiffiffiffiffiffiffiffiffiffiffiffiffiffiffiffiffiffiffiffiffiffiffiffiffiffiffiffiffiffiffiffiffiffiffiffiffiffiffiffi1þ DH0
e0
2e0DE0
2fl Dxlx
2 fg�flð Þ Dyly
2 fg�flð Þt
sdxdy if DA0 � DA0sat
R DE0þdE0DE0
R DL0þdL0DL0
ffiffiffiffiffiffiffiffiffiffiffiffiffiffiffiffiffiffiffiffiffiffiffiffiffiffiffiffiffiffiffiffiffiffiffiffiffiffiffiffiffiffiffiffiffiffiffiffiffiffiffiffiffiffiffiffiffiffiffiffiffiffiffiffiffiffiffiffiffiffiffiffiffiffiffi1þ DH0
e0
2e0DE0
2fl Dxlx
2 fg�flð Þ Dyly
2fgt
sdxdy if DA0 � DA0sat
8>>>>><>>>>>:
ð52Þ
where DA0 ¼ dL0dE0 and DA0sat ¼ L0sE0. For minimal subdivisions of the profile in the transversal and the longitudinal direc-tions, i.e., lx ¼ e0 and ly ¼ l0, Eqs. (34) and (35) are rewritten as,
Dz ¼DH0e0
e0DE0
fl Dxe0
fg�flð Þ Dyl0
fg�flð Þt
DH0e0
e0DE0
fl Dxe0
fg�flð Þ Dyl0
fgt
8>><>>: : ð53Þ

Fig. 19. Plot of modulus of rupture versus the water/cement ratio for a mortar cured by seven days.
252 L.M. Alves et al. / Engineering Fracture Mechanics 162 (2016) 232–255
Substituting Eq. (53) in (52) one has:
DA ¼dE0
R DL0þdL0DL0
ffiffiffiffiffiffiffiffiffiffiffiffiffiffiffiffiffiffiffiffiffiffiffiffiffiffiffiffiffiffiffiffiffiffiffiffiffiffiffiffiffiffiffiffiffiffiffiffiffiffiffiffiffiffiffiffiffiffiffiffiffiffiffiffiffiffiffiffiffiffiffiffiffiffiffiffiffiffiffiffiffiffiffi1þ DH0
e0
2e0DE0
2fl DE0e0
2 fg�flð Þ Dyl0
2 fg�flð Þt
sdy if DA0 � DA0sat
dE0R DL0þdL0DL0
ffiffiffiffiffiffiffiffiffiffiffiffiffiffiffiffiffiffiffiffiffiffiffiffiffiffiffiffiffiffiffiffiffiffiffiffiffiffiffiffiffiffiffiffiffiffiffiffiffiffiffiffiffiffiffiffiffiffiffiffiffiffiffiffiffiffiffiffiffiffiffiffiffiffiffiffiffi1þ DH0
e0
2e0DE0
2fl DE0e0
2 fg�flð Þ Dyl0
2fgt
sdy if DA0 � DA0sat
8>>>>><>>>>>:
ð54Þ
Eq. (52) is analogous to the approximations presented by Morel et al. [24] considering the crack propagation direction asbeing the y direction and the constants A;B, and n yð Þ in their equation given by,
A ¼ DH0e0
e0DE0
fl 1e0
fg�flð Þ
B ¼ E0l1=ty
n yð Þ ¼ E0Dyly
1=t
ð55Þ
The saturation length of the fracture surface in the transversal crack propagation is given by,
n ysatð Þ ¼ E0DyL0S
� �1=t
¼ E0 ð56Þ
6.2. Analysis of the values obtained by the fitting
The proposed fractal model presented a good fitting agreement with the experimental results, allowing to obtain theHurst roughness dimension of the profiles. The plots of the rugged crack length of the fracture profiles versus the projectedlength shown in Fig. 16 for mortar and in Fig. 17 for heavy clay were fitted, using the multiparameter nonlinear minimalsquares fitting method for curves, and Levenberg–Marquardt Iteration Algorithm, with the model represented by Eq. (39).
Some plots of the rugged crack length as a function of the projected crack length show a clear transition between the localand the global regimes for the crack growth. This is particularly observed in Fig. 15, after the crack length L0 ffi 0:75 mm,approximately. Beyond this length, the relationship between the rugged and the projected crack lengths becomesquasilinear.
The saturation length L0S was determined in two different ways. The first way was made directly by fitting from the plotsof the rugged length as a function of the projected length. The second way was made by a tangent line from the plot of fractaldimension as a function of the projected crack length by sand-box method. In this second method, a straight tangent line isdrawn from the value 2.0 in the vertical axis (which represents the maximal fractal limit dimension of a rugged line), untilthe horizontal axis, passing by a unique tangent point of the curve fractal dimension versus projected crack length, Df L0.From Table 5 it is possible to observe that the saturation length, L0S for mortar is larger than heavy clay. This result meansthat the rugged crack length of the mortar is smother than the heavy clay which can be easily verified comparing Figs. 7 and8 with Figs. 9 and 10.

L.M. Alves et al. / Engineering Fracture Mechanics 162 (2016) 232–255 253
The local and the global roughness dimensions determined in this work, for the mortar and the heavy clay specimens, arecompatible with results in the literature [24,26–28,30,31,52,53]. However, for some specimens, the values seem to exceedthe expected number, as in the case of mortar C1 (13.699 for the sides 1 and 2) and D2 (12.1456 for the sides 1 and 2).
The fractal box-dimension, DB shown in Table 5 compared to the rugged global dimension, fg in Table 6 presents compat-ibles results one with other. The mortar fractal dimensions are in the interval between 1.0 and 1.1 and the heavy clay has itsfractal dimension in the interval between 1.15 and 1.23. This results is in agreement with the more rugged aspect of thecrack in the heavy clay as shown in Figs. 9 and 10. Therefore, it is possible to distinguish mathematically a crack in thistwo materials using its geometrical characteristics which can be portraited by different values of the exponents in the rela-tions (39) and (41).
A linear relation is observed between the square of modulus of rupture r2f and the values of the local roughness of the
crack given by n ¼ dL=dL0, for the mortar specimens, as shown in Fig. 18. A linear fitting is shown in that figure. Observe thatthe data more below of the linear fitting presented a constant displacement compared to data closer to the straight line. Thusit was due to systematic deviation of the points in the roughness values.
Some authors [20,22,42,50,53] suggest a relation between the local, global, and Hurst exponents, for the tridimensionalcase, such as:
1� H � 3� b2
; ð57Þ
where b ¼ f=t and in this case b � 1þ 2H.Considering that this equation is also valid for b� ¼ fg � fl
� �=t, then
1� H � 3� fg � fl� �
=t2
ð58Þ
and one finds an approximate relation for the dynamic exponent t given by:
t � fg � fl� �1þ 2H
ð59Þ
If the local roughness dimension fl is equal to Hurst exponent H ¼ 2� DB ¼ 1=DD where DB is the box-dimension and DD isthe divider dimension. Then one has the following relation between the obtained exponents,
t � fg � fl� �1þ 2fl
ð60Þ
where
fg � fl� � � 1� H ð61Þ
and
t � 1� H1þ 2H
ð62Þ
Values presented in Table 6 were derived from this expression. Values of t are lower than those in the literature. This wasexpected as the tests were conducted to a fast rupture instead of crack growth.
6.3. Mechanical results
The increasing water/cement ratio in the mortar specimens resulted in a decreasing modulus of rupture as shown inFig. 19. Comparing this result with Fig. 18 it is observed that these results are also well correlated with the roughness ofthe crack profile.
In Tables 3 and 4 for heavy clay, the increasing sintering temperature resulted in higher modulus of rupture. However, theroughness cannot be associated due to the small number of temperatures values of tested specimens.
From the digitalized images of mortar and heavy clay, it can be observed that the fracture surface of the heavy clay pre-sented bigger tortuosity compared to the mortar material. This is also evident in the fitting results where the rugged length isnear 3.5 times the projected length for heavy clay, and only 1.7 for mortar.
It can also be seen in Figs. 14 and 15 that for each type of material the slopes of the asymptotic curves are in very closeagreement with the model proposed.
This work presents several future perspectives in terms of correlating the rugged profiles with the material granulometry,chemical composition, and cement curing time. The mathematical model can still be explored for understanding the minimalcrack length and the fractal dimension according to the mechanical testing parameters and material properties.

254 L.M. Alves et al. / Engineering Fracture Mechanics 162 (2016) 232–255
7. Conclusions
A general self-affine fractal model was presented and applied to brittle fracture surfaces. From the proposed equation, ananalytical expression for the rugged profile length was derived. Also, an analytical expression for the local roughness wasderived, which can be directly introduced into the classical fracture mechanics.
Comparing the fractal box-dimension, DB shown in Table 5 and the rugged global dimension, fg shown in Table 6 for themortar and heavy clay it was possible to distinguish mathematically a more rugged crack in this two materials using its geo-metrical characteristics which can be portraited by different values of those exponents in the relations (39) and (41).
The small ratio between roughness dimension for transversal and longitudinal directions, t, presented in Table 6 andgiven by Eqs. (15), (60) and (62) shown that these two directions are weakly coupled for the analyzed materials, mortarand heavy clay.
The rugged crack length is a response to the interaction of the crack tip with the microstructure of the material. By themodel presented in work herein it is possible mathematically to portray the peculiar rough behavior of a crack in Portlandcement mortar and red ceramics using fractal geometry.
The experimental technique of obtain crack profiles, proved very able to present satisfactory results that are very close toreality.
A good agreement between the fractal model and the experimental results was observed. A strong correlation betweenthe fractal dimension and the sintering temperature was verified. The results also showed that the increasing rugged cracklength of the profile of the fractured mortar specimens is well correlated with the rising water/cement ratio.
Acknowledgments
The authors acknowledge contributions of Interdisciplinary Laboratory of Ceramic Materials – LIMAC-CIPE-UEPG, Prof.Dr. Vicente Campitelli (Civil Engineering Laboratory) and PIBIC/CNPq/UEPG.
References
[1] Underwood EE, Banerji K. Fractal analysis of fracture surfaces. ASM Handbook 1987;12:211–5.[2] Anderson TL. Fracture mechanics: fundamentals and applications. CRC Press; 1995.[3] Dos Santos SF. Aplicação do conceito de fractais para análise do processo de fratura de materiais cerâmicos. Master dissertation. Universidade Federal
de São Carlos. Centro de Ciências Exatas e de Tecnologia, Programa de Pós-Graduação em Ciência e Engenharia de Materiais, São Carlos; 1999.[4] Mandelbrot BB. The fractal geometry of nature. New York: W.H. Freeman and Company; 1983. http://dx.doi.org/10.1119/1.13295.[5] Mandelbrot BB, Passoja DE, Paullay AJ. Fractal character of fracture surfaces of metals. Nature 1984;308:721–2.[6] Mu ZQ, Lung CW. Studies on the fractal dimension and fracture toughness of steel. J Phys D: Appl Phys 1988;21(5):848.[7] Mecholsky JJ, Passoja DE, Feinberg-Ringel KS. Quantitative of brittle analysis fracture surfaces using fractal geometry. J Am Ceram Soc 1989;72(1):60–5.[8] Heping X. The fractal effect of irregularity of crack branching on the fracture toughness of brittle materials. Int J Fract 1989;41(4):267–74.[9] Chelidze T, Gueguen Y. Evidence of fractal fracture. Int J Rock Mech Min Sci Geomech Abstr 1990;27(3):223–5.[10] Lin GM, Lai JKL. Fractal characterization of fracture surfaces in a resin-based composite. J Mater Sci Lett 1993;12(7):470–2.[11] Nagahama H. A fractal criterion for ductile and brittle fracture. J Appl Phys 1994;75(6):3220–2.[12] Lei W, Chen B. Fractal characterization of some fracture phenomena. Eng Fract Mech 1995;50(2):149–55.[13] Tanaka M. Fracture toughness and crack morphology in indentation fracture of brittle materials. J Mater Sci 1996;31(3):749–55.[14] Borodich FM. Some fractal models of fracture. J Mech Phys Solids 1997;45:239–59. http://dx.doi.org/10.1016/S0022-5096(96)00080-4.[15] Mosolov AB. Mechanics of fractal cracks in brittle solids. Europhys Lett 1993;24:673–8. http://dx.doi.org/10.1209/0295-5075/24/8/009.[16] Bouchaud E, Bouchaud JP. Fracture surfaces: apparent roughness, relevant length scales, and fracture toughness. Phys Rev B 1994;50(23):17752.[17] Bouchaud E, Lapasset G, Planes J. Fractal dimension of fractured surfaces: a universal value? EPL (Europhys Lett) 1990;13(1):73.[18] Bouchaud E. Scaling properties of cracks. J Phys: Condens Matter 1997;9(21):4319–44.[19] López JM, Rodríguez MA, Cuerno R. Superroughening versus intrinsic anomalous scaling of surfaces. Phys Rev E 1997;56(4):3993.[20] Family F, Vicsek T. Dynamics of fractal surfaces. World Scientific; 1991.[21] Barabási AL, Stanley HE. Fractal concepts in surface growth, vol. 83. Cambridge University Press; 1995.[22] Vicsek T, Meakin P, Family F. Scaling in steady-state cluster–cluster aggregation. Phys Rev A 1985;32(2):1122.[23] Schmittbuhl J, Roux S, Berthaud Y. Development of roughness in crack propagation. EPL (Europhys Lett) 1994;28(8):585.[24] Morel S, Schmittbuhl J, Bouchaud E, Valentin G. Scaling of crack surfaces and implications for fracture mechanics. Phys Rev Lett 2000;85(8):1678.[25] López JM, Schmittbuhl J. Anomalous scaling of fracture surfaces. Phys Rev E 1998;57(6):6405.[26] Morel S, Schmittbuhl J, López JM, Valentin G. Anomalous roughening of wood fractured surfaces. Phys Rev E 1998;58(6):6999.[27] Morel S, Bouchaud E, Schmittbuhl J, Valentin G. R-curve behavior and roughness development of fracture surfaces. Int J Fract 2002;114(4):307–25.[28] Morel S, Bouchaud E, Valentin G. Size effect in fracture: roughening of crack surfaces and asymptotic analysis. Phys Rev B 2002;65(10):104101.[29] Alves LM, Da Silva R, Mokross B. Influence of crack fractal geometry on elastic–plastic fracture mechanics. Phys A Stat Mech Appl 2001;295:144–8.
http://dx.doi.org/10.1016/S0378-4371(01)00067-X.[30] Mourot G, Morel S, Valentin G. Comportement courbe-r d’un matériau quasi-fragile (le bois): Influence de la forme des specimens d’essai.
Colloque_MATERIAUX 2002:1–4.[31] Mourot G, Morel S, Bouchaud E, Valentin G. Scaling properties of mortar fracture surfaces. Int J Fract 2006:39–54. http://dx.doi.org/10.1007/s10704-
005-3471-4.[32] Alves LM. Fractal geometry concerned with stable and dynamic fracture mechanics. Theor Appl Fract Mech 2005;44:44–57. http://dx.doi.org/10.1016/
j.tafmec.2005.05.004.[33] Voss RF. Dynamics of fractal surfaces. Singapore: World Scientific; 1991.[34] Vicsek T. Fractal growth phenomena. Singapore: World Scientific; 1992.[35] Greenberg MD. Curves, surfaces, and volumes. Advanced engineering mathematics. Prentice-Hall; 1998.[36] Barnsley MF. Fractals everywhere. New York: Academic Press; 1988.[37] Besicovitch AS. On the sum of digits of real numbers represented in the dyadic system (on sets of fractional dimensions II). In: Edgar GA, editor. Classics
on fractals. Boston: Addison-Wesley Reading; 1993. p. 155–9.

L.M. Alves et al. / Engineering Fracture Mechanics 162 (2016) 232–255 255
[38] Besicovitch AS. Sets of fractional dimensions (IV): on rational approximation to real numbers. In: Edgar GA, editor. Classics onfractals. Boston: Addison-Wesley Reading; 1993. p. 161–8.
[39] Besicovitch AS, Ursell HD. Sets of fractional dimensions (V): on dimensional numbers of some continuous curves. In: Edgar GA, editor. Classics onfractals. Boston: Addison-Wesley Reading; 1993. p. 171–9.
[40] Dauskardt R, Haubensak F, Ritchie R. On the interpretation of the fractal character of fracture surfaces. Acta Metall Mater 1990;38(2):143–59.[41] Bunde A, Havlin S. Fractals in science. Springer-Verlag New York, Inc; 1995.[42] Katsuragi H. Multiscaling analysis on rough surfaces and critical fragmentation [Ph.D. dissertation]. Fukuoka, Japan: Kyushu University; 2004.[43] Lung CW. Fractals and the fracture of cracked metals. Fractals in physics. Elsevier Science Publishers; 1985. p. 189–92.[44] Mishnaevsky Jr LL. A new approach to the determination of the crack velocity versus crack length relation. Fatigue Fract Eng Mater Struct 1994;17
(10):1205–12.[45] NBR. Areia normal para ensaio de cimento. ABNT, Normas Técnicas. 7214; 1982.[46] ASTM C348-97. Standard Test Method for Flexural Strength of Hydraulic-Cement Mortars. West Conshohocken, PA: ASTM International; 1997. www.
astm.org.[47] ASTM C 305-06. Standard Practice for Mechanical Mixing of Hydraulic Cement Pastes and Mortars of Plastic Consistency. PA, West Conshohocken:
1994. www.astm.org.[48] Plouraboué F, Kurowski P, Hulin JP, Roux S, Schmittbuhl J. Aperture of rough cracks. Phys Rev E 1995;51(3):1675.[49] Måløy KJ, Hansen A, Hinrichsen EL, Roux S. Experimental measurements of the roughness of brittle cracks. Phys Rev Lett 1992;68(2):213–5.[50] Milman VY, Blumenfeld R, Stelmashenko NA, Ball RC. Comment on ‘‘Experimental measurements of the roughness of brittle cracks”. Phys Rev Lett
1993;71(1):204.[51] Alves LM, da Silva RV, De Lacerda LA. Fractal modeling of the J–R curve and the influence of the rugged crack growth on the stable elastic–plastic
fracture mechanics. Eng Fract Mech 2010;77:2451–66. http://dx.doi.org/10.1016/j.engfracmech.2010.06.006.[52] Alves LM. Foundations of measurement fractal theory for the fracture mechanics. In: Belov A, editor. Applied Fracture Mechanics. Croatia: Intech; 2012,
ISBN 978-953-51-0897-9. http://dx.doi.org/10.5772/51813.[53] Ponson L, Bonamy D, Auradou H, Mourot G, Morel S, Bouchaud E, et al. Anisotropic self-affine properties of experimental fracture surfaces. Int J Fract
2006;140(1–4):27–37.