engineering creative environment portfolio …
TRANSCRIPT

ENGINEERING CREATIVE ENVIRONMENTPORTFOLIO APPLICATION
BY
ILJOONG KIM
MASTER OF ARCHITECTUREMCGILL UNIVERSITY, 2004
BACHELOR OF SCIENCE IN ARCHITECTURESUNGKYUNKWAN UNIVERSITY, 1996
SUBMITTED TO THE DEPARTMENT OF ARCHITECTUREIN PARTIAL FULFILLMENT OF THE REQUIREMENTS FOR THE DEGREE OF
MASTER OF SCIENCE IN ARCHITECTURE STUDIESAT THE MASSACHUSETTS INSTITUTE
MASSACHUSETTS INSTITUTE OF TECHNOLOGY OF TECHNOLOGY
JUN 1 5 2006JUNE 2006
@ 2006 ILJOONG KIM. All RIGHTS RESERVED LIBRARIES
The author hereby grants to MIT permission to reproduce and to distribute publicly ROTCHpaper and electronic copies of this thesis document in whole or in part in any
medium now known or hereafter created.
Signature of Author............................Department of Architecture
May, 2006
C ertified By .....................................John de Monchaux
Professor of Architecture and PlanningThesis Supervisor
Accepted By.................................... Q . . .P f s iia itectureouf Beinart
Professor of itectureChair Department Committee on Graduate Students

ENGINEERING CREATIVE ENVIRONMENTPORTFOLIO APPLICATION
by
ILJOONG KIM
Submitted to the Department of Architecturein Partial Fulfillment of the Requirements for the Degree of
Master of Science in Architecture Studies
Abstract
Richard Florida's argument about creative class as the most powerful engine for
economic growth of cities is validity; however, this thesis argues it is not creative
class or a certain group of individuals but creative spirit that can truly contribute to
city's prosperity; therefore, creating environment that can motivate the creative spirit
of any socioeconomic class is the true engine for economic growth. Based on the
basic premise described above, this thesis constructs a market-sensitive planning
tool that can efficiently engineer creative environment. Going on step further, this
thesis argues that creative economy does not derive from the number of creative
people but from environment balanced with civic attributes that motivate creative
spirit become creative activities. Applying portfolio theory from finance discipline to
socioeconomic data about cities, this thesis suggests ways to build creative
environment and further investigates potential vehicles that can facilitate the process
of making creative environment which takes place as a form of efficient urban
portfolios.
Thesis Supervisor: John de MonchauxTitle: Professor of Architecture and Planning

Table of Contents
Introduction 4
1. New Emerging Context 111.1. New Economy and Society 111.2. New Lifestyle Trends 15
2. Current Economic Theories 182.1. Human Capital Theory 182.2. Creative Capital Theory 203.1. Cities with Creative Economy 263.2. Cities and Place Marketing 30
4. Targets and Variables for Portfolios 344.1. Mapping Creative Capital 354.2. Civic Attributes (variables) with Correlations 37
5. Portfolio: New Engineering Mechanism 405.1. Portfolio Concept 405.2. Portfolio Equation 415.3. Portfolio Application 425.4. Portfolio Analysis 435.4. Portfolio Implementation 445.5. Portfolio Management 45
6. Engineering Creative Environment 476.1. Urban Portfolio for Creative Capital Improvement 476.2. Portfolio of Diversity 52
7. Managing Creative Environment 58
8. Potential Vehicle of Portfolio 62
9. Conclusion 73
10. Bibliography 76
11. Exhibits 79

Introduction
In his book "The Rise of the Creative Class," Richard Florida argues that today's
broad social, economic, and cultural changes stem from the creative ethos. He
further argues for the role of creative class as the fundamental source of economic
growth and suggests that cities attract them. He demonstrates the power of creativity
by describing historic examples: Agriculture freed people from hunting; Edison's
Light bulbs extended the time available in the day. His proposition can be further
substantiated by changes made by many creative individuals - Einstein, James Watt,
and many others - who helped to raise the quality of life and living standards. In fact,
today, advanced telecommunication technology and global economy further put
innovation and creativity forefront, putting creative people at the centre stage.
Unlike commodities or properties, creativity is not tangible. Rather, it is eccentric,
unpredictable, and even personal because it is about "human imagination." The
unusual characteristics of creativity not only generate "increasing returns"1 but also
brings about "creative destruction"2 since good ideas replace the old and affect tens
of thousands of products. Paul Romer at Stanford, in his "New Growth Theory,"
postulated ideas as potent goods because unlike other goods perishing with uses
good ideas, like the concept of wheel, never perishes as it generates increasing
returns with more uses.3 Realizing the power of creative class, many top
international companies such as IBM, Intel, Microsoft, Google, Apple, and SONY
1 Paul Michael Romer. (1989). Increasing Returns and New Developments in the theory ofrowth. Working paper no. 3098. Cambridge MA: National Bureau of Economic ResearchJoseph A. Schumpeter. (1975). From Capitalism, Socialism and Democracy. New York:
Harper, 1975) [orig. pub. 19421, pp. 82-853 Paul Michael Romer. (1989). Ibid:
compete for creative people from all around the world, reflecting how today's
economy really functions as compared to the past.
Despite the powerful implications of creative capital in today's economies, most cities
are yet to grasp the importance of creative people in their economic developments,
let alone proactively cultivating creative capital basis. In fact, in the future in order for
cities to survive, they must expand their creative capital basis which spins off many
economic benefits. The question is then how to develop cities that become attractive
to creative capital, further becoming the Mecca of creative activities. Insofar, cities
have used long range plans in a timely manner to set guideline for future
development. However, whether or not those long term plans have accommodated
strategic plans for creative capital expansion is questionable.
Creativity is multidimensional, mutually reinforcing and interactive one another.
Apple's IPOD, for instance, is not just a cool portable digital audio video player but a
cultural statement for new generations. Creativity does not flow from mere
concentration of the creative class but through interactions among them in art, media,
science, philosophy, culture, technology, entertainment, economics, literature, and
even politics. This idiosyncratic yet synthetic nature of creative capitalism challenges
cities in terms of how to organize and channel creative people into creative economy.
Without a systematic platform, cites can hardly cope with the dynamic interplays of
creativity.
According to Richard Florida, cities such as San Francisco, Austin, Boston, Silicon
Valley, Seattle, and New York, have emerged as distinctive creative centers leading
not only local but global economy, because these cities offer venues where creative

activities can take place. Corresponding to his proposition, many scholars published
literatures mainly addressing civic features or attributes that are claimed to have
positive relationships with creative capital attraction. In fact, Florida concretized
those various civic attributes using statistical data, which can help cities arrange
urban development plans accordingly. However, there has not been any studies
addressing how to develop those civic attributes in a way that delivers the most
economic benefits to cities.
Educational institutions, environmental quality, good urban design, affordable
housing prices, low taxes, spacious leisure places, sports facilities, and cultural
amenities and events are all civic attributes useful to cultivate creative capital, but
without a balance, hardly they can synchronize one another. In fact, more often than
not, civic attributes tend to contend one another given limited budget for cities to
invest in those civic attributes. Making market sensitive urban plans is extremely
difficult in today's fast changing pace of social, economic, technological, and political
environment; therefore, cities need an investment structure showing how to invest
their limited public dollars and resources with minimum risks but maximum returns.
Many critics argue that creative economy is an elitist approach and neglects
longstanding socioeconomic equity problems; however, instead of harping on
problems, we should focus on creating solutions that can spread the benefits of
creative contents across the entire socioeconomic class, allowing people without
higher education to benefit creative returns as well. In fact, no matter what an
individual is, he or she can be creative in one way or another, but unfortunately we
tend to ignore creativity at the bottom of socioeconomic pyramid. Toyota, which
overtook GM and Ford, tapped into shop-floor workers' knowledge, defying the

Taylorist system of strict vertical command and control. The founder of SONY Akio
Morita once mentioned that a company will get nowhere if all the thinking is left to
management.4 Given current trends in talent recruiting mostly focusing on people
with so called "Degrees," Akio Morita's statement is powerful message for many
leaders in the city.
The prevailing issue is how to frame social and economic cohesion by means of
which diverse creative forms from different social and economic class synthesize.
When cities resist "changes," they lag behind and eventually diminish in their
competitive edge in economic advance either by internal or external force. In the
advent of industrialization, feudalism perished; likewise, in the advent of creative
economy, neglecting creative capital expansion will enervate social, economic, and
physical strength of the cities. Referring back to the Akio Morita's statement, creative
economy defies stereotypes in education, gender, age, race, ethnicity, appearance,
and even sexual orientation; thus, high tolerance to diversities and differences is the
key element for cities if they want to augment their creative capital basis.
Based on his extensive focus group and statistical analysis, Richard Florida
discovered that 3T's - Technology, Talent, Tolerance - have the most significant
impact on formulating creative centers.5 He argues that "Talent" does not mean
highly educated individuals but represents people working in creative occupations
because creative contents do not necessarily flow from highly educated people. He
further interprets "Technology" as innovation and challenge, and "Tolerance" as
openness to socioeconomic and cultural differences. In his point of view, 3T's are
4 Richard Florida. (2002). The Rise of the Creative Class. New York: Basic Books5 Richard Florida. (2002). Ibid.
highly interdependent; as such, having all 3T's is extremely important for cities in
order for them to evolve to creative centers.
In his book "Cities and the Creative Class" Florida argues that cities like Baltimore, St.
Louis, and Pittsburgh failed to retain their top talents despite their high standard in
technology and education because they lack tolerance. He further argues that Miami
and New Orleans hardly attract top talents despite the warm climate and many
lifestyle amenities because they lack technological bases. Based on his research, he
claims that many creative people are attracted to places with talent, technology, and
tolerance altogether since those places signal new challenges and low entry barriers
for new social, economic, and cultural opportunities. Realizing the importance of the
three critical elements for creative places is one thing, but effectively balancing the
development of those three elements is another matter as they might conflict one
another.
Despite many benefit diversity can bring in, it can cause conflicts among different
cultural and social groups. These conflicts should be mitigated to achieve synthetic
benefits. Participatory education, socialization, common interest, or economic benefit
sharing could solve some potential conflicts, since many behavioral researchers
argue that organizations with shared norms and values perform better than those
without common denominators. In the same token, cities will also need to develop a
planning system that can be related to disparate communities. Insofar, many cities
have planned urban interventions without a scientific mechanism mediating various
concerns of different communities. For instance, many large urban renewal projects
in the 1960s were perceived as one of the best solutions for urban revitalization, but
6 Richard Florida. (2005). Cities and the Creative Class. New York. London: Routledge

they ended up disturbing urban fabric by haphazardly erasing the value of long term
communities. The lesson learnt from the past is that the composition of the scale and
content of urban interventions need to be effectively planned out. In other words,
plans should be developed through some of scientific framework that can deliver the
right amount of the contents and scale of urban interventions.
One of the breakthroughs in modern finance is "Portfolio Theory" by Harry Markovitz.
His mathematical framework generates maximum yield with minimum risk by
combining diverse stocks consisting of both positive and negative correlations. Using
historic covariance of the performance of stocks, portfolios allow investors to take
advantage of low risk and high return through diversification. Using this scientific
mechanism built on mathematics and statistics, cities can utilize readily available
socioeconomic data from the census or surveys. In this way, they can plan urban
intervention strategies scientifically. Although statistics have discrepancy between
real population and samples, it mirrors the reality quite accurately, as polls reflect the
opinions of people with little standard deviation.
Given Richard Florida's civic attributes in relation to creative capital attraction are
based on extensive statistical analysis of more than a few decades, his regression
models of creative capital attraction are expected to be valid. Although his civic
attributes do not reflect all the potential civic attributes available for creative capital
improvement, his attributes can at least provide cities with a certain direction of what
kind of civic attributes they need to develop in order to attract talents given
correlations between his civic attributes and creative capital are provided.
Nonetheless, gathering creative people alone will not automatically generate creative
economy for the rest of communities because there is no guarantee that creative

capital will interact one another once they are gathered. As such, portfolios balanced
with civic attributes that can motivate creative actions are essential for achieving the
true benefits from creative capital. In addition, a vehicle helping various civic
attributes coexist in harmony is extremely critical for efficient portfolio application.
So far, Richard Florida's creative capital has been introduced as an essential
component for economic growth of the city. Civic attributes attractive to creative
capital were introduced so that cities can align their urban development with creative
capital improvement. Nevertheless, urban intervention without balance in scale and
contents turned out to be rather counter-productive; indicating blindly following
Richard Florida's proposition by excessively investing in civic attributes attractive to
creative capital may cause undesirable effects. This thesis proposes to use portfolio
mechanism as a new tool for balanced urban intervention with market sensitivity.
The following chapters will first examine emerging economic, social, and cultural
context and highlight two economic theories which interpret post industrial economic
phenomenon. Based on the contextual analysis, portfolio theory will be introduced as
a critical engineering mechanism for generating sensitive environment for creative
activities. Lastly, the existing portfolios of the top ranked cities for the number of
talented people will be examined to test the validity and applicability of the portfolio
theory in real urban intervention strategies along with potential entities mediating
disparate variables effectively.

1. New Emerging Context
1.1. New Economy and Society
Today, growing interdependence in world financial markets and trades urges people
think in globally but act locally. Peter Drucker, a prominent business guru, sums up
current economic trends as the rise of knowledge economy by saying "the basis of
economic resource is neither capital nor natural resources ... nor labor, but
knowledge."7 By arguing that the best way to predict the future is to create it, Ducker
articulates how current businesses focus on initiations rather than reactions. Losing
competitive edge in manufacturing to developing countries like China and India,
many developed countries now heavily invest their resources in Research &
Development (R&D), targeting a powerful niche market: knowledge economy. In fact,
gravitation towards knowledge economy starts to spread even to developing
countries, since they also realize its high net value and future benefits.
GDP and Business Funded R&D in the OECD Area (tndex 1970- 100)
500450- -O400- -&350300250200150100
50
Figure 1: Investment on Knowledgewww.rieti.go.jp/en/events/05113001/ pdf/2-1_bounfour-presentation.pdf
Peter Drucker. (1993). The Post-Capitalist Society. New York: Harper Business
11

The Characteristics of Old and New Economies
Characteristics Old New
Scope Domestic Global
Driving Force Mass Production Technology, Innovation
Resource Capital Knowledge, Information
Jobs Stable, Large firms Dynamic, Smaller firms
Organizations Centralized/ Hierarchical Matrix, Fluid, Decentralized
Markets Stable Fluid
Workers Uneducated, Unskilled Educated, Skilled, Adaptive
Tasks Simple, Physical Complex, Intellectual, Participatory
Technology Mechanical Electronic, Biological
Emphasis Predictability Innovation, Creativity
Information Flow Top-Down Bottom-Up, Interactive
Opportunities Limited, Fixed Fluid, Rotational, Mobile
Business! Government Minimal Intervention Cooperation, Partnership
Symbol Smokestack Computer
Source: See Rosabet Moss Kanter, The Change Masters (New York: Simon & Schuster, 1983), Chap. 2.
Parallel to new economy, new social norms are spreading quickly. Today, economy
is highly vulnerable, interrelated, horizontal, and often unpredictable, as we observe
market fluctuations everyday in NYSE or NASDAQ, thanks to super-fast global
information technology. Due to insecurity or uncertainty from rapidly changing
economic contexts, many people no longer commit their entire lives to a single
corporation; moreover, many corporations do not commit themselves to their
employees either. This shift in social and economic norms is not temporary but
permanent phenomena deeply rooted in our culture, and this poses significant
challenge to the conventional city planning practices which are still tied into the linear
fashion of pipelining.

In the past, employees exchanged loyalty for job security and social status, since
they were identified through the name of the organizations they worked for. However,
many companies quickly adopted massive layoffs whenever they faced financial
challenges as an easy way-out; as such, job insecurity and short term employment is
so common that they are now a new way of life. Regardless of ranks in a corporate
ladder, many employees are no longer faithful or loyal to their employer, since they
know companies cannot guarantee long term job security. Today, people focus on
their own personal lives pouring their energy on personal development and social
relationship, and this fundamental shift in focus from a group to individuals certainly
demands a new type of urban environment.
Another big shift is in business practice. Compared to the past, today subcontract
and partnership became such a norm that many companies, both knowledge and
manufacturing, decentralize their operation to take advantage of low risk and high
specialization.8 Moreover, standardization and many options in subcontract ranging
from manufacturing, warehousing, marketing, accounting, to financing, enable firms
to hire a small number of staff with large market coverage, ending up lowering the
entry barrier for new and young entrepreneurial organizations. The question
becomes then what causes these fundamental shifts in our society.
Paul David, an economist at Stanford University, pointed out that societal changes
derive from external and internal accumulation of adaptations. In his opinion,
individualism, technological innovation, new business models, and trends toward
higher education are the outcome of "willful adaptations" in social, cultural, and
8 Timothy Sturgeon, "Modular Production Networks: A New American Model of IndustrialOrganization." Industrial and Corporate Change,11(4), 2002

personal attitudes. He says that many people today perceive themselves as unique
individuals rather than a component of a larger unit and prefer honing unique skills
for themselves to conforming to corporate standards. This phenomenon in fact will
become a lot more evident for highly educated and creative individuals, since many
of them prioritize autonomy over conformity in their working environment.
- ANOccpalek:EN COMPUla anrannerao
1100-6nm
10
low is" 19m 150 M0O*
suNv* eiauo tbusm"Figure 2: Salary Comparison
The Milken Institute report, 2001
One of the big socioeconomic challenges today is the rising gap between creative
and non-creative class. Richard Florida discovered that despite the small amount of
less than 30% of the total labor force, creative class accounts for almost half of the
entire US economy. He further claims that the underlying source of economic
disparity is fundamental shifts in economic value from manufacturing to knowledge
which in large relies on human creativity. Based on his proposition, he suggests that
instead of encouraging low paying dead end jobs, governments should provide
economic under-class with opportunities to participate in creative economic contents.
Nevertheless, we observe many talents in poor neighborhoods are often ignored and
even stymied by established sociopolitical groups. Therefore, to achieve truly

socioeconomic equity, governments and city officials in this matter need to pay more
attention to creative capital at the low end of society than those at the high end, since
many creative people at high end already enjoy plenty of social and economic
benefits. However, coming up with plausible plans for elevating low end creative
capital contents is extremely difficult for cities due to market pressure and limited
budget. Next chapter investigates new lifestyle trends in response to new economy
closely tied into people at the low end of society.
1.2. New Lifestyle Trends
Technology has freed many people from tedious work, but at the same time it has
tied many people with even more work than ever. For instance, thanks to wireless
mobile technology or satellite network like Bluetooth people can virtually work 24/7
extending time and location of work. In fact, according to news broadcasted on CNN,
Americans now sleep 2.5 hour less than two decades ago. Highly interconnected
modern technology constantly breaks geographic boundaries, making our society
widely exposed to international factors beyond our reach.
600
400
300
200
0o
0
Ii J I I I A*# O unm Bunt
saurcs 1999 &2000 HoA*glmnby. CY omFrandfoann o Depaben AE, 2001.
Figure 3: New Live/ Work Units constructed, 1987 - 2000

The unpredictable and extended environment not only blurs the boundary between
Live and Work but also demands 24/7 services such as 24 hour fast-food chains,
grocery stores, and restaurants which many of us take for granted. Moreover,
proximity to amenities, public transportation, and public safety become extremely
important for cities not only to operate 24 hours but to retain highly competitive
people who emphasizes time value of money. In fact, because of the ever increasing
time value, Live and Work, once divided to separate zones, are now merging. The
rapid increase in Live/Work units in San Francisco in the figure 3 clearly attests these
new phenomena of integrated Live and Work environment.
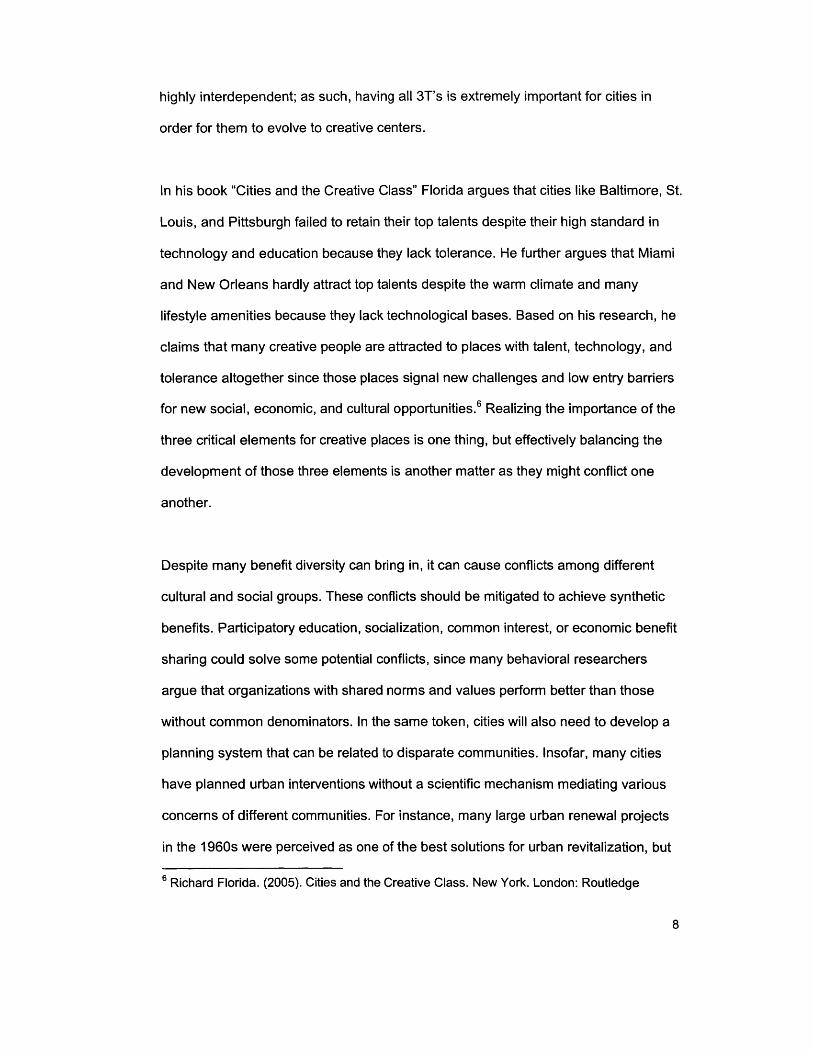
Sociologists Richard Lloyd and Terry Clark interpret amenities for new lifestyles as
"entertainment machines."9 Edward Glaeser at Harvard also claims a considerable
shift from "producer cities" to "consumer cities," by saying that the future of cities
depends on being desirable places for consumers to live, as consumers become rich
and mobile, and location choices are based as much on their advantages for workers
as on their advantages for firms.10 The quality of life as the highest priority for firms'
location selection criteria is illustrated in the survey conducted by the Pennsylvania
Economy League at the figure 4. In this survey, quality of life ranked the highest
followed by the quality of human resource, indicating the confluence of location
selection criteria between firms and individuals. The converging criteria clearly imply
that today's urban interventions should be based on demand from people rather than
a supply of infrastructure.
9 Richard Lloyd and Terry Nichols Clark, "The city as an entertainment machines," in KevinFox Gotham, Critical Perspective on Urban Redevelopment Research in Urban SociologyVol.6 Oxford: JAI Press/Elsevier, 200110 Edward L.Glaeser, Jed Kolko and Albert Saiz, "Consumer City." Cambridge: NationalBureau of Economic Resaerch, Working Paper No. 7790. 2000
O
2.0
iliii.0.0
Figure 4: Criteria for selecting placesSource: the Milken Institute report 2001
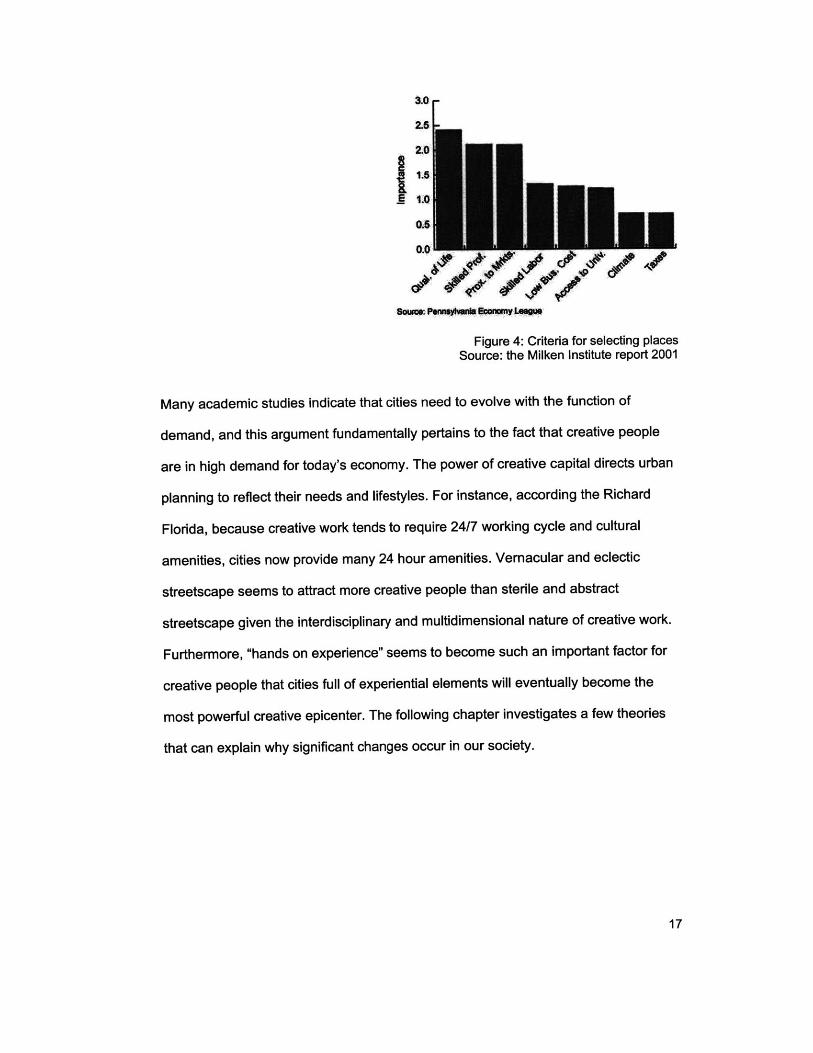
Many academic studies indicate that cities need to evolve with the function of
demand, and this argument fundamentally pertains to the fact that creative people
are in high demand for today's economy. The power of creative capital directs urban
planning to reflect their needs and lifestyles. For instance, according the Richard
Florida, because creative work tends to require 24/7 working cycle and cultural
amenities, cities now provide many 24 hour amenities. Vernacular and eclectic
streetscape seems to attract more creative people than sterile and abstract
streetscape given the interdisciplinary and multidimensional nature of creative work.
Furthermore, "hands on experience" seems to become such an important factor for
creative people that cities full of experiential elements will eventually become the
most powerful creative epicenter. The following chapter investigates a few theories
that can explain why significant changes occur in our society.

2. Current Economic Theories
2.1. Human Capital Theory
According to human capital theorists, the sustainable growth of cities does not derive
from low business/ living costs but from high concentration of educated and
productive individuals: Human Capital. Ross DeVol at the Milken Institute points out
that highly educated people tend to attract more companies generating large
economic externality leading towards the economic benefits of entire communities. In
fact, his research reveals that despite the dot.com bubble burst, the numbers of
knowledge workers and their economic contributions have grown tremendously over
the last few decades, and their influence continues to spread, challenging the way
cities used to operate in the past.
As discussed earlier, unlike old economy mainly depending on physical and natural
assets, new economy depends heavily on human intelligence which is hard to
quantify. Like it or not, knowledge economy has been multiplying to many new
business models in art, media, design, science, technology, and commerce.
Nonetheless, the wide spread of knowledge economy does not instruct cities of how
to develop civic attributes conducive to the expansion of knowledge interactions. As
such, one of the biggest challenges cities face today is to figure out the way
knowledge economy interacts with environment. Unlike consumer products,
Knowledge cannot be churned out using the same assembly lines. This means that
quality of place is extremely critical for the complex accumulation and exploitation of
knowledge. "
1 Paul Romer. (1990) Endogenous Technological Change: Journal of Political Economy 98,5: S71-S102

Acknowledging the importance of the quality of place for knowledge economy,
Robert Lucas, a professor of economics at the University of Chicago, postulates the
role of cities as to bring and augment human capital. He says that human capital
augmentation will generate more positive externality for innovation and productivity
than any other capital form. His argument is valid, but how human capital needs to
be placed in cities is yet to be resolved, given varying responses from communities
about knowledge neighbors. For instance, some communities may see human
capital as a source of community revitalization; whereas others may perceive human
capital as a source of gentrification.
The analysis above indicates that infusing a large number of highly educated people
may cause backfire from communities regardless of intentions behind it. As such,
planning the right amount of infusion is absolutely critical in order to avoid
sociopolitical disruptions; nevertheless, there are no tools helping city planners
determine the scale of urban intervention yet. Richard Florida at Carnegie Mellon
claims that true benefits from human capital improvement do not flow from the
number of highly educated people but from the creativity of human capital. In his
"Creative Capital Theory," he argues that human creativity is the ultimate underlying
factor for economic growth. His argument is valid because creativity is not
necessarily the sole property of elites.
So far, this chapter has discussed human capital theory as a possible explanation for
changes in social and economic contexts. Although human capital theory explains
why knowledge economy became one of the major economic engines, it misses the
12 Richard Florida. (2002). the Rise of the Creative Class. New York: Basic Books

core of human capital since it mainly emphasizes knowledge from higher education,
overlooking the possibility of being creative regardless of education levels. This
means cities solely investing in educational facility or recruiting a massive number of
highly educated people do not move in the right direction. Furthermore, as discussed
earlier, ripple effects from massive urban interventions without community
involvement often turned out to be negative. It seems like Richard Florida's creative
capital theory overcomes some of shortfalls in human capital theory since his theory
tackles the foundation of human capital: creativity. The following chapter will
therefore discuss creative capital theory as an alternative explanation for changing
social and economic contexts.
2.2. Creative Capital Theory
Revising human capital theory, Richard Florida coined a new term "Creative Capital
Theory" emphasizing human creativity as the ultimate source of economic benefits.
In his standpoints, creative people are not individuals with high education but
individuals who can create economic value through creative work or activities.
Identifying class not based on income or education levels but on the type of
occupations, he differentiates creative capital from human capital. Nonetheless,
distinguishing creative capital from human capital may not be necessarily critical
because empirical data from Dutch research paper suggests that despite theoretical
distinctions between creative capital and human capital as the former refers to actual
skills, whereas the latter refers to training, they are much the same.13
13 Gerard Marlet, Clemens van Woerkens. (2004). Skills and Creativity in a Cross-section ofDutch Cities. Utrecht School of Economics Tjalling C Koopmans Research InstituteDiscussion paper series 04 - 29

Regardless of technical detail about creative capital, Florida's standpoint from
creative capital theory regarding societal changes is quite different from many other
critics' perspectives, helping to observe cities from a different angle. In his book "The
Rise of the Creative Class" he openly disagreed with many critics' assertions such as
Jeremy Rifkin's unfettered hyper capitalism, Richard Sennett's demise of sociological
stability and social fabric, Jill Fraser's white collar sweatshop, Tom Frank's
materialism as hegemonic culture, and Robert Putnam's demise of social capital
repositories, because he believes that social and economic changes are the
outcomes from our voluntary actions based on our own choices, desires, and
judgments.
Furthering his claims, he also argues that changes can only occur through internal
acceptances as opposed to external imposition. 4 His statement can be translated as
societal changes are natural phenomena driven by intellectual curiosity: the source
of creativity. In other words, unlike animals or plants, people always think, constantly
conducting intellectual inquiries, and based on the former analysis, societal changes
will eventually occur one way or another. Therefore, they are rather positive signs of
humanity from creative actions than negative consequences. Given this importance
of human will shaping the societal contents, people should be regarded as leaders
rather than followers of plans.
The article by Kathryn Wallace "America's Brain Drain Crisis" in the Reader's Digest
(2005) illustrates how skilled people can affect the living standard, economy, and
even national security of the United States. Wallace describes on-going competitions
among nations for the best and brightest people, not just for short term benefits but
14 Richard Florida. (2002). the Rise of the Creative Class. New York: Basic Books

also for long term commitment for human resource development. "We go where the
smart people are," described in the Reader's Digest by Howard Hight, a
spokesperson for the Intel Corporation. She predicted that current Intel's business
organizational structure (two-thirds in the US and one third overseas) may flip over in
ten years because talents are bringing jobs not the other way around.
Economic growth can be described in many ways, but in general it falls into two
categories: quantitative and qualitative growth. New giant factories or corporate
headquarters (quantity) may increase the number of jobs and amenities, but highly
creative capital (quality) can also benefit cities even without any environmental
degeneration. For instance, patents, technological know-how, or intellectual property
right can bring Loyalty income to cities, part of which could be spent for
environmental restoration. This analysis above indicates that the qualitative growth of
cities through creative capital improvement can yield as much as or even higher
returns than the quantitative growth due to its higher Net Present Value (NPV), the
future stream of benefits and costs converted into today's equivalent values,' 5 and
cities should realize that among many urban interventions, a certain type of
intervention can deliver much higher returns than others.
The figure 5 below shows the increasing portion of High-Tech GDP within the overall
GDP of the US clearly demonstrates movements towards the quality over the
quantity of economy. In quality economy, creative people play major role for the
economic growth of cities. The Intel spokesperson's comments clearly indicate how
seriously top companies rank human resource over natural or physical resource. In
15 Definition from www.ichnet.org/glossary.htm

fact, in near future cities sought by creative capital will be sought by companies,
eventually making those cities become the centre of economic prosperity.
=* WM iJUi" I
II
Figure 5: Economic growth changeThe Milken Institute report, 2001
For the sustainable growth of economy and quality of life in general, cities need to
develop their environment compatible to the operation of creative capital. Robert
Park, a deceased prominent urban sociologist at the Chicago school, mentioned that
great cities have always been the melting pot of diversity.16 Jane Jacobs in her
famous book "The Death and Life of Great American Cities" summarized the
characteristics of a successful place as diverse, multidimensional, stimulating, and
interdependent.1 7 But, cities still need to figure out how to construct those positive
urban characteristics and what kind of development strategies will enable the
maximum yield given their limited resources.
16 Robert Park, E.Burgess, and R. Mckenzie (1925) The City. Chicago: University of ChicagoPress17 Jane Jacobs. (1961). The Death and Life of Great American Cities, Cities and theWealth of Nations. New York: Random House

In his book "The Rise of the Creative Class," Richard Florida argues that certain civic
elements are proven to attract more creative class than others based on his
extensive statistical and focus group analysis. However, only developing those
elements will disturb other socioeconomic classes since their value and vision may
not necessarily be parallel to creative class. For instance, not all of us are meat
lovers and eating too much chocolate may harm people in the long run despite its
sweet taste in a short period of time. Cities should realize that the excessive
development of civic attributes with highly positive correlation with creative capital
alone may in fact harm the over health of the cities. The true creative capital basis is
not just creative individuals but a system that effectively engenders cross-pollinations
among many diversified creative activities.
Richard Florida argues that creative capital prefers no-collar working environment
where they can maximize their creativity without managerial barriers, and social
autonomy built on weak ties is also highly preferred, since it can release them from
excessive social obligations. He further claims that many creative people value time
for it is irreplaceable and scarcest resource for them. His analysis shows that places
need to be authentic, spontaneous, and filled with civic attributes helping the organic
growth of cities as opposed to strictly planned prescriptive order.18
Furthering Florida's argument about desirable environment for creative capital,
Teresa M. Amabile at Harvard Business School claims that environment that fosters
the internal motivation of creative people is critical since in her standpoint creativity
comes from three elements: expertise, creative thinking skills, and motivation. In
18 Richard Florida. (2002). The Rise of the Creative Class. New York: Basic Books

other words, although creativity highly relies on intrinsic factors such as personal
interest and motivation, extrinsic factors such as challenge, freedom, resources,
work-group features, supervisory encouragement, and organizational support are
essential for the systematic boost of internal motivation and dedication, which in turn
increases creative activities.19
Florida's and Amabile's arguments indicate that in order for creative capital to
prosper, external factors needs to support creative capital. Analogously speaking, a
designer will likely prefer a set of various color crayons than a set of only black color
crayon, since he or she can explore more design schemes with the former than the
latter. Civic attributes can be understood as the same way as described above; in
other words, cities should provide creative capital with civic attributes supportive of
their creative work in order to establish truly effective creative capital basis.
Through his research, Florida discovered that many civic attributes playing significant
role in attracting creative capital fall into three categories: technology, talents, and
tolerance. Given changing urban contexts pertaining to new economy and social
norm, the following chapter investigates what kind of challenges cities face today in
terms of establishing civic attributes conducive to creative capital expansion and how
cities have been responding to those challenges in their effort to constituting creative
environment.
19 Teresa M. Amabile. (1998). How to Kill Creativity. Harvard Business School Review

3. Cities with New Challenges
3.1. Cities with Creative Economy
In near future, manufacturing technology will reach to a point where mass
customization is as norm and cost effective as mass prefabrication. Ubiquitous
customization envisioned in many technology journals of the past are in fact around
the corner; furthermore, today's cutting edge and state of art technology is moving
toward "Nano Level" powered by venture capitalists who constantly search for
innovative entrepreneurial business opportunities. In this wide spread yet
compressed economy, cities with the strongest creative capital basis will have the
most competitive edge and become a leader.
Robert Lucas and Edward Glaeser both argued that today's regional competitiveness
is heavily related to the quality of highly skilled people who can generate innovative
ideas.2 0 Paul Romer also emphasized close link between human capital and
economic growth. However, a major challenge cites face is that creative capital, as
the essence of the productivity of human capital, is in limited supply. Nevertheless,
fortunately the US will have more supply of creative capital thanks to emerging eco-
generations; as such, cities otherwise no chance of attracting creative capital due to
their low standard and lack of civic attributes necessary for creative capital basis will
have the opportunities to participate the economic benefits from creative economy.
20 Robert Lucas, Jr. (1998). On the Mechanics of Economic Development. Journal ofMonetary Economics, 22, 1998: 1-42Edward Glaeser. (2000). The New Economics of Urban and Regional Growth. Oxford: TheOxford Handbook of Economic Geography, Oxford University Press21 Paul Romer. (1990) Endogenous Technological Change: Journal of Political Economy 98,5: S71-S102

With high speed Internet and wireless technology, some critic argues that geography
no longer plays a significant role in current economy. Kevin Kelly in his book "New
Rules for the New Economy" postulates that technology has become our culture and
new economy operates in space rather than in places. 2 Kelly's argument somewhat
corresponds to Manuel Castells's "Network Society Theory;" however, despite
advanced technology places still function as a center of economic and social
activities, as according to economists Alfred Marshall and Michael Porter, human
agglomeration is a natural phenomenon from efficient productivity.23
Richard Florida argues that in time-driven economy, mobility is a key element for
success for both firms and individuals; 24 therefore, both individuals and firms need
something that connects them effectively. In this sense, places become the essential
element of economy, regardless of technological advance, because they function as
a broker or platform effectively linking the two interdependent parties. Florida's
argument can be further interpreted as in creative economy creative people often
select a location which meets their selection criteria; then companies move to the
location selected by many creative people, ultimately formulating economic
agglomeration.
The analysis above suggests that in order to attract creative capital urban planning
need to be tailored to creative capital's demands, but unfortunately conventional city
planning is still supply driven. In other words, typically projects are planned by
professionals who assume that people will follow their leads. However, more often
2 Kevin Kelly. (1998). New rules for the new economy: 10 radical strategies for a connectedworld. New York: Viking23 Michael E. Porter (1998). The competitive advantage of nations: with a new introduction.Basingstoke: Macmillan24 Richard Florida. (2005). Cities and the Creative Class. New York. London: Routledge

than not creative capital is an initiator not a follower; therefore, conventional urban
planning will likely fail to attract creative capital. Conventional wisdom like the
economics of sale presented by Marshall and Porter above is still an important factor
in urban planning, but for creative capital improvement a new planning tool exposing
planners to consumer's standpoint is essential.
The role cities play in creative economy also goes beyond Marshall and Porter's
efficient productivity, because creative economy defies the simple definition of
productivity as the rate of physical output. Creative economy pertains to "new and
innovative ideas" flowing from creative people inspired by surrounding environment
or civic attributes cities provide as the source of inspiration. In fact, cities need to
function as "Living Laboratory" where creative capital experiments and expands their
ideas along with multidisciplinary feedback loops. Everyone processes their ideas
into creative work differently; therefore, highly tolerating environment against
differences is integral to creative environment, but cities still need to figure out how to
develop highly tolerant environment given various civic attributes may conflict one
another.
An empirical study by Annalee Saxenian reveals that roughly one third of scientists
and engineers in Silicon Valley were foreign born. 5 Furthermore, Saxenian
discovered that from 1980 to 1995 roughly a quarter of new Silicon Valley startups
were founded by immigrants and from 1996 to 2000 the percentage went up to 30%,
significantly contributing to the US economy. From Saxenian's standpoint, a culture
of integration, openness, and information exchange seems to have been the most
25 Annalee Saxenian (1999). Silicon Valley's New Immigrant Entrepreneurs. Berkeley: PublicPolicy Institute of California

central element for the innovativeness and economic growth of cities. 26 Her
argument provides cities with new perspectives toward Jane Jacob's diversity which
is more or less contained in the socio-physical aspects of cities. In other words, it is
not the diverse physical forms but the diverse contents of cities that make cities
become highly creative, and cities need to hold those diverse contents or civic
attributes up to a tolerable level for various communities.
According to Pascal Zachary, the tremendous economic growth of the US after the
World War II derived from massive immigration. He further argues that the US'
competitiveness in high-tech economy is directly linked to the openness to foreigners
as opposed to Japan and Germany.27 However, since the September 11 terrorist
attack, immigration policy has been rather forbidding; moreover, a large number of
illegal immigrants mainly from Mexico build up bad reputations against colored
immigrants. For creative environment, biases are deadly; therefore, notwithstanding
the national security, immigrants should not be perceived as invaders but as new
friends who chose to contribute their lives to the US. Otherwise, tolerance, an
essential element for creative economy, will vanish; let alone developing a sense of
extended family.
For cities to become creative, they need to become open grounds for various
creative activities regardless of their socioeconomic status of creative people.
Furthermore, cities need to provide social and political environment that cultivates
the various forms of creativity in art, culture, technology, and more. Coexistence
26Annalee Saxenian (1999). Silicon Valley's New Immigrant Entrepreneurs. Berkeley: PublicPolicy Institute of California27 Pascal Zachary. (2000). The Global Me, New Cosmopolitan and the Competitive Edge:Picking Globalism's Winners and Losers. New York: Perseus Books Group, Public Affair

based on fair respect among various creativity forms is also essential for sustainable
creative capital basis. New York City, for instance, is the best city in the world not
only because of its financial power but because of cultural and ethnic diversity. Cities
need to be highly tolerant and diversified in order to sustain creative capital;
nevertheless, not all cities are like New York due to geographical, cultural, social,
economic, and political reasons. In other words, every city has different resources
hence different competitiveness for creative capital attraction.
Adopting a successful example from other cities, therefore, may not be a right urban
planning approach. For instance, building a Museum of Modern Art (MOMA) in Utah
will not necessarily bring about the same result as MOMA in New York did. Instead,
cities need to develop a unique plan on their own well suited to its current
circumstances or competitive position relative to other cities. The following chapter
investigates one of the most widely adopted urban economic development tools,
"Place Marketing," to examine its validity for urban development.
3.2. Cities and Place Marketing
Today, the accelerating pace of changes in social, cultural, and technological
landscape not only increases competitions and risks associated with the
competitions but also complicates the dynamics of economic growth. Competitors for
scarce resources have been multiplied more than ever due to global economy, and
Philip Kotler, a professor of business at Northwestern University, claims in his book
"Marketing places" that places like business must develop and promote products in
order to survive in today's borderless economy.

Kotler's argument can be translated into the fact that cities already with a large
number of creative capital will continue to compete among themselves; furthermore,
they will face more competitions once cities which have not realized the lucrative
value of creative capital finally join the competitions. Notwithstanding the relentless
competitions for creative capital, cities usually have limited budget and resources not
sufficient enough to pay for all the expenses in their daily operations and
maintenance. Moreover, despite the growing needs of financial supports for global
competitions, federal and state governments cut back grants and subsidies due to
political unrest in the Middle East and ongoing war on terrorism. In the face of these
tight fisted circumstances, cities needed to be more strategic about their public
investments, so many of them adopted place marketing as a new way of achieving
economic development.
According to Kotler, marketing is beyond advertising and promotion. In his book,
"According to Kotler," he defines marketing as the science and art of exploring,
creating, and delivering values to satisfy the needs of target markets at a profit. Here,
developing strategic plans based on demand from target markets is absolutely
critical, so the 4P's - Promotion, Price, Place, Products - and 5C's - Customers,
Company, Competitors, Collaborators, Context - are adopted as the core building
blocks for strategic marketing. 28 He suggests that these core blocks be structured
with five key processes - Opportunity identification, New product development,
Customer attraction, Customer retention and Loyalty building, Order fulfillment - but
unlike consumer goods or services, cities are not exclusive to individuals; hence,
28 Philip Kotler. (2005). According to Kotler. New York: Amacom, American ManagementAssociation

general marketing strategies will not be as effective as they are for consumer
products.
According to Ashworth and Voogd, the major difference is that cities are aggregate
or bundle. They argue that unlike products or services exchangeable for a simple
means (price), places cannot involve exclusive rights of use;29 as such, place
marketing is hard to be customized, and creating an image is much harder than
products. They further claim that people tend to rely on implicit knowledge such as
personal experience, biases, opinions, or just words of mouth than explicit or clear
messages from promotional packages; furthermore, "shadow effect," the image of
one place overshadows the image of other neighboring places, often causes conflicts
among neighbors.30
Many place marketing techniques such as TV ads, brochures, tax credits, cultural
tourism, community lifestyles, urban design, sports events, festivals, corporate
headquarters, and signature architecture have been widely used without any
scientific mechanism for evaluating each technique, causing negative effects to cities.
Tax incentives for corporate headquarters, for instance, often ended up with price
wars among competing cities. In fact, many corporations left cities once they got
better offers from other cities, causing economic vacuum with massive layoffs and
large brownfield.
29 G.J. Ashworth and H. Voogd. (1990). Selling the city: marketing approaches in publicsector urban planning. London & New York: Belhaven Press30 G.J. Ashworth and H. Voogd. (1990). Ibid3 Philip Kotler, Donald H. Haider, and Irving Rein. (1993). Marketing Places: AttractingInvestment, Industry and Tourism to Cities, States and Nations. New York: The Free Press

Place marketing can be a powerful economic development tool, but its application
needs to be based on scientific mechanisms to avoid negative impacts. The following
chapters will introduce "Portfolios," which is a mathematical framework delivering the
highest yield with the lowest risk with specific variables, as a new planning tool
helping cities utilize scientific planning mechanisms. As discussed earlier, in today's
knowledge intensive global economy, creative capital is the most powerful resource
for economic growth; therefore, creative capital base improvement will be set up as a
goal for cities; then portfolio theory will be applied as an efficient engineering
mechanism for cities to achieve their goal.

4. Targets and Variables for Portfolios
Before setting up a goal or target return, it is necessary to evaluate whether or not
that goal is achievable and appropriate in a given context. For instance, constructing
a lavish hotel in the middle of impoverished and violent neighborhood would be
absurd; likewise, setting up unrealistic target returns without conducting realistic
evaluation of the existing resource inventory is nonsense and debilitates the
effectiveness of portfolio application. Bismarck, North Dakota, for instance, should
not target the number of creative capital more than that of New York City because no
matter how hard Bismarck tries, it can never beat New York City since its quality of
life is not comparable to New York City. As an analogy, targeting one hundred
football players for a team of ten does not make sense at all.
Cities must set up civic attributes (variables) prior to developing portfolios based on
their own analysis about their current competitive position in relation to other cities.
Comparing civic variables with other cites is essential for setting up a right
composition of civic attributes, because regardless of their efforts in creative capital
attraction other cities are potential competitors given the fact that creative capital
chooses cities mainly based on their own selection criteria. In addition, constructing
portfolios with both positively or negatively correlated civic attributes is critical for
achieving balance in urban interventions, which is necessary for sustainable urban
environment.
In order to help cities set up a realistic target return or gain of creative capital, the
following chapters provide the current status of creative capital distribution in the US.

Then, variables with correlation to creative capital (talent) will be introduced as civic
attributes for portfolio application. The author wants to make it clear that civic
attributes used in this paper are not the only civic attributes needed for portfolios. As
described earlier, civic attributes should be set up by cities themselves depending on
their competitive position in creative capital attraction. The type and number of civic
attributes for portfolios will vary with available resources of cities. Civic attributes
used in this paper are taken from Richard Florida's statistic data mainly because his
data provides descriptive statistics and correlations necessary for portfolio
calculation.
4.1. Mapping Creative Capital
Figure 6: Art & Cultural Creativity Figure 7: Technological Creativity(Bohemians per 1,000 people) (Prof. and Tech workers per 1000 people)
Source: Richard Florida, "The Rise of the Creative Class," 2002
Creative capital can be mapped in many ways; for instance, the registration of
patents, copyrights, trademarks, or proprietary designs might locate where creative
capital is. However, they are merely the artifacts of creative work perishing as times
go by; therefore, creative capital should be measured by the number and location of
creative people. Although the term creative is somewhat subjective, Richard Florida

mapped the distribution of creative capital in the US using the number of creative
occupations from the U.S. Bureau of Labor Statistics (BLS), US Census, and the
Milken Institute. The figure 7 and 8 reveal that the location of different creative
occupations significantly overlaps one another, indicating that civic attributes
attractive to one creative occupation might appeal to another creative occupation.
Today, technology has become so ubiquitous that different creative occupations in
fact share the same technology; for instance, almost all designers use computers
just as software programmers do. In addition, 24/7 working cycle and extreme
mobility become such a norm today that wireless communication might have become
a common standard for many creative people. As such, civic attributes such as
proximity to high tech industry might have become integral part of the location
selection criteria for creative capital. Maybe, cities without strong wireless broadband
network no longer enable to attract creative capital.
The analysis above indicates that certain civic attributes are to be provided by cities
as a minimum standard. In other words, in order to attract creative capital, cities must
provide civic attributes which function like staples for most creative capital. Finding
those staples for creative capital is worth research, but this paper does not cover it
because the main focus of this thesis is not to discover civic attributes attractive to
creative capital but to develop a systematic mechanism for scientific urban planning
and development. Nonetheless, cities without staple civic attributes will need to
develop those civic attributes first in order to compete for creative capital, and cities
located far away from a large pool of creative capital may need to emphasize civic
attributes highly in demand but yet to be readily available in established creative
centers in order to justify creative capital's high relocation costs.

4.2. Civic Attributes (variables) with Correlations
The previous chapter mapped creative capital based on the number of creative
occupations, as it most accurately depicts the location selection by creative capital.
Technological and cultural norms were discussed in order to provide cities with a
sense of direction on what kind of civic attributes are needed to attract and sustain
creative capital. This chapter discusses several civic attributes and their correlations
to creative capital (talent). As discussed earlier, these civic attributes by no means
generalize variables for portfolios. In fact, the more specific variables become, the
better portfolios will perform.
The variables presented in the figure 8 onward are from Richard Florida's statistical
research. These variables will be used as civic attributes that will comprise civic
portfolios in the later chapters. The reason for using Florida's variables is that his
variables assure a fair degree of accuracy, given they are based on extensive
statistical and focus group research data. Furthermore, numeric values, such as
standard deviations and correlations, necessary for portfolio calculations in the later
chapters, are included in his statistical data.
Correlations/ Expected Return
Variables TalentTalent 100.0%Diversity 71.8%High Tech 72.3%Cultural Amenity 43%Recreational Amenity -4.8%Climate 22%Coolness 46.9%Median Housing Value 53.8%Per Capita Income 58.8%Per Capital Income Change 29.2%
Figure 8: Correlation DataSource: "Cities and the Creative Class," Richard Florida, 2004

As discussed earlier, portfolios are a mathematical framework allowing high target
return with low risk, as they diversify risks and returns. Portfolios consist of variables
either reinforcing or competing one another to set a balance. As such, selecting right
variables based on relationships among variables and target is extremely important
task prior to portfolio calculation. In general, correlations from regression are
analyzed to understand relationships, and the numeric values of correlations are
directly linked to portfolio calculation along with standard deviation and covariance.
Since mathematics is integral to portfolio application, the accountability of numbers
based on thorough statistics is absolutely critical.
The correlations presented in the figure 8 show various relationships each variable
(civic attribute) has with talent (creative capital). Most civic attributes in the figure 8
are positive correlated with creative capital, and among them Diversity and High-
Tech have relatively high positive correlations with creative capital, whereas
Recreational Amenity is negatively correlated with creative capital. One of major
limits using correlation tables like the figure 8 is that it leads cities to develop a civic
attribute without taking into account the existing status of that civic attribute.
For instance, a city "X" may only focus on developing High-Tech given its highest
positive correlation without considering that High-Tech is readily available in say a
city "Y". This means creative capital will simply go to Y without waiting for X to finish
its work, leaving X's efforts in vain. Likewise, X may decide to reduce recreational
facility given its negative correlation with creative capital, not knowing that
recreational amenity strengthens the High Tech industry in the city X.
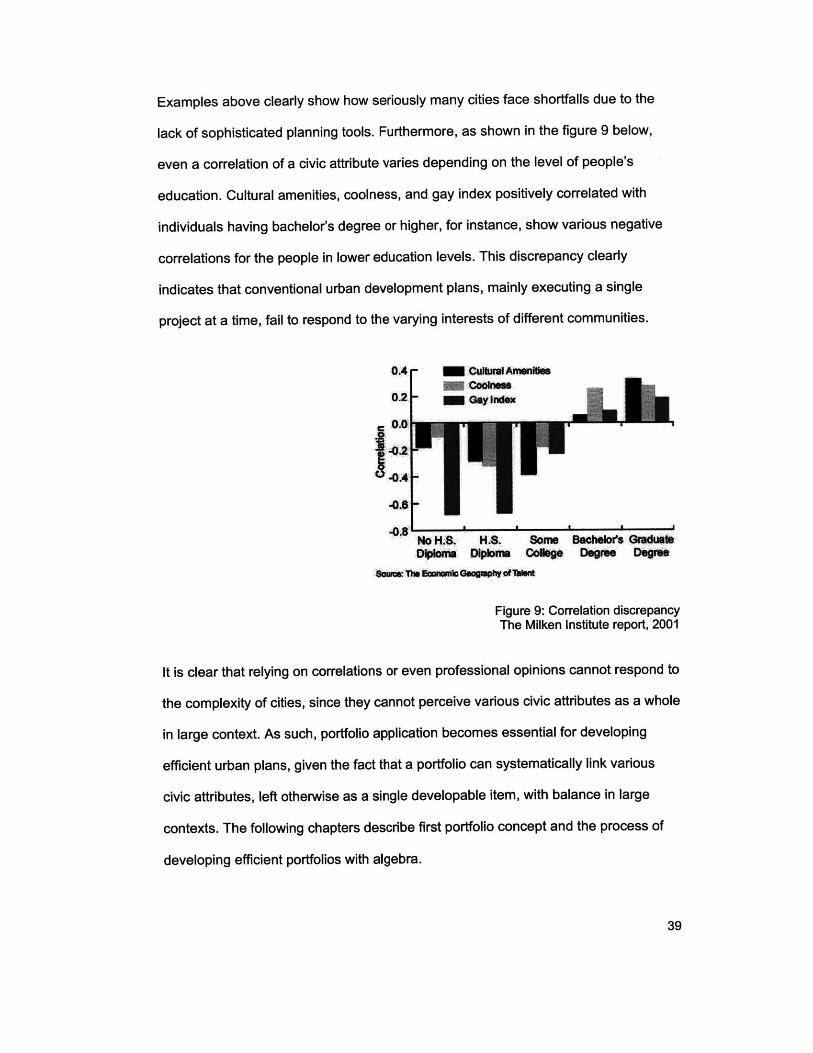
Examples above clearly show how seriously many cities face shortfalls due to the
lack of sophisticated planning tools. Furthermore, as shown in the figure 9 below,
even a correlation of a civic attribute varies depending on the level of people's
education. Cultural amenities, coolness, and gay index positively correlated with
individuals having bachelor's degree or higher, for instance, show various negative
correlations for the people in lower education levels. This discrepancy clearly
indicates that conventional urban development plans, mainly executing a single
project at a time, fail to respond to the varying interests of different communities.
GRomineet
NoH.S. H.8. Some Bachelos GduDOOMl Da om Olg Dege Dgre
sam.aonsasgulytbbn*
Figure 9: Correlation discrepancyThe Milken Institute report, 2001
It is clear that relying on correlations or even professional opinions cannot respond to
the complexity of cities, since they cannot perceive various civic attributes as a whole
in large context. As such, portfolio application becomes essential for developing
efficient urban plans, given the fact that a portfolio can systematically link various
civic attributes, left otherwise as a single developable item, with balance in large
contexts. The following chapters describe first portfolio concept and the process of
developing efficient portfolios with algebra.

5. Portfolio: New Engineering Mechanism
5.1. Portfolio Concept
In capital markets, everyone is risk averse because a risk means a probability of
failing to earn an expected return. As such, a risky investment usually offers a higher
return than a risk free investment does. This fair market behavior and efficient market
hypothesis, which assumes open information sources, are fundamental to modern
finance theories, which influence a wide range of economies from local grocery
stores to multimillion dollar international trades. Among many finance theories,
"Portfolio Theory," originally introduced by Harry Markovitz in the early 1950s,
provides the most efficient mathematical framework that can generate high returns
with low risks.
By diversifying variables, portfolios reduce risks while increasing returns, and among
all probable portfolios, efficient portfolios, called "Portfolio Frontier," provide the most
effective investment strategies, as their risk for a given return is minimal vice versa.
In financial market, portfolio frontiers help investors efficiently manage risk by
analyzing the historic performance data of stocks co-varying one another. As such,
today almost all investors prefer portfolios to a number of single risky stocks for
financial security. Mutual funds and market indices such as S&P 500 or Dow Jones
Industrial Averages, for instance, are financial products based on portfolios. The
following chapter
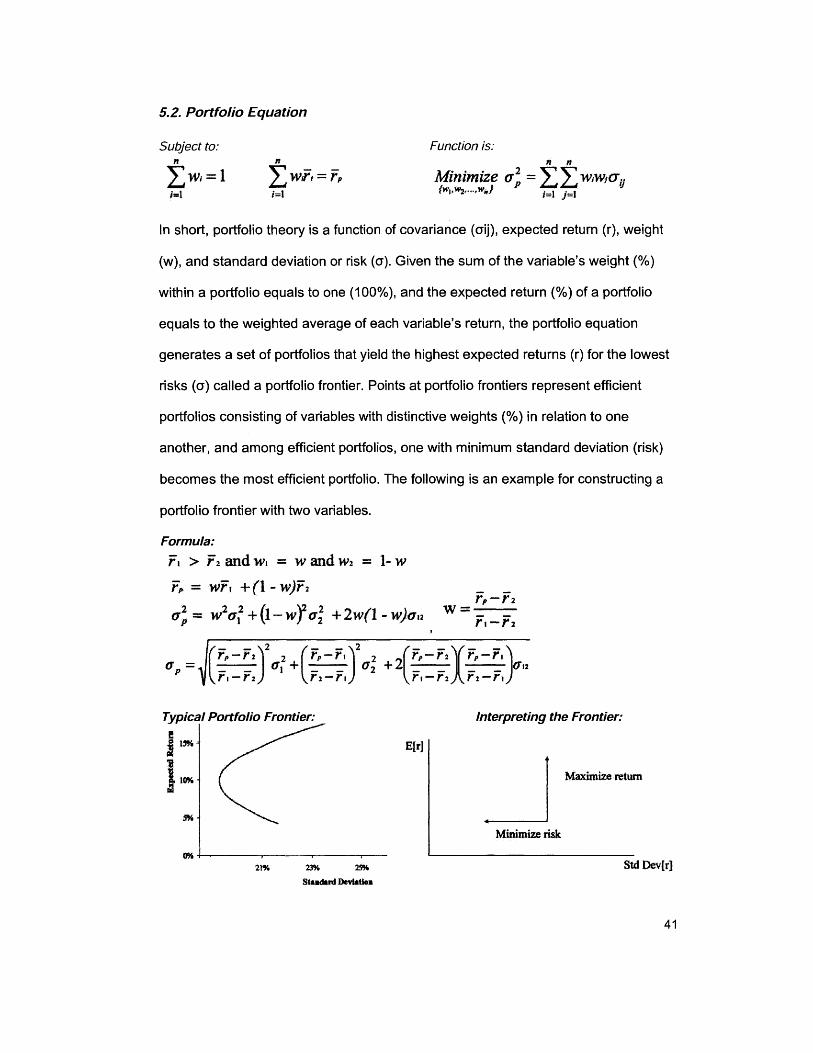
5.2. Portfolio Equation
Subject to: Function is:
=wi,=rp Minimize a =Z$$wwcT1=1{WW.... O.1 P/= j =1
In short, portfolio theory is a function of covariance (aij), expected return (r), weight
(w), and standard deviation or risk (a). Given the sum of the variable's weight (%)
within a portfolio equals to one (100%), and the expected return (%) of a portfolio
equals to the weighted average of each variable's return, the portfolio equation
generates a set of portfolios that yield the highest expected returns (r) for the lowest
risks (a) called a portfolio frontier. Points at portfolio frontiers represent efficient
portfolios consisting of variables with distinctive weights (%) in relation to one
another, and among efficient portfolios, one with minimum standard deviation (risk)
becomes the most efficient portfolio. The following is an example for constructing a
portfolio frontier with two variables.
Formula:F > F2and w, = w and w 2 = 1-w
F, = wF, +(1 -w) 2r,-rz
o = wa1+(-w)Cx2 +2w(1-w)au W -
FO f -F2 2 2 2 4 -4~~ 01r-r2 r2-r, rr r2-r, J
Typical Portfolio Frontier: Interpreting the Frontier:
15% - E[r]
10%O Maimize return
Minimize risk
0%21% 23% 25% Std Dev~r]
Stdard Devianon

5.3. Portfolio Application
Unlike private sectors, cities are yet to realize the importance of systematic risk
management. Their slow pace of adaptation might be partly from the fact that they
are public entities that can benefit subsidies or grants from the federal or state
government in case of financial difficulties, disasters, or major capital investments.
Nonetheless, today cities face aging infrastructure and the ever decreasing amount
of subsidies and grants. As such, many municipalities now act like business
enterprise raising tax revenues through economic development. Nonetheless, they
do not have efficient public investment planning tools essential for cities to maximize
returns on their public investments without sacrificing public benefits.
Responding to the need for efficient public investment tools, portfolio theory in
financial discipline will be incorporated into urban planning, creating urban portfolios.
The mathematics of urban portfolios will be the same as that of financial portfolios
except that in the case of creative capital improvement, a creative capital gain will
become an expected return, and civic attributes will become variables. Although
urban portfolios are different from financial portfolios in terms of scale and contents,
portfolio equation will offer similar portfolio frontier plots, since urban portfolios also
consist of variables (civic attributes) that have performance data in relation to other
civic attributes. In fact, urban portfolios will have civic attributes either competing or
reinforcing one another so as to balance urban environment, and portfolio frontiers
resulting from portfolio equation will provide cities with efficient urban development
plans that allow cities to achieve their goal with very low risk of failure.

5.4. Portfolio Analysis
The reason for using a portfolio is to take advantage of the power of combination.
Analogously speaking, it is like using alloy versus pure metal. Alloy is much more
durable and stronger than pure metal, because it consists of various components
interacting one another with right amount of combination. The tenet of using an
efficient urban portfolio is that just like alloy, urban plans can be structured in a way
that gives the best possible solution for a certain goal. As such, cities must use
portfolios as their planning tools if they want to benefit from the best solution.
Not all portfolios are powerful and efficient, meaning there is a certain set of rules
that applies to powerful and efficient portfolios. The formulas described in the chapter
5.2 are the set of rules deriving efficient portfolios called portfolio frontiers, which
provide the highest yield given a certain risk. All points comprising a portfolio frontier
represent efficient portfolios which consist of variables with distinctive weights. For
urban portfolios, variables mean civic attributes, and distinctive weights mean
investment priorities.
Among efficient portfolios comprising a portfolio frontier, there is one that has the
lowest risk (standard deviation) with a certain return, called the most efficient
portfolio. For urban portfolios, although the most efficient portfolio provides the
lowest risk given a set of public investment, its return or gain does not necessarily
mean the best return for a certain city because some cities cannot afford to invest to
the amount of investment specified by the most efficient portfolio due to their limited
resources and weak competitive position compared to the others.

5.4. Portfolio Implementation
The portfolio analysis described in this chapter suggests that in order for cities to
realize urban portfolio efficiently, they need to follow a certain procedure.
* Firstly, cities need to assess their current competitive position in the market in
terms of existing resources and future prospect. In this stage, accurate
information and keen market understanding is critical; hence, local
community insight should also be reflected in their assessment.
* Secondly, once cities finish their self-evaluation, they need to set a goal or
target return that is realistic and achievable given their competitive edge in
the market.
* Thirdly, they need to decide and define what kind of civic attributes are
needed to achieve their goal and collect statistical data of all the civic
attributes necessary for portfolio calculations in order to derive a portfolio
frontier: a set of efficient portfolios.
" Fourthly, they need to apply their goal setting or target returns to the portfolio
frontier and analyze whether or not the investment directions and priorities of
civic variables obtained from the efficient urban portfolio of their target return
correspond to their current inventory or stage of the civic attributes used in
the portfolio and adjust investment strategies.
* Fifthly, they need to plan how to implement the investment directions or
interventions from the urban portfolio, find out major stakeholders during and
after the interventions, and develop vehicles that can help smooth portfolio
interventions.
* Lastly, they need to monitor the implementation processes and set up
feedback loops for portfolio update.

5.5. Portfolio Management
One of the most challenging tasks during portfolio implementation is to lead, manage,
and synthesize diverse variables within the portfolio to interact one another in
harmony. The previous chapter suggested that developing the vehicles of portfolios
that can help each variable interact one another without disruption is one of the best
solutions available for efficient urban portfolio implementations. In fact, the reason for
finding and understanding potential stakeholders of urban portfolios prior to their
implementation is to well manage urban portfolios in a way that benefits each
stakeholder as much as possible. This chapter uses an analogy from chemistry to
demonstrate what a portfolio vehicle will be like, and how they help efficient portfolio
management.
Let us assume that the seven chemical compounds - Hydrogen oxide (H20),
Carbon dioxide (C02), Carbon sub-oxide (C302), Methanoic acid (HCO2H), Carbon
monoxide (CO), Ozone (03), Oxygen (02) - are civic attributes necessary for
construction an efficient urban portfolio. Although they are different in their
characteristics or functions, when they are perceived in symbol, they all share a
common chemical element called oxide (0). This means the oxide is the element or
"vehicle" that links distinctive chemical compounds seemingly unrelated otherwise.
Likewise, a portfolio vehicle can be structured for an urban portfolio intervention. For
instance, a corporate headquarter can be broken down to offices, training centers,
cafeteria, and gyms, and if a training center can be shared by neighborhoods, then a
training center can function as a portfolio vehicle. Finding a potential portfolio vehicle
might be easy for small scale urban portfolios; however, even for a large complex

urban portfolio can benefit from vehicles by breaking down the scale of the
interventions. The chemical diagrams below analogously demonstrate how vehicles
can be structured to an overall portfolio.
o
Figure 10: Analogous diagram for a small urban portfolio
H
HN
F &1
Figure 11: Analogous diagram for a large urban portfolio
Insofar, this paper urges you to reserve your perspective towards urban planning. If
you have a choice to between an automaker and automobile for your asset, what
would you choose? Responding to this new challenge, this thesis so far demonstrates
why creative capital improvement is critical to cities and further provides ideas of
how cities can improve their creative capital basis using efficient portfolios. Efficient
urban portfolios can help cities observe their environment from a mathematical
standpoint, providing new lenses for planners to become transparent, scientific, and
progressive. This chapter showed how to develop, implement, and manage efficient
urban portfolios as a new engineering mechanism for urban improvement. The
following chapter will demonstrate how efficient urban portfolios can actually
creative environment using Richard Florida's statistic data about civic attributes in
relation to creative capital.

6. Engineering Creative Environment
Using the portfolio equations and Richard Florida's statistic data about creative
capital and civic attributes, this chapter illustrates how cities can actually use efficient
urban portfolios to develop creative environment. The logics of this chapter are:
1. Present the resulted portfolio frontiers for creative capital gain.
2. Analyze the urban intervention directions from the efficient urban portfolios.
3. Verify urban portfolio intervention scenarios in terms of their market sensitivity.
6.1. Urban Portfolio for Creative Capital Improvement
6.1.1. Portfolio Frontier
Portfolio Frontier - Macro Level (City)
120% - ~ ~ ~~ ~
100% *
E 80%
60%
_
40%
20%
0% 50% 100% 150% 200% 250%
Standard Deviation (Risk)300% 350% 400% 450%
Figure 12: Portfolio frontier: Efficient urban portfolios for creative capital gain

6.1.2. Efficient Urban Portfolios
Talent Std / High- Recre- Cool- Housing IncomeGain Risk Diversity Tech Cultural ational Climate ness Value Income Change
10% 424% -9 -7 -4 -3 6 8 -5 1 -2
20% 295% -9 -7 -4 -3 5 8 -6 1 -2
30% 191% -8 -7 -6 -3 4 9 -5 1 -2
40% 112% -8 -7 -4 -3 6 9 -5 1 -2
50% 57% 8 -7 -5 -4 3 9 -6 -1 -2
60% 27% 9 -7 -4 -2 -5 8 -6 -1 -3
70% 21% 9 -7 2 -1 -5 8 -6 -3 -4
80% 40% 9 -7 4 3 -5 -8 -6 -2 -1
90% 83% 9 -7 4 3 -5 -8 -6 -2 1
100% 151% 9 -7 4 3 -5 -8 -6 -2 1
Table A: Efficient Urban Portfolios
The table A shows the efficient urban portfolios for creative capital improvement
converted from the raw data in the exhibit 2. Here, each row of the table A
represents an efficient portfolio for a given target return and the boxed out row
represents the most efficient urban portfolio given its lowest standard deviation or
risk. The integers in the table represent the investment priority of each civic attribute
in relation to the others on a scale of one (low priority) to nine (high priority), given
the total number of the civic attributes is nine.
One thing to make sure before analyzing the portfolio is that negative integers do not
necessarily mean lower priority than that of positive integers. In other words, the
square roots of an integer represent investment priority and the positive or negative
sign indicates investment directions: the former as the increase of the civic attribute
up to the square root number of the integer and the latter as the opposite. For
instance, for the 70% talent gain portfolio, diversity will have the highest investment
priority given its priority level is nine, and the direction of urban intervention will be to
increase the diversity of the city up to the scale of nine in relation to others, given the

integer is positive. On the contrary, recreational amenity will have the lowest
investment priority given its priority level is one, and the urban intervention direction
will be to reduce the number of recreational amenity up to the scale of one relative to
other investments.
Figure 13: Urban Intervention Strategy Plot: Negative values below the horizontal line
The table A and figure 13 clearly shows that a different level of goal or target return
suggests a different urban intervention strategy. For instance, the efficient urban
portfolios targeting over 50% of talent gain suggest significant increase in diversity,
whereas, the efficient urban portfolios targeting below 40% of talent gain suggest
significant decrease in diversity. Nevertheless, some investment strategies are
constant throughout the all urban efficient portfolios; for instance, every efficient
urban portfolio shown in the figure 13 suggests significant decreases in high tech
and housing value, whereas significance increases in coolness. In general, the

efficient urban portfolios for creative capital improvement indicate that heavy
investment in high tech and real estate bubbles will not bring about creative
environment. Although the later chapter will verify the overall validity of investment
strategies from the efficient portfolios given in this chapter by using the raw market
data, one can immediately realize that the overall strategies described in this chapter
make sense given many cities have tried to assimilate Silicon Valley or the route 128
in Boston, resulting in the oversupply of high tech, and higher rents usually hinder
entrepreneurial and startup businesses.
6.1.3. Market Sensitivity
In order for cities to adopt efficient portfolios as their urban planning tools, they need
to make sure that the directions of urban interventions provided by the efficient urban
portfolios reflect market sensitively. In fact, one of the main premises of using the
efficient urban portfolios is that efficient portfolios can self-update as long as they
constantly incorporate newly available information. For the verification of the market
sensitivity of the efficient portfolios presented in the previous chapter, Richard
Florida's ranking data will be used as the source of market, given his ranking reflects
the market research of over a few decades.
The table B below shows the existing inventory of the diversity and high tech of each
city along with each city's rank in talent index. The numbers in the diversity and high
tech columns in the table B come from exhibit 1, but the ranking is converted to the
amount of each civic attribute available in the city. In other words, each number at
the table B, except the talent index ranking, was calculated by subtracting rank from
50: the total number of ranking in the exhibit 1.

Washington 1 47 46
Boston 2 44 48
San Francisco 3 48 49
Austin 4 42 36
Atlanta 5 36 42
Seattle 6 45 47
Denver 7 33 37
Minneapolis 8 31 31
New York 9 46 40
Dallas 10 35 45
Richmond 11 20 5
Houston 12 32 35
Chicago 13 39 43
San Diego 14 43 38
Table B: Market Data of Diversity and High-Tech Inventory in year 2000
Figure 14: The average amount of diversity and High Tech available in the cities up to talentindex ranking 14
Summing up the table B, 55% of cities up to rank 14 have more high tech attributes
than diversity attribute, and the average amount of each attributes up to rank 14 is
38.64 for diversity and 38.71 for high tech (see the figure 14). This means high tech
is already saturated compared to diversity; therefore, in order to be market sensitive,
the efficient urban portfolios should suggest increase in diversity and decrease in
Average Stock up to Top Rank 14
A 38.71
Diversity High-Tech
Cities Talent Index Ranking Diversity High-Tech
Diversity High-Tech

high tech, responding to the niche market demand: the short of diversity despite
strong preference toward diversity by creative capital for their creative work.
The table A and the figure 13 suggest the investment strategy of increase in diversity
and decrease in high tech for high talent gain; therefore, the efficient portfolios are
sensitive enough to show the right investment strategies that clearly respond to
unmet creative capital's demand. In fact, the higher the ranking of a city for its talent
index, the more high-tech the city already established (see the exhibit 5),
substantiating even more the accuracy of the investment strategies provided by the
efficient urban portfolios. Based on the market sensitivity analysis conducted in this
chapter, it is absolutely clear that cities using efficient urban portfolios for their urban
interventions will achieve their goal without the major risk of failure.
6.2. Portfolio of Diversity
There are many civic attributes already available to be used for efficient portfolio
development, but some may have definitions too broad for cities to develop any kind
of execution strategies for that specific attribute. As such, civic attributes defined in a
broad term should be broken down into smaller and more specific civic attributes. As
a matter of fact, the more specific civic attributes get the better for cities to develop
specific actions for the effective urban portfolio interventions. The effective urban
portfolios formulated in the chapter 6.1.2 unfortunately have a couple of civic
variables that needs to be broken down due it their vague term. For instance,
diversity or coolness cannot be perceived as specific as housing price, cultural
amenities, or high-tech.

According to Florida, diversity means the low barriers to entry for people regardless
of their backgrounds. His definition of diversity is obviously too broad for cities to
develop action plans; as such, diversity must be broken down into smaller attributes.
One thing cities must pay attention to is that the subsets of diversity must be
organized as yet another portfolio. In other words, just as urban environment is
perceived as a portfolio of civic attributes, civic attributes also should be perceived as
a portfolio of smaller civic components. For technicality, the large portfolio can be
phrased as a primary portfolio and the smaller one a secondary and so on.
The kind of subsets available for diversity is quite limited given this paper only use
Florida's statistic data. Nonetheless, there are three attributes that can function as
the subsets, given their definitions seem to correspond to what Florida has described
for diversity that is conducive to creative capital improvement. The three subsets are
Bohemian (BoHo) Index, Gay Index and Melting Pot Index, and the reasons for
choosing them are their characteristics as being open to cultural, social, and racial
differences, which somewhat correspond to his low barrier to entry.

6.2.1. Portfolio Frontier
Portfolio Frontier -Micro Level (Diversity)
250%
200%
150%
2 100%
50%
20% 40% 60% 80% 100%
Standard Deviation (Risk)
Figure 15: Portfolio frontier: Efficient portfolios for Diversity
6.2.2. Efficient Portfolios of Diversity
Talent Gain Std Dev.I Risk Bohemian Index Gay index Melting Pot Index
10% 0.374% -2 -1 3
20% 0.208% -1 -2 3
30% 0.564% 2 -1 3
40% 1.443% 3 -1 2
50% 2.845% 3 -1 2
60% 4.768% 3 -1 -2
70% 7.215% 3 -1 -2
80% 10.183% 3 -1 -2
90% 13.674% 3 -1 -2
100% 17.688% 3 -1 -2
150% 45.592% 3 -1 -2
200% 86.557% 3 -1 -2
Table C: Efficient Portfolios of Diversity
Unlike the large urban portfolios, the investment priority pattern for the portfolios of
diversity is quite consistent throughout the efficient portfolios, except the 20% talent

gain portfolio. This consistency might be resulted from the fact that unlike the
efficient urban portfolios consisting of civic attributes either reinforcing or competing
one another, the efficient portfolios of diversity consist of civic attributes that seem to
reinforce only. Nonetheless, the 20% portfolio which is the most efficient given its
lowest standard deviation provides different investment strategy, as melting pot index
holds the largest priority and down to Gay and Bohemian indices respectively.
The figure 16 below shows investment strategies more illustrative ways than the
table C. It clearly shows that regardless of target returns, Gay index must be
decreased to gain talent efficiently. The most efficient portfolio, 20% talent gain,
indicates that the best way to gain talent is to increase the Melting pot index to the
largest amount while reducing the Bohemian and Gay indices with slightly more
reduction in Gay index. The following chapter will verify whether or not the
investment direction provided by the portfolio actually does make sense in the real
market.
+10% --- 20% --- 30% -e 40% -X*- 50% - - 60%-+-70% -80% -90% 100% - 150% -h-200%
Figure 16: Snake plot of investment priority of variables in the micro portfolio
Investment Weight

6.2.3. Market Sensitivity
Cities Talent Index Ranking Bohemian Index Gay Index Melting Pot Index
Washington 1 44 48 40
Boston 2 41 42 41
San Francisco 3 42 49 46
Austin 4 40 47 31
Atlanta 5 37 46 19
Seattle 6 49 44 35
Denver 7 36 40 21
Minneapolis 8 43 33 15
New York 9 47 36 47
Dallas 10 35 31 34
Richmond 11 24 21 11
Houston 12 20 29 42
Chicago 13 30 35 43
San Diego 14 32 45 44
Table D: Market Data of Bohemian, Gay, and Melting Pot Index inventory in year 2000
Like the table B in the chapter 6.1.3, the table D shows the existing inventory of the
three attributes in each city. Although cities up to the rank 14 for its talent index show
varying inventory distribution patterns, cities at the top five show a remarkably similar
inventory distribution pattern: large gay index followed by bohemian and melting pot
index respectively. The figure 24 illustrates that on average the cities highly ranked
for their talent index up to the rank 14 have higher gay index volume followed by
bohemian index and Melting pot index respectively, meaning the best investment
strategy is to tackle the melting pot index followed by bohemian index, given the
melting pot and bohemian indices are still in short in many cities with high volume of
talent despite creative capital's preference of them. The most efficient portfolio of
diversity developed in the previous chapter suggests that cities increase the melting
pot index while scale down the bohemian and gay indices in descending order. This

investment direction clearly hit the nail on the head in terms of meeting current
market demand and condition, proving that the efficient portfolios reflect the market
sensitively.
Average Stock up to Top Rank 14
3.50
Index
3
Bohemian Index Gay Index Melting Pot
Figure 24: The top 14 cities' average Inventory comparison of the three variables

7. Managing Creative Environment
Urban portfolios combine various civic attributes which either compete or reinforce
one another in order to function as a multidimensional and interactive set of
combined actions. As mentioned earlier, the number of potential civic attributes is
endless; hence, the larger an efficient portfolio becomes the more it will need civic
attributes, let alone complex operation it must endure during portfolio implementation
and management. As such, this chapter suggests how civic variables can be
organized in a way that makes urban portfolios function efficiently.
Gay Index
* Tolerance Diversity Meliting Pot
HighTedi Boho IndexHigh-Tech
PORTFOLIO 0 Technology
Coolness cultural Arnenity
* Talent Per capita Housing valueIncome
Recreational -climateAmenity
Tier Ter 2 Tier 3
Figure 17: Grouping civic variables in hierarchical order based on their characteristics
The figure 17 above shows how each specific civic attribute can be grouped into a
larger context, helping cities observe civic attributes in a more comprehensive way.
As urban portfolios consist of the weights of civic attributes as a percentage of the
total of one (100%), reflecting the limited amount of resource available in cities, and
the weight exchanges among the civic variables is inevitable, once the investment
priority and direction shown as integers is set up by portfolio calculations, perceiving

urban portfolios as a form of network is also useful to understand the relationship
among civic variables (see the figure 18).
0
0-j0z
Cultural
D-f Amenity
0 TOLERANCE -- Diversity Meliting Pot - Housing Per Capita -TALENT*Oa value Income
\Boho Inde Recreational)Clmate - Amenit
Figure 18: Civic variables as a form of networks
However, as the figure 18 shows, managing the network relationship with weight
exchanges among the civic attributes as a form of numerous direct links will be very
unproductive and even unmanageable for the large urban portfolios consisting of say
1000 civic attributes. For instance, reducing median housing value by providing more
affordable housing on high tech district may correspond to urban portfolio
applications, since it implements collective actions targeting various civic variables
with a single goal in the first place. Nevertheless, some landlords in the high tech
district may not like affordable housing since it may change say the ideal
neighborhood characteristics, or real estate developers who already purchased land
with high price may not welcome the decrease of median housing value. These

various interests or disgruntles may eventually hider the further execution of the
urban portfolio if they grow to collective resistance.
. TOLERANCE - Diversity
I -
Gay Index CuKu
Meliting Pot Housing Per Capta - TALENT *value Income
Bho Index Recreuancimate Anity
Figure 19: The refined organizational structure of civic attributes
One of the potential solutions for managing complex network relationships might be
using a pivot as a vehicle facilitating interdependence as illustrated in the figure 19.
By using an entity that can simplify the complex relationship, an urban portfolio can
be managed very efficiently, expediting the overall operation of the portfolio.
Nonetheless, there will be no one-size-fits-all vehicle, given every city is unique in
social, cultural, economic, physical, political, and geographical context. Public policy,
agencies, or local non-profit organizations could function as a vehicle facilitating
dialogues among the civic attributes, but ultimately it is up to cities themselves for
deciding a right portfolio vehicle given they know more about themselves than
anyone else.

The following chapter will introduce a few potential portfolio vehicles based on the
case studies of either successful or unsuccessful urban improvement. One thing that
cities should remember when they set up a portfolio vehicle is that portfolio vehicles
are not a static entity; in other words, just as urban portfolios can constantly evolve
with the changing market by using the latest information, a portfolio vehicle should
evolve overtime in the context of changing urban dynamics.

8. Potential Vehicle of Portfolio
Changing urban contexts is inevitable; as such, cities need to be ready for potential
disruptions from social, physical, and political changes. In the past, a huge influx of
peasants and the great depression plagued cities with pollution, poverty, and crime.
Low interest mortgage rates and the mass productions of automobiles caused urban
sprawl. Today, over eleven million illegal immigrants mainly from Mexico generate
heated nationwide political debates. Ironically, the most at stake are creative centers
in the US which have used cheap illegal labors in many of their private service
sectors. As mentioned earlier, creative economy tends to demand 24/7 urban service,
and according to news from CNN, unfortunately many workers working in low pay
service sectors are illegal immigrants.
Like it or not, many US cities need cheap labor supply especially for their service
sectors to become competitive in knowledge economy because many 24/7 service in
cities are demanded by knowledge workers. As such, economic contributions illegal
labors have made should not be overlooked in the process of making a new
immigration law. Nevertheless, justifying illegal immigration by amnesty sends wrong
messages, but the absence of legal right and responsibility hinders effective urban
planning given statistic discrepancy. Although Immigration policy is beyond the
scope of this paper, given its significant impact on urban planning, this paper
addressed illegal immigrant issues to suggest that cities develop a portfolio variable
that reflects illegal immigrants in order to develop efficient urban portfolios.

As illegal immigration issues above indicates, efficient portfolio requires accurate and
market sensitive urban data, therefore, including local communities during the urban
portfolio development is absolutely critical. In fact, this local participation required
during urban portfolio development actually help local communities feel a sense of
ownership hence will make various urban portfolio interventions much easier. Here,
local government should play active role in bridging communities with technical,
strategic, and managerial expertise, helping communities take advantage of
professional services in developing urban portfolios. Although using professional
services will be a convenient way of making urban portfolios, communities should
remember that they should play leadership role because urban interventions
primarily led by professionals will cause the displacement of long term and less
desirable residents either with or without intention. As such, to curb gentrification,
urban intervention plans should be led by the local residents with governmental
assistance.
Unlike suburban bedroom towns or rural areas, cities are cohabitated with a wide
spectrum of social class. Many social classes are fairly interdependent although they
may not realize as we saw that creative class needs service class for its better
performance. As such, cities need to provide a wide range of options available to a
variety of socioeconomic classes. The complex urban metabolism, in fact, requires
multidimensional urban plans, and this can be achieved through urban portfolios
given urban portfolios are based on collective and systematic diversification with
balance. Urban portfolios might be a combination of new business attractions,
business retention and expansion, downtown (re)development, affordable housing,
industrial development, small or minority business development, technical training,

social programming, and public architecture; but cities should remember that there is
no single recipe for successful urban portfolios.
There is a danger of using general data for urban portfolios as they are easy to get;
however, individual circumstances, needs, and resources unique to each city should
be considered to tailor urban portfolios to each city. Nevertheless, some reference
points are necessary given urban portfolio execution is complex matrix. According to
Harry Black's report for the International City Management Association (ICMA), four
strategic categories - governance and infrastructure, land and property management,
finance, and marketing - seem to emerge as most common practice for many
municipalities targeting economic development.
By combining these common practices, cities can develop strategic portfolio
implementation plans. But as discussed earlier, urban portfolio implementation is
directly linked to fair exchange of weights among civic attributes within portfolios;
therefore, developing common interest or mitigating conflicts among affected
variables is instrumental for successful urban portfolio implementation. The following
chapters introduce potential vehicles for successful portfolio implementation with
some case studies, but no vehicle can be one-size-fits-all.
8.1. Academic Institution
In general, academic institutions can be a good candidate for a portfolio vehicle since
they tend to be politically neutral embracing openness, diversity, fairness, and new
ideas. These unique characteristics of academic institutions produced a variety of
3 Harry Black. (1991). Achieving Economic Development Success: Tools That Work. Aspecial report for the International City Management Association (ICMA)

partnerships. According to the Department of Housing and Urban Development
(HUD)'s report in 1996, there are a growing number of University-Community
Partnerships and they have been substantially successful in local economic
development. The HUD's report verified the combined strength of higher educational
institutions, local governments, community organizations, and public housing
authorities acting in partnership. It also addresses that economic and intellectual
resources along with the facilities of colleges and universities benefit communities in
many innovative ways.
According to the HUD's reports, many academic institutions already have facilitated
community development by providing social services, public school supports,
technical assistance to community organizations, target research for problem solving,
and opportunities for faculty, students, and local residents to learn from one another.
Furthermore, the HUD report identifies the partnership of university, residents,
organizations, and government as powerful economic resources and lays out
common activities widely adopted by multidisciplinary partnership into seven
categories: service learning, service provision, faculty involvement, student
volunteerism, community in the classroom, applied research, and major institutional
change.
The activities described above can be a potential vehicle for urban portfolio
implementation; therefore, it is worth to elaborate the seven categories. Service
Learning is university programs where students' service activities count as course
credits; Service Provision is noncredit student and faculty initiatives as long-term
3 University-Community Partnerships in America: Current Practices, Volume 1i1 1996 HUD'sOffice of University Partnerships

target projects for a specific community; Faculty Involvement is the involvement of
academic faculty in community activities; Student Volunteerism is activities driven by
students for rewarding experiences as well as for noncredit graduation requirements
of volunteerism; Community in the Classroom indicates continued education for local
residents to enhance community capacity; Applied Research is activities accessing
the needs and solutions for community improvement; and lastly but not least Major
Institutional Change is an initiative adopting community benefits as academic
evaluation criteria.34
* Case one: the Colorado First Program
This case is a customized training project that made business training available to
startups in Colorado. Operated by the Colorado Community College and
Occupational Education System, this program served as a one-stop center for
businesses to tap into local inventories.35
e Case two: The Ohio Tomas A. Edison Institute
This case addresses that technology incubators performing basic research and
applied research for industry sponsors can provide opportunities for local residents to
take advantage of scientific and technical training programs, enriching the human
capital basis of the city. 36 One interesting thing about this case is that the institute is
not a single but a network of 28 community colleges, which effectively spreading the
benefits into regional scale.
34 University-Community Partnerships in America: Current Practices, Volume 1I 1996 HUD'sOffice of University Partnerships3s Harry Black. (1991). Achieving Economic Development Success: Tools That Work. Aspecial report for the International City Management Association (ICMA)36 Harry Black. (1991). Ibid

The case studies above are more or less large scale; however, many urban
interventions tend to be small and incremental even starting from setting up a little
corner store. As such, portfolio vehicles may not need to be large organizations.
MBA students, for instance, can get a course credit for helping small and minority
business owners develop business plans. Law students could advocate for
increasing minimum wages. Urban planning students could collect surveys.
Architectural students can get a course credit for helping affordable housing or small
shop design. These are some examples of small portfolio vehicles that can help
urban portfolio implementation.
8.2. Public Policy
Public policy can be a good candidate for a portfolio vehicle, given the fact that it
encompasses a wide range of community interest. Using high property tax rate for
luxury condos for affordable condo development can affect various neighborhoods
and real estate development. Smart Growth, Loan Guarantee, Enterprise Zones,
Incubators, Tax Incremental Financing (TIF), Community Development Block Grant
(CDBG), Inclusionary Housing, LIHTC Location Policies (transit requirement policies),
Housing Incentive Program (funding for TOD and affordable unit projects at Bay Area,
San Francisco), Affordable Housing Tax Class, Expedited Permits for Affordable
TOD (smart program in Austin Texas), Real Estate Transfer Tax Funds (Housing
Trust Fund at Chicago), and Massachusetts 40B State Affordable Housing Zoning
Law (the state mandate for affordable housing construction) are good candidates
currently available for portfolio vehicles that can expedite and stimulate portfolio
implementations.

The 40B in Massachusetts, for instance, contributing to the expansion of mixed
income neighborhoods; CDBG and TIF can foster downtown revitalization by lowing
project costs; Enterprise Zones and Incubators can stimulate local economy through
new business attraction or local business expansion; New Urbanism, although not
public policy per se, can increase public safety; Individual Development Accounts
(IDAs), an asset building tool for low and moderate income individuals, can stimulate
higher education for low income class.
8.3. Agency
Agencies can be a good candidate for a portfolio vehicle as long as they are
engaged as a neutral party, treating various communities fairly. Professional
agencies can provide technical supports during the planning, coordinating, financing,
and implementation processes of urban portfolios, and they may be able to mediate
minor conflicts. As such, engaging agencies as a partner during urban portfolio
development is desirable, but an organizational model should be considered prior to
partnership formation with agencies. According to Robert R. Weaver at University of
Texas, six organizational models have been widely accepted for urban development
depending on controls, public funds, and goal of the project.37 They are publicly
assisted private model, public proprietary model, private proprietary model, private
political model, privately initiated public private partnership model, and publicly
initiated public private partnership model.
Each model can be selected as a potential structure of portfolio vehicles based on
the scope and funding of the urban development. Small mixed use projects in a
3 Harry Black. (1991). Achieving Economic Development Success: Tools That Work. Aspecial report for the International City Management Association (ICMA)

remote suburb may not necessarily need public private partnership, whereas
converting residential zone to industrial zone might require a partnership model with
significant public authority. In fact, cities can combine any models depending on the
type and process of portfolio implementation. Following is a case study that shows
how publicly initiated public private partnership model can be an effective portfolio
vehicle.
* Case study: Downtown Kingston, Jamaica38
In this case, public private partnership and financing mechanisms called Business
Improvement District (BIDs) or Downtown Management Districts (DMDs) are used to
revitalize the downtown Kingston the capital of Jamaica. Once the center for
commercial, industrial, and governmental activities, Kingston started to decline
mainly due to the relocation of the Port of Kingston, the alternative financial district in
New Kingston, and financial deficit of the Government of Jamaica (GOJ). The city
was plagued with violence, high crime rate, and deteriorating public service and
infrastructure, filthy sewer drains, vacant lots, garbage, homelessness, and rundown
neighborhoods.
In 1985, the U.S. Agency for International Development (USAID) along with Kingston
Restoration Company (KRC) initiated a program coordinating public and private
investment. By adopting the BID concept, which started in the US in the 1970s for
downtown redevelopment by allowing the private sectors designated for public
services to have self-governing taxing authority, USAID and KRC along with the
Jamaica Chamber of Commerce and the Jamaica Ministry of Local Government
created Downtown Kingston Management Districts (DKMD) which operated trash38 www.makingcitieswork.org/ files/docs/LED/DKMDCaseStudyFINAL.pdf

cleaning business and solid waste collection service for Metropolitan Parks and
Markets (MPM) with fees.
The DKMD's strategy was cleaning up downtown to make downtown attractive for
businesses, while promoting new downtown image through cultural activities such as
Christmas parade; New Year's fireworks; Waterfront concerts, and Event
sponsorship. This simple but multidimensional approach not only boosted economic
activities, environmental quality, and public safety, but also provided low income
residents job opportunities and a sense of pride. The DKMD's function could be
interpreted as a portfolio vehicle since it combined various civic attributes. Here, the
most prioritized investment was improving the existing environment followed by
public relation activities. Without the DKMD which had political supports, foreign aids,
and steady income, the efficient improvements of civic attributes such as public
safety, business expansion, and clean environment might not have occurred.
8.4. Civic Center
Civic centers are a good candidate for a portfolio vehicle since they can effectively
connect various people along with public institutions. For instance, providing space
for public forum can initiate dialogues among different socioeconomic classes about
public policies, individual concerns and needs, or new ideas. A civic center does not
necessarily connote public buildings such as schools, libraries, or community
centers; in fact, any form of public space such as plazas, squares, parks, and
markets can function as a civic center. There are many good civic center examples,
but there are also many bad examples. The following case studies show both good
and bad examples respectively.

e Granville Island, Vancouver BC, Canada 39
Although it was salvaged from the husks of old factories, Granville Island is one of
the most dynamic districts in Vancouver. Containing a variety of civic attributes such
as markets, play areas, cultural activities, and stunning waterfront, it is a destination
for various socioeconomic classes. Granville Island will not likely win any design
award since dollars spent on architecture and landscape was minimal; however, its
function as a portfolio vehicle synthesizing many small business developments
deserves awards.
0 Guggenheim Museum Bilbao, Spain40
Unlike Granville Island, Guggenheim Museum at Bilbao is one of the word's most
expensive, famous, and impressive architecture. However, its function as a civic
center is pretty unsuccessful, since the public space use in and around the museum
is desolate and empty. As a monument, it drew many international attentions to the
city of Bilbao, but it failed to draw local activities as it was disengaged from the civic
and cultural life of the city which local people feel proud of. In fact, had Bilbao
adopted urban portfolio interventions instead, the solution might have been much
more responsive to local needs.
Figure 20: Granville Island, Vancouver Figure 21: Guggenheim, Bilbao
39www.pps.org40www.pps.org
The case studies clearly indicate that civic centers should be derived from the user's
perspective in order to become an effective vehicle of an effective urban portfolio.
Civic centers that demand attentions but never give back something in return is the
worst possible portfolio vehicle as presented in the case studies. Civic centers as a
portfolio vehicle, demand architects not to focus on spectacular space but to the
intensity of the use by communities. As an analogy, a Ferrari without Gas cannot
become real Ferrari.
A portfolio vehicle is site specific, as each city is unique it its own setting. For
instance, the museum of modern art (MoMa) in New York cannot function in the
same way somewhere in Africa. As such, local communities or municipalities must
develop their own portfolio vehicles once at a time based on their intensive local and
real knowledge. Developing a civic center as a portfolio vehicle, therefore, requires
intensive and broad local participations. In this regard, international design
competitions might not be such a good idea for developing a civic centre as a
portfolio vehicle. The following chapter will conclude this thesis with a suggestion for
future research.

9. Conclusion
This thesis asks urban designers and planners to reverse of their thinking about
cities. It asks them to think in users' perspective. For instance, let say you are a
creative individual and have a choice of choosing a place to live. Where would you
choose between one that fosters freedom to explore your innovative ideas and the
other that force you to conform to the standards they established years ago?
Responding to the analogous questions, this thesis argues it is not the number of
creative people but creative environment that motives creative spirit innate in people
regardless of their socioeconomic classes. Creative capital as an operator of
creativity was analyzed and targeted for cities to target as one of ways to build
creative environment. As a market sensitive engineering tool to create a desired
environment, efficient urban portfolios was introduced, given they can provide high
yield with low risk.
As such, the efficient urban portfolios are urban environment engineered with civic
attributes that efficiently help cities achieve what they need and want. This approach,
therefore, will fill the gap that Richard Florida leaves in his creative capital
proposition. As a testing ground, this thesis provides a planning tool that shows how
to develop urban environment that can motivate creative spirit within people, using
portfolio theory proven to function in finance. The fact that many cities with the
compatible number of creative capital show varying degree of economic success
discovered by Richard Florida's research reinforces this thesis which argues that it is
not creative class but creative environment cities need to develop for truly egalitarian
economic growth.

Unlike past, highly advanced Information technology and widely available
socioeconomic data support urban portfolio applications in urban planning. Portfolio
theory adopted in thesis as engineering mechanism has been proven to be effective
in financial discipline, and this thesis demonstrated how it can be effectively applied
in urban planning through market sensitivity analysis conducted in this paper using
urban data from Richard Florida. Furthermore, the efficient urban portfolios can
function as a market sensitive risk management tool, given the mechanism of making
efficient urban portfolios allows the constant update of the portfolio from newly
available market data just like financial portfolios.
One of the main reasons for advocating urban portfolio application is also grounded
to the fact that the scientific mechanism of urban portfolios based on proven
statistical data can make urban planning become transparent to everyone involved in
urban planning processes. In fact, active public inputs and local participations for the
accurate data sourcing and right civic attribute choices for efficient urban portfolios
helps cities become more integrated among many different components of the city.
Given the heavy integration needed for creating efficient urban portfolios, developing
portfolio vehicles, helping the smooth operation of urban portfolio developments as
well as interventions by becoming the common denominator of various civic
attributes or portfolio stakeholders is instrumental to the efficient use of urban
portfolios.
Environment should not just be planned but engineered in a way that brings possibly
the best outcome without too much risk associated with actions towards that
outcome. Urban portfolios help cities to focus not a product, physical form, but the
producer of the product when they conduct urban planning and development by

providing the customization mechanisrns for user demand. Just like companies try to
develop products based on their consumer needs, cities much develop their
environment responsive to the user's needs and demands. For cities, user demands
can be perceived as civic attributes, and this thesis adopted civic attributes attractive
to creative capital according to Richard Florida's extensive research. The
multidimensional nature of portfolio mechanism allows seemingly distinctive civic
attributes integrate one another, generating synthetic effect in urban intervention.
Furthermore, effective portfolio vehicles will help urban portfolio development,
implementation, operation, and management run smoothly. As mentioned earlier,
right civic attributes and a portfolio vehicle that can efficiently manage the right civic
attributes are critical for a successful urban portfolio; as such, developing a
systematic process of setting up right civic attributes and portfolio vehicles would be
next step forward.

10. Bibliography
Paul Michael Romer. (1989). Increasing Returns and New Developments in the theory of
growth. Working paper no. 3098. Cambridge MA: National Bureau of Economic Research
Joseph A. Schumpeter. (1975). From Capitalism, Socialism and Democracy. New York:
Harper, 1975) [orig. pub. 1942], pp. 82-85
Paul Michael Romer. (1989). Increasing Returns and New Developments in the theory of
growth. Working paper no. 3098. Cambridge MA: National Bureau of Economic Research
Richard Florida. (2002). The Rise of the Creative Class. New York: Basic Books
Richard Florida. (2005). Cities and the Creative Class. New York. London: Routledge
Peter Drucker. (1993). The Post-Capitalist Society. New York: Harper Business
Timothy Sturgeon, (2002). Modular Production Networks: A New American Model of
Industrial Organization. Industrial and Corporate Change,1 1(4)
Richard Lloyd and Terry Nichols Clark, (2001). the city as an entertainment machines, in
Kevin Fox Gotham, Critical Perspective on Urban Redevelopment Research in Urban
Sociology Vol.6 Oxford: JAI Press/Elsevier
Edward L.Glaeser, Jed Kolko and Albert Saiz, (2000) Consumer City. Cambridge: National
Bureau of Economic Resaerch, Working Paper No. 7790
Edward Glaeser. (2000). The New Economics of Urban and Regional Growth. Oxford: The
Oxford Handbook of Economic Geography, Oxford University Press
Paul Romer. (1990) Endogenous Technological Change: Journal of Political Economy 98, 5:
S71-S102
Robert Park, E.Burgess, and R. Mckenzie (1925) The City. Chicago: University of Chicago
Press
Jane Jacobs. (1961). The Death and Life of Great American Cities, Cities and the
Wealth of Nations. New York: Random House
Teresa M. Amabile. (1998). How to Kill Creativity. Harvard Business School Review
Robert Lucas, Jr. (1998). On the Mechanics of Economic Development. Journal of Monetary
Economics, 22, 1998: 1-42
Paul Romer. (1990) Endogenous Technological Change: Journal of Political Economy 98, 5:
S71-S102
Richard Florida . (2000). Competing in the Age of Talent, R.K Mellon Foundation Report
Kevin Kelly. (1998). New rules for the new economy: 10 radical strategies for a connected
world. New York: Viking
Michael E. Porter (1998). The competitive advantage of nations: with a new introduction.
Basingstoke : Macmillan
Michael Porter. (1998) Clusters and the New Economics of Competition: Harvard Business
Review
Pascal Zachary. (2000). The Global Me, New Cosmopolitan and the Competitive Edge:
Picking Globalism's Winners and Losers. New York: Perseus Books Group, Public Affair
Annalee Saxenian (1999). Silicon Valley's New Immigrant Entrepreneurs. Berkeley: Public
Policy Institute of California
Philip Kotler. (2005). According to Kotler. New York: Amacom, American Management
Association
Philip Kotler, Donald H. Haider, and Irving Rein. (1993). Marketing Places: Attracting
Investment, Industry and Tourism to Cities, States and Nations. New York: The Free Press
G.J. Ashworth and H. Voogd. (1990). Selling the city: marketing approaches in public sector
urban planning. London & New York: Belhaven Press

Gerard Marlet, Clemens van Woerkens. (2004). Skills and Creativity in a Cross-section of
Dutch Cities. Utrecht School of Economics Tjalling C Koopmans Research Institute
Discussion paper series 04 - 29
Pascal Zachary. (2000). "the Global Me, New Cosmopolitans and the Competitive Edge:
Picking Globalism's Winners and Losers. New York: Perseus Books Group
Harry Black. (1991). Achieving Economic Development Success: Tools That Work. A special
report for the International City Management Association (ICMA)
University-Community Partnerships in America: Current Practices, Volume 1I1 1996 HUD's
Office of University Partnerships
Kathryn Wallace. (2005). America's Brain Drain Crisis: Reader's Digest Article
Web Source
www.makingcitieswork.org
www.pps.org
www.cpn.org
www.huduser.org
www.lisc.org
www.chicagofed.org
www.smartgrowth.org
www.milkeninstitute.org

11. Exhibits
Ranking Data
RegionWashingtonBostonSan FranciscoAustinAtlandaSeattleDenverMinneapolisNew YorkDallasRichmondHoustonChicagoSan DiegoAlbanyHonoluluPortlandBaltimoreRochesterPhiladelphiaColumbusSacramentoLos AngelesKansas CitySalt Lake CityMemphisOklahoma CityCincinnatiMashvilleMilwaukeeIndianapolisOrlandoWest Palm BeachNew OrleansPhoenixSt. LouisCharlotteBirminghamPittsburghSan AntonioGreensboroClevelandDaytonBuffaloNorfolkMiamiLouisvilleDetroitTampaLas Vegas
Exhibit 1
Talent Bohemian Gay MeltingIndex Index Index Pot Index
1 6 2 102 9 8 93 8 1 44 10 3 195 13 4 316 1 6 157 14 10 298 7 17 359 3 14 3
10 15 19 1611 26 29 3912 30 21 813 20 15 714 18 5 615 45 30 3016 17 20 517 5 23 2318 44 31 3319 31 13 2420 35 36 2521 29 25 3822 39 9 1423 2 7 224 22 35 4225 23 41 2826 40 33 4627 49 27 3628 19 38 4029 4 28 4730 28 40 3431 34 34 4432 12 11 1733 16 16 1134 41 24 2635 24 22 2136 38 45 4337 36 43 4138 42 49 5039 46 39 3740 50 32 1241 21 46 4842 47 47 2243 43 26 4544 48 50 2745 37 37 3246 27 12 147 33 42 4948 25 44 2049 32 18 1850 11 48 13
Composite High- Tech-GrowthDiversity Tech
421
1483
1319105
45157
1239481631381128226
18294942324035172126479
203330252441363446443750232743
Index
Source: Richard Florida. (2002). the Rise of the Creative Class. New York: Basic Books

100%
150.5680%
220.0336%
-6.9366%
0.0597%
0.0339%
-0.5219%
-111.8606%
90%
82.8682%
179.4557%
-6.4561%
0.0401%
0.0224%
-0.4133%
-71.9094%
-0.8024% -0.7302%
-0.0143% -0.0122%
0.0085% 0.0028%
80%
39.6840%
138.8779%
-5.9755%
0.0205%
0.0109%
-0.3047%
-31.9581%
70%
21.0152%
98.3000%
-5.4950%
0.0009%
-0.0005%
-0.1960%
7.9931%
-0.6580% -0.5859%
-0.0101% -0.0079%
-0.0029% -0.0086%
60% 50%
26.8619% 57.2240%
57.7221% 17.1442%
-5.0145% -4.5339%
-0.0187% -0.0383%
-0.0120% -0.0235%
-0.0874% 0.0212%
47.9444% 87.8956%
-0.5137% -0.4415%
-0.0058% -0.0037%
-0.0143% -0.0200%
40% 30%
112.1017% 191.4948%
-23.4337% -64.0117%
-4.0534% -3.5729%
-0.0579% -0.0775%
-0.0350% -0.0465%
0.1298% 0.2383%
127.8469% 167.7984%
-0.3694% -0.2972%
20%
295.4034% 423.8285%
-104.5947% 145.1675%
-3.0872% -2.6118%
-0.0971% -0.1167%
-0.0579% -0.0694%
0.3470% 0.4556%
207.7494% 247.7009%
-0.2250% -0.1529%
-0.0016% 0.0005% 0.0026% 0.0047%
-0.0257% -0.0314%
10% | Talents Gain
Min. StdDev.
Diversity
High Tech
CulturalAmenity
RecreationalAmenity
Climate
CoolnessMeianHousingValue
Per capitaIncome-er capitaIncome
-0.0371% -0.0428% | Change
mx
0

Equations for Matrix
Correlation:
Corr[i, I] = PXy =xy
Covariance:
Cov[, = rxv E [ )n
j=1
Data for the Portfolios for Diversity
Descriptive Statistics
Variable Mean Std Dev Min Max
Boho Index 1.15 0.28 0.7 1.93
Gay Index 1.32 0.87 0.19 5.39
Melting Pot 0.08 0.07 0.01 0.39
Correlation/ Return Matrix
Boho Index Gay index Melting Pot Talent
Boho index 1 55.30%
Gay Index 0.6 1 71.80%
Melting Pot 0.505 0.492 1 20.60%
Covariance Matrix
Boho Index Gay Index Melting Pot
BohoIndex 1
Gay index 0.14616 1
Melting Pot 0.009898 0.0299628 1
Efficient Portfolios for Diversity
Talent Gain Std Dev. Boho Index Gay Index Melting Pot
10% 0.3737% -26.9905% -2.4108% 129.4014%
20% 0.2078% 3.2814% -3.3958% 100.1144%
30%
40%
50%
60%
70%
80%
90%
100%
150%
200%
0.5643%
1.4432%
2.8445%
4.7683%
7.2146%
10.1832%
13.6743%
17.6878%
45.5920%
86.5571%
33.5531%
63.8249%
94.0966%
124.3685%
154.6403%
184.9120%
215.1838%
245.4556%
396.8145%
548.1734%
-4.3807%
-5.3657%
-6.3507%
-7.3357%
-8.3206%
-9.3056%
-10.2906%
-11.2756%
-16.2004%
-21.1253%
70.8278%
41.5408%
12.2541%
-17.0328%
-46.3196%
-75.6064%
-104.8932%
-134.1800%
-280.6141%
-427.0481%
Exhibit 3

Exhibit 4
Figure 22: The weight configuration of the efficient urban portfolios for creativeenvironment
Figure 23: The weight configuration of the portfolio of diversity
The Weight Corposition of Each Efficient Portfolio
-10% -20% -30% 40% -50% -60% -70% -80% -- 90% -- 100%
The Weight Composition of Each Portfolio
-10% -20% -30% -- 40% -50% -60%-70% -80% -90% -100% -150% -200%

Exhibit 5
1 2 3 4 5 6 7 8 9 10 11 12 13 14
Talent Index Rank of City
-- Diversity --- High-Tech
Figure 24: The Plot of the table B, showing the relative amount of each attribute foreach city up to talent index rank 14
1 2 3 4 5 6 7 8 9 10 11 12 13 14
Talent Index Rank of City
+ Bohemian Index --- Gay Index -A-- Melting Pot IndexA
Figure 25: The Plot of the table C, showing the relative amount of each attribute foreach city up to talent index rank 14
Existing Stock Conparison
Existing Stock Comparison

Exhibit 6
Correlation/ Return MatrixHigh
VariableTalentDiversityHigh TechCultural AmenityRecreational AmenityClimateCoolnessMedian Housing ValuePer Capita IncomePer Capital IncomeChange
Covariance Matrix
VariableTalentDiversityHigh TechCultural AmenityRecreational AmenityClimateCoolnessMedian Housing ValuePer Capita IncomePer Capital IncomeChange
Talent100.00%
71.81%72.30%43.00%-4.80%22.00%46.90%53.80%58.80%
29.20%
Talent
0.031237350.06796231.36807
-1.7470561.28469
0.03540950.82314
95.962188
Diversity Tech
0.7680.2890.1570.4470.3770.4460.498
0.199
HighDiversity Tech
1.256141366.831399.4293245.418460.49526511.873411414.169
1352.241217.5958101.87831.21784529.109173687.951
Cultural Recreational MedianHousing
Amenity Amenity Climate Coolness Value
0.4930.1590.4640.4290.5060.601
0.321
Cultural
Amenity
264450.425434930.826211253.54102619866.930662481074.888
0.2490.2050.5690.4450.521
0.182
0.2910.2460.3980.096
-0.187
Recreational
Amenity
24739.68877270.40059248865.435672
228097.029
0.1460.4320.217
-0.119
10.3550.417
Per Capita Per CapitaIncome
Income Change
10.38
0.237 -0.126
Median
Climate Coolness Housing Value
25.747521543.87
82721.4616.40313
2055.2555
0.517
PerPer Capita Capita
IncomeIncome Change
137954.02456
260991.0671 -133795.685 -13660.2 351.74684 -3789.630684 1658625.24314.350194 170.1677 593.1545
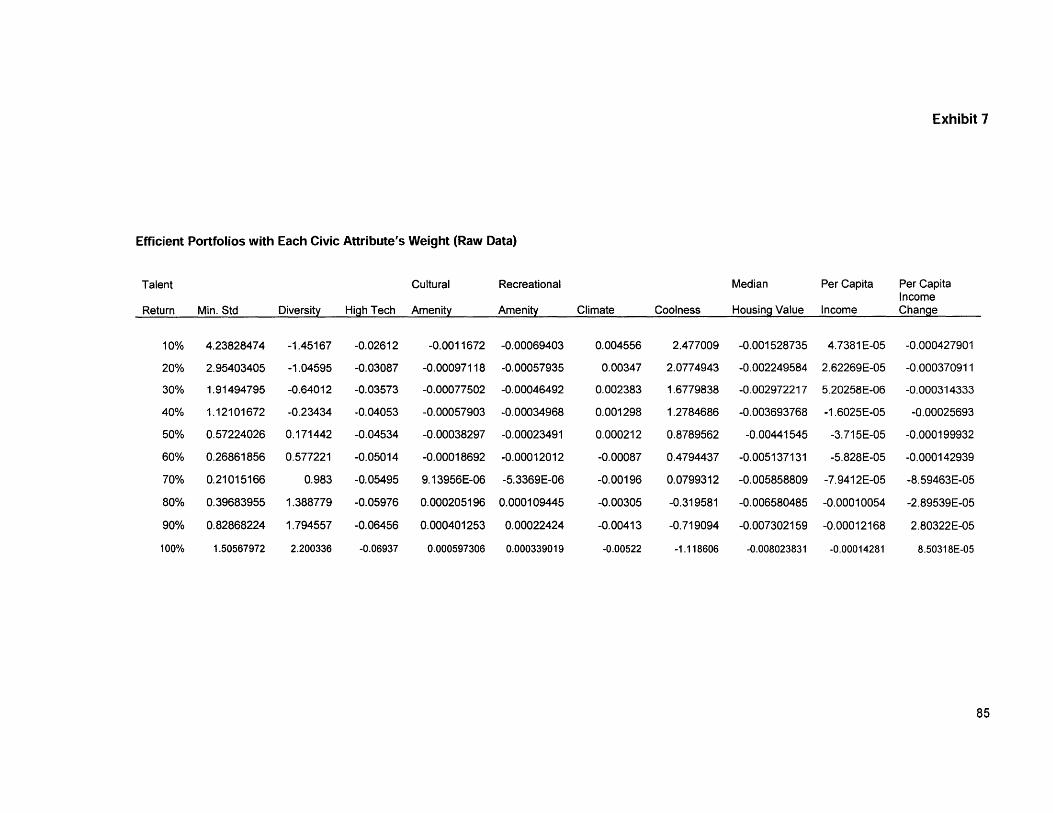
Exhibit 7
Efficient Portfolios with Each Civic Attribute's Weight (Raw Data)
Talent
Return Min. Std
Cultural
Diversity High Tech Amenity
Recreational
Amenity Climate
Median
Coolness Housing Value
Per Capita Per CapitaIncome
Income Change
-1.45167
-1.04595
-0.64012
-0.23434
0.171442
0.577221
0.983
1.388779
1.794557
-0.02612
-0.03087
-0.03573
-0.04053
-0.04534
-0.05014
-0.05495
-0.05976
-0.06456
-0.0011672
-0.00097118
-0.00077502
-0.00057903
-0.00038297
-0.00018692
9.13956E-06
0.000205196
0.000401253
-0.00069403
-0.00057935
-0.00046492
-0.00034968
-0.00023491
-0.00012012
-5.3369E-06
0.000109445
0.00022424
2.200336 -0.06937 0.000597306 0.000339019
0.004556
0.00347
0.002383
0.001298
0.000212
-0.00087
-0.00196
-0.00305
-0.00413
-0.00522
2.477009
2.0774943
1.6779838
1.2784686
0.8789562
0.4794437
0.0799312
-0.319581
-0.719094
-0.001528735
-0.002249584
-0.002972217
-0.003693768
-0.00441545
-0.005137131
-0.005858809
-0.006580485
-0.007302159
4.7381 E-05
2.62269E-05
5.20258E-06
-1.6025E-05
-3.715E-05
-5.828E-05
-7.9412E-05
-0.00010054
-0.00012168
-0.000427901
-0.000370911
-0.000314333
-0.00025693
-0.000199932
-0.000142939
-8.59463E-05
-2.89539E-05
2.80322E-05
-1.118606 -0.008023831 -0.00014281 8.50318E-05
10%
20%
30%
40%
50%
60%
70%
80%
90%
100%
4.23828474
2.95403405
1.91494795
1.12101672
0.57224026
0.26861856
0.21015166
0.39683955
0.82868224
1.50567972

Cultural
Diversity High Tech Amenity-1.451674931 -0.026118413 -0.001167201
0.75691.2561408
366.8313414
99.429324645.41846310.4952649
11.873412
1414.169305
3.5344
1352.241023
217.5958248101.8782528
1.2178452
29.109168
3687.950918
2128622.64
264450.425434930.826211253.541026
19866.93066
2481074.888
Recreational
Amenity-0.000694028
529896.643624739.68877270.4005924
8865.435672
228097.029
-0.000427901 170.1677457 593.1544572 260991.0671 -133795.685
Median
Climate Coolness Housing Value0.004555852 2.477008976 -0.001528735
13639.904125.7475234
1543.870368
82721.46239
2.2801
16.40313
2055.255473
936.36
37954.02456
-13660.21505 351.7468443 -3789.630684 1658625.243 966072.7521
Diversity1.5950608630.047627138
0.621557879
0.100175396-0.300380312-1.780879388
0.02634979
-0.097269186
High Tech0.0476271380.002411067
0.04122367
0.003944342-0.01212266
-0.078789157
0.001162275
-0.004563903
Cultural
Amenity0.621557879
0.04122367
2.899947982
0.214223561-0.185748055-3.624197846
0.035449392
-0.137211381
Recreational
Amenity0.1001753960.003944342
0.214223561
0.255238138-0.078224192-0.464849554
0.009406099
-0.007500692
Climate-0.300380312-0.01212266
-0.185748055
-0.0782241920.2831070090.290557904
-0.010752581
0.017856336
Coolness-1.780879388-0.078789157
-3.624197846
-0.4648495540.29055790413.98972107
-0.062113579
0.241211434
MedianMedian
Housing Value0.02634979
0.001162275
0.035449392
0.009406099-0.010752581-0.062113579
0.002188302
-0.002749126
Per Capita Per CapitaPer Capita
Income-0.097269186-0.004563903
-0.137211381
-0.0075006920.0178563360.241211434
-0.002749126
0.023917436
Per CapitaIncomeChange
0.105703750.006629158
0.130351244
-0.0397340730.026629987
-0.372822027
-0.002478979
-0.033627652
0.10570375 0.006629158 0.130351244 -0.039734073 0.026629987 -0.372822027
Weight-1.451674931-0.026118413
-0.001167201
-0.0006940280.0045558522.477008976
-0.001528735
4.7381 E-05
DiversityHigh TechCulturalAmenityRecreationalAmenityClimateCoolnessMedianHousing ValuePer CapitaIncomePer CapitalIncomeChange
Exhibit 8
jj~jI 1 , JJ111g 1 11 11h 1111 M n ~i g 1 g t p , . ' 1 1 ,15
Per Capita
Income4.7381 E-05
Per CapitaIncomeChange-0.000427901
10653826.56
DiversityHigh TechCulturalAmenityRecreationalAmenityClimateCoolnessMedianHousing ValuePer CapitaIncomePer CapitalIncomeChange -0.002478979 -0.033627652 0.176887596

Exhibit 9
INIO~i I,
Cultural
Diversity-1.045947356
0.75691.2561408
366.8313414
99.429324645.41846310.4952649
11.873412
1414.169305
Recreational
High Tech Amenity Amenity Climate Coolness
-0.030871987 -0.000971178 -0.000579353 0.003469855 2.077494287
3.5344
1352.241023
217.5958248101.8782528
1.2178452
29.109168
3687.950918
2128622.64
264450.425434930.826211253.541026
19866.93066
2481074.888
529896.643624739.68877270.4005924
8865.435672
228097.029
-0.000370911 170.1677457 593.1544572 260991.0671 -133795.685
13639.904125.7475234
1543.870368
82721.46239
2.2801
16.40313
2055.255473
Median
Housing Value-0.002249584
936.36
37954.02456
Per Capita
Income2.62269E-05
Per CapitaIncomeChange-0.000370911
10653826.56
-13660.21505 351.7468443 -3789.630684 1658625.243 966072.7521
High Tech0.0405613810.003368565
0.040543154
0.003891872-0.010913334-0.078108179
0.002021607
-0.002986043
Cultural
Amenity0.3726276660.040543154
2.007688579
0.148794392-0.117711548-2.529165367
0.043404211
-0.063195335
Recreational
Amenity0.0602514880.003891872
0.148794392
0.177859917-0.049733505-0.32545499
0.011554357
-0.003465847
Climate-0.164836596-0.010913334
-0.117711548
-0.0497335050.164223033
0.18560372
-0.012051038
0.007527936
Coolness-1.076185695-0.078108179
-2.529165367
-0.325454990.18560372
9.840871731
-0.07666
0.111982966
MedianMedian
Housing Value0.0279375050.002021607
0.043404211
0.011554357-0.012051038
-0.07666
0.004738571
-0.00223927
Per Capita Per CapitaPer Capita
Income-0.038793373-0.002986043
-0.063195335
-0.0034658470.0075279360.111982966
-0.00223927
0.007328216
Per CapitaincomeChange
0.0660171010.006792064
0.094014287
-0.0287511320.017580786
-0.271043768
-0.003162048
-0.016134814
0.006792064 0.094014287 -0.028751132 0.017580786 -0.271043768 -0.003162048 -0.016134814 0.132907225
Weight-1.045947356-0.030871987
-0.000971178
-0.0005793530.0034698552.077494287
-0.002249584
2.62269E-05
DiversityHigh TechCulturalAmenityRecreationalAmenityClimateCoolnessMedianHousing ValuePer CapitaIncomePer CapitalIncomeChange
DiversityHigh TechCulturalAmenityRecreationalAmenityClimateCoolnessMedianHousing ValuePer CapitaIncomePer CapitalIncomeChange
Diversity0.8280530450.040561381
0.372627666
0.060251488-0.164836596-1.076185695
0.027937505
-0.038793373
0.066017101

Exhibit 10
Cultural Recreational Median Per Capita Per CapitaIncome
Diversity High Tech Amenity Amenity Climate Coolness Housing Value Income Change
Weight -0.640116891 -0.035729047 -0.000775021 -0.000464923 0.002383408 1.677983821 -0.002972217 5.20258E-06 -0.000314333
Diversity -0.640116891 0.7569High Tech -0.035729047 1.2561408 3.5344CulturalAmenity -0.000775021 366.8313414 1352.241023 2128622.64RecreationalAmenity -0.000464923 99.4293246 217.5958248 264450.4254 529896.6436
Climate 0.002383408 45.4184631 101.8782528 34930.82621 24739.68877 13639.9041
Coolness 1.677983821 0.4952649 1.2178452 1253.541 026 270.4005924 25.7475234 2.2801MedianHousing Value -0.002972217 11.873412 29.109168 19866.93066 8865.435672 1543.870368 16.40313 936.36Per CapitaIncome 5.20258E-06 1414.169305 3687.950918 2481074.888 228097.029 82721.46239 2055.255473 37954.02456 10653826.56Per CapitalIncomeChange -0.000314333 170.1677457 593.1544572 260991.0671 -133795.685 -13660.21505 351.7468443 -3789.630684 1658625.243 966072.7521
Cultural Recreational Median Per Capita Per CapitaIncome
Diversity High Tech Amenity Amenity Climate Coolness Housing Value Income Change
Diversity 0.310139498 0.028728903 0.181986456 0.029590653 -0.069293112 -0.531966895 0.022589952 -0.004709547 0.034239449
High Tech 0.028728903 0.004511891 0.037444573 0.003614538 -0.008675635 -0.073013184 0.003091233 -0.000685528 0.006661614
CulturalAmenity 0.181986456 0.037444573 1.278572526 0.09528804 -0.064523891 -1.630195413 0.045764066 -0.010003953 0.063581274RecreationalAmenity 0.029590653 0.003614538 0.09528804 0.114538825 -0.02741406 -0.210948376 0.012250712 -0.00055172 -0.019552987
Climate -0.069293112 -0.008675635 -0.064523891 -0.02741406 0.077483282 0.102972576 -0.010936785 0.001025734 0.010234017
Coolness -0.531966895 -0.073013184 -1.630195413 -0.210948376 0.102972576 6.419917287 -0.081807849 0.017942047 -0.185527467MedianHousing Value 0.022589952 0.003091233 0.045764066 0.012250712 -0.010936785 -0.081807849 0.008271872 -0.00058689 -0.003540524Per CapitaIncome -0.004709547 -0.000685528 -0.010003953 -0.00055172 0.001025734 0.017942047 -0.00058689 0.000288365 -0.00271242Per CapitalIncomeChange 0.034239449 0.006661614 0.063581274 -0.019552987 0.010234017 -0.185527467 -0.003540524 -0.00271242 0.095453158

Cultural
Diversity-0.234336925
0.75691.2561408
366.8313414
99.429324645.4184631
0.4952649
11.873412
1414.169305
Recreational
High Tech Amenity Amenity Climate Coolness
-0.040533967 -0.000579032 -0.000349684 0.001297686 1.278468646
3.5344
1352.241023
217.5958248101.8782528
1.2178452
29.109168
3687.950918
2128622.64
264450.425434930.826211253.541026
19866.93066
2481074.888
529896.643624739.68877270.4005924
8865.435672
228097.029
13639.904125.7475234
1543.870368
82721.46239
-0.00025693 170.1677457 593.1544572 260991.0671 -133795.685 -13660.21505
2.2801
16.40313
2055.255473
Median Per Capita
Housing Value Income-0.003693768 -1.60245E-05
936.36
37954.02456 10653826.56
351.7468443 -3789.630684 1658625.243 966072.7521
Diversity0.0415642510.011931586
0.04977479
0.008147634-0.013811557-0.148377606
0.010277463
0.005310399
High Tech0.0119315860.005807028
0.031737703
0.003084224-0.005358831-0.063110451
0.004358314
0.002395462
Cultural
Amenity0.04977479
0.031737703
0.713679516
0.053545485-0.026247057-0.927963536
0.042491563
0.023021159
Recreational
Amenity0.0081476340.003084224
0.053545485
0.064795342-0.011226387-0.120885449
0.011451069
0.001278147
Climate-0.013811557-0.005358831
-0.026247057
-0.0112263870.0229694330.042716438
-0.007400311
-0.001720175
Coolness-0.148377606-0.063110451
-0.927963536
-0.1208854490.0427164383.726782591
-0.077461599
-0.042105704
Median Per CapitaMedian
Housing Value0.0102774630.004358314
0.042491563
0.011451069-0.007400311-0.077461599
0.012775625
0.002246532
Per Capita
Income0.0053103990.002395462
0.023021159
0.001278147-0.001720175-0.042105704
0.002246532
0.002735745
Per CapitaPer CapitaIncomeChange
0.010245510.006177354
0.038827865
-0.0120208180.00455452
-0.115540937
-0.003596517
0.006828871
0.00455452 -0.115540937 -0.003596517 0.006828871 0.063773613
Weight-0.234336925-0.040533967
-0.000579032
-0.0003496840.0012976861.278468646
-0.003693768
-1.60245E-05
DiversityHigh TechCulturalAmenityRecreationalAmenityClimateCoolnessMedianHousing ValuePer CapitaIncomePer CapitalIncomeChange
Exhibit 11
e ~ .
Per CapitaIncomeChange
-0.00025693
DiversityHigh TechCulturalAmenityRecreationalAmenityClimateCoolnessMedianHousing ValuePer CapitaIncomePer CapitalIncomeChange 0.01024551 0.006177354 0.038827865 -0.012020818

Exhibit 12
S. . . . . . - -
Diversity High Tech0.171442071 -0.045339451
0.75691.2561408 3.5344
366.8313414 1352.241023
99.4293246 217.595824845.4184631 101.87825280.4952649 1.2178452
11.873412 29.109168
1414.169305 3687.950918
-0.000199932 170.1677457 593.1544572
Cultural Recreational Median Per Capita Per CapitaIncome
Amenity Amenity Climate Coolness Housing Value Income Change
-0.000382971 -0.000234908 0.000211628 0.878956161 -0.00441545 -3.71496E-05 -0.000199932
2128622.64
264450.425434930.826211253.541026
19866.93066
2481074.888
529896.643624739.68877 13639.9041270.4005924 25.7475234 2.2801
8865.435672 1543.870368 16.40313 936.36
228097.029 82721.46239 2055.255473 37954.02456 10653826.56
260991.0671 -133795.685 -13660.21505 351.7468443 -3789.630684 1658625.243 966072.7521
Diversity High Tech0.022247095 -0.009764095
-0.009764095 0.007265545
-0.024085143 0.023479874
-0.004004324 0.0023175240.001647873 -0.000977533
0.0746315 -0.048532824
-0.0089881 0.005827483
-0.009006851 0.006211773
Cultural
Amenity-0.0240851430.023479874
0.312197532
0.023790688-0.002831053-0.421959881
0.033594729
0.03529876
Recreational
Amenity Climate Coolness-0.004004324 0.001647873 0.07463150.002317524 -0.000977533 -0.048532824
0.023790688 -0.002831053 -0.421959881
0.029240571 -0.001229887 -0.055830587-0.001229887 0.000610884 0.004789349-0.055830587 0.004789349 1.761523024
0.009195438 -0.001442645 -0.063660334
0.001990541 -0.000650349 -0.067109996
Median Per CapitaMedian Per Capita
Housing Value Income-0.0089881 -0.009006851
0.005827483 0.006211773
0.033594729 0.03529876
0.009195438 0.001990541-0.001442645 -0.000650349-0.063660334 -0.067109996
0.018255461 0.006225683
0.006225683 0.014703272
0.00057798 -0.061812848 -0.00334544 0.012319236 0.038616463
Weight0.171442071
-0.045339451
-0.000382971
-0.0002349080.0002116280.878956161
-0.00441545
-3.71496E-05
DiversityHigh TechCulturalAmenityRecreationalAmenityClimateCoolnessMedianHousing ValuePer CapitaIncomePer CapitalIncomeChange
DiversityHigh TechCulturalAmenityRecreationalAmenityClimateCoolnessMedianHousing ValuePer CapitaIncomePer CapitalIncomeChange
Per CapitaIncomeChange-0.0058327850.005376819
0.019983537
-0.0062837770.00057798
-0.061812848
-0.00334544
0.012319236
-0.005832785 0.005376819 0.019983537 -0.006283777

Cultural
High Tech Amenity-0.050144744 -0.000186916
3.5344
1352.241023
217.5958248101.8782528
1.2178452
29.109168
3687.950918
2128622.64
264450.425434930.826211253.541026
19866.93066
2481074.888
Recreational Median
Amenity Climate Coolness Housing Value-0.000120121 -0.000874432 0.479443661 -0.005137131
529896.643624739.68877270.4005924
8865.435672
228097.029
13639.904125.7475234
1543.870368
82721.46239
2.2801
16.40313
2055.255473
936.36
37954.02456
-0.000142939 170.1677457 593.1544572 260991.0671 -133795.685 -13660.21505 351.7468443 -3789.630684 1658625.243 966072.7521
Diversity0.252186947
-0.036358486
-0.039578187
-0.006894046-0.0229245440.137062037
-0.035207743
-0.047573545
High Tech-0.0363584860.008887232
0.012674386
0.0013106710.004467177
-0.029278922
0.007498525
0.010777862
Cultural
Amenity-0.0395781870.012674386
0.074369269
0.0059375780.005709295-0.112337188
0.019076504
0.027027716
Recreational
Amenity-0.0068940460.001310671
0.005937578
0.0076458610.002598592
-0.015572661
0.005470642
0.001596832
Climate-0.0229245440.004467177
0.005709295
0.0025985920.010429506
-0.010794419
0.006935179
0.004215669
Coolness0.137062037
-0.029278922
-0.112337188
-0.015572661-0.0107944190.524117978
-0.04040033
-0.057428233
Median
Housing Value-0.0352077430.007498525
0.019076504
0.0054706420.006935179-0.04040033
0.024710644
0.011363196
Per Capita
Income-0.0475735450.010777862
0.027027716
0.0015968320.004215669-0.057428233
0.011363196
0.036186763
Per CapitaIncomeChange-0.0140401120.004251522
0.006973075
-0.002297264-0.001707399-0.024105661
-0.002782715
0.013817249
-0.014040112 0.004251522 0.006973075 -0.002297264 -0.001707399 -0.024105661 -0.002782715 0.013817249 0.019738419
Weight0.577220903-0.050144744
-0.000186916
-0.000120121-0.0008744320.479443661
-0.005137131
-5.82803E-05
DiversityHigh TechCulturalAmenityRecreationalAmenityClimateCoolnessMedianHousing ValuePer CapitaIncomePer CapitalIncomeChange
Diversity0.577220903
0.75691.2561408
366.8313414
99.429324645.41846310.4952649
11.873412
1414.169305
Exhibit 13
C a ON
Per Capita
Income-5.82803E-05
Per CapitaIncomeChange-0.000142939
10653826.56
DiversityHigh TechCulturalAmenityRecreationalAmenityClimateCoolnessMedianHousing ValuePer CapitaIncomePer CapitalIncomeChange

Cultural
High Tech Amenity-0.054950026 9.13956E-06
3.5344
1352.241023
217.5958248101.8782528
1.2178452
29.109168
3687.950918
2128622.64
264450.425434930.826211253.541026
19866.93066
2481074.888
Recreational Median
Amenity Climate Coolness Housing Value-5.33694E-06 -0.001960491 0.079931164 -0.005858809
529896.643624739.68877270.4005924
8865.435672
228097.029
13639.904125.7475234
1543.870368
82721.46239
2.2801
16.40313
2055.255473
936.36
37954.02456
-8.59463E-05 170.1677457 593.1544572 260991.0671 -133795.685 -13660.21505 351.7468443 -3789.630684 1658625.243 966072.7521
Diversity0.731383725
-0.067851526
0.00329568
-0.000521627-0.08752874
0.038914108
-0.068381442
-0.110393248
High Tech-0.067851526
0.01067214
-0.000679121
6.38132E-050.010975245
-0.005349043
0.009371455
0.016093138
Cultural
Amenity0.00329568
-0.000679121
0.000177807
-1.28992E-05-0.0006258910.000915756
-0.001063813
-0.001800747
Recreational
Amenity-0.000521627
6.38132E-05
-1.28992E-05
1.5093E-050.000258852-0.00011535
0.000277205
9.66717E-05
Climate-0.087528740.010975245
-0.000625891
0.0002588520.052425311-0.004034748
0.017733114
0.012878662
Coolness0.038914108
-0.005349043
0.000915756
-0.00011535-0.0040347480.014567538
-0.007681609
-0.013045768
Median
Housing Value-0.0683814420.009371455
-0.001063813
0.0002772050.017733114
-0.007681609
0.032141157
0.017658543
Per Capita
Income-0.1103932480.016093138
-0.001800747
9.66717E-050.012878662-0.013045768
0.017658543
0.067186349
Per CapitaIncomeChange-0.014376647
0.00280132
-0.000205011
-6.13707E-05-0.002301703-0.002416425
-0.001908241
0.011320431
-0.014376647 0.00280132 -0.000205011 -6.13707E-05 -0.002301703 -0.002416425 -0.001908241 0.011320431 0.007136147
Exhibit 14
Weight0.982999719-0.054950026
9.13956E-06
-5.33694E-06-0.0019604910.079931164
-0.005858809
-7.94123E-05
DiversityHigh TechCulturalAmenityRecreationalAmenityClimateCoolnessMedianHousing ValuePer CapitaIncomePer CapitalIncomeChange
Diversity0.982999719
0.75691.2561408
366.8313414
99.429324645.41846310.4952649
11.873412
1414.169305
Per Capita
Income-7.94123E-05
Per CapitaIncomeChange-8.59463E-05
10653826.56
DiversityHigh TechCulturalAmenityRecreationalAmenityClimateCoolnessMedianHousing ValuePer CapitaIncomePer CapitalIncomeChange
CoaacZMtV orTln Gi 0

Exhibit 15
Cultural Recreational Median Per Capita Per CapitaIncome
Diversity High Tech Amenity Amenity Climate Coolness Housing Value Income Change
1.388778568 -0.059755347 0.000205196 0.000109445 -0.003046551 -0.319581327 -0.006580485 -0.000100545 -2.89539E-05
529896.643624739.68877 13639.9041270.4005924 25.7475234
8865.435672 1543.870368
228097.029 82721.46239
2.2801
16.40313 936.36
2055.255473 37954.02456 10653826.56
351.7468443 -3789.630684 1658625.243 966072.7521-2.89539E-05 170.1677457 593.1544572 260991.0671 -133795.685 -13660.21505
Recreational
Amenity Climate0.01511278 -0.19216484
-0.001423063 0.018546704
0.005938941 -0.021836612
0.006347239 -0.008248967-0.008248967 0.126598422-0.009457708 0.025068327
-0.00638491 0.030951179
-0.002510012 0.025338799
Coolness-0.2198122810.023256816
-0.082203038
-0.0094577080.0250683270.232871686
0.034495782
0.066039922
Median Per Capita Per CapitaIncome
Housing Value Income Change-0.108509164 -0.197466648 -0.0068425430.011446282 0.022157525 0.001026247
-0.02682604 -0.051187879 -0.001550604
-0.00638491 -0.002510012 0.0004239810.030951179 0.025338799 -0.0012049620.034495782 0.066039922 0.003254759
0.040546988 0.025111638 -0.000722041
0.025111638 0.107702133 0.004828529
-0.006842543 0.001026247 -0.001550604 0.000423981 -0.001204962 0.003254759 -0.000722041 0.004828529 0.000809887
3.5344
Weight1.388778568
-0.059755347
0.000205196
0.000109445-0.003046551-0.319581327
-0.006580485
-0.000100545
DiversityHigh TechCulturalAmenityRecreationalAmenityClimateCoolnessMedianHousing ValuePer CapitaIncomePer CapitalIncomeChange
0.75691.2561408
366.8313414
99.429324645.41846310.4952649
11.873412
1414.169305
1352.241023
217.5958248101.8782528
1.2178452
29.109168
3687.950918
2128622.64
264450.425434930.826211253.541026
19866.93066
2481074.888
Diversity1.459837504
-0.104243287
0.104536356
0.01511278-0.19216484
-0.219812281
-0.108509164
-0.197466648
DiversityHigh TechCulturalAmenityRecreationalAmenityClimateCoolnessMedianHousing ValuePer CapitaIncomePer CapitalIncomeChange
High Tech-0.1042432870.012620287
-0.016580545
-0.0014230630.0185467040.023256816
0.011446282
0.022157525
Cultural
Amenity0.104536356-0.016580545
0.089626103
0.005938941-0.021836612-0.082203038
-0.02682604
-0.051187879
VI 1 11 , I ii 1 1 111 11 Af 1 1-- W-A =
.''I Jill

Exhibit 16
Cultural
Weight1.794557389
-0.064560634
Recreational
Diversity High Tech Amenity Amenity Climate Coolness1.794557389 -0.064560634 0.000401253 0.00022424 -0.004132626 -0.719093819
0.75691.2561408
Median Per Capita Per CapitaIncome
Housing Value Income Change-0.007302159 -0.000121676 2.80322E-05
3.5344
0.000401253 366.8313414 1352.241023 2128622.64
0.00022424-0.004132626-0.719093819
-0.007302159
99.429324645.4184631
0.4952649
217.5958248101.8782528
1.2178452
264450.425434930.826211253.541026
529896.643624739.68877270.4005924
13639.904125.7475234
11.873412 29.109168 19866.93066 8865.435672 1543.870368
2.2801
16.40313 936.36
-0.000121676 1414.169305 3687.950918 2481074.888 228097.029 82721.46239 2055.255473 37954.02456 10653826.56
2.80322E-05 170.1677457 593.1544572 260991.0671 -133795.685 -13660.21505 351.7468443 -3789.630684 1658625.243 966072.7521
Cultural
Amenity0.264144718-0.035029992
Recreational
Amenity0.040011475-0.003150149
Median
Climate-0.3368339660.027181622
Coolness-0.6391171290.056538649
Housing Value-0.1555909030.013722994
Per Capita Per Capita
Income-0.3087913640.028970721
IncomeChange
0.008560352-0.001073477
0.264144718 -0.035029992 0.342716463 0.023794421 -0.057923273 -0.36169479 -0.058210353 -0.121133539 0.002935627
0.023794421-0.057923273
-0.36169479
0.026645054-0.022926251-0.04360195
-0.155590903 0.013722994 -0.058210353 -0.014516573
-0.0229262510.2329504230.076515093
-0.043601950.0765150931.179030408
-0.0145165730.04658952
0.086131814
-0.0062235580.0415959150.179828183
-0.0008410310.001582489
-0.007090433
0.04658952 0.086131814 0.04992815 0.033722172 0.00077572
-0.308791364 0.028970721 -0.121133539 -0.006223558 0.041595915 0.179828183 0.033722172 0.157731487 -0.005657332
0.008560352 -0.001073477 0.002935627 -0.000841031 0.001582489 -0.007090433 0.00077572 -0.005657332 0.000759143
DiversityHigh TechCulturalAmenityRecreationalAmenityClimateCoolnessMedianHousing ValuePer CapitaIncomePer CapitalIncomeChange
Diversity2.437548178
-0.145533662
High Tech-0.1455336620.014731646
DiversityHigh TechCulturalAmenityRecreationalAmenityClimateCoolnessMedianHousing ValuePer CapitaIncomePer CapitalIncomeChange
0.040011475-0.336833966-0.639117129
-0.0031501490.0271816220.056538649
CoaineMtafo aetGi 0

Exhibit 17
Cultural Recreational Median Per Capita Per CapitaIncome
Diversity High Tech Amenity Amenity Climate Coolness Housing Value Income ChangeWeight 2.200336202 -0.069365924 0.000597306 0.000339019 -0.00521869 -1.118606304 -0.008023831 -0.000142809 8.50318E-05
Diversity 2.200336202 0.7569High Tech -0.069365924 1.2561408 3.5344CulturalAmenity 0.000597306 366.8313414 1352.241023 2128622.64RecreationalAmenity 0.000339019 99.4293246 217.5958248 264450.4254 529896.6436Climate -0.00521869 45.4184631 101.8782528 34930.82621 24739.68877 13639.9041Coolness -1.118606304 0.4952649 1.2178452 1253.541026 270.4005924 25.7475234 2.2801MedianHousing Value -0.008023831 11.873412 29.109168 19866.93066 8865.435672 1543.870368 16.40313 936.36Per CapitaIncome -0.000142809 1414.169305 3687.950918 2481074.888 228097.029 82721.46239 2055.255473 37954.02456 10653826.56Per CapitalIncomeChange 8.50318E-05 170.1677457 593.1544572 260991.0671 -133795.685 -13660.21505 351.7468443 -3789.630684 1658625.243 966072.7521
Cultural Recreational Median Per Capita Per CapitaIncome
Diversity High Tech Amenity Amenity Climate Coolness Housing Value Income ChangeDiversity 3.664515759 -0.191722702 0.482116573 0.074169956 -0.521534468 -1.219000424 -0.209626596 -0.44437068 0.031838133High Tech -0.191722702 0.01700623 -0.056026935 -0.005117068 0.036879855 0.094496457 0.016201595 0.036533077 -0.003498608CulturalAmenity 0.482116573 -0.056026935 0.759437159 0.053550724 -0.10888473 -0.837553191 -0.09521583 -0.211636905 0.013255726RecreationalAmenity 0.074169956 -0.005117068 0.053550724 0.060903205 -0.043770374 -0.102543796 -0.024116061 -0.011043305 -0.003856985Climate -0.521534468 0.036879855 -0.10888473 -0.043770374 0.371479106 0.150305288 0.064647862 0.061650228 0.006061783Coolness -1.219000424 0.094496457 -0.837553191 -0.102543796 0.150305288 2.853043672 0.147226433 0.328320515 -0.033457137MedianHousing Value -0.209626596 0.016201595 -0.09521583 -0.024116061 0.064647862 0.147226433 0.060284609 0.043490518 0.002585592Per CapitaIncome -0.44437068 0.036533077 -0.211636905 -0.011043305 0.061650228 0.328320515 0.043490518 0.217277878 -0.020141162Per CapitalIncomeChange 0.031838133 -0.003498608 0.013255726 -0.003856985 0.006061783 -0.033457137 0.002585592 -0.020141162 0.006985097

Exhibit 18Covariance Matrix for Micro Scale Portfolio
Talent Gain 10% Talent Gain 40%Boho Index Gay Index Melting Pot Boho Index Gay Index Melting Pot
Weight -0.269904733 -0.024107956 1.294013689 Weight 0.638249219 -0.053657179 0.415407961Boho Index -0.269904733 0.0784 Boho Index 0.638249219 0.0784Gay Index -0.024107956 0.14616 0.7569 Gay Index -0.053657179 0.14616 0.7569
Melting Pot 1.294013689 0.009898 0.0299628 0.0049 Melting Pot 0.415407961 0.009898 0.0299628 0.0049
Boho Index Gay Index Melting Pot Boho Index Gay Index Melting PotBoho Index 0.005711327 0.000951041 -0.00345698 Boho Index 0.031937186 -0.005005491 0.002624294Gay Index 0.000951041 0.000439905 -0.00093472 Gay Index -0.005005491 0.002179185 -0.000667859Melting Pot -0.00345698 -0.00093472 0.00820491 Melting Pot 0.002624294 -0.000667859 0.000845562
Talent Gain 20% Talent Gain 50%Boho Index Gay Index Melting Pot Boho Index Gay Index Melting Pot
Weight 0.032813625 -0.033957687 1.001144063 Weight 0.940966458 -0.06350694 0.122541481Boho Index 0.032813625 0.0784 Boho Index 0.940966458 0.0784Gay index -0.033957687 0.14616 0.7569 Gay Index -0.06350694 0.14616 0.7569
Melting Pot 1.001144063 0.009898 0.0299628 0.0049 Melting Pot 0.122541481 0.009898 0.0299628 0.0049
Boho Index Gay Index Melting Pot Boho Index Gay Index Melting PotBoho Index 8.44159E-05 -0.000162862 0.000325161 Boho Index 0.069416761 -0.008734215 0.001141313Gay Index -0.000162862 0.0008728 -0.001018631 Gay Index -0.008734215 0.003052677 -0.000233178Melting Pot 0.000325161 -0.001018631 0.004911218 Melting Pot 0.001141313 -0.000233178 7.35804E-05
Talent Gain 30% Talent Gain 60%
Weight0.335530862
-0.0438074480.708277586
Boho IndexGay IndexMelting Pot
Boho Index0.335530862
0.07840.14616
0.009898
Boho Index0.008826347
-0.0021483690.00235225
Gay Index Melting Pot-0.043807448 0.708277586
0.75690.0299628
Gay Index-0.0021483690.001452561
-0.000929681
0.0049
Boho IndexGay Index
Melting Pot
Melting Pot0.00235225
-0.0009296810.00245812
Weight1.243684819
-0.073356671-0.170328149
Boho IndexGay IndexMelting Pot
Boho Index1.243684819
0.07840.14616
0.009898
Boho Index0.121265351
-0.013334554-0.002096738
Gay Index Melting Pot-0.073356671 -0.170328149
0.75690.0299628
Gay Index-0.0133345540.0040730310.000374376
0.0049
Melting Pot-0.0020967380.0003743760.000142157
Boho IndexGay Index
Melting Pot

Exhibit 19
Talent Gain 70% Talent Gain 100%Boho Index Gay Index Melting Pot Boho Index Gay index Melting Pot
Weight 1.546402612 -0.083206416 -0.463196195 Weight 2.454555994 -0.112755654 -1.34180034Boho Index 1.546402612 0.0784 Boho Index 2.454555994 0.0784Gay Index -0.083206416 0.14616 0.7569 Gay Index -0.112755654 0.14616 0.7569
Melting Pot -0.463196195 0.009898 0.0299628 0.0049 Melting Pot -1.34180034 0.009898 0.0299628 0.0049
Boho Index Gay Index Melting Pot Boho Index Gay Index Melting PotBoho Index 0.187482705 -0.018806498 -0.007089817 Boho Index 0.472347858 -0.040451982 -0.032599301Gay Index -0.018806498 0.005240252 0.001154793 Gay Index -0.040451982 0.009623104 0.004533239Melting Pot -0.007089817 0.001154793 0.001051299 Melting Pot -0.032599301 0.004533239 0.008822098
Talent Gain 80% Talent Gain 150%Boho Index Gay Index Melting Pot Boho Index Gay Index Melting Pot
Weight 1.849120408 -0.093056161 -0.756064247 Weight 3.968144937 -0.162004374 -2.806140563Boho Index 1.849120408 0.0784 Boho Index 3.968144937 0.0784Gay Index -0.093056161 0.14616 0.7569 Gay Index -0.162004374 0.14616 0.7569
Melting Pot -0.756064247 0.009898 0.0299628 0.0049 Melting Pot -2.806140563 0.009898 0.0299628 0.0049
Boho Index Gay Index Melting Pot Boho Index Gay Index Melting PotBoho Index 0.268068909 -0.02515005 -0.013837937 Boho Index 1.23450006 -0.093959955 -0.110215937Gay Index -0.02515005 0.006554337 0.002108076 Gay Index -0.093959955 0.019865156 0.0136213Melting Pot -0.013837937 0.002108076 0.002801002 Melting Pot -0.110215937 0.0136213 0.038584682
Talent Gain 90% Talent Gain 200%
Weight2.151838186
-0.102905897-1.048932289
Boho IndexGay indexMelting Pot
Boho Index2.151838186
0.07840.14616
0.009898
Boho Index0.363023954
-0.032365208-0.022341098
Gay Index Melting Pot-0.102905897 -1.048932289
0.75690.0299628
Gay Index-0.0323652080.0080152860.003234224
0.0049
Boho IndexGay Index
Melting Pot
Melting Pot-0.0223410980.0032342240.005391269
Weight5.481733895-0.211253102-4.270480793
Boho IndexGay IndexMelting Pot
Boho Index5.481733895
0.07840.14616
0.009898
Boho Index2.35587347
-0.169258146-0.23170861
Gay Index Melting Pot-0.211253102 -4.270480793
0.75690.0299628
Gay Index-0.1692581460.0337788370.027031009
0.0049
Melting Pot-0.231708610.027031009
0.08936133
Boho IndexGay Index
Melting Pot