engagement (des) - aamc engagement survey (des) turning data into action deborah l. plummer, ph.d....
TRANSCRIPT

DIVERSITY ENGAGEMENT
SURVEY (DES)
TURNING DATA INTO ACTION
Deborah L. Plummer, Ph.D. Vice ChancellorHuman Resources, Diversity & InclusionUniversity of Massachusetts Medical School
March 25, 2014


INCLUSION FACTORS

WHAT THE DES SCORE REPRESENTS
Degree of overall engagement with the institution
Identifies respondents in their multiple identities across various levels of systems
o Position: Faculty, staff, students, post docs, residents
o Level: Junior faculty, senior faculty, administrators,
o Diversity Dimensions: Race, gender, ethnicity, sexual
orientation, disability, age, etc.
Depicts the interplay of group identity, engagement, and inclusion within the institution.

What the Open –Ended Items Do?
Responses can be themed according to the eight inclusion factors.
Themes can be organized according to responses that would be considered:
oDescriptive: naming issues about the organization
oDiagnostic: defining areas of strengths or weakness
o Prescriptive: pointing to a direction for change

Using the DES to InformDiversity Plans
Agenda for Stakeholder Groups
o Provide background on the survey and the intent for its use at your institution
o Share results in a confidential manner—information is being provided to them to support attainment of diversity goals
o Allow time for discussion: What meaning do they make of the results? Any learnings or surprises? Any good news? Any concerns?
o Brainstorm practical ideas for how low scores might be improved: What would help us to move the needle on this item? What might we do with little or no resources? Any low hanging fruit? What plans do we need to have in place to ascertain resources for long term or strategic plans?
Create 2-3 SMART goals (specific, measurable, attainable/agreed to, realistic, timely) for each or the institution’s lowest scoring items to be included in the institutional diversity plan

UMMS Results1,958 respondents or approximately 40%; 214 comments
Overall favorable response to survey design and its brevity
Concerns on design expressed by individuals:
o No questions on Disability
o Use of term “Queer” believing it to be offensive
Overall Highest inclusion factor Common Purpose
Overall Lowest inclusion factor Equitable Reward and Recognition
Strategic direction for change
• Women needed more advancement opportunities
• Black and Hispanic needed greater recruitment and retention efforts
• LGBT community needed more inclusion efforts
• Disability community wanted more visibility and recognition of needs
• Faculty and staff with more than five years of employment wanted more recognition and reward efforts
• Students wanted more faculty of color hired, more culturally
competent faculty and diversity issues integrated into the curriculum

You Responded, We Listened, We ActedGreater recognition efforts for our faculty and staff who had been at UMMS more than 5 years
• Spot Awards Program, Special Awards Program
Greater recruitment and retention efforts for Black and Hispanic faculty and students
• FDSP Scholarship Program
• Student Mentoring Circles Program
• Micro-communities Program
More opportunities for staff recognition beyond years of service.
• Chancellor’s Award for Advancing UMMS Mission and Community Service
Faculty concerns about equitable reward and recognition
• Further communicated 2010 results of gender/race equity study; conducting an annual compensation equity analysis
Enhanced integration of diversity and health equity into curriculum
• Review of curriculum for LGBT health
• Incorporation of student facilitators in Multicultural Interstitial and Social Determinants of Health
Greater inclusion efforts for our LGBT faculty and staff
• LGBT Welcome Luncheon
• Budget allocation for attendance at GLMA (Gay Lesbian Medical Association) Conference
• Two no agenda meetings to have voices heard

Practical Applications of the Diversity Engagement SurveyJonathan S. Appelbaum, MD, FACP
Laurie L. Dozier, Jr., MD Professor and Director of Internal Medicine
GDI Representative
Chair, Diversity and Inclusion Council FSU College of Medicine
March 25, 2014

The Florida State University College of Medicine will
educate and develop exemplary physicians who
practice patient-centered health care, discover and
advance knowledge, and are responsive to community
needs, especially through service to elder, rural,
minority, and underserved populations.

Rural
Elderly
Minority
Medically Underserved

History of FSU-COM
• FSU-COM established June 2000 by Florida legislature. First of the “new” medical schools of the 21st century.
• Mission established by law
• First graduation class 2005
• First full LCME accreditation 2005
• Reaccredited by LCME in 2011
- Strengths included pipeline programs

How Do We Meet the Mission?
• Pipeline programs
• Holistic admissions
• Strong student support systems
• Ambulatory training model---70% outside the hospital in the community setting
• One-on-one instruction by community physicians beginning Year 1

Community-based Training
At the regional campuses, third- and fourth-year students train one-on-one with
practicing physicians in private practices, hospitals, and other medical facilities.

Bridge to Clinical Medicine Program
• Created in 2001
• Transition from post-baccalaureate program to MS program in 2009
• 97% (35) students entering medical school from the Program have graduated medical school
• 71.4% (20) of these have entered primary care

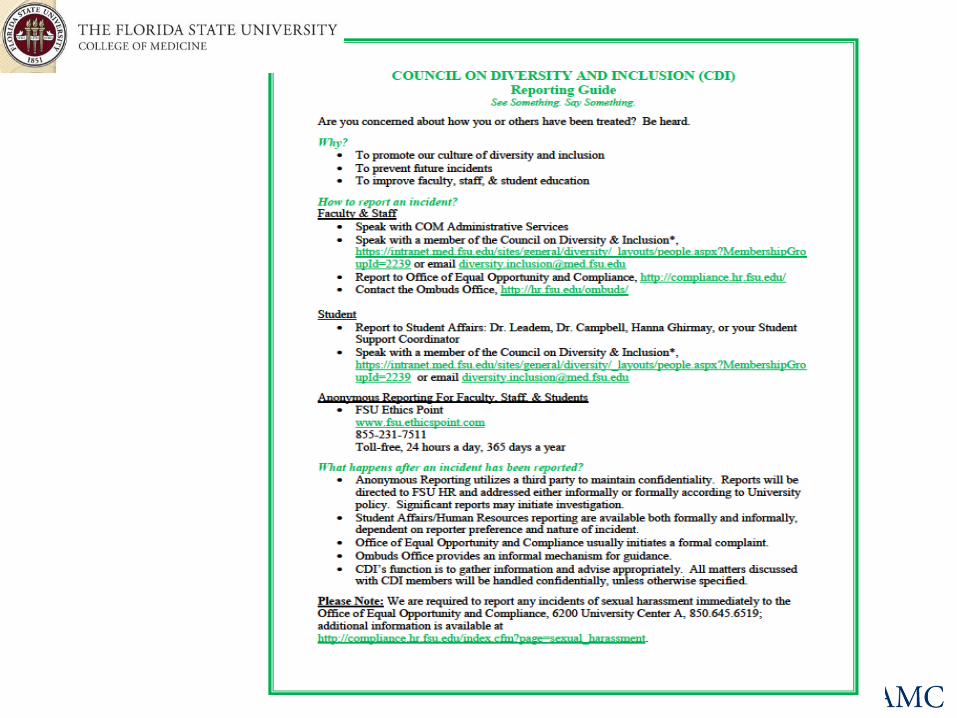
Diversity and Inclusion at FSUCOM
• Creation of GDI in 2009
• Events at COM perhaps indicated we were not addressing D&I directly
• Formation of CODI in 2010
• Needs assessment: use of DES to get a “diversity snapshot” of FSUCOM
• Develop D&I strategic plan


FSUCOM Internal Sub-analysis
• Gender: some differences (men > women)
• Race: some differences comparing each group to every other group
• Sexual orientation: some differences (hetero > LGBT)
• Religion: no differences
• Veteran status: no differences
• Generational age: millenials > all others

FSUCOM -- D&I themes
• Embrace a save and welcoming environment
• Embrace diversity at all levels
• Celebrate and cherish diversity, models inclusion

D&I Action Items-from strategic plan
• In parallel with DES
• Inform constituent groups, framing D&I as an issue of health equity. Follow up survey in 2 years-due this year!
• Develop one-page on D&I at FSUCOM
• Work with Faculty Council to identify ombudsman

• Work with curriculum redesign teams to ensure that underserved groups become part of new curriculum package
• Develop training materials
• Educational and celebratory programs

Challenges
• Operationalize survey for COM with regional campus model
• Engage faculty, staff, students
• Celebrate data while moving forward with D&I strategic plan
• Use survey as part of D&I policy (LCME)


First ‘Live the Mission’ week in January 2014 with daily events:
• Live the Mission Fair
• Experiential diversity exercise
• Panel of alumni who are living the mission
• Cultural pot luck

• Unconscious bias day
• Faculty and staff (50)
• Luncheon with CODI and Exec Committee
• Students (240)
• Hidden Colors-Black history month
• Facilitated by 2 CODI members

Enablers & Barriers to Inclusive Excellence:
Listening to The “Voices” of our Faculty, Staff, &
LearnersFaculty, Staff & LearnersJudy SeidensteinChief Diversity OfficerDuke University School of Medicine
March 25, 2014

Inclusive Leadership

Diversity and Engagement Survey (DES)
Taking A Deep Dive Into the Qualitative Data
• Senior leaders must become “architects”
of an inclusive culture and climate to chart
the path forward
• Design a process to engage leadership in
bringing forward the “voices” of
respondents from the AAMC Diversity &
Engagement Survey • Build ownership by discussing key themes that emerged
from the qualitative data
• Begin to identify recommendations to
build on what’s working well and to
address the gaps

Race/Ethnicity Distribution
AAMC Survey vs. Total School of Medicine Employees/Faculty
Base: AAMC Survey: N=2308; SOM Total: N=10,075

Gender Distribution
AAMC Survey vs. Total School of Medicine Employees/Faculty
Base: AAMC Survey: N=2308; SOM Total: N=10,075

Position Distribution
AAMC Survey vs. Total School of Medicine Employees/Faculty
Base: AAMC Survey: N=2308; SOM Total: N=10,075
* In the AAMC Survey the category Other includes the following groups: Post Docs, Resident/Fellow, Student,
Two or More, and Other (Research Associates, Research Analysts, etc.). The SOM data includes only the
following as Other: Retirees and Students.

Question 11:
I believe my institution manages diversity
effectively.
45%
76%
63%
42%
27%
15%
21%
27%23%
5%
11%
24%
4% 3% 4%7%
0%
10%
20%
30%
40%
50%
60%
70%
80%
90%
Under-RepresentedMinority (409)
Asian (208) White (1,599) Race Unknown (92)
Race / Ethnicity
Favorable Mixed Unfavorable Unable to Evaluate
Base: School Of Medicine: N=2,308
Note: Due to insufficient sample size, the following demographics have been grouped into one category labeled
‘Under-Represented Minorities’ - Hispanic/Latino(a), American Indian/Alaska Native, Native Hawaiian/Other
Pacific Islander, Black/African American, two or more races and other.

Question 11:
I believe my institution manages diversity
effectively.
66%
59%
8%
43%
20%
23%
17%
22%
10%
14%
58%
22%
5%4%
17%
12%
0%
10%
20%
30%
40%
50%
60%
70%
Male (719) Female (1,528) Other (12) Gender Unknown (49)
Gender
Favorable Mixed Unfavorable Unable to Evaluate
Base: School Of Medicine: N=2,308
Note: Due to insufficient sample size, the following demographics have been grouped into one category labeled
‘Other’ – Transgender and other.

Question 11:
I believe my institution manages diversity
effectively.
62%
58%
62%
38%
21%
25%22%
0%
14%13%
10%
15%
3%4%
7%
46%
0%
10%
20%
30%
40%
50%
60%
70%
Employee/Staff (1,306) Faculty (529) Other (450) Position Unknown (13)
Position
Favorable Mixed Unfavorable Unable to Evaluate
Base: School Of Medicine: N=2,308
Note: Due to insufficient sample size, the following demographics have been grouped into one category
labeled ‘Other’ – Resident/Fellow, Post Doc, Student, and Other.

Diversity & Engagement Survey:
Question 23
Open Ended Question:
We value any additional comments you have on what is working well with respect to diversity and inclusion at the School of Medicine as well as what are some of the areas for improvement.
• Out of 2308 survey respondents 503 provided responses to Question 23.
• Given the broad nature of the question, responses covered many different areas.
Ten overarching and interrelated themes emerged
The themes that emerged reflect this breadth of response and identify both areas of strength and areas for improvement
Quotes were selected to represent a collection of comments made reflecting a particular theme or themes.

Descriptive statistics of all participants who responded to Question
23
Total - no. (%) 503 (100.0)
Position at Duke - no. (%)
Employee/Staff 283 (56.26)
Faculty 134 (26.64)
Student 31 (6.16)
Two or More 22 (4.37)
Other (research associate, research scientist, etc…) 15 (2.98)
Post Doc (Professional Trainee) 13 (2.58)
Did Not Answer 3 (0.60)
Resident/Fellow 2 (0.40)
Gender - no. (%)
Female 339 (67.40)
Male 145 (28.83)
Did Not Answer 16 (3.18)
Other 3 (0.60)
Race - no. (%)
White 331 (65.81)
Black/African American 60 (11.93)
Asian 25 (4.97)
Other 24 (4.77)
Did Not Answer 22 (4.37)
Two or More 20 (3.98)
Hispanic/Latino(a) 19 (3.78)
Native Hawaiian/Other Pacific Islander 1 (0.20)
American Indian/Alaska Native 1 (0.20)


Ten Inter-related Themes
• SoM Doing Well Overall
• Need for Greater Diversity Especially in Leadership Positions
• Desire for More Authentic Leadership Commitment
• Lack of Accountability:– Managers Not Being Held
Accountable for Inclusion– Managers Not Holding
Employees Accountable
• Inequities Related to Job Role, Function, Discipline and/or Level
• Lack of Awareness, Appreciation and Respect Between Individuals
• Diversity and/or Diversity Management Seen as Compromising Excellence and/or Promoting “Reverse Discrimination”
• Specific Areas of Inclusion/Exclusion– Gender Bias– Power and Money Matter Over
Inclusion – Diversity of Thought (Diversity Narrowly
Defined) – LGBT Inclusion/Exclusion– Pro-Christian Bias
• HR Management and Recruitment Systems Need Improvement
• Inequitable Rewards

Designed a Leadership Engagement
Strategy to “Make it Real”
• Half Day Off Site Dean’s Diversity Leadership Retreat co-led with Marc Nivet to engage with and bring forward the “voices” of respondents from the survey
• Divided team into partner pairs, each receiving a pre-defined (yet unidentified) set of 15-20 representative quotes.
• Leaders were asked to take turns reading each of the quotes in their deck out loud. Once all of the quotes were read, they were to work with their partner to identify the theme or themes that emerged from their deck.
• They were asked to summarize the themes and any highlights from their “stack” of quotes as well as select 2-3 quotes that they felt best illustrated the identified theme/s for presentation to the full group.

(15)“Would like to see more diversity (people of color and women) in TOP leadership positions throughout Duke Medicine.”
(Female, White, Employee/Staff)

(16)“It is clear that Duke University School of Medicine values diversity and inclusion with regard to applicants accepted to their School of Medicine programs; but whether that respect for diversity extends to input from multiple professions and cultural diversity in the highest levels of administration is very much in question. It seems there is serious commitment to making opportunities for the education of physicians from varied backgrounds and cultures, but within the culture of medicine at this institution there is clearly a lack of diversity at the highest decision-making levels (i.e. many more men, mostly MDs, mostly Caucasian, etc.) To truly embrace respect for diversity and inclusion, there should be much more varied representation in positions of power within Duke.”
(Female, White, Faculty)

(18)“I think it is important to recruit highly visible minority faculty to demonstrate our commitment to diversity. We have done well in this regard with many women in senior roles at Duke. ”
(Male, White, Faculty)

(19) “Diversity will never be fully accomplished until diverse individuals are 'invited' into administrative positions that truly have the potential to make an impact on the community we serve whether it be amongst the students, staff and/or faculty. When persons of the same background, culture, beliefs etc., sit in key positions, the outcomes are most often the same and we
lose a great of creativity.”(Female, Black/African American, Two or
More)

Need for Greater Diversity Especially in
Leadership Positions
• There was a call for greater diversity and access to opportunity in key positions within the institution.
• Recommendations in this area included a need for more mentors and other professional development opportunities to promote career advancement and promotion, particularly into senior positions and among faculty.


Cascade To Next Level of Leadership
• Dedicated a full Medical Center Executive Committee Meeting to an abbreviated version of the DES Qualitative Data Leadership Engagement Process
• Upon entering the boardroom, each Chair/Institute/Center Director received a sealed numbered envelope that contained a representative quote
• At appropriate intervals during the meeting, leaders were asked to bring forward the voice of respondents to the survey by reading a quote out loud to their peers.
• Each quote identified the demographic categories of the person who wrote it.
• Appreciative Listening & Inquiry
What do you hear? Impressions? What if any themes, emerge?

Moving Forward:
Using The Data To Inform Strategy
• Confidential in depth data report provided to Chairs which provides insight into all 10 of the qualitative themes that emerged from the DES Survey.
• Leaders encouraged to review their departmental data and consider how it may further inform the implementation of their 2014-15 Departmental Diversity Strategic Plan.
Any surprises?
What are the greatest opportunities/challenges?
• Departments to nominate members for SoM Inclusion Council who will help further identify priorities and recommendations and school wide communication of data (“We hear you”)