energy-water relationships in reticulated water infrastructure systems
TRANSCRIPT

WA7090/2
Energy-Water Relationships in Reticulated Water Infrastructure Systems Final A report prepared for Beacon Pathway Limited June 2009
The work reported here was funded by Beacon Pathway Limited and the Foundation for Research, Science and Technology

About This Report Title Energy-Water Relationships in Reticulated Water Infrastructure Systems
Authors Ben Kneppers, Damon Birchfield, Maggie Lawton. Reviewer Lois Easton, Nick Collins, Dorothy Wilson and Vicki Cowan Abstract The report provides an initial analysis of the relationship between energy use and reticulated water supply and wastewater treatment. A literature study was supplemented by energy and water use data from four distinct reticulated water systems (Waitakere, Palmerston North, Kapiti and Nelson). The data was analysed and considered for energy use and energy efficiency and consideration given to how improvements could be made.
Reference Kneppers, B., Birchfield, D., and Lawton, M. . June 2009. Energy-Water Relationships in Reticulated Water Infrastructure Systems.Report WA7090/2 for Beacon Pathway Limited. Rights Beacon Pathway Limited reserves all rights in the Report. The Report is entitled to the full protection given by the New Zealand Copyright Act 1994 to Beacon Pathway Limited.
Disclaimer The opinions provided in the Report have been provided in good faith and on the basis that every endeavour has been made to be accurate and not misleading and to exercise reasonable care, skill and judgment in providing such opinions. Neither Beacon Pathway Limited nor any of its employees, subcontractors, agents or other persons acting on its behalf or under its control accept any responsibility or liability in respect of any opinion provided in this Report.
Energy-Water Relationships in Reticulated Water Infrastructure Systems: WA7090/2
Page ii

Contents 1 Executive Summary .................................................................................................................. 1 2 Introduction ............................................................................................................................... 3 3 Data analysis methodology ....................................................................................................... 7 4 Results ..................................................................................................................................... 10
4.1 Waitakere City Council (WCC)..................................................................................... 10 4.2 Palmerston North City Council (PNCC) ....................................................................... 12 4.3 Kapiti Coast District Council (KCDC).......................................................................... 14 4.4 Nelson City Council (NCC)........................................................................................... 16 4.5 Data Summary................................................................................................................ 18
5 Discussion ............................................................................................................................... 23 6 References ............................................................................................................................... 26
Energy-Water Relationships in Reticulated Water Infrastructure Systems: WA7090/2
Page iii

Tables Table 1: Case study councils with key water infrastructure features ..................................... 7 Table 2: Summary of Waitakere City Council’s Energy/Water Use Relationship...................... 11 Table 3 Summary of the Palmerston North Energy/Water Use Relationship..................... 12 Table 4: Summary table of water source and level of supply for Kapiti...................................... 14 Table 5: Summary of Kapiti Coast Energy/Water Use Relationship........................................... 15 Table 6: Summary of Nelson City Council’s Energy/Water Use Relationship ........................... 17 Table 7: Summary data including per capita energy use and total CO2 emissions for the four
case study council data. ........................................................................................................ 20
Figures Figure 1 Energy use distribution between the four sectors for Waitakere ........................... 18 Figure 2 Energy distribution between the four sectors for Palmerston North...................... 19 Figure 3 Energy distribution between the four sectors for Kapiti ........................................ 19 Figure 4 Energy distribution between the four sectors for Nelson....................................... 20 Figure 5: Figure demonstrating the kWh per capita figure for water supply and wastewater from
the four case study areas. ...................................................................................................... 21 To insert table, figure or equation captions in this report, you can use the F, T or E buttons on the Styles toolbar
Energy-Water Relationships in Reticulated Water Infrastructure Systems: WA7090/2
Page iv

1 Executive Summary This report considers the relationship between the reticulated urban water cycle and the energy used in those processes. The purpose of the investigation was to highlight the operational energy component of urban water systems, recognising that this factor should be given more weight in the design of reticulated water systems as energy costs rise. The study was undertaken to provide one aspect of why and how the urban water infrastructure could be modified to be more resource efficient and resilient, now and in the future, and to signal the fact that a water demand management approach has benefits in a reduction of both water and energy costs. The investigation found that, while the connection was increasingly being made, both overseas and in New Zealand, there was scope for further innovations or alternative solutions to be considered when designing systems or considering what sort of solutions to use. In New Zealand, data on energy used through various sectors of the water network have been captured by some councils as part of monitoring their energy use and in reporting to the International Council for Local Environmental Initiatives (ICLEI) on greenhouse gas emissions. That data, where available, can also be used to help councils make decisions about proposed future water requirements. Data from four council-managed water supply and wastewater systems with a diversity of local conditions have been analysed for their relative energy use and energy efficiency of the various water supply and wastewater situations. Energy data from the councils at Nelson, Waitakere, Kapiti Coast and Palmerston North was consolidated into four sectors of the reticulated water system being: water supply pumping, water supply treatment, wastewater pumping and wastewater treatment.
All councils involved in this study had put in place systems to best meet required health standards and protect the immediate environment. The downside of such systems is the operational requirements and energy costs in a time when those costs are signalled to increase. So the question becomes:
What can be done to bring down the costs of current infrastructure and what design changes could be made to make future water infrastructure more energy efficient, while still achieving the effectiveness that is required?
These initial results showed some variations in energy efficiency between the systems and a consideration of relative energy use between sectors. For example the degree of water supply treatment required and the degree to which gravity fed systems were available were key factors in the energy operating cost of the systems. Despite the stringent requirements and public expectations placed on our water systems, there are still a number of approaches that could be made to reduce energy requirements and which could become a focus for infrastructure managers and designers to pursue.
Energy-Water Relationships in Reticulated Water Infrastructure Systems: WA7090/2
Page 1

From overseas experience and the observations from our data analysis, these include:
Minimising energy use when designing new water/wastewater infrastructure. Reviewing the maintenance features of existing plants to improve energy efficiency. Making best use of natural local advantages that might allow gravity feeding or good
quality water which requires less treatment. Capturing co-generated energy sources such as methane from wastewater treatment to
reduce cost and carbon emissions. Providing on-site renewable energy to power the operations. Considering the provision of services which are fit for purpose e.g., not treating all water
sources to a potable standard. Considering local small scale water systems for smaller communities which can be tailored
to site specific conditions, rather than a scaled down model of major infrastructure. In the future it is likely that taking a systems engineering approach may produce more efficient designs, not yet on the drawing board. However, at the present time, there is much to be gained in reviewing current practice and making sure that existing and new infrastructure systems are not only as water and energy efficient as possible but are also underpinned by the demand management approach described in other Beacon publications.
Energy-Water Relationships in Reticulated Water Infrastructure Systems: WA7090/2
Page 2

2 Introduction This study focuses on water infrastructure energy relationships. It does not consider energy use in water provision within the home, a subject which has been previously documented. The purpose of the study is to:
Promote the discussion on energy use associated with water infrastructure. Provide initial data, as available, on how energy is consumed within the water cycle and
how that relates to the locale. Give consideration on how energy associated with water infrastructure could be reduced.
Access to clean water and the removal of wastewater is a hallmark of civilised urban living, delivering health and comfort benefits. Over the last 150 years sophisticated reticulated systems have been developed to supply those services. Traditionally, reticulated water infrastructure has developed in conjunction with population growth. This infrastructure is not just water intensive but also energy intensive, especially where significant levels of treatment and pumping are concerned. With both water and energy supply coming under more pressure and populations predicted to continue to grow, it is sensible to consider how our water needs can be met in a way that reduces the consumption of, not just water, but also associated energy. Critical to the design consideration is recognising that energy supply will become substantially restricted and therefore more expensive in the next few decades. In addition, environmental externalities, in particular greenhouse gas emissions associated with energy generation, will add to that pressure and hence energy efficiency should be a key consideration in any infrastructure investment decision. Previous research has considered the benefits of a demand management approach to water, which, in turn, reduces associated energy requirements. While demand management interventions are the most effective means of conserving both water and energy, there is also scope to focus on the design of current and future water systems to limit energy requirements. Understanding where energy requirements are highest and under what circumstances that occurs is necessary to be able to design energy efficiency into reticulated water systems and ensure that the on-going operational costs of these services to communities are minimised. That design could consider water services based on ecological principles, closed systems which move towards being self-sustaining. The recovery of energy from wastewater treatment is but one step in that direction.
A scan of published information on the links between energy and reticulated water systems was carried out, restricted to those reports that considered the water/energy relationship rather than the raft of water infrastructure and demand management analysis that is found in the literature and is reported elsewhere. In addition to a consideration of energy and water relationships in New Zealand, the most relevant information to this study was found in two water stressed areas, California and Australia. Energy-Water Relationships in Reticulated Water Infrastructure Systems: WA7090/2
Page 3

The California Institute for Economic Efficiency (CIEE, 2000) notes, “Critical elements of California’s water infrastructure are highly energy intensive. Moving large quantities of water long distances and over significant elevations in California, treating and distributing it within the state’s communities and rural areas, using it for various purposes, and treating the resulting wastewater, accounts for one of the largest uses of electrical energy in the state. Significant potential economic as well as environmental benefits can be cost-effectively achieved in the energy sector through efficiency improvements in the State’s water system.”
New Zealand is generally fortunate in not having to pump water significant distances. However the Waikato pipeline is a notable exception with the requirement for a second pipeline anticipated in 2026 unless demand is reduced. The report, Energy Down the Drain: The Hidden Costs of California’s Water Supply, highlights a generally accepted approach to utility development:
“Water utilities value only the cost of treating and delivering water. Wastewater utilities value only the cost of collection, treatment and disposal. Electric utilities value only saved electricity. Natural gas utilities value only saved natural gas. This causes underinvestment in programmes that would increase the energy efficiency of the water use cycle and increase agricultural and urban water use efficiency.”
Studies have proposed that by assessing water on its total value, energy and water demand management programmes that could not meet the earlier cost-effectiveness threshold become attractive. Further:
“In the mid-1990s, EPRI and HDR Engineering, Inc. conducted an audit of the energy savings potential for water and wastewater facilities in California. At that time, they estimated that more than 880 million kWhs could be saved by implementing several measures: load shifting, variable frequency drives, high-efficiency motors and 33 pumps, equipment modifications, and process optimization with and without Supervisory Control and Data Acquisition (SCADA) systems. These estimates did not include incorporating interim storage to shift loads and optimise plant efficiencies. Industry experts estimate that untapped energy efficiency opportunities through the optimization of water and wastewater treatment processes could be as high as 30 percent of existing processes” (CEC, 2005).
Water scarcity has become a critical and defining issue for Australia with climate change and related policy taking centre stage as an already very dry continent attempts to innovate and greatly extend the useful life of its already overstressed and in many cases over-allocated water resources. The relationship between water and energy is especially pertinent in Australia because it is likely additional new future supply will come from energy intensive desalination and black water treatment plants in order to meet future demand. If powered by renewable energy as in Perth’s new water supply powered by a near-by wind farm, those energy requirements are significantly reduced.
Energy-Water Relationships in Reticulated Water Infrastructure Systems: WA7090/2
Page 4

In response to the wider issue of water scarcity, greenhouse gas mitigation and water conservation measures have been implemented country-wide. Australia's Commonwealth Scientific and Industrial Research Organisation (CSIRO) has carried out a study considering the missing connection between these two critical efforts. In addition, studies on pumping and water treatment efficiency have been explored to better understand the available opportunities of energy and water conservation.
CSIRO has considered the water-energy relationship for seven major cities, six in Australia and Auckland City in New Zealand. This report provides the baseline energy use across all sectors as well as projections for what future water consumption will look like in terms of energy. In order to further explore the energy intensive areas of the water cycle, studies were undertaken to provide guidance on how to implement more energy efficient measures within the water supply and wastewater systems. It is noted that there were large variations between water utilities in different cities. A general list of proposed measures was provided to give managers a tailor made approach to achieving effective results for their site specific issues. The outcome of the research has shown that the large variance in energy intensity for each city was mainly due to differences in topography, water source and treatment systems.
The CSIRO (2005) report, Water for a Healthy Country 2005, Water-energy futures for Melbourne: the effect of water strategies, water use and urban form, additionally found that a compact urban form, as opposed to a sprawling Melbourne, significantly reduces residential water consumption and associated energy use.
No similar in-depth study on energy use within the urban water cycle has been undertaken in New Zealand, although a number of studies considered the subject. Aulckh, H., (1998) published results from a study considering overall energy use within local government. The study found that 20% of energy use could be attributed to water supply provision. This made water supply the highest of all local government energy uses, followed by street lighting (19%), sewage (17%), vehicle fleets (16%), swimming pools (13%), office buildings (11%), and other activities including road construction and repairs, parking, traffic signals, parks etc (4%). The total energy use relating to “water provision” and “sewage” treatment together therefore makes up 37% of all energy use for local government.
The above report suggests that the supply of water and the removal of wastewater in urban reticulated water services consume significant amounts of energy across New Zealand’s urban areas. From a report on 13 councils across the country that have reported their corporate inventory on energy and greenhouse gas emissions, Communities for Climate Protection – New Zealand (2006) ‘Inventory Report’. CCP-NZ: Wellington, the figure for water and wastewater related emissions was 25% of Council’s total emissions.
Energy-Water Relationships in Reticulated Water Infrastructure Systems: WA7090/2
Page 5

The report also provides other conclusions relating to the benefit of greater use of energy efficiency measures. In particular the report states:
“Energy efficiency in local government operations can be increased by paying attention to activity design (including construction, commissioning, and retrofitting), use of new technologies and the practice of sound energy management and building services maintenance. Averaged across all operations, 10-15% of current annual energy use in the local government sector could be saved through implementing cost-effective energy efficiency investments”.
Energy-Water Relationships in Reticulated Water Infrastructure Systems: WA7090/2
Page 6

3 Data analysis methodology To arrive at an initial understanding of New Zealand’s reticulated energy and water relationships, energy use was analysed for four councils operating with differing water infrastructure contexts.
The councils were selected based on the availability and consistency of data to be able to compare results. Previous Beacon water-related research indicated that the consistency and method of water-related data collection between councils was highly variable. To overcome this problem and collect a consistent data set, only councils with a commitment to ICLEI were considered for the study. However, even though ICLEI requires collection of energy/water supply and treatment data sets, it was evident from the initial data inspection that there was not a strictly consistent method of recording the information. Consistency of data and the time required for council officers to collect and collate the information limited the councils available for the study. A range of water infrastructure features and configurations was considered to investigate the individual and relative energy intensities they contributed to water infrastructure. The four councils selected are shown in table 1, along with their key water infrastructure features.
Table 1: Case study councils with key water infrastructure features
Council Supply Type Wastewater Treatment standard
Waitakere Five dams: mainly gravity fed plus the pipeline from the Waikato
Tertiary –Mangere plant
Palmerston North Turitea Stream and artesian well (at peak times)
Tertiary
Kapiti Coast Four systems, largest system supply from Waikanae River, bore water at peak times during dry weather
Predominantly tertiary, some secondary
Nelson City Maitai Dam and the Roding River
Predominantly tertiary
The energy examined in this study reflects direct inputs to water cycle operational requirements (i.e. electricity for pumping and operations of the treatment facilities) and makes no considered of embodied energy in plant construction.
Energy-Water Relationships in Reticulated Water Infrastructure Systems: WA7090/2
Page 7
The water cycles were broken down into the following four sectors based on the study, Energy down the drain:
Water Pumping: The energy required to extract the water from its source, the conveyance of water to the treatment site, and pumping required to supply the end-user.
Water Treatment: The energy required for the processes of treating water that meets potable water health standards.
Wastewater Pumping: The energy required for any pressurisation or pumping that occurs within the wastewater's collection, conveyance to treatment site and disposal.
Wastewater Treatment: The energy required for the operations occurring in the wastewater treatment plant.
The energy data collected for this study for all but Waitakere City Council (WCC) is derived from the ICLEI milestone 1 data. The milestone 1 data is an inventory of city councils’ greenhouse gas emissions for council services and operations and provides an analysis of sources of these emissions from the municipality as a whole.
The ICLEI information collected was:
Annual Water Supply Energy (kWh): Total annual energy input for collection, conveyance, and treatment for city council reticulated water supply;
Annual Water (Cubic Metres): Total annual water allocated for city council reticulated water supply;
Annual Wastewater Energy (kWh): Total annual energy input for collection, treatment and disposal for city council reticulated wastewater system;
Annual Wastewater (Cubic Metres): Total annual wastewater for city council reticulated wastewater system.
Although WCC contributed to ICLEI, much of its water cycle is managed by the regional water wholesaler, Watercare Services Ltd, so the data was sourced from Watercare's 2008 Annual Report, the Auckland Water Industry’s Annual Performance Review 2006/07, and Ecowater’s (WCC’s water department) 2007 to 2008 annual water pumping figures. Total energy used for each area (i.e. water pumping, wastewater treatment etc) of the entire Auckland region was collected from the Watercare report and the percentage of water (12%) and wastewater (11%) allocation for WCC was attained from the Auckland Water Industry report.
The information from each council was analysed to provide the following efficiency equations:
Water Energy Efficiency (kWh/Cubic Metres) = Annual Water Supply Energy (kWh)/ Annual Water Supply (Cubic Metres);
Wastewater Energy Efficiency (kWh/Cubic Metres) = Annual Wastewater Energy (kWh)/ Annual Wastewater Supply (Cubic Metres).
Energy-Water Relationships in Reticulated Water Infrastructure Systems: WA7090/2
Page 8

These results were then compiled to deliver the total water-energy intensity relationship as annual kWh/per person to provide a snapshot of the relative intensities of the various systems. Limitations to the analysis include that: 1) The data collected has been compiled from annual results within a range of years, with
some anticipated inconsistencies. 2) Only annual figures were collected which leads to limitations in understanding increased
energy intensity during peak demand times; 3) For WCC, water and wastewater services are part of a shared network so their energy use
was estimated as percentages of the whole system. 4) Where councils operate more than one water or wastewater treatment system, findings
relative to individual supply sources are more difficult to determine.
Energy-Water Relationships in Reticulated Water Infrastructure Systems: WA7090/2
Page 9

4 Results Results from the four case studies are presented below.
4.1 Waitakere City Council (WCC) Waitakere City, in the west of the Auckland region, covers an area from the Waitakere Ranges, flanking the Tasman Sea and the top end of the Manukau Harbour down through the foothills (semi-rural character) to its urban areas which drain into the Waitemata harbour. The population of Waitakere is 193,000 and is expected to continue to grow to c.260,000 by 2026. It has a temperate climate, more than average rainfall and has mostly clay-based soils which have low permeability. Waitakere has a Water Cycle Strategy (1995) based on the integrated management of the three waters (water, sewerage and stormwater) and has had a proactive water demand management approach. Its average domestic water consumption is 162 litres per person per day. The features of the water/wastewater infrastructure that contribute to its energy profile include:
Waitakere’s water supply source is located close to where it is consumed and 98% of the supply is gravity fed due to the height of its dams in the Waitakere Ranges. It is treated at the Huia and Waitakere filter stations using energy in the process.
Wastewater is treated at the Mangere Wastewater Treatment Plant and has to be pumped several kilometres (1042 kilometres cumulatively) from its source removing 13 million cubic metres of wastewater each year from homes and workplaces within the city. Wastewater treatment involves anaerobic digesters which provide biogas for on-site power generation providing 51% of energy for wastewater treatment process.
At the time of this report the bulk supplier Watercare owns and manages the bulk water supply and waste water treatment, whereas the retail end is owned and managed by Ecowater a department of Waitakere City Council. (This is highly likely to change in 2009 with the reorganisation of the Auckland region, however.)
Energy-Water Relationships in Reticulated Water Infrastructure Systems: WA7090/2
Page 10

The total energy figures for WCC, as shown in table 2, were derived from its percentage of Watercare’s energy figures plus the contribution managed directly by WCC through their water department, Ecowater.
Table 2: Summary of Waitakere City Council’s Energy/Water Use Relationship
Stage Energy (KWh) Energy %
Water Pumping 853,578 28.37%
Water Treatment 3,180,600 23.50%
Wastewater Pumping 1,439,948 10.64%
Wastewater Treatment 8,060,030 59.55%
Total Electricity (kWh) 13,534,155
Energy (kWh) Volume (m3) Energy Water Ratio (kWh/m3)
Water Cycle 4,034,178 16,387,101 0.39
Wastewater Cycle 9,499,978 12,570,602 0.46
Population 193,400 Notes: Pop expected to grow to 257,200 by 2026
kWh per capita 69.98
On an annual per capita basis, the total energy use for the total reticulated water system was 69.98 kWh. WCC’s energy efficiency per capita is the best of the four councils studied. As can be seen in Table 2, the highest energy use occurs with wastewater treatment (59.55%), followed by water pumping (28.37%), water treatment (23.50%) and wastewater pumping (10.64%). The total amount of electricity used annually is 13,534,155 kWh. This amount of energy was used to supply 17,054,177 m3 of potable water and to treat 15,159,110 m3 of wastewater. The energy/water ratio for supply was 0.24 kWh/m3 while wastewater treatment was 0.63 kWh/m3, showing that in terms of energy intensity, WCC’s wastewater treatment is nearly three times that of supply. Also of note was the fact that Watercare Services, responsible for the WCC data, was the only organisation that had annual, publicly-reported data available on the energy efficiency of their water and wastewater systems. The connection between water services and energy use is not generally available for public scrutiny in New Zealand.
Energy-Water Relationships in Reticulated Water Infrastructure Systems: WA7090/2
Page 11

4.2 Palmerston North City Council (PNCC) Palmerston North is situated on the banks of the Manawatu River at the foot of the Tararua Ranges, at the southern end of the North Island. Palmerston North covers an area of 32,594 hectares, and is the geographical centre of New Zealand. The population of Palmerston North is 67,000 and is expected to grow by another third by 2026. The city enjoys a mild climate and is well known for its gardening culture - there are extensive suburban areas with public and private gardens in the city which impacts on water requirements. Palmerston North, like Kapiti Coast, has a mixture of productive soil types that are generally particularly well suited for horticultural activities. Water use, domestic and all other uses, for the city is estimated at 423 litres/pp/pd. The Council has a demand management programme focused on reducing outdoor water use over summer and a leak reduction study. The Council’s Water Asset Management Plan (2008) states that Council has a policy of encouraging energy efficiency in plant and pump operations for water supply. The water treatment system consists of a primary secondary UV filtration treatment plant. The water supply to the main urban area of Palmerston North is sourced from the Turitea Stream as well as by four artesian bores at times of high demand. There are two storage dams at Turitea to help manage supply from the Turitea Stream. The analysis of data from PNCC is summarised in Table 3.
Table 3 Summary of the Palmerston North Energy/Water Use Relationship
Stage Energy (KWh) Energy %
Water Pumping 1,123,556 21.26%
Water Treatment 413,056 7.8%
Wastewater Pumping 478,056 9.03%
Wastewater Treatment 3,278,056 61.91%
Total Electricity 5,294,724
Energy (kWh) Volume (m3) Energy-Water Ratio (kwh/m3)
Water Cycle 1,538,612.00 10,391,426 0.15
Wastewater Cycle 3,756,112.00 11,567,000 0.32
Population 67,300 Notes: Expected to grow by 33% in the next 18 years (2026).
kWh per-capita 78.67
Energy-Water Relationships in Reticulated Water Infrastructure Systems: WA7090/2
Page 12

PNCC’s water supply shows a kWh per capita figure of 78.67. This is the annual energy requirement per capita for PNCC’s water infrastructure. The highest energy use occurs with wastewater treatment (61.91%), followed by water pumping (21.26%), the wastewater pumping (9.03%) and water treatment (7.8%). The total amount of electricity used annually is 5,294,724 kWh. This amount of energy was used to supply 1,538,612.00 m3 of potable water and to treat 3,756,112.00 m3 of wastewater. The energy/water ratio for supply was 0.15 kWh/m3 while wastewater treatment was 0.32 kWh/m3. The most energy intensive part of the system is for wastewater treatment. There are 22 pumping stations and 358 km of mains piping. The plant recently had a $15.5 million upgrade which included a phosphorus treatment system in order to improve the standard of wastewater being disposed of into the Manawatu River. Palmerston North, which manages water/wastewater in-house, has a lower energy rate for water and wastewater pumping in respect to the other councils in this study, even though the city is located on a flat plain, with essentially no scope for utilising gravity fed pumping options. This can, in part, be traced back to 1996 when the dam water supply (main water resource for the Council) switched from a concrete wedge to a concrete rock-fill structure, the first for a New Zealand site. This new concrete structure extends at a 30 degree angle from the top of the old dam to a height of 140.5 meters and the extra height provides increased pressure through the water treatment plant removing the need for year round pumping” Then in 2002, a mini-hydro power station was installed which takes water that would otherwise spill over the dam and turns the Turitea complex into a self sufficient electricity system. This has shown to lower costs to the community and pumps an estimated 1.2 gWh hours of electricity back into the Council’s grid every year, enough electricity to power 100 homes. The four artesian bores used during peak demand times are, by comparison, energy intensive compared to the usual supply.
Energy-Water Relationships in Reticulated Water Infrastructure Systems: WA7090/2
Page 13

4.3 Kapiti Coast District Council (KCDC) Located on the lower West Coast of the North Island, the Kapiti District covers 40 kilometres of coastal plain. Its eastern boundary is the Tararua Ranges and to the west the Tasman Sea. The district is settled around the coastline townships of Paekakariki, Raumati, Paraparaumu, Waikanae and Otaki. The major commercial and retail centre is Paraparaumu and its distinct rural areas - Te Horo, Waitohu and the Hautere Plains - are intermingled with the township settlements to the north. The population of 46,000 is likely to grow as Kapiti is a popular retirement area and a commuter town for Wellington. The moderate growth projection for Kapiti to 2026 is 57,410. (Stats NZ) KCDC has a focus on reducing water demand. The current high water usage of 650 l/pp/pd is significantly due to the sandy soils and dry summer climate and hence high outdoor use for gardens. Winters are relatively mild. The Kapiti water supply system comprises three surface water intakes, eight groundwater bores, four treatment plants and eight pumping stations, ten service reservoirs, trunk mains and distribution reticulation. The four separate water supply and sewer networks in operation in Kapiti with 10-15km distant between them reflects the Council’s commitment to taking a “catchment based approach” to meeting water demands which is, in particular, an expectation of local iwi. This approach is intended to minimise the distance to be pumped. Table 4 below summarises how much water is supplied through the various water supply systems in Kapiti as well as the source water.
Table 4: Summary table of water source and level of supply for Kapiti
Water Supply Region Water Source Annual Water Supply (m3)
Waikanae 90% River, 10% Bore(only when needed) 2,159,241
Paraparaumu/Raumati 90% River, 10% Bore(only when needed) 3,581,253
Otaki 100% Bore 1,593,492
Paekakiriki 40% Stream, 60% Shallow Bore 240,989
Hautere 100% Bore (restricted supply) 242,755
Total Water 7,817,730
Kapiti’s future supply is a critical issue for the Council with the expected capacity likely to be met within the next two to three years. Restrictions on water-take from the Waikanae river supply require a shift to bore water extraction during dry periods of the year. The energy required to extract this bore water is higher than from the river. The Council is also considering the option of increasing storage capacity by building a dam.
Energy-Water Relationships in Reticulated Water Infrastructure Systems: WA7090/2
Page 14

Meeting peak demand over summer is a serious concern. The high number of visitors and additional residents over the summer periods give rise to a high variance in water demands between summer and winter. There are limited further supply options available to the Council in the Waikanae catchment. The Council, which owns, manages and maintains its own water/wastewater assets, has more than 15,000 wastewater connections and 310 kilometres of pipes. The principal wastewater treatment in the District is to tertiary standard, with some secondary treatment. A number of properties also use septic tanks. The Council is considering spending $2 million on treatment upgrades over the next couple of years. The analysis of data from KCDC is summarised in table 5.
Table 5: Summary of Kapiti Coast Energy/Water Use Relationship
Stage Energy (kWh) Energy %
Water Pumping 118,590 1.69%
Water Treatment 3,353,589 47.69%
Wastewater Pumping 777,493 11.06%
Wastewater Treatment 2,782,749 39.57%
Total Electricity 7,032,412
Energy (kWh) Volume (m3)
Energy-Water Ratio (kWh/m3)
Water Cycle 3,472,179 7,817,730 0.44
Wastewater Cycle 3,560,233 4,025,000 0.88
Population 46,200 Has a rapidly growing population
kWh per capita 152.22
Unlike the other case studies, KCDC’s highest energy use is in water treatment and reflects the poor drinking quality standard of the base water sources. Generally most schemes are UV treated. Kapiti’s total water system shows a kWh per capita figure of 152.22, the highest of the four council case studies. This is the amount of energy per person required annually for water infrastructure. The highest sector of energy use occurs in treating water (47.69%), followed by wastewater treatment (39.57%), then wastewater pumping (11.06%) and water pumping (1.69%). The total amount of electricity used annually is 7,032,421 kWh. This amount of energy was used to supply 3,472,188 m3 of potable water and to treat 3,560,233 m3 of wastewater. The energy/water ratio for supply was 0.44 kWh/m3 while wastewater treatment was 0.88 kWh/m3.
Energy-Water Relationships in Reticulated Water Infrastructure Systems: WA7090/2
Page 15

KCDC regularly upgrades motors – and pumps – in a bid to obtain greater efficiency out of the system. They also pump water into reservoirs at off peak usage times to reduce water supply energy costs. When supplementing supply, the choice of bores and relative energy efficiency is considered. The river is always the first choice of supply because it uses less energy.
4.4 Nelson City Council (NCC) Nelson is one of the sunniest regions of New Zealand, situated at the top of the South Island. Warm, dry and settled weather predominates during summer. Winter can be cooler, particularly in the morning, but overall the weather still remains mild. The city itself is situated on a narrow coastal plain backed by mountains, the northern end of the Southern Alps. Nelson has a mix of soil types, with mildly acidic soils supporting a strong horticulture and agriculture industry base. The population base of Nelson City is 46,000 but is substantially exceeded in the summer months as Nelson is a popular tourist destination. It manages this through the use of regular summer water restrictions, resulting in a yearly average low level of domestic water use of 160 l/pp/pd. Nelson has limited access to further future water supply sources but the Maitai and Roding Rivers can provide sufficient water to meet the City’s needs until 2060. Nelson City has become increasingly focused on pursuing demand management and energy efficiency options for the city, for example, identifying appropriate measures within the water system to both reduce water loss due to leakage, and household water demand. To upgrade water quality, NCC has invested nearly $27 million in the Tantragee Ultrafiltration Potable Water Plant and associated trunk mains. There are 369 km of water supply pipes with 9 pump stations serving the city. Nelson has two main wastewater treatment systems: Nelson North Treatment Plant, nine kilometers out of Nelson (will reach treatment load capacity in 2020) and Bells Island Treatment Plant (of which only 45% of plant wastewater is from Nelson.). These systems use 360km of wastewater pipes with 27 pumping stations. Nelson owns, manages and maintains its water/wastewater assets and systems. An anticipated spend of $38.4 million over the next 12 years is required for wastewater treatment which includes an upgrade of the Bells Island Wastewater Treatment Plant and a new duplicate pumping main to Bells Island (Nelson City Council is a 45% contributor to this regional facility).
Energy-Water Relationships in Reticulated Water Infrastructure Systems: WA7090/2
Page 16

The analysis of data from Nelson is summarised in Table 6.
Table 6: Summary of Nelson City Council’s Energy/Water Use Relationship
Stage Energy (KWh) Energy %
Water Pumping 1,247,058 21.02%
Water Treatment 1,884,634 31.77%
Wastewater Pumping 643,940 10.85%
Wastewater Treatment 2,157,313 36.36%
Total Electricity 5,932,945
Energy (kWh) Volume (m3)
Energy-Water Ratio (kWh/m3)
Water Cycle 3,131,692 8,115,000 0.39
Wastewater Cycle 2,801,253 6,082,550 0.46
Population 41,000 Expected to grow from 46,000 to 53,000 in the next 15 years (2023)
kWh Per Capita 114.71
Nelson’s water supply shows a kWh per capita figure of 114.71. This is the amount of energy used per capita per annum for the water infrastructure. As with all the other case studies the highest energy use occurs with wastewater treatment (36.36%), followed by water treatment (31.77%), then water pumping (21.02%) and wastewater pumping (10.85%). The total amount of electricity used annually was 5,932,945 kWh. This amount of energy was used to supply 8,115,000 m3 of potable water and to treat 6,082,550 m3 of wastewater. The energy/water ratio for supply was 0.39 kWh/m3 while wastewater treatment was 0.46 kWh/m3. Like Kapiti, Nelson’s water treatment energy requirements were relatively high at 31.77%, reflecting the high level of treatment required from the rivers. Important geographical features that impact on the energy requirements for Nelson’s supply include the fact that the city is located on a narrow coastal plain. Therefore the options for locating water and wastewater services across the City have been limited. Water supply has to be pumped to be distributed while wastewater has to be pumped two or three times to get it to the two central points where the main treatment plants are located. This accounts in part for the relatively high energy intensity of the system. As an energy efficient practice, the Council pumps water into reservoirs at off peak times which can then be gravity fed.
Energy-Water Relationships in Reticulated Water Infrastructure Systems: WA7090/2
Page 17
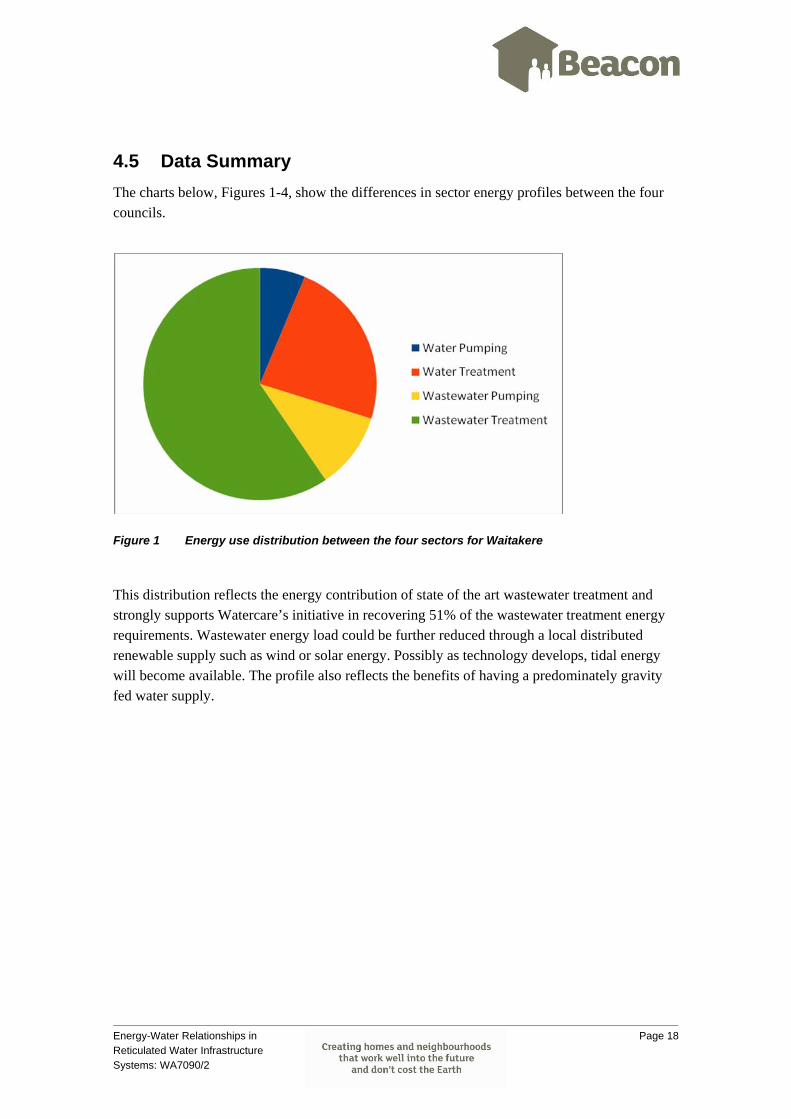
4.5 Data Summary The charts below, Figures 1-4, show the differences in sector energy profiles between the four councils.
Figure 1 Energy use distribution between the four sectors for Waitakere
This distribution reflects the energy contribution of state of the art wastewater treatment and strongly supports Watercare’s initiative in recovering 51% of the wastewater treatment energy requirements. Wastewater energy load could be further reduced through a local distributed renewable supply such as wind or solar energy. Possibly as technology develops, tidal energy will become available. The profile also reflects the benefits of having a predominately gravity fed water supply.
Energy-Water Relationships in Reticulated Water Infrastructure Systems: WA7090/2
Page 18

Figure 2 Energy distribution between the four sectors for Palmerston North
The water pumping energy requirement reflects the lack of natural opportunity for gravity fed systems. However, pumping to a dam to use off-peak power has a cost benefit if not necessarily an energy saving benefit.
Figure 3 Energy distribution between the four sectors for Kapiti
Energy-Water Relationships in Reticulated Water Infrastructure Systems: WA7090/2
Page 19

KCDC’s energy profile is unusual with water treatment featuring strongly. It is acknowledged that the water standard is poor in relation to drinking water it would still be worthwhile giving further consideration as to why it is such a low percentage of the energy profile.
Figure 4 Energy distribution between the four sectors for Nelson
NCC’s energy profile is more evenly distributed than the other councils, although again, probably because of the river-fed supply, water treatment is high. The data from the four case study councils is compared in Table 7 below. From the collated data, the energy efficiency of the water and wastewater systems of the four councils and the total kWh/ per capita for each overall system can be compared. Their relative overall efficiency is highlighted as kWh/Capita per annum. The water infrastructure contribution to CO2 equivalent greenhouse gases for each council has also been included.
Table 7: Summary data including per capita energy use and total CO2 emissions for the four case study council data.
Nelson Waitakere Kapiti Coast
Palmerston North
Population Served 41,000 193,400 46,200 67,300
Total Water Supplied (m3/yr) 8,115,000 16,387,101 7,817,730 10,391,426
Total Wastewater Treated (m3/yr) 6,082,550 12,570,603 4,025,000 11,567,000
Water Supply (kWh/yr)
Water Supply Pumping (kWh/yr) 1,247,058 853,578 118,590 1,125,556
Energy-Water Relationships in Reticulated Water Infrastructure Systems: WA7090/2
Page 20

Water Supply Treatment (kWh/yr) 1,884,634 3,180,600 3,353,589 413,056
Total 3,131,692 4,034,178 3,472,188 1,538,612
Wastewater (kWh/yr)
Wastewater Pumping (kWh/yr) 643,940 1,439,948 777,493 478,056
Wastewater Treatment (kWh/yr) 2,157,313 8,060,030 2,782,740 3,278,056
Total 2,801,253 9,499,978 3,560,233 3,756,112
Energy Per Capita (kWh/Capita)
Water Supply (kWh/Capita) 76.38 20.86 75.15 22.86
Wastewater (kWh/Capita) 68.32 49.12 77.06 55.81
Total (kWh/Capita per annum) 114.71 69.98 152.22 78.67
Total Energy (kWh/yr) 5,932,945 13,534,156 7,032,412 5,294,724
GHG Emissions (Metric Tons of CO2) 1,240 2,829 1,470 1,107
Water Energy Efficiency (kWh/m3) 0.39 0.25 0.44 0.15
Wastewater Energy Efficiency (kWh/m3) 0.46 0.76 0.88 0.32
Relative energy efficiency is also depicted in Figure 5.
Figure 5: Figure demonstrating the kWh per capita figure for water supply and wastewater from the four case study areas.
Energy-Water Relationships in Reticulated Water Infrastructure Systems: WA7090/2
Page 21

Overall WCC has the most efficient system with PNCC not far behind. If the energy generated through the Watercare’s wastewater treatment is included in the calculation, then WCC’s overall water infrastructure would be well ahead in terms of energy efficiency. As wastewater treatment was the highest segment for three of the four councils, it demonstrates the value in capturing waste gas, primarily methane, for alternative uses. As WCC and PNCC had the larger populations, it could be extrapolated that systems serving larger populations are more energy efficient, but given the low sample, number further study would be needed to substantiate that claim. Energy associated with water treatment was a major contributor to KCDC’s energy profile and does re-affirm the policy approach they are taking, trying to introduce rainwater tanks to provide water for non-potable uses and supplement reticulated supply, especially as much of the potable water is used to irrigate their dry sandy soils. Nelson’s water supply, also from rivers, also needed considerable treatment but for Nelson the supply issue was aggravated by the city’s topography, requiring water supplies to be pumped considerable distances. Of interest was the low level of energy used by PNCC for water treatment, despite being taken from the Turitea Stream and being subjected to alum-flocculation gravity filtration. Wastewater pumping was consistently a low contributor to overall energy use, being between 9% and 11% for the case study councils.
Energy-Water Relationships in Reticulated Water Infrastructure Systems: WA7090/2
Page 22

5 Discussion Energy and water are both resources that are coming under increased pressure, globally and locally. Efficiency of both design and operation is required, to reduce environmental and financial costs from urban reticulated water systems. Monitoring and analysis is required to better understand where high costs occur and wherever practical, design them out of the system. A design consideration for smaller communities should be how best to replicate or substitute for the advantages offered by larger populations and at what scale those amendments could best be achieved. Any system that offers co-generation or can utilise locally produced renewable energy sources will reduce the energy burden on the water infrastructure. Energy expended in wastewater pumping was not a major component of the four case studies. Energy expended in the treatment of wastewater was relatively high for three of the four case studies. This reflects the fact that wastewater in these communities is treated to tertiary level with direct environmental benefits. However, the high energy associated with this level of treatment indicates the opportunity for design and operational improvements to be made. Otherwise the system addresses one set of environmental problems by dealing with water pollution, while creating another being resource use inefficiency. This study, both the background research and local data analysis, highlighted a number of ways energy associated with water infrastructure could be reduced. 1) Water Demand Management Options Managing down demand will always be top of the list for reducing energy requirements. A wide range of demand management options are available from on-site supplementary supply to more efficient water fitments and fittings. Reduction in water requirements will have a “flow” on effect of reducing energy use. A full account of demand management options is available in Slowing the Flow (Lawton et al, 2008).
2) Utilising Energy Audits and Benchmarking Tools The lack of in-depth knowledge of the overall energy utilisation of water infrastructure is of concern. Councils that are contributing to ICLEI’s studies or organisations like Watercare who are making that information public are in the minority. Monitoring and benchmarking are considered useful tools in providing baseline performance data against which future strategic decisions are able to be made. In the United States, the Consortium for Energy Efficiency has taken on the initiative of creating an industry-wide metric which describes the energy performance of water and wastewater facilities. A national body such as Water New Zealand could take on that role here. Energy-Water Relationships in Reticulated Water Infrastructure Systems: WA7090/2
Page 23

3) Maintenance of Pumps and Motors Once constructed, there are limited ways of maximising the efficiency of water supply and wastewater systems. A key approach is to ensure pumps are maintained at their optimal level of efficiency. Adjusting speed drivers can help monitor and manage energy use of the motors by letting motors operate much more precisely and not over run unnecessarily. 4) Reduce Peak Demand Times The National Resource Defence Council report, Energy down the Drain (2004), notes that the energy costs for water systems depend heavily on whether energy is consumed during on-peak or off-peak periods. Where suitable, providing limited storage capacity as in Palmerston North would enable water to be pumped from bores off-peak which could then be gravity fed as required.
5) Co-Gen from Wastewater Biogas Wastewater biogas is an on-site energy resource can be used instead of remotely sourced natural gas or electricity. The biogas methane is collected during the anaerobic digester stage of a wastewater treatment process. In this process, acid-forming bacteria break down organic materials which convert into methane and carbon dioxide gases. Not only is this a significant, self-sufficient energy source, it also minimises the processes damage to the atmosphere by capturing the methane, which is ca.21 times more potent greenhouse gas than CO2. Like Watercare, any system with anaerobic digesters should be collecting biogas for energy use.
6) Other On-Site Renewable Energy Sources Other local renewable energy sources can be provided for energy intensive processes, an example being the provision of wind-power to the desalination plant in Perth. On-site renewable energy generation through wind or solar may become a common feature as energy prices rise. PNCC has implemented a closed loop system using a mini-hydro dam, providing a degree of self-sufficiency in water supply. 7) Consideration of a secondary supply The energy required to treat water to drinking water standards is clearly a significant cost to some communities such as Kapiti. It raises a fundamental question about why in New Zealand we treat water to a high potable standard for the majority of household uses, (or in Kapiti’s case, mainly outdoor use) when untreated water would suffice. It suggests that for some communities serious consideration should be given to the provision of a secondary water supply source which doesn’t require treatment to that level. This could be provided by the council or where suitable, sourced directly from rainwater capture. KCDC has recognised this approach in its proposed District Plan change to require rainwater tanks to be installed with all future new homes.
Energy-Water Relationships in Reticulated Water Infrastructure Systems: WA7090/2
Page 24

8) Re-use of water, especially where wastewater is tertiary-treated. In general, New Zealand provides a high level of wastewater treatment, required for protecting our waterways but it is very energy intensive. Instead of being discharged to waterways, tertiary-treated wastewater could be used for non-potable uses, in particular irrigation, instead of using treated potable water. In summary This study concludes that there is a growing awareness of energy requirements in water infrastructure both in New Zealand and overseas. Better monitoring and reporting systems will help focus on design and operational changes that improve efficiency. In particular, considering energy and water as one system will ensure future water infrastructure doesn’t over-burden the environment or our finances.
There are clear linkages between urban water and wastewater systems and energy and carbon emissions.
There are significant energy costs/carbon emissions in one or more parts of the water/waste water equation.
That topology, water source, distance of waste water treatment facilities and level of treatment of water and sewerage will directly affect energy costs.
That reuse of sewerage can offset carbon emissions.
That there are ways to reduce the energy costs:
- By water demand management (water efficiency = energy efficiency)
- By choosing energy efficient infrastructure when planning new facilities.
That, according to international assessments, there are efficiencies in energy use to be made in how infrastructure is managed
Energy-Water Relationships in Reticulated Water Infrastructure Systems: WA7090/2
Page 25

6 References Auckland Water Industry. (2006). Annual Performance Review 2005/06.
Auckland Water Industry. (2007). Annual Performance Review 2006/07.
Aulakh, H. and Tries, J. (1998). Energywise Monitoring Quarterly, Issue 11, June 1998. Wellington, NZ: EECA.
Burton, F. L. (1996). Water and Wastewater Industries: Characteristics and Energy Management Opportunities. Electric Power Research Institute Report CR-106941, p.ES-1.
Los Altos, CA: Electric Power Research Institute.
California Energy Commission. (2005). California’s Water-Energy Relationship. California, United States: California Energy Commission.
California Institute for Energy Efficiency. (2000). Methodology for Analysis of the Energy Intensity of California's Water Systems, and an Assessment of Multiple Potential Benefits through Integrated Water Efficiency. California, United States: CIEE, Ernest Orlando Lawrence Berkeley Laboratory.
CCP Australia. E-18 Water Supply and Sewage Treatment. Australia: CCP.
Consortium for Energy Efficiency. (2009). CEE Water and Wastewater Initiative Aids Municipalities. Website article, viewed 8/4/09, source: http://www.cee1.org/resrc/news_items/WaterTreatment.html
Dawson, M. (2009). Personal Communication.
Enterprise North Shore and Economic Matters. (2008). Economic Futures for North Shore City. Source: http://www.scribd.com/doc/7919762/ENS-Economic-Futures-Report-2008
Isaacs, N. et al. (2006). Energy use in NZ Households – Report on the Year 10 Analysis for the Household Energy End Use Project (HEEP). BRANZ Study Report SR155. Wellington: BRANZ.
Kenway, S.J., Turner, G.M., Cook, S. and Baynes, T. (2008). Energy Use in the Provision and Consumption of Urban Water in Australia and New Zealand. National Flagship Research: Water for a Healthy Country*. Melbourne, Australia: CSIRO.
Lawton, M. et al. (2008) Best Practice Water Efficiency Policy and Regulation. Report WA7060/3 for Beacon Pathway Limited.
Lawton, M., Birchfield, D. and Wilson D. (2008). Slowing the Flow: A Comprehensive Demand Management Framework for Reticulated Water Supply. Report WA7060/4 for Beacon Pathway Limited.
Lawton, M. (2007). Scoping Document and Recommended Plan for Water Demand Management Initiatives In Waitakere City; 2007 Onwards. Auckland: Waitakere City Council.
Energy-Water Relationships in Reticulated Water Infrastructure Systems: WA7090/2
Page 26

Lloyd, S., Wong, T. H. F. and Chesterfield, C. J. (2001). ‘Opportunities and impediments to water sensitive urban design in Australia.’ in Proceedings of The Second South Pacific Stormwater Conference: rain the forgotten resource, pp. 302 – 309. Auckland, New Zealand.
Lucas, S. Coombes, P. and Sharma, A.K. (2007). The impact of diurnal water use patterns, demand management and rainwater tanks on water supply network design. Sydney.
Ministry for the Environment. (2007). Environment New Zealand 2007. Publication number ME 847. Wellington: Ministry for the Environment.
Mitchell, C et al. (2007). Costing for Sustainable Outcomes in Urban Water Systems: A Guidebook. Research Report 35. Sydney: Cooperative Research Centre for Water Quality and Treatment, Institute for Sustainable Futures, University of Technology.
CSIRO. (2005). National Flagship Research: Water for a Healthy Country 2005. Water-energy futures for Melbourne: the effect of water strategies, water use and urban form. Melbourne, Australia: CSIRO.
National Resource Defense Council. (2004). Energy Down The Drain: The Hidden Costs of California’s Water Supply. California, United States: National Resource Defense Council.
Pepper, C. et al. (2008). Water Asset Management Plan, prepared for Palmerston North City Council.
Shaver, E. (2000). Low Impact Design Manual for the Auckland Region. Auckland, New Zealand: Auckland Regional Council.
Smith, N.J. and McDonald, G.W. (2008). Environment-Economy Future Model for Gisborne District. NZCEE Research Monograph Series – No. 5. Palmerston North: NZCEE. ISBN 978-0-9582782-6-3. ISSN 1176-7251.
van Roon, M. R. and van Roon, H. (2005). Low Impact Design and Development Principles for Assessment of Planning, Policy and Development Outcomes. Working Paper 051. Centre for Urban Ecosystem Sustainability and Department of Planning, University of Auckland and Landcare Research Ltd.
Watercare Services Ltd. (2008). Annual Report 2008. Auckland, New Zealand: Watercare Services Ltd.
Watercare Services Limited. (2004). From The Sky To The Sea - The Auckland Water Management Plan: A Region-Wide approach to the management of Auckland’s Reticulated Water Resources. Auckland, New Zealand: Watercare Services Ltd.
World Business Council for Sustainable Development. (2009). Water, Energy and Climate Change – A Contribution from the Business Community. World Business Council for Sustainable Development.
Energy-Water Relationships in Reticulated Water Infrastructure Systems: WA7090/2
Page 27