energy star computer monitor test methodology craig hershberg us epa [email protected]
Post on 18-Dec-2015
215 views
TRANSCRIPT


2
Objectives of Today’s Presentation
• Provide an overview of the final test methodology
• Share key points of discussion during the test methodology development phase, and their resolutions
• Present and gather industry input on two remaining issues regarding multiple measurements

3
Test Methodology Goals
• Develop sound procedure for testing computer monitors in On Mode; incorporate existing methodologies for Sleep and Off
• Design a methodology that is comprehensive and produces repeatable test results
• Decrease burden on manufacturers by referencing, where applicable, existing and widely used industry standards for testing– VESA– IEC

4
Development Phase
• Extensive input from stakeholders– Manufacturers, trade associations, European and
Japanese stakeholders, TCO Development• Various drafts broadly distributed for comment
during 9-month development phase• Final test methodology emailed to stakeholders in
February 2003 – minor changes made since then• “Development Summary” captures key additions
and changes that led to final methodology– Emailed to stakeholders and available on Web site– Basis for today’s presentation

5
Non-Energy Factors

6
Removed References to Three Non-Energy Factors
• Three non-energy factors from Draft 1 have been removed from Draft 2– Defective pixels (no effect on power
consumption)– Contrast ratio (VESA Flat Panel Display
Measurements (FPDM) Standard 2.0 does not define parameters for measuring contrast ratio)
– Warranty (market-specific so hard to implement and police for global products like computer monitors)

7
Retained Two Non-Energy Factors
• Two non-energy factors originally included in Draft 1 of the specification have been moved to the test methodology– Refresh rate– Luminance (brightness)
• Ensure all computer monitors are being tested under similar conditions

8
Refresh Rate
• Different refresh rates given for LCDs and CRTs, to accommodate differences in technologies
• LCDs: Measured at 60 Hz, unless a different refresh rate is specifically recommended by the manufacturer
• CRTs: Measured at 75 Hz (long-time norm in North America)– Discussion over use of 75 Hz or 85 Hz, which is
consistent with TCO ’99 and general practice in Europe
– 75 Hz chosen because most appropriate for power measurement purposes, whereas 85 Hz better for ergonomic purposes (reduces flicker, but increases power consumption)

9
Luminance (Brightness)
• Levels chosen that support the implementation of a performance-based specification– Allow for comparisons of power use between computer
monitors when providing the same visual experience for the user
• CRTs: Measured at minimum of 100 candelas per square meter (cd/m2)
• LCDs: Measured at minimum of 175 cd/m2
– Higher than CRTs because 100 candelas per square meter is much easier for LCDs to attain than for CRTs
• All luminance test patterns borrowed from VESA FPDM Standard 2.0
10
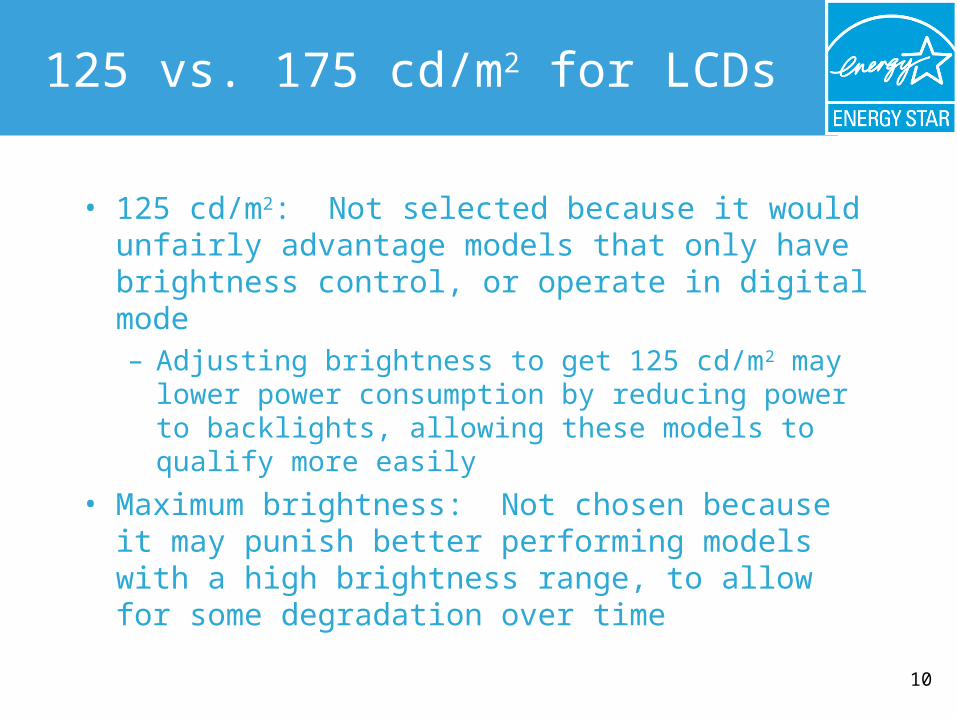
125 vs. 175 cd/m2 for LCDs
• 125 cd/m2: Not selected because it would unfairly advantage models that only have brightness control, or operate in digital mode– Adjusting brightness to get 125 cd/m2 may lower power
consumption by reducing power to backlights, allowing these models to qualify more easily
• Maximum brightness: Not chosen because it may punish better performing models with a high brightness range, to allow for some degradation over time

11
Dark Room Conditions and Color Controls and
Peripherals

12
Dark Room Conditions
• Suggested by several members of industry for light measurements
• References current industry norms through VESA FPDM Standard 2.0
13
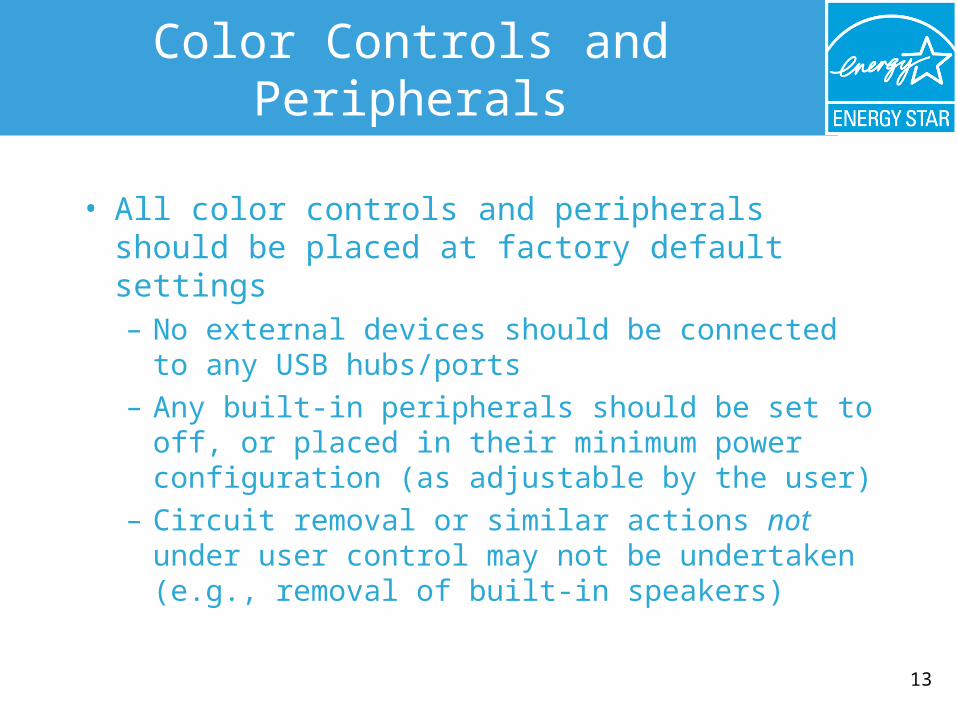
Color Controls and Peripherals
• All color controls and peripherals should be placed at factory default settings– No external devices should be connected to any
USB hubs/ports– Any built-in peripherals should be set to off, or
placed in their minimum power configuration (as adjustable by the user)
– Circuit removal or similar actions not under user control may not be undertaken (e.g., removal of built-in speakers)

14
DVI Inputs and Digital Monitors

15
Addressing DVI Inputs and Digital Monitors
• Added a clarifying statement re: stable power measurements in Off Mode– Test methodology for all three operating modes states that
power measurements should be taken once the power readings are stable
– Power readings never quite stabilize due to DVI input check cycle
– For models with DVI inputs, manufacturers should ignore the DVI input check cycle when measuring power consumption in Off
• Included information on how to test digital only interface monitors– Monitors with both analog and digital interfaces should be
tested in analog interface– See footnote 1

16
Multiple Measurements

17
Data Variability Analysis
• First round of testing: Requested testing of 5 units at each of 3 different voltage/frequency combinations– 100 Volts/50 Hz, 115 Volts/60 Hz, 230 Volts/50 Hz
• Data analysis: Considered the variability of manufacturers’ test data provided at each of the voltage/frequency combinations
• Findings: 1) Much greater variation by sample than by voltage; 2) In On Mode, power use was often higher at 115 than 230; and 3) More data points submitted by manufacturers at 115 than other voltages

18
Active Power Variability Among Different Samples
Variation of Active Power Among Samples of Each Model / Active Power
0%
5%
10%
15%
20%
25%
30%
35%
1 5 9 13 17 21 25 29 33 37 41 45 49 53 57 61 65 69 73 77 81 85 89 93
Model
Act
ive
Po
wer
Var
iati
on
/ A
ctiv
e P
ow
er
• Up to 30% variability by sample for some models

19
Active Power Variability Among Different Voltages
Variation of Active Power Among Voltages of Each Model / Active Power
0%
1%
2%
3%
4%
5%
6%
7%
1 4 7 10 13 16 19 22 25 28 31 34 37 40 43 46 49 52 55 58 61 64 67 70 73 76 79 82 85 88 91
Model
Act
ive
Po
wer
Var
iati
on
/ A
ctiv
e P
ow
er
• Less than 4% variability by voltage for majority of models

20
Reduced Number of Measurements per Model
• Second round of testing: Requested that interested manufacturers only test 3 units at 115 Volts/60 Hz
• Overall testing reduced from 15 data points per model to 3 data points per model
21
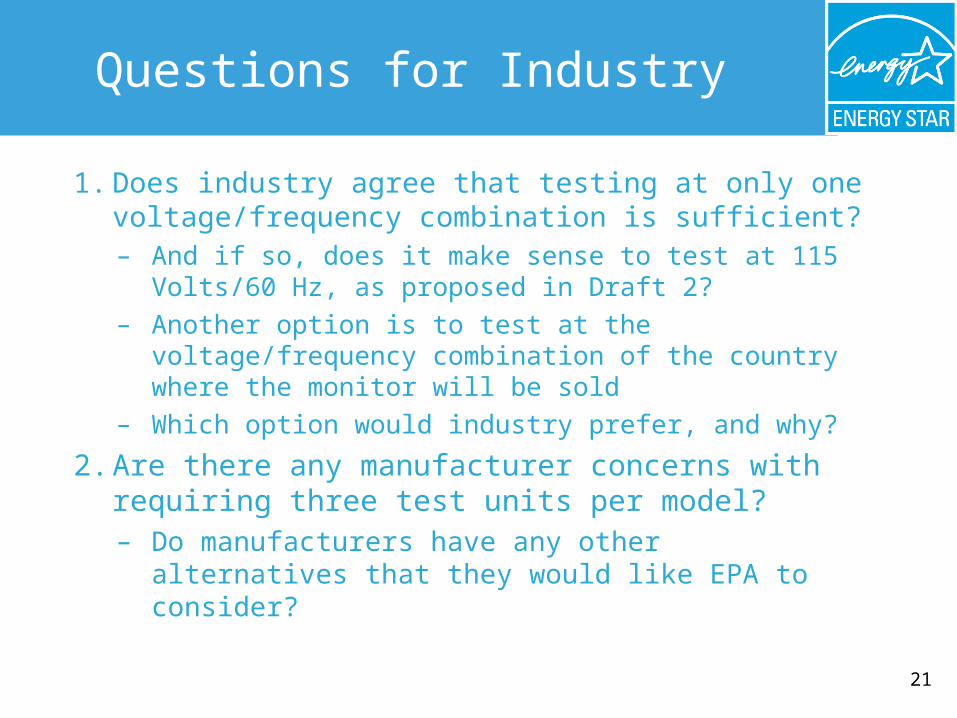
Questions for Industry
1. Does industry agree that testing at only one voltage/frequency combination is sufficient?– And if so, does it make sense to test at 115 Volts/60
Hz, as proposed in Draft 2?
– Another option is to test at the voltage/frequency combination of the country where the monitor will be sold
– Which option would industry prefer, and why?
2. Are there any manufacturer concerns with requiring three test units per model?– Do manufacturers have any other alternatives that
they would like EPA to consider?