basic fertilizer chemicals - epa.gov
TRANSCRIPT
Development Document for Effluent Limitations Guidelines
and New Source Performance Standards for the
BASIC FERTILIZER CHEMICALS
Segment o.,f the
Fertilizer Manufacturing
Point Source Category
MARCH 1974
U.S. ENVIRONMENTAL PROTECTION AGENCY
Washington, D.C. 20460
EPA 440/1-74/011a
DEVELOPMENT DOCUMENT
for
EFFLUENT LIMITATIONS GUIDELINES
and
NEW SOURCE PERFORMANCE STANDARDS
for the
BASIC FERTILIZER CHEMICALS SEGMENT OF THE FERTILIZER MANUFACTURING
POINT SOURCE CATEGORY
Russell E. Train Administrator
Roger Strelow Acting Assistant Administrator for Air & Water Programs
Allen cywin Director, Effluent Guidelines Division
Elwood E. Martin Project Officer
March, 1974
Effluent Guidelines Division Office of Air and Water Programs
u.s. Environmental Protection Agency Washington, D. c. 20460
For sale by the Superintendent of Documents, U.S. Government Prlotlng Office, Washlogton, D.C. 20402 • Price $2

ABSTRACT ----~--.. This document presents the findings of an extensive study of th~ fertilizer industry for the purpose of developing effluent limitation guidelines· for existing point sourcEs and standards of performance and pretreatment standards for new sources to implement sections 304, 306 and 307 of the Federal water Pollution Control Act, as amended (33 u.s.c. 1551, 1314, and 1316, 86 Stat. 816 et. seg.) (the "Act").
The study included a detailed and extensive exemplary plant survey, contacts with consultants and government officials, and literature search.
The industry survey involved data gathering, sample collection and analysis, and personal visitation with respons~ble plant operating personnel to obtain first-hand information on treatment technology in commercial use and technology in development and pilot plant stages.
The three main outputs from the study .were: industry categorization, recommendations on effluent guidelines, and definition of treatment technology. The fertilizer industry was divided into five categories for more meaningful separation and division of waste water treatment and development of effluent guidelines. These subcategories are phosphate, ammonia, urea, ammonium nitrate and nitric acid products. The phosphate subcategory includes all anciliary operations nec~ssary for phosphate production (e.g. sulfuric acid and phosphoric acid). Effluent guidelines for best practicable control technology currently available, best available technology economically achievable, and new source performance standards are recommended for each category.
Treatment technologies such as either in-process or end-ofprocess add on units are available or are in advanced development stages to enable existent and future fertilizer plants to meet the recommended effluent guidelines.
iii

II
III
IV
V
VI
VII
VIII
IX
X
XI
XII
XIII
XIV
Conclusions
Recommendations
Introduction
CONTENTS
Industry Categorization
waste Characterization
Selection of Pollutant Parameters
Control and Treatment Technology
cost, Energy and Nonwater Quality Aspect
Effluent Reduction Attainable Through the Application of the Best Practicable control Technology currently Available -- Effluent Limitations Guidelines
Effluent Reduction Attainable Through the Application of the Best Available Technology Economically Achievable -- Effluent Limitations Guidelines
New source Performance Standards
Acknowledgments
Bibliography
Glossary
V
1
3
7
65
69
81
95
131
143
151
155
159
161
165

1.
2.
3.
4.
5.
6.
7.
a.
9.
10.
11.
12
13.
14.
15.
16.
17.
18.
19.
20.
21.
22.
23.
24.
25.
26.
27.
FIGURES
Nitrogen Fertilizers Plant Locations
Phosphate Fertilizers Plant Locations
Sulfuric Acid Plant Single catalysis
Sulfuric Acid Plant Double catalysis
Rock Grinding
Wet Process Phosphoric Acid HlSO!!, Acidulation
NPK Process Nitric Acid Acidulation
Wet Phosphoric Acid Concentration
Merchant Grade Phosphoric Acid Clarification
Normal Superphosphate
Triple Superphosphate (Run-of-Pile R.O.P.)
Granulated Triple Superphosphate
Monoamrnonium Phosphate Plant
Diammonium Phosphate Plant
Ammonia Plant
Urea Plant
Ammonium Nitrate Plant
Nitric Acid Plant
Sulfuric Acid Effluent Control
Pond Water Treatment
Gypsum Pond Water seepage Control
DAP Self Contained Process
Wet Process Phosphoric Acid system
sulfuric Acid Dilution with Pond Water
Ammonia/Condensate Stripping
Integrated Ammonia/Condensate Stripper Unit
Ammonia/Condensate Air stripping
vi
17
21
26
27
31
34
36
38
40
42
45
47
50
51
54
58
61
63
97
101
104
106
108
109
112
113
115
28. Urea Hydrolysis 119
29. urea Hydrolysis 120
30. Biological Treatment 124
31. Ion Exchange 126
32. Oil/Grease Removal system 128
33. Ammonium Nitrate Effluent Utiliz.ation 129
vii

TABLES
1. Integration of Production in the Fertilizer Industry
2. Water Effluent Treatment costs Phosphate Subcategory
3. Water Effluent Treatment costs Nitrogen Fertilizer Subcategories
4. Metric Units conversion Table
viii
15
134
137
168
SECTION I
The basic fertilizer chemicals segment of the fertilizer manufacturing category can be grouped into five subcategories for treatment and identification of plant effluent waste water: phosphate, ammonia, urea, ammonium nitrate and nitric acid. The phosphate subcategory includes sulfuric acid (sulfur burning), phosphoric acid (wet process), phosphoric acid concentration, phosphoric acid clarification, normal superphosphate, triple superphosphate, and ammonium phosphates. In these subcategories the treatment technology does exist, and in some cases is being used, that would permit every existing fertilizer plant to meet the proposed best practicable control technology currently available.
Additional treatment methods, in the form of development projects, pilot plant studies and plant prototype units, along with technology from other industries are being refined, updated and adapted so that their use will enable fertilizer plant effluent to conform with the proposed best available technology economically achievable.
Process modifications and plant waste water separation/collection systems along with existing treatment methods will provide the necessary technology to enable new fertilizer manufacturing plants to meet the proposed new source standards.
The remainder of the fertilizer industry not covered in this study will be included in a later study.
1

SECTION II
RECOMMENDATIONS
Phosphate Subcateqq~y
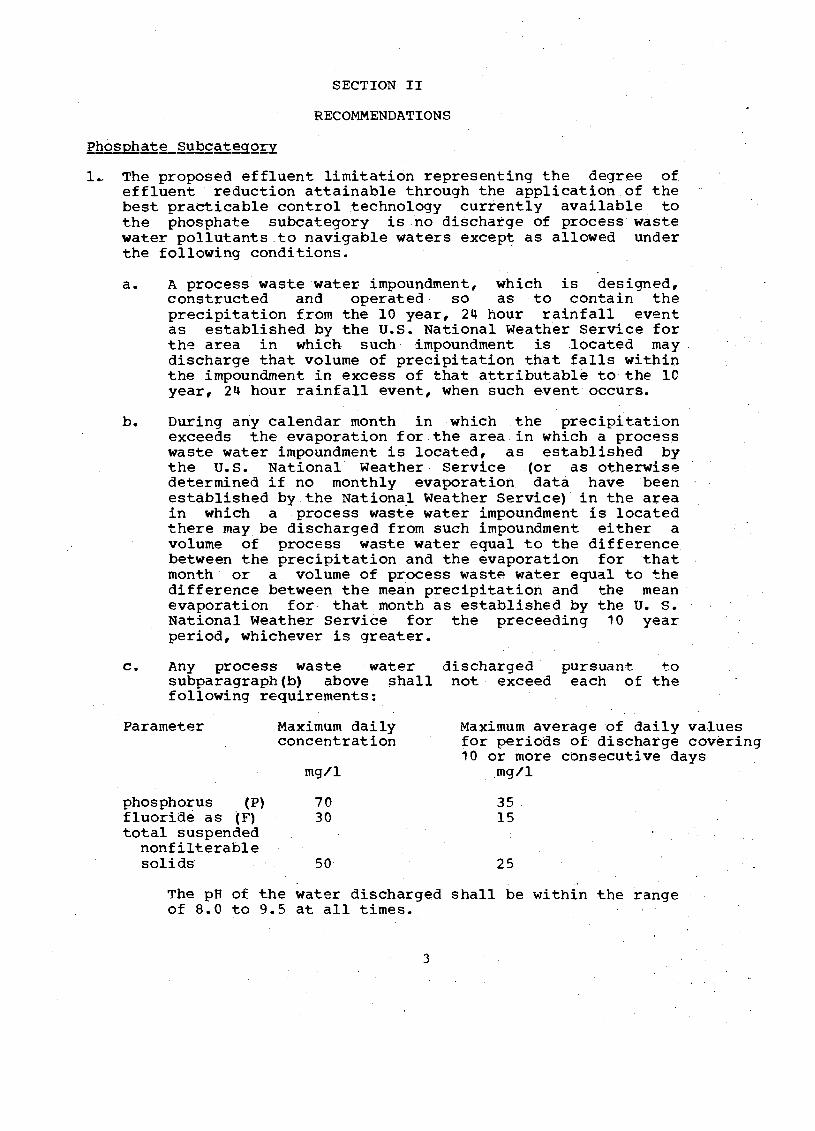
1~ The proposed effluent limitation representing the degree of effluent reduction attainable through the application of the best practicable control technology currently available to the phosphate subcategory is no discharge of process waste water pollutants to navigable waters except as allowed under the following conditions. ·
a. A process waste water impoundment, which is designed, constructed and operated so as to contain the precipitation from the 10 year, 24 hour rainfall event as established by the U.S. National Weather Service for th~ area in which such impoundment is located may discharge that volume of precipitation that falls within the impoundment in excess of that attributable to the 10 year, 24 hour rainfall event, when such event occurs.
b. During any calendar month in which the precipitation exceeds the evaporation for the area.in which a process waste water impoundment is located, as established by the u.s. National Weather Service (or as otherwise determined if no monthly evaporation data have been established by the National Weather Service) in the area in which a process wast·e water impoundment is located there may be discharged from such impoundment either a volume of process waste water equal to the difference between the precipitation and the evaporation for that month or a volume of process wast~ water equal to the difference between the mean precipitation and the mean evaporation for• that month as established by the u. s. National weather Service for the preceeding 10 year period, whichever is greater.
c. Any process waste water subparagraph(b) above shall following requirements:
Parameter Maximum daily concentration
mg/1
phosphorus (P) 70 fluoride as (F) 30 total suspended
nonfilterable solids 50
discharged · not exceed
pursuant to each of the
Maximum average of daily values for periods of discharge covering 10 or more consecutive days
mg/1
35 15
25
The pH of the water discharged shall be within the range of 8.0 to 9.5 at all times.
3

2. The proposed effluent limitation representir.g the degree of effluent reduction attainable by the application of the best available technology economically achievable is no discharge of process waste water pollutants to navigable waters. A discharge is only allowed under the following condition. A process waste water impoundment which is designed, constructed and operated so as to contain the precipitation from the 25 year, 24 hour rainfall event as established by the u.s. National weather service for the area in which such impoundment is located, may discharge that volume of precipitation that falls within the impoundment in excess of that attributable to the 25 year, 24 hour rainfall event, when such event occurs.
3. The standard of performance representing the degree of effluent reduction obtainable by the application of the best available demonstrated control technology, processes, operating methods, or other alternatives is no discharge of process waste water pollutants to navigable waters. The same conditions listed for best available technology economically achievable apply.
The proposed effluent limitations for the ammonia subcategory are listed in the table below. The following abbreviations apply:
BPCTCA - best practicable control technology currently available BATEA - best available technology economically achievable BADCT - best available demonstrated control technology
BPCTCA ~I~~ m2n tii!i--da,aJ,y m2nth.J_y ~ilY
Ammonia (as N) kg/kkg (lb/ 10 0 0)
of product 0.0625 0.125 0.025 0. 0 5
The above monthly limitations represent the maximum daily values for any period of 30 consecutive days. maximum average is twice the 30 day maximum average. within the range of 6.0 to 9.0 at all times.
urea subcategon
BADC'J' m2n~IilY .Q~ilY
0.055 0.11
averaqe of The daily
pH shall be
The proposed effluent limitations for the urea subcategory are listed in the following table:
4

BPCTCA BATEA BADCT !!!QJ:thli-~iilY monthly-daily m2n1fi1y g~ilY
Ammonia (as N) kg/kkg (lb/1000 lb)
of product nonprilled urea 0.0375 0.075 0.015 0.03 0.0325 0.065 prilled urea 0.05 0.1 0.015 0.03 0.0325 0.065
Organic Nitrogen (as N) kg/kkg (lb/1000 lb)
of product nonprilled urea 0.175 0.44 0.025 0.05 0.12 0.24 prilled urea 0.50 1.25 0.0375 0.075 0.35 0.7
The above monthly limitations represent the maximum average of daily values for any period of 30 consecutive days. The daily maximum average is greater than the 30 day maximum average as shown. pH shall be within the range of 6.0 to 9.0 at all times.
The proposed effluent limitations for the ammonium nitrate subcategory are listed in the following table.
Ammonia ( as N) kg/kkg (lb/1000 lb)
of product nonprilled AN prilled AN
Nitrate (as N) kg/kkg (lb/1000 lb)
of product nonprilled prilled
BPCTCA !!!QntFi:ii ___ dai1Y
0.0375 0.1
0.05 0.11
0.075 0.0075 0.2 0.0075
0.1 0.0125 0.22 0.0125
BADCT m2ii1Eh
0.015 0.025 0.015 0.05
0.025 0.0125 0.025 0.025
0.05 0.10
0.025 0.05
The above monthly limitations represent the maximum average of daily values for any period of 30 consecutive days. The daily maximum average average is twice the 30 day maximum average. pH shall be within the range of 6.0 to 9.0 at all times.
Nit!iC,_b£;lg_§y~tego!Y
The proposed effluent limitation representing the degree of effluent reduction attainable by the application of the best practicable control technology currently available, best available technology economically achievable, and best available demonstrated control technology, processes, operating methods, or other alternatives is no discharge of process waste water pollutants to navigable waters.
5


SECTION III
section 30l(b) of the Act requires the achievement by not later than July 1, 1977, of effluent limitations for point sources, other than publicly owned treatment works, which are based on the application of the best practicable control technology currently available as defined by the Administrator pursuant to section 304(b) of the Act. section 301 (b) also requires the achievement by not later than July 1, 1983, of effluent limitations for point sources, other than publicly owned treatme~t works. These are to be based on the application of the best available technology economically achievable which will result in reasonable further progress toward the national goal of eliminating the discharge of all pollutants, as determined in accordance with regulations issued by the Administrator pursuant to Section 304(b) of the Act. Section 306 of the Act requires the achievement. by new sources of a Federal standard of performance providing for the control of the discharge of pollutants which reflects the greatest degree of effluent reduction which the Administrator determines to be achievable through the application of the best available demonstrated control technology, processes, operating methods, or other alternatives, including, where practicable, a standard permitting no discharge of pollutants.
Section 304(b) of the Act requires the Administrator to publish within one year of enactment of the Act, regulations providing guidelines for effluent limitations setting forth the degree of effluent reduction attainable through the application of the best practicable control technology currently available and the degree of effluent reduction attainable through the application of the best control measures and practices achievable including treatment techniques, processes and procedure innovations, operation methods and other alternatives. The regulations proposed herein set forth effluent limitations guidelines pursuant to section 304(b) of the Act for the fertilizer manufacturing category of point sources.
Section 306 of the Act requires the Administrator, within one year after a category of sources is included in a list published pursuant to Section 306 (b) (1) (A) of the Act, to propose regulations establishing Federal standards of performances for new sources within such categories. The Administrator published in the Federal Register of January 16, 1973 (38 F.R. 1624), a list of 27 source categories. Publication of the list constituted announcement of the Administrator•s intention of establishing, under section 306, standards of performance applicable to- new sources within the fertilizer manufacturing category of point sources, which included within the list published January 16, 1973.
7

fil!fil!!!ilY of Methods Used for Develo2ment Qf ihg 1iIDi.!2tiQ!!~ 2Yid§!ing.§-~nd §tandgds of fgrfO!:!!!fill.£g
The effluent limitations guidelines and standards of performance proposed herein w~re developed in the following manner. The point source category was first studied for the purpose of determining whether separate limitations and standards are appropriate for different segments within the category. This analysis included a determination of whether differences in raw material used, product produced, manufacturing process employed, age, size, waste water constituents and other factors require development of separate limitations and standards for different segments of the point source category.
The raw waste charact.eristics for each such segment were then identified. This included an analysis of (1) the source flow and volume of water used in the process employed and the sources of waste and waste waters in the the plant; and (2) the constituents (including thermal) of all waste waters, including toxic constituents and other constituents which result in taste, odor, and color in the water or aquatic organisms. The constitutents of the waste waters which should be subject to effluent limitations guidelines and standards of performance were identified.
The range of control and treatment technologies existing within each segment was identified. This included an identification of each distinct control and treatment technology, including both in-plant and end-of-process technologies, which are existent or capable of being designed for each segment. It also included an identification of, in terms of the amount of constituents (including thermal) and the effluent level resulting from the application of each of the treatment and control technologies. The problems, limitations and reliability of each was also identified. In addition, the nonwater impact of these technologies upon other pollution problems, including air, solid waste, noise and radiation were also identified. The energy requirements of each control and treatment technology was identified as well as the cost of the application of such technologies.
The information, as outlined above, was then evaluated in order to determine what levels of technology constituted the "best practicable control technology currently available," the "best available technology economically achievable," and the "best available demonstrated control technology, processes, operating methods, or other alternatives." In identifying such technologies, various factors were considered. These included the total cost of application of technology in relation to the effluent reduction benefits to be achieved from such application, the age of equipment and facilities involved, the process employed, the engineering aspects of the application of various types of control techniques, process changes, nonwater quality environmental impact (including energy requirements), and other factors.
8

Qelineation of study
The effluent limitations guidelines and standards of performance proposed in this report were developed from operating data, sampling and information gathered from some twenty-five (25) plants. The methods and procedures used in the accumulation of that overall information is described in the following paragraphs.
Initial consideration was directed to identification and categorization of the various processes defined as comprising the fertilizer industry.
These processes and the corresponding standard Industrial Classification codes are defined as:
sulfuric Acid Sulfur burning only.
Phosphoric Acid Including phosphate rock grinding when it is performed on the immediate vicinity of the acid production unit.
Phosphoric Acid concentration
Phosphoric Acid clarification
Normal superphosphate
Triple superphosphate Both run-of-pile and granulated processes
Ammonium Phosphates
Ammonia
Urea
Ammonium Nitrate
2819
2874
2874
2874
2874
2874
2874
2873
2873
2873
The objective was to categorize the many processes into the least number of units that are practical for the end purpose of water effluent monitoring and structuring of specific fertilizer complexes for EPA and state enforcement officials. categorization inherently included determination of those point sources which required separate limitations and standards. The overall concept was to provide sufficient aefinition and information on an unitized basis to allow application of a building block principle. such classification of data readily permits the structuring of total water effluent information for any specific fertilizer complex regardless of the multiplicity of processes comprising its make-up.
9

rhe validated data and samples described in the foregoing pages were the primary basis for choosing the levels of technology which were considered to be the "best practicable control technology currently available", the 11 best available technology economically achievable," and the "best available demonstrated control technology, process operating methods, or other alternatives". This selection of the separate technologies, of necessity, required consideration of such additional factors as evaluation of the engineering and operational problems associated with the technology, effect on existing processes, total cost of the technology in relation to the effluent reduction that would be realized, energy requirements and cost, the range of control variations on contaminant concentration and/or quantity, and nonwater quality environmental impact. Information regarding the influence of these diverse factors was obtained from a number of sources. These sources include government research information, published literature, trade organization publications, information from qualified consultants, and cross reference with related non-fertilizer technologies utilized in other industries.
The value of a study such as this is entirely dependent upon the quality of the data from which it is made. Particular attention was, therefore, directed to selecting criteria for determining the commercial installations to be visited and from which to collect information. Criteria developed for this purpose of plant evaluation and subsequent sampling consideration are listed below.
Installations with low effluent quantities ultimate of "no discharge".
2) t!fluent contaminant Level
and/or the
Installations with low effluent contaminant concentrations and quantities.
3) tll!Y~nt Treatment Methgg_2nd Eff~£iiveness
Use of best currently available treatment methods, operating control, and operational reliability.
Utilization of good management practices such as main water re-use, planning for seasonal rainfall variations, in-plant water segregation and proximity of cooling towers to operating units where airborne contamination can occur.
5) t 2nd_Utilization
10
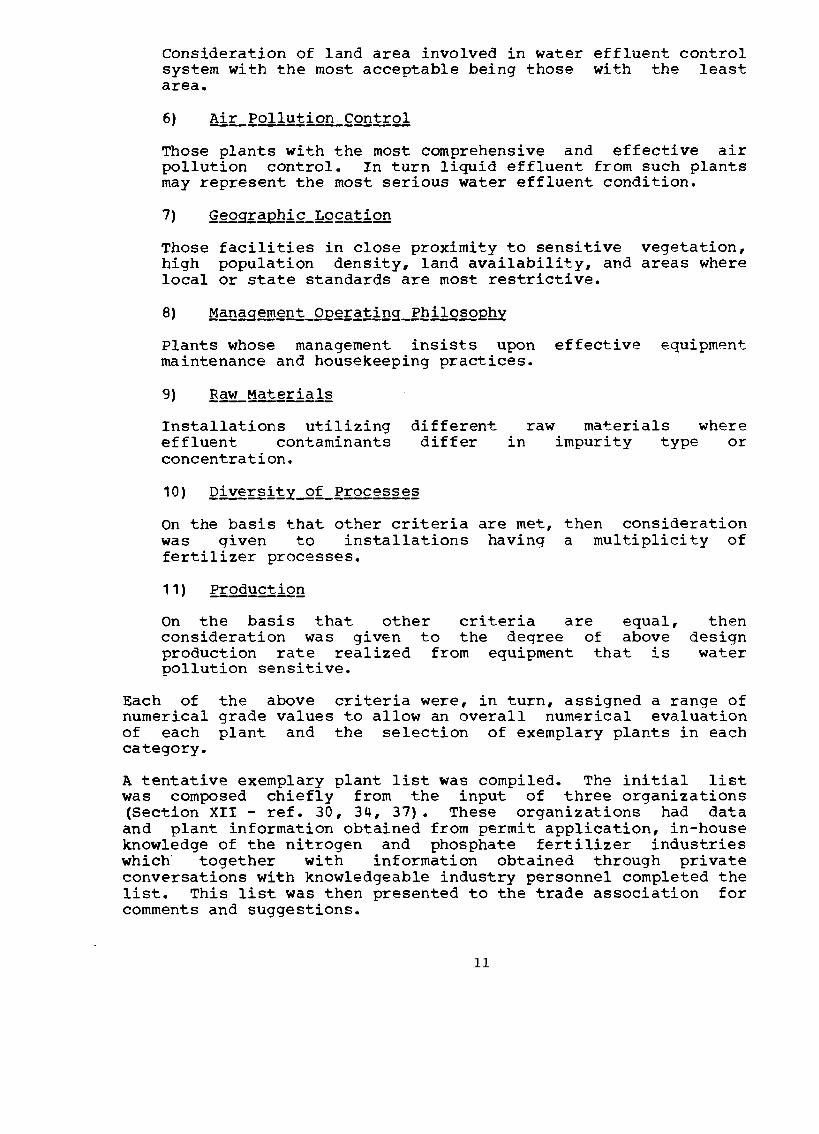
Consideration of land area involved in water effluent control system with the most acceptable being those with the least area.
Those plants with the most comprehensive and effective air pollution control. In turn liquid effluent from such plants may represent the most serious water effluent condition.
Those facilities in close proximity to sensitive vegetation, high population density, land availability, and areas where local or state standards are most restrictive.
Plants whose management insists upon effective equipment maintenance and housekeeping practices.
9) EfilLMaterials
Installations utilizing effluent contaminants concentration.
different differ
raw materials where in impurity type or
On the basis that other criteria are met, then consideration was given to installations having a multiplicity of fertilizer processes.
11) Production
On the basis that other criteria are equal, consideration was given to the degree of above production rate realized from equipment that is pollution sensitive.
then design water
Each of numerical of each category.
the above criteria were, in turn, assigned a range of grade values to allow an overall numerical evaluation plant and the selection of exemplary plants in each
A tentative exemplary plant list was compiled. The initial list was composed chiefly from the input of three organizations (Section XII - ref. 30, 34, 37). These organizations had data and plant information obtained from permit application, in-house knowledge of the nitrogen and phosphate fertilizer industries which· together with information obtained through private conversations with knowledgeable industry personnel completed the list. This list was then presented to the trade association for comments and suggestions.
11
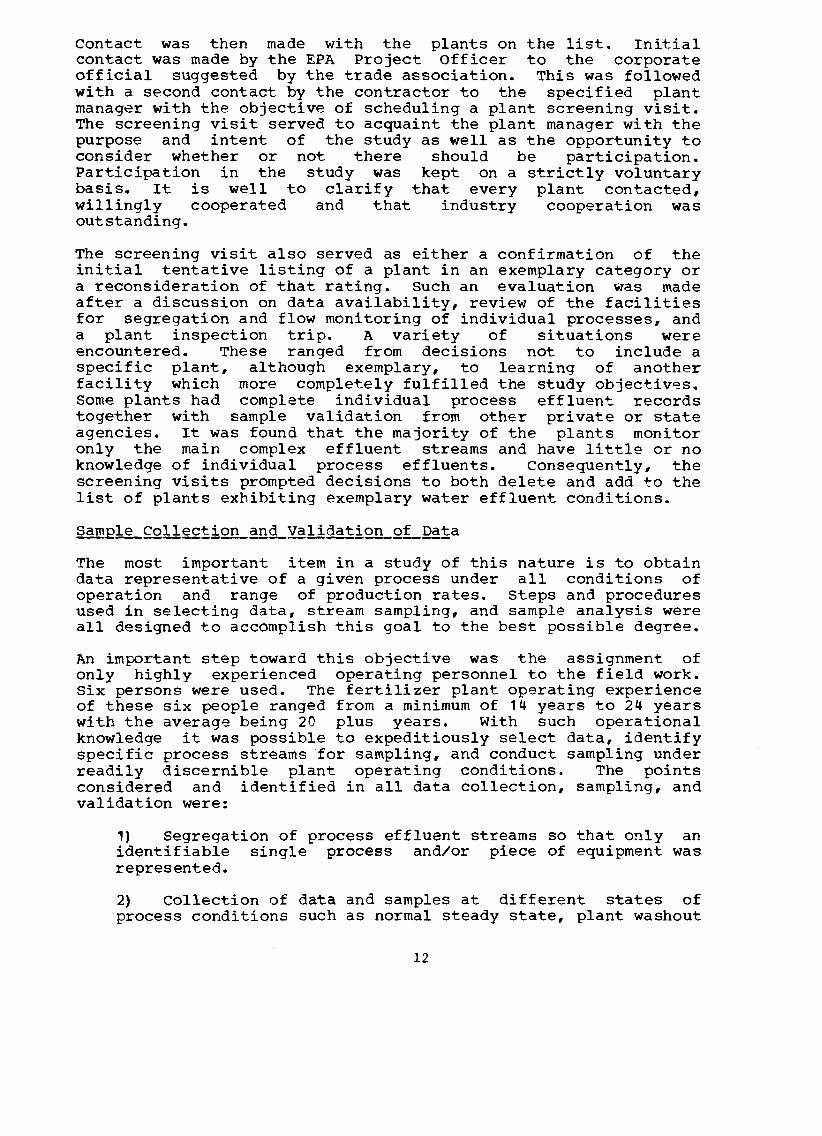
Contact was then made with the plants on the list. Initial contact was made by the EPA Project Officer to the corporate official suggested by the trade association. This was followed with a second contact by the contractor to the specified plant manager with the objective of scheduling a plant screening visit. The screening visit served to acquaint the plant manager with the purpose and intent of the study as well as the opportunity to consider whether or not there should be participation. Participation in the study was kept on a strictly voluntary basis. It is well to clarify that every plant contacted, willingly cooperated and that industry cooperation was outstanding.
The screening visit also served as either a confirmation of the initial tentative listing of a plant in an exemplary category or a reconsideration of that rating. Such an evaluation was made after a discussion on data availability, review of the facilities for segregation and flow monitoring of individual processes, and a plant inspection trip. A variety of situations were encountered. These ranged from decisions not to include a specific plant, although exemplary, to learning of another facility which more completely fulfilled the study objectiv~s. Some plants had complete individual process effluent records together with sample validation from other private or state agencies. It was found that the majority of the plants monitor only the main complex effluent streams and have little or no knowledge of individual process effluents. consequently, the screening visits prompted decisions to both delete and add to the list of plants exhibiting exemplary water effluent conditions.
The most important item in a study of this nature is to obtain data representative of a given process under all conditions of operation and range of production rates. Steps and procedures used in selecting data, stream sampling, and sample analysis were all designed to accomplish this goal to the best possible degree.
An important step toward this objective was the assignment of only highly experienced operating personnel to the field work. Six persons were used. The fertilizer plant operating experience of these six people ranged from a minimum of 14 years to 24 years with the average being 20 plus years. With such operational knowledge it was possible to expeditiously select data, identify specific process streams for sampling, and conduct sampling under readily discernible plant operating conditions. The points considered and identified in all data collection, sampling, and validation were:
i) Segregation of process effluent streams so that only an identifiable single process and/or piece of equipment was represented.
2) Collection of data and samples at different states of process conditions such as normal steady state, plant washout
12

when such a procedure is followed on a routine basis, upset process condition, operation at above/below plant design rate, and during shutdown conditions if effluent flow occurs.
3) Evaluation of the effect if any of seasonal rainfall, particularly on non-point effluent and ponds.
4) Establishment of devices and/or other effluent flows.
the existence of flow measurement means of quantitatively measuring
5) Making positive identity of the type, frequency, and handling of the samples represented by coll~cted data - i.~., such items as grab, composite, or continuous types; shift, daily or weekly frequency, etc. All samples collected by the contractor were composite samples composed of a minimum of four with the vast majority containing eight or more grab samples all caught at regular time intervals throughout the sample period. Sample periods except for special conditions were a minimum of four (4) hours.
6) Validation of data via intimate kr.owledge of plant laboratory analytical procedures used for sample analysis, check samples analyzed by independent laboratories, and/or DPG sampling under known and defined process conditions with sample analysis by an accredited commerical laboratory, was conducted on each plant visited. A total of 25 plants w~re inspected. Of these 10 plants were selected, based upon the 6 criteria for verification of effluent limits data.
13

The U.S. fertilizer industry has undergone such significant changes in the past thirty years that it has lost its old stigma of "mud chemistry". The sledge hammer and shovel days have been replaced by large, modern, fume free, plants operated from an air conditioned control room.
Eighty percent of the volume of agricultural chemicals used today are materials that were not available in their present form at the time of World War II. Fertilizer use today, in terms of plant nutrients, is four and one quarter times as great as it was in 1940. On the assumption that this fertilizer is properly used, it represents one of the major reasons why farm yields are up and unit costs are lower. It has been estimated that the use of commercial fertilizer saves the U.S. public $13 billion a year on food bills or about $70 a year per person. Large scale centrifugal compressor ammonia plants, increasing singl"e train plant capacities from 90-180 to 1400-1800 kkg/day (100-200 to 1500-2000 tons/day); sulfuric acid plant capacity increased from 270-450 to 1800 kkg/day (300-500 to 2000 tons/ day); and development of ammonium phosphate granule fertilizers illustrate the dramatic technology change.
This study considers the production of two of the three basic fertilizer ingredients - nitrogen (N) and phosphate (Pl02), the third being potassium oxide (Kl0). The following tabulation indicates the past and predicued North American consumption growth of the former two ingredients.
Year 1 65-70 1 70-80 Growth Growth '65-80
Ingredient 1222 197Q 191~ 1280 -E~t~ -E~:t.~-- !n£~~~§.f
N 4.5 7.2 11.6 16.9 10% 9% 275% Pl0.2 3.6 5.0 6.3 8.0 7% 5% 122%
Figures represent millions of metric tons
It can be noted that N consumption is expected to show the greatest future growth rates as well as the largest increase in absolute tonnage. somewhat coincidentally the N and Pl02 type of ingredient separation also applies to production facilit.i.es. That is, various N type fertilizer materials are usually produced in a plant complex which has only N type process units. Similarly, various phosphate fertilizer materials are usually produced in a plant complex which has only Pl02 type process units. This is demonstrated by Table 1. As a result of this natural separation, each of the two types will be discussed separately throughout this report.
Fertilizer industry nonmixed and mixed.
jargon identifies two types of product -straight fertilizers are defined as those
14

Table 1
Intergration of Production in the Fertilizer Industry
No. of No. of Companies NH3 u N.A. A.N. S.A. Wet A.P. TSP SPA Plants
22 X 22 2 X 2 2 X 2
X X 12 3 X X X 9 3 }) X 3
1 X l 3 ]) X X 6 6 X 6
1 X X X 3 7 1/ X X 14 3 II X X X 9
1 X 1/ X X X 4 1 II X X X X 4 3 X 6
1 X X 3 2 X X 4
13 X X 26
5 X X X 15 3 X X X 9 1 X X X 3
16 X X X X 64 1 X X X 3 2 X X X X 8
1 X X X X 4 4 X X X X X 20 1 X X X X }) X X X 7
1 X X X 4 1 X X X X 5 2 X X 4
l X 2 X X X 6 2 X X X X 8
1 X X X X X 5 l X X X X 4 1 X X X X X 5
3 X X X X X 15 7 X 14 l X X X 4
1 X X X X X 6 1 X X X X 4 l X X X X X 5
~ X X X X X X X 7 160 390
)) Not identified individually in data used to develop this list, but must assume existence of sulphuric acid facility as intermediate to wet acid production.
Jj Only 109 firms--includes more than one location of plant operations for some firms.
u Urea Wet Wet phosphoric acid N,A, Nitric acid A,P, Ammonium phosphate A.N, Ammonium nitrate TSP Triple Superphosphate S.A. Sulfuric acid SPA Superphosphate acid
15

which contain only a single major plant nutrient. Mixed fertilizers are defined as those which contain two or more primary plant nutrients. Mixed fertilizers can be produced by chemically reacting different ingredients and utilizing the chemical reaction as the binding force; or simply by mechanically blending together straight fertilizers. The following tabulation lists the principal straight and mixed fertilizers produced in the U.S.
§~rsiru1L~rtiliz~§
Nitro~n_~ili~fil:§
Ammonia Urea Ammonium Nitrate
Phosphoric Acid Normal Superphosphate Triple superphosphate
Niggg~n_Egr~i!i~.r_Indust;rx
Ammonium Phosphates
Nitrogen based fertilizers have in the past realized both the greatest consumption and industry growth rates of the three basic fertilizer nutrients (N, Pl02 and KlO) and are predicted to continue to do so for the near future. A possible reason for this may be due to the fact that application of N-based fertilizers can create spectacular crop responses. such response however is comparatively short lived and can result in disastrous crop failures unless the N fertilization is followed with P£02 and KlO fertilization within one or two years. This lead time and/or the realization of the need for P205 and K20 addition is certainly contributary to the lag time-between N and Pl02 - K£0 usage and production.
The compounds used and means of applying nitrogen to the soil have undergone radical changes since the early nineteen hundreds. Prior to this time practically all fertilizer nitrogen came from natural organic materials. Then between 1900 and 1920 the combination of natural nitrates and by-product ammonia from coke oven gas, supplied the majority of the nitrogen used by the fertilizer industry. This period concluded with the development of the Haber-Bosch process which made possible the conversion of atmospheric nitrogen into ammonia. Refinement of this process and development of single pieces of reliable, large scale mechanical equipment has been responsible for ammonia becoming the principal fertilizer material.
Today in the u.s., there are 171 ammonia plants located in 25 different states producing in excess of 17,000,000 kkg/year (18,700,000 tons/year). These plants have annual capacities ranging from 10,000 to 435,000 kkg/year (11,000 to 480,000
16

AMMONIA FIGURE 1
AMMONIUM NITRATE PIJ\N'l' IDCA1'10NS

tons/year). Locations of nitrogen fertilizer indicated on Figure 1. Ammonia plant locations are the basis of raw material supply and proximity to with the former being the dominating consideration.
plants are selected on
market area
Since atmospheric nitrogen can be obtained at any location, the raw material of importance is hydrogen. Hydrogen feedstock sources for modern ammonia plants are natural gas and petroleum fractions. In turn this has selectively place~ the highest industrial concentrations of ammonia plants near sources of these two raw materials, namely Louisiana, Texas, California, Iowa, Mississippi and Arkansas. The midwest agricultural section is the major sales market area with Iowa being the largest consumer state.
Ammonia plants are classified into two categories those operating with reciprocating gas compressors and those operating with centrifugal gas compressors. Generally speaking, those single train plants with annual capacities of less than 150,000 kkg/year (165,000 tons/year) are operated with reciprocating compressors while all larger plants, representing the more modern type, operate with centrifugal compressors. The breakpoint between the two is strictly economic. That is, in order to realize low per ton production costs industry has been building ever larger single train plant capacities. Introduction of the centrifugal unit in this process permitted dramatically increased single unit compressor capacity which is directly reflected in lower capital costs. To appreciate the effect of the centrifugal compressors on ammonia processing requires only a review of what has occurred since 1955. In 1955 single train capacities of 270 kkg/day (300 tons/day) were considered large plants. Today, 900 kkg/day (1000 tons/day) plants are common, several 1360 kkg/day (1500 tons/day) units are in operation and plans are being made to build 2300 kkg/day (2500 tons/day) plants. These larqer units have not been without problems in regard to on-stream time but i~ is unlikely that future U.S. plants will be less than 900 kkg/day (1000 tons/day) capacity.
As previously mentioned, it is modern practicE to use an ammonia plant as a basic unit and then integrate it with other process units to manufacture a range of different products. An important process unit usually associated with an ammonia plant in a nitrogen fertilizer complex is nitric acid. Ther~ are approximately 124 operating nitric acid plants in the u.s. with capacities ranging from 7,000 to 240,000 kkg/year (8,000 to 265,000 tons/year). output from these plants is used as an intermediate feed stock for the production of ammonium nitrate.
A~monium nitrate ranks second only to ammonia as a source of fertilizer nitrogen. Production of this material for fertilizer purposes increased very rapidly in the period 1950-1965 to the point that it provided 32% of the total fertilizer N market. Since 1965, use of this fertilizer in terms of market percentage has been decreasing. This decrease is expected to continue at a slow rate for the foreseeable future. The r8ason for this
18
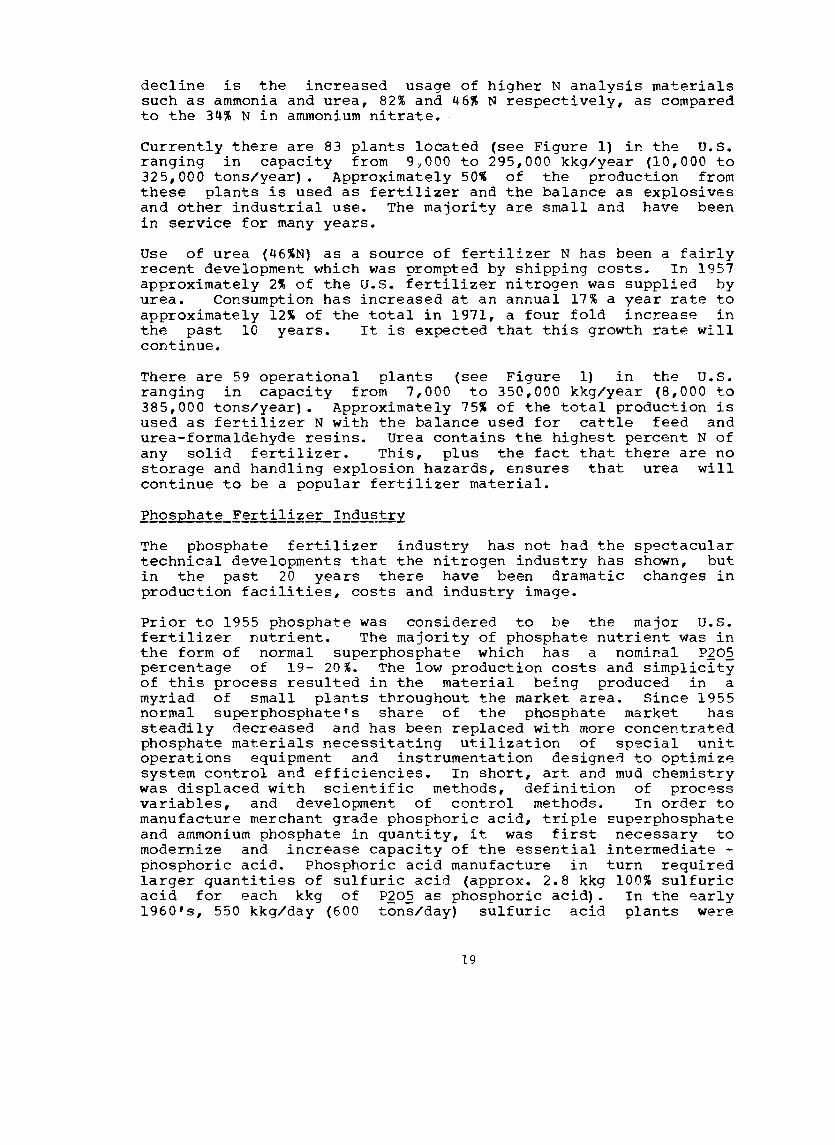
decline is the increased usage of higher N analysis materials such as ammonia and urea, 82% and 46% N respectively, as compared to the 34% Nin ammonium nitrate.
Currently there are 83 plants located (see Figure 1) in the u.s. ranging in capacity from 9,000 to 295,000 kkg/year (10,000 to 325,000 tons/year). Approximately 501 of the production from these plants is used as fertilizer and the balance as explosives and other industrial use. The majority are small and have been in service for many years.
Use of urea (46%N) as a source of fertilizer N has been a fairly recent development which was prompted by shipping costs. In 1957 approximately 2% of the U.S. fertilizer nitrogen was supplied by urea. Consumption has increased at an annual 17% a year rate to approximately 12% of the total in 1971, a four fold increase in the past 10 years. It is expected that this growth rate will continue.
There are 59 operational plants (see Figure 1) in the u.s. ranging in capacity from 7,000 to 350,000 kkg/year {8,000 to 385,000 tons/year). Approximately 75% of the total production is used as fertilizer N with the balance used for cattle feed and urea-formaldehyde resins. Urea contains the highest percent N of any solid fertilizer. This, plus the fact that there are no storage and handling explosion hazards, ensures that urea will continue to be a popular fertilizer material.
Phosphate F~rtilizer 1DQQ§try
The phosphate fertilizer industry ha,s not had the technical developments that the nitrogen industry has in the past 20 years there have been dramatic production facilities, costs and industry image.
spectacular shown, but changes in
Prior to 1955 phosphate was considered to be the major U.S. fertilizer nutrient. The majority of phosphate nutrient was in the form of normal superphosphate which has a nomiP.al P£01 percentage of 19- 20%. The low production costs and simplicity of this process resulted in the material being produced in a myriad of small plants throughout the market area. Since 1955 normal superphosphate•s share of the phosphate market has steadily decreased and has been replaced with more concentrated phosphate materials necessitating utilization of special unit operations equipment and instrumentation designed to optimize system control and efficiencies. In short, art and mud chemistry was displaced with scientific methods, definition of process variables, and development of control methods. In order to manufacture merchant grade phosphoric acid, triple superphosphate and ammonium phosphate in quantity, it was first necessary to modernize and increase capacity of the essential intermediate -phosphoric acid. Phosphoric acid manufacture in turn required larger quantities of sulfuric acid (approx. 2.8 kkg 100% sulfuric acid for each kkg of Pl02 as phosphoric acid). In the early 1960 1 s, 550 kkg/day (600 tons/day) sulfuric acid plants were
19

considered large. By 1965, single train sulfuric acid plants of 900-1100 kkg/day (1000-1200 tons/day) capacity became common with additional capacity increases to 1400 - 180C kkg/day (1600-2000 tons/day) by 1967. Similarly, large wet process phosphoric acid plants in the early 1960's were 180-270 kkg/day (200-300 tons/day) Pl02 units with multiple pieces of equipment required to perform single unit operations such as acidulation and filtration. By 1965, single train phosphoric acid units and single unit operations equipment with capacities of 450 kkg/day (500 tons/day) PJO~ became commonplace followed with an 800 kkq/day (900 tons/day) unit by 1967. several plants in the design stages will have capacities of 900-1100 kkg/day (1000-1200 tons/day).
As a result normal superphosphate•s share of the fertilize~ market has been steadily decreasing. It is expected that normal superphosphates share of the phosphate market will finally stabilize at approximately 18%. This steady market loss caused several of the smaller plants to shut down. Today there are approximately 214 plants with capacities ranging from (15,000 to 300,000 tons/year) still in operation. These plants are located over a wide cross-section of the market area (See Figure 2). In contrast to the other phosphate processes, normal superphosphate plants are usually not integrated with phosphoric acid complexes but are most generally connected with fertilizer mix plants.
Essentially all the other phosphatic fertilizer process units are like the nitrogen fertilizer industry and are integrated into phosphate complexes. The majority of these large complexes are located near the phosphate rock source in Florida. There are a few fairly isolated complexes located along the Mississippi River, North Carolina, Idaho, Utah and California. The North Carolina and western units (except California) utilize locally mined rather than Florida mined phosphate rock.
Generally wet process phosphoric acid is used as an intermediate. Steadily increasing quantities of merchant grade acid are annually being sold but such acid is in turn used either in fertilizer mixing plants or in preparing liquid fertilizer solutions. Merchant grade acid is low strength (30% PJ02) acid which has been concentrated to 52-54% PJO~ and then processed to remove a sufficient quantity of solid impurities to enable it to be shipped and distributed without difficulty. An additional near future market for merchant grade acid is in the production of high quality technical grade acid. This is presently dominated by phosphoric acid produced via the electric furnace process (see the phosphate manufacturing, development document). To date, there are no facilities producing technical grade acid from merchant grade acid in the u.s., but serious consideration is being given to such projects. One procedure for producing such a quality acid is to treat merchant grade, wet process phosphoric acid via solvent extraction to remove impurities.
A limited number of phosphoric acid plants also fluosilicic acid {15~25% HlSiF2) as a by-product phosphoric acid concentration or sulfuric acid digestion
20
produce of the steps.

FIGURE 2
GTSP,ROP,TSP
MAP/DAP AMMONIUM PHOSPHATE
PLANT IDCATJONS
21

The equipment required for this product is essentially "add on" equipment which does not affect the overall process. such production significantly reduces the total amount of fluorine in the raw waste load.
Currently there are 39 wet process phosphoric acid plants operating in 15 states with capacities ranging from 41,000 to 360,000 kkg/year (45,000 to 400,000 tons/year) PJ02 (See Figure 2). Five sizeable, new plants are currently in design and construction stages and will be brought on stream in 1974 and 1975. These new units will primarily add to existing plant capacities and will include only one new manufacturer.
Triple superphosphate (46-48% PJ02), a concentrated fertilizer, has partially displaced normal superphosphate. This material has enjoyed a very rapid market growth since 195C to the point where it is the second largest quantity of fertilizer phosphate produced. There are two types of triple superphosphate (TSP) produced. One is a non-uniform pulverized material designated as run- of-pile' (ROP) TSP. The other is a hard, uniform pellEtized material designated as granular TSP or GTSP. ROP is the older process and from an overall standpoint is a difficult process to environmentally control. In addition, the product is a troublesome material to store, handle, and ship. Consequently within the TSP family, ROP production is at best remaining constant and GTSP production is constantly increasing. There are several plants which process ROP into a granular material but this imposes an additional process step and cost. Practically all new future facilities will utilize the GTSP process.
TSP production units are always located within a phosphate complex due to their dependency on phosphoric acid supply. There are approximately 20 ROP production units ranging in capacity from 32,000 to 440,000 kkg/year (35,000 to 600,000 tons/year). currently, there are 5 GTSP plants in operation and 3 new plants in design and construction stages. The majority of the GTSP process units are located within the same complexes as the ROP units.
Ammonium phosphates are the concentrated, mixed fertilizer products which in the past 20 years have been the growth phenomenon of t~e phosphate industry. This category includes both monoammonium (MAP) and diammonium (DAP) phosphate grades. The only difference between grades is the degree of ammoniation. Annual compound rate of growth over the past ten years has been 19.8%. such popularity is due to a number of factors which are are so prominent that ammonium phosphates are certain to continue as a most important mixed fertilizer material. DAP has emerged and will continue to be the dominant grade. Both products are made by neutralizing 30-40% Pl02 phosphoric acid with th~ proper quantity of ammonia.
As with most production processes, plant capacities are constantly being increased to effect capital cost and production economies. commonplace capacities prior to 1973 have been 32-45
22

kkg/hr (35-50 tons/hour), but new plants scheduled for completion in 1974 will have instantaneous single train capacities of up to 90 kkg/hr (100 tons/hour). Currently there are 53 operating ammonium phosphate plants located in the U.S. ranging in capacity between 9,000 and 550,000 kkg/year (10,000 and 600,000 tons/year) (See Figure 2).
23
.fhosghili_Fertili~~-Indusyy
The phosphate fertilizer industry is defined as eight separate processes: sulfuric acid, phosphate rock grinding, wet process phosphoric acid, phosphoric acid concentration, phosphoric acid clarification, normal superphosphate, triple superphosphate, and ammonium phosphates.
The two important basic units are sulfuric and wet process phosphoric acid. The sulfuric acid unit is essential to the phosphoric acid plant not only for the basic sulfuric acid raw material but also to produce steam for operation of vacuum and evaporation equipment. Sulfuric acid is also a basic raw material for normal superphosphate production. Phosphoric acid is the basic raw material for all the other processes.
Essentially all existing phosphate fertilizer complexes are separated either by geographic location or by area within a general fertilizer plant from the nitrogen fertilizer operations. such separation was a significant factor in establishing the separate fertilizer categories.
Since phosphate fertilizer processes have either sulfuric acid, phosphate rock, or phosphoric acid in common, the effluents from the separate processes also have common contaminants which vary only in concentration. Primary contaminants in the effluents from these units are fluorine (F) and phosphorus (P). The only contaminant not common to all units is.nitrogen (N). Ammonia is a basic raw material to the ammonium phosphate process and is the only source of N injection to a phosphate process effluent. Therefore, with the exception of N, a common effluent treatment system can be established to treat the F and P contaminants from all phosphate fertilizer processes. In actual practice, practically all complexes combine the various unit effluents into a large recycle water system. This large contaminated recycle water system is self contained for a large portion of the year. It is only when the quantity of recycle water increases beyond capacity to contain it, that effluent treatment is necessary. Increases in recycle water inventory is usually du~ to an imbalance between rainfall and evaporation. In Florida this means that some plants discharge treated effluent up to four months per year.
24

Process_DescriJ2tion
In the United States, essentially all sulfuric acid utilized in the manufacture of fertilizer products and intermedi~tes is produced by the contact process. The process is so named due to the use of a catalyst surface to speed the oxidation reaction between sulfur dioxide (SOl) and oxygen (Ol)- This reaction occurs when the two gaseous components "contact" each other on the surface of pelletized vanadium pentoxide catalyst to form resultant sulfur trioxide (SOJ) gas. In turn, the sulfur trioxide (SOJ) gas is hydrolyzed by the addition of water to form sulfuric acid (HlSO~).
Prior to 1930 the contact process was used primarily in Europe for the manufacture of high strength sulfuric acid (98 + %) and oleums. From this date forward, American process innovations improved materials of construction and operating costs to the point that the process became the most economical method of producing sulfuric acid from elemental sulfur. In addition to these factors the process is designed to capture a high percentage of the energy released by the exothermic chemical reactions occurring in the oxidation of sulfur (S) to sulfur trioxide (SOJ). This energy is used to produce steam which is then utilized for other plant unit operations or converted to electrical energy. It is the raw water treatment necessary to condition water for this steam production that generates essentially all the water effluent from this process.
In the period between 1930 and 1971, practically all contact sulfuric acid plants built in the U.S. were designed with a "single absorption" step (see Figure 3). The term "single absorption" refers to the process point when sulfur trioxide (SOJ) gas is hydrolyzed with water to form product sulfuric acid (HlSO~). This process step is performed after the gas has passed through all the catalysis stages. Exit gas from a "single absorption" stage generally contains sulfur dioxide (SOl) at a concentration level appreciably in excess of the standard established by EPA of 1.81 kg/kkg (4.0 lb/ ton) 100% acid produced. Since 1971, however, a process modification is being offered which will allow compliance to the EPA standard. The modification is the addition of a second absorption step and is known as the "double absorption" process (Figure 4). It is most likely that all future plants will utilize the double absorption technique. Such a process modification will not affect the characteristics or quantity of sulfuric acid plant water effluent in any manner.
25

FEED STREAM
TREATED H20a----
(310 ~ 400 GAL/TON) 1300 ~ 1670 I/kkg
SULFUR FURNACE
WASTE HEAT
BOILER
,--+1 STEAM I I I I
CONVERSION
'--__ o_F_F..,.G_A_s _ _,~ - ➔ TO ATMOSPHERE
t I I I I I
ABSORPTION
I 801 LER SLOWDOWN . .___,. (5 ~ 10 GAL/TON)
AIR
21 ~ 40 I/kkg I --7
I I
AIR DRYING
PROCESS H20,i-------.i
(15 ~ 20 GAL/TON) 63 ~ 83 I/kkg
STREAM LEGEND
MAIN LIQUID
--- MAIN GAS
__ ..!...f MINOR
TON~ SHORT TON
ACID
COOLING
ACID
..-------11 COO LI NG H20
r (18,000 ~ 2!000 GAL/TON) 75,000 ~ 83~000 I/kkg
CIRC. TANK i-----1
ACID
COOLING
FIGURE 3
BLOWDOWN 1875~20801/kkg (450 ~ 500 GAL/TON)
PRODUCT
SULFURIC ACID PLANT (SINGLE CATALYSIS) FLOW RATES PER TON 100% H2 SO4

N -.J
L,,_._F_E_E_D_s_T_R_EA_M_ ..... ~-,
1875 ~ 2080 I/kkg (450 ~ 500 GAL/TON)
I I I I L
1300 ~ 1670 I/kkg (310 ~ 400 GAL/TON,
TREATED H2O
SULFUR BLOW DOWN .... ♦ FURNACE
+ OFF ~AS
I ...._ ______ l
r--1.__s_T-,EAr-M~ I
WASTE HEAT
I I
.--='-+ ONVERSION
I I I I I
STREAM LEGEND
MAIN LIQUID
-- - MAIN GAS
_--}MINOR
HEAT EXCH.
I t--- - - _. BOILER BOILER f I+- I
I ----~ I~---- T-
c.OOL1NG H2o , ,
1 _ BLOIJILDOWNh L- 1 1 --r,-__,,..,....,
r 4 (5 ~ 10 GAL/TON) 21 ~ 40 I/kkg 7 ! 1 l_ L- - -- - - - -• I • I 't _____ ...... 1 __ .:..'1 ___ I I ------i !
AIR
I
AIR DRYING
PRODUCT I -I
75,000 ~ 83,500 I/kkg (8,000 ~ 20,000 GAL/TON}
TON~ SHORT TON
.. ACID
COOLING & . r
PUMPING
'~
~
I ACID . r
COOLING & I
ABSORPTION i-J PUMPING
'
~
~
.__ __ _,: PROCESS WATER
(15 ~ 20 GAL/TON} 63 ~ 83 I/kkg
FIGURE 4
SULFURIC ACID PLANT - DOUBLE CATALYSIS FLOW RATES PER TON 100% H2 SO4
ACID COOLING &
PUMPING
' I
I
"' INTERSTAGE
ABSORPTION
PRODUCT

The raw materials used to produce sulfuric acid by the contact method are elemental sulfur, air and water. Molten elemental sulfur is sprayed into a dry air stream inside a furnace. The elevated furnace temperature auto-ignites the atomized liquid sulfur to oxidize it to sulfur dioxide (SOl). This reaction releases a larqe quantity of heat which causes the temperature of the resultant SO2 - excess air mixture to rise to 980 - 1140°c (1800-2000°F) as it exits from the furnace. The heated gas mixture flows to a boiler for heat removal. Sufficient heat is removed to reduce the gas mixture temperature to the initial reaction condition for optimum chemical conversion of soi to SOJ.
SOl conversion to SOJ takes place in a series of three or four steps. Each conversion step takes place under a a different reaction condition to achieve the most complete conversion of soi to SO] possible. This conversion efficiency in a single absorption process is approximately 98j.
Following the conversion stages, the SO3 gas flows to the bot~om of an absorption tower. In the tower the SO} gas flows upward through ceramic packing and counter-current to downward flowing 98-99% HlSOi. The SOJ is readily hydrolyzed to HlSO1 by the water in the acid. Hydrolysis of the SOJ to HlSO~ also releases heat which increases the temperature of the enriched 98-99% H2SO4 acid. After the acid exits the tower it flows through cooling coils to offset the temperature increase and then to the pump tank. From this tank it is again recycled through the absorption tower.
At the start of the process discussion, it was mentioned that the molten sulfur is burned in a dry air stream. The drying of the atmospheric air used in the process is accomplished in the drying tower. Here moist atmospheric air enters the base of the tower and flows upward counter-currently to concentrated sulfuric acid pumped from the pump tank. This acid has, however, been diluted from the normal 98-99% HlSO! acid in the pump tank to approximately 93%. The resultant moist air, 93% acid contact, removes moisture from the air stream yielding dry air and a slightly further diluted acid. In turn the dry air flows to the furnace and the diluted acid flows back to the pump tank for mixing with the stronger 98-99% acid flowing back from the SOJ absorption tower.
The product is that acid flowing into the pump tank which is in excess of drying and absorbing tower recycle requirements. Adjustments to the rate of product acid removal from the pump tank are determined by monitoring the pump tank level and maintaining it at a constant level. The excess (product) acid is diluted with water to the desired product acid concentration (normally 93% HlSO!) before it is pumped to storage.
Process - Dou2~_ibsorEtiog
As previously mentioned it is most likely that built in the United States in the future
28
all new will be
plants double

absorption process units. The feature which makes this process different from the single absorption process described above is the addition of a second absorption tower. This second towPr is installed at a point intermediate between the first and final SOl to SO] catalytic conversion steps. Utilization of this second absorption tower permits the achievement of a grea~er soi conversion to SO] and thus a significantly reduced quantity of SOl in the plant effluent gas stream. Double absorption plants realize SOl conversion efficiencies of 99.5+ % as compared to single absorption plant efficiencies of approximately 98%. Both processes have the same water effluent in respect to both quantity and contaminant levels.
29

Phos2hate_Rock Grinding
Process_DescriQtion
Phosphate rock that has been mined and beneficiated is generally too coarse to be used directly in acidulation to phosphoric acid. The rock is, therefore, processed through equipment to mechanically reduce it to the particle size required for optimum phosphoric acid plant process efficiency.
£!:ocess
Size reduction is accomplished with ball, roll or bowl mills. Phosphate rock is fed into the mills and mechanically ground (Figure 5). After the rock enters the mill system, all flow through the sizing and reclamation circuits is by pneumatic means. Air is constantly exhausted from the mill system to prevent precipitation of moisture generated from the rock as a result of grinding. Normally, the exhaust air passes through a bag type air cleaner to remove entrained rock particulates before discharge to the atmosphere.
Phosphate rock size reduction in all existing fertilizer plants is an entirely dry processing circuit and does not directly involve liquid streams. Minor quantities of water are used for indirect cooling of lubricating oil and mechanical equipm~nt such as bearings.
Some future rock grinding operations will utilize a wet grinding circuit rather than the current dry grinding practice. This change is prompted by a combination of lower capital costs and the elimination of the gas effluent streams associated with both the rock drying and grinding operations. Use of this n~w technique will not change the self-contained nature of the rock grinding circuit. There will be no liquid effluents other than those mentioned in the dry grinding process.
30

LEGEND
--- MAIN ROCK
--- MINOR ROCK
---MINOR AIR EXHAUST AIR
t
PHOS. ROCK
I I I I I I
COOLING WATER
(8 ~ 150 GAL/TON) 33 ~ 625 I/kkg
COOLING WATER
(8 ~ 150 GAL/TON) 33 ~ 625 I/kkg
TON ~ SHORT TON
GRINDING MILL
FIGURE 5
ROCK GRINDING FLOW RATE PER TON ROCK
DUST COLLECTOR
PRODUCT

Process_Descri2tion
Phosphoric acid is the basic building block from which essentially all mixed fertilizer used in the u.s. is made. The overwhelming majority of this acid is manufactured by the wet process method. The process involves changing the state of the phosphate content in phosphate rock from a practically water insoluble to a water soluble compouna. This is accomplished by solubilizing the phosphate rock with a highly ionized acid. Acid type is selected through a combination of factors including cost, simplicity of process, materials of construction, and the desi~ed end products. In the U.S., sulfuric acid is by far the most commonly used acid, but other acids, such as nitric and hydrochloric, can be utilized.
A statistical compilation of U.S. phosphoric acid producers is shown below. The figures show the relative importance of the three mentioned acid treatment processes and indicates the most prominent process.
Annual Type of Acidulation Number of Operat- PJ02 % of Total ___ lli£~§_ ____ _ing_Plants _____ k~gty~~!: £~g~£i.!Q!l
Sulfuric Acid 35* 4,879,000 98.77
Nitric Acid 4 61,000 1.23
Hydrochloric Acid 0 0 I)
----- --------- --------39 4,940,0(10 100.00%
*Including three plants restarted in 1973.
All the acidulation processes have inherent problems with process effluents, both gaseous and water, as well as by-product disposal. successful and acceptable by-product storage and processing of plant effluents is to a large degree aependent upon the considerations made for such items during the original plant layout stages. It is much more difficult and possibly economically impractical in some cases to add such facili-ti"=s to an existing plant. Sizable acreage and reasonably good soil compaction characteristics are required to handle the effluent and by-product processing arrangements. Those plants loc3ted in areas where land is not available and/or soil stability is poor are at a great disadvantage. Particular reference is to those installations in Texas and Louisiana.
32

The raw materials used in this process are ground phosphate rock, 93~ sulfuric acid, and water. Phosphate rock is mixed with the sulfuric acid after the acid has first been diluted with water to a 55-70~ HlSO~ concentration. This mixing takes place in an attack vessel of sufficient size to retain the raw material mixture for several hours (Figure 6). The simplified overall chemical reaction is represented by the following equation:
J Ca3 (PO!)l (solid) Phos. Rock
-+ 6 HJPO~ (liq) Phos. Acid
+
+ 9 HlSO.!! (liq) + 18 HlO (liq) Sulf. Acid Water
9 CaSO! (solid) Gypsum
In reality phosphate rock is not the pure compound indicated above, but a fluorapitite material containing minor quantities of fluorine, iron, aluminum, silica and uranium. Of these the one presenting the most serious overall process problem is fluorine. Fluorine is evolved from the attack vessel and other plant equipment as either the gaseous compound silicon tetrafluoride (SiF~) or hydrofluoric acid (HF). SiF~ hydrolyzes very quickly in moist air to fluosilicic acid (HlSiF£) and silica (Si02). Both SiF! and HF can be collected in a wet scrubber unit.
Additional fluorine remains in the by-product gypsum in a variety of fluorine compounds. The combination, therefore, of absorbed gaseous fluorine effluent and the soluble fluorine compounds in the gypsum are a major contaminant in the phosphoric acid plant effluent streams.
Following the reaction in the digester, the mixture of phosphoric acid and gypsum is pumped to a filter which mechanically separates the particulate gypsum from the phosphoric acid (approx. 30% Pio2 concentration). The magnitude of the byproduct gypsum is best appreciated by the fact that the production of each kkg of Pl02 as phosphoric acid creates approximately five (5) kkg of gypsum. Normally the gypsum is sluiced with contaminated water from the plant to a disposal area. The phosphoric acid separated from the gypsum is collected for further processing.
33

SULFURIC ACID
PHOSPHATE ROCK
CONT AM I NA TED WATER
(2500 ~ 3500 ._ __ o_FF_G_A_s _ __.'- _ ....... TO ATMOSPHERE GAL/TON) r
COOLING WATER IN
~COOLING WATER,OUT
11000 ~ 14500 •,
--, I/kkg I I I I I I
_.i__
----CONTAMINATED WATER
( 1300 ~ 1500 GAL/TON) 5400~ 63001/kkg
(1300 ~ 1500 GAL/TON) 5400~ 63001/kkg (0 ~ 4500 GAL/TON)
0 ~ 19,000 I/kkg SULFURIC
ACID DILUT. WATER
11,000 ~ 14,500 I/kkg (2500 ~ 3500 GAL/TON)
STREAM LEGEND
--- MAJOR LIQUID
---MINOR LIQUID
--- MINOR GAS
PRODUCT ACID
FIGURE 6
WET PROCESS PHOSPHORIC ACID- H2 SO4 ACIDULATION
FLOW RATE PER TON P20 5
CONTAMINATED WATER

fhofil2hQric Acid
There are two different nitric acid acidulation processes which have been used commercially in the United States. One of these has been discontinued within the past year and currently only one is being used for fertilizer production.
Nitric acid. acidulation differs from the sulfuric acid acidulation process in that phosphoric acid is not separated as a product from the acidulation reaction mixture~ consequently, the division of process steps between acidulation and the final fertilizer product is not possible.
The raw materials used are generally unground phosphate rock and 57% nitric acid. Nitric acid and the rock are mixed together in a series (12-15) of violently agitated small reactor vessels {Figure 7). The first few vessels serve primarily to dissolve the rock according to the following chemical reaction.
CaJ (PO,!!) J + 6HNOJ _.,. 3Ca (NO}) J + 2H.J.PO,!! Phos. Rock Nitric Acid Calcium Phos. Acid
Nitrate
This reaction essentially places both the reaction products, calcium nitrate and phosphoric acid, in a mixed liquid form. At this point either purchased phosphoric or sulfuric acid is added to the process together with ammonia to produce a specific mix of calcium compounds, ammonium nitrate, and phosphoric acid. This mixture is then converted to a dry product. The fertilizer grades produced from this mixture are limited both as to number and water soluble phosphate content.
35

FEED STREAM
TON~ SHORT TON
DIGESTION & AMMONIATION
DRYING GRANULATION
SIZING
-----, I L..----
r-------' I
_.J
PRODUCT
FIGURE 7
TO ATMOSPHERE
+ I
$ I I I I I I
SCRUBBER
NPK PROCESS NITRIC ACID ACIDULATION
FLOW RATE PER TON PO 2 5
STREAM LEGEND
MAIN FLUID
----- MAIN GAS
CONTAMINATED
WATER
1000 ~ 2300 I/kkg (240 ~ 540 GAL/TON)
CONTAMINATED
WATER
1000~ 23001/kkg (240 ~ 540 GAL/TON)

Phos2horic_Acid concentration
General
Phosphoric acid as produced in the sulfuric acid acidulation process is generally of too low in concentration (26-30% Pl02) to qualify as either a salable product or to be used for processing a final dry fertilizer product. This Pl02 level can be increased to the 40-54% Pl02 range by processing the acid through water evaporation units.
Phosphoric acid concentration to 54% Pl02 is performed with low pressure steam as the heat energy source for the evaporation of water from the acid. Evaporation is accomplished by circulating acid at a high volume rate consecutively through a shell and tube heat exchanger and a flash chamber under vacuum pressure conditions. The flash chamber serves to provide a comparatively large liquid surface area where water vapor can be easily released without incurring significant phosphoric acid entrainment losses. Inherent with the water evaporation is also volatilization of minor acid impurities, the principal one being fluorine. The evolved fluorine together with very minor quantities of phosphoric acid pass to a barometric condenser and contaminate the condenser water.
37

L,.)
CXl
STEAM ------------------~ CONTAMINATED WATER I
PHOSPHORIC ACID
STEAM
CONDENSATE
TON ~ SHORT TON
.--- BAR
COND. '
EVAP.
PUMP SEAL WATER
(.2 ~ .4 GAL/TON)
.83 ~ 1.6 I/kkg
FIGURE 8
I I
EJCT
STREAM LEGEND
MAIN LIQUID
--- MAIN GAS
___ ~MINOR
CONCENTRATED PHOSPHORIC ACID
HOT WELL
CONTAMINATED WATER
(550 ~ 570 GAL/TON) 2500~ 26001/kkg
WET PHOSPHORIC ACID CONCENTRATION
FLOW RATE PER TON P2O5

Process Description
Phosphoric acid after concentration to a 52-54% P205 level becomes a supersaturated solution to a variety of minor acid impurities, namely iron and aluminum phosphates, soluble gypsum, and fluosilicates. These impurities are present in quantities sufficient to create an appreciable solids accumulation during acid storage. In turn this causes tank car unloading and customer processing problems. It is, therefore, necessary to remove these precipitated impurities before the acid can be considered a salable product.
The process used in the U.S. for removal of precipitated solids from 54% Pl0,2 phosphoric acid involves only physical treatment of the acid rather than the more complicated and expensive solvent extraction processes utilized in Europe and Mexico (Figure 9). The acid is conditioned at the proper temperature and time necessary to realize the degree of solids precipitation required to meet the clarified acid product specifications. The precipitated impurities are then physically separated from the acid by settling and/or centrifugation.
water usage in this process is limited to indirect cooling of the acid and minor quantities for equipment washing.
39

CONC.1 PHOS. ACID.....,. ____ _
WATER IN , 165 ~ 770 GAL/TON) 690 ~ 3200 I/kkg
TON ~ SHORT TON
WATER OUT
(165 ~ 770 GAL/TON) 690 ~ 3200 I/kkg
SOLIDS
REMOVAL
SOLIDS PLUS ACID
FIGURE 9
MERCHANT GRADE ACID
TO DRY FERTILIZER MANUFACTURER
MERCHANT GRADE PHOSPHORIC ACID CLARIFICATION
FLOW RATE PER TON P2 O5

~~1
Normal superphosphate was, for many years, by far the most popular phosphate fertilizer. Since the mid-fifties, however, this popularity has been in a sharp decline and only in the past few years has the rate of decline started to moderate. The market share of this fertilizer has fallen from 68% in 1957 to 42% in 1965 and now appears leveling off at approximately 18%. The major reasons for this decline include such items as low PlO2 content (20%) with the associated increased cost of transportation per ton of nutrient and the trend to larger size plants.
Normal superphosphate can be manufactured in small inexpensive plants with low production costs per ton of PlO,2. The process is simple and easy to operate requiring less sulfur per ton of PlO.2 than the production of phosphoric acid. The combination of low investment and simplicity together with recognition of the adverse fertilization effect of sulfur deficiency in the soil assures that normal superphosphate production will not die out but sales will be limited to an area in close proximity to the plant site.
The two raw materials used in the production of normal superphosphate are 65-75% sulfuric acid and ground phosphate rock. Reaction between these two materials is both highly exothermic and rapid (Figure 10). The basic chemical reaction is shown by the following equation:
CaJ (PO~U l + Phosphate Rock
2H2S04 + Sulfuric Acid
HlO _. 2CaS0~.2HlO + Ca(HlPO~) .HlO Water Gypsum Normal superphos
phate
The interval of fluidity before the two reactants solidify is very brief and the mixture is quickly transferred to an enclosed space referred to as a den. This den may be either an essentially stationary structure or a continuous slow moving conveyor. · In the den the material becomes plastic relatively quickly. During this phase there is a copious evolution of obnoxious gas as the crystallization process progresses. Retention time in the den can range from 1 to 4 hours dependent on the overall process conditions. At the end of this time the material becomes a porous mass resembling a honeycomb and is removed from the den to storage. A storage period of 3 to 8 weeks is required for "curing" before the normal superphosphate is an acceptable product for shipment. The "curing" time serves to allow completion of the chemical reaction between the rock and
41

CLARIFIED OR CONTAMINATED WATER
940 ~ 1040 1/kkg
(225 ~ 250 GAL/TON)
SULFURIC ACID
PHOSPHATE ROCK
r---( _____ )♦ SCRUBBER
STREAM LEGEND
MINOR PROCESS
----- GAS
MAIN PROCESS
TONS ~ SHORT TONS
FIGURE 10
NORMAL SUPERPHOSPHATE
FLOW RATE PER TON N.S.
TO ATMOS.
t I I I
---+LJ
CONTAMINATED WATER
(225 ~ 250 GAL/TON) 940 ~ 1040 1/kkg
N.S. TO CURING

acid with the subsequent decrease in free acid and citrate insoluble Pl02 content.
43
Proce£LDescription
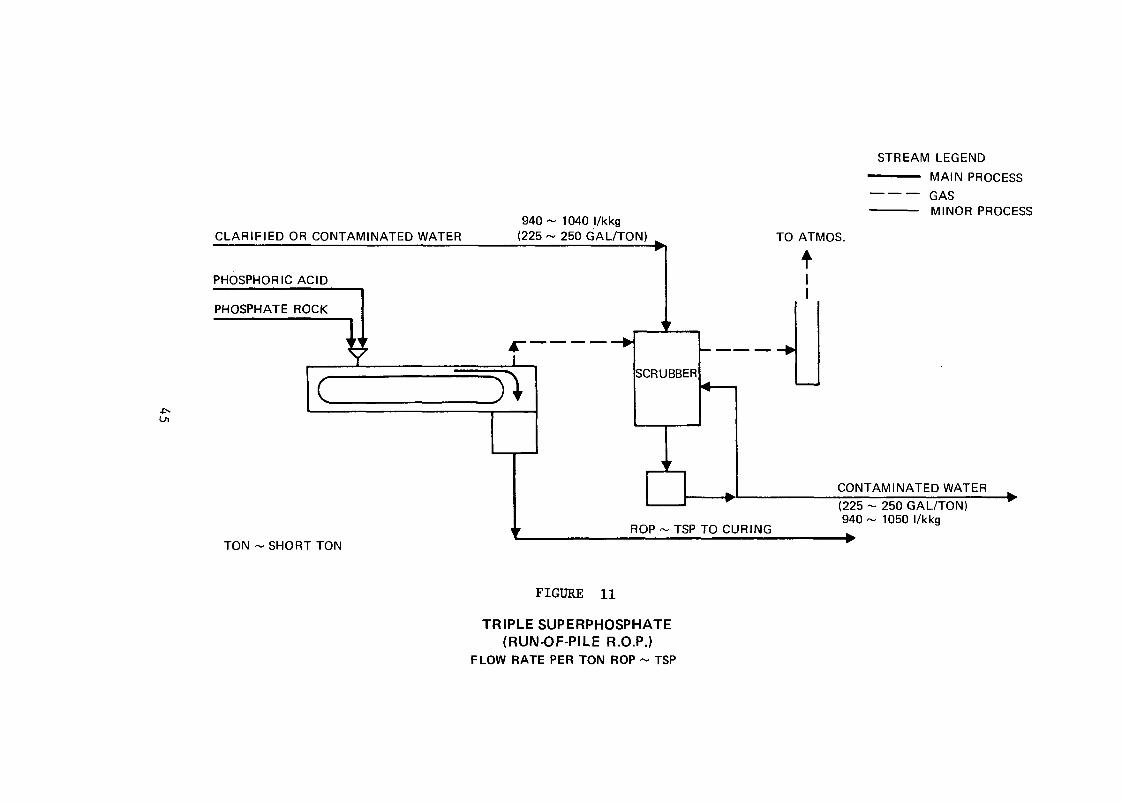
Triple superphosphate (TSP), with its 46.0% - 48.5% P102 content, is a high analysis phosphate fertilizer. As such, it provides transportation economy which has been instrumental in enlarging its share of the phosphatic fertilizer market.
This product has in the 1950-1965 period taken over much of the market lost by normal superphosphate and currently accounts for approximately 24% of the total phosphatic fertilizer market. TSP's share of the market for the near future is expected to remain relatively constant primarily because of the tremendous growth of the ammonium phosphates. TSP production, unlike normal superphosphate, can be most economically produced close to the phosphate rock source. In the u.s. this means that approximately 83% of the total production is manufactured in Florida.
There are two principal types of TSP, Run-of-Pile (ROP) and Granular Triple superphosphate (GTSP). Physical characteristics and processing conditions of the two materials are radically different. ROP material is essentially a non-uniform pulverized material which creates difficult air pollution problems in manufacture as well as difficult materials handling problems in shipment. GTSP is a hard, uniform, pelletized granule produced in process equipment which permits ready collection and treatment of dust and obnoxious fumes. Most new plants will be of the GTSP type.
Both processes utilize the same raw materials, ground phosphate rock and phosphoric acid. The basic chemical reaction is shown by the following equation:
caJ (PO!!_} l. + Phosphate Rock
4H3PO4 + 3H2O _. 3Ca(H1PO~)£.HJO Phosphoric witer Triple Superphosphate Acid (Monocalcium phosphate)
At this point the similarity between the two processes ends.
The ROP process is essentially identical to the normal superphosphate process with the exception that phosphoric rather than sulfuric acid is used as the acidulating acid (Figure 11). Mixing of the 46-54% PJ02 phosphoric acid and phosphate rock normally is done in a cone mixer. The cone depends solely on the inertial energy of the acid for mixing power. On discharge from the mixer the slurry quickly (15-30 sec) becomes plastic and begins to solidify. Solidification together with the evaluation of much obnoxious gas takes place on a slow moving conveyor (den) enroute to the curing area. The solidified material because of the gas evolution throughout the mass takes on a honeycomb appearance.
44
CLARIFIED OR CONTAMINATED WATER
PHOSPHORIC ACID
PHOSPHATE ROCK
940 ~ 1040 1/kkg (225 ~ 250 GAL/TON)
.----( ____ )) SCRUBBER
TON~ SHORT TON ROP ~ TSP TO CURING
FIGURE 11
TRIPLE SUPERPHOSPHATE (RUN-OF-PILE R.O.P.)
FLOW RATE PER TON ROP ~ TSP
STREAM LEGEND
--- MAIN PROCESS
GAS MINOR PROCESS
TO ATMOS.
t
CONTAMINATED WATER
(225 ~ 250 GAL/TON) 940 ~ 1050 1/kkg

At the point of discharge from the den the material passes through a rotary mechanical cutter which breaks up the honeycombed ROP before it discharges onto the storage {curing) pile. curing occurs in the storage pile and takes 2-4 weeks before the ROP is ready to be reclaimed from storage, sized and shipped.
GTSP is produced quite differently {Figure 12). The phosphoric acid in this process is appreciably lower in cor.centration {40% Pl02) than the 46-54% Pl02 acid used in ROP manufacture .. Forty percent Pioz acid and ground phosphate rock are mixed together in an agitated tank. The lower strength acid maintains the resultant slurry in a fluid state and allows the chemical reaction to proceed appreciably further toward completion before it solidifies. After a mixing period of 1-2 hours the slurry is distributed onto recycled dry GTSP material. This distribution and mixing with the dry GTSP takes place in either a pug mill or rotating drum. Slurry wetted GTSP granules then discharge into a rotary drier where the chemical reaction is accelerated and essentially completed by the drier heat while excess water is being evaporated. Dried granules from the drier are sized on vibrating screens. over and under-size granules are separated for use as recycle material. Product size granules are cooled and conveyed to storage or shipped directly.
46

STREAM LEGEND --- MAIN PROCESS ---- GAS --- MINOR PROCESS
CLARIFIED OR CONTAMINATED WATER 660 ~ 750 I/kkg
(158 ~ 180 GAL/TON)
PHOSPHATE ROCK
PHOSPHATE ACID
..----..---------- __ .., I I I I
I : .----' I
__ __.I _ ___, DUST
REACTOR
TON~ SHORT TON
....,_ .... I 1..,- RECOVERY GRANULATORT
I ~"YI....-..,....__ ..... I
I I I I
DRYER SIZING
FIGURE 12
GRANULATED TRIPLE SUPER PHOSPHATE
FLOW RATE PER TON GTSP
TO ATMOS.
t I
_ _J
CONTAMINATED WATER
(5 ~ 10 GAL/TON) 21~401/kkg
GTSP OUT

The ammonium phosphate fertilizers are highly concentrated sour~es of water soluble plant food which have had a spectacular agric~ltural acceptance in the past twenty years. Production capacity of diammonium phosphate (OAP) has increased at a compounded rate of 19.8% annually over the last ten years. The popularity of the ammonium phosphates results from a combination of factors. These include the ready adaptability of the production processes to ever increasing single plant capacities with their associated lower production costs; favorable physical characteristics which facilitate storage, handling, shipping and soil application; compatibility with all common fertilizer materials; transportation economies effected by the shipment of high nitrog~n (18%N) and phosphate (46% PlO2) nutrient content at a single ~reduct cost; and the ability of an N-P-K fertilizer producer to realize up to twice the profit margin per kkg of PlO2 from DAP than from concentrated superphosphate. such an impressive r.umber of plus factors insure that ammonium phosphate processing (particularly DAP) will continue to be an important segment of the fertilizer industry.
Ammonium phosphate fertilizers include a variety of different formulations which vary only in the amounts of nitrogen and phosphate present. The most important ammonium phosphate fertilizers in use in the u.s. are:
~.QD2~!!!ID2!!iY!!l_..<H~El~~hO~Qh~~~ 11 - 48 - 0 13 - 52 - 0 11 - 55 - 0 16 - 20 - 0
~!!!2!llY!!LEhOfil2hates ..{QaEl 16 - 48 - 0 18 - 46 - 0
Diammonium phosphate formulations are produced in the largest tonnages with OAP (18-46-0) being the most dominant.
Process
The two primary raw materials used to produce ammonium phosphates are ammonia and wet process phosphoric acid. sulfuric acid is of secondary importance but is used in the production of the monoammonium phosphate grade 16-20-0. As mentioned above, the various grades vary only in the amounts of nitrogen and phosphate present. It is primarily the nitrogen that varies and this is accomplished by controlling the degree of ammoniation during neutralization of the phosphoric acid. The chemical reactions involved are indicated by the following equations:
48

H3P04 + NH3 ~ NH4H2P04 Phosphoric Ammonia Monoammonium Acid Phosphate
* H2S04 + 2NH3 -+ (NH.!¼,) lSO,!! Sulfuric Ammonia Ammonium Acid Sulfate
* This reaction occurs only in the production of 16-20-0 and occurs concurrently with the monoammonium phosphate reaction.
The processing steps (Figures 13 and 14) are essentially identical to those described in the triple superphosphate GTSP process. Ammonia, either gaseous or liquid, is reacted with 30-40% Pl02 phosphoric acid in a vertical cylindrical vessel which may or may not have mechanical agitation. The resultant slurry is then pumped to a mixer where it is distributed onto dry recycled material. Distribution and mixing takes place in either a pug mill or rotating drum. wetted granules then discharge into a rotary drier where the excess water is evaporated. Dried granules are separated for use as recycle material. Product size granules are cooled and conveyed to storage or shipped directly.
49

V, 0
5000 ~ 6500 l/kkg CLARIFIED OR CONTAMINATED WATER (1200 ~ 1500 GAL/TON)
PHOSPHORIC ACID r-,---------
NH3 VAPORIZER
' I .--_.I I
REACTOR GRANULATOR f
&...-.---,--....
I I I
.--DUST
RECOVERY
SCRUB
SCRUB SUMP
TO ATMOS
t I
.J
CONTAMINATED WATER
(0 ~ 72 GAL/TON) 0 ~ 300 I/kkg
DRYER SIZING ..,__ .. COOLER
TON~ SHORT TON
STEAM LEGEND
MAIN PROCESS
GAS
- - - MINOR PROCESS
FIGURE 13
MONOiAMMONIUM PHOSPHATE PLANT
FLOW RATE PER TON MAP
MAP TO STORAGE

OFF GAS
CONTAMINATED WATER -I I""
I (1200 ~ 1500 GAL/TON)
I PHOS. ACID I I 5000 ~ 6500 1/KKg I
r I '. I ,,
I --REACTION -,--• SCRUBBER
I I ~~ CONTAMINATED WATER
I (1200 ~ 1500 GAL/TON) I 5000 ~ 6500 1/KKg
, . I __ _J
-r I GRANULATION OAP ... DRYING SIZING
TON - SHORT TON FIGURE 14
DI AMMONIUM PHOSPHATE PLANT
FLOW RATE PER TON DAP
The nitrogen fertilizer industry is composed of four basic process plants: ammonia, urea, ammonium nitrate and nitric acia. Ammonia is the basic nitrogen fertilizer constituent. It can either be used as the raw ma~erial feed stock for urea ammonium nitrate and nitric acid or it can be used directly as a fertilizer providing the highest amount of available nitrogen per kkg of any of the nitrogen fertilizers.
For the most part, nitrogen fertilizer plants exist, or will be built, without the interference of a phosphate fertilizer plant. That is, if there happens to be phosphate fertilizer units at the same plant site as nitrogen fertilizer units, they are or would be sufficiently separated so that their waste water effluent streams can be treated individually. However, the nitrogen fertilizer plants, in many cases, are very closely integrated and their waste water effluent streams intermixed.
The dependency of the three other plants on an ammonia plan~ can be seen from the process descriptions. Altho~gh there are isolated ammonia plants there are few cases where any of the other process plants, whose production goes for nitrogen fertilizers, exist by themselves. A nitric acid plant will be at the same site as an ammonium nitrate plant and an urea plant will be located next to an ammonia plant. In many cases all four of these plants will be at the same plant site. (See Table 1).
52

Ammonia
E!~§§_Description
Ammonia, being the base component for the nitrogen fertilizer industry, is produced in larger quantities than any other inorganic chemical except sulfuric acid. The total u.s. production in 1971 was 16,000,000 kkg (17,650,000 short tons) with an expected 1972 total close to 16,500,000 kkg (18,200,000 short tons). The size of an ammonia plant will range from less than 90 kkg/day (100 tons/day) to larger than 1,360 kkg/day (1,500 tons/day) with the newer plants being the larger sizes.
Ammonia is produced by the reaction of hydrogen with nitrogen in a three to one (3:1) volume (mole) ratio.
Nl + 3HJ 2NHJ
This reaction is carried out in the presence of an iron promoted metal oxide catalyst at elevated pressure, which favors the ammonia formation, in a special reaction vessel (converter) (Figure 15). Pressure in the converter will range from 130 atm (1930 psig) to 680 atm (10,100 psig) for the smaller plants, less than 550 kkg/day (600 tons/day), using reciprocating compressors to operate at higher pressures and for larger plants, greater than 550 kkg/day (600 tons/day), operating at lower pressures using centrifugal machines for gas (syn gas) compression. This reaction is exothermic and care must be taken to obtain the optimum temperature which favors both the ammonia equilibrium and rate of reaction. Most of the ammonia converters will operate at temperature from 338°c (550°F) to 421°c (700°F).
since at these operating conditions, the conversion of hydrogen and nitrogen to ammonia is on the order of 10% to 20%, a considerable quantity of reaction gas (hydrogen, nitrogen, methane, argon, other inerts, and ammonia) must be cooled to condense ammonia, recompressed, mixed with fresh make-up gas (syn gas) and reheated for recycle to the ammonia converter.
The ammonia product, after pressure reduction, is stored in either large atmospheric tanks at a temperature of -33°c (-28°F) or in large spheres or bullets at pressures up to 20 atm (300 psig) at ambient temperatures.
The above process description normally describes the 11 back end" of an ammonia plant, the ammonia synthesis section, with the "front end" being designed for the production of the syn gas (make-up feed to ammonia synthesis section). The "front end" of an ammonia plant may range from a very simple gas mixing operation to a very complex gas preparation operation depending on the raw materials used. The raw material source of nitrogen is atmospheric air and it may be used in its natural state as compressed air to a gas preparation unit or as pure nitrogen from an air plant to a gas mixing unit. Hydrogen, on the other hand, is available from a variety of sources such as: refinery off-
53

V1 .t:--
STEAM
NATURAL
GAS
~ u <( I-CJ)
TON - SHORT TON
STEAM
WASTE HEAT BOILER
BOILER FEED
WATER BOILER
BLOW DOWN (5 ~ 30 GAL/TON)
HEAT 20 ~ 1251/KKg
GAS PURIFICATION
SYN. GAS
COOL SYN. GAS
WATER COMPRESSOR
CARBON DIOXIDE r--------+-
CJ) <( <.:)
z >CJ)
~ w _J
u >u w a:
AMMONIA CONVERTER
I RECYCLE GAS
REFRIGERATION I REFRIGERANT COMPRESSOR
AIR AIR I AIR FROM ATMOS
COMPRESSOR COMPRESSOR
COOLING WATER
SLOWDOWN (30 ~ 50 GAL/TON) 125 ~ 200 I/KKg PROCESS CONDENSATE
(5 ~ 200 GAL/TON} 20 ~ 835 I/KKg FIGURE 15
AMMONIA PLANT FLOW RATE PER TON AMMONIA
HEAT
AMMONIA CONDENSER
EFFLUENT
MAKE-UP WATER
FROM CLARIFICATION 3 ~ GAL/TON 12.5 ~ 20.0 I/kkg
PRODUCT-LIQUID AMMONIA
COOLING TOWER
BLOW-DOWN
(400 ~ 800 GAL/TON) 1600 ~ 3200 I/KKg
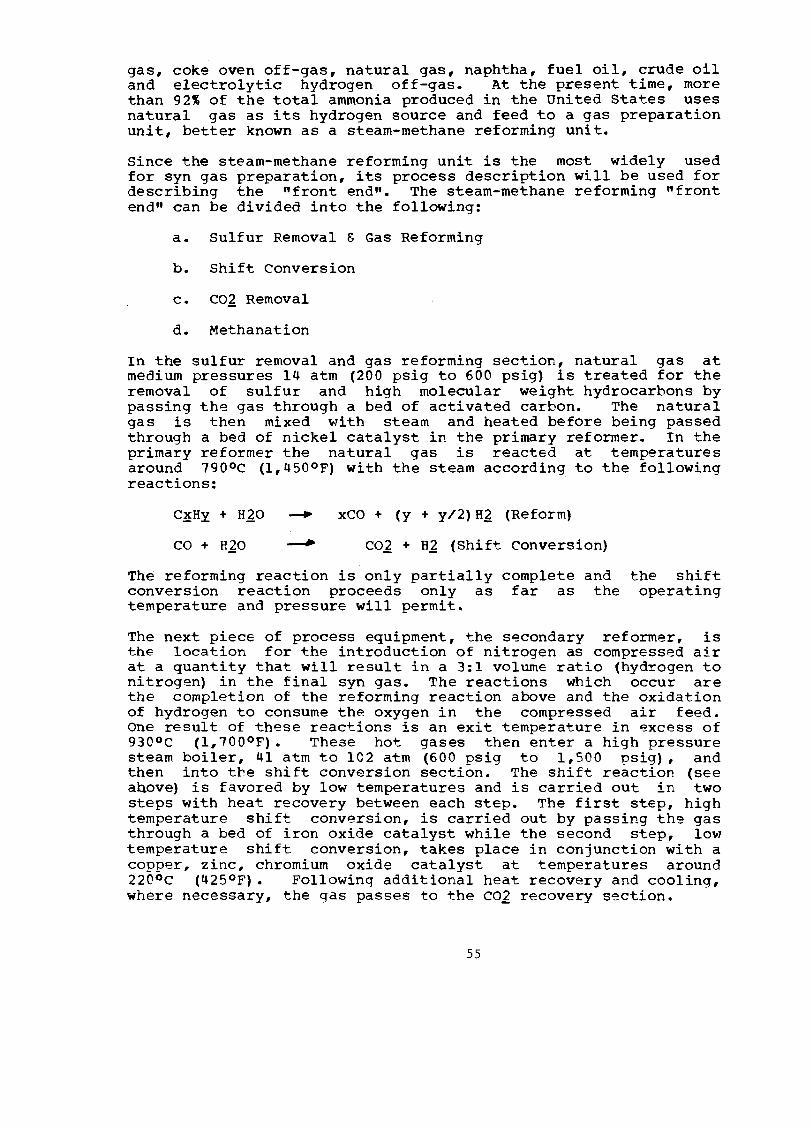
gas, coke oven off-gas, natural gas, naphtha, fuel oil, crude oil and electrolytic hydrogen off-gas. At the present time, more than 92% of the total ammonia produced in the United States uses natural gas as its hydrogen source and feed to a gas preparation unit, better known as a steam-methane reforming unit.
Since the steam-methane reforming unit is the most widely used for syn gas preparation, its process description will be used for describing the "front end". The steam-methane reforming "front end" can be divided into the following:
a. Sulfur Removal & Gas Reforming
b. Shift Conversion
c. COJ Removal
d. Methanation
In the sulfur removal and gas reforming section, natural gas at medium pressures 14 atm (200 psig to 600 psig) is treated for the removal of sulfur and high molecular weight hydrocarbons by passing the gas through a bed of activated carbon. The natural gas is then mixed with steam and heated before being passed through a bed of nickel catalyst in the primary reformer. In the primary reformer the natural gas is reacted at temperatures around 790°c (1,450°F) with the steam according to the following rea~tions:
C~Hy + HJO
co + HlO
xCO + (y + y/2)Hl (Reform)
COl + Hl {Shift conversion)
The reforming reaction is only partially complete and conversion reaction proceeds only as far as the temperature and pressure will permit.
the shift operating
The next piece of process equipment, the secondary reformer, is the location for the introduction of nitrogen as compressed air at a quantity that will result in a 3:1 volume ratio (hydrogen to nitrogen) in the final syn gas. The reactions which occur are the completion of the reforming reaction above and the oxidation of hydrogen to consume the oxygen in the compressed air feed. One result of these reactions is an exit temperature in excess of 930°c (l,700°F). These hot gases then enter a high pressure steam boiler, 41 atm to 102 atm (600 psig to 1,500 psig), and then into the shift conversion section. The shift reaction (see ahove) is favored by low temperatures and is carried out in two steps with heat recovery between each step. The first step, high temperature shift conversion, is carried out by passing the gas through a bed of iron oxide catalyst while the second step, low temperature shift conversion, takes place in conjunction with a copper, zinc, chromium oxide catalyst at temperatures around 220°c (425°F). Following additional heat recovery and cooling, where necessary, the gas passes to the coz recovery section.
55
The COl recovery system is not complicated, but there are a number of types of systems available and each one has its advantages and disadvantages. The two systems most used in the u.s. are one based on monoethanolamine (MEA) and a second one based on hot potassium carbonate and its variations. In each of these cases a circulating solution either absorbs or reacts with the COl in the gas stream reducing its concentration below 0.1%. The COl rich $Olution is then regenerated in a stripper using previously recovered heat with the COl and some water vapor being exhausted to the atmosphere.
The final stage in syn gas preparation is to remove any traces of co and COl remaining. This is accomplished in a methanation unit where the gas is passed through, a bed of nickel catalyst resulting in the following reactions:
After heat ready for section.
COl + 4Hl __,. CH.!±, + 2 HlO
co + 3Hl _.... CH.!±, + Hl 0
recovery compression
and and
any necessary cooling the syn gas is feeding to the ammonia synthesis
56

Urea is another major source of nitrogen fertilizer produced in the United States. Some 4,900,000 kkg (5,U00,000 short tons) of urea were produced in the u.s. in 1971.
Basically, there are three urea production processes which differ primarily in the way the unreacted ammonia and carbon dioxide are handled.
A. Once-through Process - In this process, no attempt is made to recycle these gases to the urea process. The off-gases containing ammonia and carbon dioxide are used in the production of fertilizer products.
B. Partial Recycle Process~ Excess ammonia is recycled back to the process while any excess carbon dioxide is vented to the atmosphere or used in another process.
c. Total Recycle Process - Both the ammonia and carbon dioxide in the off-gas are recycled back to the urea process.
currently, the total urea production is divided as follows: once through, 18%; partial recycle, 12%; and total recycle, 70%.
All of the urea production in the United States is produced by the reaction of ammonia with carbon dioxide which forms ammonium carbamate (Figure 16). The ammonium carbamate is then dehydrated to form urea.
2NH] + COl _. NH~C02NHl
NH1C02NHl ~ NHlCONHl + HlO
Most urea plants are located at the same plant site as a correspondingly sized ammonia plant. The ammonia plant not only supplies the needed ammonia, but also the high purity carbon dioxide.
The carbon dioxide-ammonia reaction to form urea, ammonium carbamate and water takes place in a reactor vessel at pressures ranging from 137 atm (2,000 psig) to 341 atm (5,000 psig) and at temperatures from 121°c (250°F) to 1s2°c (3E0°F). Unreacted ammonia and carbon dioxide are also present in the reactor exit stream. The carbamate forming reaction is highly exothermic while the carbamate dehydration reaction is slightly endothermic. Under reactor operating conditions, the dehydration reaction proceeds to 40% to 60% completion resulting in an overall net exothermic heat effect. After separation of the ammonia, carbon dioxide and ammonium carbamate, the resulting solution will be about 70% to 80% urea. Depending upon product specifica~ion this 70-80% solution can be used as is or it can be further concentrated to a solid product. This solid product can be formed by prilling, crystallation or a combination of both. The
57

\J1 (X)
BOILER FEED WATER
TREATMENT
EFFLUENT
(10 ~ 30 GAL/TON) 40 ~ 125 I/KKg ,._ __ -4
RECYCLE RECOVERY
CARBON DIOXIDE
AMMONIA
UJ Q
X 0 Q
HEAT MAKE - UP WATER
COOLING TOWER
TON - SHORT TON
BLOW-DOWN
(90 ~ 350 GAL/TON) 375~14601/KKg
0 "' I
(!) z ...J 0 0 u
PROCESS WATER
t (115~230GAL:/TON) I 480 ~ 960 I/KKg
TO: OTHER PROCESSES
I I I I I I a:
z I o
j t~ <( I a: UUJIUJ o?I Q 1-<1'. x I<( - 0 ~ Z-lo?S ~ QI a: f>RILL
~ I :;j: TOWER
EVAPORATOR
STRIPPER
UREA SOLUTION
FIGURE 16
UREA PLANT
FLOW RATE PER TON UREA
AIR & WATER VAPOR r-------+ I
EXHAUST FAN
AIR
COATING
UREA PRILLS
CLARIFICATION
EFFLUENT
(2 ~ 3 GAL/TON) 8.3 ~ 125I/KKg
concentration step takes place in flash evaporators designed with minimum residence time to prevent the formation of biuret. (NHlCONHCONHl • HlO) This biuret has a deleterous effect on crops. The basic disadvantage in selecting prilling versus crystallization or a combination is the degree of biuret formation. Frilling gives a product with about 1% biuret while crystallization only has .11. A combination of the two processes. results in a biuret content of about .5%.
59

Ammonium nitrate is a major source of nit~ogen fertilizer in the United States. The total production in the u.s. in 1971 was 7,800,000 kkg (8,600,000 short tons). It is an excellent fertilizer being high in nitrogen (35%) and relatively low in cost.
Ammonium nitrate is made by reacting ammonia with nitric acid:
NHJ + HNO] --. NH!!NOJ
This reaction is carried out in a low pressure vessel called the neutralizer (Figure 17). The high heat of reaction causes flash vaporization of water with some ammonia and nitrate going overhead leaving behind a liquid product which is 83% by weight ammonium nitrate. This product known as AN solution can be sold or it can be further processed into a dry product. The overhead vapors from the neutralizer may lead to an air pollution problem or if condensed, will have to be treated before being discharged.
If a dried product is desired, then the 83% AN solution is first concentrated up to 95% AN and then either prilled or crystallized. If prills are to be the final form of the ammonium nitrate, the concentrated solution is pumped to the top of a ~5 meter (150 ft.) to 61 meter (200 ft.) tower where it is sprayed downward into a rising flow of air. As the ammonium nitrate droplet forms it is solidified before it hits the bottom of the tower. These prills are then further dried to reduce the moisture to less than 0.5%. Following cooling, the prills are then coated with an anti-caking agent such as clay. Concentrator and prill tower air exhausts can contain significant amounts of fine particulate ammonium nitrate which represents both a significant air pollution problem and an indirect water pollution source via runoff and washoff.
A final dry crystalline ammonium nitrate product requires that the solution from the concentrator (95% AN) be fed to a continuous vacuum evaporation crystallizer. The cooling of the solution in the crystallizer causes crystals to form. A side stream of crystal solution is taken from the crystallizer and fed to a centrifuge for crystal separation. The centrifuge supernate is recycled back to the crystallizer. The crystals are removed from the centrifuge, dried to less than 0.1% water, cooled and coated with an anti-caking agent.
60

B FW TREATMENT
EFFLUENT
(3 ~ 17 GAL/TON) 12.5~71 I/KKg
AMMONIA
NITRIC ACID
HEAT
CLARIFICATION
EFFLUENT
(2 ~ 350 GAL/TON) 8.35 ~ 12.51/KKg
TON - SHORT TON
NEUTRALIZER
I<( w J:
+
CONDENSATE (50 ~ 110 GAL/TON) 200~460I/KKg r--
EXHAUST FAN
EVAPORATOR
I<( w J:
AMMONIUM NITRATE
SOLUTION
w 0 1-w <( I- a: <( I-
~ z z <( w z u 0 5 ~ u ~
<(
•
A CLARIFIED
WATER
PRILL TOWER
COOLING, DRYING &COATING
COOLING TOWER
BLOW- DOWN
(20 ~ 40 GAL/TON) 83.5 ~ 167 I/KKg
AMMONIUM NITRATE PRILLS
FIGURE 17
AMMONIUM NITRATE PLANT
FLOW RATE PER TON AMMONIUM NITRATE

Nitric Acid
Process DescriQtion
Nitric acid is produced by a number of processes in strengths from 55% to 100% acid. In 1971 there were some 8,450,000 kkg (9,300,000 short tons) of acid produced of which better than 80% was used for and/or produced at nitrogen fertilizer complexes. While varying strengths of acid are produced, the fertilizer industry uses a dilute acid (55% to 65%).
Nitric acid is produced in the United States by the ammonia oxidation process (Figure 18). In this process, ammonia .is reacted with air to produce oxides of nitrogen which are then further oxidized and absorbed in water producing a 55 to 65% nitric acid. The following reactions occur in the process:
2NO + 02 ~ 2N02
3NO2 + HlO ~ 2HNO1 + NO
The initial ammonia oxidation reaction takes place in the converter in the presence of a platinum-rhodium gauze catalyst at pressures from atmospheric up to 9.2 atm (120 psig). The exit gases from the converter may be in the temperature range of 705°c (l,300°F) to 980°c (l,800°F) and are used to superheat steam and preheat process air. The gases then pass through a waste heat boiler to generate steam for the air compressor drive turbine and for export. The quantity of steam generated by the process will range from 500 to 1,000 kg/kkg (1,000 to 2,000 lb/ton) of nitric acid. By this time, due to the lower temperature, the second reaction involving the oxidation of nitric oxide to nitrogen dioxide has begun to occur. Following some additional cooling to 38-49°c (100-120°F), where some of the water is condensed and forms nitric acid, the gases are passed up through an absorption column. Some additional air is also passed up through the column to oxidize the nitric oxide formed during the absorption step to nitrogen dioxide. Water (fed to the top of the absorber) acts as the absorbant giving product nitric acid out the bottom of the column. The absorber temperature is held constant by cooling water to improve the absorption efficiency_ Cooling water requirements will range from 104,000 to 146,000 1/kkg (25,000 to 35,000 gal/ton) of product.
The gases leaving the top of the absorber are fairly low in nitrogen oxides but may be catalytically reacted to further reduce these levels and, then depending on the process pressure, passed through a hot gas expander to recover some of the energy needed to drive the process air compressor. The differential energy required for the air compressor can be supplied by a helper turbine driven by the steam generated by the process.
62

"' w
STEAM CONDENSATE +------,
I AIR FROM ATMOS. I
I
TURBINE
:,.: u <( Ir.fl
EXPANDER
TAIL GAS
NITROGEN OXIDE
REMOVAL
~ AIR I~ 1----------+~---------,
AMMONIA AMMONIA OXIDATION
TON - SHORT TONS
r.f)
WASTE HEAT BOILER
SECONDARY OXIDATION
BOILER BLOW DOWN
(10 ~ 15 GAL/TON)
42 ~ 63 1/KKg
FIGURE 18
NITRIC ACID PLANT
WATER
C.W. IN
C.W. OUT C.W. IN ~------al
a:
~ C.W. IN al-----<( ____ _... ..
C.W. IN
C.W. OUT
MAKE-UP WATER
1250 ~ 2500 l.'KKg
'
COOLING
TOWER
I 1300 ~ 600 GAL.TONI
~
COOLING TOWER BLOW DOWN
(20,000 ~ 40,000 GAL.TONI
83,000 ~ 167,000 IKKg
PRODUCT-NITRIC ACID
FLOW RATE PER TON 100% NITRIC ACID


SECTION IV lNDY§TRX~IIQQEI!a!lQN
The task of dividing the many fertilizer processes into specific categories was considered one of the most important aspects of the study. A particular objective was to have the least possible number of categories in order to simplify the work of both enforcement officials and industry in the monitoring of effluent streams.
The factors considered in the overall categorization process included the following:
1. Industry division 2. Problems with separation of individual process effluents
within a plant complex 3. Plant size 4. Plant age 5. Effect of raw material variations 6. Existence, type and efficiency of air pollution control
equipment 7. Land area available for waste water containment
utilization of wastes 8. waste load characteristics 9. Treatability of wastes 10. Effect of rainfall - evaporation discrepancie·s
After completing the majority of the twenty-five (25) separate plant visits it became clear that only a small number of the above listed items had real overall meaning for categorization. All items effect plant effluent conditions and quantities. However, they do not all necessarily contribute to the categorization of processes. The final factors used to establish the categorization were:
1. Natural industry division 2. Waste load characteristics 3. Treatability of waste streams either by inter
process reuse or treatment technology
The application of these listed criteria resulted in the establishment of 5 subcategories for the industry. These together with their component processes are listed below:
A. PHOSPHATE SUBCATEGORY 1. Phosphate Rock Grinding 2. wet Process Phosphoric Acid 3. Phosphoric Acid Concentration 4. Phosphoric Acid Clarification 5. Normal superphosphate 6. Triple Superphosphate 7. Ammonium Phosphates 8. Sulfuric Acid
B. AMMONIA SUBCATEGORY
65

c. Urea Subcategory D. Ammonium Nitrate Subcategory E. Nitric Acid Subcategory
Industry Division
The fertilizer industry is composed of multi-product plants. With few exceptions a phosphate complex does not include nitrogen type processes (ammonia, urea, ammonium nitrate and nitric acid). This natural separation of the industry by the industry coupled with the other following factors indicates that phosphate fertilizer chemicals should constitute a separate category from nitrogen fertilizer chemicals.
Problefil.2 ~1th S§paratiQ!l Qf lndividual PrQ£~ Effluent Wiihin ~ Plant f.QID,Plex
A somewhat surprising fact brought to light in the study was the lack of information available on specific process effluents within a complex. Fertilizer complexes are gen~rally not physically designed to keep individual process streams separate. The reasons for this include: there previously was no reason to do so; simplification of underground sewer systems meant joint sewers and the practice of using effluent from one process as a liquid in another process.
This rationale is appropriate for phosphate fertilizer compl~xes, mainly because of the similar treatment technologies involved. However, at nitrogen fertilizer complexes inadequate treatment of pollutants will frequently result if the process waste waters from each component chemical are not dealt with separately.
Plant Size
There is a wide range of plant sizes for most chemicals in the fertilizer industry. However, plant size will not affect waste water characteristics or treatability.
There is also a wide range of plant ages in the fertilizer industry. This should not affect waste water characteristics or treatability to the degree where any additional subcategorization is required.
Eff~£LQLRaw Material Variations
Variations in the raw material will affect waste water characteristics in operations involving phosphate rock and the resultant phosphoric acid or phosphate. However, the effluent limitations in such cases take these variations into account. Another problem is that these variations are unpredictable and difficult to monitor, making subcategorization based upon this topic impracticable.
66

Exis1~n~!Y£e and Efficien£y_Qf Air Pollution Control Equipment
A major source of process waste water is from air scrubbers employed at all plants. The treatment technologies proposed are practicable regardless of the type or efficiency of air pollution control devices, and subcategorization is not warranted.
Land Area Availa£kfor Waste Water Containment
Confinement of process waste water in large ponds is universally practiced at phosphate fertilizer plants. These ponds range in size from 65 to 570 hectares (160 to 1400 acres). However, extremely large ponds are not necessary to achieve the degree of treatment necessary to recycle the process waste water. The principal point is that the ponds now exist and need not be expanded. Use of biological treatment of ammonia and nitrates in nitrogen fertilizer plants would require space for treatment ponds. If land availability is a problem, alternate methods of ammonia and nitrate removal are available.
Waste Load Ch2 racteristics
The phosphate and nitrogen segments of the fertilizer industry have different waste water characterics. For instance a phosphate complex effleunt would be acidic due to phosphoric, sulfuric, or nitric acids used in the process. A nitrogen fertilizer complex would generally be alkaline due to ammonia. Phosphates and fluorides will be present in the waste waters from a phosphate complex, nitrogen compounds from a nitrogen fertilizer complex. Within a nitrogen fertilizer complex the different chemicals will involve different forms of nitrogen. For instance, ammonia will naturally result from ammonia synthesis. Ammonia and nitrates will result from ammonium nitrate production. Ammonia and organic nitrogen will result from urea synthesis. such differences warrant subcategorization of these latter chemicals.
~atabiliiY of Wa.§lli
This is the principal factor used in determining subcategorization. Production of all phosphate fertilizer chemicals requires similar treatment methods (i.e. neutralization, lime precipitation, and settling). The only need for a discharge is during periods of excessive rainfall. No process waste water is even generated in manufacturing nitric acid. On the other hand urea, ammonium nitrate and ammonia can each require a different treatment technique to achieve best practicable and best available technologies.
Effect of Rainfall - Evaporation Discrg£ancies
Because of the almost universal use of ponds fertilizer subcategory lengthy periods where evaporation and/or periods of rainfall of intensity necessitate a discharge. Rather than
67
in the phosphate rainfall exceeds abnormally highcreate a separate

subcategory, this problem is better handled as a factor by which the standards can be varied, since for any given month rainfall could exceed evaporation at any location.
68

General
SECTION V
WASTE CHARACTERIZATION
The intent of this section is to describe and identify the water usage and waste water flows in each individual process. Each type water usage and effluent is discussed separately and includes a tabulation indicating ranges of flow and contaminant concentrations for each process. Flow figures are presented on a per kkg of product basis to permit ready calculation of flow for any specific production rate. Water flow information is also presented on individual process water usage flowsheets to pictorially indicate the various water flows relative to the process equipment.
~Eb~te Fertiliz~r Industry
The eight process operations sulfuric acid, phosphate rock grinding, wet process phosphoric acid, phosphoric acid concentration, ~hosphoric acid clarification, normal superphosphate, triple superphosphate, ammonium phosphates - in the phosphate fertilizer subcategory have the following types of water usage and wastes.
A. Water Treatment Plant Effluent
Includes raw water filtration and clarification, water softening, and water deionization. All these operations serve only to condition the plant raw water to the degree necessary to allow its use for process water and steam generation.
B. Closed Loop cooling Tower Blowdown
c. Boiler Blowdown
D. Contaminated Water (Gypsum Pond Water)
E. Make-up Water
F. Spills and Leaks
G. Non-Point source Discharges These include surface waters from rain or snow that become contaminated.
H. Contaminated Water (Gypsum Pond Water) Treatment
Each of the above listed types of water usage and wastes are identified as to flow and contaminant content under separate
69

headings. Detailed flow diagrams were previously presented in Figures 3 through 14.
A.~er Trfilfilfil!LPlant Effluent
Basically only the sulfuric acid process has a water treatment effluent. This 1300-1670 1/kkg (310-400 gal/ton) effluent stream consists principally of only the impurities removed from the raw water (such as carbonates, bicarbonates, hydroxides, silica, etc.) plus minor quantities of treatment chemicals.
The degree of water treatment of raw water required is dependent on the steam pressure generated. Generally medium-pressure 9.5-52 atm (125-750 psig) systems are used and do require rather extensive make-up water treatment. Hot lime-zeolite water treatment is the most commonly used.
There are phosphate complexes particularly along the Mississippi River which use river water both for boiler make-up and process water. In these plants it is necessary to treat the river water through a settler or clarification system to remove the suspended solids present in the river water before conventional water treatment is undertaken. Effluent limitations for water treatment plant effluent components are not covered in this report. They will be established at a later date.
B.£lmaed Loop cooling Tower_~!Qwdown
The cooling water requirements and normal blowdown quantities are listed in the following table. Effluent limits with respect to thermal components and rust and bacteria inhibiting chemicals is cooling tower blowdown or for once through cooling water are not covered in this report, but will be established at a later date.
70

cooling Water
Process Circulation Requirement 1/kkg gal/ton
Sulfuric Acid 75000-83000 (per ton 100%) HlSO~
Rock Grinding 33-625 (per ton rock)
Phosphoric Acid 0-19000 (per ton Pl0,2)
Phos. A. Cone. None (per ton Pl0,2)
Phos. A. Clarifi- 690-3200 cation (per ton PJ0,2)
Normal Super None (per ton product)
Triple Super None (per ton product)
Ammon Phos. None (per ton product)
18000-20000
8-150
0-4500
None
165-770
None
None
None
Discharge Requirement 1/kkg gal/ton
1670-2500 400-600
33-625* 8-150*
0-19000* 0-4500*
None None
690-3200* 165-770*
None None
None None
None None
* Non-contaminated discharge water.
only temperature increase in
Closed loop cooling systems function with forced air and water circulation to effect water cooling by evaporation. Evaporation acts to concentrate the natural water impurities as well as the treatment chemicals required to inhibit scale growth, corrosion, and bacteria growth. such cooling systems require routine blowdown to maintain impurities at an acceptable operating level. The blowdown quantity will vary form plant to plant and is dependent upon overall cooling water circulation system.
The quality of the cooling system blowdown will vary with the make-up water impurities and inhibitor chemicals used. The type of process equipment being cooled normally has no bearing on the effluent quality. cooling is by an indirect (no process liquid contact) means. The only cooling water contamination from process liquids is through mechanical leaks in heat exchanger equipment. such contamination does periodically occur and continuous monitoring equipment is used to detect such equipment failures.
The table below lists the normal range of contaminants that may be found in cooling water blowdown systems.
71

Chromate Sulfate Chloride Phosphate Zinc TDS ss Biocides
mg/l
0-250 500-3000
35-160 10-50
0-30 500-10,000
0-50 0-100
cooling tower blowdown can be treated separately or combined with other plant effluents for treatment. The method to be employed is dependent upon the chemical treatment method used and cost. Those plants which utilize chromate or zinc treatment compounds generally treat the blowdown stream separately to minimize effluent treatment costs.
The only steam generation equipment in a phosphate complex other than possibly auxillary package boilers is in the sulfuric acid plant. Medium pressure, 9.5-52 atm (125-750 psig), steam systems are the most generally used.
Boiler blowdown quantities are normally 1300-1670 1/kkg (310-400 gal/ton). Typical contaminate concentration ranges are listed below. Separate effluent limitations for boiler· blowdown with respect to both thermal discharge and specific contaminants are not covered in this report. They will be established at a later date.
Contaminant ------------Phosphate Sulfite TDS Zinc Alkanlinity Hardness Silica (Si01)
D.£.Qntaminated wat~~sum Pong_~lli)
mg/1
5-50 0-100
500-3500 0-10
50-7 00 50-500 25-80
contaminated water is used to supply essentially all the water needs of a phosphate fertilizer complex. The majority of U.S. phosphate fertilizer installations impound and recirculate all water which has direct GOntact with any of the process gas or liquid streams. This impounded and reused water accumulates sizeable concentrations of many cations and anions, but particularly F and P. concentrations of 8500 mg/1 F and in
72

excess of 5000 mg/1 Pare not unusual. Concentration of radium 226 in recycled gypsum pond water is 60-100 picocuries per liter. Acidity of the water also reaches extremely high levels (pH 1-2). Use of such poor quality water necessitates that the process equipment materials of construction be compatible with the corrosive nature of the water.
Contaminated water is used in practically all process equipment in the phosphate subcategory except sulfuric acid manufacturing and rock grinding. The water requirements of such major water using equipment as barometric condensers, gypsum sluicing, gas scrubbing equipment, and heat exchangers are all supplied by contaminated water. Each time the water is reused, the contaminate level is increased. While this contaminated water is a major process effluent, it is not discharged from the complex. The following table lists ranges of contaminated water usage for each process.
P!;OCe_§_§
sulfuric Acid Rock Grinding
wet Process Phosphoric Acid NPK Process-Nitric Acid
Acidulation Phosphoric Acid Concentra
tion Phosphoric Acid Clarifica-
tion Normal Superphosphate Triple superphosphate Ammonium Phosphate
E.Make-up w~~!:
1/kkg
None None
16400-20800
1000-2300
2500-2600
690-1040 940-1040 660-1040
5000-6500
None None
3800-5000
240-540
550-570
225-250 225-250 158-250
1200-1500
Make-up water in a phosphate complex is defined as fresh water untreated except for suspended solids removal. Normally fresh water use to all process units is held to an absolute minimum. Such restraint is necessary because all make-up water used finds its way into the contaminated water system. Excessive fresh water use will therefore needlessly increase the contaminated water inventory beyond the containment capacity. This in turn means contaminated water must undergo costly treatment before discharge to natural drainage whenever such discharge is permitted.
Normal ranges of make-up water use are listed below for each of the process units. There is no discharge except into a process stream or to the contaminated water system.
73

Process ---Sulfuric Acid Rock Grinding Wet Process Phosphoric Acid Phosphoric Acid Concentration Phos Acid Clarification Normal Superphosphate Triple superphosphate Ammonium Phosphates
Make-uE ~~t~r_Usage
1/k)sg 63-83 None None 0.8-1.6 None None
NNone None
gal/ton 15-20 None None
0.2-0.4 None None None None
Spills and leaks in most phosphate fertilizer process units are collected as part of the housekeeping procedure. The collected material is, where possible, re-introduced directly to the process or into the contaminated water system. Spillage and leaks therefore do not normally represent a direct contamination of plant effluent streams that flow directly to natural drainage.
The primary origin of such discharges is dry fertilizer material which dusts over the general plant area and then dissolves in rain or melting snow. The magnitude of this contaminant source is a function of dust containment, housekeeping, snow/rainfall quantities, and the design of the general plant drainage facilities. No meaningful data was obtained on this intermittant discharge stream.
H.Contaminated Water 1gy122um Pong__~~~LTreatm~nt SyS!fil!l
The contaminated water treatment system discharge effluent is the only major discharge stream from a phosphoric acid complex other than the water treatment and blowdown streams associated with the sulfuric acid process. Discharge from this system is kept to an absolute minimum due to the treatment cost involved. In fact, several complexes report that they have not treated and discharged water for several years. The need to treat and discharge water has been previously mentioned to be dependent upon the contaminated water inventory. As a result, water discharged from the treatment system is not done continuously throughout the year. Once the necessity for treatment o~curs, however, the flow is continuous for that period of time required to adjust the contaminated water inventory. Normally, this period is 2-4 months per year, but is primarily dependent upon the rainfall/evaporation ratio and occurence of concentrated rainfall such as an abnormal rainy season or a hurricane. Some phosphate fertilizer installations in the Western U.S. perennially have favorable rainfall/evaporation ratios and never have need to treat or discharge water. The quantity of water discharged from the contaminated water treatment system is
74

strictly dependent upon the design of the treatment has no direct connection to production tonnage. water treatment systems generally have capacities 1/min (500-1000 gpm).
system and Contaminated
of 2085-4170
The common treatment system is a two-stage liming process. Three main contaminated water parameters, namely pH, F, and Pare addressed.
~m¼um, Arsen.i£.L.._Ysnadium, Uranium and Radium 226
The amounts of cadmium, arsenic, vanadium and uranium present in Florida and Western phosphate rocks were reviewed. These elements are present in small concentrations in the rocks as shown by the following table. In general, these elements are solubilized by the phosphate rock acidulation process and tend to be retained in the acid rather than discarded with the gypsum waste. Only cadmium will be found in measureable quantities in the gypsum pond, although small. A toxic limitation for this pollutant will be established which will cover any discharge of cadmium from the fertilizer categories. Radium 226 is a decay product of uranium that occurs in the recycled gypsum pond water in the 60-100 pic9curies/ liter range. However, its presence in the effluent is controlled with control of phosphorus and fluoride.
Arsenic as As0J cadmium as Cd0 Uranium as U]0~ Vanadium as Vl0J
Phosph2!e RO£~ (ppm)
Florida ~~t~m
5-30 ,o
100~200 10-200
75
6-140 150
50-100 400-4000
NiSroqeJLFertilizer Industry
The four process operations - ammonia, urea, ammonium nitrate, nitric acid - in the nitrogen fertilizer category, discharge the following types of waste water.
A.Water treatment plant effluent (includes raw water filtration and clarification, water softening, and water deionization)
B.Closed loop cooling tower blowdown
C.Boiler blowdown
D.Compressor blowdown
E.Process condensate
F.Spills and leaks that are collected in pits or trenches
G.Non-point source discharges that are "collected" due to rain or snow.
Detailed process flow diagrams have previously been presented in Figures 15 through 18.
A.Water Treatment Plant Effluent --------~ -The total effluent stream from a combined water treatment system will range from 8 to 20 1/kkg (2 to 5 gal/ton) of product with an ammonia plant having the larger amount due to the large amounts of raw water used. The contaminants in this effluent are mainly due to the initial contaminants in the raw water and therefore would be specific to the area and geographic conditions rather than the process plants involved. If the water treatment plant effluent contains ammonia due to the use of stripped, process condensate as process or boiler water makeup (replacing raw water makeup), then the ammonia - N discharge allowance is applicable. Effluent limitations for specific components (other than ammonia - N) for treatment plant effluent are not covered in this report. They will be studied at a later time.
B.Cooling_~er Blowdown
The cooling water requirements and expected blowdown requirements for the four process plants in the nitrogen fertilizer industry are listed in the table below.
76

Ammonia
Urea
Circulation Requirement
1/kkg
circulation Requirement gal/ton
Blowdown Requirement
1/kkg
104,000 to 25,000 to 1,670 to 417,000 100,000 2,920
41,700 to 10,000 to 375 to 167,000 40,000 1,470
Ammonia Nitrate 8,350 to 2,000 to 84 to 29,200 7,000 250
Nitric Acid 104,000 to 25,000 to 1,250 to 146,000 35,000 2,500
Blowdown Require men gal/ton
400 to 700
90 to 350
20 to 60
300 to 600
In this closed loop cooling tower system, chemicals are added to inhibit scale formation, corrosion and the growth of bacteria. Due to the nature of the make-up water, the inhibitor chemicals and the evaporation water loss from the tower, a quantity of blowdown is required to prevent excessive build up of chemicals and solids in the circualtion system. This quantity will vary, as shown in the above table, from plant to plant depending on the total circulation system.
The quality of this cooling system blowdown will vary mostly with make-up water condition and inhibitor chemicals and will not be greatly affected by the process plant associated with it. Any leaks that might develop in process or machinery exchangers should not significantly affect the contaminant concentration of the cooling water. The largest contaminant in the cooling water, that is neither intentionally added as an inhibitor nor comes in with make-up, is ammonia. Due to the proximity of the cooling tower in relation to any of the four nitrogen fertilizer operations, some atmospheric ammonia is absorbed in the cooling water.
The table below represents some possible range of concentration for some of the contaminants that might be contained in the cooling water blowdown.
Chromate Ammonia Sulfate Chloride Phosphate
mg/1
0-250 5-100
500-3,000 0-40
10-50
Zinc Oil TDS MEA
mg/1
0-30 10-1,000
500-10.000 0-10
This blowdown can be either treated by itself if necessary or combined with other effluents for total treatment. However. it is recommended that this stream be treated separately for chromate-zinc reduction since this is main source of these contaminants (Cr and Zn) to the total plant effluent. Effluent
77
limitations for noncontact cooling water are not covered in this report. They will be established at a later date.
C.Boiler BloWd£fill
The four nitrogen fertilizer processes will generate up to 6,000 kg of steam/kkg (12,000 lb of steam/ton) of product depending on what processes are at the plant site. Ammonia will have the highest steam load followed by nitric acid, urea and ammonium nitrate. The pressure of the steam generated by and/or used in these plants will range from atmospheric up to 103 atm- (1,5CO psig).
Depending on the operating pressure of the steam system, the treatment of the boiler feed water will vary from extensive, including deionization, at 103 atm (1,500 psig) down to not much more than filtration at atmospheric pressure. Inhibitor chemicals are also added to boilers to prevent corrosion and scale formation throughout the system.
The combination of make-up water quality and the addition of inhibitor chemicals necessitates blowdown periodically to remove contaminants from the boiler. Based on the actual steam generated in a nitrogen fertilizer complex, this blowdown quantity will range from 42 to 145 1/kkg (10 to 35 gal/ton) of product.
Typical compositions of contaminants in boiler blowdown from nitrogen complex boilers are as follows:
mg/1 mg/1
Phosphate 5-50 suspended Solids 50-300 Sulfite 0-100 Alkalinity 50-700 TDS 500-3500 Hardness 50-500 Zinc 0-10 SiOl 10-SC
This effluent stream may be treated separately if necessary or combined with the total effluent for treatment. Effluent limitations for boiler blowdown will be established at a later date.
D.Compressor Blowdown
This waste water effluent stream has been separated out because it should contain the largest proportional amount of oil and grease. Primarily, the blowdown containing oil will come from interstage cooling-separation in the reciprocating compressors operating on ammonia synthesis gas, on ammonia process air and on urea carbon dioxide. If these streams can be contained then oil separation equipment can be kept to a minimum.
78

Due to the nature and expense of reciprocating compressors they are usually replaced by centrifugal compressors, when the ammonia plant capacity reaches 550 kkg/day (600 ton/day). The use of centrifugal com~ressors results in much less oil and grease in the blowdown effluent. The quantity of this blowdown will vary and can run up to 208 1/kkg (50 gal/ton) of product.
E-~~fondensate
Process condensate, although it may have many of the similar contaminants, will be handled separately for each of the four process plants.
~monia UQCess Condensat~
Process steam supplied to the primary reformer is in excess of the stoichiometric amount required for the process reactions and, therefore, when the synthesis gas is cooled either by heat recovery or cooling water, a considerable amount of process condensate is generated. The quantity of this condensate will range from 1,500 to 2,500 kg/kkg (3,000 to 5,000 lb/ton} of product. The contaminants in this condensate may be ammonia, methanol, some organics from the coi recovery system and possibly some trace metals. The ammonia discharged in this waste stream can range from 1,200 - 1750 kg/1000 kkg (2400 ~ 3500 lb/1000 ton}.
u~ Proce§s Condensate
Following the urea forming reactions the pressure is reduced to allow ammonia, carbon dioxide and ammonium carbamate to escape from urea product. Partial condensation of these flashed gases along with the condensation of water vapor from the urea concentration step results in a condensate containing urea, ammonium carbamate, ammonia and carbon dioxide. The quantity of this stream will range from 417 to 935 1/kkg (100 to 225 gal/ton} of product. Ammonia discharge in this stream has been observed at the level of 9,000 kg/1000 kkg (18,000 lb/1000 ton} of urea product. Urea discharge at the rate of 33,500 kg/1000 kkg (67,000 lb/1000 ton} of urea product has also been cited.
Ammonium Nitrate Process_cond~~
The nitric acid-ammonia reaction being highly exothermic causes a large amount of water to be flashed off taking with it ammonia, nitric acid, nitrates and some nitrogen dioxide. If climatic conditions or air pollution regulations require that this strearr be condensed then this contaminated condensate will range between 208 and 458 1/kkg (50 and 110 gal/ton} of product. Ammonia discharges in the stream could be at the levels of 150 kg/100( kkg (300 lb/1000 ton} and ammonium nitrate at 7000 kg/1000 kk~ (14,000 lb/1000 ton} of ammonium nitrate product.
79

Using the ammonia oxidation process for production of 55% to 65% strength acid there are no process condensate effluent streams.
F.Collecteg_§12ills and Leaks
In all process plants there will be a small quantity of material either spilled, during loading or transferring, or leaking from some pump seal or bad valve. When this material, whether it be cooling water, process condensate, carbon dioxide scrubbing solution, boiler feed water or anything else, gets on a hard surface where it can be collected in a trench, then it will probably have to be treated before being discharged. The quantity of this material is not dependent on plant size, but more on the operating philosophy and housekeeping procedures.
Rain or snow can be a collection medium for a sizable quantity of contaminants. These contaminants may be air borne ammonia that is absorbed as the precipitation falls, or it may be urea or ammonium nitrate prill dust that is lying on the ground around prill towers. Dry fertilizer shipping areas may also have urea and/or ammonium nitrate that_ can be washed down by rain or snow. Pipe sweat and drip pots are another potential source of contaminants.
80
SECTION VI §t~IQLQE POLLOT~ PARAm~
General
The selection of pollutant parameters was a necessary early step of the study. Collection of meaningful data and sampling was dependent on knowing what fertilizer process contaminants are important so far as degradation of natural water resources are concerned.
The general criteria considered and reviewed in the selection of pollutant parameters included:
quality of the plant intake water
products manufactured
raw materials used
environmental harmfulness of the compounds or elements includ1 in process effluent streams
iHOS~ILllRTILIZER INDUSTRX
Effluent waste water from be treated to reduce the taminants to achievable suspended solids.
the phosphate fertilizer processes must following primary factors and conlevels: pH, phosphorus, fluorides, and
secondary parameters which should be monitored but do not warrant establishment of guidelines are: ammonia, total dissolved solids, temperature, cadmium, total chromium, zinc, vanadium, arsenic, uranium and radium 226. The chief reason for not establishing standards for the secondary parameters is that treatment of the primary parameters will effect removal of these secondary parameters. Another reason is that insufficient data exists to establish effluent limitations.
~QGEN F~RTILIZfilLINDUSTRY
Effluent waste waters from treated to maintain the recommended guidelines: nitrate nitrogen, and pH.
a nitrogen fertilizer complex must be following primary parameters within the
ammonia nitrogen, organic nitrog~n,
secondary parameters which should be monitored but do not warrant the setting of guidelines at this time are: chemical oxygen demand (COD), total dissolved solids (TDS), suspended solids, oil and grease, total chromium, zinc, iron, and nickel. The chief reason for not establishing standards for the secondary parameters is that treatment of the primary parameters will
81
effect removal of these secondary parameters. Another reason is that insufficient data exists to establish effluent limitations.
These selections are supported by the knowledge that best practicable control technology currently available does exist to control the chosen parameters and that improved technology is being developed and refined to meet best available technology economically achievable and best demonstrated technology.
Rationale for Selecting_!gentified Parameters
Phosghoru§
During the past 30 years, a formidable case has developed for the belief that increasing standing crops of aquatic plant growths, which often interfere with water uses and are nuisances to man, frequently are caused by increasing supplies of phosphorus. Such phenomena are associated with a condition of accelerated eutrophication or aging of waters. It is generally recognized that phosphorus is not the sole cause of eutrophication, but there is evidence to substantiate that it is frequently the key element in all of the elements required by fresh water plants and is generally present in the least amount relative to need. Therefore, an increase in phosphorus allows use of other, already present, nutrients for plant growths. Phosphorus is usually described, for this reasons, as a "limiting factor."
When a plant population is stimulated in production and attains a nuisance status, a large number of associated liabilities are immediately apparent. Dense populations of pond weeds make swimming dangerous. Boating and water skiing and sometimes fishing may be eliminated because of the mass of vegetation that serves as a physical impediment to such activities. Plant populations have been associated with stunted fish populations and with poor fishing. Plant nuisances emit vile stenches, impart tastes and odors to water supplies, reduce the efficiency of industrial and municipal water treatment, impair aesthetic beauty, reduce or restrict resort trade, lower waterfront property values, cause skin rashes to man during water contact, and serve as a desired substrate and breeding ground for flies.
Phosphorus in the elemental form is particularly toxic, and subject to bioaccumulation in much the same way as mercury. colloidal elemental phosphorus will poison marine fish (causing skin tissue breakdown and discoloration}. Also, phosphorus is capable of being concentrated and will accumulate in organs and soft tissues. Experiments have shown that marine fish will concentrate phosphorus from water containing as little as 1 ug/1.
FlYQrides
As the most reactive non-metal, fluorine is never found free in nature but as a constituent of fluorite or fluorspar, calcium fluoride, in sedimentary rocks and also of cryolite, sodium aluminum fluoride, in igneous rocks. owing to their origin only
82

in certain types of rocks and only high concentrations are not a surface waters, but they may occur in ground waters.
in a few regions, fluorides in common constituent of natural in detrimental concentrations
Fluorides are used apparatus, as a flux wood and mucilages, chemical industries,
as insecticides, for disinfecting brewery in the manufacture of steel, for preserving for the manufacture of glass and enamels, in for water treatment, and for other uses.
Fluorides in sufficient quantity are toxic to humans, with doses of 250 to 450 mg giving severe symptoms or causing death.
There are numerous articles describing the effects of fluoridebearing waters on dental enamel of children; these studies lead to the generalization that water containing less than 0.9 to 1.0 mg/1 of fluoride will seldom cause mottled enamel in children, and for adults, concentrations less than 3 or 4 mg/1 are not likely to cause endemic cumulative fluorosis and skeletal effects. Abundant literature is also available describing the advantages of maintaining 0.8 to 1.5 mg/1 of fluoride ion in drinking water to aid in the reduction of dental decay, especially among children.
Chronic fluoride poisoning of livestock has been observed in areas where water contained 10 to 15 mg/1 fluoride. concentrations of 30 - 50 mg/1 of fluoride in the total ration of dairy cows is considered the upper safe limit. Fluoride from waters apparently does not accumulate in soft tissue to a significant degree and it is transferred to a very small extent into the milk and to a somewhat greater degree into eggs. Data for fresh water indicate that fluorides are toxic to fish at concentrations higher than 1.5 mg/1.
Acidity and alkalinity are reciprocal terms. Acidity is produced by substances that yield hydrogen ions upon hydrolysis and alkalinity is produced by substances that yield hydroxyl ions. The terms "total acidity" and "total alkalinity" are often used to express the buffering capacity of a solution. Acidity in natural waters is caused by carbon dioxide, mineral acids, weakly dissociated acids, and the salts of strong acids and weak bases. Alkalinity is caused by strong bases and the salts of strong alkalies and weak acids.
The term pH is a logarithmic expression of the concentration of hydrogen ions. At a pH of 7, the hydrogen and hydroxyl ion concentrations are essentially equal and the water is neutral. Lower pH values indicate acidity while higher values indicate alkalinity. The relationship between pH and acidity or alkalinity is not necessarily linear or direct.
Waters with a pH below structures, distribution
6.0 are corrosive to water works lines, and household plumbing fixtures
83

and can thus add such constituents to drinking water as iron, copper, zinc, cadmium and lead. The hydrogen ion concentration can affect the "taste" of the water. At a low pH water tastes 11 sour11 • The bactericidal effect of chlorine is weakened as the pH increases, and it is advantageous to keep the pH close to 7. This is very significant for providing safe drinking water.
Extremes of pH or rapid pH changes can exert stress conditions or kill aquatic life outright. Dead fish, associated algal blooms, and foul stenches are aesthetic liabilities of any waterway. Even moderate changes from "acceptable" criteria limits of pH are deleterious to some species. The relative toxicity to aquatic life of many materials is increased by changes in the water pH. Metalocyanide complexes can increase a thousand-fold in toxicity with a drop of 1.5 pH units. The availability of many nutrient substances varies with the alkalinity and acidity. Ammonia is more lethal with a higher pH.
The lacrimal fluid of the human eye has a pH of approximately 7.0 and a deviation of 0.1 pH unit from the norm may result in eye irritation for the swimmer. Appreciable irritation will cause severe pain.
Total Sus2ended Solids
Suspended solids include both organic and inorganic materials. The inorganic components include sand, silt, and clay. The organic fraction includes such materials as grease, oil, tar, animal and vegetable fats, various fibers, sawdust, hair, and various materials from sewers. These solids may settle out rapidly and bottom deposits are often a mixture of both organic and inorganic solids. They adversely affect fisheries by covering the bottom of the stream or lake with a blanket of material that destroys the fish-food bottom fauna or the spawning ground of fish. Deposits containing organic materials may deplete bottom oxygen supplies and produce hydrogen sulfide, carbon dioxide, methane, and other noxious gases.
In raw water sources for domestic use, state and regional agencies generally specify that suspended solids in streams shall not be present in sufficient concentration to be objectionable or to interfere with normal treatment processes. suspended solids in water may interfere with many industrial processes, and cause foaming in boilers, or encrustations on equipment exposed to water, especially as the temperature rises. suspended solids are undesirable in water for textile industries; paper and pulp; beverages; dairy products; laundries; dyeing; photography; cooling systems, and power plants. suspended particles also serve as a transport mechanism for pesticides and other substances which are readily sorbed into or onto clay particles.
Solids may the bed discharged materials,
be suspended in water for a time, and then settle to of the stream or lake. These settleable solids with man's wastes may be inert, slowly biodegradable
or rapidly decomposable substances. While in
84

suspensionr they increase the turbidity of the waterr reduce light penetration and impair the photosynthetic activity of aquatic plants.
solids in suspension are aesthetically displeasing. When they settle to form sludge deposits on the stream or lake bed, they are often much more damaging to the life in waterr and they retain the capacity to displease the senses. Solids, when transformed to sludge deposits, may do a variety of damaging things, including blanketing the stream or lake bed and thereby destroyi~g the living spaces for those benthic organisms that would otherwise occupy the habitat. When of an organic and therefore decomposable naturer solids use a portion or all of the dissolved oxygen available in the area. Organic materials also serve as a seemingly inexhaustible food source for sludgeworms and associated organisms.
Turbidity is principally a measure of properties of suspended solids. It is substitute method of quickly estimating solids when the concentration is relatively
Ammoni~ and Nitrate Nitrogen
the light frequently
the total low.
absorbing used as a suspended
Ammonia is a common product of the decomposition of organic matter. Dead and decaying animals and plants along with human and animal body wastes account for much of the ammonia entering the aquatic ecosystem. Ammonia exists in its non-ionized form only at higher pH levels and is the most toxic in this state. The lower the pHr the more ionized ammonia is formed and its toxicity decreases. Ammoniar in the presence of dissolved oxygenr is converted to nitrate (NO]) by nitrifying bacteria. Nitrite (NOl) r which is an intermediate product between ammonia and nitrater sometimes occurs in quantity when depressed oxygen conditions permit. Ammonia can exist in several other chemical combinations including ammonium chloride and other salts.
Nitrates are considered to be among the poisonous ingredients of mineralized watersr with potassium nitrate being more poisonous than sodium nitrate. Excess nitrates cause irritation of the mucous linings of the gastrointestinal tract and the bladder; the symptoms are diarrhea and diuresisr and drinking one liter of water containing 500 mg/1 of nitrate can cause such symptoms.
Infant methemoglobinemiar a disease characterized by certain specific blood changes and cyanosisr may be caused by high nitrate concentrations in the water used for preparing feeding formulae. While it is still impossible to state precise conc~ntration limitsr it has been widely recommended that water containing more than 10 mg/1 of nitrate nitrogen (NOJ-N) should not be used for infants. Nitrates are also harmful in fermentation processes and can cause disagreeable tastes in beer. In most natural water the pH range is such that ammonium ions (NH!+) predominate. In alkaline watersr however, high concentrations of un-ionized ammonia in undissociated ammonium
85

hydroxide increase the toxicity of ammonia solutions. In streams polluted with sewage, up to one half of the nitrogen in the sewage may be in the form of free ammonia, and sewage may carry up to 35 mg/1 of total nitrogen. It has been shown that at a level of 1.0 mg/1 un-ionized ammonia, the ability of hemoglobin to combine with oxygen is impaired and fish may suffocate. Evidence indicates that ammonia exerts a considerable toxic effect on all aquatic life within a range of less than 1.0 mg/1 to 25 mg/1, depending on the pH and dissolved oxygen level present.
Ammonia can add to the problem of eutrophication by supplying nitrogen through its breakdown products. some lakes in warmer climates, and others that are aging quickly are sometimes limited by the nitrogen available. Any increase will speed up the plant growth and decay process.
Organic Nitrogen
Organic nitrogen contaminants in the waste waters consist mainly of urea and lesser amounts of organic COl scrubbing solutions. Such compounds can supply nutrient nitrogen for increased plant and algae growth in receiving waters.
The organic scrubbing solution - monethanolamine (MEA) - can add a slight BOD load to the effluent waste stream.
Dis~olY&Solids
In natural waters the dissolved carbonates, chlorides, sulfates, nitrates of calcium, magnesium, traces of ir0n, manganese and other
solids consist mainly of phosphates, and possibly
sodium, and potassium, with substances.
Many communities in the United States and in other countries use water supplies containing 2000 to 4000 mg/1 of dissolved salts, when no better water is available. such waters are not palatable, may not quench thirst, and may have a laxative action on new users. Waters containing more than 4000 mg/1 of total salts are generally considered unfit for human use, although in hot climates such higher salt concentrations can be tolerated whereas they could not be in temperate climates. Waters containing 5000 mg/1 or more are reported to be bitter and act as bladder and intestinal irritants. It is generally agreed that the salt concentration of good, palatable water should not exceed 500 mg/1.
Limiting concentrations of dissolved solids for fresh-water fish may range from 5,000 to 10,000 mg/1, according to species and prior acclimatization. Some fish are adapted to living in more saline waters, and a few species of fresh-water forms have been found in natural waters with a salt concentration of 15,000 to 20,000 mg/1. Fish can slowly become acclimatized to higher salinities, but fish in waters of low salinity cannct survive sudden exposure to high salinities, such as those resulting from
86
discharges of oil-well brines. Dissolved solids may influence the toxicity of heavy metals and organic compounds to fish and other aquatic life, primarily because of the antagonistic effect of hardness on metals.
waters with total dissolved solids over 500 mg/1 have decreasing utility as irrigation water. At 5,000 mg/1 water has little or no value for irrigation.
Dissolved solids in industrial waters can cause foaming in boilers and cause interference with cleaness, color, or taste of many finished products. High contents of dissolved solids also tend to accelerate corrosion.
Specific conductance is a measure of the capacity of water to convey an electric current. This property is related to the total concentration of ionized substances in water and water temperature. This property is frequently used as a substitute method of quickly estimating the dissolved solids concentration.
Temperature
Temperature is one of the most important and influ~ntial water quality characteristics. Temperature determines those species that may be present: it activates the hatching of young, regulates their activity, and stimulates or suppresses their growth and development; it attracts, and may kill when the water becomes too hot or becomes chilled too suddenly. colder water generally suppresses development. Warmer water generally accelerates activity and may be a primary cause of aquatic plant nuisances when other environmental factors are suitable.
Temperature is a prime regulator of natural processes within the water environment. It governs physiological functions in organisms and, acting directly or indirectly in combination with other water quality constituents, it affects aquatic life with each change. These effects include chemical reaction rates, enzymatic functions, molecular movements, and molecular exchanges between membranes within and between the physiological systems and the organs of an animal.
Chemical reaction rates vary with temperature and generally increase as the temperature is increased. The solubility of gases in water varies with temperature. Dissolved oxygen is decreased by the decay or decomposition of dissolved organic substances and the decay rate increases as the temperature of the water increases reaching a maximum at about 30°c (86°F). The temperature of stream water, even during summer, is below the optimum for pollution-associated bacteria. Increasing the water temperature increases the bacterial multiplication rate when the environment is favorable and the food supply is abundant.
Reproduction cycles may be changed significantly by increased temperature because this function takes place under restricted temperature ranges. Spawning may not occur at all because
87

temperatures are too high. Thus, a fish population may exist in a heated area only by continued immigration. Disregarding the decreased reproductive potential, water temperatures need not reach lethal levels to decimate a species. Temperatures that favor competitors, predators. parasites, and disease can destroy a species at levels far below those that are lethal.
Fish food organisms are altered severely when ~emperatures approach or exceed 90°F. Predominant algal species change, primary production is decreased, and bottom associated organisms may be depleted or altered drastically in numbers and distribution. Increased water temperatures may cause aquatic plant nuisances when other environmental factors are favorable.
Synergistic actions of pollutants are more severe at higher water temperatures. Given amounts of domestic sewage, refinery wastes, oils, tars, insecticides, detergents, and fertilizers more rapidly deplete oxygen in water at higher temperatures, and the respective toxicities are likewise increased.
When water temperatures increase, the predominant algal species may change from diatoms to green algae, and finally at high temperatures to blue-green algae, because of species temperature preferentials. Blue-green algae can cause serious odor problems. The number and distribution of benthic organisms decreases as water temperatures increase above 90°F, which is close to the tolerance limit for the population. This could seriously affect certain fish that depend on benthinc organisms as a food source.
The cost of fish being attracted to heated water in winter months may be considerable, due to fish mortalities that may result when the fish return to the cooler water.
Rising temperatures stimulate the decomposition of sludge, formation of sludge gas, multiplication of saprophytic bacteria and fungi (particularly in the presence of organic wastes), and the consumption of oxygen by putrefactive processes, thus affecting the esthetic value of a water course.
In general, marine water temperatures do not change as rapidly or range as widely as those of freshwaters. Marine and estuarine fishes, therefore, are less tolerant of temperature variation. Although this limited tolerance is greater in estuarine than in open water marine species, temperature changes are more important to those fishes in estuaries and bays than to those in open marine areas, because of the nursery and replenishment functions of the estuary that can be adversely affected by extreme temperature changes.
Cadmium humans, States, kidney,
in drinking water supplies is extremely hazardous to and conventional treatment, as practiced in the United
does not remove it. Cadmium is cumulative in the liver, pancreas, and thyroid of humans and other animals. A
88

severe bone and kidney syndrome in Japan has been associated with the ingestion of as little as 600 ug/day of cadmium.
Cadmium is an extremely dangerous cumulative toxicant, causing insidious progressive chronic poisoning in mammals, fish, and probably other animals because the metal is not excreted. Cadmium could form organic compounds which might lead to mutagenic or teratogenic effects. Cadmium is known to have marked acute and chronic effects on aquatic organisms also.
cadmium acts synergistically with other metals. copper and zinc substantially increase its toxicity. Cadmium is concentrated by marine organisms, particularly molluscs, which accumulate cadmium in calcareous tissues and in the viscera. A concentration factor of 1000 for cadmium in fish muscle has been reported, as have concentration factors of 3000 in marine plants, and up to 29,600 in certain marine animals. The eggs and larvae of fish are apparently more sensitive than adult fish to poisoning by cadmium, and crustaceans appear to be more sensitive than fish eggs and larvae.
Chromium
Chromium, in its various valence states, is hazardous to man. It can produce lung tumors when inhaled and induces skin sensitizations. Large doses of chromates have corrosive effects on the intestinal tract and can cause inflammation of the kidneys. Levels of chromate ions that have no effect on man appear to be so low as to prohibit determination to date.
The toxicity of chromium salts toward aquatic life varies widely with the species, temperature, pH, valence of the chromium, and synergistic or antagonistic effects, especially that of hardness. Fish are relatively tolerant of chromium salts, but fish food organisms and other lower forms of aquatic life are extremely sensitive. Chromium also inhibits the growth of algae.
In some agricultural crops, chromium can cause reduced growth or death of the crop. Adverse effects of low concentrations of chromium on corn, tobacco and sugar beets have been documented.
Occurring abundantly in rocks and ores, zinc is readily refined into a stable pure metal and is used extensively for galvanizing, in alloys, for electrical purposes, in printing plates, for dyemanufacture and for dyeing processes, and for many other industrial purposes. Zinc salts are used in paint pigments, cosmetics, pharmaceuticals, dyes, insecticides, and other products too numerous to list herein. Many of these salts (e.g., zinc chloride and zinc sulfate) are highly soluble in water; hence it is to be expected that zinc might occur in many industrial wastes. On the other hand, some zinc salts (zinc carbonate, zinc oxide, zinc sulfide) are insoluble in water and
89

consequently it is to be expected that some zinc will precipitate and be removed readily in most natural waters.
In zinc~mining areas, zinc has been found in waters in concentrations as high as 50 mg/1 and in effluents from metalplating works and small-arms ammunition plants it may occur in significant concentrations. In most surface and ground waters, it is present only in trace amounts. There is some evidence that zinc ions are adsorbed strongly and permanently on silt, resulting in inactivation of the zinc.
Concentrations of zinc in excess of 5 mg/1 in raw water used for drinking water supplies cause an undesirable taste which persists through conventional treatment. Zinc can have an adverse effect on man and animals at high concentrations.
In soft water, concentrations of zinc ranging from 0.1 to 1.0 mg/1 have been reported to be lethal to fish. Zinc is thought to exert its toxic action by forming insoluble compounds with the mucous that covers the gills, by damage to the gill epithelium, or possibly by acting as an internal poison. The sensitivity of fish to zinc varies with species, age and condition, as well as with the physical and chemical characteristics of the water. Some acclimatization to the presence of zinc is possible. It has also been observed that the effects of zinc poisoning may not become apparent immediately, so that fish removed from zinccontaminated to zinc-free water (after 4-6 hours of exposure to zinc) may die 48 hours later. The presence of copper in water may increase the toxicity of zinc to aquatic organisms, but the presence of calcium or hardness may decrease the relative toxicity.
Observed values for the distribution of zinc in ocean waters vary widely. The major concern with zinc compounds in marine waters is not one of acute toxicity, but rather of the long-term sublethal effects of the metallic compounds and complexes. From an acute toxicity point of view, invertebrate marine animals seem to be the most sensitive organisms tested. The growth of the sea urchin, for example, has been retarded by as little as 30 ug/1 of zinc.
Zinc sulfate has also been found to be lethal to many plants, and it could impair agricultural uses.
vanadium
Metallic vanadium does not occur free containing vanadium are widespread. soils and occurs in vegetation grown adversely effects some plants in mg/1.
in nature, but minerals Vanadium is found in many
in such soils. Vanadium concentrations as low as 10
Vanadium as calcium vanadate can inhibit the growth of chicks and in combination with selenium, increases mortality in rats.
90

Vanadium appears to inhibit the synthesis of cholesterol and accelerate its catabolism in rabbits.
Vanadium causes death to occur in fish at low concentrations. The amount needed for lethality depends on the alkalinity of the water and the specific vanadium compound present. The common bluegill can be killed by about 6 ppm in soft water and 55 ppm in hard water when the vanadium is expressed as vanadryl sulfate. Other fish are similarly affected.
Specific conductance is a measure of the capacity of water to convey an electric current. This property is related to the total concentration of ionized substances in water and water temperature. This property is frequently used as a substitute method of quickly estimating the dissolved solids concentration.
Arsenic
Arsenic is found to a small extent in nature in the elemental form. It occurs mostly in the form of arsenites of metals or as pyrites.
Arsenic is normally present in sea water at concentrations of 2 to 3 ug/1 and tends to be accumulated by oysters and other shellfish. concentrations of 100 mg/kg have been reported in certain shellfish. Arsenic is a cumulative poiso~ with long-term chronic effects on both aquatic organisms and on mammalian species and a succession of small doses may add up to a final lethal dose. It is moderately toxic to plants and highly toxic to animals especially as AsHJ.
Arsenic trioxider which also is exceedingly toxicr was studied in concentrations of 1.96 to 40 mg/1 and found to be harmful in that range to fish and other aquatic life. Work by the Washington Department of Fisheries on pink salmon has shown that at a level of 5.3 mg/1 of AslOJ for 8 days was extremely harmful to this species; on mussels, a level of 16 mg/1 was lethal in 3 to 16 days.
severe human poisoning can result from 100 mg concentrations, and 130 mg has proved fatal. Arsenic can accumulate in the body faster than it is excreted and can build to toxic levelsr from small amounts taken periodically through lung and intestinal walls from the air, water and food.
Arsenic is a normal constituent of most soilsr with concentrations ranging up to 500 mg/kg. Although very low concentrations of arsenates may actually stimulate plant growthr the presence of excessive soluble arsenic in irrigation waters will reduce the yield of crops, the main effect appearing to be the destruction of chlorophyll in the foliage. Plants grown in water containing one mg/1 of arsenic trioxides showed a blackening of the vascular bundles in the leaves. Beans and cucumbers are very sensitive, .while turnips, cerealsr and grasses are relatively resistant. Old orchard soils in Washington that
91

contained 4 to 12 mg/kg of arsenic trioxide in the top soil were found to have become unproductive.
Radioactivity
Ionizing radiation, when absorbed in living tissue in quantities substantially above that of natural background levels, is recognized as injurious. It is necessary, therefore, to prevent excessive levels of radiation from reaching any living organism humans, fishes, and invertebrates. Beyond the obvious fact that radioactive wastes emit ionizing radiation, they are also similar in many respects to other chemical wastes. Man's senses cannot detect radiation unless it is present in massive amounts.
Plants and animals, to be of any significance in the cycling of radionuclides in the aquatic environment, must accumulate the radionuclide, retain it, be eaten by another organism, and be digestible. However, even if an organism accumulates and retains a radionuclide and is not eaten before it dies, the radionuclide will enter the "biological cycle" through organisms that decompose the dead organic material into its elemental components. Plants and animals that become radioactive in this biological cycle can thus pose a health hazard when eaten by man.
Aquatic life may receive radiation from radionuclides present in the water and substrate and also from radionuclides that may accumulate within their tissues. Humans can acquire radionuclides through many different pathways. Among the most important are through drinking contaminated water, and eating fish and shellfish that have concentrated nuclides from the water. Where fish or other fresh or marine products that have accumulated radioactive materials are used as food by humans, the concentrations of the nuclides in the water must be further restricted, to provide assurance that the total intake of radionuclides from all sources will not exceed the recommended levels.
In order to prevent unacceptable doses of radiation from reaching humans, fish, and other important organisms, the concentrations of radionuclides in water, both fresh and marine, must be restricted.
Radium-226 is one of the most hazardous radioisotopes of the uranium decay scheme, when present in water. The human body preferentially utilizes radium in lieu of calcium when present in food or drink. Plants and animals concentrate radium, leading to a multiplier effect up the food web.
Radium-226 decays by alpha emission into radon-222, a radioactive gas with a half life of 3.8 days. The decay products of radon-222, in turn, are particulates which can be adsorbed onto respirable · particles of dust. Radon and its decay products has been implicated in an increased incidence of lung cancer in those workers exposed to high levels (Bureau of Mines, 1971). Heating
92

or grinding of phsophate rock would liberate radon and its decay products to the surrounding atmosphere.
It is generally agreed that unlilke other materials, there is no threshold value for radiation exposure. Accordingly, the Federal Radiation council has repeatedly stated that all radiochemical material releases are to be kept to the minimum practicably obtainable. The council states "It should be general practice to reduce exposure to radiaiton, and positive efforts should be carried out to fulfill the sense of these recommendations. It is basic that exposure to radiation should result from a real determination of its necessity (Federal Radiation Council, 1960)."
Qi!_and G~™
Oil and grease exhibit an oxygen demand. Oil emulsions may adhere to the gills of fish or coat and destroy algae or other plankton. Deposition of oil in the bottom sediments can serve to exhibit normal benthic growths, thus interrupting the aquatic food chain. soluble and emulsified material ingested by fish may taint the flavor of the fish flesh. water soluble components may exert toxic action on fish. Floating oil may reduce the reaeration of the water surface and in conjunction with emulsified oil may interfere with photosynthesis. Water insoluble components damage the plumage and costs of water animals and fowls. Oil and grease in a water can result in the formation of objectionable surface slicks preventing the full aesthetic enjoyment of the water.
Oil spills can damage the surface of boats and can destroy the aesthetic characteristics of beaches and shorelines.
Elemental are found problem soluble soluble
nickel seldom occurs in nature, in many ores and minerals. As a
in water pollution because it in, water. Many nickel salts, in water.
but nickel compounds pure metal it is not a is not affected by, or however, are highly
Nickel is extremely toxic to citrus plants. It is found in many soils in California, generally in insoluble form, but excessive acidification of such soil may render it soluble, causing severe injury to or the death of plants. Many experiments with plants in solution cultures have shown that nickel at 0.5 to 1.0 mg/1 is inhibitory to growth.
Nickel salts can kill fish at very low concentrations. Data for the fathead minnow show death occurring in the range of 5-43 mg, depending on the alkalinity of the water.
Nickel is present in coastal and open ocean concentrations in the range of 0.1 - 6.0 ug/1, although the most common values are 2 -3 ug/1. Marine animals contain up to 400 ug/1, and marine plants
93

contain up to 3,000 ug/1. The lethal limit of nickel to some marine fish has been reported as low as 0.8 ppm. concentrations of 13.1 mg/1 have been reported to cause a 50 percent reduction of the photosynthetic activity in the giant kelp (Mag29ysti§ 2yrif~G) in 96 hours, and a low concentration was found to kill oyster eggs.
The methods of analysis to be used for quantitative determination are given in the Feg§~!_Regi~X 40 CFR 130 for the following parameters pertinent to this study:
alkalinity (and acidity) ammonia nitrogen arsenic cadmium chromium fluoride hardness nitrate nitrogen nitrogen, total kjeldahl oxygen demand, chemical phosphorus solids, total suspended nonfilterable solids, total temperature zinc
Organic nitrogen should be analyzed according to .§!..2nd~g Methods fo!: th§ Examinsii£n 2.£ Watfil: s!!9 ~!§ Water (SMWW) (ref W) method 215.
Oil and grease should be determined by M§!hOg§ £2!: ~h~mi£~1 Analysis Qf Water and Wastes (ref.X), page 217.
Vanadium should be determined by SMWW method 164.
94
SECTION VII
CO~TROL AND TREATMENT TECHNOLOGY
The factors and contaminants in fertilizer process effluent streams have for the most part been quite well identified and fairly well known for many years. As a consequence considerable effort has been expended to correct or minimize the majority of those which are particularly detrimental to natural water receiving bodies. Much of this work has been directed at correcting the source of the contamination or an in-process improvement rather than an end-of-pipe type of treatment. A large part of the motivation for such improvement has been economics that is, improved operating efficiency and costs. such improvements are just plain good business and justify capital expenditure required to achieve it. Additional or future corrective measures are for the most part going to require capital expenditures which will do nothing 'towards improving operational economics and will, in fact, increase operational costs.
With an appreciation of the above mentioned facts, it must be considered that future expenditures for waste water treatment should be well documented as to the need, the degree of water quality required, and assurance that the specified treatment is a workable and viable technology before the associated effluent limitation it is stipulated as an absolute requirement. It was with these conditions in mind that the following criteria were established as a basis for investigating treatment technology.
to determine the extent of existing waste water control and treatment technology
to determine the availability of applicable waste water control and treatment technology including that available by transfer from other industries
to determine the degree of treatment cost reasonability
Based upon these stated criterion the effort was made to factually investigate overall treatment technologies dealing with each of the primary factors and contaminants listed in section VI. The results of that investigation are covered separately for phosphate and nitrogen fertilizers.
CONTROL_lillJLTREATMENT ~NOLOGY fil!Q§~!;_Il;!ITlilll.B INDUSTRY
Process technology does exist for treatment and reduction of the primary factors and contaminants present in phosphate fertilizer process effluent streams to the levels proposed. These treatment technologies are reviewed in the following paragraphs.
95

Sulfuric Acid Plant Effluent control ---- --~~----A sulfuric acid plant has no inherent water pollutants associated with the actual production of acid. An indispensible part of the process, however, is heat removal. This heat removal is accomplished with steam generating equipment and cooling towers. Both of these cooling methods require blowdown and subsequent disposal to natural drainage. The amount and degree of impurities discharged vary widely with the raw water quality.
An inherent hazard of any liquid handling process is the occurrence of an occasional accidental break and operator error. In a sulfuric acid plant the sulfuric acid cooling coils are most prone to an accidental break. on these occasions the cooling tower water quickly becomes contaminated. In turn, the normally acceptable practice is to take care of that break as soon as it is discovered and protect the natural drainage waters.
Proces.§_~~£D;ption
The facilities are relatively simple. It involves the installation of a reliable pH or conductivity continuous monitoring unit on the plant effluent stream (preferably the combined plant effluent stream but at least on the cooling tower blowdown). A second part of the system is a retaining area through which noncontaminated effluent normally flows. This retaining area can be any reasonable size but should be capable of retaining a minimum of 24 hours of the normal plant effluent stream. The discharge point from the retaining area requires a means of positive cutoff, preferably a concrete abutment fitted with a valve. A final part of the system is somewhat optional. For example, the retaining area could be provided with lime treatment facilities for neutralization. In addition equipment for transfering this acid water from the retaining area to a contaminated water holding or recirculating system could also be provided. Plants 002 and 009 provide such systems to control process leaks.
The procedure is that an acid break is detected by the water monitoring instrument, located at the inlet of the cooling tower, and causes an audible alarm to be sounded. It is preferable to also have the instrument automatically activate the positive cutoff at the discharge of the retaining area although this can be done manually. Activation of this system in turn necessitates a plant shutdown to locate the failure and initiate repairs. The now contaminated water in the retaining area must then be either neutralized in the pond or moved to a contaminated water storage area where it can be stored or neutralized through a central treatment system.
Figure 19 depicts a sketch of the suggested treatment facilities. such a system provides continuous protection of natural drainage waters as well as means to correct a process failure. The primary factor to control is pH. sufficient neutralization to raise the contaminated water pH to 6 is required. Neutralization is preferably by use of lime. Lime serves not only to neutralize
96

SULFURIC ACID PROCESS PLANT
TANK
TO EFFLUENT DISPOSAL
PH MONITOR
--- -, / .- - - - - - - - TO GYPSUM POND / (-1:_- (ALTERNATE) _____ .,, I. 1 I -------,_.,,,,
CONTROLLED DISCHARGE RETENTION POND
t SITE VARIES WITH AREA AVAILABLE AND PLANT SIZE
FROM 4th CONVERTER MASS I
I
MAY BE BLOCKED/DAMMED TO PERMIT POND WATER PH CONTROL IF REQUIRED
TO ATMOSPHERE ...
(SIZE MIGHT BE 300' x 30' x 6')
SEE NOTE
FROM HT. I EXCHANGER
' I I FROM HT.
PH
CLARIFIED WATER I I I
CLARIFIED WATER I EXCHANGER
• I I
_J ABS
-----tTOWER TANK
FIGURE 19
I I .--+---.
I _J
ABS
COOLING TOWER
COOLING TONER
BLOWDOWN
NOTE- NOTE: THIS APPLIES TO BOTH CIRCLED ITEMS ADDED SINGLE AND DOUBLE FOR EFFLUENT CONTROL SULFURIC ACID EFFLUENT CONTROL ABSORPTION PLANTS
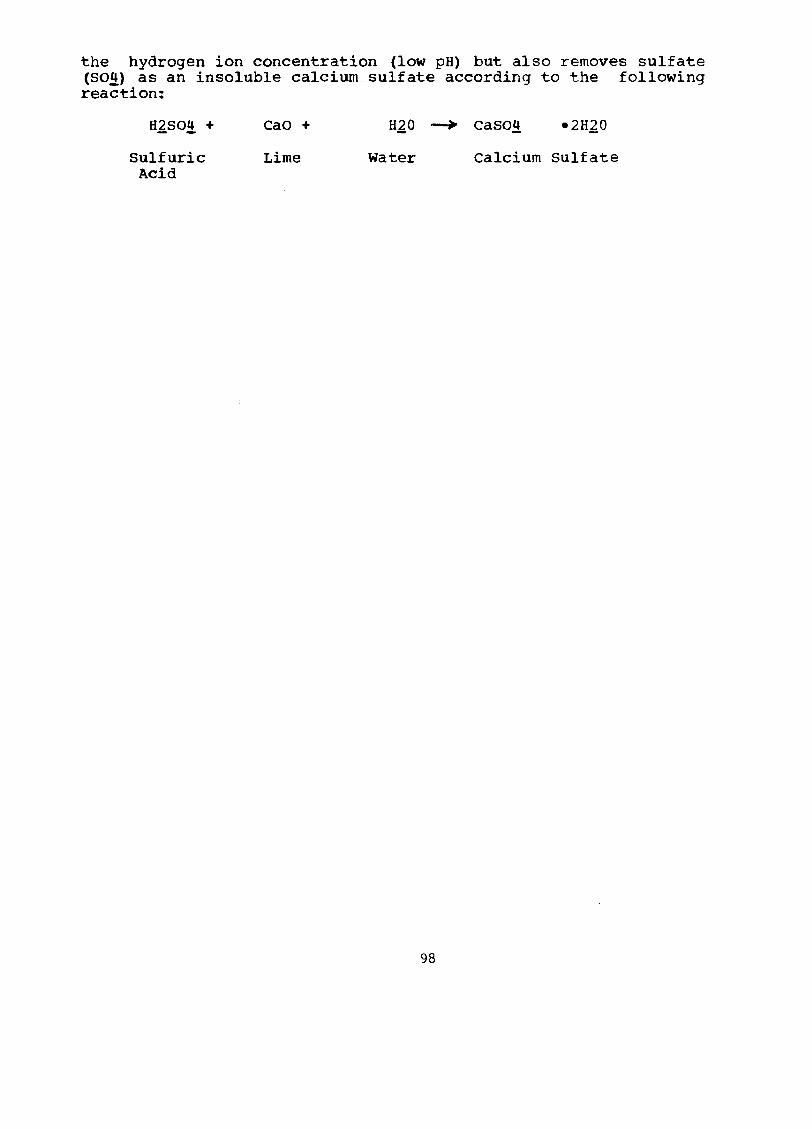
the hydrogen ion concentration (low pH) but also removes sulfate (SO!) as an insoluble calcium sulfate according to the following reaction:
Sulfuric Acid
cao +
Lime
Hl O --+ Ca SO! •2HJ0
water Calcium Sulfate
98

GYI2§ym_R2nd_jContaminatedl~ater Treatment
As described in Section V, all phosphate complex process effluents (contaminated water) are collected and impounded. The impoundment area,ranging in size from 65 to 570 hectares (160 to 1400 acres) serves two functions. one function is as a storage area for waste by-product gypsum from the phosphoric acid process. The second is as an area for atmospheric evaporative cooling of the contaminated water prior to its reuse back in the various process units. This pond system functions in a closed loop mode the majority of the time. The time interval that it can function as a no discharge closed loop system is dependent on the quantity of rainfall it can accept before the water storage capacity. is exceeded. Once the_ storage area approaches capacity it is necessary to begin treating the contaminated water for subsequent discharge to natural drainage bodies.
Proces§_~cription
Contaminated water can be treated effectively for control of the pollution parameters identified in Section VI, namely pH, phosphorus, and fluorides. Treatment is by means of a "double liming" or two stage lime neutralization procedure.
At least two stages of liming or neutralization are necessary to effect an efficient removal of the fluoride and phosphate contaminants. Fluorides are present in the water principally as fluosilicic acid with small amounts of soluble salts as sodium and potassium fluosilicates and hydrofluoric acid. Phosphorus is present principally as phosphoric acid with some minor amounts of soluble calcium phosphates.
The first treatment stage provides sufficient neutralization to raise the contaminated water containing up to 9000 mg/1 F and up to 6500 mg/1 P from pH 1-2 to pH 3.5-4.0. The resultant treatment effectiveness is, to a significant degree, dependent upon the mixing efficiency at the point of lime addition and the constancy of the pH control. At a pH level of 3.5 to 4.0, the fluorides will precipitate principally as calcium fluoride (CaFJ) as shown by the following chemical equation.
H2SiF6 + 3 cao + HlO ~ 3 CaFl + 2 Hl0 + Si0l - -Fluosilicic Lime Water calcium Water Silica
Acid fluoride
This mixture is then held in a quiescent area to allow the particulate caFl to settle.
Equipment used for neutralization ranges from crude manual distribution of lime with .localized agitation to a well engineered lime control system with a compartmented mixer. similarly the quiescent areas range from a pond to a controlled, settling rate thickener or settler. The partially neutralized
99

water following separation from the caFl, (pH 3.5-4.0) now contains 30-60 mg/1 F and up to 5500 mg/1 P. This water is again treated with lime sufficient to increase the pH level to 6.0 or above. At this pH level calcium compounds, primarily dicalcium phosphate plus additional quantities of caFl precipitate from solution. The primary reactions are shown by the following chemical equation:
2 H1PO! + cao + Phosphoric Lime
Acid
_.... Ca (HlPO!!,) l + cao + Monocalcium Lime
Phosphate
HlO Water
HlO Water
Ca(HlP04)2 Monocalcium
Phosphate
2CaHPO4 Dicalcium Phosphate
+ 2 HlO Water Water
+ 2 ttio Water
As before, this mixture is retained in a quiescent area to allow the CaHPO!!, and minor amounts of CaFl to settle.
The reduction of the P value is strongly dependent upon the final pH level, holding time, and quality of the neutralization facilities, particulary mixing efficiency. Figure 20 shows a sketch of a well designed "double lime" treatment facility. Plants 002, 007, 008, 009, 010, 014 and 019 all practice some degree of liming.
Laboratory and plant data for phosphorus and fluoride removal is presented below:
pH Phosphory§_jmg/ll Fl~ide Jmslll. laboratory plant laboratory plant
5.5 .... 17 6.0 42 14 6.5 24 - 12.5 7.0 500 18 13 12.5 7.5 330 14 8.5 12.5 8.0 200 12 6.8 12.5 8.5 120 8 5.8 12.5 9.0 20 6 5.2 12.5 9.5 3 3 4.8 12.5 10.0 1. 2 1. 2 4.6 12.5
Although the starting specific to that plant removal at high pH.
concentrations only, the data
are either arbitrary or does show significant
At plant 008 results from lime treatment show that phosphorus concentrations decrease with time as well as increasing pH. Phosphorus concentration vs pH with a 46 hour holding period were:
100

I-' 0 I-'
I LIME I HOPPER
~ ,...._...
DUST COLLECTOR v-=::! L. P. STEAM
~I r --- HOT WATER
STACK TANK
THICKENER
TO GYPSUM POND
FIGURE 20
POND WATER TREATMENT
hc,~rril STORAGE----,,
I
PhC
rZd~1 POND
l TO RIVER OR PROCESS UNITS

The time
El!
5.8 6.5 8.3
effect on phosphorus
~=hQ~
0 5
22 46
mg/1 P
20 9. 1 3.6
concentration
l2!!
7. 85 7.6 6.7 6.4
is:
mg!l_f
60 29 19
9
Data from three years of double lime treatment of gypsum pond effluent from plant 008 at a pH of 5 to 7 shows a phosphorus concentration (as P) of 10 to 40 mg/1.
Radium 226 is also precipitated by lime treatment increasingly with increasing pH as presented below:
pH
2.0 1.5 4.0 8.0-8.5
Radium 226 picocuries/1
91 65 7.6 0.04
Up to this point, nothing has been mentioned about the pollutant ammonia N in contaminated water. Any phosphate complex containing an ammonium phosphate unit will have NHJ-N in the contaminated water system. "Double lime" treatment will not reduce the N quantity, although at high pH (greater than ~.O), significant ammonia loss to ambient air can occur. To date there is no proven means of economically removing NHJ-N from aqueous solutions having such weak concentrations as 20-60 mg/1. The best method to keep the NHJ-N contaminant level low is to prevent its entry into the main contaminated water system. More about the manner that this can be done is discussed in the DAP selfcontained process discussion.
102

The contaminated (gypsum pond) water storage areas are surrounded by dikes. The base of these dikes are normally natural soil from the immediate surroundings. As the need develops to increase the height of the retaining dikes, gypsum is dug from inside the diked area and added to the top of the earthen base. Dikes in Florida now extend to a 100-120 ft. vertical height. These combined earth/gypsum dikes tend to have continual seepage of contaminated water through them. In order to prevent this seepage from reaching natural drainage streams, it is necessary to collect and re-impound it.
Seepage collection and re-impoundment (Plant 002) is best accomplished by construction of a seepage collection ditch all around the perimeter of the diked area. The seepage collection ditch needs to be of sufficient depth and size to not only collect contaminated water seepage but to permit collection of seepage surface water from the immediate outer perimeter of the seepage ditch. This is best accomplished by erection of a small secondary dike as depicted on Figure 21. The secondary dike also serves as a back-up or reserve dike in the event of a failure of a major dike.
The design of the seepage ditch in respect to distance from the main impounding dike and depth is a function of the geology of the area and the type material used for the dike. In Florida, where the largest number of phosphate complexes are located, the soil condition is such that little, if any, vertical water percolation occurs. The soil at 4.5 - 7.5 meter (15-25 ft) depths is unconsolidated ancient beach sands which lay on top of the underlying Hawthorne matrix deposit. This Hawthorne matrix deposit is basicly a nonporous material made up of impervious clay-sand-phosphate pellet mixture. surface drainage or impounded waters percolate down to this Hawthorne layer. Then, due to the nonporous nature of Hawthorne layer, are forced to migrate horizontally following the interface between the unconsolidated surface soil and the Hawthorne layer. Some data suggests that the gypsum pond bottoms tend to be self-sealing. That is, compacted gypsum plus clay fines and aluminum and iron silicates forced into the interstices may form an artificial "cement" like layer on the bottom of old gypsum ponds which is both acid resistant and of very low permeability. In conclusion, the design of seepage ditches must consider the area geology and the phreatic water level of the impounding dike material to achieve an effective seepage control system. An installation of a pump station at the low or collection point of the seepage ditch completes this seepage control system. The pumps serve to move the collected seepage water back into the contaminated water storage area. Normally these pumps are operated only a few hours per day but this is entirely dependent upon the seepage and rainfall conditions.
103

BED
SEEPAGE DITCH RETURN TO GYPSUM POND BY PUMP
/
£7
Am~guium Phosgha!&,_§elf::£Qntained Process
It was mentioned in the "double lime" treatment description that the best means of reducing NH1-N from appearing in the contaminated water system was to prevent its entry into the water. NHJN enters the contaminated water principally through the ammonium phosphate plant gas scrubber system. A secondary entry point is by way of washdown or water spillage into a surface drainage system. Both of these process waste streams can be segregated along with the ammonium phosphate scrubber waters from the gypsum pond water system and can be either introduced back into the process or treated for ammonia removal prior to discharge into the gypsum pond.
One means of doing this is to adjust the in-process water balance to permit the absorption of these collected NHJ-N containing waters (Plant 001). The degree of water balance adjustment is dependent upon the quantity of water in the two identified streams. Reduction of these water streams to a minimum may require design changes to maximize scrubber water recirculation.
The principal means of adjusting the ammonium phosphate process water balance is to increase the concentration of the phosphoric acid feed used in the plant. Normally 30-40% Pl02 phosphoric acid is required to produce ammonium phosphates. It may be necessary to increase this concentration to as high as 54% PlO2. This is dependent upon the water quantity to be absorbed and the acid concentration required to produce the specific ammonium phosphate product. Figure 22 is a sketch of this procedure.
105

FROM CYCLONES J_!,~~SYCLONES
PUMP
◄
REACTOR GRANULATOR
COOLER SCRUBBER
7 DRYER SCRUBBER
MAKEUPWATER-----
~ ---------. I l __________ , I
SURGE & SEAL TANK
_____ CONCENTRATED
PHOSPHORIC ACID
1---1 f I I I I
CT'~,7----------FANS
PUMP
REACTOR
TO PROCESS FIGURE 22
DAP SELF CONTAINED PROCESS
+ I I I I I
TAIL GAS SCRUBBER

Wet f~qc~ss Phospho~ic a.£id - Pond !!.s1~ Dilution Q! Sulfuric Acid
General
The need to treat phosphate fertilizer process contaminated water is almost entirely dependent upon the local rainfall/evaporation ratio. This means that barring poor water management and concentrated periods of heavy rainfall the complex fresh water use and pond water evaporation are essentially in balance. Therefore, any means of making an in-process change to significantly reduce fresh water use will create a negative water balance. In turn, this will eliminate the need for treatment of contaminated water and effect a no discharge condition.
There are two different methods to make an in-process phosphoric acid process modification to permit the use of contaminated water for dilution of sulfuric acid. currently, the necessity of fresh water for this dilution step represents approximately SC% of the total fresh water intake to a phosphoric acid plant. Not only does use of contaminated water for sulfuric acid dilution eliminate (except for extreme weather conditions) water effluent from a ~hosphate complex, but the overall Pl02 recovery of the phosphoric acid complex is increased by that amount of Pl02 in the contaminated water.
Both methods of accomplishing sulfuric acid dilution with pond water are proprietary. One method is considered a trade secret. The other is protected by patent. Either process can be added to existent plants or included in the design of a new facility.
The trade secret procedure involves two points. One is the mechanical means by which the dilution is made so as not to create a pluggage problem. The second involves redesign of the phosphoric acid reactor cooling system to remove the heat load formerly removed by the sulfuric acid dilution cooler (Fig. 23).
The patented process was developed and has been placed in commercial operation.
It involves sulfuric acid dilution by a two-step procedure in a manner radically different from current practice. The details of process control, vessel design, and materials construction are all proprietary information (Fig. 24).
107
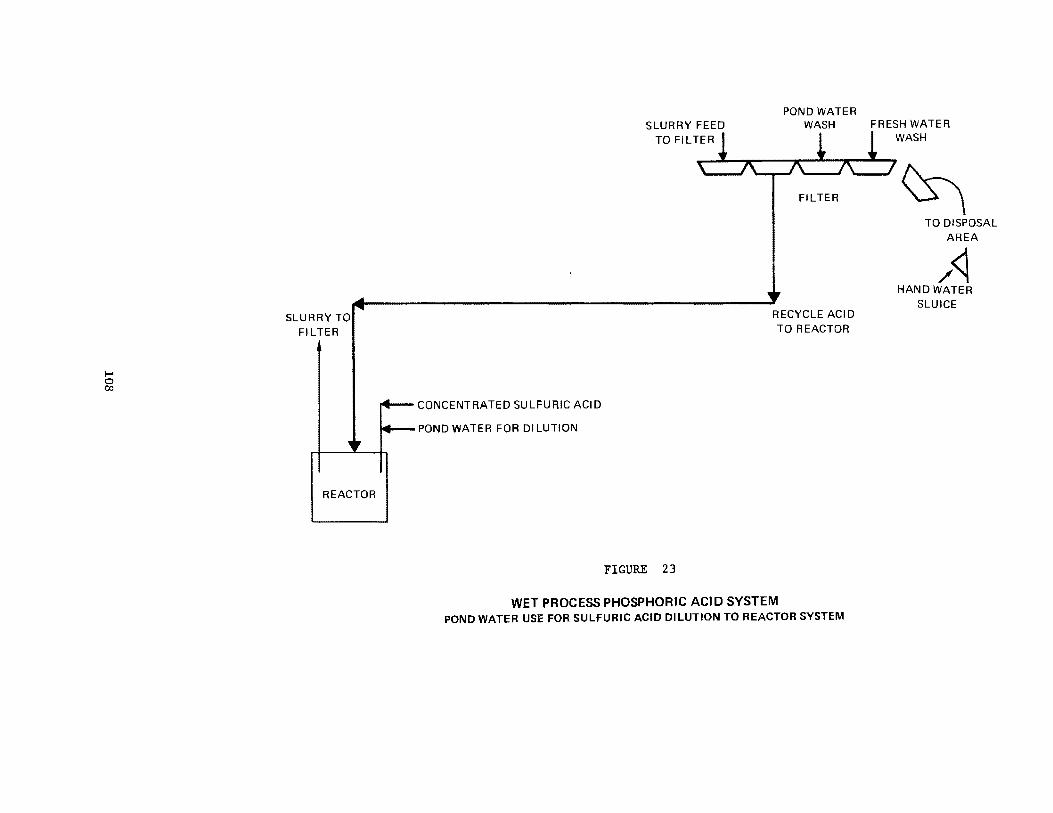
I-' 0 co
SLURRY TO FIL TEA
REACTOR
CONCENTRATED SULFURIC ACID
POND WATER FOR DILUTION
SLURRY FEED TO FILTER
FIGURE 23
POND WATER WASH
FIL TEA
RECYCLE ACID TO REACTOR
WET PROCESS PHOSPHORIC ACID SYSTEM POND WATER USE FOR SULFURIC ACID DILUTION TO REACTOR SYSTEM
FRESH WATER WASH
~ TO DISPOSAL
AREA
/<\ HAND WATER
SLUICE

FEED STREAM POND WATER--------
CONCENTRATED SULFURIC ACID-------
GAS
SCRUBBER SCRUBBER -------------------.TO POND
PRODUCT STREAMS DILUTED AND COOLED SULFURIC ACID CONTAINS RECOVERED P2O
5
DILUTER
FIGURE 24
SULFURIC ACID DILUTION WITH POND WATER

COfil.BQL AND TREATMENT TECHNOLOG! NITEQGEN FERTILIZER INDUSTRY
Proven technology exists and additional technology is being developed, which will enable the nitrogen fertilizer manufacturer, when used properly, to attain the proposed effluent limitations.
Most of these treatment processes are reviewed in the following paragraphs of this Section.
Ammonia Str.!EJ2ing
This treatment method can be used on process condensate, boiler blowdown or cooling tower blowdown from ammonia plants, urea plants and ammonium nitrate plants for the removal of ammonia from these streams. However, due to the large volumes of cooling tower blowdown and the presence of scale forming contaminants in cooling tower and boiler blowdowns this method is best suited for the treatment of process condensate or effluent from urea hydrolysis.
The stripping medium can be either air or steam depending on the desired end use of the overhead vapors, the availability of a low level heat sink and the local and national air pollution regulations.
1.St~.,.§tripping
There are a number of ammonia steam stripping units in operation in nitrogen fertilizer plants in this country. (Plants 006, 011, 015, 017, 020, and 024). These range from completely integrated process units producing boiler feed water quality condensate to separate units treating a process condensate effluent before discharge. The concentration of ammonia in the condensate feed to the stripper varies from 100 mg/1 to 1,300 mg/1 with the stripped effluent ranging from 5 mg/1 to 100 mg/1 giving reductions in some cases of better than 95J. However, the best consistent results from an ammonia stream stripper is in the range of 20 to 30 mg/1 and this is highly dependent on the amount of steam supplied and the pH of the contaminated feed condensate. The stripping of ammonia from water depends on how the ammonia exists in the water. In neutral solutions ammonia exists as NH1- while at higher pH (11 to 12) ammonia exists as dissolved NH1 gas. The following equilibrium prevails:
H+ + NH,2 (g)
H+ + oa- ...... HJ0
As the pH is increased towards 12.0 and as the temperature is increased the reaction proceeds further to the right. Therefore, if the stripped condensate is to be discharged, consideration to artificially raising the pH with caustic should be made. If the condensate is to be reused as boiler feed water then operation of
110

the stripper at a higher temperature (and pressure) would be the preferred design method.
The design and operation of an efficient ammonia steam stripping system is not simple or straight forward. Due to deviations from ideal conditions, the stripping column requires considerably more transfer units than theoretical to produce a low residual ammonia level in the stripped condensate (bottoms). One example of a separated condensate stripping system which will produce a bottom condensate with a residual ammonia concentration of 25 to 30 mg/1 has a process condensate feed rate of from 8.8 to 10.7 1/sec (140 to 170 gpm). The stripper column has a diameter of 0.915 meters (3 feet) and is 12.2 m. (40 ft.) high. The column is packed with stainless steel Pall Rings. (Figure 25)
A second ammonia steam stripping system, operating on process condensate from an ammonia plant, employs two columns operating in parallel with a total contaminated condensate feed of 7.6 1/sec (120 gpm). This unit recently operated for a 22 day period producing a stripped condensate effluent averaging less than 20 mg/1 ammonia while using slightly in excess of .12 kg of steam/ liter (1 lb. of steam/gallon) of condensate fed.
A third steam stripping unit operating satisfactorily is completely integrated with an ammonia plant. This stripping column takes process condensate and steam turbine vacuum condenser condensate and steam strips the ammonia to a level that is acceptable for boiler feed water in a 102 atm (1500 psia) steam system. The trayed stripping column is 1.37 m (4.5 ft.) in diameter and about 12.2 m (40 ft.) high. some recent data indicates that this unit is handling some 41 1/sec (700 gpm) of total condensate input. The effluent from the stripper has less than 5 mg/1 ammonia (Fig. 26). A fourth ammonia steam stripping unit that is completely integrated within an ammonia plant is handling process condensate and producing a stripped effluent that is acceptable for high pressure boiler feed water. This plant has been in operation for more than two years.

COOLING WATER IN
OUT
REBOILER/
TO CO 2 SYSTEM ~ t HOT CARBONATE SYSTEM~ I TO ATMOSPHERE
CONDENSER
AMMONIA STRIPPER
CONDENSATE
POSSIBLE CAUSTIC ADDITION IF DESIRED/REQUIRED
STEAM ----ei LEVEL CONTROLLED VESSEL~
CONDENSATE FEED TANK
TO COOLING TOWER~ TO SEWER~
--------• TO BOILERS~
FIGURE 25
AMMONIA/CONDENSATE STRIPPING
112
TO RAW WATER TREATMENT SYSTEM
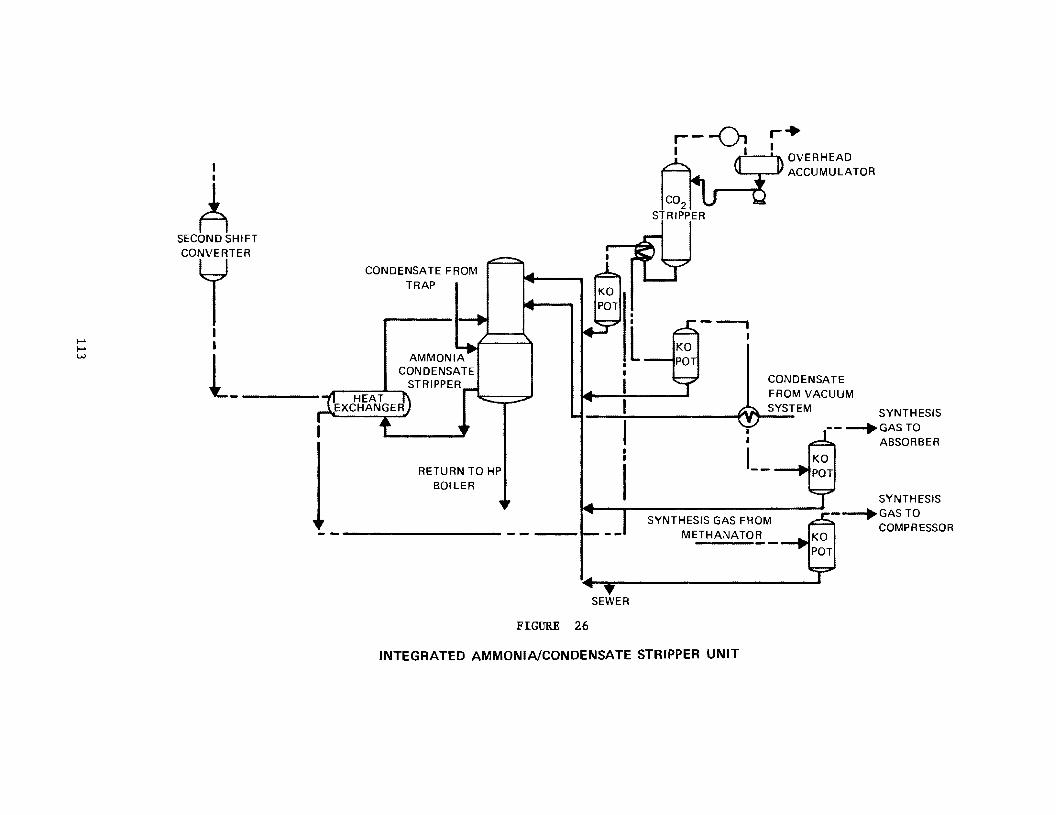
I
A SECOND SHIFT
CO~TEA
I I
l __
CONDENSATE FROM TRAP
RETURN TO HP BOILER
SEWER
FIGURE 26
• I
L
r--0, I ,,,..___. .... OVERHEAD
---ACCUMULATOR
CONDENSATE FROM VACUUM SYSTEM SYNTHESIS
---+GAS TO ABSORBER
I I
I__
SYNTHESIS GAS FROM METHANATOR
KO
SYNTHESIS ---.GAS TO
COMPRESSOR
INTEGRATED AMMONIA/CONDENSATE STRIPPER UNIT

2.Air Strippin9
A considerable amount of work has been done on air stripping of ammonia from waste water, but this has been in the field of municipal waste water treatment. Although this process does have some drawbacks, it is worth mentioning because of its possible use in connection with nitrogen fertilizer plant waste waters. The major drawbacks of air stripping are the very low efficiencies in cold weather and the deposition of calcium carbonate scale from the water on the column packing or internals resulting in plugging.
On the other hand, test data and installation performance to date show that the ammonia in the effluent air will not exceed 10 mg/m 3 (13 ppmv). The threshold limit for odor of ammonia is 35 mg/m 3 (46 ppmv). With this type of discharge there probably would not be any air pollution problem.
As mentioned under steam stripping, temperature and pH have. an effect on the stripping operation. However, since temperature will be controlled by the climatic conditions, pH must be controlled to assure complete stripping.
Although most air stripping to date has been with contaminated waste water with less than 60 mg/1 ammonia, the results obtained by using the proper bed depth, the proper transfer medium and the proper surface loading rate with good control of pH have given better than 90% removal of the ammonia. The resulting aqueous discharge can have less than 5 mg/1 ammonia (Fig. 27).
contrary to some reports, cooling towers are not good stripping units for ammonia contaminated waters. Due to their construction and air flow they are actually absorbers of air-borne ammor.ia with the result that their blowdowns may contain up to 50 mg/1 of ammonia.
114

WATER IN DISTRIBUTION
BASIN
FAN
AIR OUT <11◄-----
► AIR IN
►
TYPICAL FILL
1---4--------4,oc::::;::sir-BAFFLE (TYPICAL)
---i►..,. WATER OUT
CATCH BASIN
FIGURE 27
AMMONIA/CONDENSATE AIR STRIPPING
From Slechta And Culp 1967
115
3.~~gh P~es~ure Air/Steam fil:.illJ2ing
One engineering firm (30) has proposed the use of the process steam required for the primary reformer or the process air required for the secondary reformer as the stripping mediums for process condensate. In each case. the stripping would be performed at medium to high pressure (pressure high enough to get into the primary or secondary reformer). This would require the process condensate to be boosted up to this pressure, but if the condensate is then an acceptable boiler feed water make-up there would be very little energy lost since boiler feed water would have to be boosted to the boiler pressure anyway. The overhead vapors, whether steam/ammonia or air/ammonia. could be be injected into the primary or secondary reformers, respectively, without any expected problems. Ammonia would be dissociated into its elements in either the primary or secondary reformers and any carbon dioxide that might be stripped from the condensate is present in the reformers anyway. Any organic compounds which strip over should also be dissociated in the retormers.
If the stripped condensate is not to be used at these high pressures then it can be flashed to lower pressures in stages to release any additional ammonia.
116

~ea_Hyd~olysis
This effluent waste water treatment system is designed to process condensate from urea plants by converting the urea through a series of intermediate products back to ammonia and carbon dioxide. This process is carried out at temperatures above 100°c (212°F) and under pressures of up to 18 atm (250 psig). Following the conversion or hydrolysis, the ammonia and carbon dioxide are stripped off and returned to the urea process Plants 006 and 015.
One of the proprietary (38) variations of this treatment is presented in Fig. 28. This flowsheet depicts a unit capable of treating 4.2 1/sec (66 gpm) of process effluent, containing 4000 mg/1 urea and 3000 mg/1 ammonia. Aqueous discharge from this treatment unit will contain 100 mg/1 and 50 mg/1 of urea and ammonia respectively. steam requirements for this unit are 2200 kg/hr (4840 lb/hr) of 19 atm (265 psig) steam and 4000 kg/hr (8800 lb/hr) of 4 atm. (44 psig) steam. It is understood that this unit will be offered commercially with a urea plant and a guarantee will be given that the effluent will not contain more than 42.5 kg (85 lbs) of Org-N and 37.5 kg (75 lbs) of NHJ-N per 1000 kkg (1000 ton) of urea produced.
A second proprietary urea hydrolysis system is available (39, 40). This treatment unit has been installed in a urea plant in the spring of 1973 (Fig. 29). Although only limited information is available to date, the new unit has with some difficulty processed the urea plant condensate giving very mixed, but in some cases, good results. This medium size installation is being modified from a control instrumentation standpoint and is then expected to operate satisfactorily. Although this unit is not completely operative yet, it is expected that, with continued operating experience and future design modifications, this process will be commercially available with respectable guarantees regarding ammonia and urea levels in the effluent.
This unit consists of a steam heated vertical tower operated under pressure, to which the contaminated condensate is fed. A feed-effluent heat exchanger is included to conserve energy. The contaminants are decomposed, stripped off and recovered in the urea synthesis section of the main plant.
A third type of urea hydrolysis treatment system is in operation at a fairly large urea plant. The process was developed and installed by the owner and therefore, very little detail is available. Data obtained from this plant, however, does show that the hydrolysis unit is operating very well. Data from the plant with this treatment system including prill tower fallout show organic nitrogen (as N) monthly average values as follows:
117

~/kkg (lb/1000 lb) 0.09 0.230 0.205 0.031 o. 052 0.087 0.054
Average 0.115
118
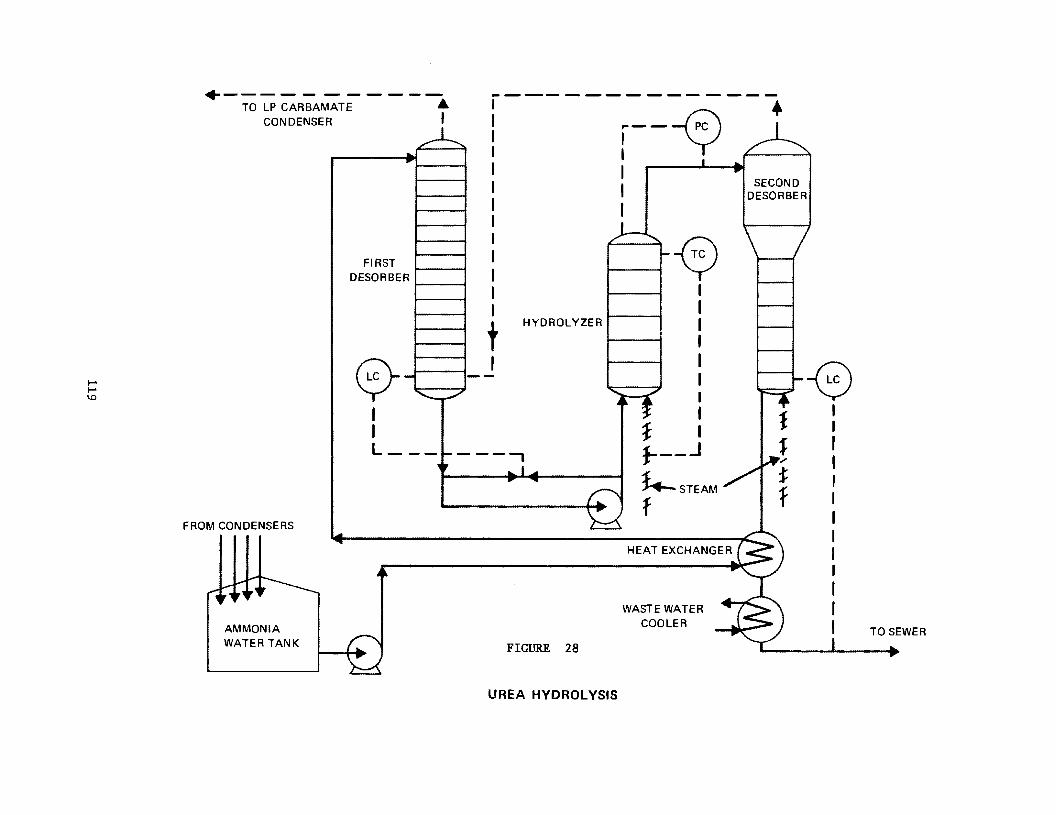
+-----------TO LP CARBAMATE ,Af
CONDENSER
FROM CONDENSERS
AMMONIA WATER TANK
FIRST DESORBER i-----,
0-1 I L __ _
--------- ♦
r--~
t HYDROLYZER
I
FIGURE 28
UREA HYDROLYSIS
I I I
~ I I I I I I I I
f I f---.J i._STEAM
f
WASTE WATER COOLER
SECOND DESORBER
-0
TO SEWER
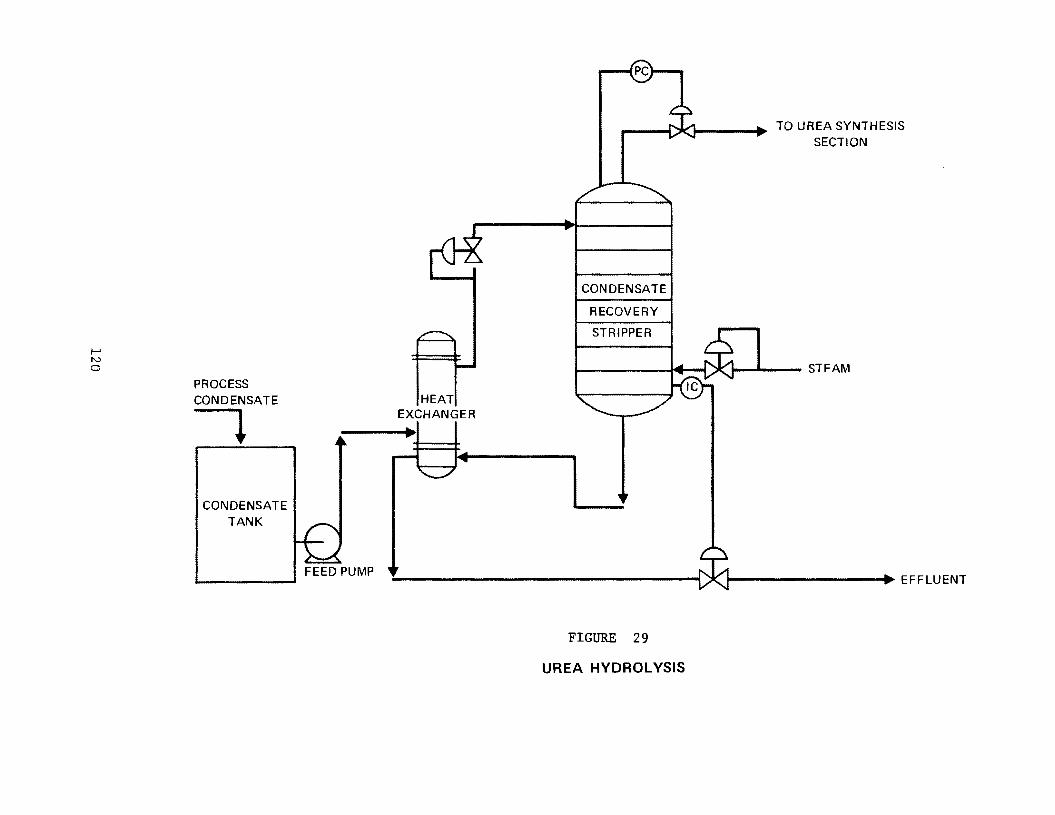
PROCESS CONDENSATE
7 CONDENSATE
TANK
FEED PUMP
HEAT EXCHANGER
►
CONDENSATE
RECOVERY
STRIPPER
FIGURE 29
UREA HYDROLYSIS
TO UREA SYNTHESIS SECTION
.,..__._ __ STEAM
i----------• EFFLUENT

ADDENDUM
Urea Manufacturing Data
The information provided by one of the respondants was labeled in a misleading manner in that a part of the waste water coming from a prill tower operation was identified as shipping and blending loss. This led to an incorrect interpretation of the data supplied by the respondant, and of the data collected by EPA during the preparation of urea manufacturing limitations. As a result of comments received after the close of the public comment period, the matter was further investigated and the correct interpretation discovered.
A special visit was made to the exemplary plant in question, which had been used as the basis for establishing effluent limitations, to confirm the validity of the above referenced comment and to collect additional data. On the basis of this investigation it was confirmed that the comment was valid. On the basis of the previously available data plus new data collected during this visit, a re-evaluation of the organic nitrogen limitations was made resulting in a substantially increased discharge level for urea manufacturing based on best practicable control technology currently available and best available control technology.
The data and re-evaluation for best practicable control technology currently available is summarized as follows:
Primary Manufacturing kg/kkg (lb/1000 lb) of product
0.130 0.132 0.204 0.109 0.057 0.098 0.266 0.109 0.070 0.112 0.083 0.095
Average 0.123
Plant 006
Monthly Averages for Organic Nitrogen (as N) effluent from Urea Manufacturing
Prill Tower Fallout Total Rainfall kg/kkg kg/kkg for lb/1000 lb) (lb/1000 lb) Month of product of product inches
0.067 0.197 0. 70 0.222 0.354 l. 85 0.165 0.368 l.65 0.297 0.415 3.10 0.318 0.375 1.20 0.121 0.219 1.00 0.394 0.660 5.64 0.136 0.244 3.35 0.502 0.573 4.95 0.535 0.644 5.50 0.272 0.356 l.92 0.051 0.146 4.35
0.239 0.379 2.93 Revised Guidelines No.
0.175 0.500
121

This data is based on daily analysis sheets supplied by plant 006.
The fallout from the prill tower is collected in the discharge system due to seepage and rainfall washing of the area where the dust falls. When a month of high rainfall follows a month of low rainfall, levels of discharge increase to exceed, in some cases, the established limitation. This is bourne out in the above data. Depending on local conditions, it may be necessary to average a low rainfall month and the following two high rainfall months to achieve the established limitation.
122

BiQl.Qgi£al Treatment - Niirification and Deo.illificati.QD
This possible treatment is based on the reaction of ammonia nitrogen with oxygen in an aerated pond or basin to form nitrates via biological oxidation. The nitrates are in turn reacted in an anaerobic pond in the presence of a biodegradable carbon compound to form elemental nitrogen. Although there has not been any significant industrial use of this combination, municipal wastes have been treated in this manner for years. Recently more and more investigations into this type of treatment for industrial use have been made (Fig. 30).
The first step-nitrification-takes place in the presence of aerobic bacteria which convert the ammonia nitrogen to nitrates. This reaction is promoted by the degree of aeration and warm temperatures. This step can be carried out in a lagoon, pond or a trickling filter according to the following equations:
2NH.J + 302
2NO2- + 02
2No2- + 2H+ + 2e1O
2NO_J-
The denitrification step is an anaerobic process which occurs when the biological micro~organisms cause the nitrates and available carbon to be b·roken down into nitrogen gas and carbon dioxide. The initial breakdown of the nitrates requires that organic carbon be present. This can be in the form of methanol in which case the following overall reaction would occur:
6NO1- + SCHJOH _,. .JNl + scoi + 7H10 + 6QH-
Thie reaction must be carried out in a pond, lagoon or tank under anaerobic (all dissolved oxygen must be consumed) conditions. _It is essential that complete nitrification be obtained in a previous pond, lagoon, etc. before the denitrification process starts; this usually requires longer retention time and lower load factors than are found in conventional activated sludge plants. Continuous addition of organic carbon (e.g. methanol) and inorganic carbon (e.g. bicarbinate) to accelerate the denitrification step rate is possible, but costs are elevated accordingly.
The overall oxidation-reduction process functions initial ammonia-nitrogen concentrations around 25 expected removals of 90~ can be achieved with controlled operations.
best with mg/1 but carefully
However, there are drawbacks, with by-products and side reactions which can give rise to odorous compounds such as hydrogen sulfide plus the ever present sensitivity to shock loads, e.g. ammonia spills, etc.
123

AERATION PUMPS
LIFT STATION
FIGURE 30
BIOLOGICAL TREATMENT
TO OUTFALL

Ion Excha,n~
Ion exchange is a unique effluent waste water treatment method in that it not only removes the contaminants from the waste water but it can also produce a useful end product. An ion exchange system may consist of a cation unit, an anion unit or both, this depends on the nature of the ions to be removed from the waste water.
l.~ti.Q.!!Lbnion see~ration unit
The first ion exchange system that will be covered is the integrated or combined unit containing a cation resin column and a separate anion resin column. This unit can be used for the treatment of waste waters containing both ammonium ions and nitrate ions (Fig. 31). The ammonium nitrate contaminated waste water first flows through a bed of strongly acidic cation resin operating in the hydrogen form. The ammonium ion combines with the cation while the H+ ion combines with the nitrate ion to form nitric acid.
The acidic waste water, minus the ammonium ion, then passes through a bed of weakly basic anion resin where the nitrate ion combines with the resin and water is formed.
HNOJ + RJOH -+ RlN01 + HlO
The effluent water from this second bed is low in ammonia and nitrates and can then be discharged or reused within the plant as make-up boiler feed water, cooling tower make-up or recycled back to the raw water treatment unit.
Each of the ion exchange resins must be regenerated. The cation resin holding the ammonium ion can be regenerated using nitric acid to form ammonium nitrate solution and a regenerated strongly acidic cation resin. The anion resin holding the nitrate ion is regenerated using a solution of ammonium hydroxide. This will form more ammonium nitrate and a regenerated weakly basic anion resin. The major difference between the incoming waste water and the regenerate by-product is that the latter has a 10% to 20% concentration of ammonium nitrate versus a few hundred mg/1 in the raw waste water. This means that, depending on available fertilizer products on site, this by-product may be used as is or it may be concentrated for sale.
A continuous unit, similar to that above, is operating at Plant 022. Information to date indicates that both the ammonium ion and the nitrate ion are being removed to levels for ammonia-N of 12 to 50 mg/1 and for nitrate -N of 6 to 40 mg/1 for a waste stream of one million gallons per day.
2.Sele~~ive Ion Exchang~..!Q.!. Ammonia Removal
125

NITRIC ACID
FROM PLANT POND
FIL TEA
CLEAR WELL
PRODUCT AMMONIUM
NITRATE DEMINERLIZER WATER
FIGURE 31
ION EXCHANGE
WATER TREATMENT
AMMONIA

Although this treatment process has not been industrially installed there has been enough testing to indicate that greater than 90% of ammonia nitrogen can be removed from waste streams containing approximately 25 mg/1 ammonia. This process (43) is based on a natural zeolite ion exchange resin clinoptiloite. The resin can be regenerated with lime slurry yielding an alkaline aqueous ammonia solution, that can be air stripped to remove the ammonia. The stripped slurry can then be recycled to regenerate more zeolite. The regeneration of the clinoptilolite can be improved by the addition of sodium chloride to the recirculated lime slurry.
Oil and grease complexes can machinery, such urea plants are
in waste water effluents from nitrogen fertilizer be ·a problem especially when large rotating as reciprocating compressors in small ammonia and in use.
Oil and grease can be removed from the waste water effluents to levels below 25 mg/1 in properly designated A.P.I. Separators (Fig. 32). To assist i~ the design of these separators, The A.P.I. in Washington, D.c., has published "Manual on Disposal of Refinery Wastes." The information contained in this manual is applicable to nitrogen plants effluent waste water. Plants 003, 016 and 022 practice oil removal treatment of their waste streams. Oil and grease from many such sources can be kept out of the effluent by housekeeping techniques at the source. This can be accomplished by such containment devices as drip pans.
Ammonium Nitrate Condensate Reuse
Flashed vapors from the neutralizer carry with them ammonia, ammonium nitrate and some oxides of nitrogen. Partial condensation of these vapors results in a contaminated condensate that requires treatment before discharge.
One possible "treatment" method for this condensate stream is to collect it and use it as the absorber feed in the associated nitric acid plant. Refer to Figure 33 for a process description of this treatment method. such use would create an internal recycle of streams from this condensate waste in which both the ammonia and nitrate values would be recovered, i.e. overall yields for both the ammonia and nitric acid units increased in terms of product ammonium nitrate.
127

OIL/GREASE BEARING
STA~
FROM PLANT I ~ OVERFLOW
WELL
SUMP OR TANK
___ ,..SAWAGED
OIL/GREASE
INCOMING OIL/GREASE
7 OIL/GREASE
POND OR SUMP
FIGURE 32
OIL/GREASE REMOVAL SYSTEMS
MECHANICAL SKIMMER TO AREA
CLEAR WATER EXIT
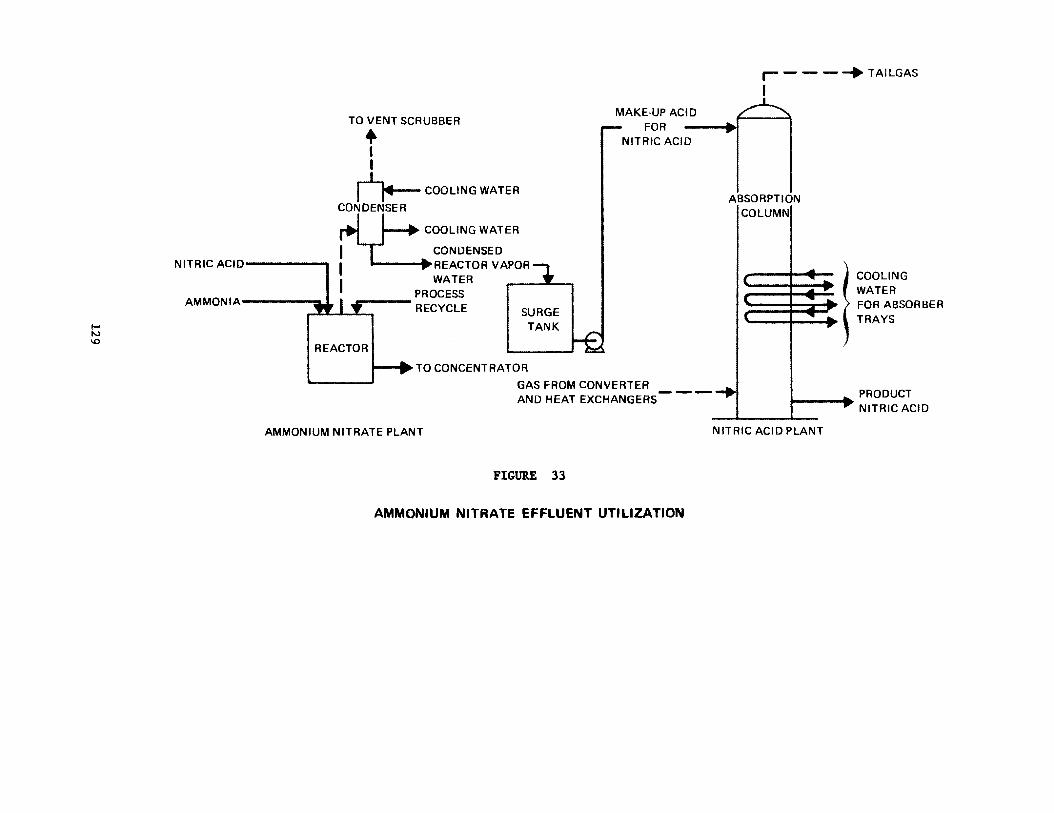
NITRIC ACID-----
TO VENT SCRUBBER
+ I I
~ COOLING WATER
CONDENSER
DOLING WATER
CONDENSED I REACTOR VAPOR
I WATER
-1f!!!'"--- PROCESS RECYCLE SURGE
TANK
REACTOR
~~~TO CONCENTRATOR
MAKE-UP ACID FOR
NITRIC ACID
r - - -➔ TAILGAS
I
ABSORPTION COLUMN
COOLING WATER FOR ABSORBER TRAYS
GAS FROM CONVERTER AND HEAT EXCHANGERS- - -➔ .,__---1•PRODUCT
NITRIC ACID
AMMONIUM NITRATE PLANT NITRIC ACID PLANT
FIGURE 33
AMMONIUM NITRATE EFFLUENT UTILIZATION


SECTION VIII CO§'.L._rnEGY AND NQN-W~TER QUALITY ASPECT
~neral
A detailed cost analysis of the various treatment methods pertaining to the fertilizer industry have been summarized in the tables of this section.
The costs discussed are listed under subcategories as follows:
(l) Phosphate
(2) Ammonia, urea, ammonium nitrate and nitric acid
Table 2
Table 3
All investment cost figures and related annual costs have been reported in August 1971 dollars.
The treatment technologies utilized in series with each levels of control.
summarized in some cases may be other to meet more advance
water Effluent Trea~m~DL£ost Tabl~
An explanation of the water effluent treatment cost tables is set forth to aid in understanding the magnitude of the figures set forth therein.
This includes the traditional expenditures, such as design; purchase of land and materials; site preparation; construction and installation; plus those additional expenditures necessary or required to place the treatment method into operation including expenditures for related or needed solid waste disposal. Because of the broad general scope, methods and processes covered, nothing has been shown in the investments for losses due to downtime; i.e. production halts needed to install pollution abatement equipment. This is treated separately.
Interest on Money
This is more or less self-explanatory. It is the cost of the money used for investments on an annual basis.
Depreciation
There are numerous methods of accounting and depreciating equipment. Because of the nature of the treatment technology and the way it may be installed for utilization, all capital is depreciated over a ten year period by the straight line method.
131

oger~ting and Maintena!l£.§_Costs
This is exclusive under a heading of insurance, taxes, maintenance.
of i~
solid
energy own. waste
and power which has been covered Costs here include materials, disposal, operating labor and
It is anticipated that maintenance, as it is normally thought of in most processes, will be lower for the add on technology to achieve pollution abatement. Therefore, the costs are adjusted accordingly to reflect a lower maintenance cost.
Energy and _fQwer costs
Costs for energy and power include such items as electricity and steam for pumps, agitators and evaporators/heat exchangers.
Effluen:t_QualitX
The items covered are the expected parameters of the effluent after the pollution abatement technology installed and placed into operation.
resulting has been
The raw waste load flow has been given in liters per second and gallons per minute. Effluent level parameters are given in units of milligrams per liter and kg/kkg of product where appropriate.
sypplemental ~
This heading is for miscellaneous data that is considered useful in understanding or using the tables. All items are identified as to their nature or use.
It is difficult to show exactly how much will be involved in an installation. This is attributed to the fact that no two plants are exactly alike nor would they require the same amount of work, equipment and land to be installed. However, hypotheses have been made in order to permit reasonable estimations as to the time and effort involved. All plants are of 900 kkg/day (lOOC tons/day) and for the main part, considered to be existing plants. The explanation for these items are covered in order for Tables 2 and 3.
Since there is so much variation in time for certain types of work to be done and equipment to be shipped, a total possible elapsed time will be given under each treatment method. This time span will include: engineering, procurement and construction.
Also listed separately, as it applies, will be the amount of downtime to make equipment tie-ins and length of time for startup and placing the unit(s) into operation.
132

Sulfuric Acid Effluent Control ---...-------Total elapsed time for engineering, procurement and construction should be five months.
It should be possible to arrange for this work to be accomplished and put into service with no downtime to the plant operations.
No start-up is required for this item. It should be noted that as an alternate the effluent may be discharged back to a retention pond or gypsum pond until control has been restored.
Egnd~~r Treatment
The elapsed time for this method in engineering, procurement and construction should be about fifteen to eighteen months.
There should be no need to shut any plant down to install or make tie-ins of this method of treatment.
For start-up and operations to be stabilized it will take ~pproximately one twenty-four hour day of continuous operation.
~12.§um Pond Wate~_seepage QQ~l 3ince this is only a secondary dike arrangement it should not .nterfere with plant operations both in construction and placing ,ump system into service.
:onstruction time is considered the prime requirement here. The rork around a 80-100 hectare (200-250 acre) pond area should be .ccomplished in ten weeks. It is not anticipated that much tart~up time will be consumed to start the pumps, so time for his effort will not be considered.
133

AINll\L EFF!lHIT ~ "&,eiiitl.ng • Miint:eiianoii
kafer to Figure • •:rnten,st Cl'! Costs (Excl,mng ~ "n""'JYand "Tota1"'1nual lllloemjylM....., - -te - -te Ierultin, Effluent Slg>la!l',ntal Data
- Alll'E1tlllTIVE fur Refe?:eooe "In"""tnent Heney "Ilepn,ciatirn --) -= carts ,_., 1"ad 1"ad """'1
Ll.i:en,!Sec ~ !!i~ 8 Sulfuric Jlci.d $ $ $ $ $
EffltlEYl.t CDltrol 19 212,760 17,470 23,280 9,310 5,000 55,060 .JI 63.0 1000 pH 6.0-9.0
8 Paxl Water Treating 20 349,600 26,220 34,960 13,990 $0. 05/1000 gal 63.0 1000 pH 6.0-9.0 F 30 - P 40, N 40 - note bel.o,
C Gypst.m Paxl Water 21 163,680 ]2,]75 16,370 6,550 5,000 40,295 .Jl 252 4000 .., disc!large ~Crntrol
C Mlitmal LiJoing PH 6,0 ... 9, F 15 p JO
C lll!P sell Cart;ained 22 JU,800 23,460 31,280 58,510 344,650 457,900 21.5 !OJt lff,li- ltt lff,li- .., du,charge 'lhis is an evaporator to Ptooess oable cabl.e o:noen.trat:e fee-1 strean
~cocid (Al Dl'a'odllateru.edR:u: 23 ]10,960 23,320 Jl ,000 12,440 168,500 235,260 10.s ltt Awli- !OJt lff,ll- IO>discharge
SUlfurlc: Acid cable cable Cait af add 01. to Dilutia, ID lleacbor ,odstirq plilllt CB)
D Paxl Water Used Ftr 23 110,400 B,280 11,040 4,420 168,SJO 192,240 10.5 -~- !OJtAwli- .., discharge Cost of aaling thla systen Sulluric Acid cable cable to a na, plant (B)
Dilutkn to --Sy,,ten
D Sul£ruic Acid Dilutkn 24 368,000 27,600 36,800 14,720 22,400 101,520 1.4 Net -"R>li- Net Awli- .., discharge (8) lrlitftPa'tdlrlater ,:mle cable
Sue Basis: 00 900 Jd,g/day (1000 &ii/day) lll!P Plant * All a:at figucee mt:! for AupEt 1971 Ill) 900 plqi/day (1000 ton day) P2 o5 Plaut
MJn:; - material $1. 40 ,me 1000 galloos _, annual <:n<rt3 $0.50 p,r 1000 gail<ns treated; IDtal ~ o:,st (raw -.al plus ..-.....1 <arts) $1.90 p,r 1000 '}ltll<nl tnao.ted
ll4

!2af_Self ~ontained ~~
This system is one that is to be added to an existing unit and will require installation of an evaporator and related auxiliaries to concentrate the feed acid stream. This creates the negative water balance necessary, to utilize the water from the local area.
Engineering, procurement and construction time should be about twelve months.
The system can be pre-constructed ready for eight-hour day will be required to tie the unit is scheduled around a routine wash day in the plant there will be no downtime in production.
tie-in. Only one in. If this work
phosphoric acid
The start-up and operations should be done and the unit stabilized in approximately twenty-four to forty-eight hours.
Operational coverage for this unit should be no more than one half a man per shift at an annual cost of approximately $40,000 to $46,000.
Pongwater Use For Sulfuric Acig_Dilution (Internal Metl!gg)
There are two types of costs listed here. One is for adding to an existing system and the other is for a new plant installation.
The time required for a new plant installation is not involved with causing a plant shutdown for tie-in; therefore, it will not be considered for engineering, procurement and construction. Similarly it is not considered for start-up or operations.
Time required to revise an and complex. The hard larger flash cooler system system.
existing plant is rather complicated part of this job is installing a new in place of the existing flash cooler
The entire elapsed time for engineering, procurement and construction should be about six to eight months.
After considerable pre-fabrication has been completed, the plant will then have to be shut down for three to four weeks of intensive change out work on the equipment.
This type work could be planned and executed around an annual turn around which would reduce the unproductive plant downtime to one to two weeks.
The new system would be so similar to the existing system that there should be no additional time required for start-up and operation of the modified system.
135
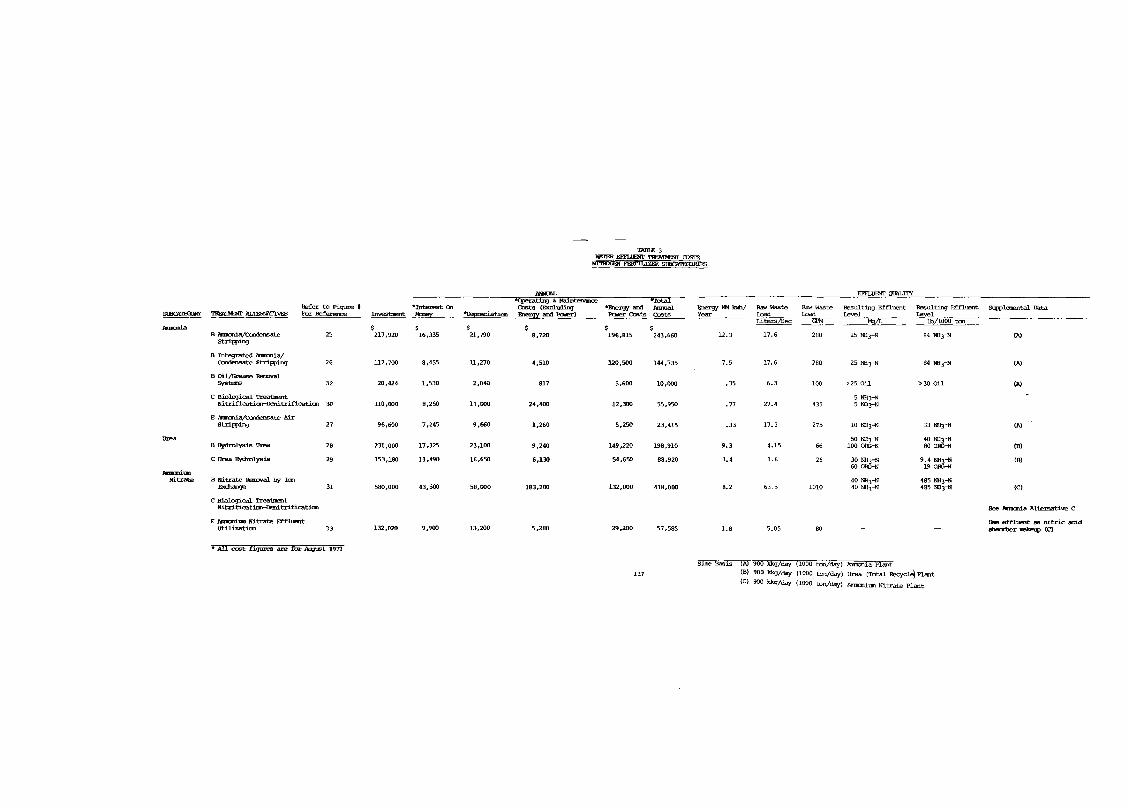
:Refer to Figure t *Interest 0,
~ - l\L=-rrv&S Far ,eference ~ ~ -ticr,
lmDnia $ $ $ $ B 1mll::n:ia,/Ccnate 25 217,920 16,335 21,790 8,720
striwing
B Integrated Junati.a/ CCndensate St:riRri-ng 26 lU,700 8,455 11,270 4,510
B OU,IGrease RenDval System 32 20,424 1,530 2,040 817
C Biolo:iical Treabient Nitrificati.cn-Denitrificaticn 30 ll0,000 8,250 11,000 24,400
E 1mrl::ni.a,/Crote Air Striwin;J 27 96,600 7,245 9,660 1,260
urea B Hydmlysis U:rea 28 231,000 17,325 23,100 9,240
C urea Hydrolysis 29 153,180 11,490 16,650 6,130 -... Nitrate B Nitrate lelDVal by lai - 31 580,000 43,500 58,000 183,200
C Biological TreatJrent Nitrl.f:icati.cn-Oeni.trificatial
E Allllaliun Nitrate Efflum.t Utiliza:ti.01 33 132,020 9,900 13,200 5,280
* All a:Et figures an! :fcu: Aujust 1971
$ 196,815 243,660
U0,500 144,735
5,600 10,000
U,300 55,950
5,250 23,415
149,220 198,910
'54,650 88,920
132,000 418,000
29,200 57,585
137
_ ... _; Year
U.3
7.5
.35
• 77
.33
9.3
3.4
8.2
1.8
RaW Waste Raw waste Load Load La.tens/Sec GPM
17.6 280
17.6 280
6.3 100
27.4 435
17.3 275
4.15 66
1.6 26
63.:> 1010
5.05 80
:Resulting Effluent Pe$ulti.DJ Effl\Ellt Level Level ~n -=lli~a=o~oo~-~-
25 NH3-N 84 ?ErN
>25 Oil >30 Oil
5 NHJ-N 5 00:J""N
10 NH3-N 33 m:3-N
50 NH3-N 40 NH3-N 100 OlG-N 80 QR}-N
30 NH3-N 9.4 NH3-N 60 OlG-N 19 Offi--N
40 m:rN 485 NH3-N 40 NH3-N 485 HJ3--N
Si..7.e Basis (A) 900 kkg/day (1000 ten/day) Arrm:n1a Plant
(B) 900 kkg/day (1000 ton/day) Urea (Total Jecycle) Plant
(C) 900 kkg/day (1000 ton/day) Anm:niun Nitrate Plant
(A)
(l\J
(A)
(A)
(Bl
(Bl
(Cl
See llmori.a Altei:native C
rse effluent as nitric aci.d -~(Cl
The start-up and operation should be very similar to that mentioned for ammonia/condensate' st.·ripping. There is no need for extra personnel to give this unit c 1Jverage.
The easiest way to explain this system is to say that it is very similar to a cooling tower. To design, procure and construct such a unit can be from twelve to fourteen months.
The tie-in to the plant will require about twelve to twenty- four hours.
Also there is no anticipated need for extra personnel to operate this unit.
£.!opriet~ry Urea Hydrolysi§
The design engineering, equipment procurement and construction should be completed in approximately ten months.
The plant will be shut down for equipment tie-ins for about twelve to thirty-six hours.
This treatment method is a little more complex. Therefore, it is more involved to start up. The unit is brought on line simultaneously as the plant start up, but to gain positive and stable control of the unit could vary from twelve to thirty hours.
The unit in the early stages of start-up and operation could involve one half to one man per shift. When the unit becomes checked out and the operators educated as to the operations of the unit the extra personnel may be phased out. This increased need may exist for four to six weeks. The cost of extra coverage could vary from $4,400 to $12,500.
The unit is not considered complex and should take about ten to twelve months for design, procurement and construction.
The tie-in of the unit should involve no more than six to eight hours of down time for the plant.
When the unit is ready it will come on line when the plant is started. Although the operator may not become very involved during the start-up, the unit will require increased monitoring until the operating and plant personnel are familiar with the unit and its limitations. This could involve one half to one man per shift for two to four weeks. After the unit is stabilized the extra personnel may be phased out .•
The increased operating surveilance could amount from $2,000 to $9,000.
138

Bioloqical_Treatment (Nitrification-Denitrificationl
Designr procurement and construction time could be twelve to fourteen months.
There is not enough start-up time involved to be considered. Howeverr there will be monitoring time involved during the normal unit operations. It is estimated that about one quarter of a man will be utilized at an approximate cos~ of $19r000 to $20r000 •
.8mmoni~Nitr2te B~yal £Y...!2!LE~chanqe
This system is somewhat more complex and involved than most of the treatment methods discussed thus far.
To designr procure and construct the ion exchange system will take from fourteen to sixteen months.
The start-up and operation some difficulty; mainly difficult to delineate the installations.
of this unit to date has mechanical. This makes exact needs for operation
experienced it somewhat of future
It is anticipated that two persons per shift will be required to operate the unit. The cost of such labor will be approximately $145r000 to $160r000 on an annual basis.
Oil/Grease Removal
The oil/grease removal systems may be used as single units or in series. For this study they are used in series.
To designr procure and construct such a unit would take approximately eight months.
There is no start-up and operation time involved so this is not considered. It is not felt that these units will require additional personnel to monitor or operate them.
aID!!!2nium Nitrate Effluent Utilization
There is not much involved in this system. It should take about eight to ten months to designr procure and construct the modified system.
The plants should be down not more than two to three hours for the final equipment tie-ins.
This system is unique in its possible mode of operation. It must be so designed to enable the ammonium nitrate and nitric acid plants to operate independently of one another or in tandom with one another. The start-up of either unit should require a few minutes to set up and initiate. The switching from one unit to the other should be very easy and quick to execute with no ill effect on the operations of the nitric acid plant.
139

With the above in mind, no time is considered for start-up and operation of the system.
There is no increase in requirements for operating labor.
140
lli2.n=~ter Quality Aspects of_Ireatment and Control Technologies
Phosphate Fertilizers
The treatment and control technology proposed for use by the phosphate fertilizer industry to meet the guidelines does not have any deleterious non-water quality aspects. There are no air pollution, noise pollution or identifiable solid waste disposal problems associated with the proposed waste water treatment methods.
Containment of contaminated recirculated (gypsum) water must not be accomplished with fluorine loses from scrubbers or ponds. Nor must containment be acpieved by percolation to ground waters (or horizontal subsurface loses).
Nit~ogen FgUilizers
There is one possible and one real air pollution control problem that may exist with some treatment methods. At present, there are no air pollution regulations on ammonia. When ccnsidering the ammonia stripping process using either air or steam, one must be concerned about where the ammonia is going, most of the time into the air. Tests have shown that with air stripping, the off gas concentration contains less than 10 mg/m3 (13 ppmv). Since the threshold odor for ammonia is about 35 mg/m 3 (46 ppmv) there would not be any noticeable odor around the stripping operations. The maximum allowable OSHA concentration of ammonia in air (on a time weighted basis) is 35 mg/m3 (46 ppmv). Since this also is greater than the expected gas effluent and surrounding air concentration, air/steam stripping of ammonia is not expected to cause any air pollution problems.
Although the anaerobic (without free oxygen) denitrification process has been used for years, especially in the municipal sewage treatment plants, it is a process that tends to be more of an art than a science. The operations of an anaerobic treatment of denitrification pond can take a great deal of care. The internal reaction occurring can lead to the formation of hydrogen sulfide if there is any sulfur present that can create an odor problem. Therefore, care should be taken when considering the installation of a denitrification pond as to the location of the plant site in relation to the wind direction and the nearest town or inhabitants.
141


SECTION IX BEST PRACTICABLE CONTROL TECHNOLOGY CURRENTLY ------AVAILABLE
GUIDELINES AND LIMITAI!Q!lli
WSODUCTION
The effluent limitations which must be achieved by July 1, 1977 are based on the degree of effluent reduction attainable through the application of the best practicable control technology currently available. For the fertilizer manufacturing industry, this level of technology is based on the best existing performance by exemplary plants of various sizes, ages and chemical processes within each of the industry's categories. In some cases where no truly exemplary plants were surveyed, this level of technology is based upon state-of-the-art unit operations commonly employed in the chemical industry.
Best practicable control technology currently available emphasizes treatment facilities at the end of a manufacturing process but also includes the control technology within the process itself. Examples of in-process control techniques which are used within the industry are:
*manufacturing process controls *recycle and alternative uses of water *recovery an/or reuse of waste water constituents *dry collection of airborne solids instead of (or prior to) wet scrubbing.
Consideration was also given to:
a. The total cost of application of technology in relation to the effluent reduction benefits to be achieved from such application;
b. The size and age of equipment and facilities involved;
c. The process employed;
d. The engineering aspects of the application of various types of control techniques;
e. Process changes;
f. Nonwater quality environmental impact (including energy requirements).
Process waste water is defined as any water which during the manufacturing process, comes into direct contact with raw materials, intermediates, products, or by-products. Cooling tower water is not covered in these limitations but will be the subject of a later study by EPA. All values of guidelines and
143

limitations are expressed as consecutive 30 day averages in units of kilograms of parameter per metric ton and pounds of parameter per 1000 pounds of product produced except where they must be expressed as a concentration.
Maximum daily values of two times the 30 day averages are established. Because extensive long term data is not available for each of the subcategories it is necessary to rely on data from other parts of the fertilizer industry as well as data from other similar industrial categories. Based on this information and using good engineering judgement on the reliability of the treatment systems involved, a factor of two appears generous.
Based upon the information contained in sections III through VIII of this report, the following determinations were made on the degree of effluent reduction attainable with the application of the best practicable control technology currently available to the fertilizer manufacturing industry.
144

PHOSPHATE SUBCATEGORY GENERAL DESCRIPTION
Eleven phosphate fertilizer plants were surveyed and studied to determine the levels of pollutants being discharged and the effluent treatment methods being used for control. Phosphate fertilizer plants do not need to discharge process waste water (gypsum pond water) continuously. The pond water is re-used in the process and a discharge is needed only when there is rainfall in excess of evaporation. For this reason limitation quantities are not based on production but on rainfall conditions. The effluent quality is based on the characteristics of properly treated water released from the gypsum pond.
Best Practicabk£ontro!_~!m.QlggY_~yrrenlli_8vai1abl~in£1Ugfil?:
A. filrnsum Pong_jcontaminateq) HillL.Treatment
Double lime treatment of gypsum pond water has been in industrial use for some 15 years. First stage treatment takes the pH to 3.5 to 4.0. second stage treatment takes the pH to 6.0 to 9.0. This reduces the phosphate (as P) concentration to 10-40 mg/1 and the fluoride (as F) concentration to 15 or less mg/1. Radium 226 is precipitated to a sufficiently low concentration by lime treatment to a pH of a.o. Pond design and operation to leave enough freeboard to contain a 10 year storm is required as best practicable control technology. Operation to maintain the required freeboard can include proper treatment and release of water.
This effluent control and treatment technology is in current industrial use. The technology is primarily one of preventing contamination of natural drainage water from accidental equipment break or operator error. It provides for a monitoring system to signal that an emergency exists followed by facilities for contaminated water isolation and subsequent reuse. A more detailed discussion of this technology is included in section VII.
Efflue!ll_~imitillQ!l§_Guidelines
The following limitations constitute the quantity or quality of pollutants or pollutant properties which may be discharged after application of the best practicable control technology currently available by a point source.
1. Subject to the provisions of paragraphs (2), (3) and (4) there shall be no discharge of process waste water pollutants into navigable waters.
2. A process waste water impoundment constructed and operated so
145
which is designed, as to contain the
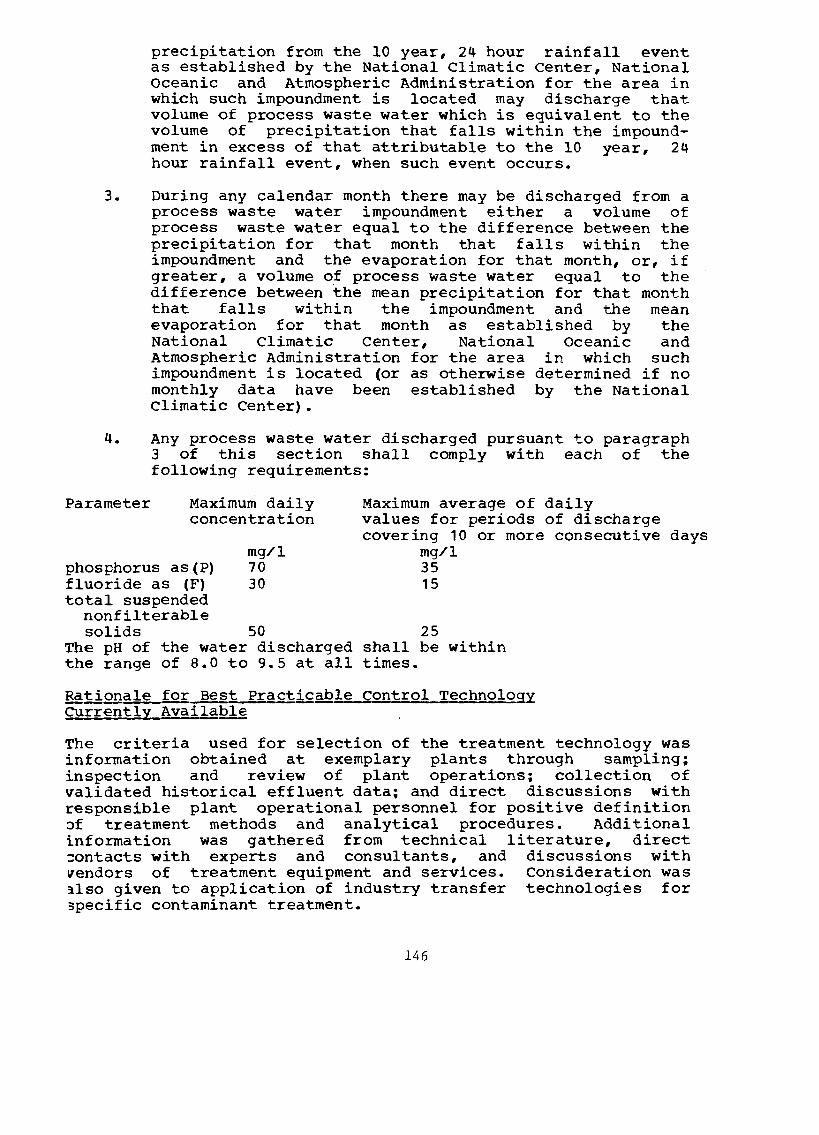
precipitation from the 10 year, 24 hour rainfall event as established by the National Climatic center, National oceanic and Atmospheric Administration for the area in which such impoundment is located may discharge that volume of process waste water which is equivalent to the volume of precipitation that falls within the impound• ment in excess of that attributable to the 10 year, 24 hour rainfall event, when such event occurs.
3. During any calendar month there may be discharged from a process waste water impoundment either a volume of process waste water equal to the difference between the precipitation for that month that falls within the impoundment and the evaporation for that month, or, if greater, a volume of process waste water equal to the difference between the mean precipitation for that month that falls within the impoundment and the mean evaporation for that month as established by the National Climatic Center, National Oceanic and Atmospheric Administration for the area in which such impoundment is located (or as otherwise determined if no monthly data have been established by the National Climatic Center).
4. Any process waste water discharged pursuant to paragraph 3 of this section shall comply with each of the following requirements:
Parameter Maximum daily concentration
phosphorus as (P} fluoride as (F} total suspended
nonfilterable
mg/1 70 30
Maximum average of daily values for periods of discharge covering 10 or more consecutive
mg/1 35 15
solids The pH of the range
50 25 the water discharged shall be within of 8.0 to 9.5 at all times.
Rationale for Best Practicable control Technology: currently Available
days
The criteria used for selection of the treatment technology was information obtained at exemplary plants through sampling; inspection and review of plant operations; collection of validated historical effluent data; and direct discussions with responsible plant operational personnel for positive definition Jf treatment methods and analytical procedures. Additional information was gathered from technical literature, direct =ontacts with experts and consultants, and discussions with ~endors of treatment equipment and services. consideration was ilso given to application of industry transfer technologies for 3pecific contaminant treatment.
146

The proposed limitations are based sampling and years of historical limitations represent values which better exemplary plants surveyed.
on composite (not grab) effluent data. These
are being achieved by the
The proposed effluent limitations for fluorine, phosphate, and pH represent an unusual effluent situation which warrants further discussion. Several factors need to be recognized. One is there is only a periodic need for effluent treatment and discharge. This need.always results from excessive rainfall.
Another factor is the treatment limitations. Particular reference is to the residual P levels after even the second lime neutralization step. The degree of P reduction is a function of pH level. At a pH of 6 the residual Pin the treated water will range 10-60 mg/1. Additional neutralization (third stage) to raise the treated w.ater pH to 9-11 will effect a P level reduction to the 2-25 mg/1 range.
A limitation for ammonia (as N) was established in the proposed guidelines but was dropped from the requirement. This was done because control required a process change and because ammonia levels in existng gypsum ponds are very high. Lime treatment does not reduce the ammonia content of the effluent. The control technology for control of ammonia is the ammonium phosphate selfcontained process. During normal operation this process does not release ammonia to the gypsum pond water system. The source of ammonia in the pond water is equipment wash out contaminated water sprays from other process units and other non-point sources. One plant that uses the self-contained ammonium phosphate technology has an N concentration in the range of 25-66 mg/1 in the gypsum pond water. The higher levels to 600 mg/1 occur when there is no pond water discharge. Additional collection and treatment of ammonia laden wastes can be carried out if necessary to maintain low ammonia nitrogen concentration.
Double lime treatment to a pH of 8.0 ato 9.5 is required to achieve Optimum removal of radium 226 to minimize its hazards.
147

NITROG.fili_fERI,!LIZER INDUSTRY
GENER8!!_~CRIPTION
The survey (described in detail under section III) of exemplary nitrogen fertilizer plants was conducted as part of this project to determine what level of contaminants was in the effluents from these plants and what were the treatment methods in use to maintain these levels. This survey data did indicate that there were some process plants which could be considered exemplary. Verifying the present treatment methods in use and those treatment methods that are still being developed, the following technology is considered to be the best practicable and currently available which is needed to meet the 1977 requirements:
~~racticaEle cont!:Q!_Technology cyrrently Available Include§:
A. Ammonia_§team Stripping
This treatment technology is in operation today in the plants whose effluents are within the newly proposed guidelines for ammonia-N. Although each nitrogen fertilizer complex is different, steam stripping of ammonia contaminated waste water is the best practicable method of control.
B. ~~ydroly~is
This type of technology is used in various forms and to various degrees in urea plants today to give an effluent waste water that will meet the newly proposed ammonia-N guidelines. Although some of these hydrolysis units are company designed, commercial units that will meet the effluent limitations are available from several different sources.
c. Containment_ (Ammonifil!l_Ni~~)
Leak control, spill control, containment and re-use of waste material and good housekeeping is the technology to be used to meet effluent limitations for ammonium nitrate.
D. Containment (Ni~~i£_~£id)
Nitric Acid is produced with no process waste water discharge. Leaks and spills are controllable and can be reused in a nitrogen fertilizer complex. Cooling water will be the subject of a later EPA study.
~- Oil separati.QD
Design technology for API oil separators has been used effectively for years and can now be applied to the nitrogen fertilizer industry. segregation of oil laden streams and
148

separation of oil from these streams will be needed to achieve a satisfactory effluent.
Proposed ~ffluent Limitations Guidelines
The following guidelines are the effluent waste water limitations for the ammonia, ammonium nitrate, nitric acid, and urea sul::categories.
Parameter
NHJ-N
Organic N
kg/kkg of product (lb/ 1000 lb) kg/kkg of product
(lb/1000 lb) kg/kkg of product
(lb/ 1000 lb)
0.063 0.0375 0.05* 0.175 0.5*
0.0375 0. 1*
0.05 0.11*
*Effluent limitations for plants that prill their product.
The above limitations apply to the maximum average of daily values for any period of 30 consecutive days. For ammonia (as N) and nitrate (as N) the maximum for any one day is twice the 30 day maximum average. For organic nitrogen (as N) the maximum for any one day is 2.5 times the 30 day maximum average. pH shall be within the range of 6.0 to 9.0 at all times.
No discharge of process waste water pollutants is the limitation for the nitric acid subcategory.
Ration~~sumptions for Sele~ion of ~chnglogy
The guidelines used for selection of the treatment technology which is required to meet the proposed 1977 effluent limitations have been based on material obtained through sampling, data taking, information gathering, and direct conversation with plant operating personnel at each of the fifteen plants contacted on the exemplary plant survey. Additional information in the form of available literature, direct contacts and vendor contacts was also considered. Treatment methods which are being successfully used in other industries were analyzed for their possible use in the fertilizer industry.
The limitation numbers are based on the best judgment of what is reasonably obtainable after careful analysis of time weighted data over periods of up to two years. These guideline numbers represent effluent levels that have been met by some of the exemplary plants and can be conformed with by any of the nitrogen fertilizer plants which will employ best practicable control technology currently available.
149

Ammonia steam stripping is one treatment method which is being used by the fertilizer industry successfully at a number of locations. Ammonia steam stripping is also in use in the petroleum industry. Steam stripping of ammonia has the drawbacks of what to do with the ammonia. Under present circumstances, it is proposed that this ammonia be vented to the atmosphere either through the carbon dioxide stripper, reformer stack, or an off site boiler stack. The ammonia concentration in the gases from these stacks is not expected to be above 35 mg/m3(46 ppmv) which is the threshold odor limit for ammonia and, therefore, should not present an air pollution problem.
The urea produce Existing problems operating companies
hydrolysis units that are operating in the industry can an effluent which is acceptable for the guidelines. units have had some mechanical problems but these
can be solved with improved engineering and additional experience. Also there are a number of contracting who will offer this treatment method.
The ammonium nitrate limitations are based on the average of the best three plants studied that do not use ion exchange. They achieve this level of performance by leak control, spill control, good housekeeping and containment and reuse of waste material. Ion exchange for treatment of ammonium nitrate wastes is being developed but has been judged to be very expensive and incompletely developed for use as best practicable control technology currently available.
Limitation for oil and grease was considered for the ammonia and urea subcategories where compresssors are used. However, the reproducibility of the oil and grease test is poor at the low concentrations that occur when properly controlled in this industry. For this reason, no limitation is established but control based on appearance of the effluent and water quality will require segregation and separation for oil removal.
150

SECTION X
INI!30DUCT!£lli
The effluent limitations which must be achieved by July 1, 1983 are based on the degree of effluent reduction attainable through the application of the best available technology economically achievable. For the fertilizer manufacturing industry, this level of technology was based on the very best control and treatment technology employed by a specific point source within the industrial category or subcategory, or where it is readily transferable from one industry process to another. Best available technology economically achievable places equal emphasis upon in-process controls and control or treatment techniques employed at the end of a production process.
Those plant processes and control technologies which at the pilot plant, semi-works, or other level, have demonstrated both technological performances and economic viability at a level sufficient to reasonably justify investing in such facilities were also considered in assessing best available technology economically achievable. This technology is the highest degree of control technology that has been achieved or has been demonstrated to be capable of being designed for plant scale operation up to and including no discharge of pollutants. Although economic factors are considered in this development, the costs for this level of control reflect the top- of-the-line of current technology subject to limitations imposed by economic and engineering feasibiligy. However, best available technology economically achievable may be characterized by some technical risk with respect to performance and with respect to certainty of costs. Therefore, this technology may necessitate some industrially sponsored development work prior to its application.
The following factors were taken into consideration in determining best available technology economically achievable:
a. The age of equipment and facilities involved;
b. The process employed;
c. The engineering aspects of the application of variou~ types of control techniques;
d. Process changes;
e. cost of achieving the effluent reduction.resulting fron application of best available technology economical!~ achievable
f. Non-water quality environmental impact (including energ) requirements).
151

PROCESS WASTE WATER GUIDELINES
Process waste water is defined as any water which, during the manufacturing process, comes into direct contact with raw materials, intermediates, products, or by-products.
Based upon the information contained in sections III through IX of this report, the following determinations were made on the degree of effluent reduction attainable with the application of the best available control technology economically achievable in the various subcategories of the fertilizer manufacturing industry.
Best available technology economically achievable includes:
~ Process PhosEboric_b£ig_- Pond Wat~ Dilution_Qf Sulfuric Acid
This technology serves to insure a negative water balance in a phosphate fertilizer complex. That is, there will always be need for fresh water addition to the process units under the assumption that reasonable water management is practiced. With a negative balance, no discharge is required except under extreme weather conditions in which the recirculating water containment volume is exceeded.
The treatment involves an in-process change in the procedure for diluting sulfuric acid. Two different methods have been developed to circumvent the problems of equipment pluggage formerly experienced when contaminated (gypsum pond) water was used for such dilution. As previously mentioned, both of these methods are proprietary but are commercially available.
Prot2~ed B~Ava_i!fil2.!e ~£hnolQgy_Economi£alJ.y_Ach,i~V~£le
The proposed effluent limitation representing the degree of effluent reduction obtainable by the application of the best available technology economically achievable is no discharge of process waste water pollutants to navigable waters. A discharge is only allowed under the following condition. A process waste water impoundment, which is designed, constructed and operated so as to contain the precipitation from the 25 year, 24 hour rainfall event as established by the U.S. National Weather service for the area in which such impoundment is located, may discharge that volume of precipitation that falls within the impoundment in excess of that attributed to the 25 year, 24 hour rainfall event, when such event occurs.
152

MTIONALE..EQB~~~Yb~~Lll;CHNOLOGY ECONOMICA~_b9!I~L!
The use of the best available technology economically achievable on sulfuric acid dilution in a phosphoric acid plant is only recently proven commercially in the u.s. This is also true of both the described processes. There is, however, sufficien~ industrial experience, confidence, and warranty available on one of the treatment methods to justify its incorporation into the design of two other large new units which will come on stream in 1974. The other method has had a unit very similar to the patented method in commercial operation for approximately two years. The unit now in operation is a more refined version of the same process and has proven its ability to function well by use of correct construction materials. Both methods are considered to be technically proven and viable technologies.
The use of pond water for sulfuric acid dilution reduces fresh water consumption by approximately 50% in a phosphoric acid plant. It also provides an attractive financial payout on phosphoric acid operating efficiency by reclamation of water soluble PlO~ values in the gypsum pond water. It is also possible through better reclamation procedures of uncontaminated steam condensate streams to make the negative fresh water balance even more negative.
Based upon the above discussion regarding best available technology economically achievable, it is considered practical and economical to establish a no discharge limitation on phosphate complex effluent.
The following technology is considered to be the best available technology economically achievable:
A. Ammonia steam stripping followed by either high flow ammonia air stripping or biological nitrification-denitrification. This combination can be designed to keep the ammonia nitrogen well within the 1983 guidelines.
B. Continuous ion exchange followed by denitrification. This treatment system can provide the technology to maintain the nitrate nitrogen within the effluent guidelines.
c. Advanced urea hydrolysis followed by high flow ammonia air stripping. The urea hydrolysis technology is fast improving and will be capable of meeting the proposed guidelines.
The following guidelines are recommended as the water limitations from the ammonia, nitric ammonium nitrate subcategories:
153
effluent waste acid, urea and

fsrameter
NHJ-N
Organic N
kg/kkg of product 0.025 (lb/1000 lb) kg/kkg of product -
(lb/1000 lb) kg/kkg of ·product -
(lb/10 00 lb)
Subcategory
0.015 0.015* 0.025 0.0375*
0.0075 0.0075*
0.0125 0.0125*
* Effluent limitations for plants that prill their product. The above limitations apply to the maximum average of daily values for any period of 30 consecutive days. The daily maximum average is twice the 30 day maximum average. pH shall be within the range of 6.0 to 9.0
No discharge of process waste water pollutants is recommended for the nitric acid subcategory.
Ratignale fil19_.AssumptiQn2-for Selection Q.L.Ig£hno1Qgy
Because there will be changes before 1983, the economic analysis of any treatment system will change. Therefore, the selection of 1983 technology is based more on the availability of processes than on detailed economics. The possibility of new improved technology being developed between now and 1983 can only enhance the owner-operators choice of treatment methods capable of meeting these guidelines.
Much of the technology proposed is still in the development stage such as high flow air and steam stripping, continuous ion exchange and advanced urea hydrolysis. However, progress to date shows that much of the remaining work deals with mechanical improvement, control instrumentation and equipment modifications which should make each one of these processes completely functional.
154
SECTION XI
~EW SOJIB£j PERFORMANCE STANDARDS AND PRETREATMENT RECOMMENDATIONS
INTRODUCTION
This level of technology is to be achieved by new sources. The term "new source: is defined in the Act to mean "any source, the construction of which is commenced after publication of proposed regulations prescribing a standard of performance". New source performance standards are to be evaluated by adding to the consideration underlying the identification of best practicable control technology currently available a determination of what higher levels of pollution control are available through the use of improved production processes and/or treatment techniques. Thus, in addition to considering the best in-plant and end-ofprocess control technology, new source performance standards are to be based upon an analysis of how the level of effluent may be reduced by changing the production process itself. Alternative processes, operating_ methods or other alternatives are to be considered. However, the end result of the analysis identifies effluent standards which would reflect levels of control achievable through the use of improved production processes (as well as control technology), rather than prescribing a particular type of process or technology which must be employed. A further determination which was to be made for new source performance standards is whether a standard permitting no discharge of pollutants is practicable.
The following factors were to be considered with respect to production processes which were analyzed in assessing new source performance standards:
a. The type of process employed and process changes;
b. Operating methods;
c. Batch as opposed to continuous operations;
d. Use of alternative raw materials and mixes of raw materials;
e. Use of dry rather than wet processes (including substitution of recoverable solvents for water); and
f. Recovery of pollutants as by-products.
PROCESS WATER GUIDELINES
Pho~phate §!!££ilegory
It is recommended that new source performance identical to the 1983 limitations for all fertilizer plant sources.
155
standards b~ new phosphate

!'g~Iogen f~rtil~z~r Industry
GeneraLDiscussion
In addition to the treatment technologies listed under the 1977 and 1983 technologies the following process modifications and plant arrangements may be considered.
Best Demonstrat~d Technology (Process Improvements}
A. Integration of an ammonia process condensate steam stripping column into the condensate-boiler feed water system of an ammonia plant with or without further stripper bottoms treatment depending on boiler quality make-up needed.
B. Building of adequate sized urea and ammonia plants so centrifugal rather than reciprocating compressors used.
that can be
c. Designing in contaminated water collection systems so that common contaminant streams can be segregated and treated in minor quantities for improved efficiencies and reduced treatment costs.
D. Location of plant cooling tower up wind of the prevailing wind direction to minimize the chance of absorbing ammonia in the tower water.
E. Design of a low velocity air flow prill tower for urea and ammonium nitrate to minimize the dust loss. This can reduce the yield loss around the prill tower from 31 down to less than 0.5% with a corresponding reduction in the raw waste load.
F. Design for a lower pressure steam level, say 41.8 atm (600 psig) to 62.2 atm (900 psig), in an ammonia plant to make process condensate recovery easier and less costly.
G. Install air cooled condensers and exchangers to minimize cooling water circulation blowdown.
fropQ§ed New source Perfor™_g_Standards
where possible and subsequent
The following guidelines are recommended for new source effluent waste water standards from the ammonia, urea, nitric acid, ammonium nitrate and subcategories:
156

Parameter Units Subcategory
Ammonia Ammonium Nitr~te
NHJ-N
Organic-N
kg/kkg of product 0.055 (lb/10 00 lb) kg/kkg of product -
(lb/1000 lb) kg/kkg of product -
(lb/1C00 lb)
0.0325 0.0325* 0.12 0.35*
0.025 0.05*
0.0125 0.025*
* Effluent limitations for plants that prill their product. The above limitations apply to the maximum average of daily values for any period of 30 consecutive days. The daily maximum average is twice the 30 day maximum average. pH shall be within the range of 6.0 to 9.0 at all times.
No discharge of process waste water pollutants is recommended for the nitric acid subcategory.
Rationale & ~~sumptions in the Development of New source Perfor!!}fill£~andards
one major problem in trying to treat waste water contaminants is that of dealing with large quantities of water with very dilute contaminant concentrations. Most existing plant complexes have very limited facilities for keeping different waste waters separated and, therefore, any treatment system installed has to handle large amounts of effluent waste water. The construction of a new process plant and more noticeably a nitrogen fertilizer complex allows the design of a contaminated water separation/ collection system to allow more efficient, less costly treatment of contaminants. More improved use of plant water including recycling should also aid in treating waste effluents.
Best available technology currently available is applicable to new sources as it becomes available on a commercial basis; however, all best practicable control technology currently available can be up-graded to treat "concentrated/separated" waste water effluents from new plants to meet the New Source Performance Standards. Therefore some effluent limitations for new sources are less stringent than those for the 1983 standards because the technology is still being refined. Of particular importance is the placement of cooling towers in relation to the ammonia, air emissions sources. Downwind absorption of ammonia by recycled cooling water can significantly contribute to the raw waste load. New plants have the freedom of plant arrangement that existing plants do not. Furthermore, through good engineering design, new plants should be able to eliminate the problem at the source by minimizing air leaks. Since much of the 1983 technology is not commercially available, the above limitations represent engineeringing judgment as to what
157

improvements can be implemented beyond best practicable control technology currently available.
Pretreatmfil!t Requirements for New sources
The type of waste water effluent that is discharged· from a nitrogen fertilizer complex contains compounds, such as ammonia nitrogen and nitrate nitrogen, that would pass through a typical activated sludge or trickling filter waste water plant and therefore this waste water at its normal concentration levels would not be amenable to treatment by conventional biological treatment processes. No discharge of process waste water pollutants from new sources to publicly owned treatment works is recommended for the phosphate and nitric acid subcategories. For the remaining subcategories pretreatment and treatment provided by the publicly owned treatment works must sum to equal the effluent limitations for discharge to navigable waters for new sources if a discharge to publicly owned treatment works is to be allowed.
158

SECTION XII
ACKNOWLEDGEMENTS
The Environmental Protection Agency would like to thank Mr. Robert Heinz, Mr. Edgar Bailey and Mr. Donald Ross of Davy Powergas, Inc. for their aid in preparation of this report.
The project officer would like to thank his associates in the Effluent Guidelines Division, particularly Messrs Allen Cywin, Ernst P. Hall, Walter J. Hunt and Michael w. Kosakowski for their valuable suggestions and assistance.
Special appreication is given to the secretarial staff, especially Ms. Sharon Ashe, Ms. Kay Starr, Ms. Chris Miller and Ms. Nancy zrubek, for typing and revision of this and the accompanying documents. Appreication is also given to Ms. Kit Krickenberger who coordinated the secretarial staff assignments.
Thanks are also given to the members of the members of the EPA working group/steering committee for their advice and assistance. They are:
Mr. Walter J. Hunt, Effluent Guidelines Division, Chairman Mr. Elwood E. Martin, Ef~luent Guidelines Division, EPA. Mr. Harry Trask, Office of Solid Waste Management Program, EPA. Mr. John savage, Office of Planning and Evaluation. Mr. Srini Vasan, Region V, Dr. Edmond Lomasney, Region VI, Mr. Paul DesRosiers, Office of Research and Monitoring, Dr. Murray Strier, Office of Permit Programs, Mr. Ray McDevitt, Office of General counsel, Mr. Richard c. Insinga, Office of Planning and Evaluation. Dr. Robert R. swank, Jr., Office of Research and Development,
NERC - Corvallis, Athens, Georgia. Mr. Michael w. Kosakowski, Effluent Guidelines Division,
Acknowledgement and appreciation is extended to the following companies, institutions, associations, laboratories, agencies, and persons for their help, assistance and cooperation in providing information:
1. Borden Chemical company, Piney Point, Florida 2. Royser Fertilizer Company, Mulberry, Florida 3. American Cyanamid, Brewster, Florida 4. Agrico Chemical company, south Pierce, Florida 5. w. R. Grace, Mulberry, Florida 6. Gardinier (USPP), East Tampa, Florida 7. Apple River Chemicals, East Dubuque, Illinois 8. cooperative Farm Chemicals Association, Lawrence, Kansas 9. Phillips, Hoag, Nebraska
159

10. Cominco-American, Hoag, Nebraska 11. Chevron Corporation, Ft. Madison, Iowa 12. North Carolina Nitrogen complex, Tunis, North Carolina 13. central Farmers, Incorporated, Tyner, Tennessee 14. J. R. Simplot, Pocatello, Idaho 15. Valley Nitrogen, Helm, California 16. Vistron corporation, Lima, Ohio 17. Terra Chemicals International, Inc., Sioux City, Iowa 18. National Phosphates, Taft, Louisiana 19. Triad Chemical, Donaldsonville, Louisiana 20. Mississippi Chemieal Corporation, Yazoo City, Mississippi 21. Mississippi Chemical Corporation, Pascagoula, Mississippi 22. Socal, Pascagoula, Mississippi 23. Freeport Chemical Company, Convent, Louisiana 24. st. Paul Ammonia Products, st. Paul, Minnesota 25. Farmland Industries, Fort Dodge, Iowa 26. Thornton Labratory, Tampa, Florida 27. serco Laboratory, Minneapolis, Minnesota 28. Harris Laboratories, Lincoln, Nebraska 29. Stewart Laboratory, Knoxville, Tennessee 30. James Engineering, Armonk, New York 31. Mr. A. L. West, Lakeland, Florida 32. Dr. James A. Taylor, Lakeland, Florida 33. Mr. w. A. Lutz, Weston, Connecticut 34. The Fertilizer Institute 35. The Environmental Committee, The Fertilizer Institute 36. Florida Phosphate Chemists Association 37. Davy Powergas, Inc., P.O. Box 2436, Lakeland, Florida 38. Stamicarbon N.V, Dutch State Mines, Geleen, Netherlands 39. IVO MAROVIC, Consultant, New York, New York 40. Technip, Inc., 437 Madison Avenue, New York, New York 41. Battelle Northwest, Richland, Washington 42. United States Steel Agricultural Chemicals corporation,
Bartow, Florida.
160
SECTION XIII !3:EF~~~
prepared by Battelle Memorial Institute Richland, Washington for the Environmental Protection Agency, Grant No. 12020FPD, September 1971, U.S. Government Printing Office, Washington, o.c., 20402.
B. Advanced wastewater ~eatment
by Russell L. Culp and Gordon L. Culp, Van Nostrand Environmental Engineering Series, copyright 1971 Educational Publishing, Inc., New York, Library of catalog card Number 78-147192.
c. Am!!!QniLRemgy~l in a_P~ysical-Chemical Wa.§i.fil!s!~£ ~llifilfil1LProcess
Runhold, by Litton congress,
by Robert A. Barnes, Peter F. Atkins, Jr. Dale A. Scherger; Prepared for Office of Research and Monitoring, u.s. Environmental Protection Agency, Washington, D. c., 20460, EPA-Ri-72-123, November, 1972.
D. AmmoniLfillg_Synthesi.§_~2
by Robert Noyes; Noyes Development Corporation, Mill Road at Grand Avenue Park Ridge, New Jersey, 07656.
by Herbert F. Lund; McGraw H.ill Publishing Co., New York, Library of congress catalog card Number 70-101164.
F. Gauging ang sampling In.g.Y2Yial w22!~wat~~
by Joseph G. Robasky and Donald L. Koraido Calgon corporation; Chemical Engineering Magazine, Vol. 80, No. 1, January 8, 1973, Pages 111-120.
G. ~virollmfilltal ~ection Agency §t~dy Report Indus:,Uia! ~~ fil:~ies Prog~
Group 6 Fertilizers prepared by Wellman-Powergas, Inc.; Lakeland, Florida, 33803, for Environmental Protection Agency, July, 1971, contract No. 68-01-0029.
H. Ih~ Phosphate Indu.§:tu in thLQnited ~~
by E.c. Houston Tennessee Valley Authority, Office of Agricultural and Chemical Development, Division of Chemical Development, Muscle Shoals, Alabama, July, 1966.
161

I. COfil!rull£ial Fe~tilizer Yearbook - 191.Q
Walter w. Brown Publishing co., Inc. 75 Third street, N.W. Atlanta, Georgia, 30308.
J. Characteristics of~ World Fertilizer Industry - Phosphatic Fertilizers-
by Travis Hignett, Director of Chemical Development, Tennessee Valley Authority, Muscle Shoals, Alabama, December 1967, TVA Report No. S-422.
by Wellman-Lord, Inc. Lakeland, Florida, Copyright 1967, Paramount Press, Inc., Jacksonville, Florida.
L. Economi£ Impac'!; of !i§:ter ,gollutign Control ,Eeguirements Q!! th~ Fertiliz~~ ~fillli!.2£tur,ing Industn
by Development Planning and Research Associates, Inc., P.O. Box 727, Manhattan, Kansas, 66502. Interim Report to Environmental Protection Agency, Contract No. 68-01-0766, November, 1972.
M. World Nitrogen Plants 1968-1973
Chemical Products series Report-May 1969, Stanford Research Institute; Menlo Park, California, 94025.
N. Phosphatic F~tilizers - Prope!ties and Processes
by David w. Bixby, Delbert L. Rucker, Samuel L. Tisdale, Technical Bulletin No. 8, October 1966, The Sulphur Institute, 1725 "K" Street Northwest Washington, D.c. 20006.
o. Ne~ Developme!ll.§ iu Fluorid~ Emissions Pfocessing Plani§
Phosphate
by Frank L. cross, Jr. and Roger w. Ross JAPCA, Volume 19, No. 1, Page 15, January, 1969.
P. The Chemical Indus1!Y.-Facts Book by Manufacturing Chemist Association, Inc., 5th Edition 1962, 1825 Connecticut Ave., Washington, D.C., Library of Congress catalog card No. 59-15407.
Q. ~2ter Quali~y Criteria
National Technical Advisory Committee, Federal Water Pollution Control Administration, Washington, D.c., 1968.
N.I sax, Reinhold Publishing corp. New York, New York, 1951.
-162
s. Ni~es in Human Health
c. J. Mansfield, Missouri Agricultural Experiment Station, Special Report No. 55, Pages 37~38, 1965.
T. Industrial Water Pollution control
w. w. Ekenfelder, McGraw-Hill Publishing co., New York, Published 1966, Library of Congress catalog card No.66 -17913.
u. " ?,bqsi;>9o~u2 and 11;s Com,2o~n<;i§i .,.._ . ,- - . .
John R. Van Wazer, Interscience Publishers, Inc., New York (1961), Library of congress card No. 58-10100.
v. ~dmium in_BQck Phosphate Or~
H.P. Nicholson, PH.D., Director southeast Research Laboratory (6/19/73).
Environmental
w. standa~g M~~hog2 £2!: !h~ E~mination 2! ~.fil: and waste Water~ 13th edition, American Public Health Association (1971) •
x. ~thods for £hemic2! &ualysis Q1 !'@!.~ ~nd ~es, EPA, National Environmental Research center, Analytical Quality control Laboratory, Cincinnati, Ohio (1971).
163

•,
SECTION XIV 1
All underlined numbers within a chemical formula represent normally subscripted numbers. For example, HlO represents water. Physical limitations of the printing device make this system necessary.
Aerobic
Living in the presence of oxygen.
Algae
A group of ~quatic nonvascular plants with chlorophyll.
Anaerobic
Living in the absence of free oxygen.
Apatite
A natural calcium phosphate usually containing fluorine occuring as phosphate rock. ~
Biological Process
The process by which bacteria and other micro-organisms in search of food, breakdown complex organic materials into simple, more stable substances.
Biuret
NH2CONHCONH2 • HlO. cabamylurea:-
Also referred to as allophanamide and
Boiler Blowdown
A small amount of boiler feed water wasted to remove the build up of contaminants from the boiler.
Boiler Feed water Make-up
water that is acceptable for steam generation in high pressure boilers.
contaminated waste water
Effluent waste water that has been contaminated due to contact with process water (could be cooling tower, boiler blowdown or pond water)
165
cooling Water Blowdown
Small quantity of cooling water discharged from a recycling cooling water system to remove concentrated contaminants from the tower.
Deionized water
Water (raw, filtered or treated) that had certain ions removed by an ion exchange unit.
Denitrification
An anaerobic process which converts nitrate nitrogen to nitrogen gas.
Dissolved Oxygen
Amount of free oxygen dissolved in water.
Exemplary
The term used for plants or units within plants that exhibit well operated treatment schemes or in-plant techniques that qualify them as best practicable control technology currently available, best available technology economically achievable, or best demonstrated technology. such plants or units may belong to another industrial category whose technology may be transferred to the industry under study.
GTSP
Granulated triple superphosphate.
Nitrification
conversion of nitrogenous matter into nitrate by bacteria.
Pond water
Water us~d in the manufacture of phosphoric acid and related compounds to remove heat, convey gypsum and scrub contaminants.
Prills
Small round or acicular aggregates of a material that are artificially prepared.
Process Water
'Any water which, during the manufacturing process, comes into direct contact with any raw material, intermediate, product, byproduct, or gas or liquid that has accumulated such constituents.
166

Raw Water
Water that has not been treated in any way, taken from a well, a river, a lake, or other non-contaminated source.
ROP
Run-of-pile triple superphosphate.
Single Train Plant
A plant (especially an ammonia plant) that employs a single very large production unit with a high degree of maintenance-free reliability. This is in contrast to a double train plant which employs 2 identical units run in parallel with a lesser degree of reliability, but which has the advantage of maintaining some production when one unit is down.
Ton
All uses of the term "ton" imply short ton equal to 2000 lb.
Treated water
Raw water or filtered water that has been treated to make it suitable for plant needs (such as softening).
TSP
Triple superphosphate.
167

METRIC UNIT'S CD:NERSICN TABLE 4
MULTIPLY (ENGLISH UNITS) by 'IO OBTAIN (METRIC UNITS)
~SH UNIT ABBRE.VIATIOO CD:NERSICN ABBREVIATION METRIC UNIT
acre ac 0.405 ha hectares acre - feet ac ft 1233.5 cum cubic rceters British 'lhennal BTU 0.252 kg cal kilogram-calories
Unit British 'lhennal B'IU/lb 0.555 kg cal/kg kilogram calories/
Unit/pound kilogram cubic feet/minute cfm 0.028 cum/min cubic rceters/minute cubic feet/sea:md cfs 1. 7 cu m/mi.n cubic rceters/minute cubic feet cu ft 0.028 cum cubic rceters cubic feet cu ft 28.32 1 liters cubic inches cuin 16.39 cu cm cubic centimeters degree Fahrenheit op 0.555 (°F-32) * oc degree Centigrade
1--' feet ft 0.3048 m rceters °' gallon gal 3.785 1 liters CD
gallon/minute gpn 0.0631 1/sec liters/seoond horseix:,wer hp 0.7457 kw kilowatts inches in 2.54 cm centimeters
~ inches of rcercury in Hg 0.03342 atm atnospheres !'" Q pounds lb 0.454 kg kilograms 0 < '"' million gallons/day ngd 3,785 cum/day cubic rceters/day "' z ,: mile mi 1.609 km kilareter m z .... potmd/square inch psig (0.06805 psig +1)* atm atnospheres ,, "' z (gauge) (absolute) ::! z square feet sq ft 0.0929 sq m square rceters C>
0 ... square inches sq in 6.452 sq cm square centimeters .,, 0 m tons (short) ton 0.907 kkg rcetric tons ;;, j (1000 kilograms) ... u, yard yd 0.9144 m rceters ... a-
"' ~ ~
*Actual conversion, not a multiplier "'