energy market a - federal energy regulatory … inappropriate energy market behavior, contact our...
TRANSCRIPT
STAFF REPORT BY THE
OFFICE OF MARKET OVERSIGHT AND INVESTIGATIONS
FEDERAL ENERGY REGULATORY COMMISSION
ENERGY MARKETASSESSMENT
J U L Y 2 0 0 3

1
E N E R G Y M A R K E T A S S E S S M E N T
TABLE OF CONTENTS
P R E F A C E
This market assessment reflects the ongoing commitment of the Federal Energy Regulatory Commission’s Office of Market Oversight and Investigations to identify and monitor the significant issues facing wholesale electric and natural gas markets.
The assessment focuses on electric and natural gas issues the nation’s energy markets face. While OMOI’s primary focus is real-time and after-the-fact market analysis, we use forward-looking assessments to focus our monitoring efforts and to highlight opportunities for action by Commission, industry and other interested parties.
The Federal Energy Regulatory Commission created OMOI in April 2002 to focus its efforts in energy market oversight. Any errors are the responsibility of OMOI alone and not of the Commission as a whole.
We encourage readers to provide feedback on this OMOI product by sending comments to [email protected], or by contacting staff listed in the acknowledgements. They can be reached as follows:
Office of Market Oversight and InvestigationsFederal Energy Regulatory Commission888 First Street, N.E.Washington, DC 20426(202) 502-8100
A fair energy marketplace is everyone’s responsibility. Please do your part. If you encounter inappropriate energy market behavior, contact our Enforcement Hotline toll-free by telephone at 1-888-889-8030 or via e-mail at [email protected].
Thank you.
WILLIAM F. HEDERMANDirectorOffice of Market Oversight and Investigations
EXECUTIVE SUMMARY.......................... 1
NATIONAL CHALLENGES
1. HIGH NATURAL GAS PRICES ................... 52. LACK OF DEMAND RESPONSIVENESS IN ELECTRICITY MARKETS .................... 15
3. FINANCIAL STRESS OF SOME NATURAL GAS AND ELECTRIC MARKET SECTORS............. 23
CONCLUSION .................................. 31
APPENDICES A. REGIONAL ASSESSMENTS ................... 33 NEW ENGLAND ............................ 34 NEW YORK ................................. 36 MID-ATLANTIC (PJM) .................... 38 SOUTHEAST (ENTERGY, SOUTHERN, TVA, VACAR, FRCC) ................. 40 MIDWEST (ECAR, MAIN, MAPP) ..... 43 SOUTH CENTRAL (SPP)................... 45 SOUTHWEST (AZ-NM-SNV AND RMPA) .............................. 47 NORTHWEST (NWPP) .................... 49 CALIFORNIA................................ 51B. LIST OF ACRONYMS .......................... 55C. GLOSSARY ................................... 57D. FERC ENERGY MARKET PARTICIPANT INDEX ......................... 61E. SELECTED NATURAL GAS
AND ELECTRICITY PRICE POINTS............... 63
ACKNOWLEDGEMENTS ....................... 65

1
E N E R G Y M A R K E T A S S E S S M E N T
National ChallengesIn OMOI’s assessment, the three most pressing concerns for electric and natural gas markets currently are:
Challenge 1: High natural gas pricesA tight supply and demand balance in North
America has driven natural gas prices significantly higher than year-ago levels. Recently, natural gas drilling has increased, but it is unlikely that new supply will moderate prices soon. Demand will remain relatively high compared to supply due to the twin uses of filling storage, which reached record lows this spring, combined with meeting demand for gas-fired power generation for cooling loads. Demand-side solutions, such as fuel switching and indus-trial demand responsiveness, will be less effective than in the past. How the public responds to pleas for conserva-
tion from Energy Secretary Abraham could play a key role in the near term.
High gas prices will challenge both electric and gas market customers in the near term. Electric markets, increas-ingly dependent on natural gas for a significant share of power generation fuel, will face increased prices. The extent of the burden depends primarily on weather conditions. And gas markets face the competing demands to use gas to serve electric customers and to use gas to fill storage for heating customers this coming winter.
Challenge 2: Lack of demand respon-siveness in electricity markets
A lack of demand responsiveness in electricity markets costs customers in times of peak demand. When prices for electricity rise, few customers see this change in time to respond and, thus, do not have the opportunity to
ExecutiveSummary ENERGY MARKET
ASSESSEMENT
High reserve margins exist across much of the country. Market participants have taken steps toward transparent market designs and trading platforms as energy markets evolve. Industry has agreed to respond to concerns about gas
price information. Despite recent financial problems, energy markets appear to be rebounding financially.
Nevertheless, energy markets face national and regional challenges, which we examine in this report.

E N E R G Y M A R K E T A S S E S S M E N T
2
E N E R G Y M A R K E T A S S E S S M E N T
3
reduce their electricity use. During periods of transmission constraints or high demand, these prices can rise substan-tially. Rather than reducing supply to those customers who would prefer to reduce consumption rather than pay high prices, market operators must generate or buy sufficient electricity to meet total price-insensitive demand, raising costs for all customers. In addition, lack of demand responsiveness increases the ability of suppliers to exert market power and raise prices for all customers.
Absent demand responsiveness, electricity markets face higher prices during periods of high demand and congestion. Though small reductions in demand during these times could lower electric prices significantly, this option is missing across most of the country. Customers need access to meaningful and accurate price information that reveals the value of electricity given the time and place of use. With this tool allowing customers to change their electricity usage in response to price, demand response could have a significant effect on electricity price levels, price volatility, system reliability and supplier market power. This is a more efficient means of meeting peak demand than purchasing electricity at peak prices. In the near term, the only likely meaningful effect on high and volatile electricity prices and supplier market power will result from policy leader exhortations for conserva-tion, load shifting and other actions as a part of good energy citizenship.
Challenge 3: Financial stress of some natural gas and electric market sectors
Since 2001, large sectors of natural gas and electric markets have experienced a financial crisis accompanied by a loss of investor confidence, a dramatic decline in financial liquidity and project delays and cancellations. These problems have adversely affected customers by reducing the number of companies active in energy markets, conse-quently limiting market liquidity and effectiveness.
In the first half of 2003, while a few companies filed for bankruptcy, many companies in the beginning of the year negotiated debt-refinancing deals that allowed them additional time to implement revised business strate-gies and await improving market conditions. If financial conditions continue to improve, the industry can move into a new phase characterized by streamlined costs, a refocus on core business lines, continued improve-
ments to balance sheets and, in some cases, a change in ownership, management and business strategies. The results should improve market liquidity over the longer term, making markets more efficient and giving customers choices.
Although the industry is still recovering from the loss of market capitalization incurred since 2001, it appears to have reached a new, reduced-value plateau that could be the starting point for future growth. For the FERC Energy Market Participant Index of more than 90 companies (see Appendix D) as of June 20, year-to-date market capitalization was up almost $34 billion, or 11 percent, compared to a loss of $91 billion, or 29 percent, in 2002.
Because financial uncertainty continues, however, the industry and its customers must contend with shrinking physical and financial energy markets due to participants that have exited or scaled back trading. This contraction gives customers fewer choices and reduces market efficiency. Financial troubles can be accompa-nied by reduced capital expenditures and consequent operational difficulties. Finally, financial stress creates the incentive for potentially inappropriate interaffiliate cash management practices because the costs could be inappro-priately borne by customers of regulated affiliates.
Regional AssessmentsCurrently, most electricity markets across the
country have high reserve margins, which gener-ally reduce prices. Nevertheless, there are issues of concern in each region that OMOI is monitoring. More detailed discussion of each region’s areas of concern appears in Appendix A, including reserve margins, natural gas and electric prices and maps. The matters of particular concern in each region that OMOI will monitor closely are:

E N E R G Y M A R K E T A S S E S S M E N T
2
E N E R G Y M A R K E T A S S E S S M E N T
3
New England Southwest Connecticut load pocket
ISO-NE’s new market software
Transmission constraints that prevent export of excess efficient generation
Potentially high natural gas-driven electric prices
New York New York City load pocket
Long Island load pocket
Non-operational tie line between Long Island and Connecticut
Gas deliverability constraints into the downstate area
Potentially high natural gas-driven electric prices
Mid-Atlantic (PJM) Congestion in the Delmarva Peninsula
Congestion in northern New Jersey
Constrained transmission lines or substations Wylie Ridge Bedington-Black Oak Doubs Erie West-Erie South East Towanda-North Meshoppen
Seams problems related to coordination with other regions
Potentially high natural gas-driven electric prices
Southeast (Entergy, Southern, TVA, VACAR, FRCC) Gas deliverability constraints in Florida
Constraints along internal interfaces, such as between Southern and the Tennessee Valley Authority
Local transmission constraints Atlanta, Ga. Destin, Fla. Panama City, Fla.
Constrained Cloverdale-Lexington transmission line
Potentially high natural gas-driven electric prices
Midwest (ECAR, MAIN, MAPP) Load pocket in Wisconsin-Upper Michigan System
Seams problems related to loop flow along Lake Erie with PJM
Constrained transmission areas Eau Claire-Arpin Lore-Turkey River Northern Kentucky Poweshiek-Reasnor Michigan-Ontario interface North Platte-Stockville
Potentially high natural gas-driven electric prices
South Central (SPP) Constrained interface between SPP and Entergy
Constraints along LaCygne-Stilwell transmission line
Other constrained transmission lines Phillips-South Phillips North Eastern-Oneta Craig Junction-Ashdown West Morrison-Stilwater Creswell-New Kirk El Paso-Farber Ft. Smith-ANO
Potentially high natural gas-driven electric prices
E N E R G Y M A R K E T A S S E S S M E N T
4 5
E N E R G Y M A R K E T A S S E S S M E N T
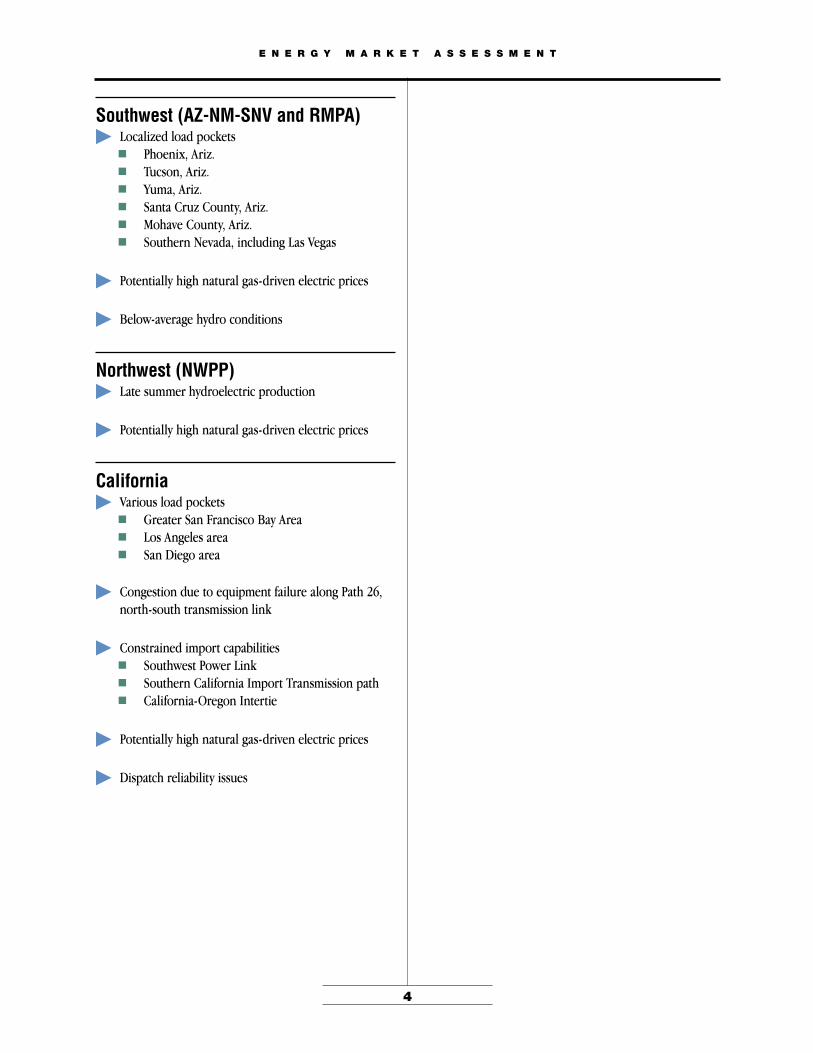
Southwest (AZ-NM-SNV and RMPA) Localized load pockets
Phoenix, Ariz. Tucson, Ariz. Yuma, Ariz. Santa Cruz County, Ariz. Mohave County, Ariz. Southern Nevada, including Las Vegas
Potentially high natural gas-driven electric prices
Below-average hydro conditions
Northwest (NWPP) Late summer hydroelectric production
Potentially high natural gas-driven electric prices
California Various load pockets
Greater San Francisco Bay Area Los Angeles area San Diego area
Congestion due to equipment failure along Path 26, north-south transmission link
Constrained import capabilities Southwest Power Link Southern California Import Transmission path California-Oregon Intertie
Potentially high natural gas-driven electric prices
Dispatch reliability issues

E N E R G Y M A R K E T A S S E S S M E N T
4 5
E N E R G Y M A R K E T A S S E S S M E N T
two issues, discusses how the industry is addressing them and presents Commission actions to address the issues. OMOI plans to monitor closely developments related to these issues.
The SituationNatural gas prices have moved
to a new, potentially sustainable level above $4/MMBtu. Spot gas prices are holding at this high level and the average of the 12-month strip through July 2004 at the New York Mercantile Exchange (Nymex) is trading around $5.105/MMBtu. As shown in Figure 1-1, Nymex values for monthly contract settlement prices for the balance of 2003 are trading at 42 percent above the monthly contract settlement prices for the same months in 2002 and at approximately three times the price of those contracts during the early 1990s.
A tight supply and demand balance in North America has driven natural gas prices signifi-cantly higher than year-ago levels. Recently, natural gas drilling has increased, but it is
unlikely that new supply will moderate prices soon. Demand will remain relatively high compared to supply due to the twin needs to refill storage, which reached record lows this spring, combined with meeting demand for gas-fired power generation for cooling loads this
summer. Demand-side solutions, such as fuel switching and indus-trial demand responsiveness, will be less effective than in the past. How the public responds to pleas for conservation from Energy Secretary Abraham could play a key role.1
High gas prices will challenge both electric and gas market custom-ers in the near term. Electric markets, increasingly dependent on natural gas for a significant share of power generation fuel, will face increased prices in the near term. The extent of the burden depends primarily on weather conditions. And gas markets face the competing needs to use gas to serve electric customers and to use gas to fill storage for heating custom-ers this coming winter.
This chapter presents these
1 Department of Energy, “Abraham Unveils Smart Energy Use Education Campaign,” press release, July 9, 2003.
Load, which is often synonymously used with
demand, is the total amount of power carried
by an electric system per unit of time.
Demand responsiveness/
demand response occurs when
customers respond to an increase in price by lowering demand for a good or service
and respond to a decrease in price by
increasing demand for a good or service.
Spot market is the natural gas market
for contractual commitments that are
short-term (usually a month or less) and that begin in the near future (often the next day, or within days).
In electricity, spot markets are usually
organized markets for day-ahead and real-time electricity run by an independent system operator or
regional transmission organization.
12-month strip refers to the prices
for the next 12 months of consecutive natural
gas futures trading contracts, usually
starting with the nearest, or prompt, month.
HIGH NATURAL GAS PRICES
Challenge 1

E N E R G Y M A R K E T A S S E S S M E N T
6
E N E R G Y M A R K E T A S S E S S M E N T
7
Figure 1-108-22-03
$12
$10
$8
$6
$4
$2
$0
Price($/MMBtu)
History Futures Prices
Jan‘03
Jan‘91
Jan‘92
Jan‘93
Jan‘94
Jan‘95
Jan‘96
Jan‘97
Jan‘98
Jan‘99
Jan‘00
Jan‘01
Jan‘02
Jan‘04
Jan‘05
Jan‘06
Monthly ContractSettlement Price
FuturesSettlementPrice
Figure 1-1: Henry Hub futures prices indicate that market participants expect real natural gas prices to remain well above prices of the early 1990s
Source: Historical data are Nymex settlement prices from GASdat, adjusted for inflation.Futures prices are Nymex settlement prices on July 15, 2003.
Recently, natural gas drilling has increased, but it is unlikely that new supply will arrive quickly enough to moderate prices soon. The number of U.S. natural gas rigs drilling for gas increased 29 percent from January 1, 2003 to July 11, 20032 showing that the market is respond-ing effectively to price signals but U.S. natural gas dry production is down since 2001. It dropped from 19.68 Tcf in 2001 to 19.05 Tcf in 2002, a decrease of 3.2 percent.3 Well productivity has declined significantly and gas prices have risen in part because gas production costs are higher. Though demand has remained low — 2002 demand is slightly above 2001 demand and below 2000 consump-tion4 — it remains high relative to supply.
Limitations exist in demand-side flexibility to buffer natural gas prices. Many industrial and power generation facilities that have been burning liquid fuels due to recent high natural gas prices may be nearing emissions limits.5
In addition, most of the new natural gas-fired generating units that have entered service since 2002 do not have backup fuel oil capability.6
Finally, a significant amount of price-sensitive demand declined prior to the heat of the summer. The chemical industry, the largest industrial natural gas consuming sector,7 has been reporting poor financial results due to weak product prices and high natural gas prices. Several firms have shut down or slowed production at U.S. plants.8 The story in fertilizer production, another large industrial user of gas, is much the same, with several U.S. firms in bankruptcy and others shifting much or all of their operations to Trinidad or the Middle East, where gas feedstock is cheaper than in the United States. Other industrial companies that use natural gas for power generation have invested in more efficient gas equipment
Point,” monthly briefing, May 15, 2003, p. 3.6 POWERdat, July 31, 2003.7 Lehman Brothers, “Natural Gas: A Comprehensive Supply-Demand Analysis,” April 16, 2003.8 Carol Dudley, Dow Chemical Co., news conference, March 11, 2003.
2 www.bakerhughes.com, “U.S. Rotary Rig Count, Baker Hughes Oil-Gas Split.”3 Energy Information Administration (EIA), Summary of Natural Gas Production, Web file name: NGM01VMALL.xls.4 EIA, Short-Term Energy Outlook, Table 8, July 2003.5 Cambridge Energy Research Associates (CERA), “Oil and Gas at the Switch
E N E R G Y M A R K E T A S S E S S M E N T
6
E N E R G Y M A R K E T A S S E S S M E N T
7
An electric generating unit is on the margin/the
marginal unit if it is the last unit turned
on in an area to serve load. In organized
wholesale markets, the price of the marginal source of electricity
usually sets the price for all generation within the market.
9 NEWGen, May 22, 2003.10 Peter Augustini, CERA, personal correspondence, April 23, 2003.11 Energy Information Administration (EIA), Annual Energy Report 2001,
November 2002.
or installed equipment that uses an alternate fuel, reducing gas demand.
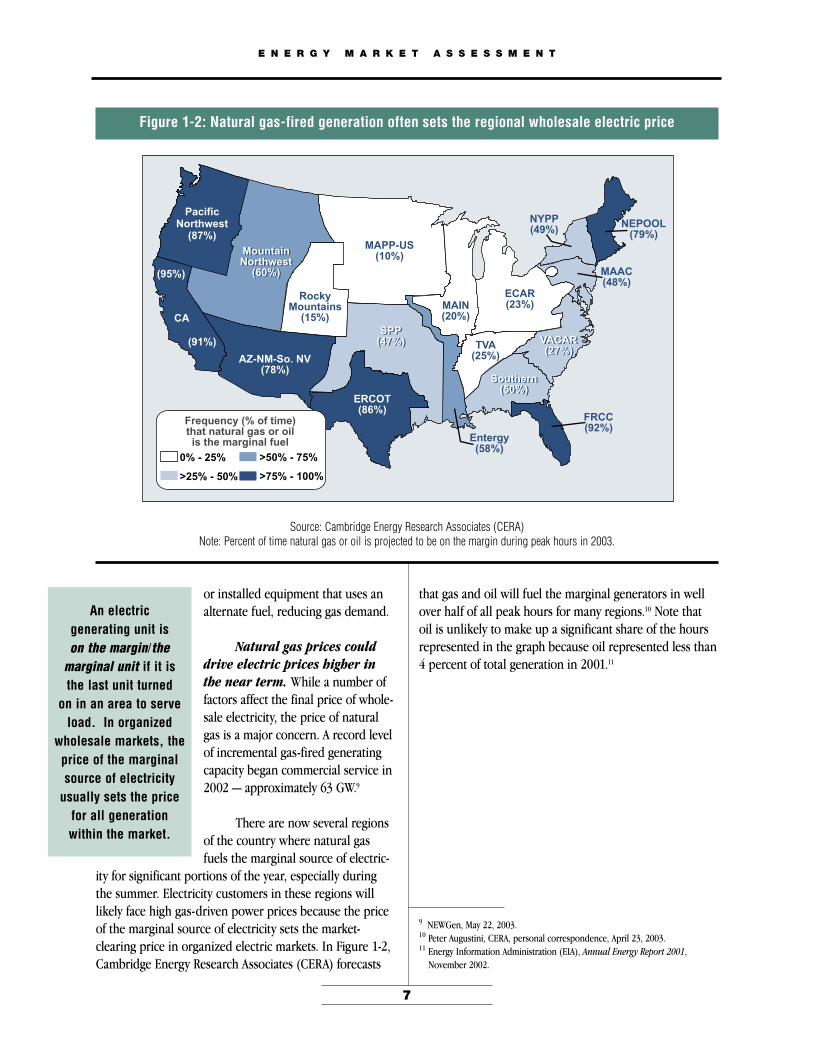
Natural gas prices could drive electric prices higher in the near term. While a number of factors affect the final price of whole-sale electricity, the price of natural gas is a major concern. A record level of incremental gas-fired generating capacity began commercial service in 2002 — approximately 63 GW.9
There are now several regions of the country where natural gas fuels the marginal source of electric-
ity for significant portions of the year, especially during the summer. Electricity customers in these regions will likely face high gas-driven power prices because the price of the marginal source of electricity sets the market-clearing price in organized electric markets. In Figure 1-2, Cambridge Energy Research Associates (CERA) forecasts
that gas and oil will fuel the marginal generators in well over half of all peak hours for many regions.10 Note that oil is unlikely to make up a significant share of the hours represented in the graph because oil represented less than 4 percent of total generation in 2001.11
Figure 1-2: Natural gas-fired generation often sets the regional wholesale electric price
Source: Cambridge Energy Research Associates (CERA)Note: Percent of time natural gas or oil is projected to be on the margin during peak hours in 2003.
PacificNorthwest(87%)
(95%)
CA
(91%)
MountainNorthwest(60%)
VACAR(27%)
Southern(50%)
SPP(47%)
AZ-NM-So. NV(78%)
MountainNorthwest(60%)
RockyMountains(15%)
MAPP-US(10%)
MAIN(20%)
ERCOT(86%)
NYPP(49%) NEPOOL
(79%)
MAAC(48%)
ECAR(23%)
VACAR(27%)TVA
(25%)
Southern(50%)
FRCC(92%)
Entergy(58%)
SPP(47%)
Figure 1-2August 22, 2003
>50% - 75%
>75% - 100%
0% - 25%
>25% - 50%
Frequency (% of time)that natural gas or oilis the marginal fuel

E N E R G Y M A R K E T A S S E S S M E N T
8
E N E R G Y M A R K E T A S S E S S M E N T
9
Figure 1-3 shows that across the country, with one exception, early summer prices were higher than they were last year. Comparing June 2002 to June 2003 using
these points, prices were up from 8 percent at ComEd in the Midwest to 243 percent at Mid-Columbia in the Northwest.
Figure 1-3: Electric prices were higher across the U.S. going into summer 2003 than summer 2002
Source: Megawatt DailyNote: Prices shown are the volume-weighted, day-ahead, peak prices averaged for the month.
For a map of price points, see Appendix E.
Figure 1-308-22-03
NEPOOL/MassHub
NewYork,ZoneG
NewYork,ZoneJ
PJMWest
Entergy
Southern
Florida
Cinergy
ComEd
MAPPNorth
SPP
ERCOT
PaloVerde
Mid-Columbia
NP15
SP15
June 2002
June 2003
$90
$80
$70
$60
$50
$40
$30
$20
$10
$0
Price($/MWh)

E N E R G Y M A R K E T A S S E S S M E N T
8
E N E R G Y M A R K E T A S S E S S M E N T
9
Figure 1-4: Natural gas prices are higher across the U.S. goinginto summer 2003 than summer 2002
Source: Gas DailyNote: Prices shown are volume-weighted, day-ahead, mid-point prices averaged over the month. For a map of price points, see Appendix E.
Figure 1-408-22-03
Tenn.,Zone6
delivered
Transco,Zone6N.Y.
Transco,Zone6
non-N.Y.
HenryHub
Transco,Zone4
Floridacity-gates
ColumbiaGas, App.
Chicagocity-gate
Panhandle, Tx.-Okla.
Northern,demarc.
HoustonShip
Channel
El Paso,SanJuan
Basin
Northwest (Sumas)
PG&Ecity-gate
SoCalGas
$7
$6
$5
$4
$3
$2
$1
$0
Price($/MMBtu)
June 2002
June 2003
Figure 1-4 shows the increases in natural gas prices for the same time period, June 2002 to June 2003, for representative points across the United States. The numbers show that prices are up everywhere and that the increases range from 58 percent at Florida city-gates to 131 percent at Northwest (Sumas).
Changes in natural gas prices can have pronounced effects on electric-ity production costs. The price of natural gas represents the largest component of cost for a gas-fired generator.12 For instance, the price of natural gas accounts for approxi-mately 86 percent of the production cost for a generic 500-MW gas-fired combined-cycle plant with a 7,000 Btu/kWh heat rate operating at a 50 percent load factor.13 Other costs include variable operations and
maintenance (O&M) expenses and transmission charges. Under these assumptions, a 50 percent increase in the cost of natural gas results in a 43 percent increase in the produc-tion cost of power, holding O&M and transmission charges constant.
Not all generators’ produc-tion costs are affected equally by increases in natural gas prices. Some generators have hedged their gas-price risk. Hedging some or all of a
Combined-cycle generators increase the
efficiency of electric generation by capturing and reusing waste heat; the latest units achieve
heat rates near 6,000 Btu/kWh with
more than 50 percent fuel-to-electricity
conversion efficiency.
Hedging is a risk management tool used
to protect the value of an investment or
contractual commitment from the risk of loss due
to price fluctuations.
12 The price of natural gas may include charges for the following: gas commod-ity, all interstate pipeline transportation services and local distribution company services.13 This calculation makes assumptions about O&M and transmission costs. It assumes the average monthly contract index settlement price of natural gas commodity at the Henry Hub for January through June 2003 of $5.88/MMBtu, a transmission charge of $4.11/MWh or (($1.50/kW-month x 500,000 kW) / ((500,000 kW x 730 Hours in a Month x 50% Capacity Factor) / 1000)) and a variable O&M charge of $2.50/MWh.

E N E R G Y M A R K E T A S S E S S M E N T
10
E N E R G Y M A R K E T A S S E S S M E N T
11
Gas on the margin: There are many regions where natural gas is the fuel on the margin for signifi-cant portions of the year. These regions are most at risk for high gas-driven power prices.
Availability of significant dual-fueled generation: Surveys of capacity indicate that existing dual-fueled generating capacity, esti-mated at 135–153 GW21, is located primarily in New England, New York and the Southeast. As discussed
facility’s gas and other fuel needs through long-term contracts or options could play an important role in limiting some generators’ gas costs. In the past, public utility commissions (PUCs) have encouraged local distribu-tion companies (LDCs) to benchmark to spot prices and avoid hedging. When PUCs encourage LDCs to hedge, they may protect customers with prudent hedging program guidelines.
The potential for high gas prices to affect electric prices is not the same across all regions of the United States. Major factors that influence regional vulnerability to high natural gas-driven electric prices are summa-rized in Table 1-1 and discussed below.
Share of regional generation that is gas-fired: A key factor affecting a region’s vulnerability to high electric prices as a result of high gas prices is the region’s dependence on natural gas, especially dependence on natural gas on the margin since marginal generators set the market-clearing price in organized markets. Table 1-1 shows that natural gas fuels a large portion of capacity (greater than 50 percent) in California and a significant (25 percent to 49 percent) portion of generation in New England, New York, the Southeast, South Central and the Southwest.
14 See maps of each region in Appendix A (Regional Assessments).15 POWERdat, July 31, 2003. Qualitative labels are based on percentage of total capacity that uses natural gas as the primary fuel: 1%-24%, small; 25%-49%, sig-nificant; 50%+, large.16 CERA, see Figure 1-2. Qualitative labels are based on percent of time gas or oil is projected to be on the margin in 2003: 1%-39%, no; 40%+, yes.17 Ken Yeasting, CERA, phone conversation, July 23, 2003.18 Derived from natural gas pipeline capacity data base provided by James Tobin, Energy Information Administration, April 2003. Estimates incorporate potential deliverability increases associated with liquefied natural gas (LNG) expansion facilities.19 OMOI analysis.20 OMOI analysis.21 EIA; analysis derived from POWERdat, May 21, 2003.
A dual-fueled (or dual-fired) unit is a generating unit that
can produce electricity using two or more fuels. In some of
these units, only the primary fuel can be
used continuously; the alternate fuel(s) can be used only as a start-up fuel or in emergencies.
Table 1-1: Major factors influencing regional vulnerabilityto high natural gas-driven electric prices in summer 2003
Risk FactorsNew
England14 New York Mid-Atlantic Southeast MidwestSouth
Central
West -- Southwest &
Northwest California
Share of regional generation that is gas-fired15
Significant Significant Small Significant Small Significant Significant in Southwest, small in Northwest
Large
Gas often on the margin?16
Yes Yes Mixed, varies by subregion
Mixed, varies by subregion
No Yes Yes, except in Rocky Mountains
Yes
Availability of sig-nificant dual-fueled generation17
Yes Yes No Yes No No No No
Recent and anticipat-ed increases in pipe-line deliverability18
Yes, Tractebel LNG expansion (280 MMcfd)
No No Yes, FGT (41 MMcfd)
No No No Yes,Kern River (886 MMcfd)
Likelihood of sus-tained, material gas pipeline constraints19
Unlikely Possible Unlikely Possible in Florida, unlikely in rest of Southeast
Unlikely Unlikely Unlikely Unlikely
Availability of hydroelectricity this summer20
n/a — hydro a low percent of generation
n/a — hydro a low percent of generation
n/a — hydro a low percent of generation
n/a — hydro a low percent of generation
n/a — hydro a low percent of generation
n/a — hydro a low percent of generation
Slightly below normal
Slightly below normal
E N E R G Y M A R K E T A S S E S S M E N T
10
E N E R G Y M A R K E T A S S E S S M E N T
11
previously, fuel switching, including fuel switching by industrial facilities, may be limited because of industry shutdowns, environmental regulations and the fact that loads able to switch already have.
Recent and anticipated increases in pipeline deliverability: Incremental gas pipeline capacity can reduce a region’s vulnerability to high gas-driven electric prices by increasing access to alternative gas supplies. Approximately 1.2 Bcfd of new gas pipeline and liquefied natural gas (LNG) deliverability will soon enter service in the United States. Key infrastructure projects beginning service are shown in Table 1-1.
These recent pipeline expansions build upon approxi-mately 10 Bcfd of new interstate natural gas pipeline capacity completed in 2002. 22
Likelihood of sustained gas pipeline constraints: Conversely, constraints at key receipt or delivery points on natural gas pipelines can increase gas prices deliv-ered into a region and potentially lead to increased electric prices. Despite increases in pipeline deliverabil-ity, constraints along segments of key pipelines remain possible. To date, the Florida market has occasionally been affected by pipeline constraints on Florida Gas Transmission’s (FGT’s) summer-peaking system.
However, FGT’s system reportedly has adequate deliverability to meet firm shipper deliveries due to its continuing expansion efforts and enhanced flexibility stemming from downstream receipt point access on the Gulfstream Natural
Gas System,23 which came on line in summer 2002. High natural gas load on the Transcontinental Gas Pipe Line Corp. system is unlikely to compromise the reliability of transportation into New York City in the near term due to the availability of market area storage.24 However, pipeline constraints could arise due to coincidental hot weather, storage injections and fuel use limitations.
Near term availability of electricity from hydro sources: A region’s vulnerability to high gas-driven electric prices is affected by the availability of electric-ity produced using other sources. The Northwest continues to have slightly below-normal levels of water in its hydroelectric network.25 Imports by California from the Pacific Northwest are likely to be 85 percent
of normal,26 but the shortfall in California will be supplemented by hydroelectricity produced from healthy in-state hydro conditions. The Southwest, though less depen-dent on hydroelectric generation than the rest of the West (about 15 percent of total regional capacity),27 continues to experience drought conditions, and generation from the Colorado River and its tributaries will be below normal so more natural gas will be needed to meet its energy supply needs.
High natural gas prices and competition for gas to fuel generation influence storage injec-tion plans and leave storage levels low entering the 2003-04 heating season. Storage stocks ended the 2002-2003 winter heating season well below the five-year average of 1,187 Bcf, 54 percent below the year-ago level and at the lowest aggregate inven-tory level in March recorded by EIA in nine years. The producing and eastern consuming region stocks were at record lows. Storage levels in the West are not as low as elsewhere. As shown in Figure 1-5, national storage levels at the begin-ning of the injection season in April continued at historical lows, but in May, June and early July, storage holders made repeated, substantial injections into storage.
To reach the industry’s 2,700-3,000 Bcf “comfort level” for the end of the injection season on October 31, storage must refill at an accelerated rate. This “comfort level” is necessary to ensure that gas supply in the United
Firm transportation or deliveries are
guaranteed not to be interrupted.
Winter heating season refers to the November
1 through March 31 period, during which most natural gas use
for space heating takes place.
Injection season refers to the April 1 through
October 31 period, during which gas is injected into natural
gas storage reservoirs in preparation for
withdrawal and use during the winter heating season.
22 Derived from natural gas pipeline capacity database provided by James Tobin, EIA, April 2003. Estimates incorporate potential deliverability increases associ-ated with expanded LNG facilities.23 Personal communication with FGT market and system planning personnel, May 30, 2003. 24 Transcontinental Gas Pipe Line Corp., “Daily Operational Information,” elec-tronic bulletin board, June-July 2003.25 National Oceanic and Atmospheric Administration (NOAA), National Weather Service, Northwest River Forecast Center (NWRFC), http://www.nwrfc.noaa.gov/.26 Office of Energy Projects analysis.27 Office of Energy Projects analysis.

E N E R G Y M A R K E T A S S E S S M E N T
12
E N E R G Y M A R K E T A S S E S S M E N T
13
States can meet demand even if extreme weather or physical operations problems occur. As of July 4, in order to reach 3,000 Bcf by October 31, injections need to be 2.2 Bcfd more than average, or roughly 20 percent of daily demand during the remainder of the injection season.28 LDCs control almost three-fourths of storage capacity in the United States.29 FERC has alerted public utility commissions (PUCs) to the gas storage challenge and the PUCs will likely encourage LDCs to purchase gas and fill storage, even though prices are high, because LDCs have an obligation to serve their customers whose health and safety are at stake. The remaining one-fourth to one-third of storage is of most concern.
Refilling low storage volumes while still meeting electric generation fueling needs will be more difficult than in the past. The distressed condition of the merchant energy sector likely will affect total working gas in storage as energy companies reduce positions in the gas market, reduce market-ing and trading activities and reduce the number of assets and physical supply necessary to support such operations.30
Figure 1-508-22-03
3,500
3,000
2,500
2,000
1,500
1,000
500
0
Volume(Bcf)
Jan Feb Mar AprApr May Jun Jul Aug Sep Oct Nov Dec
5-year range
2001–2002
2002-2003
2003-2004
U.S. Total
Figure 1-5: National natural gas storage level
Source: EIA, “Historical Weekly Storage Estimates Database,”Weekly Natural Gas Storage Report; data through the week ending July 11, 2003.
28 Numbers for gas demand are taken from EIA’s Natural Gas Monthly and consist of gas demand for July, August, September and October for the most recent year available, 2002.29 American Gas Association, “The Evolution of Underground Natural Gas Storage: Changes in Utilization Patterns,” August 2000, saying LDCs have “owner-ship or contractual rights to about 73% of the total storage capacity.”30 For example, in its press release titled “El Paso Reports First Quarter 2003 Results,” dated May 13, 2003, El Paso reported “a substantial reduction in the size of the transportation and storage portfolios and their related hedges.” El Paso also reported that its “storage portfolio was reduced by 56 percent, from 125 Bcf to 55 Bcf.” El Paso’s reductions were due primarily to its business dif-ficulties and exit from active trading.
Actions
Industry Actions
While there is little that can be done in the short term, the North American gas and power industries are attempting to counter the upward shift in natural gas prices and its resulting effects on power markets in the long term.

E N E R G Y M A R K E T A S S E S S M E N T
12
E N E R G Y M A R K E T A S S E S S M E N T
13
The displacement of inefficient gas-fired genera-tion with new, efficient gas turbines allows effi-cient dispatch that uses less natural gas to produce the same amount of electricity.
The number of rigs drilling for natural gas in the United States has increased, as discussed previ-ously, showing that supply is responding effectively to price signals.
The natural gas industry has sought congressio-nal approval to give drillers access to lands cur-rently blocked from development, such as certain lands in the Rocky Mountains, Alaska, offshore California, Florida and the Carolinas, and has taken advantage of royalty relief in areas of the U.S. Gulf of Mexico.
Commission Actions
The Commission has helped gas and power markets add necessary infrastructure and address issues that directly or indirectly affect the gas and power customers.
Expedited Pipeline Certificates: On average, pipe-line certificates are now processed in about 200 days at the Commission, compared to an average turn-around time of almost 300 days 10 years ago. The Commission has authorized almost 16 Bcfd of new pipeline capacity since January 2001. More than 50 percent of these additions are expected to serve new power plants, with the greatest growth in that sector in the Southeast and West.
Further Certificate Streamlining Initiative: FERC’s National Environmental Policy Act Pre-Filing Process is designed to identify issues and engage stakeholders early in the certificate process and encourage problem solving by FERC staff, other agencies and landowners. The objective is to reduce total certificate processing time. The initia-tive has already produced expedited results for several large pipeline projects.
FERC is expediting certificates for new Rocky Mountain region pipeline capacity and monitoring price effects of capacity changes. FERC staff have participated and will continue to participate in
Wyoming Pipeline Authority proceedings regard-ing pipeline takeaway capacity. In addition, FERC is paying special attention to market developments in the Rockies to assure that market forces can act, unimpeded by inappropriate factors.
Monitoring and Enforcement of Markets: FERC staff continues to monitor natural gas and electric market activity to oversee the marketplace and identify in real time any developments that could harm customers or the market itself. Short- and long-term market developments are analyzed to determine whether they require Commission action. In April and June 2003, FERC staff held conferences to encourage measures to improve gas price reporting and index calculations, which were adopted in the Commission’s policy statement.31
Revised LNG Terminal Policy: As part of FERC’s order preliminarily approving construction of the proposed Hackberry LNG terminal, the Commission announced that LNG facilities would not be classified as open-access facilities. Instead, these facilities are treated as natural gas production facilities, allowing them to charge market-based rates for terminal services. This will not affect markets in the short term, but FERC anticipates that this new policy will stimulate development of new LNG terminals by streamlin-ing the development cycle and reducing potential regulatory risks. LNG has grown in importance not only as a source of additional gas supply for North America, but also due to the use of LNG facilities as a strategic resource to increase efficiency of the pipeline grid. FERC also approved the expansion of CMS Trunkline LNG Co.’s terminal.
The Commission has been addressing issues regarding Order No. 637, which dealt with pipe-line segmentation, standards and issues relating to capacity release. These decisions are increasing the efficiency of the existing assets in the pipe-line system.
31 FERC, Docket No. PL03-3-000, July 25, 2003.

E N E R G Y M A R K E T A S S E S S M E N T
14 15
E N E R G Y M A R K E T A S S E S S M E N T

E N E R G Y M A R K E T A S S E S S M E N T
14 15
E N E R G Y M A R K E T A S S E S S M E N T
A lack of demand respon-siveness in electricity markets costs customers in times of peak demand.
When prices for electricity rise, few customers see this change in time to respond and, thus, do not have the opportunity to reduce their electricity use. During periods of transmission constraints or high demand, these prices can rise substantially. Rather than reducing supply
to those customers who would prefer to reduce consumption instead of paying high prices, market operators must generate or buy sufficient electricity to meet total price-insensitive demand, raising costs for all customers. In addition, lack of demand respon-siveness increases the ability of suppliers to exert market power and raise prices for all customers.
Absent demand responsiveness, electricity markets face higher prices during periods of high demand and
congestion. Though small reductions in demand during these times could lower electric prices significantly, this option is lacking across most of the country. Customers need access to meaningful and accurate price information that reveals the value of electricity given the time and place
of use. With this tool allowing customers to change their electricity usage in response to price, demand response could have a significant effect on electricity price levels, price volatility, system reliability and supplier market power. This is a more efficient means of meeting peak demand than purchasing electricity at peak prices.1 In the short run, the only likely meaningful effect on high and volatile electricity prices and supplier market power will result from policy leader exhortations for conservation, load shifting and other actions as a part of good energy citizenship.2
This chapter examines this challenge, discusses how the industry is attempting to address it and presents the Commission’s actions to address the challenge.
The SituationElectricity prices are volatile. For example, in PJM,
prices ranged from $0/MWh to $802/MWh in 2000.3 A primary reason for the volatility is that demand varies by season, day of the week and hour. For example, in 2002 in New York City and Long Island, demand ranged from 5,400 MW at 3 a.m. to 7,400 MW at 4 p.m. on a fall Sunday, and on a summer weekday in 2002, the area’s demand
Challenge 2
LACK OF DEMAND RESPONSIVENESS IN ELECTRICITY MARKETS
Market power can include, but is not
limited to, the ability of a firm to raise its price or withhold its
output with the effect of raising market prices
above competitive levels for a sustained
period of time.
Volatility is a measurement of the price fluctuation of a commodity that takes place over a certain
period of time.
1 Severin Borenstein, “Time-Varying Retail Electricity Prices: Theory and Practice,” University of California Energy Institute, undated.2 Department of Energy, “Abraham Unveils Smart Energy Use Education Campaign,” press release, July 9, 2003.3 PJM systemwide real-time hourly prices retrieved from www.pjm.com/markets/jsp/lmpmonthly.jsp on June 23, 2003.

E N E R G Y M A R K E T A S S E S S M E N T
16
E N E R G Y M A R K E T A S S E S S M E N T
17
ranged from 8,500 MW to 15,000 MW between the same hours.4 Figure 2-1, which shows peak hourly demand in PJM, highlights the seasonality of demand — peak demand in the summer is more than twice as high as in early spring — but also shows that demand changes unpredictably, such as during the sharp peak in April due to unseasonably warm weather.
In periods of higher demand, electricity is generally provided with higher-cost generation, and at peak levels of demand, generation costs escalate substantially.
Though prices rise in large part due to higher demand, they may also rise due to transmission congestion, which can constrain delivery of electricity across transmis-sion lines. This can occur when generation located outside an area is less expensive than generation within the area, but cannot reach load because of limited transmission capacity.
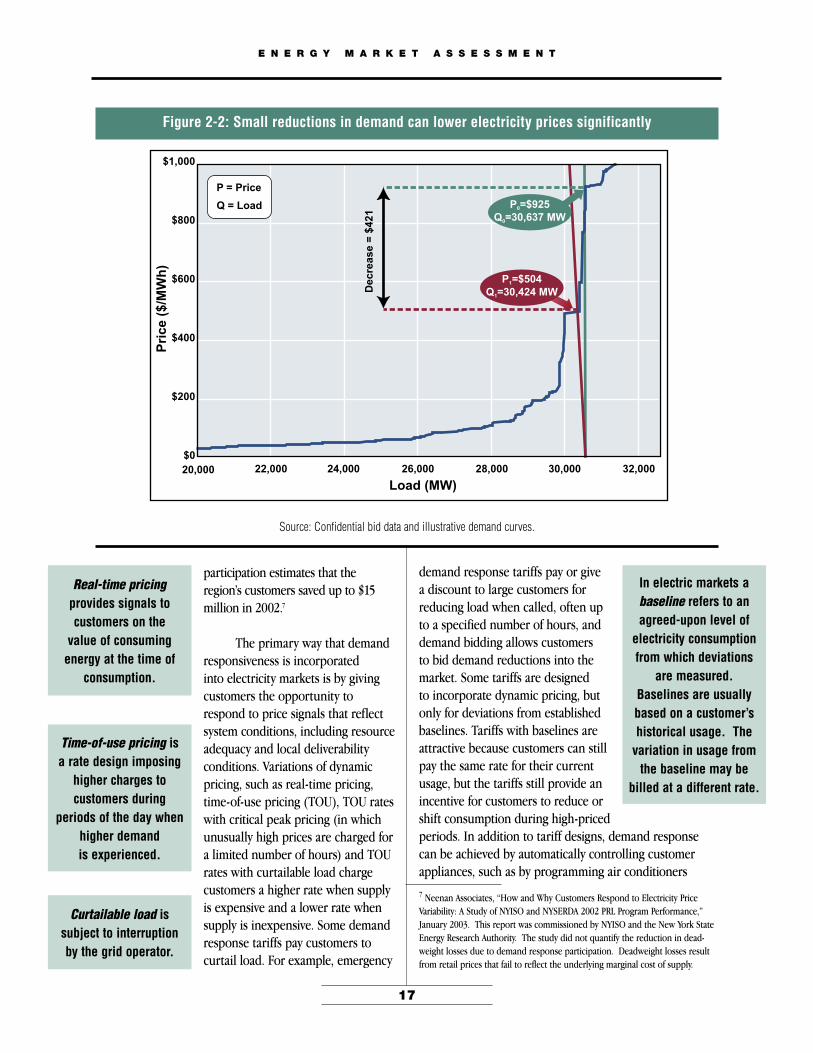
Demand responsiveness can reduce the high cost of electricity during periods of high demand or congestion, since relatively small changes in demand can have large effects on price. For instance, in the illustrative schematic shown in Figure 2-2, a 1 percent reduction in demand lowers
Figure 2-1: Electricity demand varies with the season, but can also vary unpredictably
Source: PJM systemwide peak hour load retrieved from www.pjm.com/pub/account/loadhryr/2002.txt on July 3, 2003.
Jan‘02
Feb‘02
Mar‘02
Apr‘02
May‘02
Jun‘02
Jul ‘02
Aug‘02
Sep‘02
Oct‘02
Nov‘02
Dec‘02
Figure 2-108-22-03
DailypeakloadinPJM–East(MW)
60,000
50,000
40,000
30,000
20,000
10,000
0
the price by nearly 50 percent, saving all customers, not just those who reduced demand, more than $400/MWh.
Because most customers are not aware of dramatic price changes when they occur, but see only a long-term average price, they cannot respond by reducing or shifting consumption. Incorporating demand responsiveness into electricity markets would lower demand at times of high prices, thus lowering electric prices and financially benefit-ing customers. It has been estimated that incorporation of demand response into wholesale electric markets would save customers $70 million in 2004, growing to $3 billion in 2020.5 Looking back at summer 2000, the Electric Power Research Institute estimated that California customers could have saved $700 million if peak demand had been 2.5 percent lower.6 A study of New York’s demand response
4 New York Independent System Operator, “Integrated Real Time Actual Load.” Data for Oct. 13, 2002, and July 29, 2002, retrieved from mis.nyiso.com/public/P-58Clist.htm on June 22, 2003. 5 FERC, “Economic Assessment of RTO Policy,” prepared by ICF, Feb. 26, 2002, Table ES-1, p. vi. 6 Steven Braithwait and Ahmad Faruqui, “The Choice Not to Buy: Energy Savings and Policy Alternatives for Demand Response,” Public Utilities Fortnightly, vol. 139, no. 6, March 15, 2001, pp. 48-60, see especially table 2.
E N E R G Y M A R K E T A S S E S S M E N T
16
E N E R G Y M A R K E T A S S E S S M E N T
17
Curtailable load is subject to interruption by the grid operator.
In electric markets a baseline refers to an agreed-upon level of
electricity consumption from which deviations
are measured. Baselines are usually based on a customer’s historical usage. The
variation in usage from the baseline may be
billed at a different rate.
Real-time pricing provides signals to customers on the
value of consuming energy at the time of
consumption.
Time-of-use pricing is a rate design imposing
higher charges to customers during
periods of the day when higher demand is experienced.
Figure 2-2: Small reductions in demand can lower electricity prices significantly
Source: Confidential bid data and illustrative demand curves.
participation estimates that the region’s customers saved up to $15 million in 2002.7
The primary way that demand responsiveness is incorporated into electricity markets is by giving customers the opportunity to respond to price signals that reflect system conditions, including resource adequacy and local deliverability conditions. Variations of dynamic pricing, such as real-time pricing, time-of-use pricing (TOU), TOU rates with critical peak pricing (in which unusually high prices are charged for a limited number of hours) and TOU rates with curtailable load charge customers a higher rate when supply is expensive and a lower rate when supply is inexpensive. Some demand response tariffs pay customers to curtail load. For example, emergency
demand response tariffs pay or give a discount to large customers for reducing load when called, often up to a specified number of hours, and demand bidding allows customers to bid demand reductions into the market. Some tariffs are designed to incorporate dynamic pricing, but only for deviations from established baselines. Tariffs with baselines are attractive because customers can still pay the same rate for their current usage, but the tariffs still provide an incentive for customers to reduce or shift consumption during high-priced periods. In addition to tariff designs, demand response can be achieved by automatically controlling customer appliances, such as by programming air conditioners
Load (MW)20,000 22,000 24,000 26,000 28,000 30,000 32,000
$1,000
$800
$600
$400
$200
$0
Price
($/MWh)
P = Price
Q = Load
P =$504Q =30,424 MW
1
1
P =$925Q =30,637 MW
0
0
Figure 2-208-22-03
Decrease=$421
7 Neenan Associates, “How and Why Customers Respond to Electricity Price Variability: A Study of NYISO and NYSERDA 2002 PRL Program Performance,” January 2003. This report was commissioned by NYISO and the New York State Energy Research Authority. The study did not quantify the reduction in dead-weight losses due to demand response participation. Deadweight losses result from retail prices that fail to reflect the underlying marginal cost of supply.
E N E R G Y M A R K E T A S S E S S M E N T
18
E N E R G Y M A R K E T A S S E S S M E N T
19
to change temperatures at predetermined times or to respond to external electronic signals.
In some cases, demand reductions have been achieved without direct price signals but by exhorting customers to behave differently. During the energy crisis in California, for example, customers reduced peak June 2001 consumption by 14 percent, due in part to advertis-ing by the state that urged Californians to reduce or shift consumption to help the state manage through the energy crisis.8 Because most markets lack real-time price signals that reach the end-use customer, only advertising
calling for “good energy citizenship” will be a driver of demand reduc-tions this summer. The Department of Energy, for example, has urged energy conservation this summer to help reduce demand for natural gas, which is currently in tight supply.9
Demand response reduces the potential for genera-tors to exert market power in times of scarcity, further
Demand is inelastic if customers do not
change their demand in response to a change
in price.
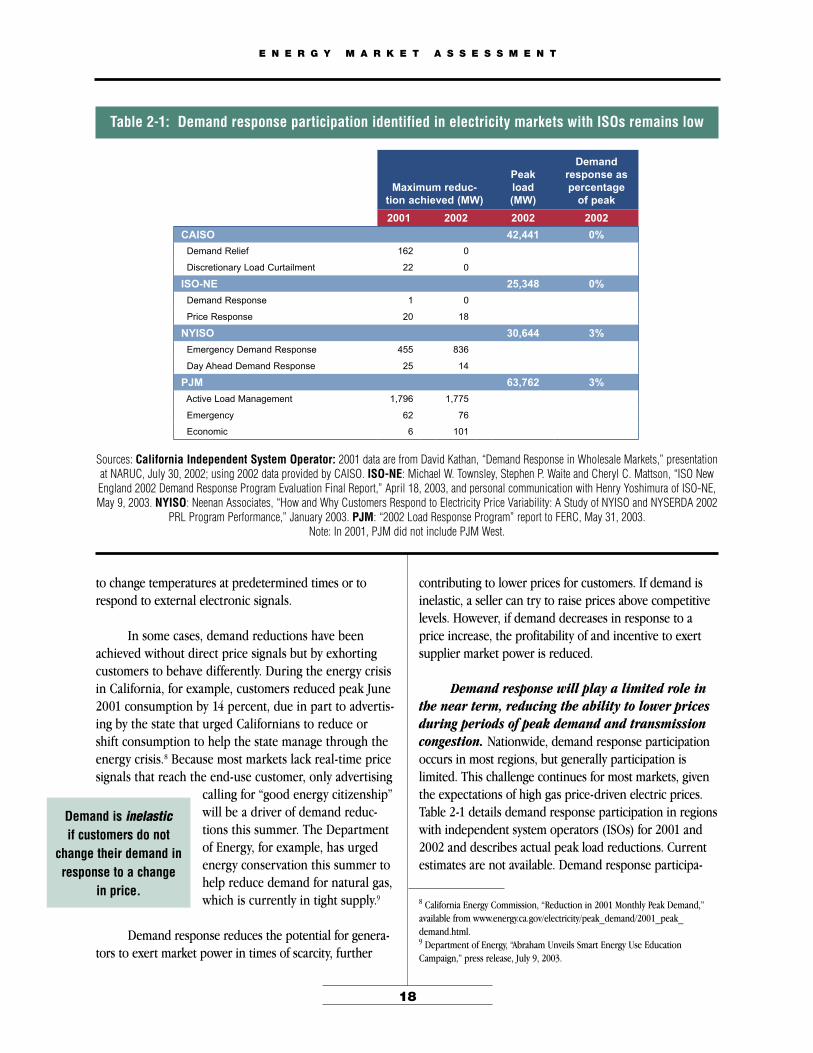
Table 2-1: Demand response participation identified in electricity markets with ISOs remains low
Maximum reduc-tion achieved (MW)
Peak load (MW)
Demand response as percentage
of peak
2001 2002 2002 2002
CAISO 42,441 0%
Demand Relief 162 0
Discretionary Load Curtailment 22 0
ISO-NE 25,348 0%
Demand Response 1 0
Price Response 20 18
NYISO 30,644 3%
Emergency Demand Response 455 836
Day Ahead Demand Response 25 14
PJM 63,762 3%
Active Load Management 1,796 1,775
Emergency 62 76
Economic 6 101
Sources: California Independent System Operator: 2001 data are from David Kathan, “Demand Response in Wholesale Markets,” presentation at NARUC, July 30, 2002; using 2002 data provided by CAISO. ISO-NE: Michael W. Townsley, Stephen P. Waite and Cheryl C. Mattson, “ISO New England 2002 Demand Response Program Evaluation Final Report,” April 18, 2003, and personal communication with Henry Yoshimura of ISO-NE, May 9, 2003. NYISO: Neenan Associates, “How and Why Customers Respond to Electricity Price Variability: A Study of NYISO and NYSERDA 2002
PRL Program Performance,” January 2003. PJM: “2002 Load Response Program” report to FERC, May 31, 2003.Note: In 2001, PJM did not include PJM West.
contributing to lower prices for customers. If demand is inelastic, a seller can try to raise prices above competitive levels. However, if demand decreases in response to a price increase, the profitability of and incentive to exert supplier market power is reduced.
Demand response will play a limited role in the near term, reducing the ability to lower prices during periods of peak demand and transmission congestion. Nationwide, demand response participation occurs in most regions, but generally participation is limited. This challenge continues for most markets, given the expectations of high gas price-driven electric prices. Table 2-1 details demand response participation in regions with independent system operators (ISOs) for 2001 and 2002 and describes actual peak load reductions. Current estimates are not available. Demand response participa-
8 California Energy Commission, “Reduction in 2001 Monthly Peak Demand,” available from www.energy.ca.gov/electricity/peak_demand/2001_peak_demand.html.9 Department of Energy, “Abraham Unveils Smart Energy Use Education Campaign,” press release, July 9, 2003.

E N E R G Y M A R K E T A S S E S S M E N T
18
E N E R G Y M A R K E T A S S E S S M E N T
19
tion, as reported in Table 2-1, did not exceed 4 percent of peak demand in any market.
Table 2-2 estimates demand-response potentials as a percentage of total demand in the North American Electric Reliability Council (NERC) regions for 2002 and 2003, which are based on best estimates for both years, not observed and reported reductions, and reveals that little identified demand response exists in each region. As seen by comparing Table 2-2 (above) with Table 2-1, although some NERC regions show higher levels of demand response than ISO markets, the systemwide average estimate of the amount of load available to respond to high prices is less than 4 percent of peak demand.
Lack of demand-responsive participation can be attributed to a variety of factors, including the following.
End-use customers have to modify their electricity usage for demand response to occur. This requires retail rate structures and policies that encourage clearer pricing and information options for key cus-tomer groups.
Real-time pricing can expose the geographic and temporal variations of prices, exposing some custom-ers to higher prices than they had been paying. For example, during market redesign proceedings, some localities expressed concern that such real-time pric-ing could raise their prices because they are located in the San Francisco Bay Area, a constrained area in California. This may be true, but in the long-run
Table 2-2: Estimates of total demand response are low in NERC regions in 2002 and 2003
2002 2003
Estimated peak demand
response (MW)
Actual peak regional demand
(MW)
Estimated demand response as share
of peak demand
Estimated peak demand
response (MW)Projected peak demand (MW)
Estimated demand response as share
of peak demand
ECAR 3,000 101,150 3% 3,000 97,800 3%
ERCOT 160 56,233 0% 720 56,900 1%
FRCC 2,700 40,260 7% 2,800 38,800 7%
MAAC 1,600 55,569 3% 1,300 55,000 2%
MAIN 3,300 55,300 6% 3,200 54,100 6%
MAPP 1,600 33,830 5% 1,600 33,600 5%
NPCC 1,000 105,166 1% 0 104,000 0%
SERC 6,100 157,333 4% 1,600 152,000 1%
SPP 1,500 39,571 4% 1,400 38,700 4%
WECC 1,700 136,108 1% 1,800 135,000 1%
Source: NERC, summer assessments for 2001, 2002 and 2003. ”Estimated peak demand response” is expected interruptible demand and direct-control demand-side management. “Projected peak demand” is projected net internal demand.
these tariffs lower costs to all customers by reduc-ing consumption of expensive electricity in areas to which it is hard to deliver, lowering prices for high cost power as well as the potential for the exercise of market power.10
Emergency curtailment and demand bidding, as well as some dynamic pricing tariffs, require that customer baselines be set. These baselines are problematic because groups of customers will lobby for baselines that benefit their usage and they encourage custom-ers to use electricity in ways that benefit their base-lines.11 Furthermore, baselines may confer a right to electricity consumption that other stakeholders may oppose, and this opposition can stall development of demand-response tariffs.
Market participants often lack adequate awareness of demand-response opportunities or do not fully understand how demand-response tariffs work and can be financially beneficial. Retail and wholesale energy providers must do more to promote demand-response participation and educate end-users.
Many demand-response options, as currently designed, are complex and costly for customers to implement. Despite more than a decade of research,
10 Severin Borenstein, Michael Jaske and Arthur Rosenfeld, “Dynamic Pricing, Advanced Metering and Demand Response in Electricity Markets,” Center for the Study of Energy Markets (CSEM) Working Paper 105, October 2002. 11 Severin Borenstein, “Time-Varying Retail Electricity Prices: Theory and Practice,” University of California Energy Institute, undated.

E N E R G Y M A R K E T A S S E S S M E N T
20
E N E R G Y M A R K E T A S S E S S M E N T
21
some believe that more research is needed to deter-mine how to make meaningful demand response or demand-response proxies available and easy for a broader range of customers.
ActionsIndustry Actions
Some regions are relying on demand-response partici-pation to serve load reliably. For example, with regula-
tory leadership from the New York Public Service Commission, NYISO has increased demand-response participa-tion in New York City and Long Island, both areas with continued reliability concerns. In 2002, these localities accounted for nearly 20 percent of the statewide load curtailment, compared to 12 percent in 2001. ISO-NE expects that aggressively promoted demand-response participation will result in 20–50 MW of reductions during peak hours in the southwest Connecticut
load pocket, reductions needed to help maintain reli-ability in the area.12 (For comparison, the region has invested in emergency transmission and generation that is expected to provide an additional 170 MW.13)
ISO-NE received approval from FERC to increase minimum payments to customers who are called on to curtail load.14 The increase provides a higher level of price certainty to customers, improving the attractive-ness of participating. However, though the real-time price is typically higher than the minimum guaranteed payments, the increase could result in subsidization of demand response if the minimum payment is higher than the market price.
To integrate the role of demand response into its mar-ket, NYISO has tied the activation of demand response to prices in the spot markets.15 When demand response resources are activated, NYISO will set the market-clear-ing price for energy based on the payments provided to the activated demand response resources and all resources, including supply, will receive the same price. In addition to improving the economic efficiency of the tariff, this modification helps secure ongoing support
Load pockets are areas isolated by the limits of the transmission
network to get power to them; demand within
the load pocket exceeds internal generation, so imports are needed or
reliability will fail.
Locational marginal price is the market-
clearing price for electricity at the
location the energy is delivered or received.
for the tariff from all market participants. PJM has expanded its demand response tariff to
allow customers on real-time locational marginal pricing to also participate in economic demand response, which allows customers to reduce load and be compensated at the current locational marginal price. In addition, PJM expanded its pilot program that allows custom-ers without advanced meters capable of recording real-time electricity use to elect time-varying pricing. It has expanded from customers with loads up to 25 MW to customers with loads of up to 100 MW.16
Many regions are working to implement new demand response programs or improve existing ones.
California is currently working to implement two variations of demand response: real-time metering for industrial customers and a pilot time-of-use tariff for residential and small retail customers. Although California spent $35 million on 20,000 real-time meters in 2000 and 2001, the meters have not been used with real-time pricing because the California Public Utilities Commission has not adopted electricity rates that leverage the full capability of these meters.
The California Power Authority announced the availability of $30 million in tax-exempt indus-trial development bonds that can be used to finance new load management equipment by manufacturers.
Gulf Power in Florida, which has a retail tariff that combines time-of-use with critical peak pric-ing, is implementing improvements. The com-pany is installing more advanced equipment that is easier to use, provides more information on prices and total consumption and provides more control of current consumption.
12 Personal communication with Shiv Mani, ISO New England, June 19, 2003.13 Stacy Wong, “Connecticut Utility Taking Steps to Avoid Blackouts, Brownouts This Summer,” Hartford Courant, June 10, 2003. Also, personal communica-tion with Peter Brandien, Connecticut Light & Power, June 19, 2003.14 FERC Docket No. ER02-2330, June 6, 2003.15 FERC Docket No. ER03-766, June 20, 2003.16 Susan Covino, PJM, personal communication, July 11, 2003.

E N E R G Y M A R K E T A S S E S S M E N T
20
E N E R G Y M A R K E T A S S E S S M E N T
21
Commission Actions
The ability to incorporate demand responsiveness into electricity markets is often found at the retail level. Nonetheless, FERC is working to better incorporate demand response into wholesale electricity markets.
FERC is committed to market-design rules that allow demand resources to participate on equal footing with supply resources in day-ahead, real-time and capacity markets.17
The Commission monitors electric markets to ensure that demand response is properly and fairly administered, and requires that market monitors report on demand-response participation in their annual reports.
To encourage the development of demand response, in 2003 the Commission approved changes to the rates of ISO-NE, NYISO and PJM. These changes should increase customer partici-pation in demand response, allocate costs more equitably and allow easier access to markets for aggregators of demand response.18
FERC has proposed standard interconnection rules for small generation. The intention is to make it less difficult for distributed generation to partici-pate in the market.19
The Commission is working with the U.S. Department of Energy on analysis of distributed generation resources and their effect on electricity markets, including costs, price and reliability.
As a participant in the New England Demand Response Initiative, FERC is working to develop better market rules and demand response for ISO-NE.
Day-ahead markets are forward markets for electricity to be
supplied the following day. This market
closes with acceptance by the independent
system operator, power exchange or scheduling coordinator of the final day-ahead schedule.
Real-time markets are electric markets
that settle — or, determine the price
— for one-hour periods or less during the day
of delivery.
Capacity markets exist to ensure that power is available when it
is needed; a capacity market requires
companies with an obligation to deliver
electricity to customers to pay power plant
owners for having their units up and running and able to produce additional energy.
17 FERC White Paper, “Wholesale Power Market Platform,” April 28, 2003.18 FERC Docket No. ER03-303, March 21, 2003, and Docket No. ER03-810, June 25, 2003.19 FERC Dockets No. RM02-1-000 and RM02-12-000, July 24, 2003.

E N E R G Y M A R K E T A S S E S S M E N T
22 23
E N E R G Y M A R K E T A S S E S S M E N T

E N E R G Y M A R K E T A S S E S S M E N T
22 23
E N E R G Y M A R K E T A S S E S S M E N T
Challenge 3
FINANCIAL STRESS OF SOME NATURAL GAS AND ELECTRIC MARKET SECTORS
Since 2001, large sectors of natural gas and electric markets have experienced a financial
crisis accompanied by a loss of investor confidence, a dramatic decline in financial liquidity and project delays and cancel-lations. These problems have adversely affected customers by reducing the number of compa-nies active in energy markets, consequently limiting market liquidity and effectiveness.
In the first half of 2003, while a few companies filed for bankruptcy, many companies in the beginning of the year negotiated debt-refinancing deals
that allowed them additional time to implement revised business strategies and await improving market conditions. If financial conditions continue to improve, the industry can move into a new phase characterized by streamlined costs, a refocus on core business lines, continued improvements to balance sheets and, in some cases, a change in ownership, management and business strategies. The results should improve market liquidity over the longer term, making markets more efficient and giving customers choices.
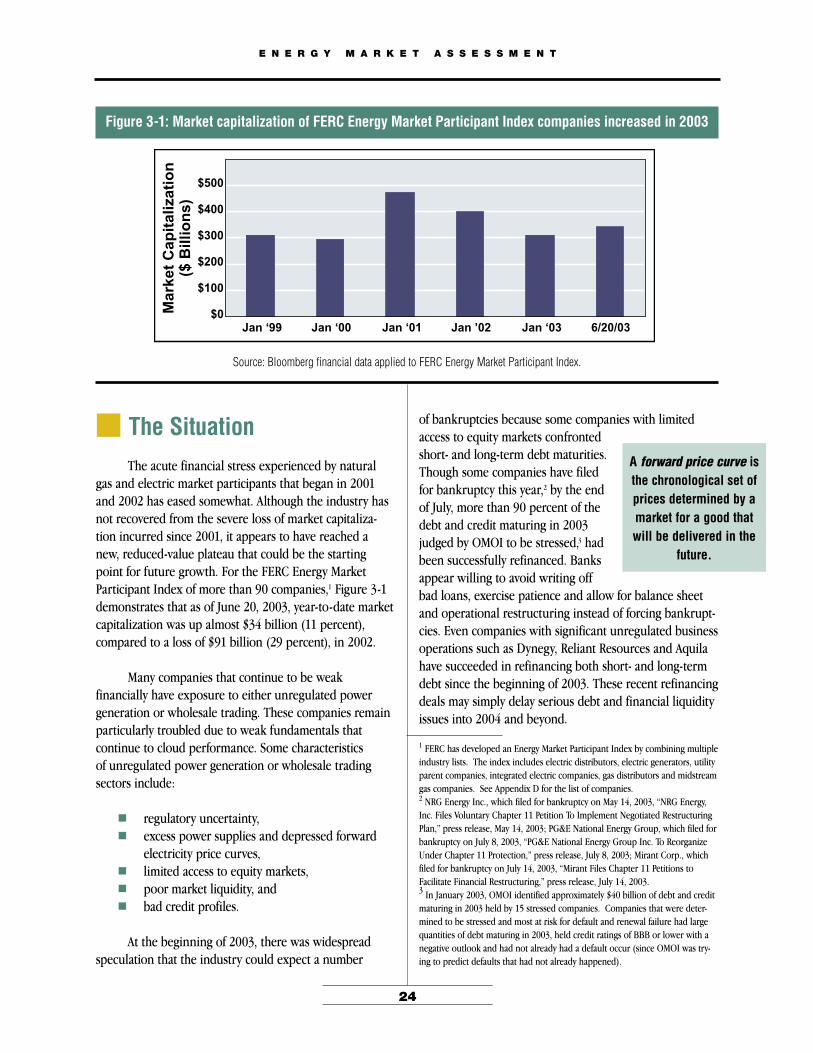
Although the industry is still recovering from the loss of market capitalization incurred since 2001, it appears to have reached a new, reduced-value plateau that could be the starting point for future growth. For the FERC Energy Market Participant Index of more than 90 companies (see Appendix D) as of June 20, year-to-date market capitalization was up almost $34 billion, or 11 percent, compared to a loss of $91 billion, or 29 percent, in 2002.
Because financial uncer-tainty continues, however, the industry and its customers must contend with shrinking physical and financial energy markets due to participants that have exited or scaled back trading. This contrac-tion gives customers fewer choices and reduces market efficiency. Financial troubles can be accompanied by reduced capital expenditures and consequent operational difficulties. Finally, financial stress creates the incen-tive for potentially inappropriate interaffiliate cash management practices because the costs could be inappropriately borne by customers of regulated affili-ates.
This chapter examines these issues, discusses how the industry continues to evolve in response to them and presents the Commission’s actions to address the issues.
Financial liquidity generally describes an entity’s ability to obtain funds to meet its cash flow obligations, with consideration for the
speed with which such funds can be obtained.
Market liquidity describes the ease with which a buyer can buy or a seller can sell at a prevailing price in a
marketplace.
Market capitalization measures company market value and is computed as stock
market price per share of stock times the
total number of shares outstanding.
E N E R G Y M A R K E T A S S E S S M E N T
24
E N E R G Y M A R K E T A S S E S S M E N T
25
The SituationThe acute financial stress experienced by natural
gas and electric market participants that began in 2001 and 2002 has eased somewhat. Although the industry has not recovered from the severe loss of market capitaliza-tion incurred since 2001, it appears to have reached a new, reduced-value plateau that could be the starting point for future growth. For the FERC Energy Market Participant Index of more than 90 companies,1 Figure 3-1 demonstrates that as of June 20, 2003, year-to-date market capitalization was up almost $34 billion (11 percent), compared to a loss of $91 billion (29 percent), in 2002.
Many companies that continue to be weak financially have exposure to either unregulated power generation or wholesale trading. These companies remain particularly troubled due to weak fundamentals that continue to cloud performance. Some characteristics of unregulated power generation or wholesale trading sectors include:
regulatory uncertainty, excess power supplies and depressed forward
electricity price curves, limited access to equity markets, poor market liquidity, and bad credit profiles.
At the beginning of 2003, there was widespread speculation that the industry could expect a number
Figure 3-1: Market capitalization of FERC Energy Market Participant Index companies increased in 2003
$0
$100
$200
$300
$400
$500
Jan ‘99 Jan ‘00 Jan ‘01 Jan ’02 Jan ‘03 6/20/03
Ma
rke
t C
ap
ita
liza
tio
n($
Bil
lio
ns
)
Figure 3-108-22-03
Source: Bloomberg financial data applied to FERC Energy Market Participant Index.
A forward price curve is the chronological set of prices determined by a market for a good that will be delivered in the
future.
of bankruptcies because some companies with limited access to equity markets confronted short- and long-term debt maturities. Though some companies have filed for bankruptcy this year,2 by the end of July, more than 90 percent of the debt and credit maturing in 2003 judged by OMOI to be stressed,3 had been successfully refinanced. Banks appear willing to avoid writing off bad loans, exercise patience and allow for balance sheet and operational restructuring instead of forcing bankrupt-cies. Even companies with significant unregulated business operations such as Dynegy, Reliant Resources and Aquila have succeeded in refinancing both short- and long-term debt since the beginning of 2003. These recent refinancing deals may simply delay serious debt and financial liquidity issues into 2004 and beyond.
1 FERC has developed an Energy Market Participant Index by combining multiple industry lists. The index includes electric distributors, electric generators, utility parent companies, integrated electric companies, gas distributors and midstream gas companies. See Appendix D for the list of companies.2 NRG Energy Inc., which filed for bankruptcy on May 14, 2003, “NRG Energy, Inc. Files Voluntary Chapter 11 Petition To Implement Negotiated Restructuring Plan,” press release, May 14, 2003; PG&E National Energy Group, which filed for bankruptcy on July 8, 2003, “PG&E National Energy Group Inc. To Reorganize Under Chapter 11 Protection,” press release, July 8, 2003; Mirant Corp., which filed for bankruptcy on July 14, 2003, “Mirant Files Chapter 11 Petitions to Facilitate Financial Restructuring,” press release, July 14, 2003. 3 In January 2003, OMOI identified approximately $40 billion of debt and credit maturing in 2003 held by 15 stressed companies. Companies that were deter-mined to be stressed and most at risk for default and renewal failure had large quantities of debt maturing in 2003, held credit ratings of BBB or lower with a negative outlook and had not already had a default occur (since OMOI was try-ing to predict defaults that had not already happened).

E N E R G Y M A R K E T A S S E S S M E N T
24
E N E R G Y M A R K E T A S S E S S M E N T
25
Financial stress has forced market partici-pants to exit trading, reducing the liquidity of physical and financial energy markets and the ability of participants to provide services to the market that improve efficiency. Companies such as Reliant, El Paso and Williams have recently exited speculative trading or announced plans to do so.4 Other market participants that continue to trade are limited by their weak financial conditions. In addition, continuing investigations regarding past trading practices are limiting trading. Uncertainty is causing companies to behave more conservatively, expressing concern about whether their current strategies and actions, especially in trading, may be viewed later as manipulative or abusive.
Trading is a necessary extension of competitive physical energy delivery because it increases market liquidity. Market liquid-ity is important because it gives buyers and sellers a number of parties with whom to do business and helps establish price levels through competitive bidding.
Figure 3-208-22-03
Share of energy companies that are noninvestment grade
Share of energy companies that are investment grade
100%
80%
60%
40%
20%
0%Jan ‘00 Jan ‘01 Jan ‘02 Jan ‘03 3/31/03
Bid-ask differential is the difference in price between what a buyer
offers to pay for a commodity and what a seller offers to accept
for a commodity.
Figure 3-2: The number of noninvestment grade U.S. gas and electric companies has increased since 2002
Source: OMOI analysis of U.S. natural gas and electric companies rated by Standard and Poor’s.
Having fewer trading participants reduces market liquidity, particularly at less active trading points. A lack of trading partners can lead to higher bid-ask differentials, increase price volatility and increase prices for wholesale and retail customers. When many suppli-ers compete at trading points, they offer choices to the market that can lower prices for customers.
Reduced market liquidity also can lead to reduced transparency in energy markets. A key product of any efficient market is accurate information about the prevailing price in that market. Having fewer traders completing transactions means fewer market partici-pants reporting price information to the marketplace through price indices. Price information helps custom-ers determine the cost of meeting their needs, helps sellers determine the value of their investment and, when the system works correctly, efficiently allocates resources to the customers who most value them. The quality of price indices depends in part on the number of active participants trading at a given price point.
Financial stress continues for market participants, potentially hampering operations. Debt levels remain high and the electric and natural gas sectors continue to experience credit rating down-grades and poor financial liquidity. Credit-rating downgrades continued through the first quarter of 2003. Figure 3-2 shows that the percentage of gas and electric companies rated as noninvestment grade by Standard and Poor’s has increased since 2002.
4 Reliant Resources Inc., “Reliant Resources exits proprietary trading,” press release, March 7, 2003; El Paso Corp., “El Paso Corporation Announces Third Quarter 2002 Results and Plan to Exit the Energy Trading Business,” press release, Nov. 8, 2002; The Williams Cos. Inc., “Williams Reports Third-Quarter Net Loss of $294.1 Million,” press release, Nov. 14, 2002, and 2002 Annual Report, March 19, 2003.

E N E R G Y M A R K E T A S S E S S M E N T
26
E N E R G Y M A R K E T A S S E S S M E N T
27
Creditworthiness can also affect contracts. For example, NRG recently attempted to terminate a contract with Connecticut Light and Power Co. (CL&P) to provide power in the constrained southwest area of Connecticut, citing its bankruptcy as the reason.6
Financial stress reduces capital expenditures. Power generation is adequate across most of the country. However, financial stress may lead some companies to postpone or cancel planned generation or transmission infrastructure projects. As shown in Figure 3-3, capital expenditures declined by 10 percent in 2002 for compa-nies within the FERC Energy Market Participant Index. While integrated electric companies and electric distribu-tors continued to have increased capital expenditures, most sectors, particularly those with wholesale exposure, reduced their capital expenditures.
Noninvestment grade credit levels can hamper business functions. For example, generators without a specified creditworthiness may have to prepay or establish 100 percent collateral for fuel,5 deal with a limited number of suppliers or have diffi-culty meeting New York Mercantile Exchange (Nymex) margin require-ments, which have increased with higher gas costs. Scheduled power sales may be hampered if electric grid independent system operators (ISOs) or regional transmission organizations (RTOs) tighten credit requirements for market participation. Defaults on project-financed generation could
result in banks ultimately owning and operating power plants, but banks have shown little inclination to take over generation assets so far.
Margin requirement is the amount of money
required to hold futures contracts and cover
changes in the value of futures contracts.
Project financing is a form of asset-based financing in which a
firm finances a discrete set of assets (the
project) on a stand-alone basis.
Figure 3-3: Year-to-year change in capital expendituresshows decline in 2002 expenditures
Source: Bloomberg data applied to FERC Energy Market Participant Index.
5 Collateral may be provided through prepayment, a letter of credit or, if pos-sible, a guarantee from a parent company.6 Reuters, “Bankrupt NRG halts further power sales to CL&P,” June 13, 2003.
ElectricDistributors
ElectricGenerators
Utility ParentCompanies
withSignificantWholesaleExposure
Utility ParentCompanies
withMinimalWholesaleExposure
IntegratedElectric
GasDistributors
Mid-streamGas
FERC EnergyMarket Partici-pant Index
figure 3-308-22-03
32%
10%
67%
-27%
43%
-14%
23%
0%
20%
7% 6%
-1%
26%
-10%
36%
-10%
Year-to-YearChangeinCapitalExpenditures(%)
80%
60%
40%
20%
0%
-20%
-40%
2001 compared to 2000
2002 compared to 2001
4.7 8.5 28.5 6.9 10.3 3.7 6.7 69.2
2002 Capital Expenditures (Billions of $)

E N E R G Y M A R K E T A S S E S S M E N T
26
E N E R G Y M A R K E T A S S E S S M E N T
27
Co., both entities have the same rating due to close financial ties and a lack of effective ring-fencing.10
If regulated utilities purchase generation plants or other assets, those acquired assets may be put into regulated rate bases. Regulatory oversight should ensure that subsequent regulated revenue require-ments are based on the lesser of cost or market value to protect regulated customers.
Actions
Industry Actions
With the goals of enhancing shareholder value, regaining investor confidence and reducing cost and collateral requirements, some companies have revised their strategies and business models in fundamental ways to include:
refocusing on core competencies and domestic markets;
re-emphasizing regulated asset-based business plans and oppor-tunities rather than unregulated power generation and revenue growth via trading;
reducing exposure to counter-parties that are not creditworthy, reducing trading limits, seeking collateral and moving towards credit clearing;
scaling back trading operations from market-making and speculative activity to asset-based trading, or abandoning trading altogether; and
selling assets to strengthen balance sheets.
Companies with wholesale exposure were, until recently, involved in most infrastructure develop-ment projects and were willing to engage in higher risk growth strategies targeting competitive markets. Smith Barney Citigroup estimated in May that more than 16,000 MW of new generation had been either delayed or cancelled since February 2002.7
Financial stress increases the need to ensure that the problems of nonregulated affil-iates do not harm regulated utility customers. With nonutility businesses performing poorly, there may be pressure to raise funds and a greater tempta-tion for unregulated parent companies to use the financial resources of regulated affiliates to shore up finances than would be the case under more favor-able conditions. For instance, businesses may seek to pledge regulated assets as collateral for unregu-lated businesses. If this occurs, rates to customers could increase if unregulated businesses default on commitments and regulated companies have to pay off the loans or if the cost of capital were to increase for the utility.
Ring-fencing techniques help isolate affiliate credit risk, protecting regulated assets from risks such as those presented during the Enron bank-ruptcy.8 Ring-fencing mechanisms include regulatory restrictions, both state and federal, financial constraints and organizational structure. The quality and strength of a ring-fence contributes to the differential in credit ratings between a regulated entity such as a utility or interstate pipeline and its corporate parent; the cost of funds to a regulated entity may be substantially lower if the ring-fencing
is perceived by lenders or inves-tors to be effective. Typically, a regulated utility will have a credit rating somewhat superior to a utility holding company. For example, the Portland General Electric Co. subsidiary maintains its own investment grade credit fully independent of Enron due
to effective ring-fencing techniques required by the Oregon Public Utility Commission, including structural mechanisms and regulatory insulation at the state level.9 In some instances, however, such as that involving Dynegy and subsidiary Illinois Power
Ring-fencing refers to techniques used to isolate the credit risk of a subsidiary within a corporation from the
risk of its affiliated companies.
Credit clearing is a mechanism for settling
mutual claims, the result of which is that the risk that a specific company might fail to fulfill its contract is
substantially reduced by pooling among
many companies.
7 Smith Barney Citigroup, Weekly Energy Wire, May 8, 2003, p. 8.8 As an example, prior to the Enron bankruptcy, two Enron pipeline subsidiaries pledged assets as collateral for loans and passed the funds to Enron just before its collapse. More recently, there has been concern at the state and federal levels with planned issuances by Aquila and Westar of debt collateralized by regulated assets.9 Standard and Poor’s, “An Enron Subsidiary is Ring-Fenced,” Jan. 16, 2003.10 Fitch Ratings, “Rating Linkage Within U.S. Utility Groups: Ring Fencing Mechanisms,” April 8, 2003.

E N E R G Y M A R K E T A S S E S S M E N T
28
E N E R G Y M A R K E T A S S E S S M E N T
29
Other important developments include:
nontraditional marketing entities such as finan-cial institutions and producer-affiliated compa-nies entering or expanding energy trading;11
industry group initiatives such as the recom-mended best practices of the Committee of Chief Risk Officers (CCRO) to restore confidence in trading and the development of master trading agreements;12
clearing services from the New York Mercantile Exchange (Nymex), IntercontinentalExchange (ICE) and EnergyClear, and other approaches such as insurance by Virtual Markets Assurance Corp. to reduce collateral requirements, improv-ing market liquidity; and
active participation in the debate for industry recovery from ratings agencies, bond insurance companies and fixed-income investors, many of which have become increasingly vocal about the need to protect regulated assets from bankrupt and distressed corporate holding companies with tools such as ring-fencing.
Commission Actions
FERC has taken action or proposes to take action on these financial challenges to:
Enhance policy under Section 204 of the Federal Power Act. The Westar Order13 provides additional restrictions on the use of borrowed money to finance nonutility business. The following restrictions will apply to all future issuances of debt to be approved by the Commission: debt secured by utility assets must only be
used for utility purposes; if assets securing debt are divested, the cor-
responding secured debt must be divested or spun off as well; and
if unsecured assets (utility and nonutility) are divested, the corresponding unsecured debt must be divested or spun off.
Continue oversight of credit standards that pipe-lines impose on gas transmission customers to ensure reasonableness for all market participants.14
Continue review of credit standards that electric transmission owners impose on electric generators and other transmission customers to ensure rea-sonableness for all market participants.15
Propose expanding quarterly financial report forms to collect financial information from juris-dictional entities more frequently than current reporting requirements.16
Regulate cash management practices to prevent abuses that could adversely affect the health of reg-ulated entities and their ability to provide service.17
Implement a wholesale power market platform intended to increase electricity transmission invest-ment.18 Open transmission access will, in the long run, improve market liquidity. Customers will also benefit from fair access to transmission and broader markets.
Set guidelines for reporting and developing price indices for natural gas and electricity transactions to help restore confidence in the current system.19
11 Reuters, “Banks Step in to Fill Trading Void Left by Enron,” April 29, 2003; Power Markets Week, “Thanks, But No Thanks: AEP, Most Other Leaders in 2002 Power Sales Pulling Back,” April 28, 2003.12 Several entities, including Edison Electric Institute (EEI), National Energy Marketers Association (NEM), North American Energy Standards Board (NAESB) and International Swaps and Derivatives Association (ISDA) have developed mas-ter trading and netting agreements.13 FERC 102 ¶ 61,186 Westar Energy Inc., Docket Number ES02-51-000, Feb. 21, 2003.
14 Including Docket Nos. GT02-35-004 (Tennessee Gas Pipeline Co.), GT02-38-005 (Northern Natural Gas Co.), RP02-363-005 (North Baja Pipeline LLC), RP03-7-001 (Natural Gas Pipeline Co. of America), RP03-41-003 (e prime Inc. v. PG&E Gas Transmission, Northwest Corp.), RP03-64-000 (Gulf South Pipeline Co. LP), RP03-70-001 (PG&E Gas Transmission, Northwest Corp.), RP03-162-000 (Trailblazer Pipeline Co.), RP03-256-000 (Honeoye Storage Corp.), RP03-312-000 (Calpine Energy Services LP v. Southern Natural Gas Co.) and RP03-354-000 (CenterPoint Energy-Mississippi River Transmission Corp.).15 Including Docket Nos. ER03-540-002 (Carolina Power & Light Co. and Florida Power Corp.), ER03-548-000 (San Diego Gas & Electric Co.), ER03-552-000 (New York Independent System Operator) and ER03-645-000 (Duquesne Light Co.).16 FERC 103 ¶ 61,352 Quarterly Financial Reporting and Revisions to the Annual Reports, Docket Number RM03-8-000, June 26, 2003.17 Regulation of Cash Management Practices Interim Rule, FERC, Docket No. RM02-14, passed June 25, 2003.18 FERC White Paper, “Wholesale Power Market Platform,” April 28, 2003, Docket No. RM01-12-000.19 FERC Docket No. PL03-3-000, July 24, 2003.

E N E R G Y M A R K E T A S S E S S M E N T
28
E N E R G Y M A R K E T A S S E S S M E N T
29
Promote discussion of financial health and mar-ket liquidity concerns among all stakeholders. As examples, the Commission recently sponsored conferences on: capital availability and its implications for
infrastructure investment and trading; credit clearing, which has the potential to
substantially reduce capital tied up for credit coverage; and
price indices, a keystone of competitive markets.
Continue work to bring closure as quickly as pos-sible to the remaining investigations of gaming and withholding in western markets in 2000 and 2001 to reduce uncertainty faced by market partici-pants and the financial markets upon which they depend.
Improve monitoring of financial health through greater coordination of the Commission’s audit functions.

E N E R G Y M A R K E T A S S E S S M E N T
30 31
E N E R G Y M A R K E T A S S E S S M E N T

E N E R G Y M A R K E T A S S E S S M E N T
30 31
E N E R G Y M A R K E T A S S E S S M E N T
High reserve margins across much of the country continue. Market participants have taken steps toward transparent market designs and trading platforms as open
and competitive energy markets evolve. Concerns about the quality of natural gas price reporting have been met with actions by industry to improve all energy price indices. Despite recent financial developments, energy markets appear to be on the rebound from adverse financial conditions and are showing signs of renewal. Market participants have stabilized financially while others have even seen modest growth.
Though progress has been made, there are national challenges that markets face, including:
High natural gas prices
Lack of demand responsiveness in electricity markets
Financial stress of some natural gas and electric market sectors
OMOI considers the issues facing the effective competitive functioning of the industry to be manageable. To meet these challenges, however, both industry partici-pants and regulators must seek and aggressively promote solutions to assure efficient, cost-effective and reliable electric and natural gas service to all U.S. customers. Such actions can address these challenges successfully and can
maintain the benefits of a competitive electric industry for customers and the overall economy.
The Commission seeks to promote fair, efficient markets through a clear focus on its strategic initiatives to:
assure sufficient infrastructure;
create balanced market rules; and
maintain vigilant oversight and enforcement.
CONCLUSION

E N E R G Y M A R K E T A S S E S S M E N T
32 33
E N E R G Y M A R K E T A S S E S S M E N T