energy management systems - fenix.tecnico.ulisboa.pt · energy management systems problems tânia...
TRANSCRIPT

Energy Management Systems Problems
Tânia Sousa and Mário Costa
With the collaboration of Carlos Santos Silva and André Pina
Version: 1/2/2018

Version 19.2.2018
Week 1 Power and Energy. Energy Tariffs. Energy Efficiency
1. Consider the prices for the residential sector in Portugal in 2015 from two electricity
retailers:
Simple Tariff Dual Tariff Triple Tariff
Power
(kVA)
Power
(€/day)
Energy
(€/kWh)
Power
(€/day)
Energy
(€/kWh)
Power
(€/day)
Energy
(€/kWh)
Off-peak Peak Off-peak Normal Peak
A 3,45 0,1530 0,1515 0,1561 0,0978 0,1853
0,1561 0,0978
0,1675 0,3047
4,6 0,1989 0,2030 0,2030
5,75 0,2446 0,2496 0,2496
6,9 0,2903 0,2962 0,2962
B 3,45 0,1449 0,1592 0,1449 0,0985
0,1947 0,1449
4,6 0,1853 0,1853 0,1853
5,75 0,2279 0,2279 0,2279
6,9 0,2740 0,2740 0,2740
Consider also the average load profile per month
Period Off – peak Normal Peak
Energy (kWh) 100 250 50
Off-Peak is between 00h and 8.00h and Peak is between 9.00-11.00h and 18-21h. In dual tariff, the
normal and peak periods have the same price while In simple tariff, all periods have the same price
a. If the contracted power is 6.9 kVA, how much is the reduction in the electricity bill (before
taxes) if the consumer changes to 3.45kVA?
b. What is the best tariff for this consumer considering a 3.45 kVA contracted power?
Evaluate all tariffs (simple, dual and triple tariff from company A and B).
c. How much will this client save per year if he changes 1) a 70 Watt halogen lamp by an 11
Watt LED lamp assuming that this lamp is on between 19h and 23h every day and 2) an
electric radiator by a heat pump (COP=3) assuming that it provides 4 kWh of heat per day
during 5 months assuming the simple tariff of provider A?
Version 19.2.2018
2. A family consumes 20m3 of natural gas in average for hot water and cooking. The natural
gas costs are described in the following table.
Connection to the grid Energy
0,099€/day 0,057 €/kWh
Assume that the family has 5 members and each ones consumes 40 L of hot water per day.
The family uses a tank-less boiler which delivers hot water at 40°C, with an efficiency of
80%. Assume a inlet temperature of 20°C. Consider also a conversion factor between m3
and kWh of gas of 11.7 kWh/m3.
a) Estimate how much energy is used by the boiler and what is the percentage between
cooking and hot water demand
b) The family is considering to change the gas boiler to a electric boiler, with an efficiency
of 100%. Compare the operation costs and provide an advice to the family regarding
the change of equipment. Assume the simple tariff of provider A.

Version 19.2.2018
Week 2 (Moran & Shapiro) Exergy Definition, Exergy Balance to Closed Systems & Exergy Destruction

Version 19.2.2018
Week 3 (Moran & Shapiro) Exergy Balance to Open Systems and Exergetic Efficiencies

Version 19.2.2018

Version 19.2.2018
Week 4 (Moran & Shapiro) Exergetic Efficiencies and Thermoeconomics

Version 19.2.2018

Version 19.2.2018
Week 5 (Moran & Shapiro) Exergetic Efficiencies of Reacting Systems

Version 19.2.2018
Week 6 Primary, Final, Available and Useful Energy.
Sankey diagrams
1. Reading a book requires the conversion from primary energy to light. Assume that the used
electricity is produced from coal with 37% efficiency and transported with 94% efficiency.
Assume that the efficiency of the light bulbs is 50% and that only 20% of the produced light
is used for reading the book, with the rest being dispersed in the environment and from
poor use of the lights.
a. Draw the Sankey diagram of this process (primary, final, useful and productive
energy);
b. What are the total losses associated with this activity?
2. In a CHP plant, the electricity is produced with an efficiency of 35% and then transported
with an efficiency of 94%. However, from the heat produced at the plant, 62% is reused in
a district heating system which has a transmission efficiency of 80%.
a. Draw the Sankey diagram for this plant.
b. What is the overall first law efficiency from primary to final energy in the case of the
CHP plant?
c. What is the overall second law efficiency from primary to final energy assuming that
1) the heat is distributed to final consumers at a temperature of 70ºC, 2) the mean
environmental temperature is 5ºC and 3) the exergy of the primary energy carrier
(coal or natural gas) is equal to its energy?
3. Consider a residential heat pump with a coefficient of performance COP = 3. Consider that
the electricity is produced from natural gas at a power plant with 45% efficiency (including
transportation losses) and that 20% of the heat produced at the heat pump is lost through
the walls and windows.
a. Draw the Sankey diagram.
b. Compute the second law efficiency of the heat pump between the final and useful
stages of energy use assuming that the heat released by the heat pump is at 27ºC
and that typical environmental conditions are 10ºC. Compare with COP and
comment.
4. Consider a factory that consumes electricity and propane.
Electricity has the following applications: 10% lighting, 70% productive equipment and
20% in pressurized air. In the pressurized air, around 20% of the electrical consumption in
lost in the air compressors because there is no associated production. There are also
losses in the network that transports the compressed air due to bad maintenance and
these losses correspond to 30%. Consider that the efficiency in producing electricity is 35%
(from coal).

Version 19.2.2018
Propane is used in ovens with an efficiency of 60%. The conversion of primary into final
energy for the propane is achieved with 95% efficiency.
Draw the Sankey diagrams, quantifying all stages, for:
a. the ovens;
b. the compressed air.
5. A trip performed by a driver is represented in Table 1, divided in 4 segments. For this trip, a
gasoline car was used. Assume that the energy content of gasoline is 31.8 MJ / l, the
conversion of oil to gasoline has an efficiency of 88% and that the efficiency of a gasoline
car from final energy to movement is 20%.
Table 1 – Trip characterization
Segment 1 Segment 2 Segment 3 Segment 4
Average speed (km/h) 35 80 110 65
Time (min) 20 15 40 10
Consumption (l / 100 km) 10.0 7.3 8.5 7.5
a. Calculate the average final energy consumption in MJ / km.
b. Assuming that 25% of the energy used in segment 1, 10% of segment 2, 5% of
segment 3 and 15% of segment 4 was lost due to traffic, how much final energy was
lost due to traffic?
c. Draw the Sankey diagram, specifying all losses (conversion from oil to gasoline, from
gasoline to movement and in traffic losses).
d. What was the conversion factor from primary energy to useful energy?

Version 19.2.2018
Week 10 (29-4 to 4-5-2018) Energy Balance
Answer the following questions using the energy balance of Portugal for 2016.
1. Compute the percentages of each energy carrier (coal, oil, natural gas, renewable & waste,
electricity and heat) in
a. the primary energy mix;
b. the final energy mix;
c. What is the overall energy transformation efficiency from primary to final?
d. Explain the main differences between the primary and final energy mixes.
2. How much of the primary energy supply is domestic production?
3. What is the efficiency in producing electricity:
a. In dedicated powerplants?
b. In cogeneration units?
c. Compare the previous values and comment.
4. What is the share of renewable energy in
a. the primary energy supply?
b. the final energy supply?
5. What is the first law efficiency of cogeneration (CHP)?
6. What is the second law efficiency of cogeneration in the ceramics industry (T=1600ºC),
cement industry (T=1450ºC) and paper industry (T=150ºC)?
7. What are the Per capita use of primary and final energy? Assume that the population in
2016 was 10371627.
8. What are the primary and final energy intensities? Consider that the GDP in 2016 was
185109 €.

Version 19.2.2018
Week 11 (11-5 to 16-05-2018) Block Diagrams
1. Consider a factory that produces 17 000 tonnes per year (output 14) following the
production process shown in the next block diagram:
2. Consider a company that produces steel bottles to store gasses. Each bottle is made of a
cylindrical body and two half-spheres. The cylindrical element weights as much as the two
halfspheres.
The production of the half-spheres starts with the disc cutting operation, followed by the
cupping (where the disc takes the shape of an half sphere). The production of the cylindrical
bodies starts also with a cutting operation, followed by an operation of rolling and longitudinal

Version 19.2.2018
welding. The 3 pieces are then taken to the operation of elements welding to produce a
bottle. After, the bottle suffers a thermal and surface treatment in the finalization process.
The last operation is the pressure test, where the non conformities are separated from the
final product. The non conformities bottles suffer a treatment operation after the finalization
process and then are reintroduced (recycling) in the elements welding operation.
Consider that the specific consumption of the raw material can be neglected, when compared to
the remaining energy specific consumptions involved in this process. The following values for the
main operations are given bellow:
a) In these conditions, answer to the following questions, making the adopted simplifications
explicit whenever necessary:
b) Draw the block diagram of the above production process.
c) Determine the expression to calculate the specific energy consumption of the bottles.
d) Determine the primary energy specific consumption associated to the bottles.
e) Indicate if the cycling operation is reasonable in terms of energy consumption, justify your
answer.
f) Determine the limit value for the specific energy consumption of the recycling operation
(the value that rules out the advantage of recycling in terms of energy consumption).

Version 19.2.2018
Week 12 (18-5 to 23-05-2018) Energy in Industry
The energy consumption of a cement plant in 2008 is reported in the following table:
Electricity 220118 MWh
Coal 58211 ton
Petroleum coke 168979 ton
Industrial waste 1318 ton
Fueloil 731 ton
Diesel 1172 m3
Propane gas 79 ton
a) Calculate the primary energy consumption according to the SGCIE (DL 71/2008). The
conversion factors from primary to final energy and the carbon emissions factors
are reported in the following table:
tep/ton
kg
CO2e/tep
Coal1 0,674 3956,5
Petroleum coke1 0,74 4082,1
Industrial waste1 0,256 5982,9
Fueloil1 0,984 3236,4
Diesel1 1,01 3098,2
Propane Gas1 1,11 2637,7
1 In this case the conversion factors corresponds to an efficiency of 100%
For electricity the factors are 215 toe/GWh and 0,47 kgCO2e/kWh and the density
of diesel is 0.84 ton/m3.
b) Calculate the energy intensity and carbon intensity in 2008 taking into account that
total production (clinker and cement) was 2 522 821 tons.
c) What are the legislation requirements for this cement plant? Calculate the target
values of energy intensity and carbon intensity.
d) Draw the Sankey diagram quantifying the amounts of Primary, Final and Useful
Energy and indicating the types of Useful Energy. Consider the following efficiencies:
petroleum coke, coal, industrial waste and fueloil are consumed in clinker kilns with
an efficiency of 65%, diesel is used in emergency generators with an efficiency of
37%, propane gas is used in the packaging engine with an efficiency of 30% and
electricity is used in milling with an efficiency of 90%.

Version 19.2.2018
e) The energy rationalization plan contemplates the optimization of the clinker kilns
leading to an energy saving of 108,7 MJ per tonne of clinker produced. Check
whether this measure is enough to satisfy the SGCIE, assuming that in 2008 there
was a production of 2031291 ton of clinker in these kilns and that the energy saving
will allow a reduction in the consumption of petroleum coke. LHV (coal)=28.2MJ/kg;
LHV (petroleum coke)=31MJ/kg; LHV (industrial waste)=10.7MJ/kg; LHV
(fueloil)=41.2MJ/kg;
f) If electricity in Portugal was all obtained with the combustion of natural gas in
combined cycle power plants with an efficiency of 50%, what should be the
coefficient of conversion from primary to final energy in tep/GWh to be found in
the legislation? And the carbon emissions factor in kgCO2e/kWh? EF(natural gas) =
2683.7 kg CO2 e/ tep
Week 13 (21-05 to 25-05-2018) Energy uses in Transports
Table 1 – Emission factors for electricity production in some countries.
Country Emission factor for electricity production (kg CO2e/kWh)
Belgium 0.285
Germany 0.624
Spain 0.440
France 0.056
Greece 1.149
Portugal 0.369
Suécia 0.023
Bulgaria 0.819
Romania 0.701
Table 2 – Emission factors for selected energy sources.
Fuel Energy content (MJ/l)
Tank-to-Wheel (TTW) emission factor (kg CO2e/l)
Well-to-Tank (WTT) emission factor (kg CO2e/l)
Cradle to Gate (CTG) emission factor (kg CO2e/l)
Gasoline 31.76 2.49 2.99 3.29
Diesel 35.95 2.67 3.05 3.35
Exercise 1

Version 19.2.2018
Consider a small city on the border between Portugal and Spain whose transportation network
involves public and private transportation. Citizens have at their disposal the following modes of
transportation:
1. A diesel urban bus that runs every day and does 20,000 km per year and has an expected
useful life of 20 years. The bus has maximum occupancy of 20 passengers and is usually
half full. The fuel consumption for this bus is approximately 20 l/100km.
2. A shared single-passenger bike system. Bikes only last for 3 years on average, and each is
typically used for 200 km per year. There are 20 bikes available, but only five are used.
3. Private cars. 50 citizens have diesel cars, while another 85 citizens have gasoline cars. All
cars have 5 seats, and have a 10 year useful life. Each car does approximately 10,000 km
every year. Diesel cars on average carry 3 persons, while gasoline cars only transport one
person. On average, diesel cars consume 5l/100km and gasoline cars 8l/100 km.
1. What are the CO2e emissions per year in this city due to transportation, considering only direct
emissions from fuel combustion?
2. What are the average yearly emissions per citizen (i.e. considering the total number of
inhabitants)? If there was a personal tax of 10 €/t CO2e in the city to compensate for the
emissions, paid regardless of the transportation method used by each citizen, how much would
each person pay per year?
3. If you were a policy-maker in this city, would you consider the bus an efficient transportation
method regarding (1) its energy consumption, and (2) its environmental performance (considering
only direct emissions)?
4. Would the answer to the previous question change if you consider WTT emissions?
5. What would be the maximum occupancy rate of the bus that would make it more environmentally
efficient for a single passenger to drive a gasoline car than to take the bus (i.e. how much does
the occupancy rate of the bus need to drop for it to have more direct emissions that driving in a
gasoline car, considering the conditions of question 3)?
6. As a policy-maker in this city, you decide to try and incentivize the use of the bicycles. To make
then faster, you decide to install electric motors on all 20 bikes. The motors consume 0.05
kWh/km. You also waive the payment of the 10 €/t CO2e for citizens who use the bikes (regardless
of being users prior to the change or not). You also decide to start using WTT emissions to
determine the tax charged. However, this only persuades 5 bus users to switch to bikes, and
maintains the 5 people previously using them as well as all private transportation. What is the
change in emissions per year after this policy comes into effect? How much more or less do tax-
payers have to pay due to the emissions (considering that those who pay the tax still pay it
regardless of their means of transportation, and must also pay for the emissions of the electrical
motors on the bikes)?

Version 19.2.2018
7. Considering the answer to the previous question, would it be an efficient policy to end the bus
route, as long as all remaining bus passengers would be distributed among existing gasoline cars
(e.g. car sharing)? What would the emissions be in that case, and what would be the tax paid by
each citizen?
8. Start by considering the situation in question 6 (i.e. with electrical bikes). Electric cars start
replacing diesel and gasoline cars in your city. 75 of your inhabitants purchase electric cars, which
consume 0.2 kWh/km, and have 5 seats. They are used for the same amount of time and
kilometres as the diesel/gasoline cars. These 200 vehicles replace 25 diesel cars and 50 gasoline
cars, while maintaining the previous occupancy rates of each prior vehicles (i.e. electric vehicles
replacing diesel cars transport 3 persons, while those replacing gasoline cars transport only one).
(i) What are the emissions of these electrical vehicles per seat.km and per passenger.km?
Are electrical vehicles more or less efficient than the bus, considering the occupation rate
of the bus in question 6? And how would the emissions change if the driver charges the
car in Spain rather than Portugal?
(ii) What are the annual emissions in the city after the electrical vehicles are on the road?
What would be the tax paid by each non-bike rider?
Question 2
In the same city there is a paper production company that has a fleet of vehicles for distribution. The
fleet includes:
(i) 5 diesel 16 tonne diesel trucks (25 l/100 km full, 18 l/100 km empty), average TTW
emissions
(ii) 2 older diesel 32 tonne trucks (40 l/100 km, 25 l/100 km empty), which emits double of
average TTW emissions.
The trucks transport several products separately, but there are two products that always travel
together: A4 paper sheets and envelopes. Per year, they transport:
(i) 740 t of A4 sheets
(ii) 700 t envelopes
When loaded with these products, each trip between the facility and the market takes 300 km.
Consider that the trucks always make a round trip – one way full, and empty on the way back.
Consider that the number of trips made by all trucks is the same.
1. Allocate the emissions (TTW) of the fuel consumption of the trucks corresponding to A4 sheets
based on mass.
2. Allocate the emissions (TTW) of the fuel consumption of the trucks corresponding to A4 sheets
based on economic value, assuming that the selling price of A4 sheets is 0.01 €/sheet and of
envelopes is 0.05 €/envelope, where 1 sheet weighs 30 g and 1 envelope weighs 50 g.
Version 19.2.2018
Week 14 (28-05 to 1-06-2018)
1. Build the hourly energy demand model (load diagram) of a house with the following
equipment’s and consumption patterns:
- A fridge with a nominal power of 150 W (total power of 300 VA), which is used 24 hours
per day;
- An internet router with a nominal power of 15 W (total power of 30 W) which is also used
24 hours per day;
- A dish washer which is used once per day after midnight. The energy per cycle is 1 kwh and
the nominal power is 2200 W (total power of 2200 VA);
- A TV with a nominal power of 150 W (total power of 200 VA) which is used 5 hours per day
between 19 and 24 H;
- A laptop with a nominal power of 40 W (total power of 60 VA) that works for 3 hours per
day between 21 and 24 H;
- A micro wave of 900 W (1500 VA) which is used for 5 minutes at 8 H and for 5 minutes at
20H;
- A hairdryer of 1500 W (total power of 1500 VA) which is used for 10 minutes per day
around 7 H;
- The lighting which consists of:
o In the corridor, 5 halogen bulbs of 50 W (total power of 100 VA) which work a
total of 1 hours per day, between 7 and 8 and from 19 to 24H;
o In the kitchen, 2 compact fluorescent bulbs of 15 W (total power of 20 VA)
which works 2 hours, between 19 and 21;
o In the living room, 1 compact fluorescent bulb of 11 W (total power of 15 VA)
for 5 hours, between 19 and 24;
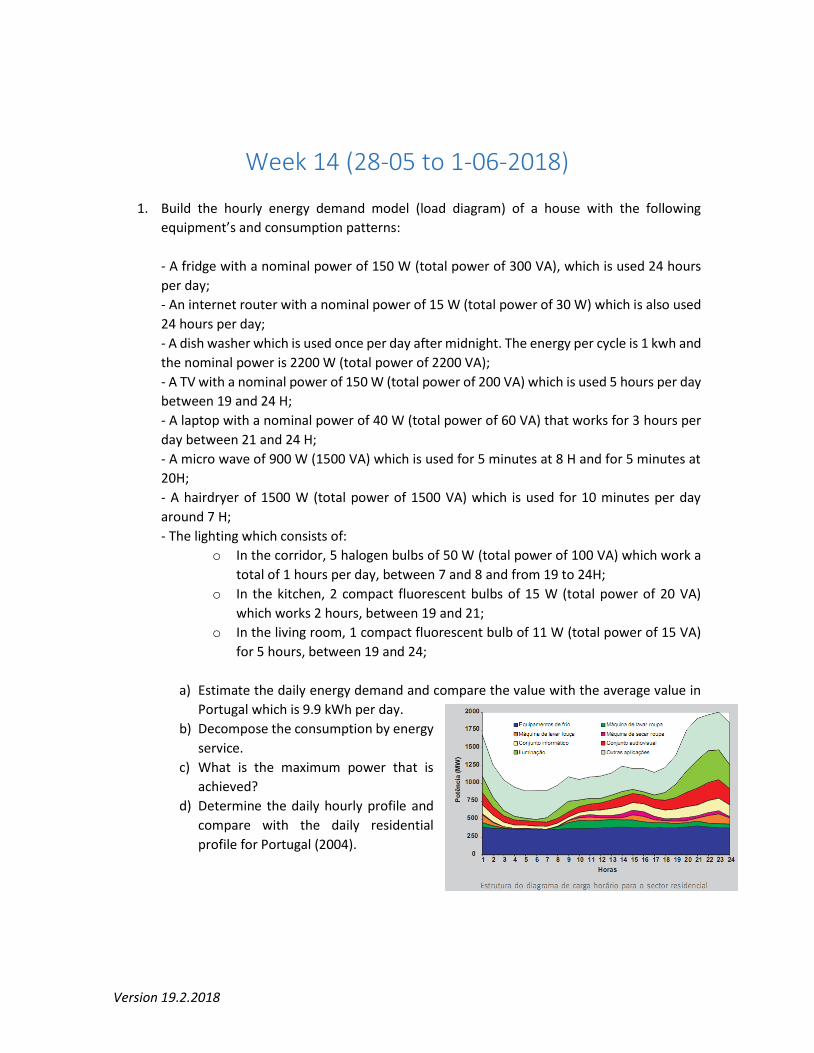
a) Estimate the daily energy demand and compare the value with the average value in
Portugal which is 9.9 kWh per day.
b) Decompose the consumption by energy
service.
c) What is the maximum power that is
achieved?
d) Determine the daily hourly profile and
compare with the daily residential
profile for Portugal (2004).

Version 19.2.2018
2. Consider a household with 3 persons. The average time in
shower is for each of the three persons 7m, 10m and 8 m.
The water flow in has the water efficiency label shown in
the figure.
a. Estimate the hot water energy needs in summer (3
months), when the inlet temperate is 20°C and the
outlet temperature at the shower head is 38°C.
b. Estimate the hot water energy needs in winter (4
months), when the inlet temperature is 15°C.
c. Estimate the yearly consumption of the household,
considering that people use the hot water for 330
days (1 month of holidays in summer) and that in
spring and autumn the inlet temperature is an average of winter and summer inlet
temperature.
d. Compare the previous value with the regulation that assumes a 40L consumption
per person for 365 days with a temperature difference between inlet and outlet
water of 35°C. What are the factors that contribute more to the difference?
e. Estimate the final energy consumption in winter if the hot water system is a tank-
less boiler with 75% efficiency and the primary energy consumption assuming a
conversion factor of 1. Estimate further the associated CO2 emissions considering
that the emission factor of natural gas is 0.202 kgCO2/kWh.
f. Estimate the final energy consumption if the hot water is provided by an electric
boiler with a storage tank, considering an efficiency of 0.9. In this case, assume that
the temperature has to be stored at 60°C and that the thermal losses are 3%.
Estimate the primary energy consumption assuming a conversion factor of 2.5 from
final to primary. Estimate further the associated CO2 emissions considering that the
emission factor of electricity is 0.144 kgCO2/kWh.

Version 19.2.2018
3. Consider the classroom V1.10 in the civil engineering department. The room has an area of
54m2 (6mx9m), a height of 2.5m. It has 16 fixtures with 1 fluorescent lamps of 58 W and a
capacity for 40 students. The walls are made of a simple brick layer and the floor and ceiling
are made of concrete. The simple glaze surface has an area of 13.5m2 and is facing EAST.
The data from the room is the following:
Room Occupation in the week 26th to 30th September
Temperature in the week 3rd to 9th October
Humidity in the week 3rd to 9th October

Version 19.2.2018
Luminosity Temperature in the week 3rd to 9th October
Internal gains a) Estimate the internal gains during one hour of class under the following conditions:
• 100% of students capacity and 100% of lighting capacity
• 50% of students and 100% of lighting
• 50% of students and 50% of lighting
Note: assume that in a tubular fluorescent bulbs the thermal losses
represent at least 40%. Assume that each student emits around 70W.
b) Compare these values with an average internal gain of 4W/m2. Use this value in the
rest of the questions.
Thermal Comfort c) Considering the standard thermal comfort conditions, evaluate if in general the
conditions in the room comply with the standard.
Air leakage
d) Calculate the losses due to infiltration through the windows frames, assuming that
the infiltration rate is 0.5 h-1 and that the outside temperature is 15°C.
Note: consider that at 20°C, the air properties are Cp=1,005kJ/kgK and ρ=1,2kg/m3

Version 19.2.2018
e) Estimate how much has to be the infiltration rate to decrease the temperature by
one degree in a break of 10m.
Heat exchange through the envelope f) Estimate the losses through the ground, the ceiling, the corridor and the walls of
adjacent rooms and the wall to the outside assuming the following values:
• Concrete floor and ceiling with U=0.6 W/m2
• Brick walls with U= 0.5 W/m2°C
• Simple glaze window U=1 W/m2°C
• Adjacent areas temperature=18°C
g) Estimate the additional heating needs of the room that need to be provided by a
HVAC system. Neglect the solar gains in winter.
h) Assume the use of a split AC unit with a COP=3. Estimate the final energy
consumption.
Solar gains i) Consider now the same room in the summer. Estimate the solar gains through the
window, considering the average incident radiation in Lisbon for EAST facades is
500W/m2 and a typical solar gain of the window of 0.53.
Cooling needs Estimate the cooling needs when the temperature outside are 30°C, for an operative
temperature in the room of 25°C and considering the adjacent temperatures are
also 25°C.