energy intensity, renewable energy, and economic ...iaee.org/en/students/best_papers/ning_wu.pdf ·...
TRANSCRIPT

1
Energy Intensity, Renewable Energy, and Economic Development: Examining Three Provinces in China
Ning Wu
Department of Urban Studies and Planning, MIT ([email protected]) Abstract China has incurred a steady decrease of energy intensity (EI, energy consumption per unit of GDP) since the 1980s, for example, a decrease of 29.3% from 1995 to 2004. EI trends of individual provinces vary, although the whole country shows declining energy intensity. The energy-intensity trends in three provinces seem especially interesting, Inner Mongolia, Liaoning and Ningxia: they represent three typical EI trends in China, increasing, nearly constant, and decreasing. It brings forth a puzzle that Ningxia and Inner Mongolia, with developed renewable energy industry and clean energy technology, has increasing or almost constant EI, while Liaoning, which has a heavy industry base and does not have much renewable energy capacity, experienced an EI decrease. Whether or to what an extent does renewable energy development impact the energy intensity? What are other reasons driving the EI trends in these regions? How the economic development is interacting with energy intensity issues? This paper examines underneath reasons for differences in energy intensity trends. Furthermore it tackles that puzzle by analyzing determinants for EI trends and examining economic structures of these regions.
Keywords: energy intensity, renewable energy, economic structure, energy investment
1. Introduction
The People’s Republic of China (China) has incurred a steady decrease of energy intensity (EI,
energy consumption per unit of GDP) since the 1980s. This trend continued in the past decade.
From 1995 to 2004, for example, the EI of China decreased from 163.25 to 115.42 kilogram
standard coal equivalent (kgce) per thousand Yuan (1995 deflated value), a decrease of 29.3%
(see Table1 and Figure 1).
Scholars have studied China’s EI at the national level from the perspectives of structural change
and real energy intensity (Smil 1990, Polenske & Lin 1993, Sinton & Levine 1994, Lin &
Polenske 1995, Garbaccio 1999, Zhang 2003, Polenske 2007). Some of these analysts

2
determined that structural change was a main factor responsible for EI decrease in the early
1980s when China started the “Open-door” policy, while others showed that it was technological
change. The structural-change factor still works in decreasing China’s EI in the late 1980s and
1990s, but its effect is less significant than the factor of real energy intensity which is caused by
technology innovation. Based on firm-level data, Zhang (2003) further argues that 88% of the
cumulative energy savings in the industrial sector was attributed to real intensity change, with
approximately 80% of such savings from the four chief energy using sub-sectors (i.e., ferrous
metals, chemicals, nonmetal mineral products, and machinery). Polenske & McMichael (2002)
also find that technology innovation is the primary factor for EI decrease in those firms using
large quantities of coal.
Few analysts have conducted studies concerning EI trends of individual provinces in China. In
fact the EI trends of individual provinces vary, while the whole country shows declining energy
intensity. Among all the 30 provinces or municipalities (not including Taiwan and Hong Kong
Special Administration Region and Macau), the energy-intensity trends in three provinces seem
especially interesting: Inner Mongolia, Liaoning and Ningxia (Table 1 and Figure 1). They
represent three typical EI trends in China, increase, no significant change, and decrease. As
shown in Table 1, Ningxia, a less-developed province in the northwest but with a well-developed
solar-power industry, has experienced an EI increase over the past decades, from 308.24 in 1995
to 427.60 kgce (kilograms of coal equivalent) per thousand Yuan in 2004 (1995 deflated value),
an increase of 38.7% over ten years. Inner Mongolia, famous for wind and solar-power and
coal-gasification industries, exhibits a roughly constant EI over this period, from 258.26 kgce per

3
thousand Yuan in 1995 to 220.53 in 2004 (1995 deflated value), but its EI basically fluctuated
around 200. Liaoning, a province with considerable heavy industry, like most provinces, has a
steadily decreasing EI trend, and its EI is at about the same level as that for China as a whole. Its
EI decreased from 276.4 kgce per thousand Yuan in 1995 to 122.9 in 2004 (1995 deflated value),
a decrease of 55.6%.
Table 1: Energy intensity, 1995-2004 (kilograms of standard coal equivalent per 1000 Yuan GDP
1995 1996 1997 1998 1999 2000 2001 2002 2003 2004
National 163.25 160.74 138.44 123.21 115.31 108.54 98.30 98.38 104.35 115.42
Inner Mongolia 258.26 204.39 248.58 198.75 197.29 191.16 186.73 181.53 175.84 220.53
Liaoning 276.39 218.62 208.69 167.77 148.65 150.86 140.38 132.56 128.40 122.86
Ningxia 308.24 227.73 240.68 233.61 241.20 * * * * 427.60
Source: SSB&NDRC 1996-2005, SSB 1996-2005; edited by the author Note: *: data of energy consumption by sector are unavailable from the sources given; therefore, I could not calculate the energy intensity. However, Polenske (2007) shows the energy intensity data of Ningxia for this period and indicates that Ningxia has a climbing curve of energy intensity over these 10 years.
0.00
100.00
200.00
300.00
400.00
500.00
1995 1996 1997 1998 1999 2000 2001 2002 2003 2004
Year
EI (k
gce)
National Inner Mongolia Liaoning Ningxia
Source: derived from Table 1 Figure 1: China’s energy intensity from 1995 to 2004, national and provincial (from Table 1)

4
The past decades have also witnessed China’s development of renewable energy. China’s efforts
for developing renewable energy date to 1982 when the central government issued “Suggestions
to Reinforce the Development of Rural Energy.” More efforts were seen since 1995 when the
State Planning Commission, together with other commissions, issued the Outline on New and
Renewable Energy Development in (NREL 2004a&b, 2006). In 2001 the State Economic and
Trade Commission (SETC) proposed its Tenth Five-Year Plan for Sustainable Development,
including the Tenth Five-Year Plan for New and Renewable Energy Commercialization
Development. Five years later, in 2006, China passed its Renewable Energy Law with a firm
objective of boosting the use of renewable energy capacity up to 10 percent of the country's total
energy consumption by the year 2020 (compared to 3% in 2003). Totally, since 1980s, China has
issued more than 20 national policies or laws to promote renewable energy development and has
achieved considerable progress (NREL 2004a&b, 2006). China’s renewable energy development
has also received attention from multiple agencies. For example, the National Renewable Energy
Laboratory (NREL) under the U.S. Department of Energy keeps track of China renewable energy
policy. Wang (2005) concludes that renewable energy in China is still under utilized that it is
even disregarded in official figures. Some reports also reflect that some provinces still rely on
coal industries for economic growth (21 Century Economics 2005).
Renewable energy development is supposed to have a positive effect on EI decrease. Martinot
(2001a, 2001b) reviews the World Bank’s renewable energy projects in China and finds that, on
the one hand, these projects contribute to energy efficiency or decreasing EI in China by
promoting the awareness of energy conservation. On the other hand, renewable energy

5
development is supposed to help decrease EI as it brings forth technology innovation of energy
use (NREL 1999, Martinot 2001a&b, Gao et al. 2005). For example, coal gasification, an
innovation introduced in this period in Inner Mongolia, not only decreases energy intensity but
reduces carbon-dioxide emissions (Moniz & Deutch 2007, SEPA 2004).
Given this background, Inner Mongolia has achieved significant growth in its renewable energy,
especially wind power and solar power. Inner Mongolia has the highest wind power potential in
the country, with a total wind power capacity by the end of 2005 of 166,000 kw, ranking 1st in
China, with a projected capacity of 4,000,000kw by 2010 (North News 2006). Ningxia’s solar
industry dates to the 1970s, and the government plans to build up annual solar power capacity,
which can substitute 432,000 tonnes of coal equivalents, about 5% of its coal consumption in
2004 (San 2004). Liaoning, which is a heavy industry base, so far does not have much renewable
energy capacity.
It becomes a puzzle that Ningxia and Inner Mongolia, with developed renewable energy industry
and clean energy technology, has increasing or almost constant EI, while Liaoning, which has a
heavy industry base and does not have much renewable energy capacity, experienced an EI
decrease. My hypothesis is that other factors, mainly technology innovation which improves the
real energy intensity, still play key roles in changing energy intensity in these three provinces.
Renewable energy also plays some role but it’s at this stage too minimal to impact energy
intensity.
To test the hypothesis, I explore what drives the changes of energy intensity in Liaoning, Inner
Mongolia, and Ningxia. I also probe what factors prevent renewable energy from playing a role

6
in decreasing energy intensity. My analysis sheds lights on what factors account for EI changes
in those regions and what factors hinder or trade off the effect of renewable energy.
2. Three provinces
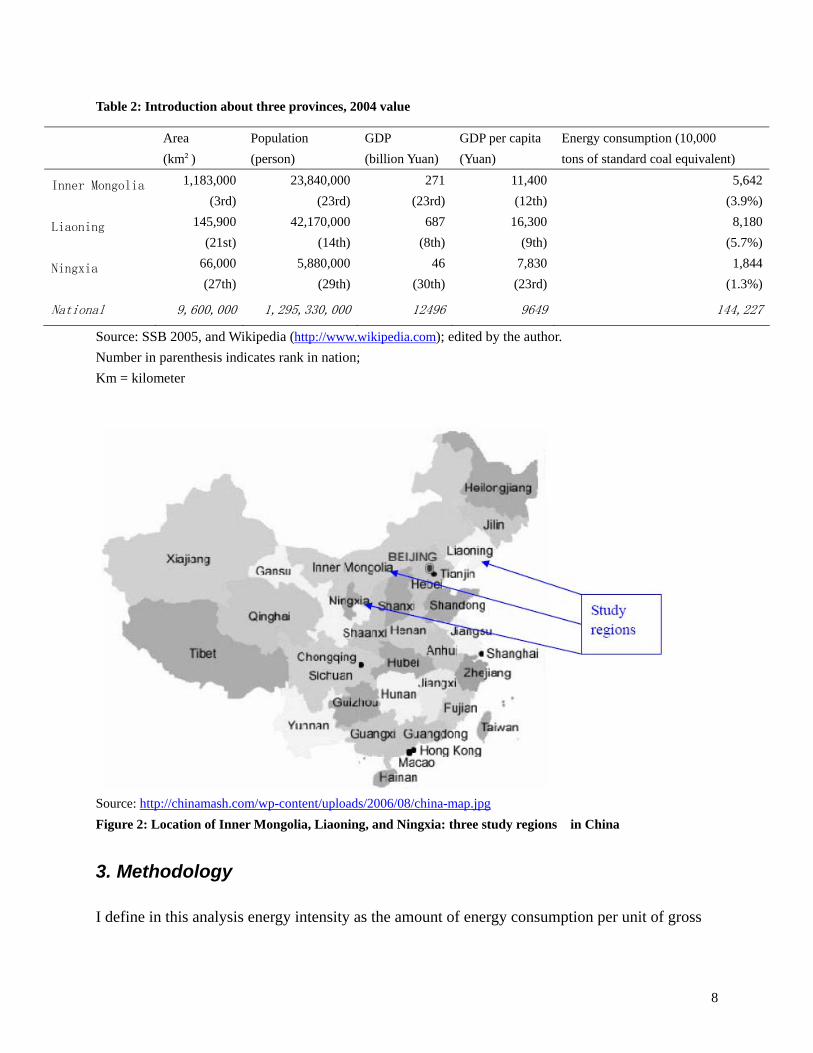
Inner Mongolia, Liaoning, and Ningxia are located in the north of China, as shown in Figure 2.
Inner Mongolia has an area of 1.18 million kilometers (km) occupying about 12% of China’s
land area. In 2004, it had a population of about 24 million and its GDP was 271 billion Chinese
Yuan (Yuan), which makes its rank 12th in GDP per capita all the provinces and municipalities in
China. Its energy consumption was 3.9% of the national total, lower than Liaoning’s, but two
times more than Ningxia’s amount of 2004. Liaoning has a larger population and smaller land
area than Inner Mongolia. As of 2004, Liaoning achieved a GDP per capita of 16,300 Yuan,
almost double the national average of 9,649 Yuan. Accordingly, its energy consumption is higher,
claiming 5.7% of the national total. Ningxia, the smallest province of the three, consumed about
1.3% of the national total energy in 2004 for its GDP of 46 billion Yuan. Ningxia’s GDP per
capita is about 81% of China’s average, placing 30th (the second smallest in China, higher than
Tibet) in 2004 (SSB&NDRC, 2005, SSB, 2005).
Inner Mongolia is known for its abundance of coal and as an important coal base in north China.
Also, it has other resources, such as cashmere, natural gas, and rare earth elements, and more
deposits of naturally-occurring niobium, zirconium, etc. Inner Mongolia plans to double its
annual coal production by 2010, from an annual 260 million tons in 2005 to 500 million tons by
2010 (PDO, 2005). Shenhua Group is the largest coal company in China (see the coming

7
section), comparable to Peabody of the United States. Inner Mongolia growth depends upon coal,
power generation, etc. The provincial government emphasizes the following six as competitive
industries: energy, chemicals, metallurgy, equipment manufacturing, processing of farm produce,
and hi-tech products (San, 2004).
Liaoning is one of China’s most important industrial bases, covering a wide range of industries,
such as machinery, electronics, metal refining, petroleum, chemical industries, coal, etc. Of
provinces in China, it has the most iron, magnetite, diamond, and boron deposits. Its history of
being a base for heavy industry in China since the birth of the People’s Republic of China and its
abundance of iron and other resources make Liaoning a key producer of steel in China. It has
several large steel corporations, such as Anshan/Benxi Steel Group Corporation and Wushun
Special Steel Corporation, Liaoning accounts for 1/6 of the total steel production in China (see
http://www.ln.stats.gov.cn/jrln/gy.htm).
Ningxia is a relatively undeveloped region in China, which is shown by its low GDP per capita
(SSB, 1997-2005). Coal is its key resource and the coal industry has become a base industry in
Ningxia. East Ningxia Coal Basin is one of the 13 key huge coal production cases in China, with
a proved reserve of 27.34 billion tonnes and a potential reserve of 139.43 billion tonnes.
Developed by NingXia Coal Industry Corporation (merged by Shenhua Group from Inner
Mongolia), this coal base will become an industrial park with mainly energy-intensive industries,
including coal mining, coking, coal tar, petroleum products, etc. Ma Qizhi (2006), then the
governor of Ningxia, stated that “The project of East Ningxia Coal Base is the key for ensuring
our GDP growth of more than 10% per year until 2020”.
8
Table 2: Introduction about three provinces, 2004 value
Source: SSB 2005, and Wikipedia (http://www.wikipedia.com); edited by the author. Number in parenthesis indicates rank in nation; Km = kilometer
Source: http://chinamash.com/wp-content/uploads/2006/08/china-map.jpg Figure 2: Location of Inner Mongolia, Liaoning, and Ningxia: three study regions in China
3. Methodology
I define in this analysis energy intensity as the amount of energy consumption per unit of gross
Area (km²)
Population (person)
GDP (billion Yuan)
GDP per capita (Yuan)
Energy consumption (10,000 tons of standard coal equivalent)
Inner Mongolia 1,183,000 (3rd)
23,840,000 (23rd)
271 (23rd)
11,400 (12th)
5,642 (3.9%)
Liaoning 145,900 (21st)
42,170,000 (14th)
687 (8th)
16,300 (9th)
8,180 (5.7%)
Ningxia 66,000 (27th)
5,880,000 (29th)
46 (30th)
7,830 (23rd)
1,844 (1.3%)
National 9,600,000 1,295,330,000 12496 9649 144,227

9
domestic product (GDP) or gross regional product (GRP). For energy consumption, I use the unit
of 10,000 tonnes of standard coal equivalent (based on calorific value calculation). I deflate GDP
to real GDP, based on 1995 values, as well as GRP using a current price index, which is
calculated by the research group of Professor Karen Polenske at MIT. For energy consumption
and GDP/GRP data (1995 through 2004), I use data from the China Energy Statistical Yearbooks
and China Statistical Yearbooks for the relevant years.
I use shift-share analysis as the framework to explore energy intensity. There are different
methods and analysts use the Laspeyres method extensively (Zhang 2003). Park (1992) proposes
this method calculating changes in energy consumption with respect to a constant year. The
change of energy consumption between two years, ottot EEE −=∆ is interpreted by three
components: REEEE strouttot +∆+∆+∆=∆ int . outE∆ is a change in aggregate production
(output effect, the energy consumption of the second year based on the same energy intensity and
industrial structure of the base year minor the energy consumption of the base year). strE∆
represents a change of consumption due to changes in composition of aggregate production
(structural effect) and intE∆ is the intensity effect which shows the changed resulted from the
adoption of more efficient technologies and techniques, and so forth (Detailed formulae about
calculating these effects are presented by Zhang 2003, or Park 1992). R is the residual, which
is not equal to zero and it will grow generally if t increases, which leaves part of the observed
change in energy consumption unexplained. This constitutes a shortcoming of the Laspeyres
methods and some scholars, such as Zhang (2003), derive their own equations to eliminate this
residual.

10
Therefore, I adopt the method developed by Polenske and Lin (1993). Their method clearly
decomposes the energy consumption into three parts each of which can be calculated and
explained easily.
∑∑ ⋅−+⋅−+⋅=i
tiitii
tiitt OeeOeeOeE ])[(])[( ,0,,,00,0 (1)
(constant share) (industrial mix) (efficiency change)
Where tE is the total energy consumption in year t, tO is the GRP (or GDP for the whole
nation) in year t. tiO , is the GRP for each sector in year t. 0e is the energy intensity for the
whole region in the base year, and 0,ie and tie , are the energy intensity for industry i in the
base year and year t.
The constant share is the energy consumption under the condition that the energy intensity in
year t remains at the same level as that of the base year. The effect of industrial structure on
energy use is illustrated by the industrial-mix component. A negative industrial mix means that
the industrial structure has become less energy intensive compared with that in the base year, and,
likewise, efficiency change is similar to the intensity effect discussed in the Laspeyres method,
measuring the change of energy efficiency.
If we extend the items on the right-hand side of Equation (1) and add them, the sum is exactly
equal to the item on the left side, which leaves no residual in the equation. In other words, the
energy intensity can be fully explained by the three effects defined on the right-hand side of the
equation. Furthermore, by dividing both sides of Equation (1) by tO , Equation (2) describing the
impacts on energy intensity is obtained.

11
ti
tiititi
tiit OOeeOOeeee /])[(/])[( ,0,,,00,0 ∑∑ ⋅−+⋅−+= (2)
(constant share) (industrial mix) (efficiency change)
where ttt OEe /= is the energy intensity for the whole region in year t. te can be smaller or
greater than 0e depending on the simultaneous effects from industrial mix and efficiency
change. Obviously the combined effect of industrial mix and efficiency change determines the
level of energy intensity in a given year.
Energy efficiency is broadly defined as the introduction of new equipment, processes, and/or
techniques, which can influence the amount of energy consumed per unit of output. A structural
change reflects the shift in the industrial composition. Ideally, by using a finer industrial
classification, an analyst can explain more about the shift and obtain a more reasonable
explanation than for the courser detail data. But data availability remains a challenge. Similar to
Polenske and Lin (1993), I use China’s classification of six material production sectors: (1)
Primary Industry (Farming, Forestry, Animal Husbandry, Fishery & Water Conservancy); (2)
Industry; (3) Construction, (4) Transportation, Storage, Postal & Telecommunications Services;
(5) Wholesale, Retail Trade & Catering Service; and (6) Others. The use of this classification is
also determined by the data. I obtain energy consumption data for different sectors from the
China Energy Statistical Yearbook, which designates seven sectors (the first five are the same
with the above. The 6th and 7th sectors are Residential Consumption and Others, respectively). I
obtain GRP data from the China Statistical Yearbook, which provides data for more sectors, but
only the first five are same as those in the China Energy Statistical Yearbook. In this context, I

12
use the first five sectors plus a six “others,” which includes all the other sectors.
4. Energy-intensity changes
In this section, I present the results of shift-share analysis both for China and for the three
provinces. As shown in Table1, Ningxia Province energy-consumption data by sector for 2000,
2001, and 2002 are not available, which leaves the shift-share analysis of 2000-2003 blank for
this province. For the convenience of the reader, I provide only the tables with results of the
shift-share analysis, giving energy-consumption-by-sector, and GDP/GRP-by-sector tables in the
Appendix.
Table 3 shows the shift-share analysis for China’s energy intensity during the past ten years
(1995-2004). This country’s energy intensity continues to decrease from 1995 to 2001/2002,
from 163.25 to 98.3 kg of standard coal equivalent (SCE) per 100 Yuan. Its EI shows an
increasing trend in 2003 and 2004. In 2003, China’s EI increases by 6 EI units, while in 2004 this
increase is accelerated to 11 EI units. I note that the industrial mixes are all positive (except the
value of 1998) in these ten years. This indicates that China’s industrial structure in these ten
years actually increases its energy intensity. Also, this might suggest that it is hard for China to
reduce its energy intensity by changing its industrial structure. One explanation for the negative
industrial mix value of 1998 (-0.64) is that in 1998, China started its so-called “laid-off” reform,
duing which many employees of state-owned enterprises (SOEs) were laid off, and some old,
inefficient or unprofitable SOEs were closed, which had a great impact on China’s industrial
structure. Except for 2003 and 2004, the efficiency shift has played a role in decreasing energy

13
intensity. During this period, the efficiency shift accounts for the decrease of energy intensity,
while industrial mix mostly increases the energy intensity of China.
Table 3: Shift-share analysis of energy intensity in China's material production sector (kilograms of standard coal equivalent per 1000 Yuan of Output)
1995 1996 1997 1998 1999 2000 2001 2002 2003 2004
Constant share 163.25 160.74 138.44 123.21 115.31 108.54 98.30 98.38 104.35
Industrial mix 0.92 2.71 -0.64 0.95 2.39 0.34 0.34 1.10 0.29
Efficiency shift -3.42 -25.02 -14.59 -8.85 -9.16 -10.58 -0.26 4.88 10.77
Total EI 163.25 160.74 138.44 123.21 115.31 108.54 98.30 98.38 104.35 115.42
Source: calculated from related tables in the Appendix.
In the case of Inner Mongolia, the effect of efficiency shift is still significantly larger than that of
industrial mix (see Table 4 and Figure 2). In the past decade, the EI of Inner Mongolia has
decreased and then increased, fluctuating by roughly 200 EI units. Industrial mix, in general,
does not contribute to energy efficiency except in 1998 and 2000. In contrast, for most of the
years, the efficiency shift is negative, decreasing the energy intensity. This effect is especially
noticeable in 1996 and 1998. In the early 2000s, the effect of efficiency shift is relatively minute,
and in 2004, this effect on energy intensity actually is positive. Figure 2 shows an explicit
comparison between these two effects. Regardless of being negative or positive, the efficiency
shift always has a larger influence on the total EI than the industrial mix does, which matches the
trend at the national level discussed above.
Table 4: Shift-share analysis of energy intensity in Inner Mongolia’s material production sector, 1996-2004 (kilograms of standard coal equivalent per 1000 Yuan of Output)
1995 1996 1997 1998 1999 2000 2001 2002 2003 2004
Constant share 258.26 204.39 248.58 198.75 197.29 191.16 186.73 181.53 175.84

14
Industrial mix 10.06 6.77 -0.51 3.00 -2.36 2.06 1.13 1.62 12.50
Efficiency shift -63.93 37.42 -49.32 -4.45 -3.78 -6.50 -6.33 -7.31 32.19
Total EI 258.26 204.39 248.58 198.75 197.29 191.16 186.73 181.53 175.84 220.53
Source: calculated from related tables in the Appendix.
-80.00
-60.00
-40.00
-20.00
0.00
20.00
40.00
60.00
1996 1997 1998 1999 2000 2001 2002 2003 2004
Industrial mix Efficiency shift
Source: derived from Table4 Figure 2: Inner Mongolia’s industrial mix and efficiency shift, 1996-2004
Liaoning shows a constant decrease of energy intensity except in the year 2000, in which the EI
is slightly higher than the previous year then returning to a lower level. This indicates that this
province has made progress in improving its energy efficiency. Examining from the effects of
industrial mix and efficiency shift, we can easily find that its efficiency shift has been
continuously negative, while the industrial mix varies above and below zero. The efficiency shift
trend clearly tells that, Liaoning, in the past ten years, has introduced new energy technology or
other techniques that improve energy efficiency. In contrast to Inner Mongolia, Liaoning also
makes more progress in optimizing its industrial structure: in five of the nine years, the industrial

15
mix is negative. Still, efficiency shift has higher values than industrial mix, thus, it remains a
main force in changing energy intensity, as shown both in the table and the figure
Table 5: Shift-share analysis of energy intensity in Liaoning’s material production sector, 1996-2004 (kilograms of standard coal equivalent per 1000 Yuan of 0utput)
1995 1996 1997 1998 1999 2000 2001 2002 2003 2004
Constant share 276.39 218.62 208.69 167.77 148.65 150.86 140.38 132.56 128.40
Industrial mix -6.76 3.72 -5.47 1.32 5.16 -3.09 -1.35 0.50 -2.53
Efficiency shift -51.01 -13.65 -35.44 -20.44 -2.96 -7.39 -6.48 -4.66 -3.01
Total EI 276.39 218.62 208.69 167.77 148.65 150.86 140.38 132.56 128.40 122.86
Source: calculated from related tables in the Appendix.
-60.00
-50.00
-40.00
-30.00
-20.00
-10.00
0.00
10.00
1996 1997 1998 1999 2000 2001 2002 2003 2004
Industrial mix Efficiency shift
Source: derived from Table5 Figure 3: Liaoning’s industrial mix and efficiency shift, 1996-2004
For Ningxia Provicne, due to data unavailability, I have only five years’ data about shift and mix
effects. Based on the available information, I find that, as a whole, energy intensity climbed in
Ningxia Province from 1995 through 2004. Although its EI in 1996 decreases to 227.7 from
308.2 in 1995, the coming three years actually have increasing energy intensity. EI of 1997, 1998

16
and 1999 stays basically at the same level (around 240 EI units), and then in 2004, it soars to
427.6, almost doubling that of 1996. To go further, the efficiency shift does not stay constant,
changing between positive and negative. The years of 1996 and 2004 witness significant
negative efficiency shift compared to other years; meanwhile, the industrial mix also presents a
large trade-off with a positive effect on energy intensity. On the one hand, I infer that, Ningxia,
a relatively undeveloped region in China, has not improved its technology of utilizing energy
significantly in the past ten years. On the other hand, its industrial structure still remains
energy-intensive. I explain this in detail in the coming section.
Table 6: Shift-share analysis of energy intensity in Ningxia’s material production sector, 1996-2004 (kilograms of standard coal equivalent per 1000 Yuan of output)
1995 1996 1997 1998 1999 2000 2001 2002 2003 2004
Constant share 308.24 227.73 240.68 233.61 563.56
Industrial mix 10.06 0.48 -4.92 0.01 38.86
Efficiency shift -90.57 12.47 -2.15 7.58 -74.83
Total EI 308.24 227.73 240.68 233.61 241.20 427.60
Source: calculated from related tables in the Appendix.

17
-200.00
-150.00
-100.00
-50.00
0.00
50.00
1996 1997 1998 1999 2000 2001 2002 2003 2004
Industrial mix Efficiency shift
Source: derived from Table 6 Figure 4: Ningxia Province’s industrial mix and efficiency shift, 1996-2004
5. Energy investment, efficiency and renewable energy
In the previous section, I showed that the energy-efficiency shift is the main factor explaining the
change of energy intensity in China as a whole as well as in each of the three selected provinces.
As defined, I assume this efficiency effect is triggered by technological innovations. To help
understand the underlying factors causing the efficiency effect, I examine energy-technology
investments in China and in the three provinces.
Table 7 describes the investment in technology updates and transformation in the energy industry
by region in China. On average, China’s investment in this field has increased steadily in those
years, from 0.441 billion yuan in 1991 to 3.549 billion yuan in 2002, with an average annual
growth rate of 66.4%. Compared to this national average, both Inner Mongolia and Ningxia
Provinces have underinvested. Ningxia’s investment remains roughly at the level of 400 million
yuan during this period. Its investment in 2002 is only 367 Million Yuan, considering the factor

18
of deflation, lower than that of 1995, which is 353 million yuan. Ningxia has experienced a
long-term underinvestment in technical updates and transformation in energy industry. This
underinvestment naturally cannot contribute to increasing energy efficiency and can cause the
efficiency shift to be insignificant in decreasing energy intensity, which might well explain why
this province, unlike many provinces in China, has increasing energy intensity in the past ten
years. Inner Mongolia (Figure 5) also underinvests in technology during this period. Since 1996,
its investment has been always less than half that of the national average, and from 1996-2000,
Inner Mongolia invests about the same amount for technologies in the energy industry, around
700 million yuan (roughly 90 million US dollars). Inner Mongolia’s energy intensity basically
has remained constant or only slightly decreased during 1996 through 2003, which is shown by
this investment profile.
In contrast to the other two provinces, Liaoning Province, in general, has increased its annual
technology investment. In 1991, Liaoning Province invested only 1,160 million yuan for
technology innovation in the energy industry, but this value tripled to 3.75 billion yuan after four
years. Then, from 1995 to 2002, this investment continues to climb, reaching 9.2 billion yuan in
2002. The investments for years around 1998 stay almost the same or only slightly decrease,
which might be connected to the “laid-off” reform around 1998 when a lot of heavy industrial or
some other SOEs were shut down, which could lead to the non-increase in energy technology
investment. Figure 5 well illustrates this trend. For each year, Liaoning’s investment is more than
double that of the provincial average. These large amounts of investment benefit Liaoning
Provicne by decreasing its energy intensity remarkably. As discussed earlier, in 1995 Liaoning’s

19
energy intensity was 276.4 units, which was almost double that of the national value (163.4
units), but in 2004, Liaoning had decreased its EI to 122.86, very close to the national 115.42 EI
units. This achievement, although we cannot illustrate it strictly at this stage, can be reasonably
attributed to the continuously increasing investments in energy technology innovation in
Liaoning Province.
Table 7: Investment in technical updates and transformation in energy by region, 1991-2002, (100 million yuan, current price)
1991 1995 1996 1997 1998 1999 2000 2001 2002
National (provincial average*) 4.41 14.59 17.03 19.38 22.21 24.38 29.47 31.63 35.49
Inner Mongolia 3.55 13.82 6.93 6.49 6.38 7.85 7.84 9.31 17.05
Liaoning 11.60 37.51 48.92 65.92 65.18 62.77 71.39 84.49 91.94
Ningxia 1.88 3.53 3.95 5.15 5.12 4.00 3.97 3.96 3.67
Source: China Energy Statistics Yearbook (1992-2005) *: the average of 31 of China’s provinces and municipalities (not including Hong Kong, Macau and Taiwan), calculated from the national total divided by 31; 1992/1993/1994, and 2003/2004 data unavailable.
010
2030
4050
6070
8090
100
1991 1995 1996 1997 1998 1999 2000 2001 2002
Years
Amou
nt (1
00M
il C
NY)
National average(provincial level) Inner Mongolia Liao Ning Ning Xia
Source: derived from Table 7. Figure 5: Investment in technical updates & transformation in energy industry (edited from Table7)

20
However, these investments in the energy industry are not necessarily directed to renewable
energy development. Due to China’s long push and policy motivation for developing renewable
energy, I believe that these provinces have some renewable energy that might benefit from
technology investments and contribute to energy efficiency to a certain degree. In the following,
I discuss the development of renewable energy in these regions.
Unfortunately, due to data limitations, I cannot analyze in detail the renewable energy
development in the three provinces, but I can give a brief description about their general status
with respect to renewables. Ningxia Province, based on its geographic location, has a good
potential of developing the solar industry. Its solar industry development dates to 1970s, with
technologies including solar stoves, solar water heaters, solar-powered houses, and household
solar PV systems. Yinchuan, the capital of Ningxia, ranks the 3rd, after Lasha and Hohhot,
among all the 31 capital cities in China in terms of solar power potential capacity. San (2004)
shows that the 2003-2010 planning of Ningxia solar power utilization will reduce annual energy
consumption by 432,000 Tonnes of Coal Equivalent (TCE), about 5% of its 2004 coal
consumption. However, the investment in the solar industry is still minimal: government
investment for rural energy has accumulatively amounted only to 28 million RMB (about 3.7
million USD) up to 2003. Although having a relatively long history, the solar industry, the main
renewable industry in Ningxia, remains at its infant stage, and its minimal scale keeps it from
playing a noticeable role in bringing energy technology innovation or reducing energy intensity.
Inner Mongolia has the largest wind power potential in China. Up to 2005, the total capacity of
wind power was 166,000kwh (kilowatt hours), the top one in China. However, only 1% of this

21
potential has been developed so far. Up to 2004, there were 158,000 mini wind turbines, which
supply 150,000 households with electricity. In 2010, this wind capacity will reach 4,000,000kwh,
about 25 times that of 2005. However, even this planned amount, only accounts for 0.0075% of
the electricity consumption by Inner Mongolia in 2004, which is 53.6 billion kwh. Apparently,
although Inner Mongolia has a well-developed wind-power industry, it is still too little to
contribute to its energy efficiency.
Due to the data unavailability for Liaoning Province, I cannot discuss much about its renewable
energy industry. Renewable energy is less developed compared to the other two provinces.
Although the provincial government issued some policies and laws, on the one hand, these
regulations mainly affect renewable development in rural areas, and the scale is minimal. On the
other hand, things are changing. In Liaoning Province, energy conservation and developing
renewable energy were on the agenda in the provincial 11th Five-Year Plan (Liaoning, 2006).
6. Industrial structure
To play a role in decreasing energy efficiency, officials need to promote the renewable energy
industry more than they do at present. The minimal scale of renewable energy in the provinces
explains why this industry cannot show the expected effect of improving energy efficiency.
Althoguh Investments in energy technology updates and transformation help analysts understand
why there is a difference in the energy-shift effect among these provinces, I note that the
industrial mix usually plays a minimal role in changing energy intensity.
As mentioned before, the coal industries, energy-intensive sectors, are the main force driving the

22
Inner Mongolian and Ningxia economies, and in Liaoning Province, the energy-intensive steel
industry, plays a similar role. Table 8 shows two supporting companies in Inner Mongolia and
Ningxia, Shenhua and Ningxia Coal. Each of them is regarded as the main power fueling the
GDP growth in the host province. As the economy relies on these energy-intensive industries for
growth, it may face internal challenges of adjusting the industrial structure to a better level for
decreasing energy intensity. To understand the importance of such a company, for example,
Shenhua Corporation, we can compare it with Peabody, the largest coal company in the United
States, which made a total revenue of 3.6 billion USD in 2004. Shenhua’s 2004 revenue was 56.5
billion Yuan, about 7 billion USD, almost double that of Peabody.
Table 8: Shenhua and Ningxia Coal
Rank Corporation Assets (billion RMB)
Proved Reserve (billion tonnes)
Annual coal production (million tonnes)
Province
1 Shenhua Corporation 188.8 > 223.6 121 Inner Mongolia
8 Ningxia Coal Corporation 25.1 24.1 33 Ningxia
Source: Multiple, edited by the author
Note: Ningxia Coal Corporation merged with Shenhua in 2006.
7. Conclusion and discussion
Conducting a shift-share analysis, I have proved my hypothesis proposed at the first section. My
analysis shown that the energy-efficiency shift, the key ‘other’ factor rather than the development
of renewable energy, plays a main role in changing the energy intensity of China, and three of its
provinces (Inner Mongolia, Liaoning, and Ningxia) from 1995-2004. Although Liaoning
province has a heavy industry base, it still decreases its energy intensity during those years. Inner

23
Mongolia and Ningxia, although having better developed renewable industry than Liaoning,
have experienced flat or increases in energy intensity. Renewable energy development
supposedly brings in new energy technology that can decrease energy intensity, but this does not
appear to occur in Inner Mongolia and Ningxia. This can be mostly explained by the minimal
scale of this industry in both regions. I show that technical update and transformation
investments in the energy industry can partially explain the effect of efficiency shift in the three
study provinces.
However, due to the data limitations, I cannot at present understand the exact role of renewable
energy development in China and, in particular, in these three provinces. This prevents me from
examining what exactly renewable energy industry has brought to technology innovation. This
remains a problem for future research.
Another puzzle also occurs. The fact that the energy-intensive coal industry remains a base
industry for both Inner Mongolia and Ningxia seems to explain partially why they cannot realize
an energy-intensity decrease. However, Shanxi, the largest coal production province in China,
has decreased its energy intensity successfully in the past decades (Polenske 2007). Then, why
can Shanxi Province do this while Inner Mongolia and Ningxia cannot? This can also be a
question for future research. Both questions call for field trips to China to collect data and to
interview companies and government officials to find appropriate information.

24
Appendix
Note1.
All these data come from China Energy Statistics Yearbook 1996-2005, and China Statistical
Yearbook 1996-2005.
Note2.
Energy consumption data are edited by the author from China Energy Statistics Yearbook
1996-2005. The total consumption is composed of the following ten sub-categories and is
the sum of these ten after converting into standard coal equivalent via calorific value
calculation: (1) coal total, (2) coke, (3) coke-oven gas, (4) other gas, (5) other coking
products, (6) petroleum products total, (7) natural gas, (8) heat, (9) electricity, and (10) other
energy.
These data tables with sub-categories are not attached here but are available upon request
from the author.
Note3.
Sectors:
1. Farming, Forestry, Animal Husbandry, Fishery, & Water Conservancy
2. Industry
3. Construction
4. Transportation,Storage, Postal, &Telecommunications Services
5. Wholesale, Retail Trade, & Catering Service
6. Residential consumption
7. Others
67. Sum of 6 and 7 to match the classification of GDP/GRP sectors
25
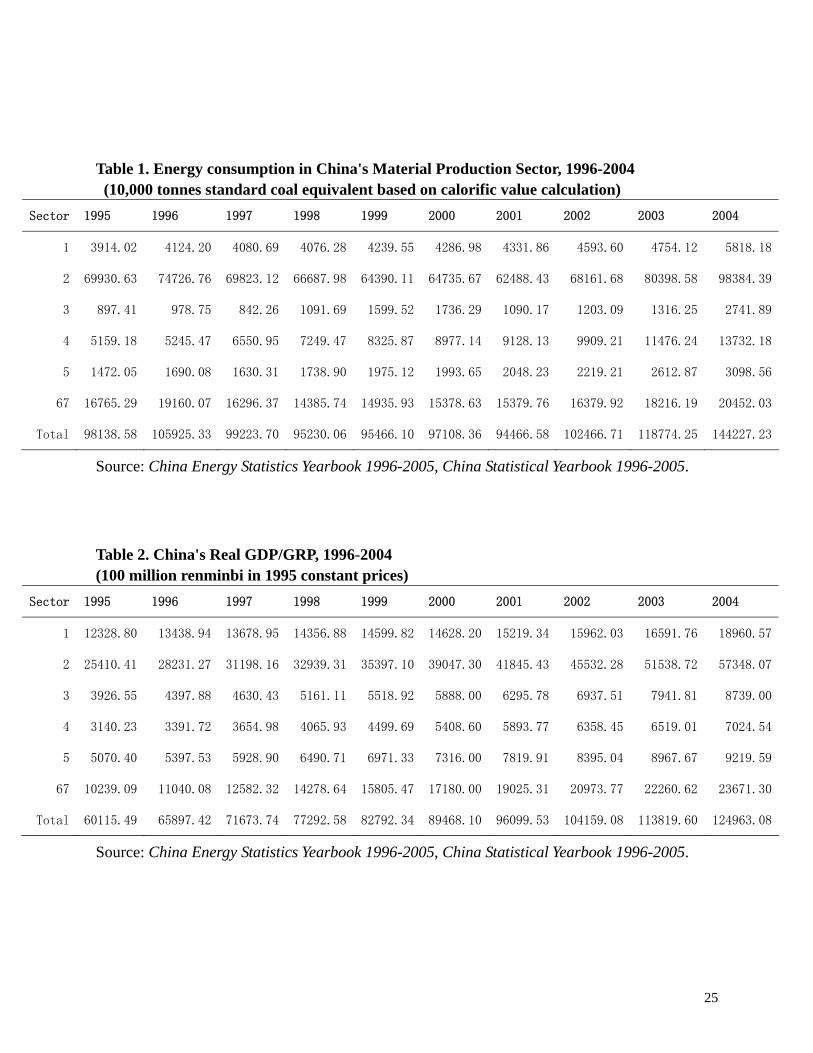
Table 1. Energy consumption in China's Material Production Sector, 1996-2004 (10,000 tonnes standard coal equivalent based on calorific value calculation)
Sector 1995 1996 1997 1998 1999 2000 2001 2002 2003 2004
1 3914.02 4124.20 4080.69 4076.28 4239.55 4286.98 4331.86 4593.60 4754.12 5818.18
2 69930.63 74726.76 69823.12 66687.98 64390.11 64735.67 62488.43 68161.68 80398.58 98384.39
3 897.41 978.75 842.26 1091.69 1599.52 1736.29 1090.17 1203.09 1316.25 2741.89
4 5159.18 5245.47 6550.95 7249.47 8325.87 8977.14 9128.13 9909.21 11476.24 13732.18
5 1472.05 1690.08 1630.31 1738.90 1975.12 1993.65 2048.23 2219.21 2612.87 3098.56
67 16765.29 19160.07 16296.37 14385.74 14935.93 15378.63 15379.76 16379.92 18216.19 20452.03
Total 98138.58 105925.33 99223.70 95230.06 95466.10 97108.36 94466.58 102466.71 118774.25 144227.23
Source: China Energy Statistics Yearbook 1996-2005, China Statistical Yearbook 1996-2005. Table 2. China's Real GDP/GRP, 1996-2004 (100 million renminbi in 1995 constant prices)
Sector 1995 1996 1997 1998 1999 2000 2001 2002 2003 2004
1 12328.80 13438.94 13678.95 14356.88 14599.82 14628.20 15219.34 15962.03 16591.76 18960.57
2 25410.41 28231.27 31198.16 32939.31 35397.10 39047.30 41845.43 45532.28 51538.72 57348.07
3 3926.55 4397.88 4630.43 5161.11 5518.92 5888.00 6295.78 6937.51 7941.81 8739.00
4 3140.23 3391.72 3654.98 4065.93 4499.69 5408.60 5893.77 6358.45 6519.01 7024.54
5 5070.40 5397.53 5928.90 6490.71 6971.33 7316.00 7819.91 8395.04 8967.67 9219.59
67 10239.09 11040.08 12582.32 14278.64 15805.47 17180.00 19025.31 20973.77 22260.62 23671.30
Total 60115.49 65897.42 71673.74 77292.58 82792.34 89468.10 96099.53 104159.08 113819.60 124963.08
Source: China Energy Statistics Yearbook 1996-2005, China Statistical Yearbook 1996-2005.

26
Table 3. Energy consumption in Inner Mongolia’s Material Production Sector, 1996-2004 (10,000 tonnes standard coal equivalent based on calorific value calculation)
Sector 1995 1996 1997 1998 1999 2000 2001 2002 2003 2004
1 87.46 117.64 136.73 120.71 118.13 126.59 154.56 159.42 184.66 216.67
2 1381.03 1363.18 1780.24 1529.41 1798.66 1969.51 2116.30 2326.02 2766.82 3605.16
3 35.85 46.05 63.97 62.28 53.09 54.82 50.85 57.52 68.69 88.11
4 150.86 154.17 184.36 187.11 137.29 144.16 149.75 164.12 174.14 329.35
5 62.81 89.23 122.86 105.83 100.68 89.29 89.12 93.26 106.39 252.77
67 269.93 341.28 443.20 390.28 326.78 293.79 308.60 322.95 369.79 1150.06
Total 1987.95 2111.54 2731.36 2395.63 2534.62 2678.16 2869.18 3123.29 3670.48 5642.12
Source: China Energy Statistics Yearbook 1996-2005, China Statistical Yearbook 1996-2005.
Table 4. Inner Mongolia’s Real GDP/GRP, 1996-2004
(100 million Renminbi in 1995 constant prices)
Sector 1995 1996 1997 1998 1999 2000 2001 2002 2003 2004
1 235.39 328.17 323.78 345.37 347.37 350.80 356.75 371.71 407.79 477.40
2 232.51 338.36 375.80 403.80 433.90 455.21 503.67 568.74 700.44 958.11
3 63.00 67.94 71.44 80.99 88.26 101.07 119.07 153.81 244.96 298.86
4 60.46 87.52 98.43 107.21 118.16 142.59 161.82 186.59 210.41 229.19
5 54.35 74.62 80.59 96.54 104.33 133.45 147.30 162.82 175.49 191.84
67 124.04 136.49 148.75 171.46 192.67 217.89 247.97 276.86 348.31 403.01
Total 769.75 1033.11 1098.79 1205.37 1284.69 1401.01 1536.57 1720.53 2087.40 2558.41
Source: China Energy Statistics Yearbook 1996-2005, China Statistical Yearbook 1996-2005.

27
Table 5. Energy consumption in Liaoning’s Material Production Sector (10,000 tonnes standard coal equivalent based on calorific value calculation)
Sector 1995 1996 1997 1998 1999 2000 2001 2002 2003 2004
1 128.50 147.32 145.53 144.88 148.41 143.18 148.09 145.83 144.75 151.08
2 5938.14 5454.32 5540.41 5011.22 4759.76 5483.66 5251.18 5411.11 5837.28 6005.13
3 45.86 40.98 68.96 64.79 64.19 65.67 68.13 68.75 73.53 77.91
4 245.12 195.10 304.37 290.10 289.98 442.32 653.91 637.74 594.25 635.94
5 61.41 67.15 49.53 51.00 54.92 58.61 62.95 66.77 69.47 99.96
67 984.55 1056.68 1015.11 852.90 877.94 850.21 881.23 985.58 943.30 1140.78
Total 7403.59 6961.56 7123.91 6414.89 6195.21 7043.64 7065.49 7315.78 7662.58 8110.80
Source: China Energy Statistics Yearbook 1996-2005, China Statistical Yearbook 1996-2005. Table 6. Liaoning’s Real GDP/GRP (100 million Renminbi in constant 1995 prices)
Sector 1995 1996 1997 1998 1999 2000 2001 2002 2003 2004
1 347.05 478.09 474.76 523.50 520.28 503.44 544.44 596.76 612.24 739.57
2 1207.67 1390.71 1533.26 1639.11 1793.91 2114.89 2190.12 2357.89 2542.04 2721.37
3 162.31 159.95 172.45 188.31 205.56 229.51 250.43 280.99 340.09 428.33
4 174.31 196.20 219.13 267.88 314.17 350.46 394.50 430.14 492.81 588.88
5 312.95 394.55 428.72 525.16 575.20 631.64 696.51 768.72 798.57 860.70
67 474.38 564.84 585.37 679.60 758.39 839.12 957.08 1084.43 1182.10 1263.03
Total 2678.68 3184.34 3413.69 3823.56 4167.52 4669.06 5033.08 5518.93 5967.85 6601.86
Source: China Statistics Yearbook, 1996-2005.
28
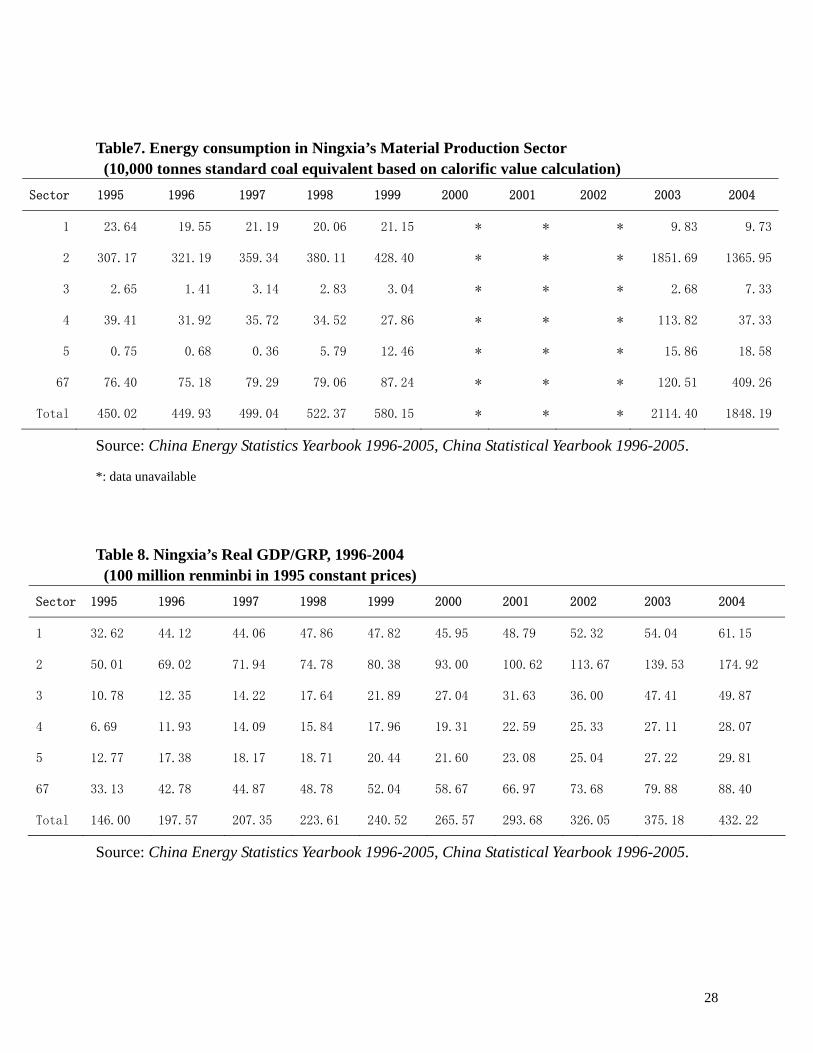
Table7. Energy consumption in Ningxia’s Material Production Sector (10,000 tonnes standard coal equivalent based on calorific value calculation)
Sector 1995 1996 1997 1998 1999 2000 2001 2002 2003 2004
1 23.64 19.55 21.19 20.06 21.15 * * * 9.83 9.73
2 307.17 321.19 359.34 380.11 428.40 * * * 1851.69 1365.95
3 2.65 1.41 3.14 2.83 3.04 * * * 2.68 7.33
4 39.41 31.92 35.72 34.52 27.86 * * * 113.82 37.33
5 0.75 0.68 0.36 5.79 12.46 * * * 15.86 18.58
67 76.40 75.18 79.29 79.06 87.24 * * * 120.51 409.26
Total 450.02 449.93 499.04 522.37 580.15 * * * 2114.40 1848.19
Source: China Energy Statistics Yearbook 1996-2005, China Statistical Yearbook 1996-2005.
*: data unavailable
Table 8. Ningxia’s Real GDP/GRP, 1996-2004 (100 million renminbi in 1995 constant prices)
Sector 1995 1996 1997 1998 1999 2000 2001 2002 2003 2004
1 32.62 44.12 44.06 47.86 47.82 45.95 48.79 52.32 54.04 61.15
2 50.01 69.02 71.94 74.78 80.38 93.00 100.62 113.67 139.53 174.92
3 10.78 12.35 14.22 17.64 21.89 27.04 31.63 36.00 47.41 49.87
4 6.69 11.93 14.09 15.84 17.96 19.31 22.59 25.33 27.11 28.07
5 12.77 17.38 18.17 18.71 20.44 21.60 23.08 25.04 27.22 29.81
67 33.13 42.78 44.87 48.78 52.04 58.67 66.97 73.68 79.88 88.40
Total 146.00 197.57 207.35 223.61 240.52 265.57 293.68 326.05 375.18 432.22
Source: China Energy Statistics Yearbook 1996-2005, China Statistical Yearbook 1996-2005.

29
References:
Bendavid-Val, Avrom. 1991. 4th Ed. Regional and Local Economic Analysis for Practitioners. New York, NY: Praeger Publishers. 67-85.
SSB & NDRC (State Statistical Bureau and National Development and Reform Commission of P.R. China). China Energy Statistical Yearbook (CESY) 1996-2005 (multiple years). China Statistics Press. Including:
CESY. 1995/1996. CESY. 1997-1999. CESY. 2000-2002. CESY. 2003. CESY. 2004. CESY. 2005. Fisher-Vanden, Karen, Jefferson Gray H., Hongmei Liu, and Quan Tao. 2004. “What is driving China’s decline in
energy intensity?” Resource and Energy Economics 26: 77-97.
Gao, Hu, Zhongying Wang and Yongqiang Zhao. 2005. “Renewable Energy Options in improving the life of western rural poor population in China”. Energy Research Institute of National Development and Reform Commission of China.
Garbaccio, R.F., M.S. Ho, D. W. Jorgenson. 1999. “Why has the energy-output ratio fallen in China?” Energy Journal. 20: 63–91.
Liaoning (Liaoning Government Official Website). 2006. URL: http://www.ln.stats.gov.cn/jrln/gy.htm.
Lin, Xinnuan, and Karen R. Polenske. 1995. “Input–output anatomy of China’s energy use changes in the 1980s”. Economics System Research. 7: 67–84.
Ma, Qizhi. 2006. URL: http://www.cctd.com.cn/detail/06/01/02/00055780/content.html .
Martinot, Eric. 2001a. “Renewable energy investment by the World Bank”. Energy Policy. 29: 689-699.
Martinot, Eric. 2001b. “World Bank energy projects in China: influences on environmental protection”. Energy Policy. 29: 581-594.
Moniz, Ernest J., and John Deutch. 2007. “The Future of Coal”. MIT Laboratory for Energy and the Environment. URL: http://web.mit.edu/coal
North News. 2006. “Inner Mongolia ranks NO. 1 in the wind power in China. March 21st 2006”. URL: http://www.newenergy.com.cn
NREL (National Renewable Energy Laboratory). 1999. “Rneweable energy markets in China: an analysis of renewable energy markets in Guangdong, Jiangxi, Jilin, and Yunnan provinces with updated information from Beijing”. URL: http://www.doe.gov/bridge
NREL. 2004a. “Renewable Energy Policy in China: Review”. URL: http://www.nrel.gov/China
NREL. 2004b. “China’s plan for renewable energy”. URL: http://www.nrel.gov/China
NREL. 2006. “Developing renewable energy in China”. URL: http://www.nrel.gov/China

30
PDO (People’s Daily Online). 2005. “Inner Mongolia to double annual coal output by 2010”. URL: http://english.people.com.cn/200512/27/eng20051227_231175.html.
Polenske, Karen R., and Xinnuan Lin. 1993. “Conserving energy to re-duce carbon dioxide emission in China”. Structural Change and Economic Dynamic. 4(2): 249-265.
Polenske, Karen R., and Francis C. McMichael. 2002. “A Chinese coke-making processing-flow model for energy and environmental analysis”. Energy policy 30: 865-883.
Polenske, Karen R. 2007. “Comparative and competitive energy strategies: Brazil and China”. MIT SPURS/Humphrey Program Presentation, March 19 2007.
San, Jianren. 2004. “The countermeasure analysis and exploration and utilization of solar energy in Ningxia”. URL: http://www.newenergy.com.cn/html/2007-1/2007126_13040_1.html
SEPA (State Envirnonment Protection Administration of China). 2004. “The green technology: coal gasification”. URL: http://www.chinaeol.net/bell-green/xsyj/0402pdf/mqh.pdf
Sinton, J.E., M.D. Levine, 1994. “Changing energy intensity in Chinese industry: the relative importance of structural shift and intensity change”. Energy Policy. 22: 239–255.
Smil, V. 1990. “China’s Energy”. Report Prepared for the U.S. Congress, Office of Technology Assessment, Washington, DC.
SSB (State Statistical Bureau), 1996. China Statistical Yearbook. China Statistical Publishing House, Beijing. URL: http://www.stats.gov.cn/english/statisticaldata/yearlydata/
SSB, 1997. China Statistical Yearbook. China Statistical Publishing House, Beijing.
SSB, 1998. China Statistical Yearbook. China Statistical Publishing House, Beijing.
SSB, 1999. China Statistical Yearbook. China Statistical Publishing House, Beijing.
SSB, 2000. China Statistical Yearbook. China Statistical Publishing House, Beijing.
SSB, 2001. China Statistical Yearbook. China Statistical Publishing House, Beijing.
SSB, 2002. China Statistical Yearbook. China Statistical Publishing House, Beijing.
SSB, 2003. China Statistical Yearbook. China Statistical Publishing House, Beijing.
SSB, 2004. China Statistical Yearbook. China Statistical Publishing House, Beijing.
SSB, 2005. China Statistical Yearbook. China Statistical Publishing House, Beijing.
Wang, Joy H. 2005. “Wind power in China: social acceptability and development of a domestic manufacturing industry”. Working paper, Michigan State University.
Zhang, Zhongxiang. 2003. “Why did the energy intensity fall in China’s industrial sector in the 1990s?” Energy Economics. 25: 625-638.
21 Century Economics. 2005. “The sample of Inner Mongolia: the energy-based pattern changes China’s layout of regional economics”. August 17th 2005.