energy systems. carbon/capita trends in carbon-intensity and energy-intensity
TRANSCRIPT
ENERGY SYSTEMS
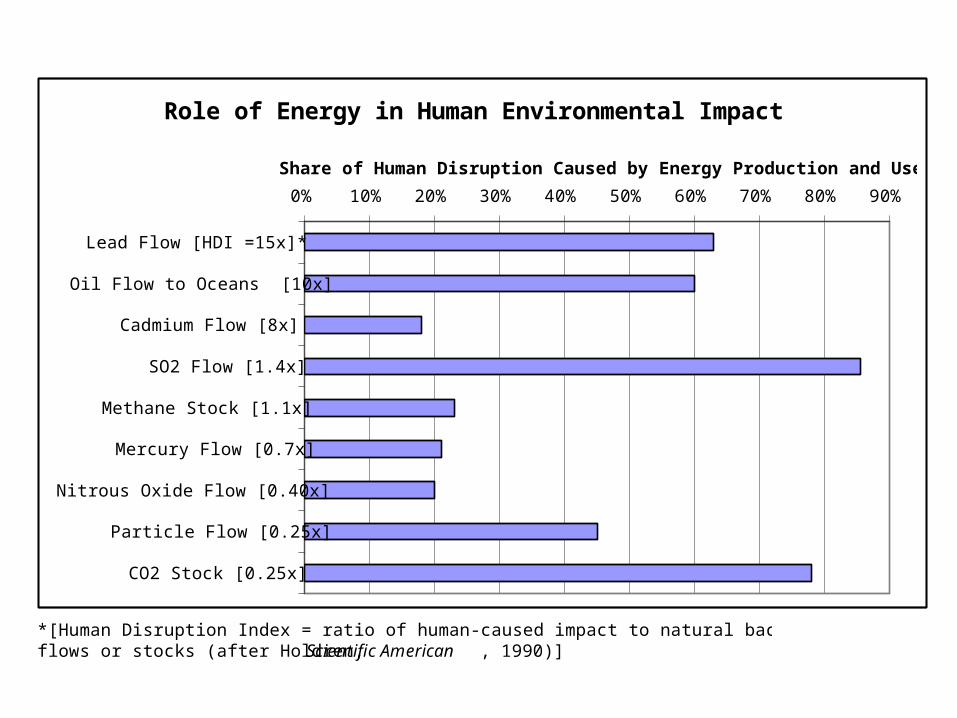
Role of Energy in Human Environmental Impact
0% 10% 20% 30% 40% 50% 60% 70% 80% 90%
Lead Flow [HDI =15x]*
Oil Flow to Oceans [10x]
Cadmium Flow [8x]
SO2 Flow [1.4x]
Methane Stock [1.1x]
Mercury Flow [0.7x]
Nitrous Oxide Flow [0.40x]
Particle Flow [0.25x]
CO2 Stock [0.25x]
Share of Human Disruption Caused by Energy Production and Use
*[Human Disruption Index = ratio of human-caused impact to natural background flows or stocks (after Holdren, Scientific American , 1990)]

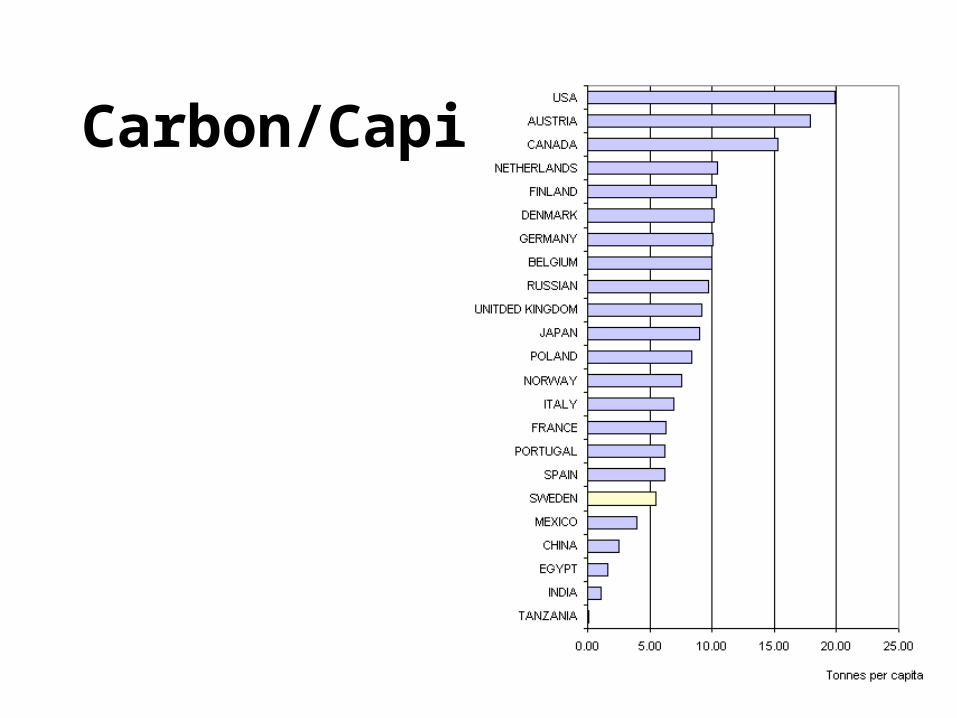
Carbon/Capita
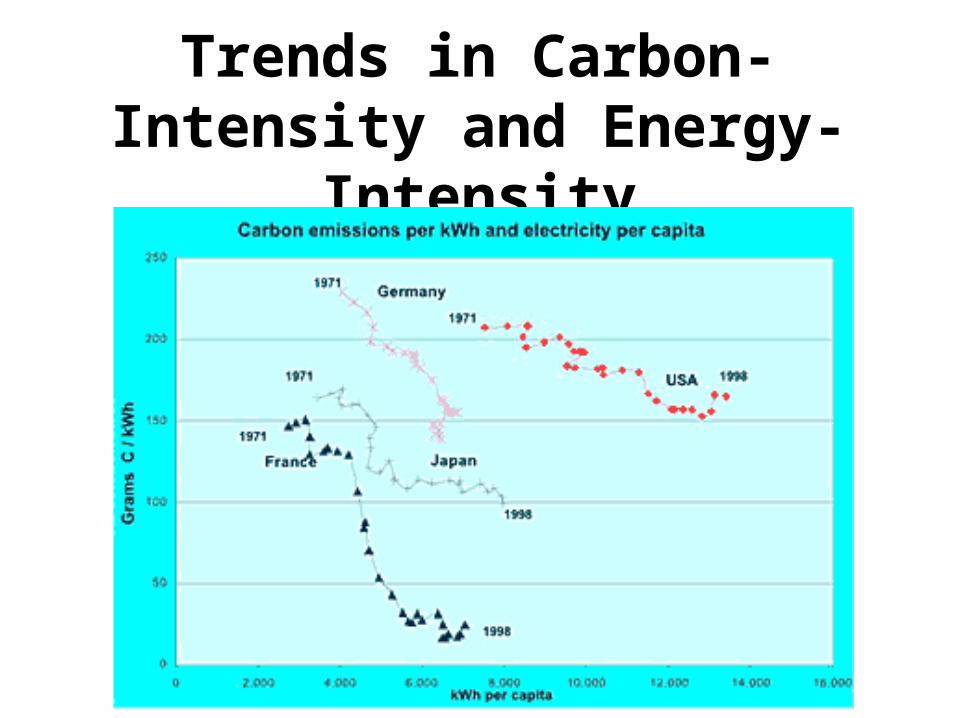
Trends in Carbon-Intensity and Energy-Intensity
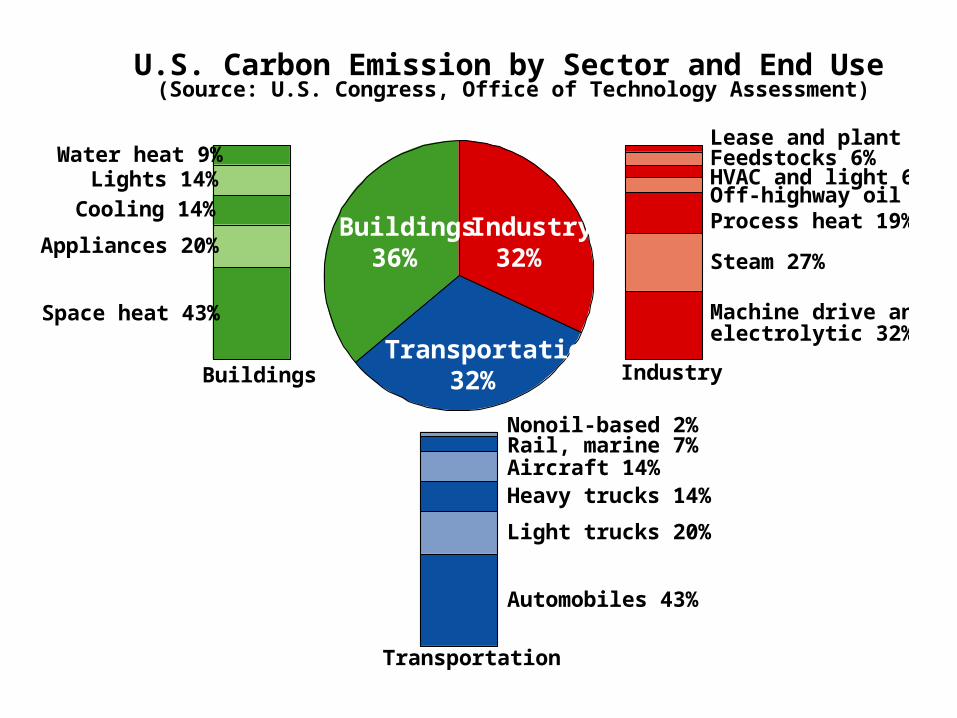
Industry32%
Buildings36%
Transportation32%
Machine drive and electrolytic 32%
Steam 27%
Process heat 19%
HVAC and light 6%Off-highway oil 7%
Feedstocks 6%Lease and plant 3%
Nonoil-based 2%Rail, marine 7%Aircraft 14%Heavy trucks 14%
Light trucks 20%
Automobiles 43%
Water heat 9%Lights 14%
Cooling 14%
Appliances 20%
Space heat 43%
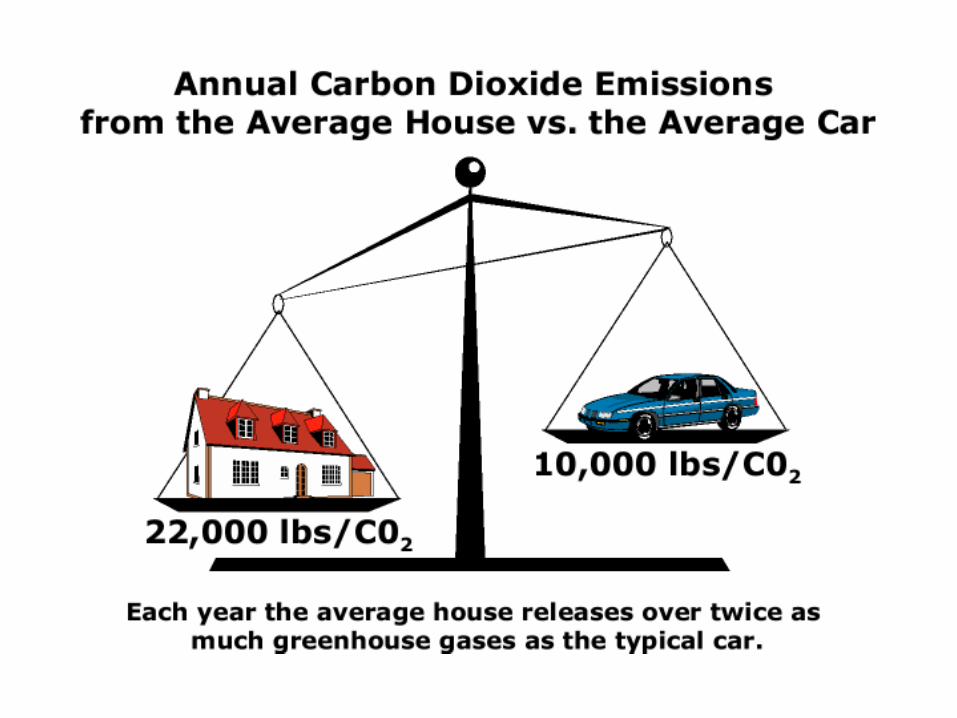
U.S. Carbon Emission by Sector and End Use(Source: U.S. Congress, Office of Technology Assessment)
Buildings Industry
Transportation
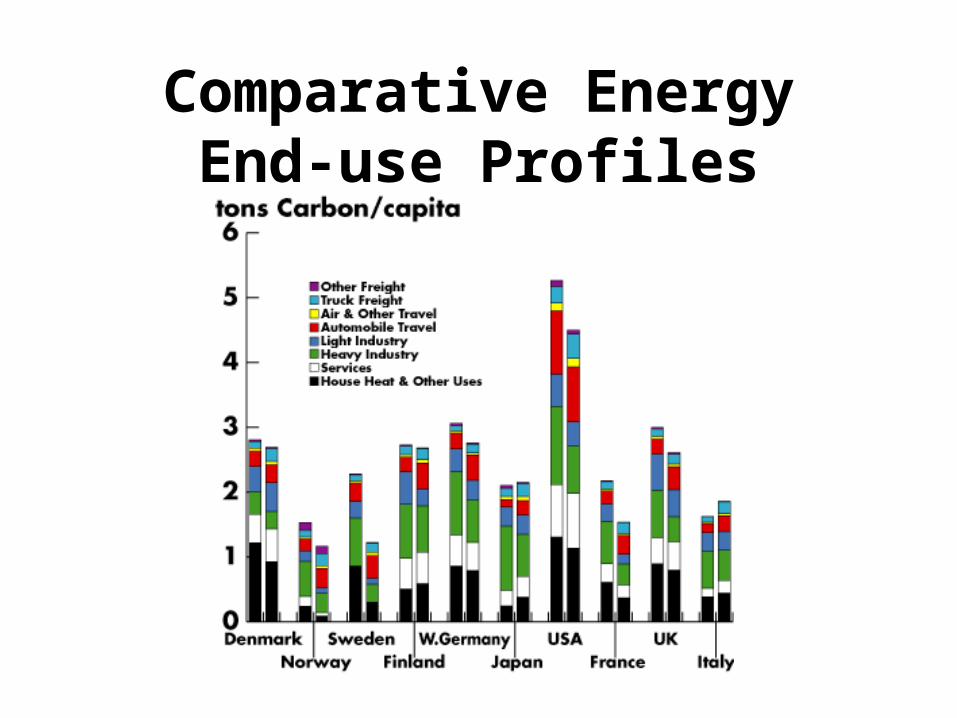
Comparative Energy End-use Profiles

Unit Conversions1. Convert raw energy to common units (millions of BTUs, MBTU):
• a. _________kWh x 3413 BTU/kWh x 1 MBTU/1,000,000 BTU
• b. _________Therms x 100,000 BTU/therm x 1 MBTU/1,000,000 BTU
• c. _________Gallons Oil x 138,095 BTU/gallon x 1 MBTU/1,000,000 BTU
d. _________ Gallons LPG x 95,500 BTUs/gallon x 1 MBTU/1,000,000 BTU
2. Convert MBTU of energy to greenhouse-gas emissions (pounds of carbon dioxide, CO2)
• a. 1.2 lbs CO2/kWh x 1 kWh/0.003413 MBTU x ______ MBTU of electricity
• b. 12 lbs CO2/therm x 1 therm/0.1 MBTU x ______ MBTU of natural gas
• c. 22.384 lbs CO2/gallon oil x 1 gallon/0.138095 MBTU x ______ MBTU of heating oil
• d. 12.805 lbs CO2/gallon LPG x 1 gallon/0.0955 MBTU x ______ MBTU of LPG
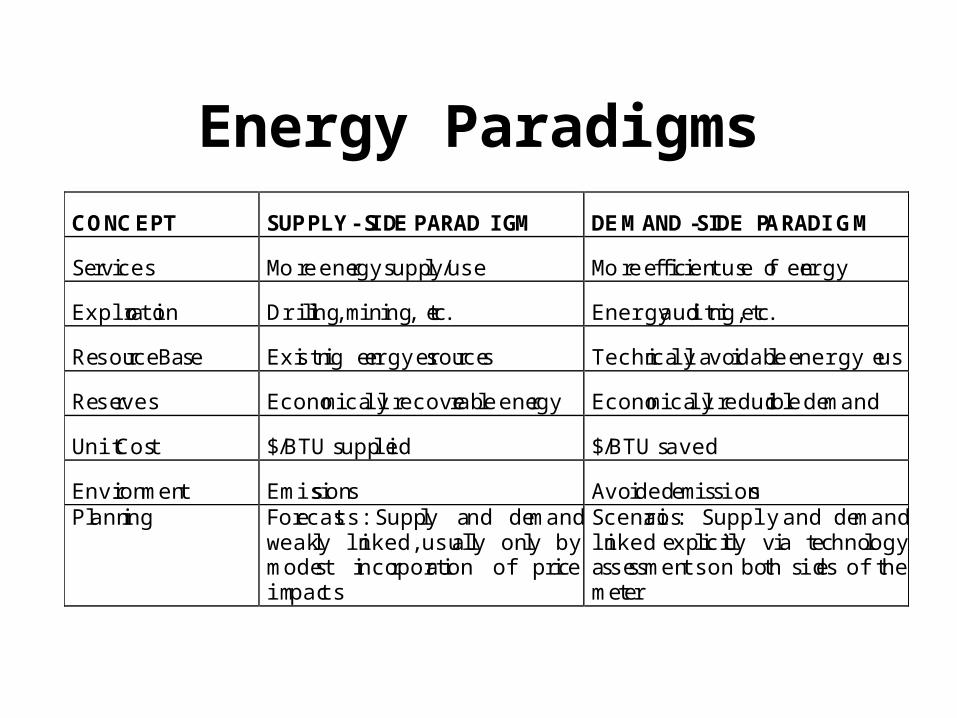
Energy Paradigms
CONCEPT SUPPLY-SIDE PARADIGM DEMAND-SIDE PARADIGM
Services More energy supply/use More efficient use of energy
Exploration Drilling, mining, etc. Energy auditing, etc.
Resource Base Existing energy resources Technically avoidable energy use
Reserves Economically recoverable energy Economically reducible demand
Unit Cost $/BTU supplied $/BTU saved
Environment Emissions Avoided emissionsPlanning Forecasts: Supply and demand
weakly linked, usually only bymodest incorporation of p riceimpacts
Scenarios: Supply and demandlinked explicitly via technologyassessments on both sides of themeter
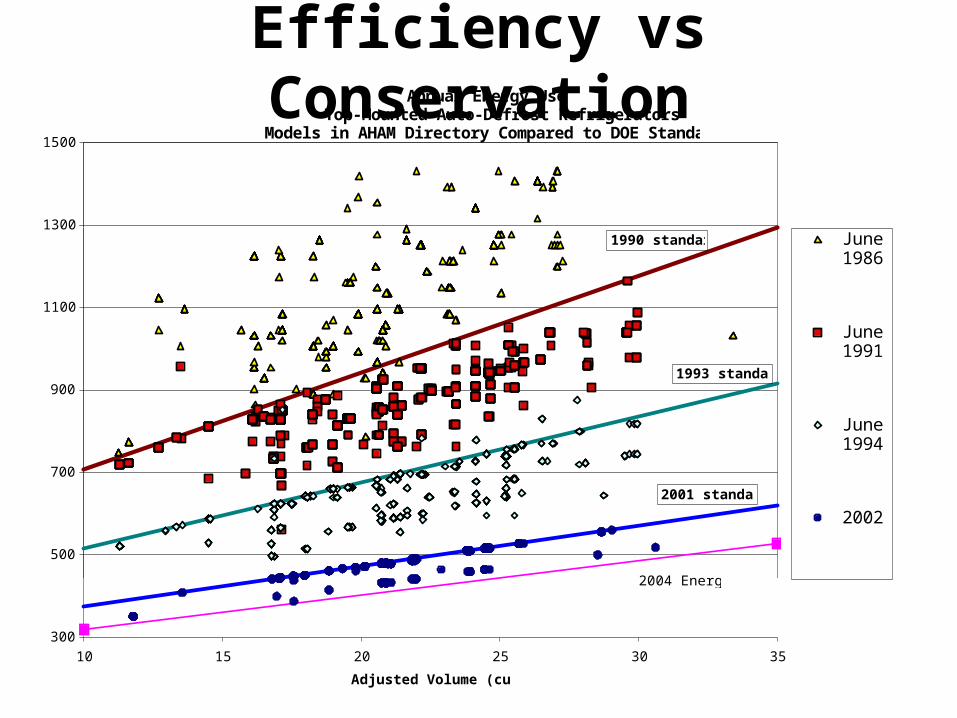
Efficiency vs ConservationAnnual Energy Use
Top-Mounted Auto-Defrost Refrigerators Models in AHAM Directory Compared to DOE Standards
300
500
700
900
1100
1300
1500
10 15 20 25 30 35
Adjusted Volume (cu.ft.)
An
nu
al E
ner
gy
Use
(kW
h/y
r)
June1986
June1991
June1994
2002
Energy Star2004(15%less)
1990 standard
1993 standard
2001 standard
2004 Energy
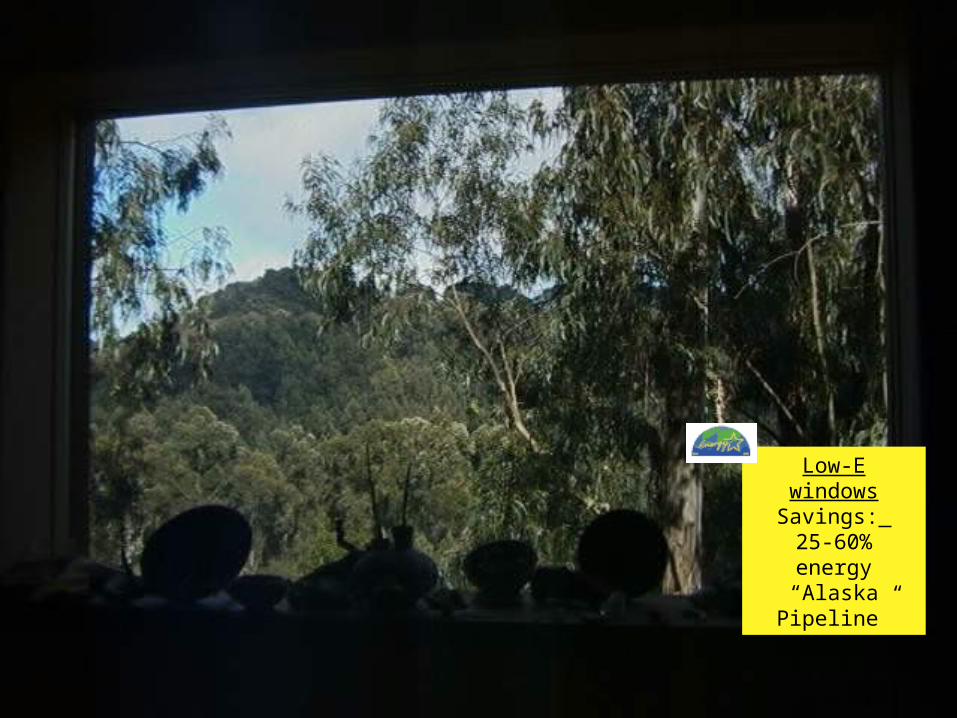
Low-E windowsSavings:
25-60% energy“Alaska Pipeline”
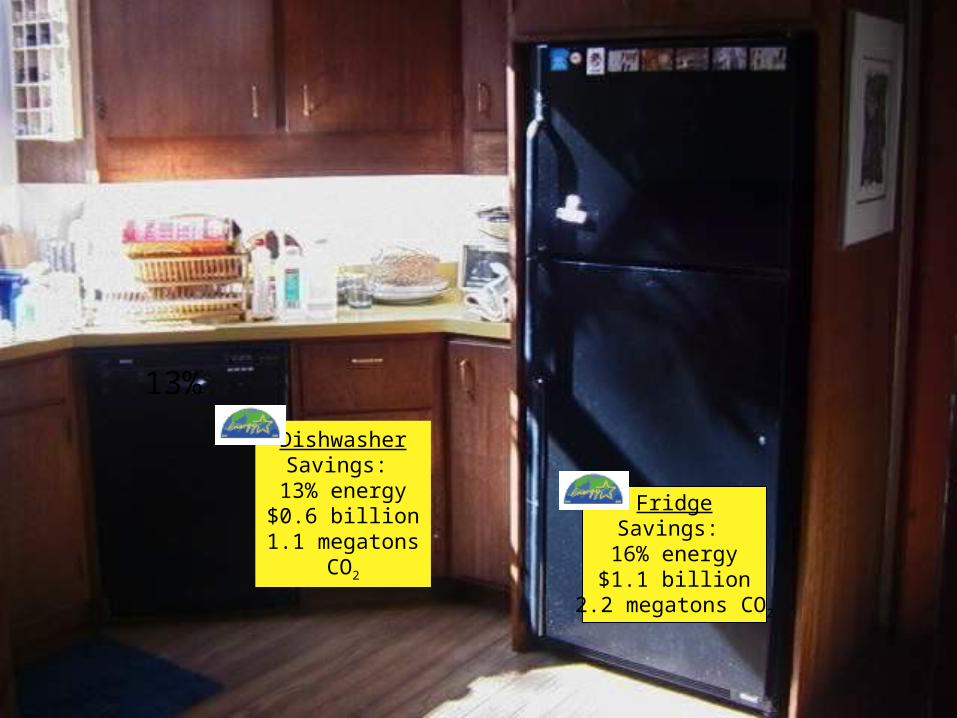
13%
DishwasherSavings:
13% energy$0.6 billion
1.1 megatons CO2
FridgeSavings:
16% energy$1.1 billion
2.2 megatons CO2

Compact FluorescentSavings:
75% energy$8.2 billion
21 megatons CO2
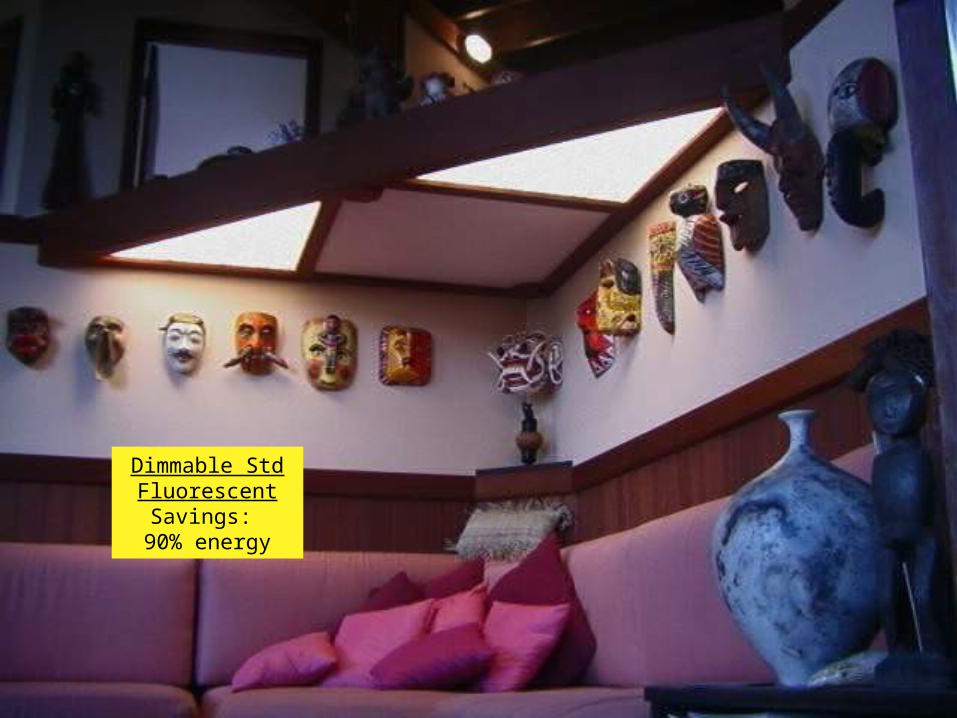
Dimmable Std FluorescentSavings:
90% energy

Flat Screen DisplaySavings:
50% energy$11 billion
31 megatons CO2
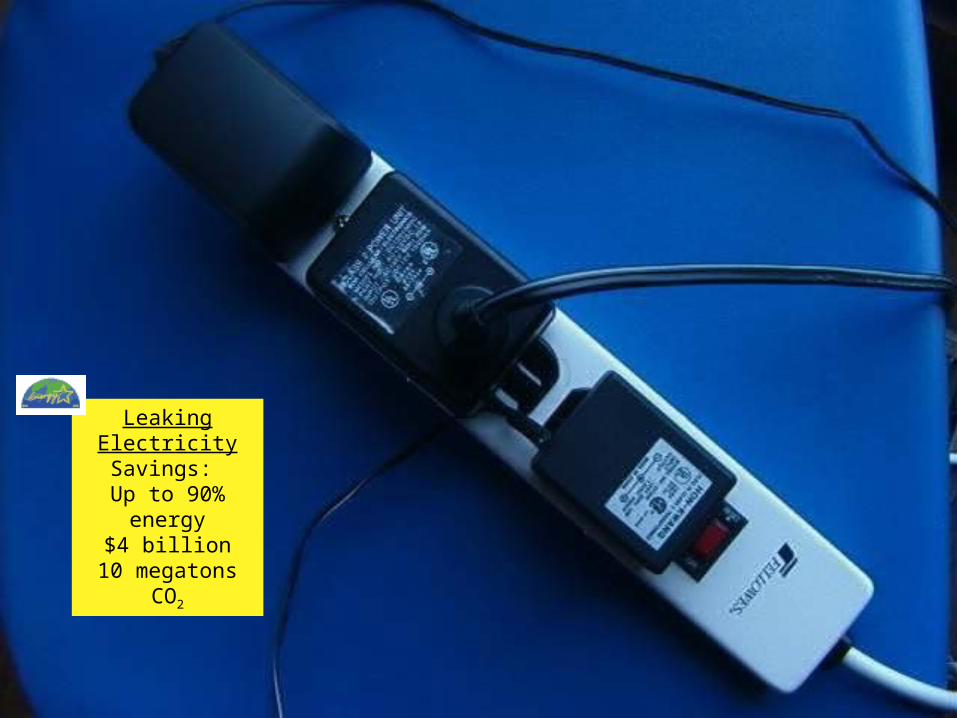
Leaking ElectricitySavings:
Up to 90% energy$4 billion
10 megatons CO2
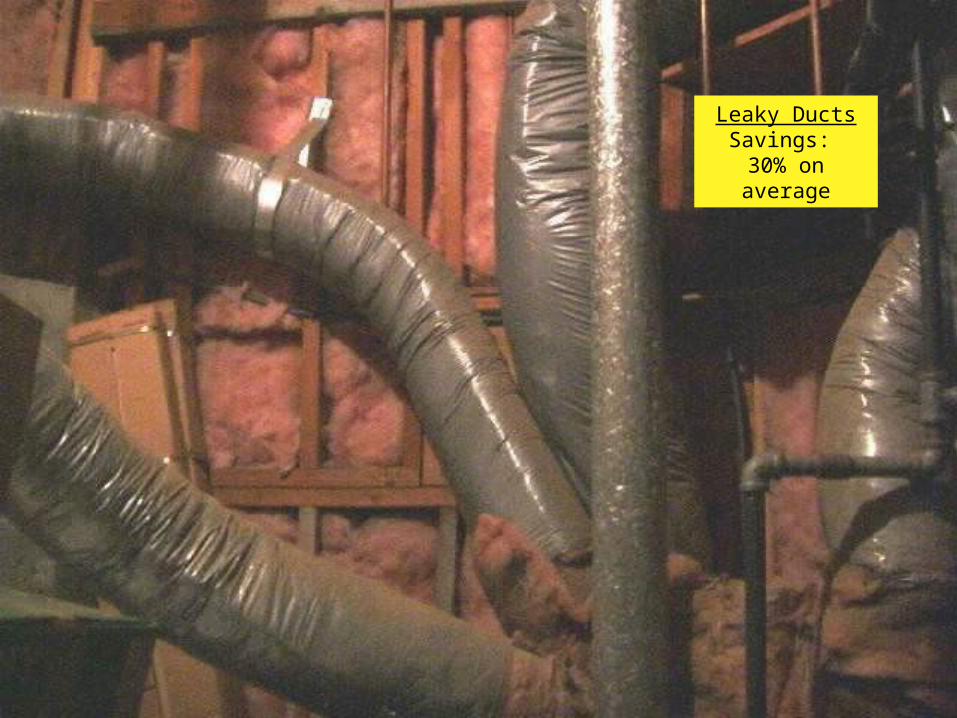
Leaky DuctsSavings:
30% on average
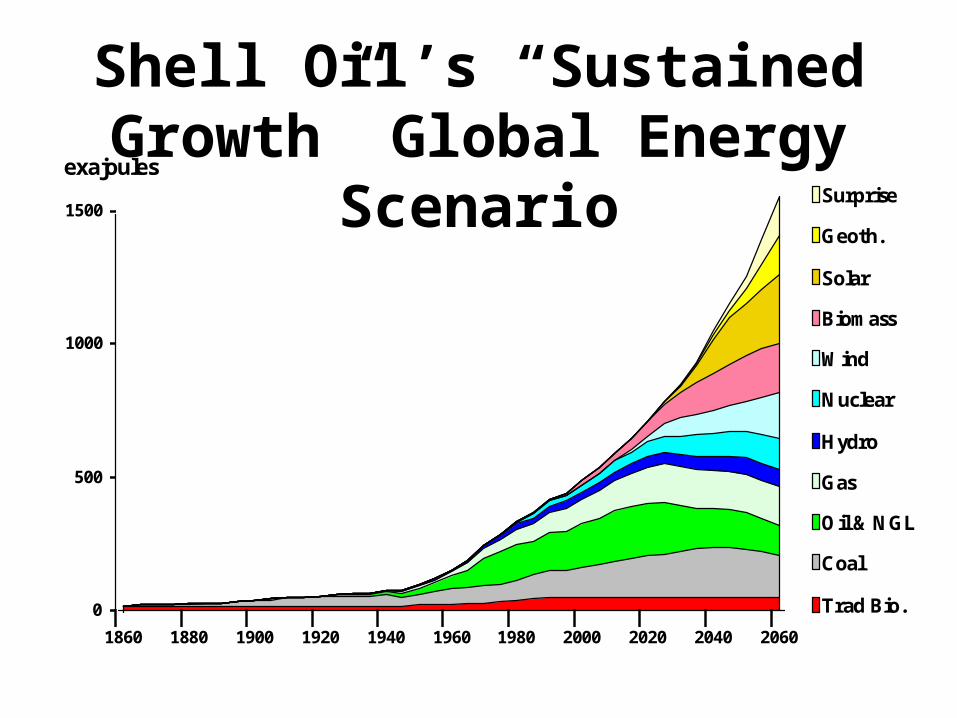
Surprise
Geoth.
Solar
Biomass
Wind
Nuclear
Hydro
Gas
Oil & NGL
Coal
Trad Bio.0
500
1000
1500
1860 1880 1900 1920 1940 1960 1980 2000 2020 2040 2060
exajoules
Shell Oil’s “Sustained Growth” Global Energy Scenario
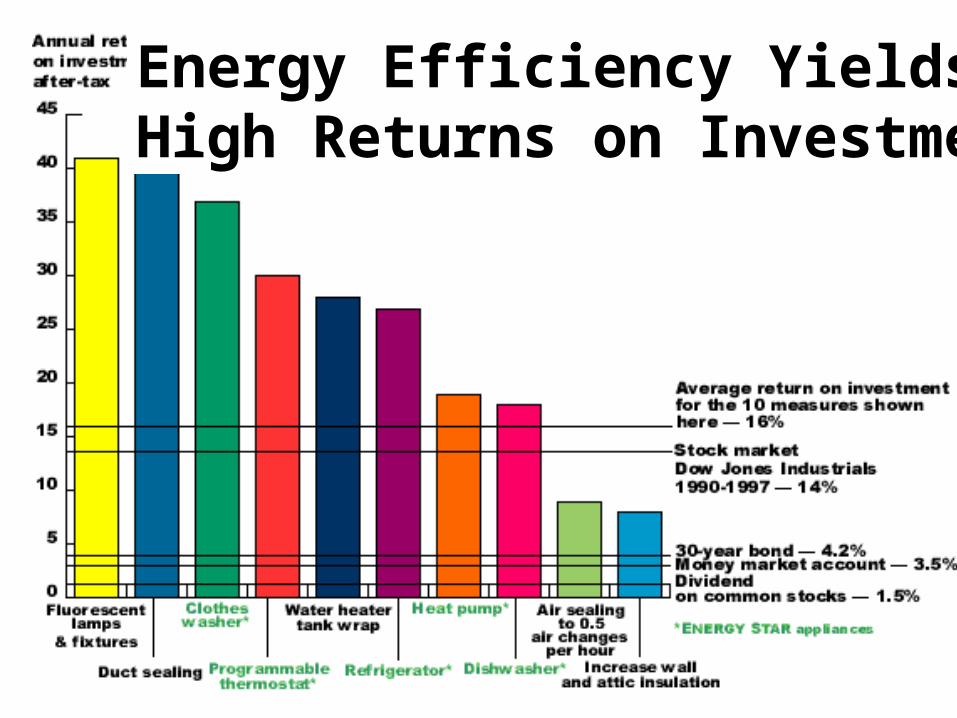
Energy Efficiency Yields High Returns on Investment
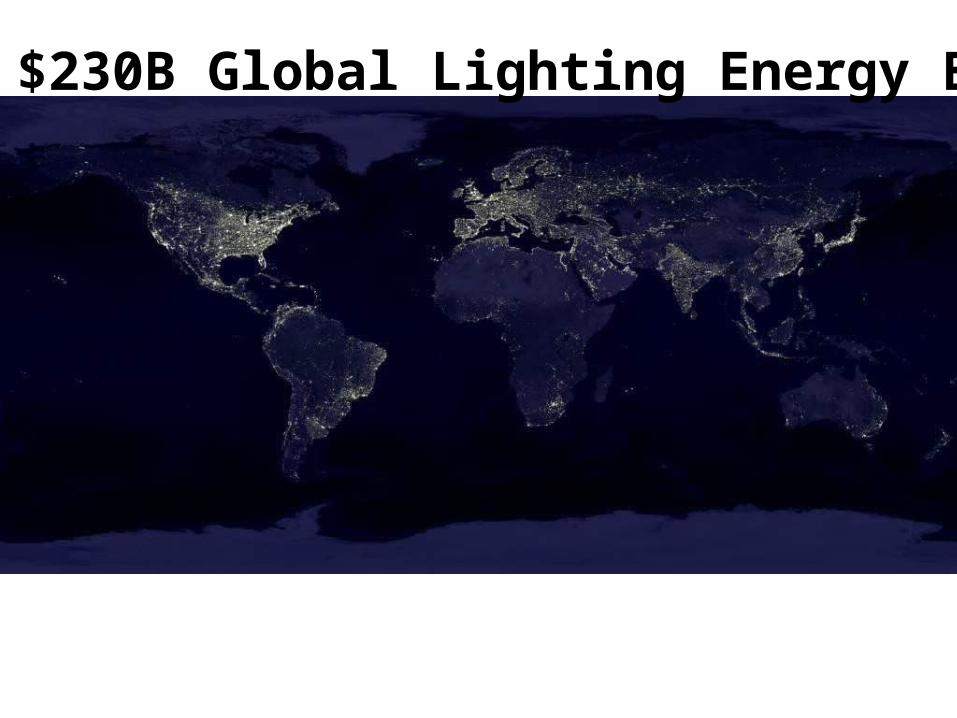
The $230B Global Lighting Energy Bill
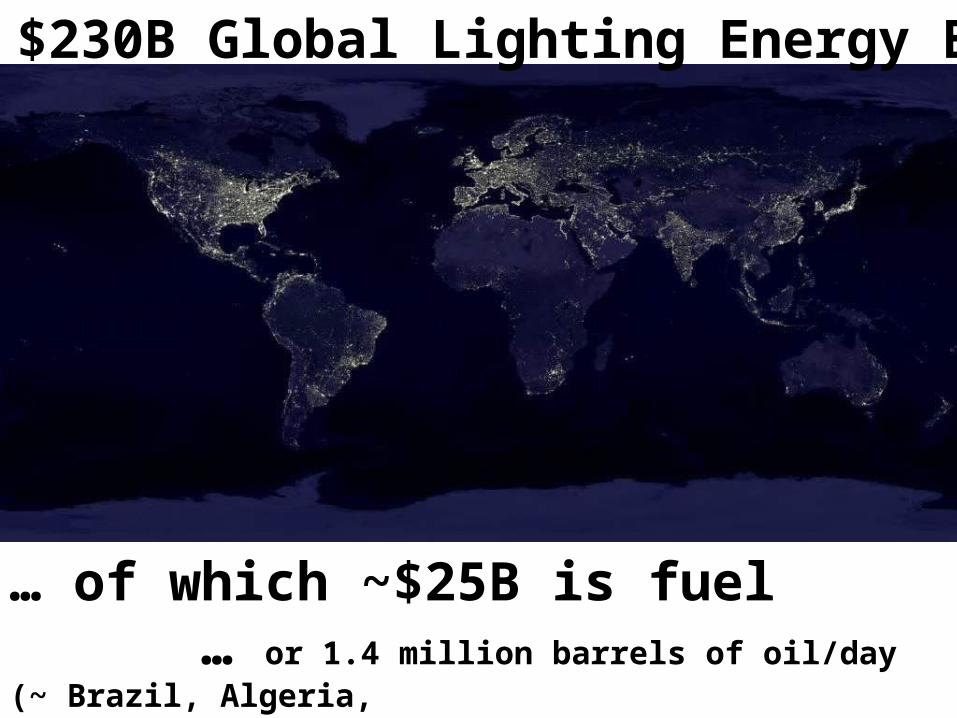
The $230B Global Lighting Energy Bill
… of which ~$25B is fuel … or 1.4 million barrels of oil/day (~ Brazil, Algeria, Libya, or Indonesia, or 50% of Iraq’s production)
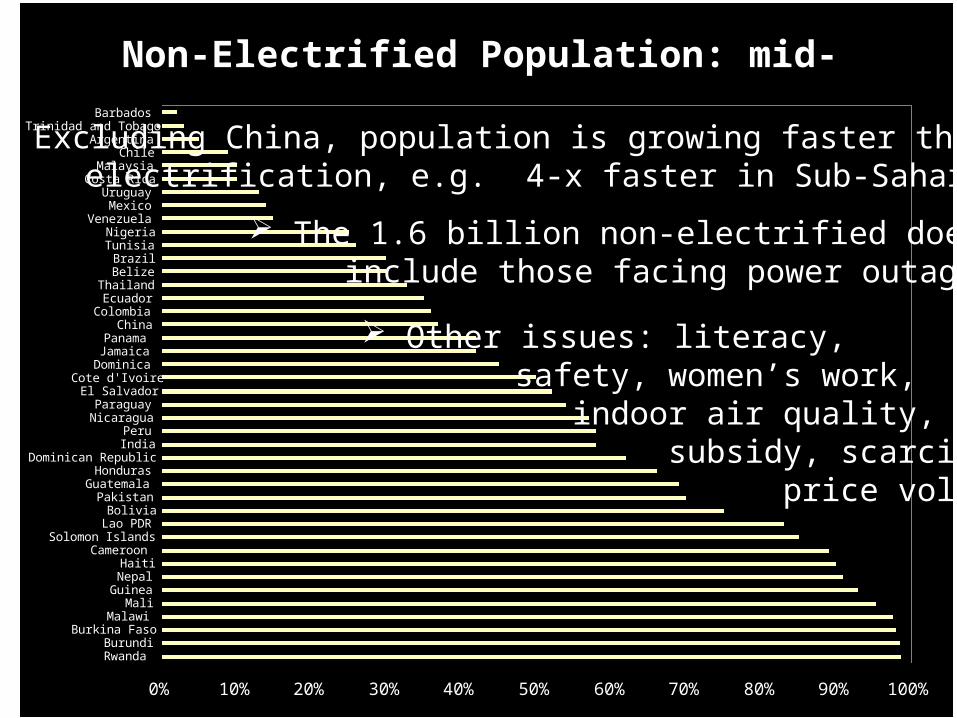
Non-Electrified Population: mid-1990s
0% 10% 20% 30% 40% 50% 60% 70% 80% 90% 100%
RwandaBurundi
Burkina FasoMalawi
MaliGuineaNepalHaiti
CameroonSolomon Islands
Lao PDRBolivia
PakistanGuatemala
HondurasDominican Republic
IndiaPeru
NicaraguaParaguay
El SalvadorCote d'Ivoire
DominicaJamaicaPanama
ChinaColombia
EcuadorThailand
BelizeBrazil
TunisiaNigeria
VenezuelaMexico
UruguayCosta Rica
MalaysiaChile
ArgentinaTrinidad and Tobago
Barbados
Excluding China, population is growing faster than electrification, e.g. 4-x faster in Sub-Saharan Africa
Other issues: literacy, safety, women’s work, indoor air quality, subsidy, scarcity, price volatility
The 1.6 billion non-electrified doesn’t include those facing power outages
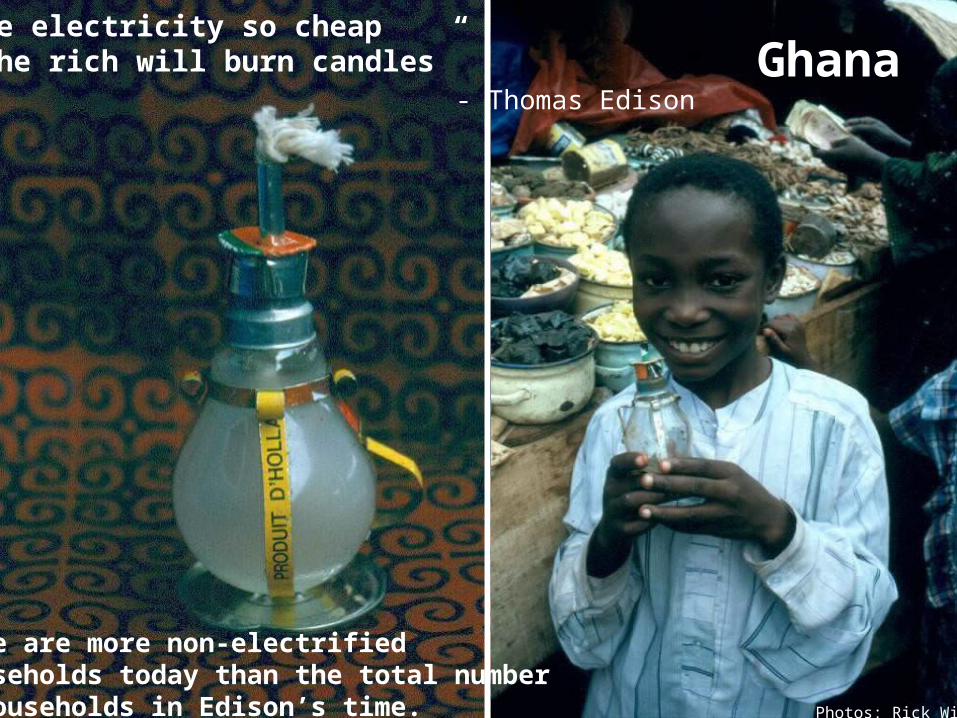
Ghana“We will make electricity so cheap that only the rich will burn candles” - Thomas Edison
Photos: Rick Wilk
There are more non-electrified households today than the total numberof households in Edison’s time.

Photos: Evan Mills ©
Assam, India
Assam, India Assam, India
Bhutan
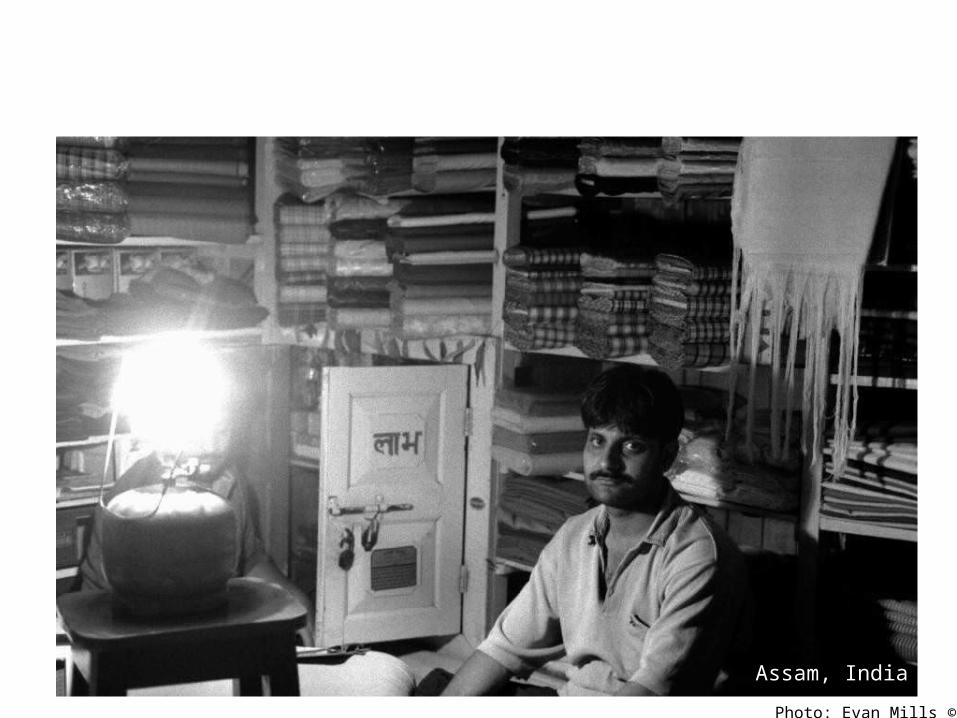
Photo: Evan Mills ©
Assam, India
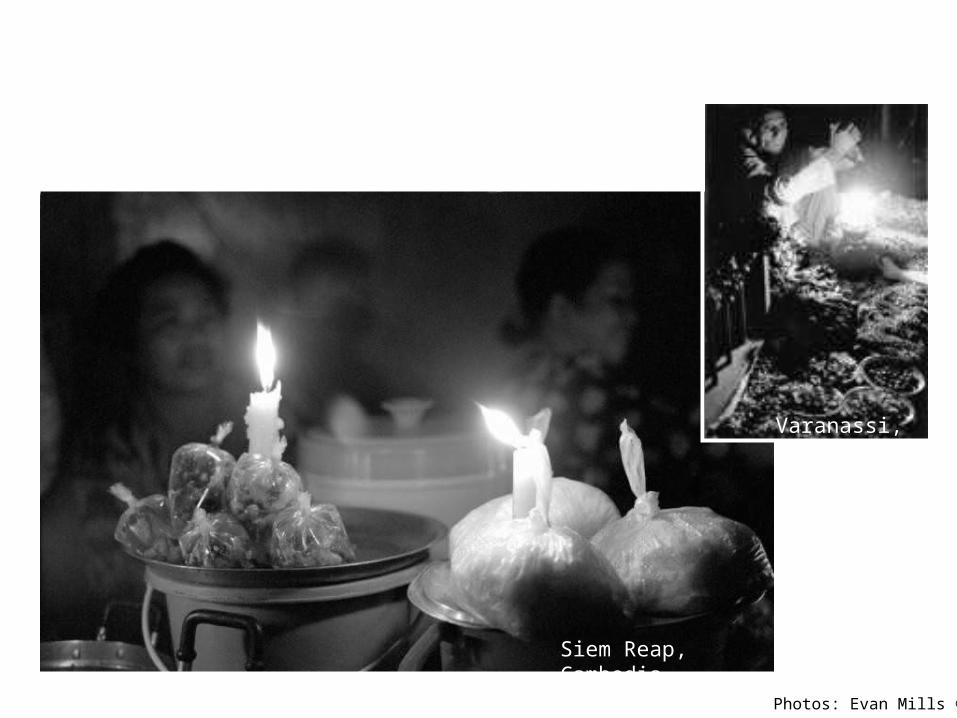
Photos: Evan Mills ©
Varanassi, India
Siem Reap, Cambodia

Kerosene Kommerce
Photos: Evan Mills ©Northeast Viet Nam
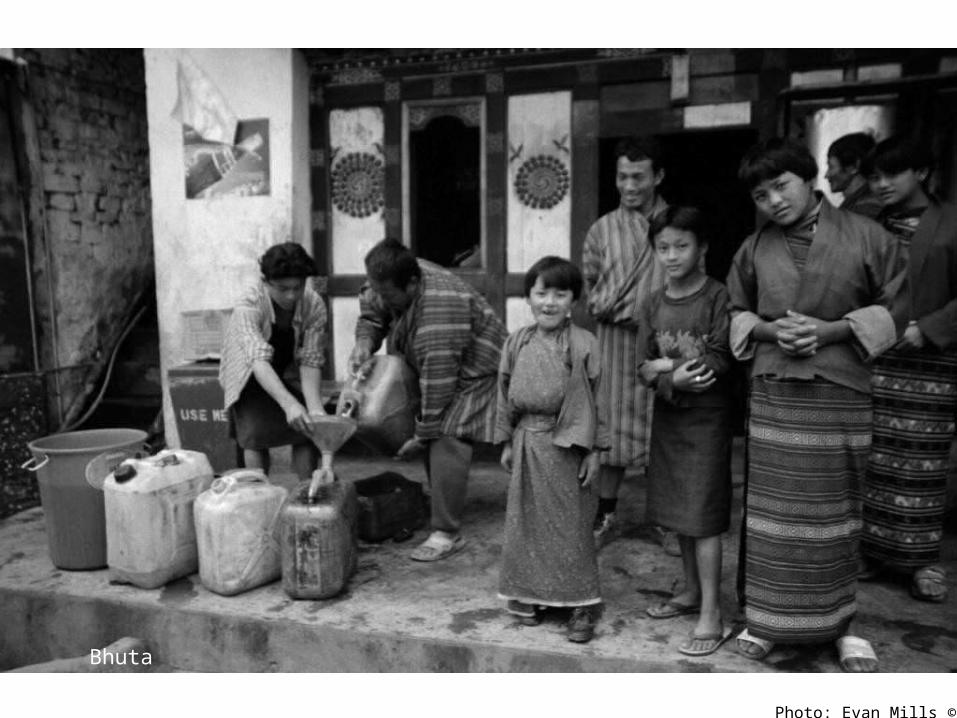
Photo: Evan Mills ©
Bhutan
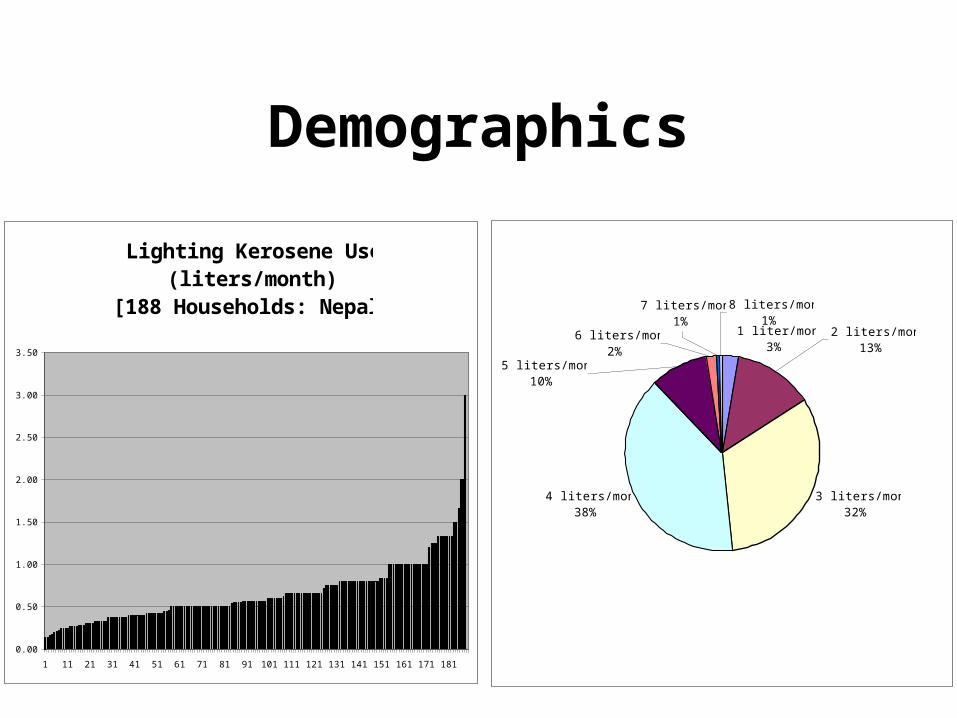
Demographics
3 liters/month32%
4 liters/month38%
1 liter/month3%
7 liters/month1%
6 liters/month2%
5 liters/month10%
8 liters/month1%
2 liters/month13%
Lighting Kerosene Use (liters/month)
[188 Households: Nepal]
0.00
0.50
1.00
1.50
2.00
2.50
3.00
3.50
1 11 21 31 41 51 61 71 81 91 101 111 121 131 141 151 161 171 181
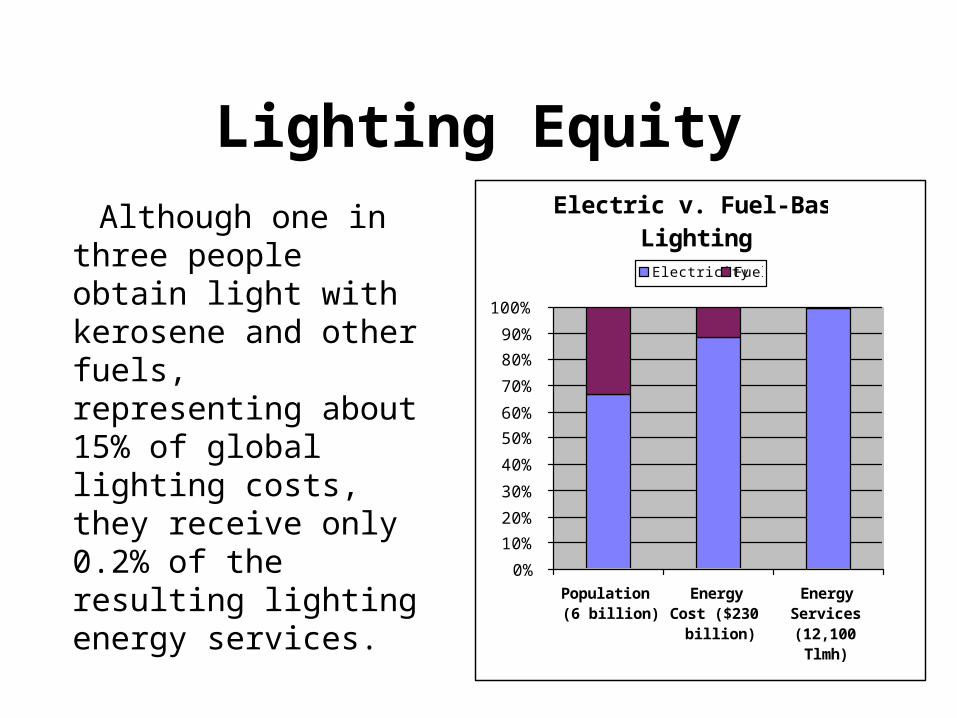
Lighting Equity
Although one in three people obtain light with kerosene and other fuels, representing about 15% of global lighting costs, they receive only 0.2% of the resulting lighting energy services.
Electric v. Fuel-Based Lighting
0%
10%
20%
30%
40%
50%
60%
70%
80%
90%
100%
Population(6 billion)
EnergyCost ($230
billion)
EnergyServices(12,100Tlmh)
Electricity Fuel
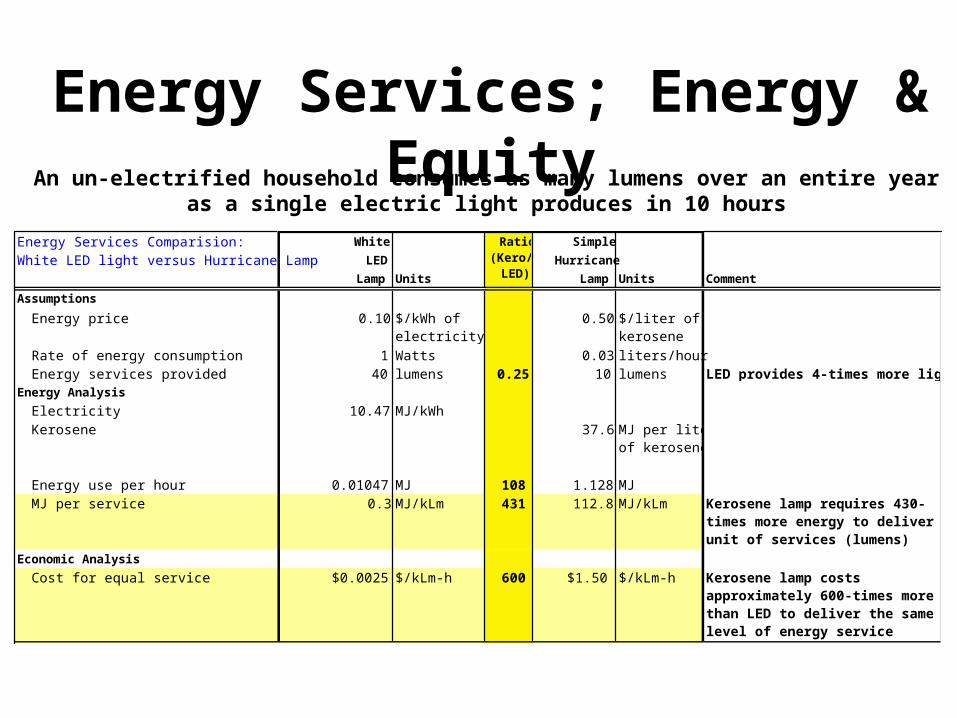
Energy Services; Energy & EquityAn un-electrified household consumes as many lumens over an entire year as a single electric light
produces in 10 hours
Energy Services Comparision: White Simple
White LED light versus Hurricane Lamp LED Hurricane
Lamp Units Lamp Units Comment
Assumptions
Energy price 0.10 $/kWh of electricity
0.50 $/liter of kerosene
Rate of energy consumption 1 Watts 0.03 liters/hourEnergy services provided 40 lumens 0.25 10 lumens LED provides 4-times more light
outputEnergy Analysis
Electricity 10.47 MJ/kWhKerosene 37.6 MJ per liter
of kerosene
Energy use per hour 0.01047 MJ 108 1.128 MJMJ per service 0.3 MJ/kLm 431 112.8 MJ/kLm Kerosene lamp requires 430-
times more energy to deliver a unit of services (lumens)
Economic Analysis
Cost for equal service $0.0025 $/kLm-h 600 $1.50 $/kLm-h Kerosene lamp costs approximately 600-times more than LED to deliver the same level of energy service
Ratio (Kero/
LED)
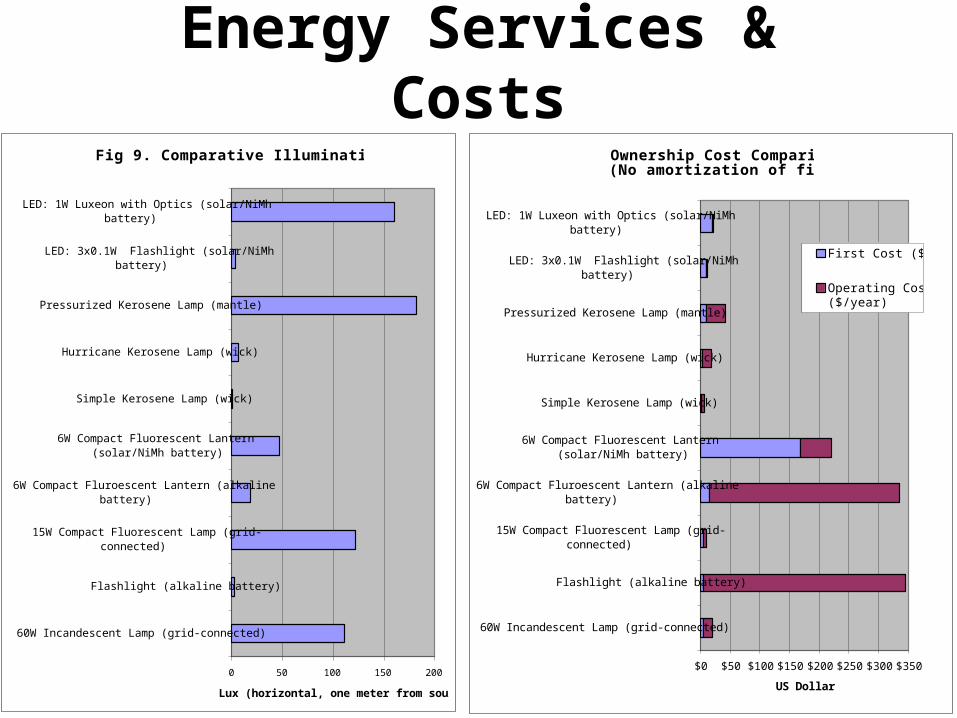
Fig 9. Comparative Illumination Levels
0 50 100 150 200
60W Incandescent Lamp (grid-connected)
Flashlight (alkaline battery)
15W Compact Fluorescent Lamp (grid-connected)
6W Compact Fluroescent Lantern (alkalinebattery)
6W Compact Fluorescent Lantern(solar/NiMh battery)
Simple Kerosene Lamp (wick)
Hurricane Kerosene Lamp (wick)
Pressurized Kerosene Lamp (mantle)
LED: 3x0.1W Flashlight (solar/NiMhbattery)
LED: 1W Luxeon with Optics (solar/NiMhbattery)
Lux (horizontal, one meter from source)
Ownership Cost Comparison(No amortization of first cost)
$0 $50 $100 $150 $200 $250 $300 $350
60W Incandescent Lamp (grid-connected)
Flashlight (alkaline battery)
15W Compact Fluorescent Lamp (grid-connected)
6W Compact Fluroescent Lantern (alkalinebattery)
6W Compact Fluorescent Lantern(solar/NiMh battery)
Simple Kerosene Lamp (wick)
Hurricane Kerosene Lamp (wick)
Pressurized Kerosene Lamp (mantle)
LED: 3x0.1W Flashlight (solar/NiMhbattery)
LED: 1W Luxeon with Optics (solar/NiMhbattery)
US Dollars
First Cost ($)
Operating Cost($/year)
Energy Services & Costs
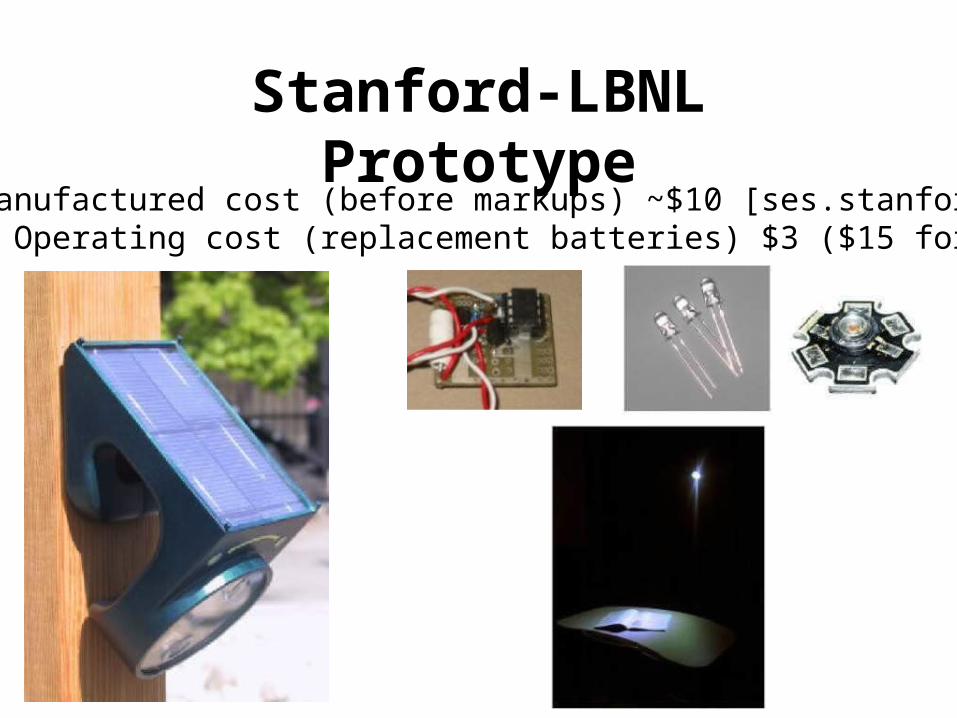
Stanford-LBNL Prototype• Est. manufactured cost (before markups) ~$10 [ses.stanford.edu]• Annual Operating cost (replacement batteries) $3 ($15 for kerosene)
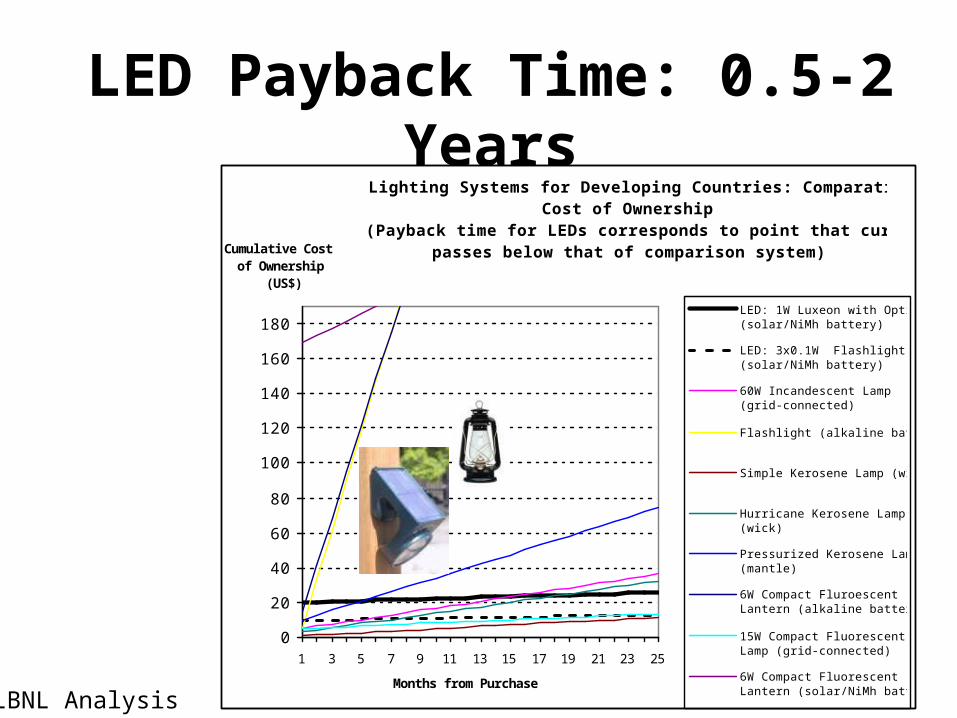
LED Payback Time: 0.5-2 Years
LBNL Analysis
Lighting Systems for Developing Countries: Comparative Cost of Ownership
(Payback time for LEDs corresponds to point that curve passes below that of comparison system)
0
20
40
60
80
100
120
140
160
180
1 3 5 7 9 11 13 15 17 19 21 23 25
Months from Purchase
Cumulative Cost of Ownership
(US$)
LED: 1W Luxeon with Optics(solar/NiMh battery)
LED: 3x0.1W Flashlight(solar/NiMh battery)
60W Incandescent Lamp(grid-connected)
Flashlight (alkaline battery)
Simple Kerosene Lamp (wick)
Hurricane Kerosene Lamp(wick)
Pressurized Kerosene Lamp(mantle)
6W Compact FluroescentLantern (alkaline battery)
15W Compact FluorescentLamp (grid-connected)
6W Compact FluorescentLantern (solar/NiMh battery)