energy in the balance
DESCRIPTION
This guide includes a series of charting and graphing activities in which students evaluate the advantages and disadvantages of the major energy sources.TRANSCRIPT

Energy in the BalanceThis guide includes a series of charting and graphing activities in which students evaluate the advantages and disadvantages of the major energy sources.
eScience
Grade Level:
Subject Areas:
Social Studies
Elementary
Math
2017-2018
Elem
2 Energy in the Balance
Teacher Advisory BoardConstance BeattyKankakee, IL
Amy Constant - SchottRaleigh, NC
James M. BrownSaratoga Springs, NY
Nina CorleyGalveston, TX
Linda FonnerNew Martinsville, WV
Shannon DonovanGreene, RI
Samantha Forbes
Vienna, VA
Michelle Garlick
Bob Hodash
DaNel HoganTucson, AZ
Greg HolmanParadise, CA
Barbara LazarAlbuquerque, NM
Robert LazarAlbuquerque, NM
Leslie LivelyPorters Falls, WV
Jennifer Mitchell - Winterbottom Pottstown, PA
Mollie MukhamedovPort St. Lucie, FL
Don Pruett Jr.Puyallup, WA
Judy ReevesLake Charles, LA
Tom SpencerChesapeake, VA
Jennifer Trochez MacLeanLos Angeles, CA
Wayne YonkelowitzFayetteville, WV
Robert GriegolietNaperville, IL
Erin GockelFarmington, NM
Long Grove, IL
Printed on Recycled Paper
NEED Mission StatementThe mission of The NEED Project is to promote an energy conscious and educated society by creating effective networks of students, educators, business, government and community leaders to design and deliver objective, multi-sided energy education programs.
Permission to CopyNEED curriculum is available for reproduction by classroom teachers only. NEED curriculum may only be reproduced for use outside the classroom setting when express written permission is obtained in advance from The NEED Project. Permission for use can be obtained by contacting [email protected].
Teacher Advisory Board In support of NEED, the national Teacher Advisory Board (TAB) is dedicated to developing and promoting standards-based energy curriculum and training.
Energy Data Used in NEED MaterialsNEED believes in providing teachers and students with the most recently reported, available, and accurate energy data. Most statistics and data contained within this guide are derived from the U.S. Energy Information Administration. Data is compiled and updated annually where available. Where annual updates are not available, the most current, complete data year available at the time of updates is accessed and printed in NEED materials. To further research energy data, visit the EIA website at www.eia.gov.
1.800.875.5029www.NEED.org
© 2017

© 2017 The NEED Project 8408 Kao Circle, Manassas, VA 20110 1.800.875.5029 www.NEED.org 3
Energy in the Balance
Table of Contents¡ Standards Correlation Information 4
¡ Teacher Guide 5
¡ Answer Key: How We Use Our Energy Sources 8
¡ Energy Source Rating Sheets
¡ Biomass 9
¡ Coal 10
¡ Geothermal 11
¡ Hydropower 12
¡ Natural Gas 13
¡ Petroleum 14
¡ Propane 15
¡ Solar 16
¡ Uranium 17
¡ Wind 18
¡ The Energy Sources We Use 19
¡ Renewables and Nonrenewables 20
¡ How We Use Our Energy Sources 21
¡ Evaluation Form 23
e

4 Energy in the Balance
Standards Correlation Informationwww.NEED.org/curriculumcorrelations
Next Generation Science Standards � This guide effectively supports many Next Generation Science Standards. This material can satisfy performance expectations, science and engineering practices, disciplinary core ideas, and cross cutting concepts within your required curriculum. For more details on these correlations, please visit NEED’s curriculum correlations website.
Common Core State Standards � This guide has been correlated to the Common Core State Standards in both language arts and mathematics. These correlations are broken down by grade level and guide title, and can be downloaded as a spreadsheet from the NEED curriculum correlations website.
Individual State Science Standards � This guide has been correlated to each state’s individual science standards. These correlations are broken down by grade level and guide title, and can be downloaded as a spreadsheet from the NEED website.

© 2017 The NEED Project 8408 Kao Circle, Manassas, VA 20110 1.800.875.5029 www.NEED.org 5
e Teacher Guide
& BackgroundEnergy in the Balance is a cooperative learning activity that encourages elementary students to evaluate the advantages and disadvantages of the major energy sources through a series of graphing and charting activities.
Objectives �Students will be able to identify basic advantages and disadvantages of the ten major energy sources.
�Students will be able to identify economic and environmental trade-offs of the ten major energy sources.
Concepts �Energy is involved in everything we do.
�We use a lot of energy to support our lifestyle in the United States.
�All energy sources have advantages and disadvantages.
�Economic and environmental effects help determine the energy sources we use.
Materials �Crayons or markers �Photocopies of materials as indicated �NEED Energy Infobooks as resources �Digital projector or overhead projector �Master copies of the ten rating sheets
2 Preparation �Make enough copies of the ten energy source rating sheets and supplemental activities (pages 9-21) so that each group of three students has a complete set.
�Make one transparency or master of each rating sheet on which to record a class summary of the groups results. Alternatively, you can download the spreadsheet from www.NEED.org. The spreadsheet Energy in the Balance can be used to record each group's score of the sources and a class average for each.
Grade Level �Elementary, grades 3–5
Time �Two to five 30 minute class periods
NEED InfobooksNEED's Energy Infobooks are a comprehensive guide to energy sources, energy consumption, electricity, and efficiency and conservation. These infobooks are a perfect resource for use with this activity and other energy activities. Infobooks are available on primary, elementary, intermediate, and secondary reading levels and can be downloaded in PDF or e-reader format from www.NEED.org.

6 Energy in the Balance
Procedure
Part One1. Divide your class into groups of three students. Provide one set of rating sheets to each group. For younger students, you may want to
complete the first rating sheet with the students as a class.
2. Explain to the students that they will be working in groups to complete rating sheets about the ten major sources of energy used in the United States. They will complete the rating sheets by reading each statement and deciding as a group if it is a fact, advantage, or disadvantage.
3. Tell the students to disregard the Rating column as they complete the forms. They will complete this column later, after they have read all of the rating sheets.
NOTE: Some of the statements may be controversial. If the students in the group cannot agree on a statement after a brief discussion, they should note that on the sheet and move on to the next statement.
4. Have the groups write their names on the back of the rating sheets, collect them, and explain that the students will work in the same groups for the next few days.
Part Two1. Have the students return to their groups. Explain that they will begin deciding how important the advantages and disadvantages are
by rating them. The groups will complete the rating sheets one at a time, then compile a class average, before moving on to the next rating sheet. Give the students the following explanations:
�If the group decided the statement is a fact, the rating for that statement is a zero. There is no rating (0) to a fact that is neither an advantage nor a disadvantage.
�If the group decided that the statement is an advantage or a disadvantage, they must decide the importance of the advantage or disadvantage—its rating. Write the scale below on the board for the students to use as a guide:
DISADVANTAGE -3 -2 -1 0 +1 +2 +3 ADVANTAGENotice that all advantages are positive numbers—they add to the value of the energy source; all disadvantages are negative numbers—they subtract from the value of the energy source.
2. Explain that the groups can decide on any number between –3 and +3 as the rating. For example:
�Our basketball team is playing our big rival on Friday night. (Fact) �Our coach has a cold. (Disadvantage -1) �The opposing team's best player is injured. (Advantage +2) �We are playing in their gym. (Disadvantage -1) �We have beaten them twice this year. What do you think?
3. Once all of the students understand the rating system, they should begin to rate the first energy source—Biomass. For younger students, you may want to complete the first sheet as a class. Each group should try to reach a consensus on the rating, but if they cannot, they should compromise by calculating the average rating for the group. Emphasize that there are no right or wrong answers in the ratings and that it is acceptable for different people and groups to place different values on the advantages and disadvantages.
4. After the groups have completed each sheet, they should calculate the total rating for the sheet by adding the positive numbers together and subtracting the negative numbers. The total can be a negative number or zero.
5. Using the projected rating sheet masters or the Energy in the Balance spreadsheet, tally the results of all the groups, statement by statement, as shown in the example on the next page. The spreadsheet will automatically calculate the average score (step seven). Hide this column if you wish students to calculate it on their own.
6. If there is disagreement about whether a statement is a fact, an advantage, or a disadvantage, have one student from each opposing group give the rationale for their decision. The rating scores can also be discussed if there is a marked disparity in the scores and you wish to expand the unit.

© 2017 The NEED Project 8408 Kao Circle, Manassas, VA 20110 1.800.875.5029 www.NEED.org 7
Supplemental Activities � The Energy Sources We Use
Students will use the rating sheets to complete a bar graph on The Energy Sources We Use worksheet. This activity shows the percentage that each energy source contributes to total U.S. consumption.
� Renewables and NonrenewablesStudents will use the rating sheets or the information they recorded in The Energy Sources We Use to compare the amount of energy from renewable and nonrenewable energy sources in the U.S. by completing a pie chart on the Renewables and Nonrenewables worksheet.
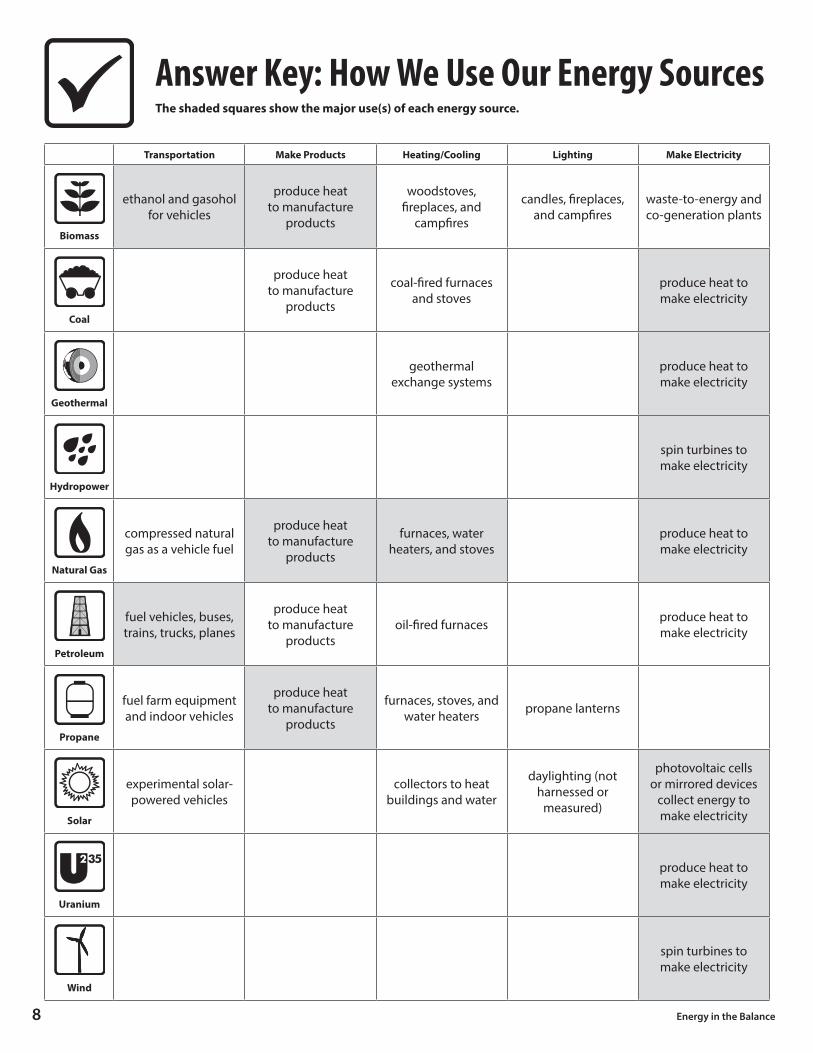
� How We Use Our Energy Sources Students will use the rating sheets to determine the main use or uses of each energy source on the How We Use Our Energy Sources worksheet. The answer sheet on page 8 shows many uses for the energy sources, with the main use(s) shaded. You may want to spend some extra time going over all of the uses listed.
? Supplemental Discussion Questions 1. Most of the energy we use is from fossil fuels—coal, petroleum, natural gas, and propane. Why do we use fossil fuels for so much
energy? Is it because they meet our needs? Is it because they’re less expensive? Is it because they’re plentiful?
2. Would you be willing to pay more money for cleaner energy?
Answer Keys � The Energy Sources We Use
Biomass (green) 4.9% Petroleum (blue) 36.6% Solar (green) 0.4% Hydropower (green) 2.4% Natural Gas (blue) 29.0% Wind (green) 1.8% Coal (blue) 16.0% Uranium (blue) 8.6% Geothermal (green) 0.2%
� Renewables and Nonrenewables Renewables: 9.7% (green) Nonrenewables: 90.2% (blue)*Totals do not equal 100% due to independent rounding.
1. Biomass is plants, trees, garbage, yard waste— anything that was alive a short time ago.
//// 0
2. All biomass contains energy that it has absorbed from the sun and stored as chemical energy.
//// +2 +2+2 +3
5. Biomass doesn't have as much energy as fossil fuels. We must burn more biomass to get the same amount of energy.
//// -2 -3-2 -2
FAC
T
AD
VAN
TAG
E
DIS
AD
VAN
TAG
E
RAT
ING
Biomass
SAMPLE RATING SHEET
7. Work with the students to average the rating for each source by adding together all of the scores and dividing by the number of groups. Each group should write the average score next to their group’s rating for comparison.
8. Ask the students if they notice a trend in their group’s ratings, as compared to the average. For example, are some groups more concerned about environmental impacts than economic impacts?
9. Follow the procedure above for the remaining rating sheets.
8 Energy in the Balance
Transportation Make Products Heating/Cooling Lighting Make Electricity
Biomass
ethanol and gasohol for vehicles
produce heat to manufacture
products
woodstoves, fireplaces, and
campfires
candles, fireplaces, and campfires
waste-to-energy and co-generation plants
Coal
produce heat to manufacture
products
coal-fired furnaces and stoves
produce heat to make electricity
Geothermal
geothermal exchange systems
produce heat to make electricity
Hydropower
spin turbines to make electricity
Natural Gas
compressed natural gas as a vehicle fuel
produce heat to manufacture
products
furnaces, water heaters, and stoves
produce heat to make electricity
Petroleum
fuel vehicles, buses, trains, trucks, planes
produce heat to manufacture
productsoil-fired furnaces produce heat to
make electricity
Propane
fuel farm equipment and indoor vehicles
produce heat to manufacture
products
furnaces, stoves, and water heaters propane lanterns
Solar
experimental solar-powered vehicles
collectors to heat buildings and water
daylighting (not harnessed or
measured)
photovoltaic cells or mirrored devices
collect energy to make electricity
Uranium
produce heat to make electricity
Wind
spin turbines to make electricity
Answer Key: How We Use Our Energy SourcesThe shaded squares show the major use(s) of each energy source.
© 2017 The NEED Project 8408 Kao Circle, Manassas, VA 20110 1.800.875.5029 www.NEED.org 9
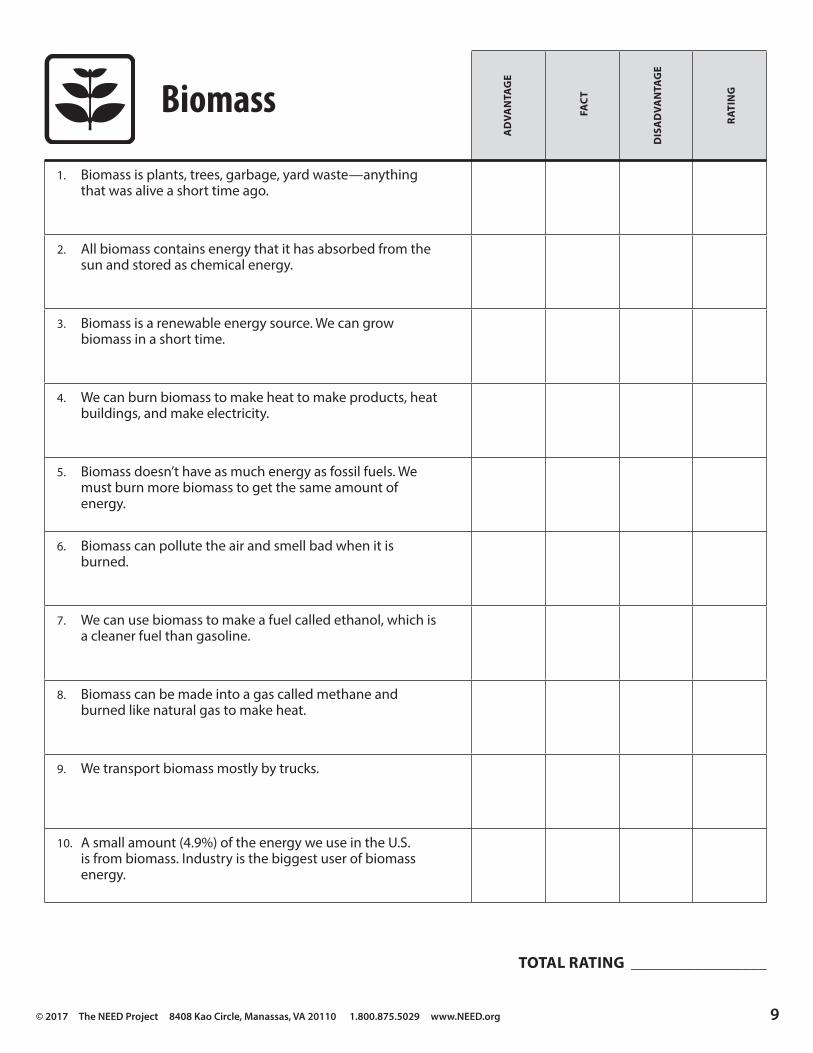
1. Biomass is plants, trees, garbage, yard waste—anything that was alive a short time ago.
2. All biomass contains energy that it has absorbed from the sun and stored as chemical energy.
3. Biomass is a renewable energy source. We can grow biomass in a short time.
4. We can burn biomass to make heat to make products, heat buildings, and make electricity.
5. Biomass doesn’t have as much energy as fossil fuels. We must burn more biomass to get the same amount of energy.
6. Biomass can pollute the air and smell bad when it is burned.
7. We can use biomass to make a fuel called ethanol, which is a cleaner fuel than gasoline.
8. Biomass can be made into a gas called methane and burned like natural gas to make heat.
9. We transport biomass mostly by trucks.
10. A small amount (4.9%) of the energy we use in the U.S. is from biomass. Industry is the biggest user of biomass energy.
TOTAL RATING _________________
DIS
AD
VAN
TAG
E
RAT
INGBiomass
AD
VAN
TAG
E
FAC
T
10 Energy in the Balance
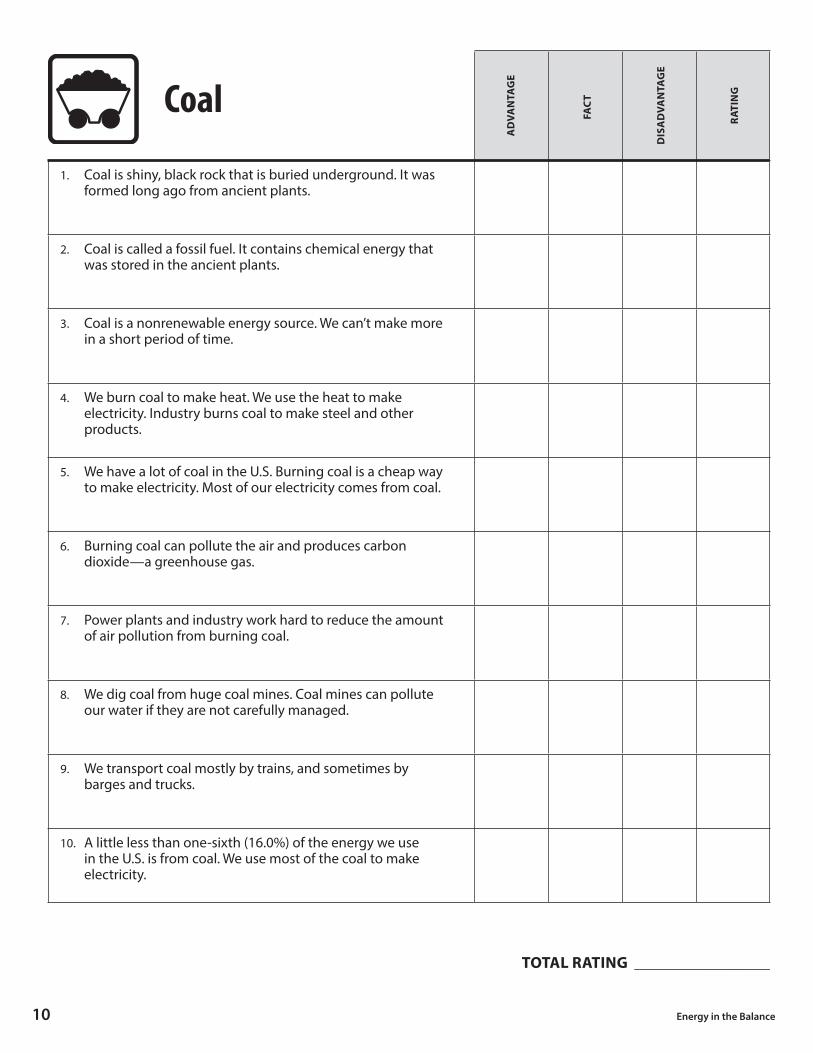
1. Coal is shiny, black rock that is buried underground. It was formed long ago from ancient plants.
2. Coal is called a fossil fuel. It contains chemical energy that was stored in the ancient plants.
3. Coal is a nonrenewable energy source. We can’t make more in a short period of time.
4. We burn coal to make heat. We use the heat to make electricity. Industry burns coal to make steel and other products.
5. We have a lot of coal in the U.S. Burning coal is a cheap way to make electricity. Most of our electricity comes from coal.
6. Burning coal can pollute the air and produces carbon dioxide—a greenhouse gas.
7. Power plants and industry work hard to reduce the amount of air pollution from burning coal.
8. We dig coal from huge coal mines. Coal mines can pollute our water if they are not carefully managed.
9. We transport coal mostly by trains, and sometimes by barges and trucks.
10. A little less than one-sixth (16.0%) of the energy we use in the U.S. is from coal. We use most of the coal to make electricity.
TOTAL RATING _________________
DIS
AD
VAN
TAG
E
RAT
INGCoal
AD
VAN
TAG
E
FAC
T
© 2017 The NEED Project 8408 Kao Circle, Manassas, VA 20110 1.800.875.5029 www.NEED.org 11
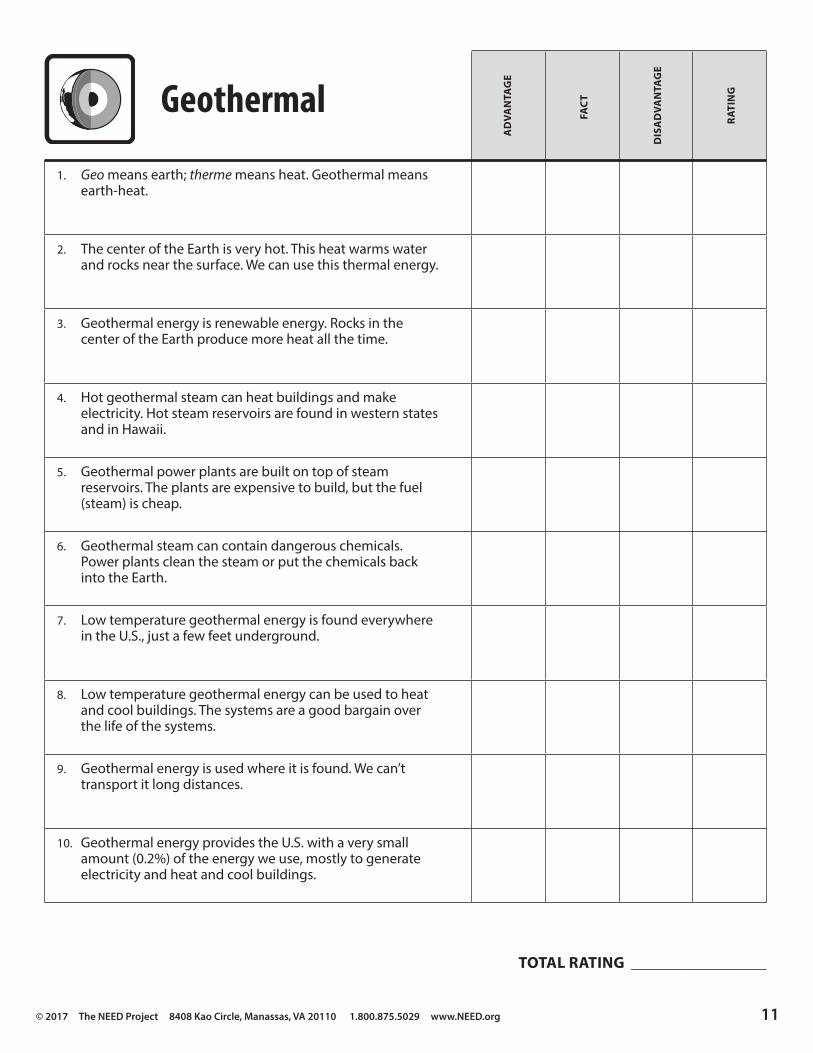
1. Geo means earth; therme means heat. Geothermal means earth-heat.
2. The center of the Earth is very hot. This heat warms water and rocks near the surface. We can use this thermal energy.
3. Geothermal energy is renewable energy. Rocks in the center of the Earth produce more heat all the time.
4. Hot geothermal steam can heat buildings and make electricity. Hot steam reservoirs are found in western states and in Hawaii.
5. Geothermal power plants are built on top of steam reservoirs. The plants are expensive to build, but the fuel (steam) is cheap.
6. Geothermal steam can contain dangerous chemicals. Power plants clean the steam or put the chemicals back into the Earth.
7. Low temperature geothermal energy is found everywhere in the U.S., just a few feet underground.
8. Low temperature geothermal energy can be used to heat and cool buildings. The systems are a good bargain over the life of the systems.
9. Geothermal energy is used where it is found. We can’t transport it long distances.
10. Geothermal energy provides the U.S. with a very small amount (0.2%) of the energy we use, mostly to generate electricity and heat and cool buildings.
TOTAL RATING _________________
DIS
AD
VAN
TAG
E
RAT
INGGeothermal
AD
VAN
TAG
E
FAC
T

12 Energy in the Balance
1. Hydro means water. Hydropower is the energy of moving water.
2. Gravity pulls water from high ground to low ground. There is energy in moving water—motion energy.
3. Water is a renewable energy source. Rain will fall as long as the sun evaporates water from the oceans, rivers, and lakes.
4. Dams can be built across rivers to harness the energy of moving water. Turbines at the bottom of the dams make electricity.
5. Hydropower is the cheapest way to make electricity. The fuel (moving water) is free to use and isn’t transported. Gravity moves it.
6. Hydropower plants do not pollute the air since no fuel is burned.
7. Hydropower dams can flood a lot of land when they are built. They can also disturb fish and wildlife habitats.
8. The lakes made by the dams can be used for fishing, boating, and other sports. They can also help prevent floods.
9. Most of the good places to put hydro dams have been used. The U.S. will not build many more hydro dams.
10. Hydropower provides the U.S. with a small amount (2.4%) of the energy we use. Hydropower is used to make electricity.
TOTAL RATING _________________
DIS
AD
VAN
TAG
E
RAT
INGHydropower
AD
VAN
TAG
E
FAC
T

© 2017 The NEED Project 8408 Kao Circle, Manassas, VA 20110 1.800.875.5029 www.NEED.org 13
1. Natural gas has no taste, color, or smell. A smell, like rotten eggs, is added so we can tell if there is a gas leak.
2. Natural gas contains energy—chemical energy. It was formed long ago from tiny sea plants and animals. It is a fossil fuel.
3. Natural gas is buried underground in pockets of rocks. It is a nonrenewable energy source and took a long time to form.
4. We can burn natural gas to make heat. We can use the heat to make products, warm buildings, and make electricity.
5. We have just under a 93-year supply of natural gas at the rate we use it today.
6. Burning natural gas produces some air pollution and carbon dioxide—a greenhouse gas.
7. Cars with special engines can run on natural gas. Natural gas is cleaner than gasoline, but there are not very many fuel stations.
8. We dig wells deep into the ground to get natural gas and send it to a plant to be cleaned.
9. We transport natural gas across the country through pipelines. There are more than two million miles of natural gas pipelines in the U.S.
10. A little over one-fourth (29.0%) of the energy we use in the U.S. comes from natural gas.
TOTAL RATING _________________
DIS
AD
VAN
TAG
E
RAT
INGNatural Gas
AD
VAN
TAG
E
FAC
T

14 Energy in the Balance
1. Petroleum is oil that is buried underground in the pores of rocks. We drill wells into the ground and under the oceans to reach it.
2. Petroleum is a fossil fuel. It was formed long ago from tiny sea plants and animals. Petroleum contains chemical energy.
3. Petroleum is a nonrenewable energy source. We can’t make more petroleum in a short period of time.
4. We burn petroleum for energy. We use it mostly for transportation fuel. It can also heat buildings and make electricity.
5. Petroleum is also used to make plastics, medicines, paint, soaps, and many other products.
6. Burning petroleum can pollute the air. Burning it also produces carbon dioxide—a greenhouse gas.
7. Drilling for oil and transporting it can harm the land and water if the oil spills.
8. We do not drill enough petroleum in the U.S. to meet our needs. We import about 48 percent of the oil we use from other countries.
9. We transport petroleum by pipelines, oil tankers, and trucks.
10. More than a one-third (36.6%) of the energy we use in the U.S. comes from oil. We use more oil than any other fuel, mostly for transportation.
TOTAL RATING _________________
DIS
AD
VAN
TAG
E
RAT
INGPetroleum
AD
VAN
TAG
E
FAC
T

© 2017 The NEED Project 8408 Kao Circle, Manassas, VA 20110 1.800.875.5029 www.NEED.org 15
1. Propane is a gas with no color, taste, or smell. It is buried underground with petroleum and natural gas.
2. Propane contains energy—chemical energy. It was formed long ago from tiny sea plants and animals. Propane is a fossil fuel.
3. Propane is a nonrenewable energy source. We can’t make more propane in a short period of time.
4. We can burn propane for energy. We use propane to heat buildings in rural areas. We also use it in grills and as a clean fuel for vehicles.
5. Propane turns into a liquid under pressure and takes up less space. A one-gallon tank of liquid can hold 270 gallons of propane gas.
6. Propane is a portable fuel. The gas can be stored under pressure as a liquid and transported by pipeline or by truck to rural areas without pipelines.
7. Propane is a cheap and clean-burning fuel. We use propane to fuel vehicles that we operate inside buildings—like forklifts.
8. Propane produces some air pollution and carbon dioxide when it is burned.
9. Propane is a byproduct from processing natural gas and petroleum refining.
10. A small amount of the energy we use comes from propane. We use it mostly to make products and heat buildings.
TOTAL RATING _________________
DIS
AD
VAN
TAG
E
RAT
INGPropane
AD
VAN
TAG
E
FAC
T

16 Energy in the Balance
1. Sol means sun. Solar energy is energy from the sun.
2. The sun is a big ball of gas. It produces energy all the time. The sun’s energy reaches the Earth in rays—radiant energy.
3. Solar energy is a renewable energy source. We will have solar energy as long as the sun shines.
4. We get light from the sun every day. We can also capture the sun’s energy to heat water and buildings and to make electricity.
5. Photovoltaic (PV) cells can change solar energy directly into electricity. PV cells are used in places with no power lines.
6. Electricity from PV cells and concentrated solar plants is more expensive than electricity from power plants.
7. Solar energy is free to use. It is also a clean energy source—no fuel is burned to make the heat or electricity.
8. The sun’s energy is spread out and hard to capture. The energy is only available when the sun is shining, not 24 hours a day.
9. We cannot transport solar energy. We use it where we find it.
10. Solar energy provides the U.S. with a very small amount (0.4%) of the energy we capture and use, not counting light.
TOTAL RATING _________________
DIS
AD
VAN
TAG
E
RAT
INGSolar
AD
VAN
TAG
E
FAC
T

© 2017 The NEED Project 8408 Kao Circle, Manassas, VA 20110 1.800.875.5029 www.NEED.org 17
1. Everything in the universe is made of tiny particles called atoms. In the center of each atom is a nucleus, with smaller particles.
2. The nucleus has energy that holds it together—nuclear energy. The nucleus of a uranium atom has lots of energy holding it together.
3. Uranium is a mineral buried underground. It is a nonrenewable energy source—we can’t make more uranium.
4. We have a lot of uranium in the U.S. It is a cheap energy source.
5. We can split atoms of uranium into two smaller atoms. When we split atoms of uranium, some of the nuclear energy is set free as heat.
6. We can use this heat to make electricity. The uranium isn’t burned, so there is no air pollution.
7. When we split uranium, rays of energy—called radiation—are also produced. This radiation can be very dangerous.
8. The waste from nuclear plants produces radiation for a long time. Many people are concerned about how to store this waste.
9. We transport uranium mostly by truck.
10. Almost one-tenth (8.6%) of the energy we use in the U.S. comes from uranium. It is used to make electricity.
TOTAL RATING _________________
DIS
AD
VAN
TAG
E
RAT
INGUranium
AD
VAN
TAG
E
FAC
T

18 Energy in the Balance
1. Wind is air in motion—kinetic energy.
2. The sun heats the Earth’s surface unevenly, causing the air over warmer surfaces to rise and cooler air to flow in—forming wind.
3. Wind energy is a renewable energy source. We will have wind as long as the sun shines.
4. Wind turbines can capture the energy in wind to make electricity. Many wind turbines placed together are called a wind farm.
5. Wind turbines take up a lot of land, but the land can also be used for farming or grazing animals.
6. Wind energy is free to use. It is also a clean energy source—no fuel is burned to make electricity.
7. Electricity from new wind turbines is an economical source of electricity.
8. Many places do not have enough wind to make electricity, and the wind doesn’t blow all the time.
9. We cannot transport wind energy. We must capture and use it where we find it.
10. Wind energy provides the U.S. with a very small amount (1.8%) of the energy we use. Wind is used to make electricity.
TOTAL RATING _________________
DIS
AD
VAN
TAG
E
RAT
INGWind
AD
VAN
TAG
E
FAC
T

© 2017 The NEED Project 8408 Kao Circle, Manassas, VA 20110 1.800.875.5029 www.NEED.org 19
e The Energy Sources We UseWhat percentage of the energy used in the U.S. does each source provide?
Complete the bar graph showing how much energy each energy source provides in the U.S. Write the names of the energy sources in the spaces at the bottom of the graph. Color the renewable sources green and the nonrenewable sources blue.
Biomass ________ %
Coal ________ %
Geothermal ________ %
Hydropower ________ %
Natural Gas* ________ %
Petroleum* ________ %
Solar ________ %
Uranium ________ %
Wind ________ %
*includes propane
E N E R G Y S O U R C E S
P E R C E N T A G E T H E S O U R C E P R O V I D E S50%
40%
30%
20%
10%
0%
20 Energy in the Balance
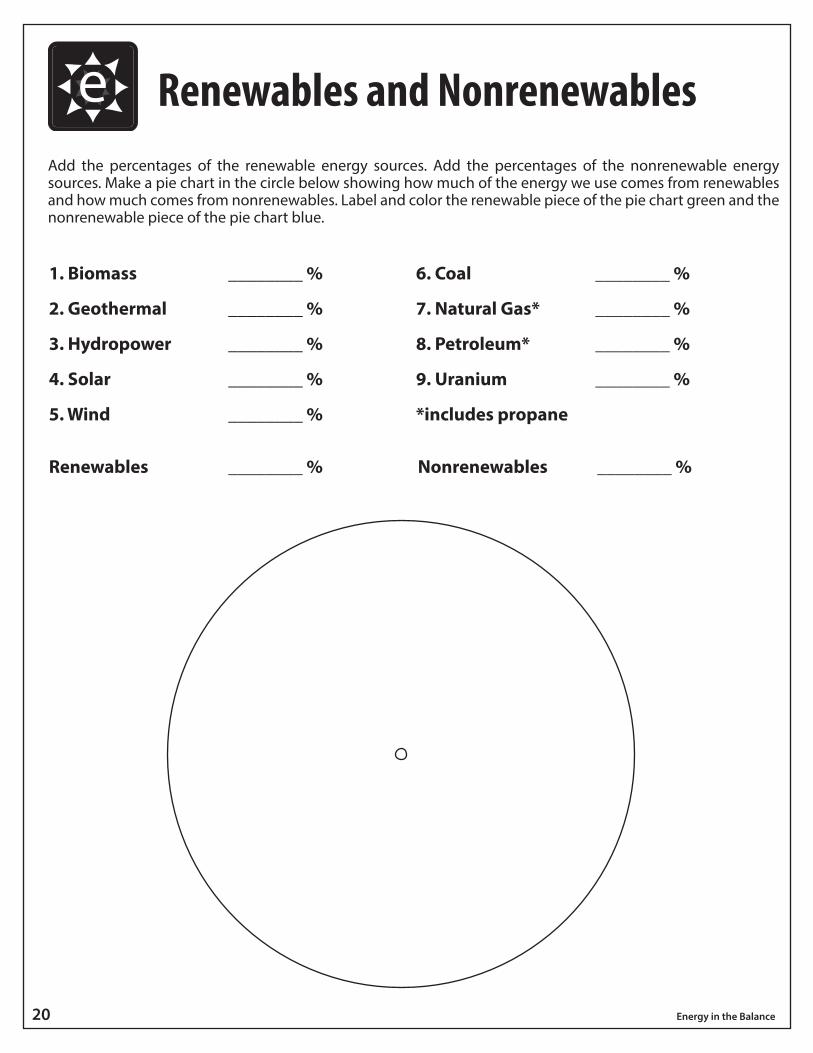
e Renewables and NonrenewablesAdd the percentages of the renewable energy sources. Add the percentages of the nonrenewable energy sources. Make a pie chart in the circle below showing how much of the energy we use comes from renewables and how much comes from nonrenewables. Label and color the renewable piece of the pie chart green and the nonrenewable piece of the pie chart blue.
1. Biomass ________ %
2. Geothermal ________ %
3. Hydropower ________ %
4. Solar ________ %
5. Wind ________ %
6. Coal ________ %
7. Natural Gas* ________ %
8. Petroleum* ________ %
9. Uranium ________ %
*includes propane
Renewables ________ % Nonrenewables ________ %

© 2017 The NEED Project 8408 Kao Circle, Manassas, VA 20110 1.800.875.5029 www.NEED.org 21
Transportation Make Products Heating/Cooling Lighting Make Electricity
Biomass
Coal
Geothermal
Hydropower
Natural Gas
Petroleum
Propane
Solar
Uranium
Wind
e How We Use Our Energy SourcesUse the rating sheets to determine the main uses of each energy source. In each box, list any uses for each source that fit the category. Shade or check off the box that shows each source's main use or uses.

22 Energy in the Balance
Awesome Extras!Our Awesome Extras page contains PowerPoints, animations, and other great resources to compliment what you are teaching! This page is available at www.NEED.org/educators.

© 2017 The NEED Project 8408 Kao Circle, Manassas, VA 20110 1.800.875.5029 www.NEED.org 23
Energy in the Balance Evaluation Form
State: ___________ Grade Level: ___________ Number of Students: __________
1. Did you conduct the entire activity? Yes No
2. Were the instructions clear and easy to follow? Yes No
3. Did the activity meet your academic objectives? Yes No
4. Was the activity age appropriate? Yes No
5. Were the allotted times sufficient to conduct the activities? Yes No
6. Was the activity easy to use? Yes No
7. Was the preparation required acceptable for the activity? Yes No
8. Were the students interested and motivated? Yes No
9. Was the energy knowledge content age appropriate? Yes No
10. Would you teach this activity again? Yes No Please explain any ‘no’ statement below.
How would you rate the activity overall? excellent good fair poor
How would your students rate the activity overall? excellent good fair poor
What would make the activity more useful to you?
Other Comments:
Please fax or mail to: The NEED Project 8408 Kao Circle Manassas, VA 20110 FAX: 1-800-847-1820

National Sponsors and Partners
Air Equipment CompanyAlaska Electric Light & Power CompanyAlbuquerque Public SchoolsAmerican Electric PowerAmerican Fuel & Petrochemical ManufacturersArizona Public ServiceArmstrong Energy CorporationBarnstable County, MassachusettsRobert L. Bayless, Producer, LLCBG Group/ShellBP America Inc.Blue Grass EnergyCape Light Compact–MassachusettsCentral Falls School DistrictChugach Electric Association, Inc. CITGOClean Energy CollectiveColonial PipelineColumbia Gas of MassachusettsComEdConEdison SolutionsConocoPhillipsConstellationCuesta College David Petroleum CorporationDesk and Derrick of Roswell, NMDirect EnergyDominion EnergyDonors ChooseDuke EnergyEast Kentucky PowerEnergy Market Authority – SingaporeEscambia County Public School Foundation EversourceExelon FoundationFoundation for Environmental EducationFPLThe Franklin InstituteGeorge Mason University – Environmental Science and PolicyGerald Harrington, GeologistGovernment of Thailand–Energy MinistryGreen Power EMCGuilford County Schools – North CarolinaGulf PowerHawaii EnergyIdaho National LaboratoryIllinois Clean Energy Community Foundation
Illinois Institute of TechnologyIndependent Petroleum Association of New MexicoJames Madison UniversityKentucky Department of Energy Development and IndependenceKentucky Power – An AEP CompanyKentucky Utilities CompanyLeague of United Latin American Citizens – National Educational Service CentersLeidosLinn County Rural Electric CooperativeLlano Land and ExplorationLouisville Gas and Electric CompanyMississippi Development Authority–Energy DivisionMississippi Gulf Coast Community Foundation Mojave Environmental Education ConsortiumMojave Uni�ed School DistrictMontana Energy Education CouncilThe Mountain InstituteNational FuelNational GridNational Hydropower AssociationNational Ocean Industries AssociationNational Renewable Energy LaboratoryNC Green PowerNew Mexico Oil CorporationNew Mexico Landman’s AssociationNextEra Energy ResourcesNEXTrackerNicor Gas Nisource Charitable FoundationNoble EnergyNolin Rural Electric CooperativeNorthern Rivers Family ServicesNorth Carolina Department of Environmental QualityNorth Shore GasO�shore Technology ConferenceOhio Energy ProjectOpterra EnergyPaci�c Gas and Electric CompanyPECOPecos Valley Energy CommitteePeoples GasPepcoPerformance Services, Inc. Petroleum Equipment and Services Association
Phillips 66PNMPowerSouth Energy CooperativeProvidence Public SchoolsQuarto Publishing GroupRead & Stevens, Inc. Renewable Energy Alaska ProjectRhode Island O�ce of Energy ResourcesRobert ArmstrongRoswell Geological SocietySalt River ProjectSalt River Rural Electric CooperativeSaudi AramcoSchlumbergerC.T. Seaver TrustSecure Futures, LLCShellShell ChemicalsSigora SolarSingapore Ministry of EducationSociety of Petroleum EngineersSociety of Petroleum Engineers – Middle East, North Africa and South AsiaSolar CityDavid SorensonSouth Orange County Community College DistrictTennessee Department of Economic and Community Development–Energy DivisionTeslaTesoro FoundationTri-State Generation and TransmissionTXU EnergyUnited Way of Greater Philadelphia and Southern New JerseyUniversity of KentuckyUniversity of MaineUniversity of North CarolinaUniversity of TennesseeU.S. Department of EnergyU.S. Department of Energy–O�ce of Energy E�ciency and Renewable EnergyU.S. Department of Energy–Wind for SchoolsU.S. Energy Information AdministrationUnited States Virgin Islands Energy O�ceWayne County Sustainable EnergyWestern Massachusetts Electric CompanyYates Petroleum Corporation
©2017 The NEED Project 8408 Kao Circle, Manassas, VA 20110 1.800.875.5029 www.NEED.org