energy for india information board of directors sir william b.b. gammell (chairman) malcolm shaw...
TRANSCRIPT

Energy for India
ANNUAL REPORT & FINANCIAL STATEMENTS
Securing EnergyFuelling Growth
Desig
ned
by
ww
w.ic
din
dia
.co
m &
Printe
d a
t H
T B
urd
a M
ed
ia L
td.
Cairn India Limited
3rd & 4th Floors, Vipul Plaza, Sun City
Sector 54, Gurgaon 122 002, India
+91 124 270 3000
www.cairnindia.com
Cairn
Ind
ia L
imite
d A
nnual R
ep
ort &
Fin
ancia
l Sta
tem
ents
20
09
–10

C O M PA N Y I N F O R M AT I O N
BOARD OF DIRECTORS
Sir William B.B. Gammell (Chairman)
Malcolm Shaw Thoms (Deputy Chairman)
Jann Brown
Naresh Chandra
Dr Omkar Goswami
Aman Mehta
Edward T. Story
Rahul Dhir (Managing Director & Chief Executive Offi cer)
Indrajit Banerjee (Executive Director & Chief Financial Offi cer)
Rick Bott (Executive Director & Chief Operating Offi cer)
BOARD COMMITTEES
Audit Committee
Aman Mehta (Chairman)
Naresh Chandra
Dr Omkar Goswami
Edward T. Story
Jann Brown
Remuneration Committee
Naresh Chandra (Chairman)
Sir William B.B. Gammell
Malcolm Shaw Thoms
Aman Mehta
Dr Omkar Goswami
Nomination Committee
Sir William B.B. Gammell (Chairman)
Rahul Dhir
Jann Brown
Malcolm Shaw Thoms
Edward T. Story
Shareholders’ / Investors’ Grievance Committee
Dr Omkar Goswami (Chairman)
Edward T. Story
Rahul Dhir
COMPANY SECRETARY
Neerja Sharma
STATUTORY AUDITORS
S.R. Batliboi & Associates
Golf View Corporate Tower B
Sector 42, Sector Road
Gurgaon 122 002, India
BANKERS
State Bank of India | Standard Chartered Bank |
Deutsche Bank | Citibank
STOCK EXCHANGES LISTED ON
Bombay Stock Exchange Limited
Phiroze Jeejeebhoy Towers,
Dalal Street, Mumbai – 400 001
Tel +91 22 22721233/4
Fax +91 22 22721919
National Stock Exchange of India Limited
Exchange Plaza,
Plot No, C/1, G Block,
Bandra-Kurla Complex,
Bandra (E),
Mumbai – 400 051
Tel +91 22 26598100-8114
Fax +91 22 26598120
REGISTERED OFFICE
101, West View
Veer Savarkar Marg
Prabhadevi
Mumbai 400 025, India
Tel +91 22 24338306
Fax +91 22 24311160
CORPORATE OFFICE
3rd & 4th Floors, Vipul Plaza
Sun City, Sector 54
Gurgaon 122 002, India
Tel +91 124 2703000
Fax +91 124 2889320
REGISTRAR & SHARE TRANSFER AGENT
Link Intime India Private Limited
C-13, Pannalal Silk Mills Compound
L.B.S. Marg, Bhandup (West)
Mumbai 400 078, India
Contents
Board of Directors
Chairman's letter
Managing Director and CEO's letter
Management Discussion and Analysis
Securing Energy, Fuelling Growth
Delivering to the Nation
Corporate Social Responsibility
Report on Corporate Governance
Additional Shareholder Information
Directors’ Report
Auditors’ Report
Balance Sheet
Profi t and Loss Account
Statement of Cash Flows
Schedules to the Financial Statements
Balance Sheet Abstract and Company’s General Business Profi le
Auditors’ Report on Consolidated Financial Statements
Consolidated Balance Sheet
Consolidated Profi t and Loss Account
Consolidated Statement of Cash Flows
Schedules to Consolidated Financial Statements
Glossary
2
5
6
8
20
42
44
48
56
62
68
72
73
74
76
97
98
99
100
101
103
128

The operational activity was largely focused on the development of the Mangala Processing Terminal (MPT) at Barmer, Rajasthan and the crude oil pipeline. The MPT is designed to process crude from the Mangala, Bhagyam and Aishwariya (MBA) fi elds and will have a capacity to handle 205,000 barrels of oil per day (bopd) of crude with scope for further expansion.
The MPT consists of four processing trains
Train One, with a capacity of 30,000 bopd, was commissioned on 29 August, 2009, with
crude oil being trucked to the Kandla port for shipping to both Public Sector Undertaking
(PSU) and private refi ners.
Train Two, with a capacity of 50,000 bopd, commenced production in May 2010.
Train Three, with a capacity of 50,000 bopd, will be completed by June 2010.
Train Four, with a capacity of 75,000 bopd, is expected to come on stream in CY 2011.
The ~590 km heated and insulated crude oil pipeline from Barmer in Rajasthan to Salaya
in Gujarat is complete. Crude oil was introduced into the pipeline in May 2010. By June
2010, it will supply crude to private refi ners and to Indian Oil Corporation Limited in
early July, 2010.
Sales arrangements are in place for 143,000 bopd of Rajasthan crude.
81 wells including six horizontals have been drilled. Horizontal wells tested at an average
rate of more than 11,500 bopd, the highest ever production rate for an onshore well in India.
The potential resource base for the Rajasthan block is now estimated to be 6.5 billion
barrels of oil equivalent (boe) in place. The discovered resource base has increased
from 3.7 billion boe to 4 billion boe in place. As a result of the exploration potential, the
prospective resource base is now estimated at 2.5 billion boe in place.
The Rajasthan resources provide a basis for a vision to produce 240,000 bopd, subject to
Government of India (GoI) approval and additional investment.
The Rajasthan project is now well funded, with Cairn India having completed the fi nancing
arrangements for USD 1.6 billion at competitive pricing — comprising international
borrowing of USD 750 million and domestic borrowing of INR 4,000 crore (USD 850 million).
Gross operated production was 69,059 barrels of oil equivalent per day (boepd) and net
working interest was 24,957 boepd. This takes into account the Rajasthan production from
29 August, 2009.
T H E H E A D L I N E S F O R F I N A N C I A L Y E A R 2 0 0 9 - 10
30
,00
0 B
OP
D
AU
GU
ST
20
09
50
,00
0 B
OP
D
UN
DE
R C
ON
ST
RU
CT
ION
50
,00
0 B
OP
D
MA
Y 2
010
75
,00
0 B
OP
D
UN
DE
R C
ON
ST
RU
CT
ION
2.5 billion BOEPROSPECTIVE
4 billion BOEDISCOVERED
USD 750 millionINTERNATIONAL
BORROWING
USD 850 millionDOMESTIC BORROWING

2 CAIRN INDIA LIMITED AN N UAL R E PORT 2009-10
S I R B I L L G A M M E L L
Chairman and Non-Executive Director
Sir Bill Gammell, 57, holds a BA in Economics and Accountancy from Stirling University and was awarded a knighthood in 2006 for services to the industry in Scotland. He has over 25 years of experience in the in-ternational oil and gas industry. He founded Cairn Energy PLC and was appointed Chief Executive on its initial listing in 1988. He is the Chairman and Non-Executive Director of Cairn India Limited and is a member of the Asia Task Force and the UK India Business Council. Sir Gammell, who is an ex-Scotland rugby internationalist, is also Chairman of Winning Scotland Foundation and a Director of Sport Scotland and Glasgow 2014 Limited and a member of the British Olympic Advisory Board.
M R R A H U L D H I R
Managing Director and CEO
Mr Rahul Dhir, 44, joined Cairn India in May 2006 as the Chief Executive Offi cer and was appointed the Managing Director on 22 August, 2006. He completed his degree in Bachelor of Technology from the Indian Institute of Technology, Delhi. He went on to complete his M.Sc from the University of Texas at Austin and MBA from the Wharton Business School in Pennsylvania. Mr Dhir started his career as an oil and gas reservoir engineer before moving into investment banking. He has worked at SBC Warburg, Morgan Stanley and Merrill Lynch. Before joining Cairn India, he was the Managing Director and Co-Head of Energy and Power Investment Banking at Merrill Lynch.
M R R I C K B OT T
Executive Director and COO
Mr Rick Bott, 50, was appointed as Additional Director on 29 April, 2008 and assumed offi ce of Executive Director and Chief Operating Offi cer with effect from 15 June, 2008. Mr Bott holds a B.S in Marine Sciences and Masters in Geology from Texas A&M. Mr Bott has global exploration and production experience of more than 21 years and has served in several senior positions in Ocean Egypt Companies, Ocean Yemen Corporation, British Gas, and Tenneco. Before joining Cairn India, he was Vice President of Devon Energy’s International Division, responsible for developing and implementing business growth and exploration strategy for assets in 12 countries outside of North America.
M R I N D R A J I T B A N E R J E E
Executive Director and CFO
Mr Indrajit Banerjee, 54,was appointed as an Additional Director on 26 February, 2007 and as the Executive Director and Chief Financial Offi cer on 1 March, 2007. He graduated from the University of Calcutta with a Bachelor’s Degree in Commerce. An associate member of the Institute of Chartered Accountants of India, Mr Banerjee started his career at PriceWaterhouse Coopers in Calcutta in 1979. He has held several senior posi-tions throughout his career, including 17 years at the Indian Aluminium Company, formerly part of the Alcan Group and at Lucent Technologies (India). Before joining Cairn India, he was President-Finance and Planning at Lupin Limited.
Board of Directors

3BOARD OF DIRECTORS
M R A M A N M E H TA
Non-Executive and
Independent Director
Mr Aman Mehta, 63, is an economics graduate from Delhi University. He was earlier the Chief Executive Offi cer of HSBC Asia Pacifi c until 2003. Mr Mehta is currently an independent non-executive director of several public companies in India as well as overseas. Besides this he is also a member of the Advisory Council of INSEAD, France and International Advisory Boards of Prudential Inc., USA and CapitaLand Ltd. of Singapore.
M R N A R E S H C H A N D R A
Non-Executive and
Independent Director
Mr Naresh Chandra, 75, holds an MSc. in Mathematics from Allahabad University and is a retired IAS offi cer.Previously, Mr Chandra was the Chairman of the Committee on Corporate Governance, India’s Ambassador to the USA, Advisor to the Prime Minister, Governor of Rajasthan, Cabinet Secretary to the Government of India, and Chief Secretary to the Government of Rajasthan. A reputed administrator and diplomat, Mr Chandra serves as an independent director on the boards of a number of companies.
D R O M K A R G O S WA M I
Non-Executive and
Independent Director
Dr Omkar Goswami, 53, holds a Master of Economics Degree from the Delhi School of Economics. He is a D.Phil. in Economics from Oxford University. He has authored various books and research papers on economic history, industrial economics, public sector, bankruptcy laws and procedures, economic policy, corporate fi nance, corporate governance, public fi nance, tax enforcement and legal reforms.
M R E D WA R D T S TO RY
Non-Executive and
Independent Director
Mr Edward T Story, 66, is a science graduate from Trinity University, San Antonio, Texas and holds a Masters degree in Business Administration from the University of Texas and has been con-ferred an honorary Doctorate degree by the Institute of Finance and Economics of Mongolia. He is the Chairman of the North America Mongolia Business Council. Mr Story has more than 40 years of experience in the international oil and gas industry and is the founder, President and Chief Executive Offi cer of the LSE listed SOCO International PLC.
M S J A N N B R OW N
Non-Executive Director
Ms Jann Brown, 55, was appointed Finance Director of Cairn Energy PLC in 2006 and is also a Non-Executive Director of Cairn India Limited. She holds an MA degree from Edinburgh University and joined Cairn Energy PLC in 1998 after a career in the accountancy profession, mainly with KPMG. Prior to her appoint-ment as Finance Director, she served on the Group Management Board for seven years. She is a member of the Institute of Chartered Accountants of Scotland and the Chartered Institute of Taxation. She is the Senior Independent Director of Hansen Transmissions International NV, a Belgian engineering company, which is listed on the London Stock exchange.
M R M A L C O L M S H AW T H O M S
Non-Executive Director
Mr Malcolm Shaw Thoms, 54, holds a BSc Hons degree in Physics from Edinburgh University. He is an MBA from Heriot- Watt University and is currently trustee of the University of Edinburgh Development Trust. He started his career in the oil industry with Schlumberger and became the manager of their businesses in Qatar and Brunei. He joined Cairn Energy PLC in 1989 and held a number of senior management positions prior to his ap-pointment as Executive Director in 2000. Currently, the Chief Operating Offi cer of Cairn Energy PLC, Mr Thoms is a Non-Executive Director of Cairn India Limited and has recently been appointed as a Non-Executive Director of Agora Oil & Gas AS.

CAIRN INDIA LIMITED AN N UAL R E PORT 2009-104
NIGHT VIEW OF TRAIN ONE FACILITIES AT
THE MANGALA PROCESSING TERMINAL

5
First oil from Rajasthan in August 2009 and the subsequent fl ow of crude through the world’s lon-gest continuously heated and insulated oil pipe-line has been the culmination of a journey of part-nership and co-operation between your Company and the Government of India, the Government of Rajasthan, the Government of Gujarat, the Oil and Natural Gas Corporation (ONGC) and other stakeholders.
It was a great honour to have the Honourable Prime Minister of India, Dr Manmohan Singh, inaugurate the Mangala Processing Terminal on 29 August, 2009. It was a proud day for everybody involved in the growth of Cairn India.
Six years on from the major discovery of Mangala in January 2004, the development in Rajasthan is starting to deliver for the government and the people of India. It has been a huge achieve-ment to develop this project in the middle of a des-ert, and to construct the pipeline from Rajasthan to the coast of Gujarat, which will eventually allow access to 75 per cent of India’s refi ning capacity.
At the peak of construction, more than 16,000 people were involved in building the Mangala Processing Terminal, the pipeline and related infrastructure — making it one of the biggest oil and gas production developments in India in recent years.
When the Rajasthan fi elds are on production at the current approved peak production plateau rate of 175,000 bopd, Cairn India, along with its joint venture partner ONGC, will account
for more than 20 per cent of India’s overall oil output. Your Company has a belief and vision that, subject to further investment and approval from the Government of India, the Barmer Basin can produce 240,000 bopd.
The Mangala fi eld is one of the 25 discoveries that have been made in the Barmer Basin, and I look forward to many long years of production as additional fi elds are appraised, developed and tied in to this world-class infrastructure.
Working effectively with government agencies and partners is fundamental wherever we operate. But the Rajasthan development has meant even more intense and continuous co-operation. The support of the Government of India, the state governments, ONGC, local communities and key contractors has been vital in helping complete this national asset. I would personally like to thank all who have played their part in developing this key project for the country.
With a strong and sustainable cash fl ow, Cairn India is well positioned for future growth. It is focused on maximising value from the phased development of the Rajasthan resource base in the coming years.
May your Company thrive—and with it, India.
Sir Bill GammellChairman
CHAIRMAN'S LETTER
Chairman’s Letter
Dear Shareholder,
Your company is helping to play a part in meeting the energy security needs of India with oil and gas production from its operations across the country. While consumption of oil across the globe in the last year has dipped, it continues to rise in India. The International Energy Agency, a policy and research group based in Paris, has forecast in November 2009 that India’s energy demand would more than double by 2030. With GDP in India predicted to continue at its current rate the country will need energy to help meet its economic growth. Your company ultimately has the potential to produce more than 20 percent of India’s crude output that will go towards meeting the country’s energy needs. The development in Rajasthan has a key role to play in the energy security plans of the country.

CAIRN INDIA LIMITED AN N UAL R E PORT 2009-106
By the time you read this, your Company will be in a position to produce 130,000 bopd from Barmer. By next year, Cairn India’s production from Rajasthan will be at 175,000 bopd — or over a fi fth of India’s crude oil output.
It has been an incredible journey. As I look back over the last two years, it has been the story of a team of committed and dedicated people overcoming one challenge after another.
Think about it: More than 16,000 people work-ing in deserts of Rajasthan and northern Gujarat where the day temperature soars to between 46°C and 51°C. Ensuring each of the many thousand processes and parts were up and ready in time, despite huge infrastructure constraints, was a huge achievement. Consider some of the big ele-ments of the project:
Setting up various wells at Mangala, � using the latest technology to get not only the maximum throughput but also the maximum life out of each well
Securing the gas supply which is 90 km � away from the Mangala Processing Terminal to fi re the boilers to drive the steam turbines at the process-ing terminal and to heat the pipeline
Piping saline water from a sub-surface reservoir � to be used to pump out the crude and to be desali-nated, creating steam and drinking water
Constructing a state-of-the-art processing �
terminal at Mangala with thousands of different
elements and equipment — a terminal that can process up to 205,000 bopd, with fl exibility for further expansion
Creating a massive closed loop system � to con-serve and re-use environmental resources in the most energy effi cient manner
Building a ~590 km continuously heated and �
insulated 24” pipeline from Barmer in Rajasthan to Salaya in Gujarat with a terminal at Viramgam and 36 heating stations approximately 18 km apart along the route. The next segment to the coast at Bhogat will follow soon.
That’s not all. Consider the kind of cutting edge technologies that your Company has put to use: the drilling of horizontal wells, pad-based drilling, rapid rigs and world-class well designs, enhanced oil recovery, skin effect heat management system using electric heat induction technology to heat the length of the pipeline at a constant tempera-ture above 65°C, hydro-fracturing of less perme-able reservoirs, and many others. All these have been tested, modifi ed, optimised and implement-ed in your Company’s Rajasthan project.
These activities — both in the upstream and midstream — cost a great deal of money. The challenge, therefore, was to secure funds at globally competitive rates. At a time when the world was reeling under the fi nancial crisis, your
Managing Director and CEO’s Letter
Dear Shareholder,
I write this letter with a sense of fulfi lment. The management of Cairn India Limited, with the support of our joint venture partner, ONGC, has delivered its promise of supplying crude oil to our nation.
On 29 August, 2009, Dr Manmohan Singh, the Honourable Prime Minister of India, inaugurated the Company’s fi rst oil from the Mangala Processing Terminal at Barmer, and dedicated the fi eld to the nation. Initially, the oil from Train One of up to 30,000 bopd was being trucked to different refi neries. In May 2010, Train Two with a capacity of 50,000 bopd was commissioned. In June 2010, the ~590 km heated pipeline from Barmer to Salaya in Gujarat was made operational. As I write, oil is fl owing through this pipeline to Indian Oil Corporation and private refi ners. And Train Three, with a capacity of another 50,000 bopd, has become operational.
7MANAGING DIRECTOR AND CEO'S LETTER
Company’s management succeeded in raising USD 1.6 billion at internationally competitive rates — International borrowing facility of USD 750 million and domestic borrowing facility of INR 4,000 crore (USD 850 million). This has been used to repay the existing debt of USD 850 million and fund the ongoing projects in Rajasthan. It was a great honour that this fi nanc-ing arrangement was awarded the Oil & Gas Deal of the Year (in Asia).
It is one thing to pump and fl ow the oil, and to fi nance it; it is yet another to fi nd the buyers. Here too, your Company has performed very well. It has secured approval of multiple delivery points, got the green light for selling to private sector refi neries, locked in multiple buyers, achieved a pricing benchmarked to low sulphur international crude at a 10% to 15% discount to Dated Brent, and has already got commitments for 143,000 bopd as of 31 March, 2010.
Thanks to an outstanding job executed by your Company’s upstream and midstream teams, the operating expense of Rajasthan — includ-ing the pipeline — is estimated at ~USD 5 per barrel. Even after adding the interest and overhead charges, the cost of Rajasthan oil will be in the neighbourhood of USD 10 per barrel. Therefore, under any realistic pricing scenario, your Company should generate returns for all its stakeholders.
Today, it is not enough to be operationally successful and therefore profi table. Companies like ours must consciously strive to meet societal goals. I am proud to say that Cairn India has played a leading role in this front — from the per-spective of both the environment and corporate social responsibility. The chapter on Management Discussion and Analysis, a part of this Annual Report gives a summary of your Company’s achievements in occupational health, safety and environment (HSE). And a separate chapter on corporate social responsibility (CSR) lists the vari-ous initiatives that Cairn India carries out in this regard. I am as satisfi ed with your Company’s
HSE and CSR activities as I am with its opera-tions in Rajasthan, Ravva and Cambay.
You will read about all these and more in the chapters that follow. It is now required of me to thank six sets of stakeholders.
First, � the Government of India, the Government of Rajasthan and the Government of Gujarat, who have been exemplary in their support
Second, � the people, local communities, non-governmental organisations and district authori-ties in Rajasthan and Gujarat, who have co-oper- ated and worked with us throughout the period
Third, � ONGC,our partner in the Rajasthan proj-ect, without whose steady and supporting hand little could have been achieved
Fourth, � the various suppliers, contractors and contracting companies that helped set up the Mangala Processing Terminal and the pipeline
Fifth, � the team leaders and each and every em-ployee of Cairn India, who together ensured that we will overcome all odds and forge ahead
And fi nally, � to you, for your faith in Cairn India’s ability to deliver long term value.
It has been a great journey. And it will be even better in the years to come. Stay with us!
Thank you for your support.
Rahul DhirManaging Director and CEO
It has been the story of a team of committed and dedicated people overcoming one challenge after another

8 CAIRN INDIA LIMITED AN N UAL R E PORT 2009-108
Delivering tothe Nation
MANAGEMENT
DISCUSSION AND ANALYSIS
MANAGEMENT DISCUSSION AND ANALYSIS 9

CAIRN INDIA LIMITED AN N UAL R E PORT 2009-1010
The Mangala fi eld is not the beginning of the involvement with the Indian hydrocarbon sector for Cairn India Limited (‘Cairn India’, ‘CIL’, ‘Cairn’ or ‘the Company’). We started in India some 15 years ago with the operating rights of the Ravva block in the Krishna-Godavari basin of Andhra Pradesh. From then on it has been an eventful journey: one of India’s fastest discovery to production stories was witnessed in the CB/OS-2 block (in Cambay, off the coast of Gujarat); a doubling of reserves and sustenance of plateau rates in the Ravva block for more than nine years; 25 discoveries in Rajasthan including the landmark Mangala discovery, whose oil now fl ows to various refi neries in the country.
Nor is Mangala the end. In Rajasthan alone, the Company has discovered other fi elds viz. Bhagyam and Aishwariya, which will be on stream in the near future, and is actively exploring the potential of future developments in the further 22 discover-ies, incluing the Barmer Hill tight reservoirs. Cairn
is also conducting systematic exploratory work in several other onshore and offshore areas in India and off the coast of Sri Lanka where the Company believes there is signifi cant hydrocarbon potential.
As an Indian listed company, Cairn India is com-mitted to securing energy for the nation — thus fuelling its growth.
In this chapter on Management Discussion and Analysis, we begin with Rajasthan — the MPT, the heated and insulated pipeline, Rajasthan crude sales, enhanced oil recovery and hydrocarbon resources in the area. We then move on to the Company’s other operating assets. Thereafter, we discuss exploration. This is followed by the Company’s human resources and health, safety and environment. The chapter concludes with internal controls and their adequacy, fi nancial re-sults, business risks and the business outlook. The Company’s focus on CSR is outlined in the chapter that follows.
As an Indian listed company, Cairn India is committed to securing energy for the nation
29 was a red-letter day in the history of Cairn India Limited. Dr Manmohan Singh, the Honourable Prime Minister of India,
dedicated the Mangala fi eld to the nation and inaugurated the Company’s fi rst oil production from the Mangala Processing Terminal at Barmer, Rajasthan in the presence of Shri Ashok Gehlot, the Honourable Chief Minister of Rajasthan and Shri Murli Deora, the Honourable Union Minister for Petroleum & Natural Gas. Crude oil has started fl owing through the world’s longest continuously heated and insulated pipeline from MPT, in Barmer to Salaya in Gujarat, in preparation of sales to some of the major refi neries in India. Soon, Cairn India’s production from Rajasthan, at the currently approved rate of 175,000 bopd, will account for more than 20% of India’s domestic crude oil production.
AUG 2009

MANAGEMENT DISCUSSION AND ANALYSIS 11
The Rajasthan Project
In essence, the Rajasthan project is about com-mercialising the world class discoveries, getting the oil and gas production to market and nurtur-ing and enhancing the resource base in the region — thus providing additional supply of energy that is vital for India’s growth needs. It involves four sets of activities:
Producing crude oil from the three main fields � fi rst Mangala, then Bhagyam and Aishwariya, followed by other fi elds through the development and operations of the MPT.Flowing crude through the continuously heated �
and insulated pipeline from the MPT at Barmer to Bhogat on the coast of Gujarat via Viramgam and Salaya.Enhancing Rajasthan’s resources through tech- �
nology applications in reservoir development, management, enhanced oil recovery (EOR), focused development efforts in low permeabil-ity reservoirs such as the Barmer Hill and the phased development of other fi elds.Further exploration � in other parts of the Rajasthan block, which is spread over 3,111 km2, where the Company believes there are signifi -cant prospects.
Cairn came into Rajasthan in the late 1990s, when it acquired an interest in the block RJ-ON-90/1. It soon realised that the area was rich in
The Rajasthan Fields
BHAGYAM
N-I-NORTH
SHAKTI
SHAKTI NE
N-I
NC WEST OIL & GAS
BHAGYAM SOUTH
MANGALA
MANGALA BARMER HILL
AISHWARIYA
N-E
VANDANA
VIJAYA
GS-V
SARASWATI CREST
SARASWATI
KAAMESHWARI
RAAGESHWARI OIL
SHAHEED TUKARAM OMBALE
RAAGESHWARI DEEP GAS
GUDA
OIL FIELD
GAS FIELD
OIL DISCOVERY
GAS DISCOVERY
OIL SHOWS
OIL DISCOVERY & GAS SHOWS
CURRENT OPERATIONS
DEVELOPMENT AREA 2
Awarded November 2008
N-P
DEVELOPMENT AREA 3
Awarded December 2008
KAAMESHWARI WEST-6 GAS
KAAMESHWARI WEST-3 GAS
KAAMESHWARI WEST-2 OIL
DEVELOPMENT AREA 1
Awarded October 2004
0 5
KILOMETRES
10 20
I N D I A
HONOURABLE PRIME MINISTER OF INDIA,
DR MANMOHAN SINGH, INAUGURATING FIRST
OIL PRODUCTION FROM THE MANGALA FIELD

CAIRN INDIA LIMITED AN N UAL R E PORT 2009-1012
MPT’s Four Oil Processing Trains
Train One Capacity of 30,000 bopd from
the Mangala fi eld which was inaugurated
by our Prime Minister on 29 August, 2009,
and is on stream.
Train Two Capacity of 50,000 bopd, also
from the Mangala fi eld, which commenced
production in May 2010.
Train Three Capacity of 50,000 bopd is
targeted for completion in June 2010 — to
access the plateau production from the
Mangala fi eld.
Train Four Capacity of 75,000 bopd,
designed to accommodate production
from Bhagyam and Aishwariya and further
expansion, will be commissioned in 2011.
hydrocarbons and possessed all the key ingredients for successful commercial production. By 2003, Cairn had acquired 100% of the exploration interest and assumed the role of operator of this acreage.
In 2004, the Mangala Field was discovered which is considered to be the largest onshore discovery in India in the last 25 years. This was followed by the key discoveries at Bhagyam and Aishwariya, which along with Mangala, comprise the MBA fi elds. To date, 25 discoveries have been made in the Rajasthan block.
Cairn India is the operator of the Rajasthan block with a 70% participating interest and its joint venture (JV) partner, ONGC has a 30% participat-ing interest.
The Rajasthan block consists of three
contiguous development areas
Mangala, Aishwariya, Raageshwari and Saraswati 1 (MARS) fields Bhagyam and Shakti fields 2 Kaameshwari West fields 3 The commercialisation and development phases
have resulted in successive de-risking of the value of these assets by removing the binary risks that were present at the end of the Exploration Phase. Rajasthan is considered a relatively low risk onshore project versus working in the offshore environ-ment with its inherently high costs and operational challenges. The wells are relatively shallow; and the team has a good understanding of the reser-voirs through extensive appraisal and development work. The Rajasthan crude can be extracted using industry best practices in oilfi eld technology; and recovery is expected to be further enhanced through proven tertiary methods, such as EOR.
More than 350 wells and over 40 well pads are currently planned across the Rajasthan fi elds. At the current approved peak production rate from the MBA fi elds of 175,000 bopd, Cairn India will contribute more than 20% of India’s crude oil production by 2011. Subject to GoI approval and additional investments, the Rajasthan resource base now provides a basis for a vision to produce 240,000 bopd — or 37% more than the currently approved peak production, which could ultimately translate to about 35% of India’s domestic crude oil production.
In the fi rst month of operation Train 2 operated at 97% effi ciency and confi rmed nameplate capac-ity. To date, both Trains One and Two have together processed over 4 million barrels of crude oil.
The Mangala Processing Terminal
(MPT) has been designed as a
centralised hub facility to handle
crude oil production from the MBA
fi elds as well the smaller fi elds
that have been discovered by the
Company. It will be able to process
205,000 bopd of crude; and has
been designed with suffi cient
fl exibility to be later expanded to
process more crude, depending
upon the resource potential of
the block. The resource base
established in the block provides
a vision to produce 240,000
bopd, subject to further regulatory
approvals and aditional investments.
T H E M A N G A L A P R O C E S S I N G T E R M I N A L
At the currently approved peak production rate of 175,000 bopd from the MBA fi elds, Cairn India will contribute more than 20% of India’s crude oil production by 2011
Subject to GoI approval and additional investment, the Rajasthan resource base now provides the basis for a vision to produce 240,000 bopd — or 37% more than the currently approved peak production rate, which could ultimately translate to about 35% of India’s domestic crude oil production

MANAGEMENT DISCUSSION AND ANALYSIS 13
The MPT uses boilers to produce steam, which drives the
turbines to generate power. A closed loop system of steam
condensate recovery helps to meet the feed water requirement
of boilers and the heating requirement of various process units
and also the power fl uid for injection into the oil wells. This
closed loop system has resulted in effi cient power management
and in turn, has resulted in lower emissions.
Sub-surface saline water is transported to the MPT by a 20”
pipeline from the Thumbli reservoir, which is 22 km from the
terminal.
Some of this water is desalinated to:
feed the fi ve boilers at the MPT to generate steam for heating, �
drive the turbines to generate electricity as well as to aid water-
fl ooding of the oil reservoirs, and
supply drinking and bathing water at the terminal. �
The remaining saline water, with some steam, is injected into the
oil reservoirs for the extraction of crude. Any excess water in this
fl ooding is trapped and re-used.
Gas is needed to fi re the boilers to generate steam, which in
turn generates the power to heat the waxy crude at an average
of 65°C along the pipeline. It comes from the Raageshwari gas
fi eld, located some 90 km away from the MPT. The Raageshwari
Gas Terminal (RGT), with four gas well pads and 35 wells, is
designed to produce dry gas of over 30 million standard cubic
feet per day (mmscfd). It is transported via a 12” gas pipeline to
the MPT and the gas liquids, or condensate, by a separate 4”
pipeline.
OIL RECOVERY SYSTEM
THE CLOSED LOOP SYSTEM
PANORAMIC VIEW OF THE
MANGALA PROCESSING TERMINAL

14 CAIRN INDIA LIMITED AN N UAL R E PORT 2009-10
E N V I R O N M E N T M A N AG E M E N T AT T H E M P T
The MPT facility has been designed to conserve and
minimise the impact on the surrounding environment.
There is almost zero surface disposal of any solid or
liquid waste. The facility meets its water demand from
the abundant supply of sub-surface saline water, without
any need to draw on scarce freshwater resources of
the area. Its energy demands are met by utilising the
associated gas produced from the separation of well
fl uid, backed up by gas from the Raageshwari gas fi eld.
Power generation is achieved by using steam as the
means to transfer energy in a closed loop cycle — with
the medium and low pressure steam being utilised for
heating. A closed drainage system routes all hydrocarbon
liquid discharges to tanks, from where these circulate
back for reprocessing. All vapour emissions from vessels
and tanks are directed to the vapour recovery system
where these are pressure-conditioned and compressed
— to be fed back into the fuel gas system. At the MPT,
gas fl aring is only done in the case of an emergency.
There is also no cold venting of gas at the MPT.
All waste-water, reject water and wash water are routed
to the injection water system for re-injection into the oil
reservoir. In case of any operational issue — where a
specifi c type of waste water discharge cannot be mingled
with the injection stream— there is a provision for solar
evaporation ponds and deep dump wells, which can help
in the disposal without causing any environmental harm.
In addition, there is a dedicated secure landfi ll facility
complying with the national standards on landfi ll design
for the storage and disposal of non-recyclable wastes.
14 CAIRN INDIA LIMITED AN N UAL R E PORT 2009-10

MANAGEMENT DISCUSSION AND ANALYSIS 15
Saline water sourcing
The MPT facility utilises sub-surface
saline water to meet its operational
and potable water needs. The Thumbli fi eld,
22 km south-east of the MPT, is a massive
saline water underground reservoir. The
fresh water lens rides over the saline water
— and is located 12 km north-west of the
saline water abstraction zone. The country’s
regulatory body has accorded its approval
for saline water abstraction after carefully
reviewing the results of the detailed
modelling study. An extensive and ongoing
groundwater monitoring programme is
in place to monitor the behaviour of the
various aquifer systems in response to
the saline water abstraction. The systems
are designed to give early warning of
any potential issue so that they can be
corrected before problems arise.
Freshwater
The freshwater requirements of
the MPT are met by desalination
of about 4,000 cubic metres of water per
day. The reject water from the desalination
process is co-mingled with the well
injection water — for injecting it back
into the oil reservoir. There is no surface
discharge of the reject water.
Closed Drain System
A closed drain system routes
wastewater and fl uids from the
various vessels, process units and tanks to
a collection tank. Thereafter, this is pumped
into an off-spec oil tank for re-circulating
to the inlet manifold for processing. All
equipment handling hydrocarbon liquids
and water containing hydrocarbons are
connected to the closed drain system.
Open Drain System
An open drain system collects drain
fl uids from equipment that is not
under pressure and routes it into collection
tanks. These fl uids are then put back into
the process through either the off-spec
oil tank or the produced water treatment
system.
Vent Gas Recovery Units
Hydrocarbon vapour from the
various process units, vessels and
tanks, including the crude oil storage
tanks, is recovered and fed into a two-
stage vapour recovery unit — and fed
into the fuel gas system. There will be no
venting of hydrocarbons during normal
routine operations.
Greenbelt Development
In accordance with our bio-diversity
commitments, the development of
a greenbelt within the MPT, the pipeline
corridors and the well pads is being done
keeping in mind that no alien invasive
species is introduced. The expertise of a
local specialist organisation, The School
of Desert Sciences, is being taken for
selection of appropriate species and for
training of local community for maintaining
the greenbelt.
Solid Waste Management System
A common captive landfi ll
disposal site, including a high
temperature incinerator facility, is being
established within the MPT. The landfi ll
will serve as a disposal facility for all
non-recyclable wastes generated from
the MPT operation and the associated
well drilling programmes. The landfi ll is
segregated into a hazardous waste and a
non-hazardous waste section. It is being
developed in a phased manner, and
will have the capacity to handle waste
generated over a 20-year period. It is
designed in compliance with international
best practices and in line with national
laws and guidelines.
Produced Water Treatment and Disposal
Produced water generated from
the well fl uid phase separation is
treated in the Produced Water Treatment
Plant to separate any of the carried over
sediments and oil traces. This is achieved
using an induced gas fl oatation process.
The treated produced water is then re-
injected into the oil reservoir. There is no
surface discharge of produced water.
Flaring System
The fl aring system is provided to
safely route the emergency release
of hydrocarbons to the Flare Knock-Out
drums and then to the fl are tips. The fl are
system will only be required in emergency
conditions. The fl are tip is located in
the High Pressure (HP) Flare Stack at a
height of 30 metres to ensure that safe
radiation and burnt gas dispersion levels
are maintained beyond the exclusion zone.
Rainwater Harvesting
The storm water from the paved
areas (i.e. the non-hazardous areas)
and rooftops will be routed to a rain water
collection tank. Infi ltration wells (approxi-
mately 20 metres deep) have been built
within the tank area so that the water
collected in the tank over a certain level
will overfl ow into the infi ltration well for
recharging the groundwater.
Sewage Treatment Facility
Sewage from the plant and the
living quarters are treated in
a sewage treatment plant complying
with the regulatory standards for land
discharge, and then used for greenbelt
maintenance. This consists of physical
and biological treatment, followed by
disinfection. The entire treated sewage
is used within the facility, with no surface
discharge outside the MPT premises.
Power Generation
Steam is used for power generation
and for heating and pumping. It
is generated by heating the desalinated
water in fuel gas powered boilers. High
pressure (HP) steam is used to drive the
Steam Turbine Generators (STG) and the
steam turbine pumps. Exhaust from the
STG is cooled in air cooled condensers
at medium pressure (MP) levels. The MP
system provides heat for various process
heat exchanges, tanks and vessels.
The MP condensate passes to the low
pressure (LP) steam system. LP steam
is used in the de-aerators for the boiler
feed water and various utility stations. The
waste stream cycle is condensed and fed
in to the boiler feed water tank.
MANAGEMENT DISCUSSION AND ANALYSIS 15

CAIRN INDIA LIMITED AN N UAL R E PORT 2009-1016
RAJASTHAN
TECHNICAL DEVELOPMENTS
Development drilling and the well completion activities are under way, with three drilling rigs and one completion rig operating in the Mangala development area.
To date, 65 Mangala development wells have been drilled, of which 51 have been completed for initial production. In addition, three EOR pilot wells, 10 Raageshwari Deep Gas wells and three Thumbli water supply wells have also been drilled.
Given the success of its fi rst horizontal well at Mangala — which was tested at an oil production rate of more than 11,500 bopd, the highest ever for an onshore well in India — Cairn India has successfully drilled and completed fi ve more hori-zontal wells in Mangala. Twenty four Mangala wells are currently producing and other wells will be brought on stream in a staged manner during the ramp-up period.
The results from all the wells drilled to date confi rm excellent reservoir quality and the high deliverability potential of the Fatehgarh formation reservoir.
A hydro-fracturing campaign in three Raageshwari Deep gas wells was carried out across 10 gas zones. Following hydro frac treatment, the fi rst Raageshwari deep gas well tested at a gas rate of 15.7 million stand cubic feet per day (mmscfd); and the second well showed a gas rate of 20.9 mmscfd, the highest ever in the fi eld, signifi cantly more than expected. These test results indicate the potential for improved frac designs, which could be applied to the low permeability reservoir zones of the Barmer Hill formation in the near future.
Following are some of the signifi cant technologi-
cal applications used to develop the Rajasthan
resources:
Drilling Engineering,
Completions and Operations
Cairn India is committed to technological excel-lence with precise execution and top quartile drill-ing performance. Given below are some of the technological advances and processes that have been implemented leading to increased effi ciency in the drilling operations.
Well Type Design
Six different well types have been designed for oil and gas production wells, water source wells and water injection wells. To date, all these well design concepts have been tested and proven to be performing to or above expectations.
The successful test results of the hydro-fracturing campaign in three Raageshwari Deep gas wells indicate the potential for improved frac designs, which could be applied to the low permeability reservoir zones of the Barmer Hill formation in the near future

MANAGEMENT DISCUSSION AND ANALYSIS 17
RAPID MOBILE SKID MOUNTED "SUPER SINGLES" RIG

CAIRN INDIA LIMITED AN N UAL R E PORT 2009-1018
Custom Made Rapid Rig Design
Highly mobile skid mounted ‘Super singles’ of 1000 HP with smaller footprint and self deploy-ing design were custom built for Cairn India. This design allows rigs to move between wells on a pad in a period of fi ve to 10 hours. In fact, the Company achieved a very fast slot-to-slot rig move time of 4.5 hrs on four occasions. By drastically cutting the time of rig movement, the Company should save a minimum of 300-rig days for the planned 350 wells over the life of the asset. It has also helped reduce well construction time: wells of 1,200-1,500 metre depths are being drilled in seven to nine days.
Compact Well Head Design
This was custom designed for Cairn India to facil-itate optimal extraction from the fi eld. The design includes the provision for the termination of the heater string, control lines and electrical submers-ible pump cables. The system has resulted in rig time savings of anywhere between 16 hours and 36 hours per well, depending on the well design.
Custom Mud Design
Cairn India succeeded in using customised synthetic oil based mud system for the Rajasthan
drilling applications at almost the same cost as con-ventional water based mud systems. Installation of a thermo-mechanical Cuttings Cleaner unit in Rajasthan will be a fi rst in India — another example of Cairn India’s standing as an innovative and environmentally responsible company.
Turbine and Bit Selection
Conventional usage of Tungsten Carbide Insert (TCI) bits with positive displacement motors has been replaced with the more advanced assembly of impregnated (IMPREG) bits with turbines to drill the Raageshwari fractured basement formations. This has lead to a saving of around USD 360,000 per well. Cairn had earlier pioneered the intro-duction of the high performance Polycrystalline Diamond Compact (PDC) bits in India.
ICD completion for horizontal wells
Drain hole in horizontal wells have been com-pleted with the latest technology of Infl ow Control Devices and Swell Packers in order to slow down water cut, reduce fi eld operating expenses and maximise recoverable reserves. Wells have tested to production rates in excess of 11,500 bopd on self fl ow and set the record of being highest rate onshore production wells in India.
COMPACT WELL HEAD DESIGN

MANAGEMENT DISCUSSION AND ANALYSIS 19
Coiled tubing heater string
The unique concept of coiled tubing inclusion as heater string in conjunction with the production tubing has been adopted in the production well completions. Heater string is used to circulate heated water in the annulus that addresses the ap-prehensions on downhole fl ow assurance posed by the waxy and viscous crude of Rajasthan oilfi elds.
Pumps and Electrical
Submersible Pumps (ESP)
Jet Pumps using hot water as power fl uid are planned for artifi cial lift deviated wells as the water cut rises with time; high rate ESPs are installed in the horizontal wells for artifi cial lift in the future. Both technologies are set to open up new frontiers in artifi cial lift technology in India and would be the largest fi eld scale application of the jet pump technology worldwide.
Enhanced Oil Recovery
Enhanced Oil Recovery (EOR) techniques are methods of increasing recovery from oil fi elds. Historically, EOR has been considered as a ter-tiary recovery method — to be applied at the later stage of fi eld life after primary and secondary recovery from the reservoirs.
Cairn recognised the potential for EOR at an early stage of development in its MBA fi elds. The reservoir quality, oil properties and ambient tem-perature make these fi elds ideal for the application of chemical fl ooding EOR methods such as poly-mer or Alkali Surfactant Polymer (ASP) fl ooding.
With the viscosity of oil being higher than that of water, the injected water is not able to displace the oil very effi ciently, resulting in some bypassed oil under a conventional water fl ooding scheme.
By adding chemicals such as polymers, the in-jected water attains a viscosity close to that of the oil, which improves the displacement and overall sweep. In addition, the use of alkali and surfac-tants along with polymer further increase recov-ery, as these chemicals act like soap and wash off more oil from the reservoir pore spaces.
Studies conducted by two independent labo-ratories show favourable trial results of 30% to 40% incremental recovery from the application of EOR in the reservoir core-fl oods. Detailed fi eld scale modelling and simulation studies car-ried out incorporating the fi ndings of the labora-tory evaluation indicate incremental recoveries of 15% from the MBA fi elds by the application of ASP fl ooding.
The Company is conducting a fi eld pilot to demonstrate the applicability of EOR in the Mangala fi eld. A 10 well drilling programme is planned and the drilling of the pilot wells has started. Pilot trails will begin this year, initially with water injection and subsequently with poly-mer and ASP injection. Conditional upon success of the pilot, Cairn India intends to implement chemical fl ooding on a fi eld scale in Mangala, followed by Bhagyam and Aishwariya. The cur-rent assessment of the EOR resource base is more than 300 million barrels (mmbbls) of incremental recoverable oil from the MBA fi elds.
Cairn India is an active member of a Joint Industry Project (JIP) on chemical EOR. This JIP is supported by approximately 30 Exploration and Production and service companies across the world, which sponsors research in chemical EOR. This initiative shall provide access to the results of the latest technology and research carried out by the industry
Studies conducted by two independent laboratories show favourable trial results of 30% to 40% incremental recovery from the application of EOR in the reservoir core-fl oods
The current assessment of the EOR resource base is 15% of STOIIP which amounts to more than 300 million barrels of incremental recoverable oil from the MBA fi elds
EOR Opportunity in Rajasthan
Schematic Representation
Chemical EOR processes
Schematic Representation

CAIRN INDIA LIMITED AN N UAL R E PORT 2009-1020
Securing Energy,
Fuelling Growth
Demand supply gap is met by importsIn spite of India’s current oil production of around 0.7 million bopd, the country still remains grossly energy defi cient. This makes the
country a net importer of most forms of energy, including more than 70% of oil and gas.
Energy security is perhaps the most critical
challenge for any country, central to its
economic development and rapid growth.
For India, Cairn’s Rajasthan fi elds will thus
play a key role: the combined production
from Mangala, Bhagyam and Aishwariya
fi elds are set to contribute more than 20%
of India’s domestic crude production from
CY 2011.
FY 2009-10 has been a historic year for
Cairn India, marking the commencement of
production from Mangala. With growth in this
stage of the business— a fi ve-fold increase in
net production— Cairn’s journey of discovery
and production in a supply defi cient market
has begun its transition to becoming a key
player in the energy security of the country.
…of which
HYDROELECTRIC
NUCLEAR ENERGY
COAL
NATURAL GAS
OIL
5%
1%
52%
10%
32%
In 2009, India consumed 4.2% of the world’s energy…
Source: BP Statistical Review of World Energy June 2010
Source: BP Statistical Review of World Energy June 2010
Figures in million barrels per annum

21SECURING ENERGY, FUELLING GROWTH
An increase of
USD 1 per
barrel of oil…
…results in an
increase of USD
1 billion in India’s
import bill
In 2009, India produced 1% (275 mmbbls)
of crude oil but consumed 4.2%
(1,160 mmbbls) of the world’s total
produce (21,981 mmbbls)
ETHANE
DIESEL FUEL
FUEL OILS
GASOLINE/PETROL
JET FUEL
KEROSENE
LPG

CAIRN INDIA LIMITED AN N UAL R E PORT 2009-1022
RAJASTHAN
HYDROCARBON RESOURCES
Mangala, Bhagyam and Aishwariya
The MBA fi elds’ Stock Tank Oil Initially In Place (STOIIP) is over 2.1 billion barrels with approved Field Development Plans (FDPs) for all three fi elds. Cairn India believes that production potential from these fi elds exceeds 210,000 bopd (MBA approved rate of 175,000 bopd, additionally 25,000 bopd from Mangala and 10,000 bopd from Aishwariya) against an ap-proved rate of 175,000 bopd (Mangala 125,000 bopd, Bhagyam 40,000 bopd and Aishwariya 10,000 bopd). The increase in production is subject to regulatory approval.
The Mangala fi eld contains nearly 1,300 mmb-bls of STOIIP in the Fatehgarh formation, with nearly 500 mmbbls recoverable through water fl ood. Development drilling on the fi eld com-menced in January 2009, and 65 wells from eight pads have been drilled, with a combination of horizontal wells with screens, deviated producers and monobore water injectors. This represents approximately a third of the wells planned for the fi eld-wide development. Results from these wells have confi rmed the geological and reser-voir understanding of the fi eld and the STOIIP estimates.
Performance of the horizontal wells has been better than expected, with tested rates greater than 11,500 bopd. Production performance from the more conventional wells has been according to expectations.
Given these encouraging well results, Cairn India believes that the Mangala fi eld has a potential to produce 150,000 bopd. Moreover, the increased off-take rate from Mangala would have no impact on the ultimate technical recovery from the fi eld. This requires further regulatory approvals.
Raageshwari Deep Gas Field
The Raageshwari Deep gas fi eld is designed to supply gas to meet the energy requirements at the MPT and the pipeline. Ten new wells were drilled
and completed in addition to the existing three gas producers. Hydraulic fracturing operations have been completed in two wells so far with four to fi ve zones fracced in each well. These fracturing operations have been highly successful with wells having fl owed at rates up to 20 mmscfd — which is fi ve times the rates previously achieved from this reservoir.
Saraswati and Raageshwari Fields
The FDPs for both the fi elds have been approved and both the fi elds are currently under development.
Barmer Hill and Other Fields
In addition to the MBA, Raageshwari and Saraswati fi elds, Cairn India has discovered 20 other fi elds. Including the MBA fi elds, these contain a gross discovered resource of approxi-mately 4 billion boe of oil and gas in place.
From the development drilling results and further evaluation of the Barmer Hill formation overlying the Mangala and Aishwariya Fatehgarh Formation reservoirs, the Company has identi-fi ed signifi cantly increased potential in the basin. Fields in other parts of the world with characteris-tics similar to the Barmer Hill are being devel-oped — and have demonstrated recovery factors of 7%–20%.
As a result of this evaluation, the estimated Barmer Hill (from Mangala and Aishwariya) and other fi elds gross recoverable resources have more than doubled to 140 mmbbls.
Since the Barmer Hill reservoir is less perme-able than the main Fatehgarh formation reservoir, fracturing of horizontal wells is being planned to optimise the well count and deliver high online production rates. A declaration of commerciality for the Barmer Hill has been submitted to the GoI and an FDP is under preparation for submis-sion later this year.
An FDP covering fi elds in the Kaameshwari West development area has also been submitted to the GoI.
Cairn India believes that the Mangala fi eld has a potential to produce up to 150,000 bopd. Moreover, the increased off-take rate from Mangala would have no impact on the ultimate technical recovery from the fi eld

MANAGEMENT DISCUSSION AND ANALYSIS 23
Further Potential: Exploration Upside
There remains a signifi cant and as yet untested prospective resource potential to pursue in the Barmer Basin of the Rajasthan block.
Over the last two years, a full re-evaluation of the Barmer Basin has been undertaken. All 170 explo-ration and appraisal wells were re-examined, new studies were started and 2,733 km2 of 3D seismic data was re-processed and re-interpreted. Cairn India has also acquired over 2.2 km of cores to help gain a better understanding of the geographi-cal and reservoir models. As a result of these stud-ies, the Rajasthan prospect portfolio has increased substantially to 250 mmboe recoverable risked mean prospective resources with an upside poten-tial, equivalent to a most likely in place resource of 2,500 mmboe. Discovering and developing these
resources will be an important step in realising the full production potential of Rajasthan.
Cairn India drilled two exploration wells in Q4 FY 2010. Both wells found hydrocarbons in the Thumbli reservoir, extending the Shaheed Tukaram Ombale (Raageshwari East-1z) discovery made in 2008. Tukaram-2 found 6m of oil pay and 6m of gas pay whilst Tukaram SE-1 found 11m of oil pay. In addition, 2.5m of oil pay was found in a Dharvi Dungar reservoir, and the deeper well Tukaram-2 also found 15m of gas pay in the Fatehgarh, extending the Raageshwari deep gas resource base.
Technical evaluation work continues to assess existing and new plays in the basin to generate further prospects in Rajasthan.
There remains a signifi cant and as yet untested prospective resource potential to pursue in the Barmer Basin of the Rajasthan block
Technical evaluation work continues to assess existing and new plays in the basin to generate further prospects in Rajasthan
OFF SPEC OIL STORAGE TANKS AT MANGALA PROCESSING TERMINAL

CAIRN INDIA LIMITED AN N UAL R E PORT 2009-1024
The 24” heated and insulated pipeline is approximately 670 km long, from the MPT to the terminal at Bhogat on the Gujarat coast. It is the world’s longest continuously heated and insulated crude oil pipeline and will have access to more than 75 % of India’s refi ning capacity when the Bhogat terminal is completed in 2011
T H E P I P E L I N E A N D E X P O R T S YS T E M
Mangala crude is sweet (low sulphur) and waxy in
nature with an API gravity of around 28 degrees
and a pour point just over 40°C. In the BP crude
assay database, there are around 94 types of crude
oil that are heavier than the Mangala crude and
31 that are more viscous. So, while challenging,
the properties of the Rajasthan crude are not
something that will have any adverse impact on
subsequent processing. Though the crude has a
high pour point and viscosity due to its waxy nature,
its highly paraffi nic content makes it an excellent
secondary processing feedstock for refi ners.
The 24” heated and insulated pipeline is
approximately 670 km long, from the MPT to the
proposed marine terminal at Bhogat on the cost
of Gujarat. It is the world’s longest continuously
heated and insulated crude oil pipeline and will
have access to more than 75% of India’s refi ning
capacity when the Bhogat terminal is completed
in 2011. About 154 km of the pipeline is in
Rajasthan and the rest in Gujarat.
The crude pipeline has an outer diameter of 24”
with an 8” pipeline running along it that carries
Raageshwari gas, which will be used for power
generation. The heating of the pipeline is based
on an electric heat induction technology named
Skin Effect Heat Management System (SEHMS).
Along the length of the pipeline, there are 36
SEHMS heating stations or Above Ground
Installations (AGIs). Gas is supplied at each
station to generate the power required to heat the
pipeline for approximately 9 km on either side of
the heating station — to ensure that crude remains
constantly heated above 65°C.
In addition, there is an intermediate terminal at
Viramgam for storage and further pumping to the
coast, including a pigging facility. There are two
other pigging stations at Sanchore and Wankaner
to insert ‘pigs’ (pipeline cleaning devices) that are
used to clean and inspect the pipeline.
PIPELINE SECTION GETTING READY TO BE BURIED

MANAGEMENT DISCUSSION AND ANALYSIS 25
R A J A S T H A NMangala
Processing
Terminal
Bhogat
G U J A R AT
Phase I From MPT to Salaya, in Gujarat, via a
storage and pumping terminal at Viramgam (in
the district of Ahmedabad). It includes spur lines
to connect to private refi ners and another spur
line at Radhanpur to connect with the Indian Oil
Corporation Limited’s (IOCL’s) Mundra to Panipat
crude pipeline.
As on 31 March, 2010, the status of the pipe-
line was as follows:
The entire section from MPT to Salaya �
(~590 km) had been laid below the ground
and commissioned.
The Radhanpur (Gujarat) terminal, including a �
22 km long 10” spur line was completed. It was
ready for start-up to supply crude to IOCL’s
Mundra-Panipat crude oil line.
The Viramgam terminal was completed and is �
expected to be commissioned by June 2010.
Since then, oil was introduced in the pipeline on
13 May, 2010 in anticipation of sales to refi ners.
Phase II From Salaya to the Bhogat terminal on
the Arabian Sea coast, and a pipeline connecting
the terminal to the marine facilities. This Salaya
to Bhogat pipeline extension project consists of
three main components:
Extension of the pipeline with associated heat-1.
ing stations from Salaya to the Bhogat terminal.
Coastal crude oil storage terminal at Bhogat.2.
Marine export facilities, consisting of twin 24” 3.
sub-sea pipeline connecting the Bhogat ter-
minal to the SPM (Single Point Mooring). The
SPM is located ~ 6 km off shore in the Arabian
Sea and is equipped to load the AFRAMAX
type tankers.
All approvals for the Salaya to Bhogat section
have been obtained, and the necessary land
purchase completed to allow construction
to start. A number of major contracts for
construction and long lead equipment and
materials have been placed.
Pipeline length
Approximately 670 km
24” insulated heated
oil pipeline
from Barmer to Bhogat in
Gujarat, via Viramgam
Pipeline material
and diameter
Crude oil 24” API 5L X-65
insulated pipeline 90 mm
thick polyurethane foam
(PUF) insulation and 5 mm
thick high density
polyethylene (HDPE) wrap
Natural gas 8” API 5L
polyethylene (PE) coated
pipeline
Crude Oil Storage and
handling capacity
Viramgam 10,000 m3
(~60,000 barrels)
Bhogat 393,512 m3
(~2.5 million barrels)
Heating stations
36 at a distance of
approximately 18 km
apart along the pipeline
Standards
Heated oil pipeline with
PUF insulation and
HDPE wrap. OISD 118,
141, ASME B31.4, API 5L,
API 1102, API1104
Key Technical Details
of the Pipeline
670KMS
T H E P R O J E C T I S D I V I D E D I N TO T W O P H A S E S
Pipeline Route Map

CAIRN INDIA LIMITED AN N UAL R E PORT 2009-1026
RAJASTHAN CRUDE:
SALE CONTRACTS
With Trains One, Two and Three being able to process 130,000 bopd of crude oil at MPT, it is important to understand the sales contracts or arrangements that have been put in place with refi neries.
The fi rst step of the sales process was the approval of additional delivery points by the GoI. The approvals were initially for the public sector units — which allowed Cairn India to tie up sales contracts at Viramgam for IOCL’s Koyali refi nery, and at Radhanpur for delivery to IOCL’s Panipat refi nery.
In addition, the GoI had, as an interim ar-rangement, approved an additional Delivery Point at the Kandla port for delivery of crude to the Mangalore Refi nery and Petrochemicals Limited (MRPL) and other coastal refi neries. During FY 2009-10, six parcels were delivered to MRPL. When the Bhogat terminal along with the marine export facilities is operational, it will be an ad-ditional delivery point.
The second step was securing GoI approval to sell the crude to private sector refi ners. Here, too, the GoI agreed to allow domestic private refi ners to qualify as additional buyers of the Rajasthan crude. Cairn India has been successful in reach-ing an agreement to supply Mangala crude to pri-vate refi neries in Gujarat. In FY 2009-10, seven parcels were delivered to the private refi ners.
As of 31 March, 2010, sales arrangements for 143,000 bopd were in place (two PSU buyers and two private sector buyers). This has helped set a clear roadmap for aligning sales volume with the production ramp-up. Contracts for additional vol-umes are expected to be fi nalised as the produc-tion ramps up, subject to GoI approval.
The commercial terms and pricing negotiations for the Rajasthan crude have been concluded with the GoI nominees and domestic private refi ner-ies. In accordance with the PSC, this pricing is based on Bonny Light, comparable low sulphur crude that is frequently traded in the region, with appropriate adjustments for crude quality. The implied price realisation represents an average 10% to 15% discount to Dated Brent on the basis of prices prevailing for the year.
Once the Bhogat marine terminal becomes operational, sales to other coastal refi neries will be possible, subject to GoI approval.
FUNDING THE
RAJASTHAN PROJECT
The Rajasthan project is now well funded, with Cairn India having completed fi nancing arrangements for USD 1.6 billion at competitive pricing. The facility is of a long term nature with tenure of over six years from the time they were contracted in October 2009. Proceeds from this facility have been used to repay the then existing debt of USD 850 million and to fund the ongoing projects in Rajasthan. The fi nancing was arranged through a combination of US Dollars and Indian Rupee borrowing by accessing both domestic and international markets.
International borrowing facility of USD 750 million was provided by a consortium of overseas commercial banks led by Standard Chartered Bank and the International Finance Corporation, a member of the World Bank Group. Domestic borrowing facility of INR 4,000 crore (USD 850 million) was underwritten by the State Bank of India, which later syndicated to other banks and fi nancial institutions, including Canara Bank, Bank of India, Oriental Bank of Commerce,
As of 31 March 2010, sales arrangements with PSU and private refi ners for 143,000 bopd were in place
2004 2005 2006 2007 2008 2009 2010
Crude Price Movement since the discovery of Mangala Fieldin USD per barrel
Bonny Light
Brent
Mangala Crude
30
60
90
120
150

MANAGEMENT DISCUSSION AND ANALYSIS 27
Bank of Baroda, HDFC Bank and Infrastructure Development and Finance Corporation.With these fi nancing arrangements, Cairn India is well funded to execute the Rajasthan project.
This financing is innovative in that: It uniquely accesses two separate lending mar- �
kets on different terms for the same projectIt is one of the largest fully underwritten deals �
of this size in the oil and gas sector after the 2008 fi nancial crisisIt is one of the largest ‘Reserve Base Lending’ �
deals completed in India to date
This fi nancing deal was awarded the ‘Oil & Gas Deal of the Year’ for Asia Pacifi c region by Project Finance International (part of the Thomson Reuters group).
The completion of the fi nancing underscores the robustness of the Rajasthan project and the lenders’ confi dence in Cairn India’s ability to deliver.
In March, 2010, Cairn India was awarded the ‘AAA’ rating by the Credit Analysis and Research Limited (CARE) for its INR 4,000 crore domestic borrowing facility. The ‘AAA’ rating reinforces the credit worthiness of the project.
As always, the Company has an ongoing dialogue with various international and domestic institutions to review its fi nancing options, so as to create even greater fi nancial fl exibility by securing competitively priced long term debt. In this, the guiding principle is to secure terms that enhance long term shareholder value. Table 1 gives the fi nancial details: capital expenditure versus fi nancing.
During the year, PETRONAS International Corporation Ltd (PICL), the overseas arm of Petroliam Nasional Berhad (PETRONAS), acquired from Cairn Energy PLC 43.6 mil-lion shares in Cairn India, representing a 2.3%
stake and taking the total holding of PICL in the Company to 14.94%.
A Scheme of Arrangement between the Company and some of its wholly owned subsid-iaries, to be effective from 1 January 2010, had been approved earlier by our shareholders. The Scheme of Arrangement has been approved by the Hon’ble High Court of Madras but is pending approval from the Hon’ble High Court of Bombay and other regulatory authorities. Pending receipt of such approvals, no accounting impact of the scheme has been given in the fi nancial state-ments. After the implementation of the scheme, the Company will directly own the Indian busi-nesses, which are currently owned by some of its wholly owned subsidiaries.
The Rajasthan project is now well funded, with Cairn India having completed fi nancing arrangements for USD 1.6 billion at competitive pricing
This fi nancing deal was awarded the ‘Oil & Gas Deal of the Year’ for Asia Pacifi c region by Project Finance International
1Capital Expenditure towards Rajasthan Project
in USD billion
Capital Expenditure Gross Net to Cairn
Exploration (upto 2006) 0.61 0.57
Development
CY 2007 0.31 0.22
CY 2008 and 2009 1.76 1.23
CY 2010 and 2011 (estimated) ~2.00 ~1.40
Financed by
Net Cash (Net Debt) 31December, 2009 (0.1)
Existing Debt Facility 1.60
Total 1.50
Note: Cash fl ow from producing assets is an additional source of funds
Shareholding StructureAs on 31 March, 2010
22.69%
14.94%62.37%
Cairn Energy PLC
Petronas
Public including Institutions

CAIRN INDIA LIMITED AN N UAL R E PORT 2009-1028
Other Producing Assets
PKGM-1 BLOCK (RAVVA FIELD)
Krishna Godavari Basin, Andhra Pradesh
Cairn India ownership 22.5% and the operator
The Ravva oil and gas fi eld in the Krishna-Godavari Basin was developed in partnership with ONGC, Videocon and Ravva Oil, working under a PSC that runs until 2019.
Currently, eight unmanned offshore platforms are being operated. A 225-acre onshore process-ing facility at Surasaniyanam processes natural gas and crude oil from the Ravva fi eld. The Ravva onshore terminal operates at an internationally recognised environmental standard (ISO 14001), and has the capacity to handle 70,000 bopd oil, 95 mmscfd of natural gas and 110,000 barrels per day of injection water. The terminal also has the capacity to store one million barrels of crude oil onshore.
Ravva completed 15 years of continuous op-erations on 28 October, 2009. The fi eld direct operating expense for the Ravva block is amongst the lowest in the world. The low-cost operating base has been achieved by focusing on life-cycle planning, continuous monitoring, control of operational costs and the innovative application of operating technologies.
The average gross production from the Ravva fi eld for FY 2009-10 was 40,718 boepd — comprising an average oil production of 32,786 bopd and average gas production of 48 mmscfd.
Originally estimated to produce 101 million bar-rels of crude oil, Ravva has now produced more than 225 million barrels. Cairn India is confi dent of the fi eld’s considerable remaining reserve po-tential and of producing more oil from this block. The Company and its joint venture partners have completed a 4D seismic acquisition campaign to identify bypassed oil zones within the fi eld and the scope of further reserve addition through future infi ll drilling.
The Ravva block’s direct operating cost per barrel is amongst the lowest in the world
Originally estimated to produce 101 million barrels of crude oil, Ravva has now produced more than 225 million barrels of crude oil
Ravva Offshore Facilities
Schematic Representation

MANAGEMENT DISCUSSION AND ANALYSIS 29
CB/OS-2 BLOCK
Cambay Basin, Western India
Cairn India ownership 40% and the operator
Cairn is the operator for this block and the PSC signed in 1998 with ONGC and Tata Petrodyne Limited as partners, runs until 2023.
In 2002, gas production commenced from the Lakshmi gas fi eld in the CB/OS-2 Block in the Cambay offshore basin in the Gulf of Khambat on the west coast of India. The Gauri offshore gas fi eld was discovered in 2001 and came on stream in 2004. CB-X, a marginal gas fi eld in the transi-tion zone of the block was in production between June 2007 and August 2009. The Lakshmi and Gauri fi elds commenced production of oil in addi-tion to gas in 2005.
The 82-acre onshore processing facility at Suvali is certifi ed to ISO 14001 and OSHAS 18001 stan-dards. It has the capacity to process 150 mmscfd of natural gas and 10,000 bopd of crude oil.
The application of advanced geophysical tools has helped map thin oil sands which are beyond normal seismic resolution capability. These
techniques have transformed the CB/OS-2 block from a predominantly gas fi eld to an oil fi eld through the discovery of an oil leg. Tubing sand screens were used for the fi rst time in the Cambay Basin as a sand control measure. The Cambay asset has witnessed the use of several cutting-edge technologies which have increased throughput at a lower unit cost.
Cairn India signed a Term Sheet agreement to produce Gauri share of GBA (Gas Balancing Agreement – for sharing of gas from the shared reservoir formation) gas through the Hazira facili-ties in December 2009. The gas production and sales also commenced in the same month. This is a fi rst of its kind arrangement in the country which showcases the Company’s commitment to produce gas in the most economical manner and contribute to the nation’s energy security.
The average gross production from the CB/OS-2 block for FY 2009-10 was 13,480 boepd consisting of an average oil / condensate produc-tion of 9,060 bopd and an average gas production of 26 mmscfd.
JUN 1998
Production sharing contract signed
MAY 2000
Lakshmi oil and gas field discovery
JAN 2001
Gauri oil and gas field discoveryAmbe oil and gas field discovery
OCT 2002
Lakshmi gas field developed and gas production commmenced; discovery to production in only 28 months
FEB 2004
CB-X onshore discovery
APR 2004
Gauri development and gas production commenced
APR 2005
Onshore and offshore facilities certified for ISO 14001; 2004 standards
NOV 2005
Gauri field development First oil from Gauri
JAN 2006
Oil production up to 3,000 bopd
JUN 2007
CB-X field development completed and gas sales commenced
FEB 2008
Oil production up to 6,000 bopd
MAY 2009
Upgraded oil processing capacity to 10,000 bopdCB/OS-2 onshore and offshore facilities certified for OHSAS 18001:2007 standards
DEC 2009
GBA agreement signed and sales commenced
CB/OS-2 Milestones

Exploring to DiscoverIn addition to ongoing exploration activities in the three
producing blocks — Rajasthan, Ravva and CB/OS-2
— Cairn India has exploration interests in fi ve blocks in
India and one in Sri Lanka, fi ve of which are operated
by the Company.
These blocks are located in the Krishna-Godavari
basin, the Palar-Pennar basin, the Kerala-Konkan
basin, the Cambay basin, the Gujarat-Saurashtra
basin, the Barmer basin, the Jaisalmer basin and
the Mannar basin, off the shore of Sri Lanka. The
Company made two successful bids in the NELP
VIII licensing round, and was provisionally awarded
the KG-OSN-2009/3 and MB-DWN-2009/1 blocks,
subject to GoI approval.

East coast of India
Krishna Godavari Basin
Cairn holds a strong position in the
Krishna Godavari basin with both existing
production from Ravva and prospective
onshore and offshore acreages. Cairn
India’s commitment to this basin was further
consolidated with the award of the sought-
after KG-OSN-2009/3 block in the NELP
VIII bid round, subject to GoI approval.
Krishna Godavari Basin—
PKGM-1 (RAVVA FIELD)
Cairn India Ownership 22.5%
Operator Cairn
A major review of the block-wide additional
potential is being undertaken. A review of
contingent resources was completed in
early 2009, resulting in small but signifi cant
additions to the resource base, although
further drilling will be required to monetise
these. A second study to assess the
additional undiscovered potential within the
fi eld, both in untested deeper horizons and
in adjacent structures, is ongoing and is
expected to add new exploration prospects.
Further evaluation of the commerciality of
these prospects is required.
Other Indian Acreage
Kerala-Konkan Basin
KK-DWN-2004/1
Cairn India Ownership 40% Operator ONGC
A 3,840 line km 2D seismic programme
was completed in 2009 and following
interpretation of the data, 300 km2 of 3D
acquisition is being planned.
Krishna Godavari Basin—
KG-ONN-2003/1
Cairn India Ownership 49%
Operator Cairn
The Company has fi nalised fi ve prospects
and the drilling of the fi rst of these wells
(Nagaram-1) commenced in February
2010 and was plugged and abandoned in
March 2010. The second well (Daliparu-1)
commenced drilling in the same month.
Drilling of the remaining wells is expected
to be completed by early Q3 CY 2010.
Krishna Godavari Basin—
KG-DWN-98/2
Cairn India Ownership 10%
Operator ONGC
The northern area of this PSC is now in
an appraisal phase, following completion
of the exploration period. The fi rst of three
wells commenced drilling in December
2009 and encountered low saturation
gas. Two further wells are expected to be
drilled by end Q2 CY 2010, as part of the
future plan for commercial development
of this discovered oil and gas resource.
The southern area appraisal period was
completed in December 2009, with the
declaration of commerciality submitted to
the DGH.
Gujarat-Saurashtra basin
Block GS-OSN-2003/1
Cairn India Ownership 49% Operator ONGC
The offshore well GSA-1 was plugged and
abandoned in Q1 CY 2010.
Cairn India also completed its work
programme commitments in the Ganga
Valley exploration blocks
(GV-ONN-2002/1 and GV-ONN-2003/1) and
Vindhyan basin block (VN-ONN-2003/1).
The Company has since relinquished its
interests in these blocks.
Palar-Pennar Basin—
PR-OSN-2004/1
Cairn India Ownership 35%
Operator Cairn
This block, covering 9,400 km2, is located
contiguous to discoveries in Krishna-
Godavari and Cauvery basins. Following
interpretations of 3,100 line km of offshore
2D seismic data, an 800 km2 of 3D seismic
data was acquired in Q1 CY 2010 in
preparation for a drilling campaign planned
for the Q1 CY 2011.
Rajasthan
Jaisalmer Basin—RJ-ONN-2003/1
Cairn India Ownership 30%
Operator ENI
The operator completed the fi rst exploration
well in mid-2009, which encountered
a sequence of low reservoir quality
Mesozoic and older rocks of limited
hydrocarbon potential. The operator held
discussions with the Directorate General
of Hydrocarbons (DGH) regarding
the remaining work of its programme
commitments. The block has now been
relinquished by Cairn.
Moving Beyond India
Sri Lanka, Mannar Basin—
SL 2007-01-001
Cairn Lanka 100%A wholly owned subsidiary of Cairn India
Cairn Lanka (Private) Limited, a wholly
owned subsidiary of Cairn India, acquired
1,750 km2 3D seismic data in the Mannar
Basin in Sri Lanka between December
2009 and January 2010. The programme
fulfi ls the commitment of 1,450 km2 of 3D
seismic data acquisition. The Mannar basin
is an under-explored frontier basin, with
both structural and strati-graphic plays.
The 3D seismic data is currently being
processed. A detailed Metocean study has
recently commenced in preparation for the
exploration drilling of three wells planned to
commence in Q2 CY 2011.
MANAGEMENT DISCUSSION AND ANALYSIS 31

CAIRN INDIA LIMITED AN N UAL R E PORT 2009-1032
Cairn provides an environment that encourages initiative, innovation and rewards performance to foster "High Performance"
Our multicultural workforce is encouraged to imbibe the best practices from different sectors, enabling a vibrant delivery and execution oriented work culture
Human Resources
To build a sound and growing business in a diffi cult and complex industry, Cairn India needs people with world-class capabilities.
The Company’s talent base has steadily increased, witnessing almost a three-fold growth in manpower over the last three years. The Company is now 1,068 people strong with an average age of 36 years and an average work experience of 13 years. It is, thus, a young yet experienced company.
Various initiatives to nurture talent were launched during the year, the key amongst them being:
Creation of multiple platforms for learning �
Encouraging lateral placements and cross func- �
tional expertiseLeadership development �
Continuation of competency management �
framework buildup During the year, special emphasis was given to
leadership development, targeting the Company’s senior management through its ‘Star Trek’ programme.
Cairn’s aggressive growth in FY 2009-10, and heightened activity for delivery of the Mangala project, scaled up the human resource needs for the organisation. This was managed by reducing cycle time to hire while giving greater emphasis on the quality of potential employees. A total of 360 people were hired during the year, including 16 graduate engineer trainees from colleges in Rajasthan.
One of the landmark achievements was man-aging a workforce of more than 16,000 at the Rajasthan and Gujarat sites during the peak of construction activity. The work was conducted adhering to strict safety standards and the people were trained on HSE practices to ensure that Cairn India’s safety policies were strictly complied with. Attention to details such as induction and training of the contractor’s workers, innova-tive safety compliance reward programmes and proper shelter and water were a part of the initia-tives employed by the Company. There is more on this in the next section.

MANAGEMENT DISCUSSION AND ANALYSIS 33
COLLABORATION AND SAFE WORKING PRACTICES ARE A PART OF THE CAIRN CULTURE

CAIRN INDIA LIMITED AN N UAL R E PORT 2009-1034
HEALTH AND SAFETY
The safe execution and commissioning of projects in the upstream and midstream projects were signifi cant challenges for Cairn India during the year. It employed a number of contractors at various work sites to execute the projects. Around 16,000 workers contributed approximately 63 million man-hours, which en-abled Cairn India to achieve signifi cant progress in the project schedule.
The Company has achieved global industry top quartile performance in Lost Time Injury Frequency Rate (LTIFR) and Total Recordable Incident Frequency Rate (TRIFR) during the year. It has registered 42 million man-hours continu-ously without any lost-time injury, which is a world class performance by any standard.
HSE Training
More than 50,000 contract workers were �
trained on HSE induction; more than 10,000 went through the HSE road shows at MPT; and over 6,000 workers were covered under HSE training in the midstream project.Efforts to increase road safety awareness for �
employees and contractors continued through in-house and external training resources.Around 700 Cairn staff attended road safety �
and defensive driving training programmes at the Gurgaon offi ces, while another 300 did so at the Company’s assets and project sites.
Cairn Incident Management System
The Cairn Incident Management System was launched in September 2009 for better reporting and investigation of incidents and near-misses. It is based on a user-friendly integrated process for reporting, investigation and tracking preventative actions until satisfactory closure and sharing of the lessons learned. The software tool was devel-oped in-house. It handles all incidents, accidents and near-misses that require either a summary or detailed analysis.
Crude Oil Transportation
Adhering to road safety guidelines and ensur-ing HSE compliance by contractors engaged in crude transportation by road tankers were
major challenges. A safety management system including road risk survey, tanker specifi cations, driver competency, inspection and an emergency response plan were set up, and all relevant per-sonnel were trained on the effective implementa-tion of the system.
Vehicles operating for Cairn India travelled some 32 million km during the year, which amounts to circumnavigating the earth around 800 times. Cairn India has achieved a remark-able performance in road safety, measured as MVAFR (Motor Vehicle Accident Frequency Rate). This was at 1.16 per million km driven, which is well below the international and na-tional benchmarks for the industry.
Contractors HSE Performance Improvements
Although signifi cant efforts were put in place to maintain safe working at the project sites, our contractors suffered three fatalities and four lost-time injuries during the year.
In order to improve contractor performance, Cairn India has taken the following corrective actions:
A performance-oriented manual on contractor �
HSE requirements has been releasedThere is more rigorous screening of contractors �
before engaging themSetting up and communicating expectations �
and risk based targets for contractorsCreating ownership and oversight of HSE �
compliance by Cairn India’s line managers and supervisorsHaving fi nancial incentives/penalties for HSE �
performance of suppliers/contractors
Process Safety
To ensure safety of existing assets, Cairn India has established an internal integrated audit assurance programme. It includes a review of health, safety, environment and quality of individual assets, and their compliance to the Company’s own standards as well as various ap-plicable statutory regulations. A multi-disciplin-ary internal team was involved in the process of review and assurance and sharing best practices
Health, Safety and Environment
The Company’s policies on Health, Safety and Environment (HSE) are clear: no harm to people and no adverse impact on the environment and the communities in which it operates. Hence, the priorities were excellence in construction safety, minimising the environmental impact of activities, including those carried out by contractors, and continuing to improve HSE across all our assets.
NOx Emissions
in Tonnes
0
200
400
600
800
1000
1200
10
61
76
5 812
1141
2009200820072006
Lost Time Injury Frequency
Rate (LTIFR)
2009200820072006
0.0
0.1
0.2
0.3
0.4
0.5
0.6
0.6
0
0.3
9
0.2
7
0.2
6

MANAGEMENT DISCUSSION AND ANALYSIS 35
across assets. A total of six integrated audits were conducted, apart from walk-through inspections and ISO-14001 and OHSAS-18001 surveillance audits.
Ensuring safety of personnel, assets and envi-ronment during the commissioning of various projects was one of the major achievements dur-ing the year. Cairn India has established a gated process, including compliance verifi cation of new facilities in the Rajasthan project including the upstream, MPT and the pipeline facilities. A Compliance and Assurance Team (CAT) was constituted. It visits the new facilities and veri-fi es process safety compliance and readiness for start-up besides ensuring availability of updated standard operating procedures. Emergency response procedures were upgraded and tested for their effectiveness in the course of periodic emergency drills at all operating and project sites throughout the year.
Occupational Health
During the year, a number of initiatives were taken by the occupational health team. A H1N1 prevention campaign was launched throughout the Company and its contractors to prevent the spread of the virus. Travellers were screened medically before permitting them inside the facilities or offi ces. Alerts were issued on alternate days throughout the outbreak. In addition, a ma-jor campaign was launched to prevent heat stress at all the Company’s sites and assets. Various precautionary measures were taken to avoid heat stress related illnesses. Bottled water was distributed to the contractor workers at sites; and shades were provided for their rest during hot day periods.
Periodic occupational and exposure surveys were conducted at all operating sites in confor-mance with regulatory requirements. Medical coverage was provided across all the Company’s assets and project work sites.
Total Recordable Incident
Frequency Rate (TRIFR)
2009200820072006
0.0
0.5
1.0
1.5
2.0
2.5
3.0
2.7
5
1.6
4
0.7
3
0.6
4
ENVIRONMENT FRIENDLY MODES OF TRANSPORT
ARE ENCOURAGED IN THE PROCESSING FACILITIES
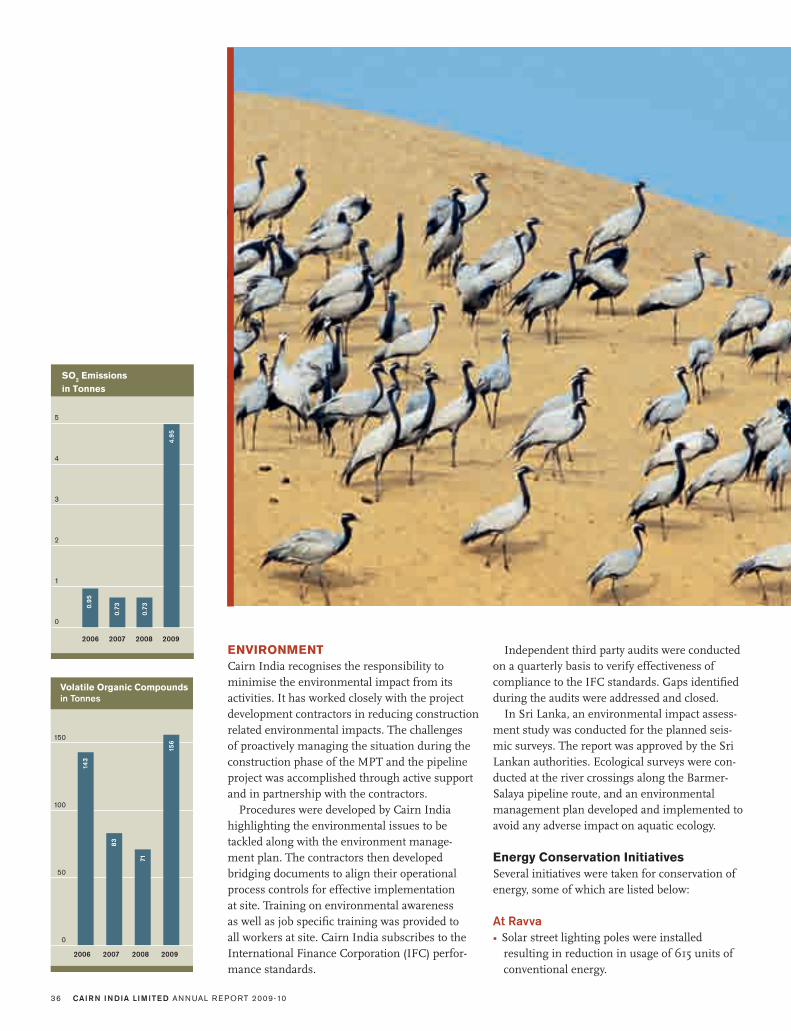
CAIRN INDIA LIMITED AN N UAL R E PORT 2009-1036
ENVIRONMENT
Cairn India recognises the responsibility to minimise the environmental impact from its activities. It has worked closely with the project development contractors in reducing construction related environmental impacts. The challenges of proactively managing the situation during the construction phase of the MPT and the pipeline project was accomplished through active support and in partnership with the contractors.
Procedures were developed by Cairn India highlighting the environmental issues to be tackled along with the environment manage-ment plan. The contractors then developed bridging documents to align their operational process controls for effective implementation at site. Training on environmental awareness as well as job specifi c training was provided to all workers at site. Cairn India subscribes to the International Finance Corporation (IFC) perfor-mance standards.
Independent third party audits were conducted on a quarterly basis to verify effectiveness of compliance to the IFC standards. Gaps identifi ed during the audits were addressed and closed.
In Sri Lanka, an environmental impact assess-ment study was conducted for the planned seis-mic surveys. The report was approved by the Sri Lankan authorities. Ecological surveys were con-ducted at the river crossings along the Barmer-Salaya pipeline route, and an environmental management plan developed and implemented to avoid any adverse impact on aquatic ecology.
Energy Conservation Initiatives
Several initiatives were taken for conservation of energy, some of which are listed below:
At Ravva
Solar street lighting poles were installed �
resulting in reduction in usage of 615 units of conventional energy.
Volatile Organic Compounds
in Tonnes
2009200820072006
0
50
100
150
14
3
83
71
15
6
SO2 Emissions
in Tonnes
0
1
2
3
4
5
2009200820072006
4.9
5
0.9
5
0.7
3
0.7
3

MANAGEMENT DISCUSSION AND ANALYSIS 37
P E R F O R M A N C E H I G H L I G H T S
Environmental management plans
developed during various assessments of
the Rajasthan development project have
been consolidated into a comprehensive
Environmental and Social Management
Plan document.
At Ravva, a de-bottlenecking project
was undertaken to achieve the targeted
produced water re-injection. This has
enabled signifi cant reduction in ground
water consumption, and reduced effl uent
discharge to the sea.
The Company regularly monitored air
emission sources and the ambient air
quality, and was able to maintain emission
levels within regulatory standards. During
construction activities in Rajasthan, dust
suppression was carried out through
sprinkling of treated sewage.
Green House Gas (GHG) emissions were
within targets set at the beginning of the
year notwithstanding a rise in energy
use. GHG emissions intensity was 47.32
tonnes of CO2
per 1,000 tonnes of
hydrocarbon produced, which was slightly
higher than previous year (40.8) due to
decline in crude production from the Ravva
fi eld.
Organic waste convertors were installed
and operated at the Rajasthan construction
site for composting all food waste into
manure, which is being used for greenbelt
development.
In the midstream project, a management
plan was developed and implemented for
protection of the top soil. The top soil after
excavation was stored in a manner to avoid
erosion with runoff. After lowering of the
pipeline sections top soil was refi lled in the
trenches.
All conventional water heaters were replaced �
with solar water heaters, thus reducing energy consumption by 40,000 units per annum.18 conventional HPSV street light lamps were �
replaced with LED lamps in plant street lighting systems.
At the Gurgaon offi ce
Several energy conservation initiatives have resulted in saving of 350,342 units of electricity, thus reducing the offi ce’s carbon footprint. These included:
Ensuring that all except the emergency lights �
are turned off after working hours and on holidaysAir handling units are started at 7 am and �
turned off when the employees have left offi ceLights in empty cubicles are turned off after �
6 pmOn working days, lights are turned on only by �
the employees when they arrive on duty
Direct GHG Emissions
Tonnes CO2
0
50000
100000
150000
200000
20062
04
60
72007
13
24
77
2008
12
94
74
2009
16
56
56
Direct GHG IntensityTonnes CO
2 / 1000 tonnes of
Hydrocarbon produced
2009200820072006
0
10
20
30
40
50
48
.4
37.
7
40
.8
47.
3
MAPPING AND SAFEGUARDING THE
FRAGILE BIO-DIVERSITY IN THE
REGION THROUGH ENVIRONMENT
IMPACT ASSESSMENT STUDIES
CAIRN INDIA LIMITED AN N UAL R E PORT 2009-1038
BUSINESS RISK
MANAGEMENT PROCESS
The Cairn India Business Risk Management System, which aims to systematically identify and document business risks, their signifi cance and the appropriate controls to mitigate them, has been implemented for all activities.
OPERATING POLICIES
AND PROCEDURES
Policies have been disseminated to appropriate departments / functions, as considered essential by senior management. Procedures have been re-vised and put in place in many areas. The process is still ongoing and will be completed and put in place by the end of CY2010. Cairn India’s opera-tional activities have been subjected to audits and peer reviews. Implementation of the recommen-dations arising from all audit reports is regularly monitored by senior management.
LEGAL AND COMMERCIAL
PROCEDURES
These have been actively disseminated through-out the Company. A process is ongoing to ensure that policies and procedures are in place for all key activities. A Legal Compliance Management System has been developed to track regula-tory compliance requirements. Internal audit procedures for the Legal Department are being developed, and will be completed in CY 2010.
CODE OF
BUSINESS ETHICS
The Cairn India Code of Business Ethics has been distributed throughout the Company in FY 2009-10. The staff has accepted the provisions of the Code.
FINANCIAL AND
MANAGEMENT REPORTING
Financial policies, standards and delegations of authority have been disseminated to appropriate senior management for further dissemination to staff within their departments. Procedures to ensure conformance with the policies, standards and delegations of authority have been put in place covering all activities. Periodic assessment of the accuracy and reliability of the budget and forecast model with respect to actual results have been implemented. Cairn India’s processes and fi nancial activities are subjected to independent audits — by internal as well as statutory auditors. The implementation of the recommendations arising from all audit reports is regularly moni-tored by the senior management. Internal and statutory audit reports and fi ndings, including comments by management, are regularly placed before the Audit Committee of the Board of Directors.
PERFORMANCE SETTING
AND MEASUREMENT
Objectives and Key Performance Indicators have been drawn up to meet the business plans and work programme. A system is in place to moni-tor and report on the progress to the Executive Committee and the Board of Directors.
BUSINESS CONTINUITY
Emergency response and management plans are in place for all operations. The IT Disaster Recovery Plan was implemented in FY 2009-10. The Gurgaon Offi ce Business Continuity Plan is well developed. Final release will be by April 2011. Business Continuity Plans for all other assets and locations will be in place by end of CY 2010.
Internal Controls and their Adequacy
During FY 2009-10, Cairn India further developed the use of the SAP system, which enhanced the Company’s internal control environment. The intranet portal use was extended and enhancements were made to the business risk management system in line with best practices.
The review of management processes by third party consultants started in 2008 and continued in 2009. This has resulted in further improvements to business systems and processes.
AC H I E V E M E N T S D U R I N G F Y 2 0 0 9 - 10
Cairn India’s processes and fi nancial activities are subjected to independent audits; by internal as well as statutory auditors. The implementation of the recommenda-tions arising from all audit reports is regularly monitored by the senior management

MANAGEMENT DISCUSSION AND ANALYSIS 39
0
5,000
15,000
10,000
FY 20102007
16
,23
0
10
,12
3 11,1
68
Income from Operations
INR million
FY 2009*
EPS
INR
0
4
2
3
1
5
FY 20102007-0
.1FY 2009*
3.6
5.5
Net Profit/Loss
INR million
0
8,000
4,000
6,000
2,000
10,000
FY 20102007
-24
5
6,8
70
10
,511
FY 2009*
Abridged Financials
F I N A N C I A L H I G H L I G H T S
For the Financial Year 2009–2010
Profi t After Tax at INR 10,511 million
(USD 222 million)
Operating revenues at INR 16,230
million (USD 342 million)
The average oil price realisation was
USD 68.2 per bbl, the average gas
price realisation was USD 4.2 per
mscf; average price realisation per
boe was USD 60.9
Cash available as on 31 March, 2010
was INR 26,313 million (USD 583
million); loan drawn down to 31
March, 2010 against the loan facility
of USD 1.6 billion was INR 33,867
million (USD 751 million)
Gross cumulative Rajasthan
development capex spend USD
2,292 million, of which USD 934
million was spent during FY 2009-10
Completed fi nancing of USD 1.6
billion facility in October 2009
through a unique combination of USD
750 million international borrowing
and a domestic borrowing of INR
4,000 crore (USD 850 million)
The USD 1.6 billion fi nancing deal
was awarded the “Oil & Gas Deal
of the Year” for Asia Pacifi c region
by Project Finance International.
The Company’s domestic borrowing
programme was given “AAA” by
CARE for an aggregate amount of
INR 4,000 crore (USD 850 million)
Company and some of its wholly
owned subsidiaries are undertaking
a Scheme of Arrangement. After the
approval and implementation of the
scheme, the Company will directly
own the Indian businesses, which are
currently owned by some of its wholly
owned subsidiaries.
Following the alignment of the Company’s fi nancial year with India’s
tax year the results of the current accounting period cover 12 months
as opposed to the 15 months period last year. One cannot thus readily
compare the results over the two successive periods. Table 2 provides
the consolidated audited results.
2Consolidated Profit and Loss Account for the Year ended March 31, 2010
All amounts are in INR Million, unless otherwise stated
Year ended
March 31, 2010
For 15 months ended
March 31, 2009
Income from operations 16,230 14,327
Total Income 20,307 19,837
Total Expenditure 8,511 7,197
Earnings before Depreciation Interest and Tax (EBIDTA)
11,796 12,640
Finance Cost 148 63
DD&A 1,485 2,698
Profit before taxation 10,163 9,879
Profit for the year / period 10,511 8,035
Paid up Equity Share Capital (face value of Rs.10 each)
18,970 18,967
Reserves excluding Revaluation Reserves 319,250 308,668
Earnings Per Share (in INR)
Basic 5.54 4.31
Diluted 5.52 4.28
Public shareholding
Number of Shares 713,730,341 669,824,025
Percentage of Public Shareholding 37.62% 35.32%
* Figures normalised for 12 months

CAIRN INDIA LIMITED AN N UAL R E PORT 2009-1040
What if global crude oil prices crash to below 1.
USD 40 per barrel?
The past year saw crude oil prices stabilise in the USD 70 per barrel range with some upward movement. Energy researchers believe that the demand for energy will continue to increase in FY 2011. The Secretariat of the Organisation of Petroleum Exporting Countries (OPEC) states that, in all likelihood, crude prices of USD 70 per barrel is longer term equilibrium—and a level that ought to encourage exploration and produc-tion of crude oil.
However, a lowering in crude prices can never be ruled out. The only way to deal with it is through operational cost advantages for which Cairn India is well placed. The operational expense for existing operations at Ravva and CB/OS-2 is USD 2.10 per barrel; and the Rajasthan operational expense including the pipeline is es-timated at approximately USD 5 per barrel. Thus, the Company should generate shareholder value even at lower crude oil prices.
What if Train Four at the MPT is delayed?2.
Train One at MPT was commissioned on 29 August, 2009 followed by Train Two in May 2010. This will be followed by the commission-ing of Train Three with a capacity of 50,000 by end June 2010. At the moment, Train Four is the focus of Cairn India’s project activities at the MPT, and all efforts are towards adhering to time-lines. As of today, the Company plans to complete Train Four in CY 2011 to support the ramp up of production to the FDP approved rate of 175,000 bopd.
What if crude oil sales are not aligned to the 3.
capacity created at MPT?
As of now, the MPT has the capacity to process 130,000 bopd of crude, which can support the Mangala approved peak production rate of 125,000 bopd. The Company targets to achieve this rate during H2 CY 2010. Hence, it sees no misallocation between sales arrangements and production capacity at present.
Cairn India is in discussion with existing buy-ers to enhance volumes, and with other refi ners in the country to place orders for the Rajasthan crude. In securing new buyers, the Company has received consistent support from the GoI. It, therefore, expects to fi nalise more allocations in line with Train Four coming into operation in CY 2011 — when the MPT could produce up to 205,000 bopd, subject to GoI approval.
What if Cairn ran out of funds for the 4.
Rajasthan project?
The capability to secure the USD 1.6 billion facil-ity in diffi cult times demonstrates the capacity of Cairn India to fi nancially secure the Rajasthan development. The strong promoter support, low fi nancial gearing and increasing cash fl ows should only improve the fi nancial health of the organisation. Moreover, lower operating costs of the pipeline in comparison with trucking will re-duce transport costs signifi cantly. The Company continues to explore possibilities for additional fi nancing — if necessary and available at terms that can enhance long term corporate value.
OUTLOOK
MBA targeted to reach its current approved peak production level of 175,000 bopd in CY 2011.
The gross operated production of the Company is expected to increase from 69,059 bopd in FY 2009–10 to more than 200,000 bopd in FY 2011–12 with more than 400% increase in the working interest.
CAUTIONARY STATEMENT
Statements in this Management Discussion and
Analysis describing the Company’s objectives,
projections, estimates and expectations may be
‘forward looking statements’ within the meaning
of applicable laws and regulations. Actual results
might differ substantially or materially from those
expressed or implied. Important developments
that could affect the Company’s operations
include a downtrend in the sector, signifi cant
changes in political and economic environment in
India, exchange rate fl uctuations, tax laws,
Business Risks
Given the nature of oil and gas exploration and production, managing risks is an essential component of our business at Cairn India. The senior employees and the Board of Directors are aware of the risks faced by the Company; and the management takes steps when needed to mitigate such risks to the best possible extent, for example:
Cairn India is well placed to deal with low crude oil prices through operational cost advantages. The operational expense for existing operations at Ravva and CB/OS-2 is USD 2.10 per barrel; and the Rajasthan operational expense including the pipeline is estimated at approximately USD 5 per barrel. Thus, the Company should generate shareholder value even at lower crude oil prices
The strong promoter support, low fi nancialgearing and increasingcash fl ows should only improve the fi nancialhealth of the organisation

MANAGEMENT DISCUSSION AND ANALYSIS 41
INSIDE THE EXPORT OIL STORAGE TANK
DURING THE CONSTRUCTION PHASE AT
MANGALA PROCESSING TERMINAL

CAIRN INDIA LIMITED AN N UAL R E PORT 2009-1042
Delivering To
The NationM AY
PSC
signed
between
SIPD and
GoI
D E C
Cairn
farmed in
for 27.5%
N O V
Saraswati
discovery
F E B
Raagesh-
wari
discovery
J U N
Cairn
acquired
100%
J A N
Mangala
discovery
M A R
Aishwariya
discovery
A U G
Bhagyam
discovery
Mangala Processing Terminal
The World’s Longest Continuously Heated and Insulated Pipeline
1995 1999 2001 2003 2004
THE SITE IN 2004
THE CONCEPT TAKING SHAPE STATE–OF–THE–ART MOBILE RIGS
Cairn and ONGC JV (India) 670 km
LUKOIL Oil Company (Russia) 160 km
Pertamina (Indonesia) 115 km
LUKOIL Oil Company (Russia) 39 km
Aktua Oil (Kazakhstan) 20 km

43DELIVERING TO THE NATION
O C T
Cairn submits
development plans to
GoI for its oil fi elds
Cairn’s fi nal concept
of pipeline with a
single 24” crude oil
line and a parallel gas
pipeline to feed gas
to heating stations
every ~18 km
J A N
Raageshwari Deep
gas and NE fi eld
discovery
A P R
First letter of approval
from GoI to shift
delivery point on the
pipeline to the coast
J U N
Work on the pipeline
formally commenced
D E C
Raageshwari East 1z
discovery
ONGC agrees to
share cost of USD
900 million pipeline
to Gujarat
Substantial RoU for
pipeline obtained in
Gujarat
F E B
RoU for pipeline
also obtained for
Rajasthan
A U G
Hon'ble Prime
Minister of India
dedicated Mangala
fi eld to the nation.
Production
commences from
Mangala
M AY
Crude oil introduced
into the pipeline
2005 2006 2007 2008 2009 2010
TRAIN ONE AT MPT
CONSTRUCTION OF THE STORAGE TANKS
CURRENT NIGHT VIEW OF THE MPT

CAIRN INDIA LIMITED AN N UAL R E PORT 2009-1044
Respect
People are Cairn India’s key asset and the at-titude of the Cairn team is critical to its business culture. Cairn’s entrepreneurial spirit is under-pinned by a depth of knowledge and a strong set of cultural core values, including integrity, social and environmental responsibility, teamwork, nur-turing of individual creativity, risk management and developing alliances with key partners.
Relationships
These are the key to developing any business and Cairn India’s success in the region for more than a decade would not have been possible without the consistent support of all stakeholders, from governments, regulators and JV partners to the people living near our sites. The level of support and understanding on the ground is something
we have worked hard to bring about in our busi-ness development activities and we are proud of what we have achieved — and continue to achieve — wherever we operate.
Responsibility
Cairn India is operating in many areas that face economic, social and environmental challenges. It has the responsibility to understand these CSR challenges, identify the potential impact of its activities and, through engaging with stakeholders, look for opportunities for mutual benefi t.
OBJECTIVES
Strategic
Designed to establish best practices in the fi eld of CSR and chartering a new path for others to follow.
Corporate Social Responsibility
OVERVIEW
Global organisations are expected not only to make a difference to the economic development and stability in their countries of operation but also play a key role in the social and environmental development of the region.
Cairn India has taken a lead in this direction by developing linkages, relationships and interfaces between “business” and “society”. CSR is an integral part of the business process and strategy at Cairn from exploration to development and production. We aim to make a difference where we operate through our ideology of “Respect, Relationships and Responsibility”.

MANAGEMENT DISCUSSION AND ANALYSIS 45
External
Aimed towards a positive engagement with the external stakeholders to enlist support for CSR ini-tiatives and derive a vision striking a balance with the expectation and needs of external stakeholders.
Internal
Directed towards seeking active participation of internal stakeholders, namely employees, investors and supply chain members.
FOCUS AREAS
Cairn India is committed to the Millennium Development Goals (MDG). As we become an increasingly signifi cant player in the energy sec-tor, we will continue to leverage our CSR activities and bring the benefi ts of energy development to the communities.
We focus on inclusive growth by fostering social capital through our health and education initiatives and creating access to opportunities and resources through our economic develop-ment and infrastructure support initiatives.
Infrastructure
We recognise the role of infrastructure in the macro development perspective and work closely with local administration and communities surrounding our areas of operations be it in Ravva, Rajasthan or Suvali to aid and improve existing infrastructure facilities From building
roads to improve access to the project site and water harvesting structures in Rajasthan, providing health infrastructure and sanitation facilities in Ravva, Andhra Pradesh, we have triedto seamlessly merge our social responsibility initiatives with different stages of our business development.
Economic Development
In a bid to create a conducive environment for improved income generating opportunities, more than 1000 trainees were provided with employ-ment training for the year under review with 70% being linked to various employment opportuni-ties at the conclusion of the programme. These programmes also include training for semi skilled persons wherein 80% of the 115 trainees started their own enterprise. Close to 400 women have been trained in handicrafts making, majority from project affected families with market linkage of local exporters and contractors provided to approximately 70% for the year under review. Our dairy initiatives which have positively impacted the lives of more than 800 families continued its success through the year gone by. Approximately 0.5 million litres of milk collection was generated with revenue of INR 6.9 million (USD 0.1 million) for the year under review.
Cairn India has tied up with Thomson Reuters to provide agricultural market intelligence to 10,000 farmers along the pipeline route.
C S R H I G H L I G H T S
IFC linkage programme–
1,065 trainees trained in employment programmes
Self-employment
programme 361 women from project affected areas trained in handicraft and key chain making
Lives of more than 12,000 villagers touched through Mobile Health Van project
More than 10,000 farmers connected through SMS service of Reuters Market
Light
Dairy Project collected more than 0.5 million litres of milk and generated more than INR 6.9 million as revenue (USD 0.1 million)
COMMUNITY ENGAGEMENT PROGRAMMES IN PROGRESS

CAIRN INDIA LIMITED AN N UAL R E PORT 2009-1046
The information is collated from around 1000 different markets on 250 different types of crops and weather forecast from 2500 locations. Agri kiosks as a single-window service for all pre-harvest and post-harvest requirements of farmers along with farming inputs from 10 corporate houses are being set up in association with Multi Commodity Exchange of India Limited (MCX) and the Department of Post. For the year under review, three such centres catering to 70 villages and 2500 households have been set up.
Education
Initial activity during the exploration phase was centred around providing educational aids to set-ting up educational infrastructure like buildings, computer rooms, text books and so on. Now a long term approach is being adopted. The focus is to improve the quality of education imparted through innovation like “Theatre in Education” and “English Relay” sessions aimed at enrich-ing classroom experience. As part of the same
initiative, to inculcate a culture of learning and reading, the Company set up 40 libraries in Rajasthan and 20 in Gujarat under the “Room to Read” initiative.
Health
Our health initiatives have touched more than 12,000 lives for the year under review, directly and indirectly. While mobile health vans help augment and support healthcare facilities, health awareness camps and activities help improve the health seeking behaviour of the villagers. Almost 100 villages have availed of the mobile health van facilities in Rajasthan and Gujarat. More than 10 awareness camps attended by nearly 3000 villag-ers were organised during the year.
Corporate Social ResponsibilityCreating values for stakeholders
CO
MM
UN
ITIE
S
G
OVERNMENT NGOS B
US
INE
SS
AN
D REGULATORS P
AR
TN
ER
S
SU
PP
LIE
R
S INVESTORS
E
MPLO
YE
ES
CO
NT
RA
CTO
RS AND ° Competitive pay
° Challenging, high quality work ° Opportunity for development
° Continuing professional
development for all employees
° Consultation on organisational
initiatives
° Adherence to
global standards
° Direct interaction for feedback
and performance reporting ° Commercial relationship
° Responsible investment ° Legal compliance ° Fair returns
° Meetings with investment analysts ° IFC audit and annual monitoring
report to IFC ° Participation in surveys for
investment analysts
° Regular reporting
° To be treated fairly and honestly ° Long term relationships
° Opportunities for growth
° Commercial realtionships ° Meetings ° Training and capacity building
° Good neighbours ° Employment opportunities
° Community development
and welfare
° Public consultations ° Grievance mitigation
° Community investment
° Effective communication of
strategy and performance
° Good corporate governance and
risk/opportunity management
° Climate change strategy
° Award of exploration permits
° Granting Operational Permits
° Compliance monitoring
° Clear policies and principles ° Partnerships for progress
° Partnerships for conservation
of the environment ° Community development projects
STAKEHOLDERS
° Key interest and expectations
° Engagement

MANAGEMENT DISCUSSION AND ANALYSIS 47
PARTNERING FOR SUCCESS
We build different levels of partnership looking at the local needs and deliver highend programme towards improving lives. Here are some of our key partnerships and programmes:
International Finance Corporation (IFC)
IFC is a part of the World Bank group that provides investment and advisory services to the private sec-tor in developing countries. The Cairn-IFC Linkage Programme with the support of the Government of Rajasthan aims at maximising the development impacts of Cairn’s investments in Barmer.
Thomson Reuters
This partnership offers localised, customised and personalised information on agriculture to farmers on their mobile phones. The model is one of the six initiatives supported and recognised by United Nations Development Programme (UNDP) as part of its Millennium Development Goals.
Helpage India
The Helpage alliance with Cairn is based on providing preventive and curative healthcare to communities in Gujarat and Rajasthan.
MCX and Dept of Post, GoI
MCX is the fourth largest derivatives exchange in Asia and sixth largest commodity exchange in the world. The postal department of Government of India has the largest postal network in the world. The partnership aims to reach out to the 40,000 farmers along the pipeline route.
Room to Read India Trust
A global network which has benefi tted four million children in nine countries with their inno-vative model of infotainment through libraries.
Society to Uplift Rural Economy
One of the oldest and most renowned non-profi t organisation working in the Barmer region with the local community for more than six decades.
WE ENCOURAGE THE USE OF
INNOVATIVE METHODS TO IMPART
EDUCATION

CAIRN INDIA LIMITED AN N UAL R E PORT 2009-104848
Board of Directors
COMPOSITION, BOARD
PROCEDURE AND INFORMATION
SUPPLIED TO THE BOARD
As on 31 March, 2010, the Board comprised 10 Directors, including seven non-executive Directors, four of whom are also independent. In terms of the Securities and Exchange Board of India’s (SEBI’s) revised Clause 49 of the Listing Agreement, the Company is required to increase the number of independent Directors to at least half the strength of the Board. It is actively engaged in the process of inducting two more independent Directors with requisite expertise. It intends to have half of the Board comprising inde-pendent Directors before the end CY 2010.
The Chairman of the Board is a non-executive Promoter Director. All non-executive Directors are
renowned professionals, having diversifi ed experi-ence and expertise in fi nance, economics, oil and gas exploration and general administration.
The Board has three executive Directors, namely Messrs. Rahul Dhir, Indrajit Banerjee and Rick Bott. The executive Directors have been appointed for a term of fi ve years, except Mr Rick Bott, who has a three-year contract.
The composition of the Board as on 31 March, 2010 is given in Table 1. None of the Directors is a member of more than 10 Board-level commit-tees of Indian public limited companies; nor are they chairmen of more than fi ve committees in which they are members. Moreover, none of the Directors is related to the other, or to any other employee of the Company.
During the period under review, Mr Philip Tracy ceased to be an alternate Director to Sir William B. B. Gammell effective 26 May, 2009,
The corporate governance philosophy of Cairn India Limited (‘Cairn India’ or ‘the Company’) is structured to institutionalise policies and procedures that enhance the effi cacy of the Board and inculcate a culture of accountability, transparency and integrity across the Cairn India group as a whole.
1 Composition of the BoardAs on 31 March, 2010
S. No. Name of the Director Executive/ Non-ExecutiveNo. of other
Directorships
Memberships/Chairmanships
of Board-level Committees**
Indian Others* Member Chairman
1 Sir William B.B. Gammell Chairman, Non-Executive Director - 29 - -
2 Ms Jann Brown Non-Executive Director - 41 1 -
3 Mr Malcolm Shaw Thoms Non-Executive Director - 26 - -
4 Mr Aman Mehta Non-Executive Independent Director 6 4 3 3
5 Mr Naresh Chandra Non-Executive Independent Director 16 3 9 1
6 Dr Omkar Goswami Non-Executive Independent Director 11 1 7 2
7 Mr Edward T. Story Jr Non-Executive Independent Director - 1 2 -
8 Mr Rahul Dhir Managing Director and CEO - 5 1 -
9 Mr Indrajit Banerjee Executive Director and CFO - 29 - -
10 Mr Rick Bott Executive Director and COO - - - -
Notes * Directorships in companies registered in other jurisdictions (listed, unlisted and private limited companies).
** Only the Audit Committee and the Shareholders’ / Investors’ Grievance Committee of Indian public limited companies have been considered
Report on Corporate Governance

49REPORT ON CORPORATE GOVERNANCE
and was re-appointed in the same post effective 27 May, 2010.
The Company follows a structured pro-cess of decision-making by the Board and its Committees. The meeting dates are usually fi nalised well before the beginning of the year. Detailed agenda, management reports and other explanatory statements are circulated at least seven days ahead of the meeting. To address specifi c urgent needs, meetings are also called at shorter notice but never less than a minimum of seven days. In some instances, resolutions are passed by circulation. The Board is also free to recommend inclusion of any matter in the agenda for discussion. Senior management offi cials are called to provide additional inputs on the matters being discussed by the Board/ Committee.
The Board has complete access to all relevant information of the Company. The quantum and quality of information supplied by the management to the Board goes well beyond the minimum requirement stipulated in Clause 49. All information, except critical price sensitive information (which is handed out at the meet-ings), is given to the Directors well in advance of the Board and Committee meetings.
NUMBER OF BOARD MEETINGS
AND THE ATTENDANCE OF DIRECTORS
During the year ended 31 March, 2010, the Board of Directors met eight times on: 27 May, 2009, 29 July, 2009, 18 August, 2009, 22 October, 2009, 29 October, 2009, 9 December, 2009, 28 January, 2010 and 25 March, 2010. The maxi-mum gap between any two meetings was less than three months.
Table 2 gives the Directors’ attendance at Board Meetings and the Annual General Meeting (AGM) during the year ended 31 March, 2010.
DIRECTORS’ REMUNERATION
Table 3 lists the remuneration paid or payable to the Directors. The non-executive Directors do not have any material pecuniary relationship or transactions with the Company, other than sitting fees / Directors’ remuneration paid / payable to them. The non-executive Directors are eligible for commission up to 1% of net profi ts as permitted by the Companies Act, 1956 and as approved by shareholders in the annual general meeting held on 20 September, 2007.
During the year under review, 65,845 options were granted to Mr Indrajit Banerjee under the Cairn India Performance Option Plan, 2006 (CIPOP). These were granted on the basis of his
2 Directors' Attendance Record for year ended 31 March, 2010
Name No. of meetings held during the period
the Director was on Board
No. of meetings
attended
Presence at
the last AGM
Sir William B. B. Gammell * 8 7 Yes
Ms Jann Brown* 8 7 Yes
Mr Rahul Dhir 8 8 Yes
Mr Malcolm Shaw Thoms* 8 7 Yes
Mr Aman Mehta 8 8 Yes
Mr Naresh Chandra 8 8 Yes
Dr Omkar Goswami 8 7 Yes
Mr Indrajit Banerjee 8 8 Yes
Mr Rick Bott 8 8 Yes
Mr Edward T. Story Jr* 8 4 No
Note * Also participated in the proceedings of one Board Meeting through audio conference.

CAIRN INDIA LIMITED AN N UAL R E PORT 2009-1050
performance in contributing to business results, organisational strength and market position of the Company and criticality of the role assigned. The vesting period is minimum three years, sub-ject to the fulfi lment of performance conditions in the Plan. The exercise period is three months from the date of vesting of options.
In addition, 155,341 cash options were granted to Mr Rick Bott under the Phantom Performance Option Plan.
No options were exercised by the executive Directors during the year under review.
SHAREHOLDING OF NON-EXECUTIVE
OR INDEPENDENT DIRECTORS
Sir William B. B. Gammell, Ms Jann Brown and Mr Malcolm Shaw Thoms, who are non-executive Directors of the Company, hold one equity share each in the Company as nominees of Cairn UK Holdings Limited. Apart from this, none of the non-executive or independent Directors holds any equity shares or convertible instruments of the Company.
CODE OF CONDUCT
The Board of Directors has laid down a ‘Code of Business Ethics’ which is applicable to everyone in the Cairn India Group including employees, contractors and Directors. Details of the Code are available at www.cairnindia.com. All Directors and senior management have affi rmed compliance with the Code for the year ended 31 March, 2010.
COMMITTEES OF THE BOARD
Audit committee
The Company has an adequately qualifi ed Audit Committee. As on 31 March, 2010, the
Committee comprised fi ve non-executive Directors: Mr Aman Mehta (Chairman), Mr Naresh Chandra, Ms Jann Brown, Dr Omkar Goswami and Mr Edward T. Story. Four of the fi ve members are independent. All members have the fi nancial knowledge and expertise mandated by Clause 49 of the Listing Agreement. The current charter of the Audit Committee is in line with international best practices as well as the regulatory requirements mandated by SEBI and Clause 49 of the Listing Agreement.
Mr Indrajit Banerjee, Executive Director and CFO, Mr Raj Agarwal, Partner, S. R. Batliboi and Co., and Mr Raman Sobti, Director, KPMG, are invitees to the meetings of the Audit Committee. Ms Neerja Sharma, Company Secretary is the Secretary to the Committee. During the year ended 31 March, 2010, the Audit Committee met fi ve times: on 27 May, 2009, 29 July, 2009, 29 October, 2009, 28 January, 2010 and 25 March, 2010. The attendance record of the Audit Committee is given in Table 4. Mr Aman Mehta, Chairman of the Audit Committee, was present at the Company’s last AGM held on 18 August, 2009.
Shareholders’ / Investors’ Grievance Committee
As on 31 March, 2010, the Committee comprised three Directors: Dr Omkar Goswami (Chairman), Mr Edward T. Story and Mr Rahul Dhir. Mr Story was co-opted to the Committee as a member in place of Mr Naresh Chandra with effect from 29 October, 2009.
The Chairman of the committee is an inde-pendent Director. Ms Neerja Sharma, Company
3 Directors’ Remuneration For the year ended 31 March, 2010 (in INR)
Name Salary Perquisites Bonus & Performance
incentives
Retirement
Benefi ts
Commission Sitting
Fee
Total
Sir William B. B. Gammell - - - - - - -
Ms Jann Brown - - - - - - -
Mr Rahul Dhir1 34,995,023 67,616,900 28,812,876 4,201,892 - - 135,626,691
Mr Indrajit Banerjee2 13,207,800 - 12,644,829 1,425,612 - - 27,278,241
Mr Rick Bott3 23,969,235 68,736,308 6,497,197 2,887,725 - - 102,090,465
Mr Malcolm Shaw Thoms - - - - - - -
Mr Aman Mehta4 - - - - - 340,000 340,000
Mr Naresh Chandra4 - - - - - 340,000 340,000
Dr Omkar Goswami4 - - - - - 320,000 320,000
Mr Edward T. Story Jr - - - - - 160,000 160,000
Notes 1 Mr Rahul Dhir’s salary as stated above includes salary from Cairn Energy India Pty Limited of INR 133,226,6912 Mr Indrajit Banerjee’s salary as stated above includes salary from Cairn Energy India Pty Limited of INR 25,478,241. He was also paid an ex-gratia amount of
INR 25,478,362.3 Mr Rick Bott’s salary as stated above includes salary from Cairn Energy India Pty Limited of INR 100,890,465. He was also paid a milestone linked bonus of
INR 62,653,500.4 Mr Aman Mehta, Dr Omkar Goswami and Mr Naresh Chandra were paid a remuneration of INR 586,375 each from Cairn Energy Holdings Limited,
Cairn Energy Hydrocarbons Limited & Cairn Energy Asia Pty Limited, respectively, in their capacity as directors in these subsidiary companies.

51
Secretary, is the Compliance Offi cer of the Company and the Secretary of the Committee. The Committee met once during the fi nancial year on 25 March, 2010. Dr Omkar Goswami and Mr Rahul Dhir attended the said meeting. The Company has appointed Link Intime India Private Limited as the Registrar and Transfer Agent to handle investor grievances in coordination with the Compliance Offi cer. All grievances can be addressed to the Registrar and Share Transfer Agent. The Company monitors the work of the Registrar to ensure that the investor grievances are settled expeditiously and satisfactorily. The status of complaints received during the 12-month period ended 31 March, 2010 by the Registrar and Share Transfer Agent is given in Table 5.
Remuneration Committee
The Board has a Remuneration Committee to make recommendations to the Board as to the Company’s framework or broad policy for the remuneration of the executive Directors and senior executives one level below the Board. As on 31 March, 2010, the Remuneration Committee comprised fi ve non-executive Directors: Mr Naresh Chandra (Chairman), Sir William B.B. Gammell, Mr Malcolm Shaw Thoms, Mr Aman Mehta and Dr Omkar Goswami. Three of these members were independent Directors. Ms Neerja Sharma, Company Secretary, is the Secretary to the Committee.
The objective of the Company’s remuneration policy is to ensure that Cairn India’s executive Directors and senior executives are suffi ciently
incentivised for enhanced performance. In determining this policy, the Committee takes into account factors it deems relevant and gives due regard to the interests of shareholders and to the fi nancial and commercial health of the Company. It ensures that levels of remuneration are suffi -cient to attract and retain senior executives of the quality required to run the Company successfully.
Within the terms of the agreed policy, the Committee determines the entire individual re-muneration packages for the executive Directors. The Committee is also responsible for overseeing the Company’s share option schemes and long term incentive plans, including determining the eligibility for benefi ts and approving total annual payments. During the year ended 31 March, 2010, four meet-ings of the Remuneration Committee were held: on 27 May, 2009, 29 July, 2009, 29 October, 2009 and 25 March, 2010. The attendance record of the Remuneration Committee is given in Table 6.
Nomination Committee
As on 31 March, 2010, the Nomination Committee comprised fi ve Directors: Sir William B.B. Gammell (Chairman), Mr Rahul Dhir, Ms Jann Brown, Mr Malcolm Shaw Thoms and Mr Edward T. Story.The functions of the Nomination Committee are:
Reviewing the structure, size and composition �
of the Board, and make recommendations to the Board with regard to changes, if any.
Evaluating the balance of skills, knowledge �
and experience of the Board and, in light of this
4 Attendance Record of Audit Committee For the year ended 31 March, 2010
Name Position Status
No. of meetings held during
the period the Director was a
Member of the Committee
No. of meetings
attended
Mr Aman Mehta Independent Director Chairman 5 5
Mr Naresh Chandra Independent Director Member 5 5
Dr Omkar Goswami Independent Director Member 5 4
Ms Jann Brown Non-executive Director Member 5 5
Mr Edward T Story Independent Director Member 5 4
5 Complaints Received and Attended During the year ended 31 March, 2010
Nature of Complaint No. of Complaints
Received Attended Pending
Non-receipt of refund orders /
revalidation / demat credit23 23 NIL
Referred by SEBI 10 10 NIL
Referred by Stock Exchanges - - NIL
Received from investors 44 44 NIL
Non-receipt of the Annual Report 11 11 NIL
Total 88 88 NIL
REPORT ON CORPORATE GOVERNANCE

CAIRN INDIA LIMITED AN N UAL R E PORT 2009-1052
evaluation, preparing a description of the role and capabilities required for particular appointments.
Identifying and nominating, for the approval �
of the Board, appropriate individuals to fi ll Board vacancies as and when they arise.
Reviewing time required from each non-exec- �
utive Director, and assessing whether s(he) has given suffi cient commitment to the role.
Considering succession planning taking into �
account the challenges and opportunities facing the Company, and what skills and expertise are needed from members of the Board in the future.
Ensuring that on appointment to the Board, the �
non-executive Directors receive a formal letter of appointment setting out clearly what is expected of them in terms of time commitment, committee
6 Attendance Record of Remuneration Committee For the year ended 31 March, 2010
Name Position StatusNo. of meetings
held
No. of meetings
attended
Mr Naresh Chandra Independent Director Chairman 4 4
Sir William B.B. Gammell Non-Executive Director Member 4 4
Dr Omkar Goswami Independent Director Member 4 4
Mr Aman Mehta Independent Director Member 4 4
Mr Malcolm Shaw Thoms Non-Executive Director Member 4 4
7 Details of Directorship and Committee Positions held in other Companies
S. No. Name of Director Name of the Company in which Directorship held Committee Chairmanship* Committee Membership*
1 Mr Rahul Dhir Cairn India Holdings Limited
CIG Mauritius Holding Pvt. Ltd.
CIG Mauritius Pvt. Ltd.
Cairn Lanka (Pvt.) Ltd.
Sunborne Energy Holdings LLC
2 Mr Indrajit Banerjee Cairn Energy Holdings Limited
Cairn Energy Hydrocarbons Limited
Cairn Exploration (No. 2) Limited
Cairn Exploration (No. 4) Limited
Cairn Exploration (No. 6) Limited
Cairn Exploration (No. 7) Limited
Cairn Energy Gujarat Block 1 Limited
Cairn Energy Discovery Limited
Cairn Petroleum India Limited
Cairn Energy Cambay B.V.
Cairn Energy India West B.V.
Cairn Energy Gujarat B.V.
Cairn Energy India Holdings B.V.
Cairn Energy Group Holdings B.V.
Cairn Energy Netherlands Holdings B.V.
Cairn Energy Gujarat Holding B.V.
Cairn Energy India West Holding B.V.
Cairn Energy Cambay Holding B.V.
Cairn Energy Australia Pty Limited
CEH Australia Limited
Cairn Energy Asia Pty Limited
Cairn Energy Investments Australia Pty Limited
Wessington Investments Pty Limited
Sydney Oil Company Pty Limited
Cairn Energy India Pty Limited
CEH Australia Pty Limited
CIG Mauritius Holding Pvt. Ltd.
CIG Mauritius Private Limited
Cairn Lanka (Pvt.) Limited
Note * Only Audit and Shareholders’/Investors’ Grievance Committees included

53
service and involvement outside Board meetings.
Management
MANAGEMENT DISCUSSION
AND ANALYSIS
This Annual Report has a detailed chapter on Management Discussion and Analysis.
DISCLOSURES
The Company follows the accounting standards and guidelines laid down by the Institute of Chartered Accountants of India (ICAI) in prepara-tion of its fi nancial statements. No material fi nan-cial and commercial transactions were reported by the management to the Board, in which the management had any personal interest that either had or could have had a confl ict with the interest of the Company at large. There were no transactions with the Directors or Management, their associates or their relatives etc. that either had or could have had a confl ict with the interest of the Company at large.
There were no penalties or strictures imposed on the Company by the stock exchange, the SEBI or any statutory authority on any matter related to capital markets, during the last three years.
CODE FOR PREVENTION OF
INSIDER TRADING PRACTICES
In compliance with the SEBI regulations on prevention of insider trading, the Company has instituted a comprehensive Code of Conduct for its management and staff. The Code lays down guide-lines which advise management and staff on proce-dures to be followed and disclosures to be made while dealing with shares of the Company, and cautions them on the consequences of violations.
RISK MANAGEMENT
Cairn India follows well-established and detailed risk assessment and minimisation procedures, which are periodically reviewed by the Board.
CEO / CFO CERTIFICATION
The CEO’s and CFO’s certifi cation of the fi nancial statements and a declaration that all Board members and senior management have affi rmed compliance with the Company’s Code of Business Ethics for the year ended 31 March, 2010 is enclosed at the end of this chapter.
SUBSIDIARY COMPANIES
All subsidiaries of the Company are unlisted wholly owned foreign companies. These subsid-iaries have their own Board of Directors hav-ing the rights and obligations to manage such companies in best interest of the Company.
The Company has its representatives on the Boards of subsidiary companies and regularly monitors the performance of such companies.
Shareholders
DISCLOSURES REGARDING
APPOINTMENT OR RE-APPOINTMENT
OF DIRECTORS
Brief profi les of the persons sought to be appointed / re-appointed as Directors at the ensuing AGM of the Company are given below.
Mr Rahul Dhir
Mr Rahul Dhir, 44, joined Cairn India in May 2006 as the Chief Executive Offi cer and was appointed the Managing Director on 22 August, 2006. He completed his degree in Bachelor of Technology from the Indian Institute of Technology, Delhi. He went on to complete his M.Sc from the University of Texas at Austin and MBA from the Wharton Business School in Pennsylvania. Mr Dhir started his career as an oil and gas reservoir engineer before moving into investment banking. He has worked at SBC Warburg, Morgan Stanley and Merrill Lynch. Before joining Cairn India, he was the Managing Director and Co-Head of Energy and Power Investment Banking at Merrill Lynch.
Mr Indrajit Banerjee
Mr Indrajit Banerjee, 54,was appointed as an Additional Director on 26 February, 2007 and as the Executive Director and Chief Financial Offi cer on 1 March, 2007. He graduated from the University of Calcutta with a Bachelor’s Degree in Commerce. An associate member of the Institute of Chartered Accountants of India, Mr Banerjee started his career at PriceWaterhouse Coopers in Calcutta in 1979. He has held several senior positions throughout his career, includ-ing 17 years at the Indian Aluminium Company, formerly part of the Alcan Group and at Lucent Technologies (India). Before joining Cairn India, he was President-Finance and Planning at Lupin Limited.
The directorships and committee positions held by these two Directors as on 31 March, 2010 are detailed in Table 7.
REPORT ON CORPORATE GOVERNANCE

CAIRN INDIA LIMITED AN N UAL R E PORT 2009-1054
MEANS OF COMMUNICATION
Financial Results
The Company intimates un-audited as well as au-dited fi nancial results to the Stock Exchanges, im-mediately after the Board meetings at which they are approved. The results of the Company are also published in at least one prominent national and one regional newspaper having wide circulation. The fi nancial results are also displayed on the Company’s website: www.cairnindia.com and posted on the corporate fi ling and dissemination system at www.corpfi ling.co.in.
News Releases, Analyst Presentation, etc.
Offi cial news releases, detailed presentations made to media, institutional investors, fi nancial analysts etc. are displayed on the Company’s website: www.cairnindia.com.
Website
The Company’s website (www.cairnindia.com) contains a separate dedicated section ‘Investor Relations’ where shareholders information is available. The full Annual Report, shareholding pattern and Corporate Governance Report is also available on the website.
GENERAL BODY MEETINGS
The Company in its brief history has had three AGMs and four Extraordinary General Meetings (EGMs). The forthcoming AGM is scheduled to take place on 15 September, 2010. The desired details in respect of general meetings are given in Table 8.
SPECIAL RESOLUTIONS PASSED
IN THE LAST THREE YEARS
At AGMs
At the AGMs held on 20 September, 2007 and 25 June, 2008, the following special resolutions were passed:
20 September, 2007
Keeping register of members and other related �
documentsConsent of shareholders for issue of further �
securitiesPayment of commission to non-executive �
Directors
25 June, 2008
Keeping register of members and other related �
documents
At EGMs
At the EGMs held on 8 September, 2006, 21 September, 2006, 17 November, 2006 and 16 April, 2008, the following special resolutions were passed:8 September, 2006
Investment in shares of Cairn India Holdings �
Limited
21 September, 2006
Amendment in the memorandum of associa- �
tion of the CompanyAmendment in the articles of association of the �
CompanyAppointment of non-retiring Directors �
Issue of equity shares of the Company on a �
private placement basisIssue of equity shares of the Company by an �
initial public offeringIncrease in the limit of foreign institutional �
investment in the CompanyInvestment in the shares of Cairn India �
Holdings Limited
17 November, 2006
Appointment of Chief Executive Offi cer of the �
CompanyEmployee stock option plans �
Amendment in the articles of association of the �
CompanyRemuneration of non-executive Directors �
8 Location and time of general meetings
Financial Year Location of the meeting Date Time
AGMs
2006 Birla Matushri Sabhagar, 19 New Marine Lines, Mumbai 20 September, 2007 11:00 AM
2007 Birla Matushri Sabhagar, 19 New Marine Lines, Mumbai 25 June, 2008 11:00 AM
2008-09 Birla Matushri Sabhagar, 19 New Marine Lines, Mumbai 18 August, 2009 11:00 AM
EGMs
2006 50 Lothian Road, Edinburgh 08 September, 2006 03.00 PM
2006 50 Lothian Road, Edinburgh 21 September, 2006 02.00 PM
2006 50 Lothian Road, Edinburgh 17 November, 2006 02.15 PM
2008 Birla Matushri Sabhagar, 19, New Marine Lines, Mumbai 16 April, 2008 02.30 PM
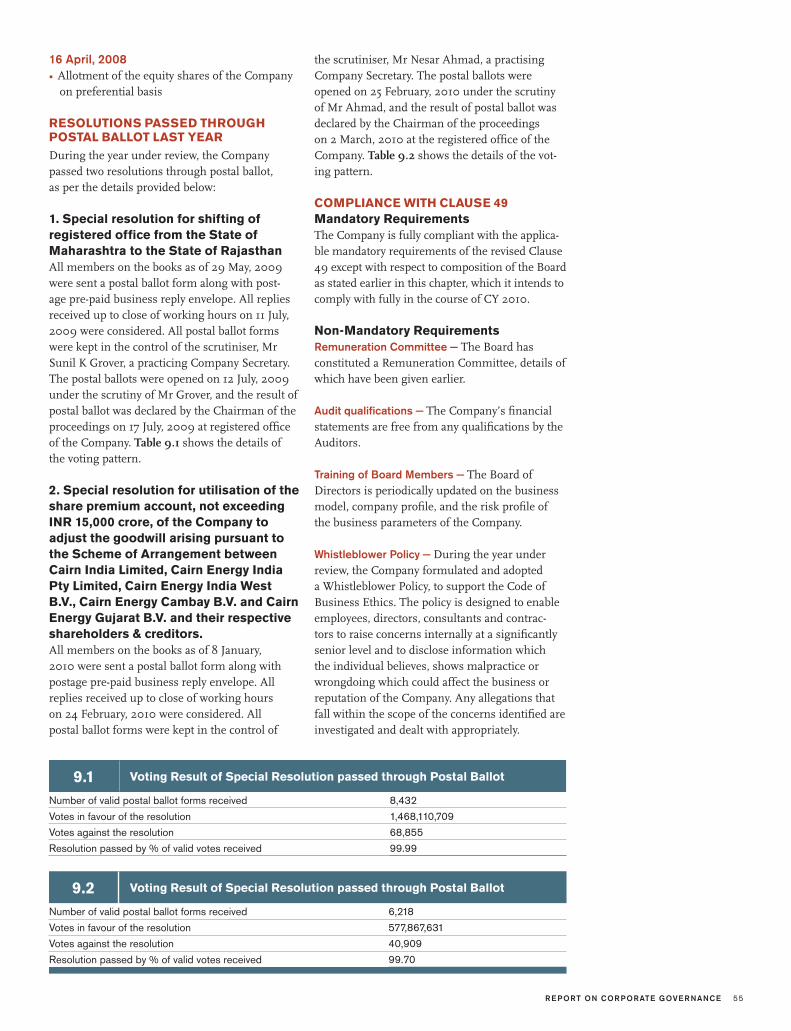
55
16 April, 2008
Allotment of the equity shares of the Company �
on preferential basis
RESOLUTIONS PASSED THROUGH
POSTAL BALLOT LAST YEAR
During the year under review, the Company passed two resolutions through postal ballot, as per the details provided below:
1. Special resolution for shifting of
registered offi ce from the State of
Maharashtra to the State of Rajasthan
All members on the books as of 29 May, 2009 were sent a postal ballot form along with post-age pre-paid business reply envelope. All replies received up to close of working hours on 11 July, 2009 were considered. All postal ballot forms were kept in the control of the scrutiniser, Mr Sunil K Grover, a practicing Company Secretary. The postal ballots were opened on 12 July, 2009 under the scrutiny of Mr Grover, and the result of postal ballot was declared by the Chairman of the proceedings on 17 July, 2009 at registered offi ce of the Company. Table 9.1 shows the details of the voting pattern.
2. Special resolution for utilisation of the
share premium account, not exceeding
INR 15,000 crore, of the Company to
adjust the goodwill arising pursuant to
the Scheme of Arrangement between
Cairn India Limited, Cairn Energy India
Pty Limited, Cairn Energy India West
B.V., Cairn Energy Cambay B.V. and Cairn
Energy Gujarat B.V. and their respective
shareholders & creditors.
All members on the books as of 8 January, 2010 were sent a postal ballot form along with postage pre-paid business reply envelope. All replies received up to close of working hours on 24 February, 2010 were considered. All postal ballot forms were kept in the control of
the scrutiniser, Mr Nesar Ahmad, a practising Company Secretary. The postal ballots were opened on 25 February, 2010 under the scrutiny of Mr Ahmad, and the result of postal ballot was declared by the Chairman of the proceedings on 2 March, 2010 at the registered offi ce of the Company. Table 9.2 shows the details of the vot-ing pattern.
COMPLIANCE WITH CLAUSE 49
Mandatory Requirements
The Company is fully compliant with the applica-ble mandatory requirements of the revised Clause 49 except with respect to composition of the Board as stated earlier in this chapter, which it intends to comply with fully in the course of CY 2010.
Non-Mandatory Requirements
Remuneration Committee — The Board has constituted a Remuneration Committee, details of which have been given earlier.
Audit qualifi cations — The Company’s fi nancial statements are free from any qualifi cations by the Auditors.
Training of Board Members — The Board of Directors is periodically updated on the business model, company profi le, and the risk profi le of the business parameters of the Company.
Whistleblower Policy — During the year under review, the Company formulated and adopted a Whistleblower Policy, to support the Code of Business Ethics. The policy is designed to enable employees, directors, consultants and contrac-tors to raise concerns internally at a signifi cantly senior level and to disclose information which the individual believes, shows malpractice or wrongdoing which could affect the business or reputation of the Company. Any allegations that fall within the scope of the concerns identifi ed are investigated and dealt with appropriately.
9.1 Voting Result of Special Resolution passed through Postal Ballot
Number of valid postal ballot forms received 8,432
Votes in favour of the resolution 1,468,110,709
Votes against the resolution 68,855
Resolution passed by % of valid votes received 99.99
9.2 Voting Result of Special Resolution passed through Postal Ballot
Number of valid postal ballot forms received 6,218
Votes in favour of the resolution 577,867,631
Votes against the resolution 40,909
Resolution passed by % of valid votes received 99.70
REPORT ON CORPORATE GOVERNANCE

CAIRN INDIA LIMITED AN N UAL R E PORT 2009-1056
ANNUAL GENERAL MEETING
Date 15 September, 2010Time 11:00 AMVenue:Rangsharda Auditorium, K C Marg, Bandra Reclamation,Bandra West, Mumbai-400050
FINANCIAL CALENDAR
For the year ended 31 March, 2010, results were announced on
29 July, 2009: First quarter �
29 October, 2009: Second quarter �
28 January,2010 : Third quarter �
27 May, 2010 :Fourth (last) quarter and the �
fi nancial year’s resultsFor the year ending 31 March, 2011, results will be announced by
Last week of July 2010: First quarter �
Last week of October 2010: Half yearly �
Last week of January 2011: Third quarter �
Last week of May 2011: Fourth quarter and full �
fi nancial year’s results.
BOOK CLOSURE
The dates of book closure are from Wednesday, 8 September, 2010 to Wednesday, 15 September, 2010, inclusive of both days.
LISTING
The equity shares of the Company are listed on Bombay Stock Exchange Limited (BSE) and the National Stock Exchange of India Limited (NSE). The annual listing fee for the fi nancial year 2010-11 has been paid to BSE and NSE. The stock codes are given in Table 1 below.
MARKET PRICE DATA
Table 2 and Chart A give the details.
DISTRIBUTION OF SHAREHOLDING
Tables 3 and 4 list the distribution of the Shareholding and Shareholding pattern of the Company by size and by ownership class as on 31 March, 2010. Further details of top twenty share-holders are given in Table 5.
Additional Shareholder Information

57ADDITIONAL SHAREHOLDER INFORMATION
1 Stock Exchange codes
Name of the Stock Exchange Stock Code
The National Stock Exchange of India CAIRN
Bombay Stock Exchange Limited 532792
2 High, Low and Volume of Company’s Shares traded During the year ended 31 March, 2010 at the BSE and the NSE
Months BSE NSE
High Low No. of Shares traded High Low No. of Shares traded
April 2009 214.0 178.5 13,869,825 211.6 178.5 71,683,250
May 2009 239.9 192.0 49,252,984 240.5 190.5 164,417,628
June 2009 273.7 220.0 31,626,399 274.0 220.1 144,248,354
July 2009 252.0 201.0 17,376,062 252.0 200.6 79,285,187
August 2009 272.5 230.0 17,168,054 272.5 232.1 64,997,559
September 2009 275.25 253.5 11,576,332 275.5 253.2 55,393,930
October 2009 301.45 253.25 12,239,989 301.0 252.6 55,763,961
November 2009 288.0 254.0 7,365,798 288.9 254.2 37,112,191
December 2009 294.9 265.7 7,828,273 300.1 266.1 39,358,739
January 2010 310.0 258.3 10,288,360 310.0 258.0 59,917,270
February 2010 273.4 248.0 7,718,586 274.0 248.1 46,265,139
March 2010 307.8 261.9 9,884,708 307.6 261.4 62,073,392
0
50
100
150
200
Note Share prices, Nifty and Sensex indexed to 100 as on the fi rst working day of the fi nancial year 2009-10, i.e.1 April, 2009

CAIRN INDIA LIMITED AN N UAL R E PORT 2009-1058
DEMATERIALISATION OF SHARES
As on 31 March, 2010, over 99.99% shares of the Company were held in dematerialised form. The shares of the Company are permitted to be traded only in dematerialised form under ISIN INE910H01017.
OUTSTANDING GDRS / ADRS /
WARRANTS OR ANY CONVERTIBLE
INSTRUMENTS, CONVERSION DATES
AND LIKELY IMPACT ON EQUITY
There are no outstanding GDRs / ADRs / war-rants or any convertible instruments issued by the Company. However, the Company has outstand-ing employee stock options, the details of which as on 31 March, 2010 are given in Table 6.
DETAILS OF FUNDING OBTAINED
IN THE LAST THREE YEARS
The Company’s Initial Public Offering (IPO) of 328,799,675 equity shares, which closed on 15
December, 2006, was fully subscribed aggregat-ing INR 52,608 million at the issue price of INR 160. The Company also placed INR 33,547 million through a pre-IPO placement and exercised its Green Shoe Option for 13,085,041 shares. The total proceeds aggregated INR 88,249 million.
The Company made a preferential issue of 113,000,000 equity shares to Petronas International Corporation Ltd and Orient Global Tamarind Fund Pte Ltd. amounting to INR 25,345.9 million on 22 April, 2008. The shares were issued at a premium of INR 214.30 per share.
During the year under review, the Company has received INR 20,363,110 as subscription amount, pursuant to exercise of stock options granted to employees.
During the fi nancial year ended 31 March, 2010, the Company borrowed USD 750 million from a consortium of overseas commercial banks led by Standard Chartered and International Finance Corporation. Further, a domestic
3 Distribution of Shareholding As on 31 March, 2010
Number of Shares No of Shareholders % of Shareholders Total Shares % of Shares
Up to 5,000 243,914 99.55 41,283,100 2.18
5,001-10,000 360 0.15 2,608,352 0.14
10,001-20,000 173 0.07 2,423,262 0.13
20,001-30,000 87 0.03 2,181,380 0.11
30,001-40,000 52 0.02 1,804,181 0.09
40,001-50,000 37 0.01 1,688,050 0.09
50,001-100,000 90 0.04 6,500,488 0.34
100,001 and above 309 0.13 1,838,485,319 96.92
Total 245,022 100 1,896,974,132 100
4 Shareholding Pattern by Ownership As on 31 March, 2010
No. of Equity Shares
Face Value INR 10/- Each
Shares Held
(%)
A. PROMOTER HOLDING
Indian Promoters - -
Foreign Promoters 1,183,243,791 62.38
Persons acting in concert - -
B. NON-PROMOTER HOLDING
A Banks, Financial Institutions, Insurance Companies
(Central /State Govt. Institutions /Non-Government Institutions)90,434,695 4.77
B Foreign Institutional Investors 194,051,172 10.23
C Public 43,757,767 2.31
D Mutual Funds 53,758,180 2.83
E NRI (Repatriable) 1,069,150 0.05
F NRI (Non-Repatriable) 380,995 0.02
G Bodies Corporate 35,457,071 1.87
H Foreign Bodies Corporate 290,481,473 15.31
I Clearing Member 1,536,702 0.08
J Directors/relatives 2,776,156 0.15
K Trusts 26,980 -
Grand Total 1,896,974,132 100.00

59ADDITIONAL SHAREHOLDER INFORMATION
7 Status of Equity Shares lying in the Suspense Account
S. No. ParticularsNo. of
Shareholders
No. of
Shares
1Aggregate number of shareholders and the outstanding shares in the
suspense account lying as on 1 April, 200972 12,495
3No. of shareholders who approached for transfer of shares from sus-
pense account during the 12 months period ended 31 March, 201015 2,135
4No. of shareholders to whom shares were transferred from suspense ac-
count during the 12 months period ended 31 March, 201015 2,135
5Aggregate number of shareholders and the outstanding shares in the
suspense account as on 31 March, 201057 10,360
5 Top Twenty Shareholders As on 31 March, 2010
S.No. Name No. of Equity Shares Shares Held (%)
1 Cairn UK Holdings Limited 1,183,243,785 62.38
2 Petronas International Corporation Limited 283,431,438 14.94
3 Life Insurance Corporation of India 46,672,794 2.46
4 LIC of India - Market Plus 14,271,145 0.75
5 Europacifi c Growth Fund 12,812,190 0.68
6 LIC of India Market Plus – 1 12,154,468 0.64
7 Merrill Lynch International Investment Fund 11,745,952 0.62
8 ICICI Prudential Life Insurance Company Ltd 10,359,774 0.55
9 International Finance Corporation 7,050,035 0.37
10 Schroder International Selection Fund Emerging Asia 6,751,530 0.36
11 New World Fund Inc 6,587,000 0.35
12 Barclays Capital Mauritius Limited 5,702,763 0.30
13 PRU India Equity Open Limited 5,663,234 0.30
14 Norges Bank A/C Government Petroleum Fund 5,556,960 0.30
15 State Bank of India (Equity) 5,222,170 0.28
16 LIC of India Money Plus 5,211,809 0.27
17 Franklin Templeton Investment Funds 4,554,429 0.24
18 Metlife India Insurance Company Limited 4,377,029 0.23
19 Societe Generale 4,144,345 0.22
20 SBI Life Insurance Co. Limited 4,126,623 0.22
6 Outstanding ESOPs
ESOP Scheme No. of outstanding options Last date for exercise Exercise Price (INR)
CIESOP 1,981,770 31 December, 2016 160.00
3,915,607 19 September, 2017 166.95
3,502,555 28 July, 2018 227.00
18,388 9 December, 2018 143.00
5,227,889 28 July, 2019 240.05
CIPOP* 168,382 31 March, 2010 10.00
777,496 19 December, 2010 10.00
714,237 28 October, 2011 10.00
966,715 28 October, 2012 10.00
CISMP 2,238,077 18 months after the vesting date, which
will occur on Company achieving 30 days’
consecutive production of over 150,000
bopd from the Rajasthan Block
33.70
Total 19,511,116
Note * The vesting period is a minimum of three years, subject to the fulfi lment of performance conditions as defi ned
in the Plan. The exercise period is three months from the date of vesting of options. The last date of exercise in
case of CIPOP is considered on the assumption that the options shall vest after three years of their grant. If all the
outstanding stock options granted get vested and exercised, the number of equity shares will increase by 19,511,116.

CAIRN INDIA LIMITED AN N UAL R E PORT 2009-1060
borrowing of INR 4,000 crore was also under-written by SBI, who had syndicated the facility to other banks and fi nancial institutions.
SHARE SUSPENSE ACCOUNT
Following Clause 5A of the Listing Agreement, the status of the equity shares lying in the Suspense Account is given in Table 7.
SHARE TRANSFER SYSTEM
Link Intime India Private Limited is the Registrar and Transfer Agent of the Company. All share transfers and related operations are conducted by Link Intime, which is registered with the SEBI. The Company has a Shareholders’/Investors’ Grievance Committee for redressing the com-plaints/queries of shareholders and investors.
ADDRESS FOR INVESTOR
CORRESPONDENCE
Either
Link Intime India Private Limited(Unit: Cairn India Limited)C-13, Pannalal Silk Mills CompoundL.B.S Marg, Bhandup (West)Mumbai 400 078, India.
E-Mail [email protected] +91 22 25946970Fax +91 22 25946969
Or
The Company SecretaryCairn India Limited4th Floor, Vipul Plaza, Sun City, Sector 54Gurgaon 122 002, India.
E-Mail [email protected] +91 124 2703000Fax +91 124 2889320
Investors can e-mail their queries/complaints to [email protected]. The weblink to this E-Mail ID is also available on Company’s website www.cairnindia.com under the ‘Investor Relations’ section.
INVESTOR RELATIONS
The Company has a dedicated Shares Investor Relations Department which helps investors, including FIIs and institutional investors, in mak-ing informed decisions. This team also maintains close liaison with investors and shares informa-tion through periodic meetings including tele-conferencing in India and abroad, regular press meeting with investment bankers, research ana-lysts, the media, institutional investors etc. The ‘Investor Relations’ section on the Company’s website (www.cairnindia.com) updates informa-tion sought by investors and analysts. It provides the latest information on fi nancial statements, investor-related events and presentations, annual reports and shareholding pattern along with me-dia releases and the current Company overview, and thus helps existing and potential investors to interact with the Company.
OPERATIONAL LOCATIONS
The Company’s oil and gas fi elds are located at: Ravva (Andhra Pradesh) �
Cambay Basin (Gujarat) �
Barmer (Rajasthan) �
REGISTERED OFFICE ADDRESS
Cairn India Limited101, West View, Veer Savarkar Marg, Prabhadevi, Mumbai- 400 025
Tel +91 22 24338306Fax +91 22 24311160

61ADDITIONAL SHAREHOLDER INFORMATION
C E R T I F I C AT E O F T H E C E O & C F O
THE BOARD OF DIRECTORS
Cairn India Limited101, West View, Veer Savarkar Marg, Prabhadevi, Mumbai- 400 025
Dear Sirs,We, Rahul Dhir, Chief Executive Offi cer, and Indrajit Banerjee, Chief Financial Offi cer, of Cairn India Limited hereby certify to the Board that:
a. We have reviewed fi nancial statements and the cash fl ow state-ment for the fi nancial year ended 31 March, 2010 and that to the best of our knowledge and belief:i. These statements do not contain any materially untrue state-
ment or omit any material fact or contain statements that might be misleading;
ii.These statements together present a true and fair view of the Company’s affairs and are in compliance with existing account-ing standards, applicable laws and regulations.
b. There are, to the best of our knowledge and belief, no transac-tions entered into by Cairn India Limited during the year which are fraudulent, illegal or violative of the Company’s Code of Business Ethics.
c. We are responsible for establishing and maintaining internal controls for fi nancial reporting in Cairn India Limited, and we have evaluated the effectiveness of the internal control systems of the Company pertaining to fi nancial reporting. We have dis-closed to the auditors and the Audit Committee, defi ciencies in the design or operation of such internal controls, if any, of which we are aware and the steps we have taken or propose to take to rectify these defi ciencies.
d. We have indicated to the auditors and the Audit Committeei.Signifi cant changes in internal control over fi nancial reporting
during the year;ii.Signifi cant changes in accounting policies during the year and
the same have been disclosed in the notes to the fi nancial state-ments; and
iii.Instances of signifi cant fraud of which we have become aware and the involvement therein, if any, of the management or an employee having a signifi cant role in the Company’s internal control system over fi nancial reporting.
e. We affi rm that we have not denied any personnel access to the Audit Committee of the Company (in respect of matters involv-ing alleged misconduct).
We further declare that all Board members and senior manage-ment have affi rmed compliance with the Company’s Code of Business Ethics for the fi nancial year ended 31 March, 2010.
Rahul Dhir Indrajit BanerjeeManaging Director & CEO Executive Director & CFO
Date 27 May, 2010Place Gurgaon
AU D I TO R S ’ C E R T I F I C AT E
TO THE MEMBERS OF CAIRN INDIA LIMITED
We have examined the compliance of conditions of corporate governance by Cairn India Limited (‘the Company’), for the year ended on 31 March, 2010, as stipulated in clause 49 of the Listing Agreement of the said Company with stock exchanges.
The compliance of conditions of corporate governance is the responsibility of the management. Our examination was limited to procedures and implementation thereof, adopted by the Company for ensuring the compliance of the conditions of the Corporate Governance. It is neither an audit nor an expression of opinion on the fi nancial statements of the Company.
In our opinion and to the best of our information and according to the explanations given to us, subject to the fact that the propor-tion of the independent directors to the total strength of the Board being 40% is less than the minimum prescribed limit of 50%, the Chairman of the Board being related to the promoter of the Company in terms of clarifi cation dated 23 October, 2008 issued by the Securities Exchange Board of India, we certify that the Company has complied with the conditions of Corporate Governance as stipulated in the above mentioned Listing Agreement.
We further state that such compliance is neither an assurance as to the future viability of the Company nor the effi ciency or effective-ness with which the management has conducted the affairs of the Company.
For S.R. BATLIBOI & ASSOCIATESFirm registration number: 101049WChartered Accountants
per Sanjay Vij, Partner Membership No.: 95169
Place GurgaonDate 27 May, 2010

CAIRN INDIA LIMITED AN N UAL R E PORT 2009-106262
Dear Members,
Your Directors have pleasure in presenting the Fourth Annual Report on the business and operations of the Company and the Audited Financial accounts for the year ended 31 March, 2010.
FINANCIAL HIGHLIGHTS
In INR million
The consolidated statements provide the results of Cairn India Limited together with those of its subs-idiaries for the fi nancial year ended 31 March, 2010.
DIVIDEND
In view of the inadequacy of profi ts in Cairn India Limited, your Directors regret their inability to recommend any dividend.
CHANGES IN CAPITAL STRUCTURE
During the fi nancial year under review, 306,316 equity shares of INR 10/- each were allotted on exercise of Employee Stock Options by the employees of the Company or of its subsidiaries. Accordingly, the issued and paid up capital of the Company has increased to INR 18,969,741,320 divided into 1,896,974,132 equity shares of INR 10/- each.
Subsequent to the close of the fi nancial year, the Company allotted 239,288 equity shares of INR. 10/- each on exercise of Stock Options by the employees. Accordingly, the issued and paid up capital of the Company has increased to INR 18,972,134,200 divided into 1,897,213,420 equity shares of INR 10/- each
CONSOLIDATED FINANCIAL
STATEMENTS
Your Company is also presenting the audited con-solidated fi nancial statements prepared in accor-dance with the Accounting Standard 21 issued by the Institute of Chartered Accountants of India. Information in aggregate for each subsidiary in respect of capital reserves, total assets, liabilities, investments, turnover, etc. is disclosed separately and forms part of the annual report.
OPERATIONS
A detailed review of operations has been included in the Management Discussion and Analysis Report, which forms a part of this Annual Report.
UTILISATION OF IPO PROCEEDS
The Company has fully utilised INR 88,249 mil-lion raised from its maiden offer to the public.
EMPLOYEE STOCK OPTION SCHEMES
Your Company has established share incentive schemes viz., Cairn India Senior Management Plan (CISMP), Cairn India Performance Option Plan (CIPOP) and Cairn India Employee Stock
Directors’Report
Standalone Consolidated
For the fi nancial year ended For the fi nancial year ended
31 March, 2010
(Twelve months)
31 March, 2009
(Fifteen months)
31 March, 2010
(Twelve months)
31 March, 2009
(Fifteen months)
Total Income 1,634 2,980 20,307 19,837
Total Expenditure 2,367 1,860 10,143 9,958
Profi t/(loss) before tax (734) 1,121 10,163 9,879
Taxes (44) 578 (348) 1,844
Profi t/(loss) after tax (689) 542 10,511 8,034

63DIRECTORS' REPORT
Option Plan (CIESOP) pursuant to which options to acquire shares have been granted to select employees and Directors of the Company and its subsidiaries. The Company also has cash awards option plan (phantom stock options) for expatriate employees of the Company and its subsidiaries.
During the year, stock/cash options have been granted to the executive Directors and employees of the Company or of its subsidiaries. On exercise of the options so granted, the paid-up equity share capital of the Company will increase in terms of the Stock Option Plans mentioned above. The details of stock options granted by the Company are disclosed in compliance with Clause 12 of the Securities and Exchange Board of India (Employee Stock Option Scheme and Employee Stock Purchase Scheme) Guidelines, 1999 and set out in Annexure I to this Report.
During the period under review, 306,316 equity shares of INR 10/- each were allotted pursuant to the exercise of the stock options.
SUBSIDIARY COMPANIES
As on 31 March, 2010, the Company had 31 sub-sidiaries including indirect subsidiaries. All these companies are benefi cially owned 100% by Cairn India Limited.
These subsidiaries have their own Boards of Directors having the rights and obligations to man-age such companies in the best interest of such Companies. The Company has its representatives on the Board of subsidiary companies and moni-tors the performance of such companies regularly.
Pursuant to the provisions of Section 212(8) of the Companies Act, 1956, the Company has ob-tained exemption from the Ministry of Corporate Affairs, Government of India from attaching the accounts of its subsidiaries to the Company’s Annual Accounts for the fi nancial year ended 31 March, 2010. The accounts of the subsidiaries are available for inspection by members on any work-ing day at the Registered Offi ce of the Company between 10 am and 12 noon. Members interested in obtaining copies are entitled to receive them on specifi c request. A statement pursuant to the
approval under Section 212(8) of the Companies Act,1956, in respect of subsidiary companies forms part of the annual report.
SCHEME OF ARRANGEMENT
In order to simplify and consolidate the multi layered structure comprising foreign susidiar-ies, your Company had proposed a scheme of arrangement between Cairn India Limited, Cairn Energy India Pty Limited, Cairn Energy India West B.V., Cairn Energy Cambay B.V., Cairn Energy Gujarat B.V. and their respective shareholders and creditors (the 'Scheme'). The members of the Company had approved the Scheme with overwhelming majority in the Court convened meeting held on 18 February, 2010.
The Scheme has since been approved by the Hon'ble High Court of Judicature at Madras on 1 April, 2010. The matter is currently pending for fi nal hearing before the Hon'ble High Court of Bombay.
DIRECTORS
Mr Philip Tracy ceased to be an alternate director with effect from 26 May, 2009. He was again appointed as an alternate Director to Sir William B. B. Gammell effective 27 May, 2010. Mr Rahul Dhir and Mr Indrajit Banerjee, directors of the Company, retire by rotation at the ensuing an-nual general meeting and being eligible, offer themselves for re-appointment. A brief profi le of the above-named directors forms part of the Corporate Governance report.
CORPORATE GOVERNANCE
Your Directors reaffi rm their continued commit-ment to good corporate governance practices. A detailed report on the Corporate Governance and Management Discussion and Analysis Report, together with a certifi cate from Statutory Auditors forms an integral part of this report and are set out as separate sections in this annual report.

CAIRN INDIA LIMITED AN N UAL R E PORT 2009-1064
AUDITORS
M/s S. R. Batliboi & Associates, Chartered Accountants, auditors of the Company, retire at the conclusion of the ensuing annual gen-eral meeting but do not offer themselves for re-ap-pointment. The Company has recieved a requisi-tion to appoint M/s S.R Baltiboi & Co., Chartered Accountants, as the Statutory Auditor of the Company. Consequently a consent letter and certifi cate from M/s S.R Baltiboi & Co., Chartered Accountants stating that their appointment, if made, will be in accordance with the limits specifi ed in Section 224(1B) of the Companies Act, 1956 has also been received. The Audit Committee in its meeting held on 27 May, 2010 has also recommended the appointment of M/s S. R. Batliboi & Co., as Statutory Auditors of the Company. Your directors also recommend their appointment.
FIXED DEPOSITS
The Company has not invited any deposits from the public under Section 58A of the Companies Act, 1956.
HUMAN RESOURCES
Company’s industrial relations continued to be harmonious during the period under review.
PARTICULARS OF EMPLOYEES
Particulars of employees required to be furnished under Section 217(2A) of the Companies Act, 1956 (‘the Act’) form part of this report. However, as per the provisions of Section 219(1)(b)(iv) of the Act, the report and accounts are being sent to the shareholders of the Company excluding the particulars of employees under Section 217(2A) of the Act. Any shareholder interested in obtain-ing a copy of the said statement may write to the Company Secretary at the Registered Offi ce of the Company.
CONSERVATION OF ENERGY,
TECHNOLOGY ABSORPTION
AND FOREIGN EXCHANGE
EARNINGS AND OUTGO
Information on Conservation of Energy, Technology Absorption and Foreign Exchange Earnings and Outgo is given in Annexure II to this report.
DIRECTORS’
RESPONSIBILITY STATEMENT
Pursuant to Section 217(2AA) of the Companies Act, 1956, the Directors confi rm that:
In the preparation of the annual accounts, the 1 applicable accounting standards have been fol-
lowed along with proper explanation relating to material departuresAppropriate accounting policies have been se-2 lected and applied consistently and have made judgments and estimates that are reasonable and prudent so as to give a true and fair view of the state of affairs of the Company as at 31 March, 2010 and of the profit of the Company for the year ended 31 March, 2010Proper and sufficient care has been taken for 3 maintenance of adequate accounting records in accordance with the provisions of the Companies Act, 1956 for safeguarding the assets of the Company and for preventing and detecting fraud and other irregularitiesThe annual accounts have been prepared on a 4 going concern basis
CORPORATE
SOCIAL RESPONSIBILITY
Your Company is a responsible corporate citizen, and strives to give back to the community it oper-ates in. A detailed report on CSR efforts of the Company forms part of this annual report.
LISTING
The Company has paid the annual listing fee for the year 2010-2011 to Bombay Stock Exchange Limited and National Stock Exchange of India Limited.
APPRECIATION
Your Directors wish to place on record their sincere appreciation of the concerted efforts and dedicated service of all employees, which contrib-uted to the continous growth and performance of the Company. Your Directors wish to place on record their gratitude for the valuable assistance and co-operation extended to the Company by the Central Government, State Governments, Joint Venture Partners, Banks, Institutions, Investors and Customers.
For and on behalf of the Board of Directors
Sir William B.B. GammellChairman
Place Gurgaon Date 27 May, 2010

65
Annexures To The Directors’ Report
A N N E X U R E I
Disclosure pursuant to the provisions of Securities and Exchange Board of India (Employee Stock Option Scheme and Employee Stock Purchase Scheme) Guidelines, 1999
DIRECTORS' REPORT
S. No. ParticularsCairn India Senior Management Plan
Cairn India Performance Option
Plan (2006)
Cairn India Employee Stock Option Plan (2006)
1 Options granted during April 2009 - March 2010 Nil 994,768 5,405,144
2. The Pricing Formula Rs. 33.70 per Share Rs. 10 per Share Price determined by the Remu-
neration Committee but not
less than the fair market value
of a share on the date of grant
3. Options Vested during April 2009 - March 2010 NIL 359,369 2,142,525
4. Options Exercised during April 2009 - March 2010 NIL 190,983 115,333
5. Total number of Shares arising as a result of exercise of
options during April 2009 - March 2010
NIL 190,983 115,333
6. Options lapsed during April 2009 - March 2010 NIL 1,377,051 1,557,846
7. Variation of terms of options None None None
8. Money realized by exercise of options during April 2009 –
March 2010
NIL 1,909,830 18,453,280
9. Total number of options in force as on 31 March 2010 2,238,077 2,626,830 14,646,209
10. Employee wise details of options granted during the year to:
(i) Senior Managerial Person None Indrajit Banerjee 65,845
Manu Kapoor 77,130
S V Nair 68,953
P Elango 53,290
Santosh Chandra 52,474
None
(ii) Any other employee who receives a grant in any
one year of option amounting to 5% or more of options
granted during the year
None Narayanan P S 67,747
Venkatesan T K 57,394
Ajay Gupta 51,099
None
(iii) Identifi ed employees who were granted options during
any 1 year, equal to or exceeding 1% of the issued capital
(excluding outstanding warrants & conversions) of the
Company at the time of grant
None None None
11. Diluted Earnings Per Share (EPS) pursuant to issue of
Shares on exercise of options calculated in accordance
with Accounting Standard 20
(0.36) (0.36) (0.36)
12. (i) Method of calculation of employee compensation cost Intrinsic Value Method
(ii) Difference between the employee compensation cost
so computed at 12(i) above and the employee compensa-
tion cost that shall have been recognised if it had used the
fair value of the options (Rs. in thousands)
390,521
(iii) The impact of this difference on profi ts and on EPS of
the Company
Profi t after Tax (PAT) (Rs. in thousands) (689,534)
Less: Additional employee Compensation cost based on
fair value (Rs. in thousands)390,521
Adjusted PAT (Rs. in thousands) (1,080,055)
Adjusted EPS Basic (Rs.) (0.57)
Adjusted EPS Diluted (Rs.) (0.57)
13Weighted-average exercise prices of options granted
during April 2009 - March 2010NA 10 240.05
Weighted-average fair value of each option outstanding as
on 31 March 2010135.50 200.23 110.99

CAIRN INDIA LIMITED AN N UAL R E PORT 2009-1066
Conservation of Energy, Technology Absorption, Foreign Exchange Earnings and Outgo
CONSERVATION OF ENERGY
Energy conservation measures taken
As a responsible Corporate Citizen and in adher-ence to our climate change strategy, we are con-tinuously taking effective steps to conserve energy and to reduce methane and other Green House Gas (GHG) emissions, wherever feasible. GHG emissions in 2009 were within targets set at the beginning of the year notwithstanding a rise in energy use.
Cairn India recognises the responsibility to minimise environmental impact from its activi-ties. The challenges of proactively managing en-vironmental issues during the construction phase of the MPT and the pipeline project have been successfully achieved through active support and in partnership with the contractors.
The Company regularly monitored air emis-sion sources and the ambient air quality, and was able to maintain emission levels within regulatory standards in 2009.
Measures taken for reduction of energy consumption & consequent impact
During the period under review, several energy conservation initiatives were adopted and were taken, some of which are listed below:
At Ravva
Solar street lighting poles were installed, which �
resulted in the reduction in usage of 615 units of conventional energy.All conventional water heaters were replaced �
with solar water heaters as a result of which
energy consumption was reduced by 40,000 units per annum.18 conventional high pressure sodium street �
light lamps were replaced with LED lamps in plant street lighting systems.
At the Gurgaon offi ce
Several energy conservation initiatives at Cairn India’s Gurgaon offi ce have resulted in saving of around 350,000 units of electricity, thus reducing the offi ce’s carbon footprint. These include:
Ensuring that all except the emergency lights �
are switched off after working hours and on holidays.Effi cient and judicious use of energy effi cient �
lights and air handling units.
Additional investments and proposals being implemented for conservation of energy
Additional funds were allocated during the year for energy conservation measures. New tech-nologies were absorbed & adapted to reduce the carbon foot print of the Company like installation of wind mills and solar arrays on platforms, solar water heaters and LED street lights, wherever feasible.
TECHNOLOGY ABSORPTION,
ADAPTION & INNOVATION
Research & Development (R&D)
Specific areas in which R & D was carried out by the CompanyCairn has been actively pursuing the application of EOR (Enhanced Oil Recovery) technology in the Mangala, Bhagyam and Aishwariya Fields. Core fl ood studies have been carried out in 2 independent laboratories in order to deter-mine the effi ciency of the various chemical fl ood processes like polymer injection and alkali-surfactant-polymer (ASP) fl ooding. Studies are ongoing in research institutes with a view to optimise the chemical formula-tions that could increase oil recovery in these fi elds using minimum of chemical quality. In-
A N N E X U R E I I
14. A description of the method and signifi cant assumptions
used during the year to estimate the fair values of options,
including the following weighted-average information:
(i) risk-free interest rate 7.05% 7.77% 8.13%
(ii) expected life (in years) 2.45 3.12 6.50
(iii) expected volatility 44.08% 37.90% 40.14%
(iv) expected dividends NA NA NA
(v)price of the underlying Share in market at the time of
option grant160 183.04 199.73

67DIRECTORS' REPORT
house simulation & modelling work has also been carried out to determine the effi ciency at fi eld level. A fi eld scale EOR pilot implementation is al-ready underway to take the application of this tech-nology from lab to a restricted area in the fi eld.
Re-injection of produced water separated at the Ravva terminal, back into the reservoir helps reduce discharge of waste water to sea and ab-straction of ground water for injection purposes. Produced Water Re-Injection (PWRI) has been designed and implemented to treat and handle a maximum capacity of 45,000 barrels of water per day. The PWRI was successfully commissioned in Q2 2008 and is presently re-injecting 50% of the produced water.
Various other technology absorption, adaption and innovation initiatives/methods like Rapid Rig for drilling wells, customised well designs, multi well pad approach, Rotary steerable/Logging While Drilling technology, customised compact well head equipment, usage of high cost synthetic oil based mud system on onshore drilling applica-tions, horizontal well technology, sand control technology integral with sleeve devices, hydraulic fracturing technol-ogy, Sand Jet Perforating, Micro seismic for frac modelling, multiphase metering technology were taken/used for the development & drilling of the oil fi elds in Rajasthan.
Benefi ts derived as a result of this R&D
All these initiatives are helping the Company in improving the overall effi ciency, lowering the land impact & environmental concerns, cost ef-fectiveness & project economics. Cairn’s research in EOR applications for the MBA fi elds has the potential to unlock additional oil reserves within these fi elds and a long term strategy for EOR is being developed with this end in mind.
Cairn’s study with the National Geophysical Research Centre (NGRI) on salinity changes of ground water sets an example of ‘good industry practice’. We are reassured that our operation in Ravva does not have an adverse impact on ground water and the environment.
Expenditure on R&D
Details outlined in the Table below. in INR
FOREIGN EXCHANGE
EARNINGS AND OUTGO
Activities relating to exports; initiatives taken to increase exports; development of new export markets for products and
services; and export plans
India imports approximately 75% of its oil and gas requirement and in this situation, the export of crude oil and natural gas, which are the main products of Cairn are not relevant in this sector.
However, by discovering new oil & gas fi nds and bringing them into production, Cairn is working towards enhancing energy security and increasing the self suffi ciency of the nation which is in line with policy of the Indian Government. At peak production rate, Rajasthan block is ex-pected to contribute more than 20% of domestic crude oil production.
Foreign exchange used and earned
During the period ended 31 March, 2010, the Company earned INR 32.04 million and incurred expenditure of INR 188.82 million in foreign exchange.
For and on behalf of the Board of Directors
Sir William B.B. GammellChairman
Place Gurgaon Date 27 May, 2010
No. Particulars Amount
1 Capital 962,452
2 Recurring -
3 Total 962,452
4Total R&D expenditure
as a % of total turnover0.05%
Note These are consolidated numbers for the
Twelve months period ended 31 March, 2010
CAIRN INDIA LIMITED AN N UAL R E PORT 2009-1068
TO THE MEMBERS OF CAIRN INDIA LIMITED
We have audited the attached Balance Sheet of Cairn India Limited (‘the Company’) as at 31 March, 2010 and also the Profit and Loss 1 Account and the Cash Flow Statement for the year ended on that date annexed thereto. These financial statements are the responsibility of the Company’s management. Our responsibility is to express an opinion on these financial statements based on our audit.
We conducted our audit in accordance with auditing standards generally accepted in India. Those Standards require that we plan 2 and perform the audit to obtain reasonable assurance about whether the financial statements are free of material misstatement. An audit includes examining, on a test basis, evidence supporting the amounts and disclosures in the financial statements. An audit also includes assessing the accounting principles used and significant estimates made by management, as well as evaluating the overall financial statement presentation. We believe that our audit provides a reasonable basis for our opinion.
The attached financial statements include Company’s share of net assets, expenses and cash flows aggregating to INR 4,031 thousand, 3 INR 529,058 thousand and INR Nil thousand respectively in the unincorporated joint ventures not operated by the Company or its sub-sidiaries, the accounts of which have been audited by the auditors of the respective unincorporated joint ventures and relied upon by us.
As required by the Companies (Auditor’s Report) Order, 2003 (as amended) (‘the Order’) issued by the Central Government of India in 4 terms of sub-section (4A) of Section 227 of the Companies Act, 1956, we enclose in the Annexure a statement on the matters speci-fied in paragraphs 4 and 5 of the said Order. In respect of clauses (ii), (ix)(a), (ix)(b), (ix)(c) and (xxi), our comments are restricted to the operations of the Company and does not cover the unincorporated joint ventures where any third party is the operator.
Further to our comments in the Annexure referred to above, we report that:5 We have obtained all the information and explanations, which to the best of our knowledge and belief were necessary for the pur-i poses of our audit;In our opinion, proper books of account as required by law have been kept by the Company so far as appears from our examination of ii those books;The balance sheet, profit and loss account and cash flow statement dealt with by this report are in agreement with the books of iii account;In our opinion, the balance sheet, profit and loss account and cash flow statement dealt with by this report comply with the account-iv ing standards referred to in sub-section (3C) of section 211 of the Companies Act, 1956;On the basis of the written representations received from the directors, as on 31 March, 2010, and taken on record by the Board of v Directors, we report that none of the directors is disqualified as on 31 March, 2010 from being appointed as a director in terms of clause (g) of sub-section (1) of section 274 of the Companies Act, 1956.In our opinion and to the best of our information and according to the explanations given to us, the said accounts give the informa-vi tion required by the Companies Act, 1956, in the manner so required and give a true and fair view in conformity with the accounting principles generally accepted in India;
in the case of the balance sheet, of the state of affairs of the Company as at 31 March, 2010; a in the case of the profit and loss account, of the loss for the year ended on that date; andb in the case of cash flow statement, of the cash flows for the year ended on that date.c
Auditors’Report
For S.R. BATLIBOI & ASSOCIATES Firm registration number: 101049W Chartered Accountantsper Sanjay Vij, Partner Membership No.: 95169
Place Gurgaon Date 27 May, 2010

69
Annexure referred to in paragraph 4 of our report of even dateRe: Cairn India Limited (‘the Company’)
(i) (a) The Company has maintained proper records showing full particulars, including quantitative details and situation of fi xed assets.
(b) Fixed assets have been physically verifi ed by the management during the year and no material discrepancies were identifi ed on such
verifi cation.
(c) There was no substantial disposal of fi xed assets during the year.
(ii) (a) The management has conducted physical verifi cation of inventory at reasonable intervals during the year.
(b) The procedures of physical verifi cation of inventory followed by the management are reasonable and adequate in relation to the size of the
Company and the nature of its business.
(c) The Company is maintaining proper records of inventory and no material discrepancies were noticed on physical verifi cation carried out at the
end of the year.
(iii) (a-d) As informed, the Company has not granted any loans, secured or unsecured to companies, fi rms or other parties covered in the
register maintained under section 301 of the Companies Act, 1956. Therefore the provisions of clause 4(iii) (b), (c) and (d) of the
Order are not applicable to the Company.
(e-g) As informed, the Company has not taken any loans, secured or unsecured from companies, fi rms or other parties covered in the register
maintained under section 301 of the Companies Act, 1956. Therefore the provisions of clause 4(iii) (f) and (g) of the Order are not
applicable to the Company.
(iv) In our opinion and according to the information and explanations given to us, there is an adequate internal control system commensurate
with the size of the Company and the nature of its business, for the purchase of inventory, fi xed assets and for the sale of services.
During the course of our audit, no major weakness has been noticed in the internal control system in respect of these areas. During the
course of our audit, we have not observed any continuing failure to correct major weakness in internal control system of the Company.
Since the Company has not started commercial production in any of its oil and gas blocks, it has not sold any goods.
(v) (a) According to the information and explanations provided by the management, we are of the opinion that the particulars of contracts or
arrangements referred to in section 301 of the Companies Act, 1956 that need to be entered into the register maintained under section
301 have been so entered.
(b) In respect of transactions made in pursuance of such contracts or arrangements exceeding the value of Rupees fi ve lakhs entered into
during the fi nancial year, because of the unique and specialized nature of the items involved and absence of any comparable prices, we
are unable to comment whether the transactions were made at prevailing market prices at the relevant time.
(vi) The Company has not accepted any deposits from the public.
(vii) In our opinion, the Company has an internal audit system commensurate with the size and nature of its business.
(viii) The Company has not commenced commercial production in any of its oil and gas blocks. Accordingly, the provisions of clause 4(viii) of the
Order are not applicable to the Company.
(ix) (a) The Company is generally regular in depositing with appropriate authorities undisputed statutory dues including provident fund, investor
education and protection fund, income-tax, wealth-tax, service tax, cess and other material statutory dues applicable to it. Further, since
the Central Governent has till date not prescribed the amount of cess payable under section 441 A of the Companies Act, 1956, we are
not in a position to comment upon the regularity or otherwise of the Company in depositing the same. The provisions relating to
employees’ state insurance, sales tax, customs duty and excise duty are not applicable to the Company.
(b) According to the information and explanations given to us, no undisputed amounts payable in respect of provident fund, investor
education and protection fund, income-tax, wealth-tax, service tax, cess and other undisputed statutory dues were outstanding, at the year
end, for a period of more than six months from the date they became payable. The provisions relating to employees’ state insurance, sales
tax, customs duty and excise duty are not applicable to the Company.
(c) According to the information and explanations given to us, there are no dues of income tax, wealth tax, service tax, and cess which have not been
deposited on account of any dispute. The provisions relating to sales tax, customs duty and excise duty are not applicable to the Company.
Auditors’ Report

CAIRN INDIA LIMITED AN N UAL R E PORT 2009-1070
Auditors’ Report
(x) The Company has been registered for a period of less than fi ve years and hence we are not required to comment on whether or not the
accumulated losses at the end of the fi nancial year is fi fty per cent or more of its net worth and whether it has incurred cash losses in such
fi nancial year and in the immediately preceding fi nancial year.
(xi) Based on our audit procedures and as per the information and explanations given by the management, we are of the opinion that the Company
has not defaulted in repayment of dues to a fi nancial institution or bank. The Company has not issued any debentures.
(xii) According to the information and explanations given to us and based on the documents and records produced to us, the Company has not
granted loans and advances on the basis of security by way of pledge of shares, debentures and other securities.
(xiii) In our opinion, the Company is not a chit fund or a nidhi / mutual benefi t fund / society. Therefore, the provisions of clause 4(xiii) of the Order are
not applicable to the Company.
(xiv) In our opinion, the Company is not dealing in or trading in shares, securities, debentures and other investments. Accordingly, the provisions of
clause 4(xiv) of the Order are not applicable to the Company.
(xv) According to the information and explanations given to us, the Company has not given any guarantee for loans taken by others from bank or
fi nancial institutions.
(xvi) Based on the information and explanations given to us by the management, term loans were applied for the purpose for which the loans were
obtained.
(xvii) According to the information and explanations given to us and on an overall examination of the balance sheet of the Company, we report that no
funds raised on short-term basis have been used for long-term investment.
(xviii) The Company has not made any preferential allotment of shares to parties or companies covered in the register maintained under section 301
of the Companies Act, 1956.
(xix) The Company did not have any outstanding debentures during the year.
(xx) We have verifi ed that the end use of money raised by public issues is as disclosed in the notes to the fi nancial statements.
(xxi) Based upon the audit procedures performed for the purpose of reporting the true and fair view of the fi nancial statements and as per the informa-
tion and explanations given by the management, we report that no fraud on or by the Company has been noticed or reported during the course of
our audit.
For S.R. Batliboi & Associates
Firm registration number: 101049W
Chartered Accountants
per Sanjay Vij
Partner
Membership No.:95169
Place Gurgaon Date 27 May, 2010

71
Financial Accounts

CAIRN INDIA LIMITED AN N UAL R E PORT 2009-1072
(All amounts are in thousand Indian Rupees, unless otherwise stated)
Balance SheetAS AT MARCH 31, 2010
Schedules As at March 31, 2010 As at March 31, 2009
Sources of Funds
Shareholders’ funds
Share capital 1 18,969,741 18,966,678
Stock options outstanding 2 463,978 388,978
Reserves and surplus 3 301,161,222 301,090,274
Loan funds
Secured loans 4 13,450,000 -
334,044,941 320,445,930
Application of Funds
Fixed assets 5
Gross cost 1,055 974
Less: Accumulated depreciation /
amortisation 869 365
Net book value 186 609
Exploratory work in progress 6 242,074 540,299
Investments 7 331,290,939 292,253,966
Current assets, loans and advances
Inventories 8 9,831 -
Sundry debtors 9 15,728 17,942
Cash and bank balances 10 1,927,862 27,632,762
Other current assets 11 12,360 633,645
Loans and advances 12 829,151 220,814
2,794,932 28,505,163
Less: Current liabilities and provisions
Current liabilities 13 1,480,662 1,076,734
Provisions 14 30,062 315,373
1,510,724 1,392,107
Net current assets 1,284,208 27,113,056
Profi t and loss account 1,227,534 538,000
334,044,941 320,445,930
Notes to accounts 20
The schedules referred to above and the notes to accounts form an integral part of the balance sheet.
As per our report of even date
For S. R. Batliboi & Associates For and on behalf of the Board of Directors
Firm Registration No.:101049W
Chartered Accountants Rahul Dhir Managing Director and Chief Executive Offi cer
per Sanjay Vij Indrajit Banerjee Executive Director and Chief Financial Offi cer
Partner Omkar Goswami Director
Membership No. 95169 Neerja Sharma Company Secretary
Place Gurgaon Date 27 May, 2010

73
(All amounts are in thousand Indian Rupees, unless otherwise stated)
SchedulesYear ended
March 31, 2010
Fifteen months ended
March 31, 2009
Income
Revenue from operating activities 32,040 37,331
Other income 15 1,601,580 2,943,072
1,633,620 2,980,403
Expenditure
Staff costs 16 175,929 212,519
Data acquisition and pre exploration cost 33,860 36,235
Administrative expenses 17 302,959 793,554
Unsuccessful exploration costs 6 1,191,194 813,568
Depreciation/Amortisation 5 504 365
Finance costs 18 662,806 3,446
2,367,252 1,859,687
Profi t/(Loss) before taxation (733,632) 1,120,716
Current tax 44,000 543,800
Fringe benefi t tax (refer note no. 14 in schedule 20) (88,098) 34,509
Profi t/(Loss) for the year/period (689,534) 542,407
Add: Accumulated losses at the beginning of
the year / period(538,000) (1,080,407)
Defi cit carried forward to balance sheet (1,227,534) (538,000)
Earnings/(Loss) per share in INR 19
Basic (0.36) 0.29
Diluted (current year considered anti-dilutive) (0.36) 0.29
[Nominal value of shares INR 10]
Notes to accounts 20
Profi t and Loss AccountFOR THE YEAR ENDED MARCH 31, 2010
The schedules referred to above and the notes to accounts form an integral part of the profi t and loss account.
As per our report of even date
For S. R. Batliboi & Associates For and on behalf of the Board of Directors
Firm Registration No.:101049W
Chartered Accountants Rahul Dhir Managing Director and Chief Executive Offi cer
per Sanjay Vij Indrajit Banerjee Executive Director and Chief Financial Offi cer
Partner Omkar Goswami Director
Membership No. 95169 Neerja Sharma Company Secretary
Place Gurgaon Date 27 May, 2010

CAIRN INDIA LIMITED AN N UAL R E PORT 2009-1074
Year ended
March 31, 2010
Fifteen months ended
March 31, 2009
Cash fl ow from operating activities
Profi t/ (loss) for the year/period (733,632) 1,120,716
Adjustments for:
- Employee compensation expense (stock options) - net of
exceptional gains 39,385 (33,325)
- Interest income (1,266,573) (1,341,376)
- Dividend from unquoted current investments (220,839) (200,225)
- Depreciation/Amortisation 504 365
- Profi t on sale of unquoted current investments (net) (2,385) (1,245,686)
- Share issue expenses - 208,410
- Unrealised exchange loss / (gain) on restatement of assets
and liabilities (net) (110,526) 183,896
- Unsuccessful exploration costs 1,191,194 813,568
- Loan facility and management fees 59,574 -
- Balances written back (40,653) -
- Interest expense 599,810 388
Operating (loss) before working capital changes (484,141) (493,269)
Movements in working capital:
(Increase)/decrease in inventories (9,831) -
(Increase)/decrease in debtors 2,214 (5,234)
(Increase)/decrease in loans and advances 32,383 (212,729)
Increase/(decrease) in current liabilities and provisions (84,301) 909,781
Cash generated from / (used in) operations (543,676) 198,549
Direct taxes paid including fringe benefi t tax (248,254) (553,060)
Net cash (used in) operating activities (A) (791,930) (354,511)
Cash fl ow from investing activities
Payments made for exploration, development activities and
purchase of fi xed assets (368,982) (1,372,093)
Long term investments made in subsidiaries (23,827,569) (1,562,784)
Fixed deposits made (6,083,612) (37,573,811)
Proceeds from matured fi xed deposits 31,728,811 10,005,000
Short term investments in mutual funds (net) (15,207,018) 4,691,789
Interest received 1,887,858 707,732
Dividend received from unquoted current investments 220,839 200,225
Net cash (used in) investing activities (B) (11,649,673) (24,903,942)
Cash fl ow from fi nancing activities
Proceeds from issue of equity shares
(including securities premium) 20,363 25,523,445
Payment for share issue expenses - (208,410)
Proceeds from long term borrowings 13,450,000 -
Loan facility and management fees paid (488,651) -
Interest paid (599,810) (388)
Net cash from fi nancing activities (C) 12,381,902 25,314,647
(All amounts are in thousand Indian Rupees, unless otherwise stated)
Statement of Cash FlowsFOR THE YEAR ENDED MARCH 31, 2010

75
Year ended
March 31, 2010
Fifteen months ended
March 31, 2009
(All amounts are in thousand Indian Rupees, unless otherwise stated)
Statement of Cash Flows Continued
Net increase in cash and cash equivalents (A+B+C) (59,701) 56,194
Cash and cash equivalents at the beginning of the year/ period 63,951 7,757
Cash and cash equivalents at the end of the year/ period 4,250 63,951
Components of cash and cash equivalents as at March 31, 2010 March 31, 2009
Cash in hand 42 15
Balances with scheduled banks
- on current accounts 4,208 13,936
- on deposit accounts 1,923,612 27,618,811
Less: Deposits having maturity of over 90 days (1,923,612) (27,568,811)
4,250 63,951
Notes
i) The above Cash Flow Statement has been prepared under the ‘Indirect Method’ as set out in Accounting Standard-3 on “Cash fl ow statements”.
ii) Amounts in bracket indicate a cash outfl ow or reduction.
iii) Bank balance in deposit accounts includes INR 1,790,000 thousand, previous period INR 1,530,000 thousand, pledged with the banks.
As per our report of even date
For S. R. Batliboi & Associates For and on behalf of the Board of Directors
Firm Registration No.:101049W
Chartered Accountants Rahul Dhir Managing Director and Chief Executive Offi cer
per Sanjay Vij Indrajit Banerjee Executive Director and Chief Financial Offi cer
Partner Omkar Goswami Director
Membership No. 95169 Neerja Sharma Company Secretary
Place Gurgaon Date 27 May, 2010

CAIRN INDIA LIMITED AN N UAL R E PORT 2009-1076
Notes
i) Issued, subscribed and fully paid up share capital includes 1,183,243,791 equity shares (previous period - 1,226,843,791 equity shares) of INR 10 each held
by Cairn UK Holdings Limited, the holding company, together with its nominees.
ii) Shares held by the holding company includes 861,764,893 equity shares (previous period - 861,764,893 equity shares) of INR 10 each, allotted as fully paid
up pursuant to contracts for consideration other than cash.
iii) For stock options outstanding, refer note no. 6 in schedule 20.
Schedules to the Financial Statements
As at
March 31, 2010
As at
March 31, 2009
Schedule 1
Share capital
Authorised:
2,250,000,000 (previous period 2,250,000,000) equity shares of
INR 10 each22,500,000 22,500,000
Issued, Subscribed and fully Paid up:
1,896,974,132 (previous period 1,896,667,816) equity shares of INR 10 each 18,969,741 18,966,678
18,969,741 18,966,678
Schedule 2
Stock options outstanding
Employee stock options outstanding 768,120 782,548
Less: Deferred employee compensation outstanding 304,142 393,570
Closing Balance 463,978 388,978
Schedule 3
Reserves and surplus
Securities premium account
Opening balance 301,090,274 276,084,115
Add: Additions during the year/ period (refer note no. 10 of schedule 20) 70,948 25,006,159
Closing Balance 301,161,222 301,090,274
Schedule 4
Secured loans
Long term loans
- from fi nancial institutions 1,008,750 -
- from banks 12,441,250 -
13,450,000 -
(All amounts are in thousand Indian Rupees, unless otherwise stated)
Notes
i) There is no amount repayable within one year.
ii) Refer note no. 12 in schedule 20.

77
Schedule 5
Fixed Assets
As at
March 31, 2010
As at
March 31, 2009
Schedule 6
Exploratory work in progress
Opening Balance 540,299 -
Additions during the year/period 892,969 1,353,867
Less: Unsuccessful exploration costs for the year/period 1,191,194 813,568
242,074 540,299
Schedule 7
Investments
Long term investments in Subsidiary Companies (at cost)
Unquoted, trade and fully paid-up
420,810,062 equity shares (previous period: 292,929,752 equity shares) of
GBP 1 each in Cairn India Holdings Limited, U.K. 300,424,799 290,524,514
175,560 redeemable preferential shares (previous period: Nil) of GBP 1,000
each in Cairn India Holdings Limited, U.K. 13,437,637 -
13,159,960 equity shares (previous period: 2,509,960) of USD 1 each in CIG
Mauritius Holding Private Limited 611,627 121,980
Current Investments (at lower of cost and market value)
Unquoted and non trade
Mutual Funds (refer note no. 22 in schedule 20 for details)* 16,816,876 1,607,472
331,290,939 292,253,966
Aggregate amount of unquoted investments 331,290,939 292,253,966
Repurchase price of mutual fund units, represented by Net Asset Value 16,816,876 1,607,472
* includes unutilized monies of the public issue. (refer note no. 5 in schedule 20)
Schedule 8
Inventories
Stores and spares 9,831 -
9,831 -
(All amounts are in thousand Indian Rupees, unless otherwise stated)
Description Gross Block Accumulated Depreciation / Amortisation Net Block
As on
01.04.2009 Additions
Deletions/
Adjustment
As on
31.03.2010
As on
01.04.2009
For the
year/ period
Deletions/
Adjustment
As on
31.03.2010
As on
31.03.2010
As on
31.03.2009
A) Tangible Assets
Offi ce equipments - 32 - 32 - 9 - 9 23 -
B) Intangible Assets
Computer software 974 49 - 1,023 365 495 - 860 163 609
Grand Total 974 81 - 1,055 365 504 - 869 186 609
Previous period - 974 - 974 - 365 - 365 609 -
Schedules to the Financial Statements Continued

CAIRN INDIA LIMITED AN N UAL R E PORT 2009-1078
Schedule 9
Sundry Debtors
Debts outstanding for a period exceeding six months
- Unsecured, considered good 4,039 7,609
Other debts
- Unsecured, considered good 11,689 10,333
15,728 17,942
Schedule 10
Cash and bank balances
Cash in hand 42 15
Balances with scheduled banks *
- on current accounts 4,208 13,936
- on deposit accounts ** 1,923,612 27,618,811
1,927,862 27,632,762
* includes unutilized monies of the public issue (refer note no. 5 in schedule 20)
** Includes INR 1,790,000 thousand, previous period INR 1,530,000 thousand, pledged with the banks
Schedule 11
Other current assets
Interest accrued on bank deposits 12,360 633,645
12,360 633,645
Schedule 12
Loans and advances
Unsecured considered good:
Advances recoverable in cash or in kind or for value to be received* 582,159 12,855
Advances recoverable from subsidiary companies 242,247 192,795
Deposits 512 15,164
Fringe benefi t tax paid (Net of provisions INR 266,901 thousand, previous
period INR Nil) 4,233 -
829,151 220,814
* includes capital advances INR 1,465 thousand (previous period INR Nil)
As at
March 31, 2010
As at
March 31, 2009
(All amounts are in thousand Indian Rupees, unless otherwise stated)
Schedules to the Financial Statements Continued
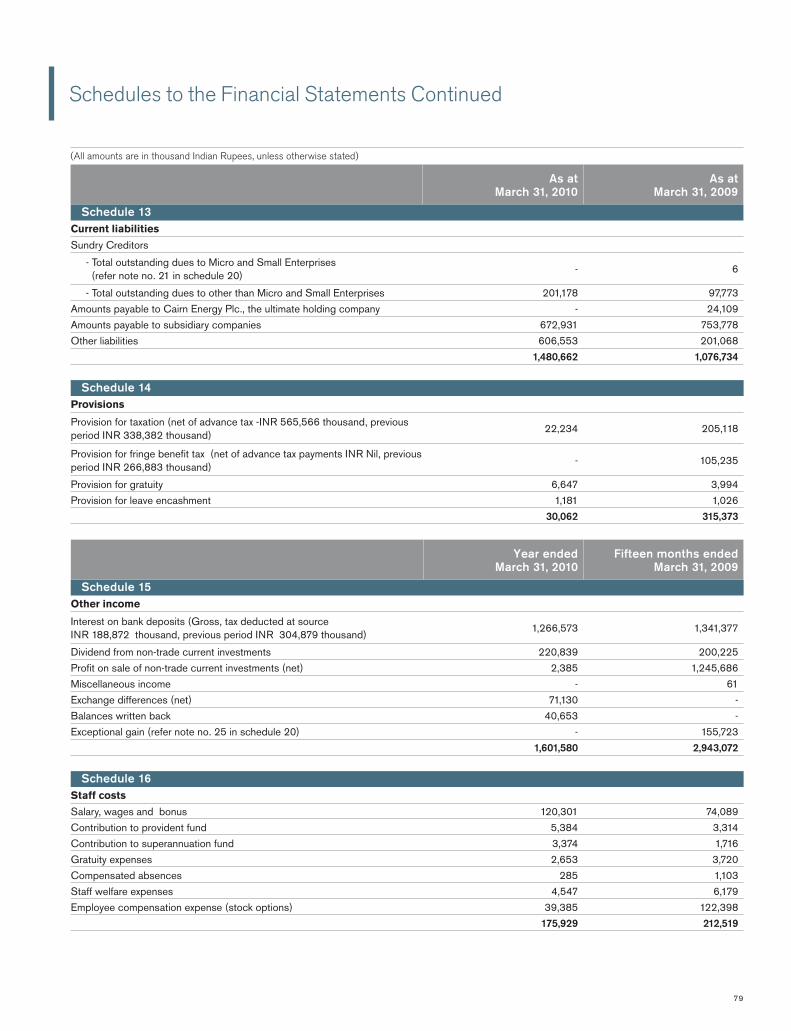
79
As at
March 31, 2010
As at
March 31, 2009
(All amounts are in thousand Indian Rupees, unless otherwise stated)
Schedule 13
Current liabilities
Sundry Creditors
- Total outstanding dues to Micro and Small Enterprises
(refer note no. 21 in schedule 20) - 6
- Total outstanding dues to other than Micro and Small Enterprises 201,178 97,773
Amounts payable to Cairn Energy Plc., the ultimate holding company - 24,109
Amounts payable to subsidiary companies 672,931 753,778
Other liabilities 606,553 201,068
1,480,662 1,076,734
Schedule 14
Provisions
Provision for taxation (net of advance tax -INR 565,566 thousand, previous
period INR 338,382 thousand) 22,234 205,118
Provision for fringe benefi t tax (net of advance tax payments INR Nil, previous
period INR 266,883 thousand) - 105,235
Provision for gratuity 6,647 3,994
Provision for leave encashment 1,181 1,026
30,062 315,373
Year ended
March 31, 2010
Fifteen months ended
March 31, 2009
Schedule 15
Other income
Interest on bank deposits (Gross, tax deducted at source
INR 188,872 thousand, previous period INR 304,879 thousand)1,266,573 1,341,377
Dividend from non-trade current investments 220,839 200,225
Profi t on sale of non-trade current investments (net) 2,385 1,245,686
Miscellaneous income - 61
Exchange differences (net) 71,130 -
Balances written back 40,653 -
Exceptional gain (refer note no. 25 in schedule 20) - 155,723
1,601,580 2,943,072
Schedule 16
Staff costs
Salary, wages and bonus 120,301 74,089
Contribution to provident fund 5,384 3,314
Contribution to superannuation fund 3,374 1,716
Gratuity expenses 2,653 3,720
Compensated absences 285 1,103
Staff welfare expenses 4,547 6,179
Employee compensation expense (stock options) 39,385 122,398
175,929 212,519
Schedules to the Financial Statements Continued

CAIRN INDIA LIMITED AN N UAL R E PORT 2009-1080
Year ended
March 31, 2010
Fifteen months ended
March 31, 2009
(All amounts are in thousand Indian Rupees, unless otherwise stated)
Schedule 17
Administrative expenses
Legal and professional expenses 197,777 254,050
Contract employee charges 4,370 4,517
Rent 1,642 1,377
Auditor's remuneration
As Auditors
- Fees for statutory audit and consolidated fi nancial
statements 4,440 5,314
- Fees for tax audit - 828
- Fees for limited review 5,460 7,595
- Fees for statutory reporting for parent companies
consolidated fi nancial statements 2,041 10,566
- Other services 2,160 3,503
- Out of pocket expenses 394 14,495 443 28,249
Directors' sitting fees 1,160 1,320
Advertisement and publicity 9,538 14,385
Public relation expenses 18,248 42,959
Sponsorship 11,500 15,666
Printing & stationery 3,489 3,157
Security Expenses 361 129
Repairs and maintenance (others) 2,639 303
Travelling and conveyance 19,358 30,954
Insurance expenses 199 197
Communication expenses 16,104 5,983
Share issue expenses - 208,410
Exchange differences (net) - 180,632
Sundry balances written off 824 -
Miscellaneous expenses 1,255 1,266
302,959 793,554
Schedule 18
Finance costs
Interest
-on term loan 599,684 -
-others 126 388
Loan facility and management fees 59,574 -
Bank charges 3,422 3,058
662,806 3,446
Schedules to the Financial Statements Continued

81
Schedule 19
Earnings / (Loss) per share
Profi t/(Loss) for the year/ period as per profi t and
loss account (689,534) 542,407
Weighted average number of equity shares in
calculating basic earnings / (loss) per share1,896,696,475 1,866,146,993
Add: Number of equity shares arising on grant of stock
options8,321,392 10,052,076
Weighted average number of equity shares in
calculating diluted earnings / (loss) per share1,905,017,867 1,876,199,069
Earnings/(Loss) per share in INR
Basic (0.36) 0.29
Diluted (current year considered anti dilutive) (0.36) 0.29
(All amounts are in thousand Indian Rupees, unless otherwise stated)
Schedules to the Financial Statements Continued
Year ended
March 31, 2010
Fifteen months ended
March 31, 2009

CAIRN INDIA LIMITED AN N UAL R E PORT 2009-1082
NATURE OF OPERATIONS1.
Cairn India Limited (‘the Company’) was incorporated in India on August 21, 2006 and is a subsidiary of Cairn UK Holdings Limited, which in turn is a
wholly owned subsidiary of Cairn Energy Plc., UK which is listed on London Stock Exchange.
The Company is primarily engaged in the business of surveying, prospecting, drilling, exploring, acquiring, developing, producing, maintaining,
refi ning, storing, trading, supplying, transporting, marketing, distributing, importing, exporting and generally dealing in minerals, oils, petroleum, gas
and related by-products and other activities incidental to the above. As part of its business activities, the Company also holds interests in its
subsidiary companies which have been granted rights to explore and develop oil exploration blocks in the Indian sub-continent.
The Company is participant in various Oil and Gas blocks/fi elds (which are in the nature of jointly controlled assets), granted by the
Government of India through Production Sharing Contracts (‘PSC’) entered into between the Company and Government of India and other venture
partners. The Company has interest in the following Oil & Gas blocks / fi elds, which are presently under exploration phase:
STATEMENT OF SIGNIFICANT ACCOUNTING POLICIES2.
Basis of preparation(A)
The fi nancial statements have been prepared to comply in all material respects with the mandatory Accounting Standards notifi ed under the
Companies (Accounting Standard) Rules, 2006 under the historical cost convention and on an accrual basis. The accounting policies, in all material
respects, have been consistently applied by the Company and are consistent with those used in the previous period.
Oil and gas assets(B)
The Company follows a successful efforts method for accounting for oil and gas assets as set out by the Guidance Note issued by the Institute of
Chartered Accountants of India (ICAI) on “Accounting for Oil and Gas Producing Activities”.
Expenditure incurred on the acquisition of a license interest is initially capitalised on a license by license basis. Costs are held, undepleted,
within exploratory & development wells in progress until the exploration phase relating to the license area is complete or commercial oil and gas
reserves have been discovered.
Exploration expenditure incurred in the process of determining exploration targets which cannot be directly related to individual exploration
wells, is expensed in the period in which it is incurred. Exploration/appraisal drilling costs are initially capitalised within exploratory and development
work in progress on a well by well basis until the success or otherwise of the well has been established. The success or failure of each exploration/
appraisal effort is judged on a well by well basis. Drilling costs are written off on completion of a well unless the results indicate that oil and gas
reserves exist and there is a reasonable prospect that these reserves are commercial.
Where results of exploration drilling indicate the presence of oil and gas reserves which are ultimately not considered commercially viable,
all related costs are written off to the profi t and loss account. Following appraisal of successful exploration wells, when a well is ready for com-
mencement of commercial production, the related exploratory and development work-in-progress are transferred into a single fi eld cost centre within
producing properties, after testing for impairment.
Where costs are incurred after technical feasibility and commercial viability of producing oil and gas is demonstrated and it has been deter-
mined that the wells are ready for commencement of commercial production, they are capitalised within producing properties for each cost centre.
Subsequent expenditure is capitalised when it enhances the economic benefi ts of the producing properties or replaces part of the existing producing
properties. Any costs remaining associated with such part replaced are expensed in the fi nancial statements.
Net proceeds from any disposal of an exploration asset within exploratory and development work in progress is initially credited against the
previously capitalised costs and any surplus proceeds are credited to the profi t and loss account. Net proceeds from any disposal of producing
properties are credited against the previously capitalised cost and any gain or loss on disposal of producing properties is recognised in the profi t and
loss account, to the extent that the net proceeds exceed or are less than the appropriate portion of the net capitalised costs of the asset.
Oil & Gas blocks/fi elds Area Participating Interest
Operated block (through subsidiaries)
PR-OSN-2004 Palar Basin offshore 25%
KG-ONN-2003/1 Krishna Godavari Onshore 25%
Following block has been relinquished
VN-ONN-2003/1 in Aug 2009 Vindhyan Onshore 25%
Non – operated block
GS-OSN-2003/1 Gujarat Saurashtra Onshore 49%
KK-DWN-2004 Kerala Konkan Basin offshore 40%
Following blocks have been relinquished
CB-ONN-2002/1 in Jan 2009 Cambay Onshore 30%
RJ-ONN-2003/1 in Jan 2010 Rajasthan Onshore 30%
(All amounts are in INR thousand unless, otherwise stated)
Schedules to the Financial Statements ContinuedSCHEDULE 20–NOTES TO ACCOUNTS

83
Depletion(C)
The expenditure on producing properties is depleted within each cost centre.
Depletion is charged on a unit of production basis, based on proved reserves for acquisition costs and proved and developed reserves for
other costs.
Site restoration costs(D)
At the end of the producing life of a fi eld, costs are incurred in restoring the site of production facilities. The Company recognizes the full cost of
site restoration as a liability when the obligation to rectify environmental damage arises. The site restoration expenses form part of the exploration &
development work in progress or cost of producing properties, as the case may be, of the related asset. The amortization of the asset, calculated on
a unit of production basis based on proved and developed reserves, is included in the depletion cost in the profi t and loss account.
Impairment(E)
The carrying amounts of assets are reviewed at each balance sheet date if there is any indication of impairment based on internal/external 1
factors. An impairment loss is recognized where the carrying amount of an asset exceeds its recoverable amount. The recoverable amount
is the greater of the asset’s net selling price and value in use. In assessing value in use, the estimated future cash fl ows are discounted to
their present value at the weighted average cost of capital.
After impairment, depreciation/depletion is provided in subsequent periods on the revised carrying amount of the asset over its remaining 2
useful life.
Tangible fi xed assets, depreciation and amortization(F)
Tangible assets are stated at cost less accumulated depreciation and impairment losses, if any. Cost comprises the purchase price and any attributable
cost of bringing the asset to its working condition for its intended use. Borrowing costs relating to acquisition of fi xed assets which take a substantial
period of time to get ready for its intended use are also included to the extent they relate to the period till such assets are ready to be put to use.
Depreciation is provided using the Straight Line Method as per the useful lives of the assets estimated by the management, or at the rates
prescribed under Schedule XIV of the Companies Act 1956, whichever is higher. The expected useful economic lives are as follows:
Vehicles 2 to 5 years
Freehold buildings 10 years
Computers 2 to 5 years
Furniture and fi xtures 2 to 5 years
Offi ce equipments 2 to 5 years
Plant and Equipment 2 to 10 years
Leasehold land Lease period
Leasehold improvements are amortized over the remaining period of the primary lease or expected useful economic lives, whichever is shorter.
Intangible fi xed assets and amortization(G)
Intangible assets, other than oil and gas assets, have fi nite useful lives and are measured at cost and amortized over their expected useful economic
lives as follows:
Computer software 2 to 4 years
Leases(H)
Finance leases, which effectively transfer substantially all the risks and benefi ts incidental to ownership of the leased item, are capitalised at the lower
of the fair value and present value of the minimum lease payments at the inception of the lease term and disclosed as leased assets. Lease payments
are apportioned between the fi nance charges and reduction of the lease liability based on the implicit rate of return. Finance charges are charged
directly against income. Lease management fees, legal charges and other initial direct costs are capitalised.
If there is no reasonable certainty that the Company will obtain the ownership by the end of the lease term, capitalised leased assets are
depreciated over the shorter of the estimated useful life of the asset or the lease term.
Leases where the lessor effectively retains substantially all the risks and benefi ts of ownership of the leased item, are classifi ed as operating
leases. Operating lease payments are recognised as an expense in the profi t and loss account on a straight-line basis over the lease term.
Investments(I)
Investments that are readily realisable and intended to be held for not more than a year are classifi ed as current investments. All other investments
are classifi ed as long-term investments. Current investments are measured at cost or market value, whichever is lower, determined on an individual
investment basis. Long term investments are measured at cost. However, provision for diminution in value is made to recognise a decline other than
temporary in the value of the investments.
Joint Ventures(J)
The Company participates in several Joint Ventures involving joint control of assets for carrying out oil and gas exploration, development and
producing activities. The Company accounts for its share of the assets and liabilities of Joint Ventures along with attributable income and expenses in
such Joint Ventures, in which it holds a participating interest. Joint venture cash and cash equivalent balances are considered by the Company to be
the amounts contributed in excess of the Company’s obligations to the joint ventures and are, therefore, disclosed within loans and advances.
Revenue recognition(K)
Revenue is recognized to the extent that it is probable that the economic benefi ts will fl ow to the Company and the revenue can be reliably measured.
Schedules to the Financial Statements ContinuedSCHEDULE 20–NOTES TO ACCOUNTS(All amounts are in INR thousand unless, otherwise stated)

CAIRN INDIA LIMITED AN N UAL R E PORT 2009-1084
Revenue from operating activities
The Company recognizes parent company overhead as revenue from joint ventures (in which its foreign subsidiaries are participants) based on the
provisions of respective PSCs.
Interest income
Interest income is recognised on a time proportion basis.
Borrowing costs(L)
Borrowing costs include interest and commitment charges on borrowings, amortisation of costs incurred in connection with the arrangement of
borrowings, exchange differences to the extent they are considered a substitute to the interest cost and fi nance charges under leases. Costs
incurred on borrowings directly attributable to development projects, which take a substantial period of time to complete, are capitalised within the
development/producing asset for each cost-centre.
All other borrowing costs are recognised in the profi t and loss account in the period in which they are incurred.
Foreign currency transactions and translations(M)
The Company translates foreign currency transactions into Indian Rupees at the rate of exchange prevailing at the transaction date. Monetary assets
and liabilities denominated in foreign currency are translated into Indian Rupees at the rate of exchange prevailing at the balance sheet date. Non-
monetary items which are carried in terms of historical cost denominated in a foreign currency are reported using the exchange rate at the date of
the transaction.
Exchange differences arising on the settlement of monetary items or on reporting the Company’s monetary items at rates different from those
at which they were initially recorded during the period, or reported in previous fi nancial statements, are recognised as income or as expenses in the
period in which they arise.
Income taxes(N)
Tax expense comprises of current and deferred tax. Current income tax is measured at the amount expected to be paid to the tax authorities in
accordance with the Indian Income Tax Act. Deferred income tax refl ects the impact of current period timing differences between taxable income and
accounting income for the period and reversal of timing differences of earlier periods.
Deferred tax assets and liabilities are measured, based on tax rates and laws enacted or substantively enacted at the balance sheet date.
Deferred tax assets are recognised only to the extent that there is reasonable certainty that suffi cient future taxable income will be available
against which such deferred tax assets can be realised. If the Company has carry forward of unabsorbed depreciation and tax losses, deferred tax
assets are recognised only if there is virtual certainty, supported by convincing evidence, that such deferred tax assets can be realised against future
taxable profi ts. Unrecognised deferred tax assets of earlier periods are re-assessed and recognised to the extent that it has become reasonably
certain or virtually certain as the case may be, that future taxable income will be available against which such deferred tax assets can be realised.
Earnings Per Share(O)
Basic earnings per share are calculated by dividing the net profi t or loss for the period attributable to equity shareholders by the weighted average
number of equity shares outstanding during the period. The weighted average number of equity shares outstanding during the period is adjusted for
events of bonus issue, bonus element in a rights issue to existing shareholders, share split and reverse share split (consolidation of shares).
For the purpose of calculating diluted earnings per share, the net profi t or loss for the period attributable to equity shareholders and the
weighted average number of shares outstanding during the period are adjusted for the effects of all dilutive potential equity shares, if any.
Provisions(P)
A provision is recognised when the Company has a present obligation as a result of past event and it is probable that an outfl ow of resources will
be required to settle the obligation, in respect of which a reliable estimate can be made. Provisions are not discounted to its present value and are
determined based on best estimate required to settle the obligation at the balance sheet date. These are reviewed at each balance sheet date and
adjusted to refl ect the current best estimates.
Cash and Cash equivalents(Q)
Cash and cash equivalents in the cash fl ow statement comprise cash at bank and in hand and short-term investments, with an original maturity of 90
days or less.
Employee Benefi ts(R)
Retirement and Gratuity benefi ts
Retirement benefi ts in the form of provident fund and superannuation scheme are defi ned contribution schemes and the contributions are charged to
the profi t and loss account of the period when the contributions to the respective funds are due. There are no obligations other than the contribution
payable to the respective funds.
Gratuity liability is a defi ned benefi t obligation and is provided for on the basis of an actuarial valuation on projected unit credit method made
at the end of each fi nancial year. The scheme is maintained and administered by an insurer for the entire Cairn India Group to which the trustees
make periodic contributions.
Short term compensated absences are provided for on based on estimates. Long term compensated absences are provided for based on
actuarial valuation made at the end of each fi nancial year. The actuarial valuation is done as per projected unit credit method.
Actuarial gains / losses are immediately taken to profi t and loss account and are not deferred.
Employee Stock Compensation Cost
Measurement and disclosure of the employee share-based payment plans is done in accordance with SEBI (Employee Stock Option Scheme and
Schedules to the Financial Statements ContinuedSCHEDULE 20–NOTES TO ACCOUNTS(All amounts are in INR thousand unless, otherwise stated)
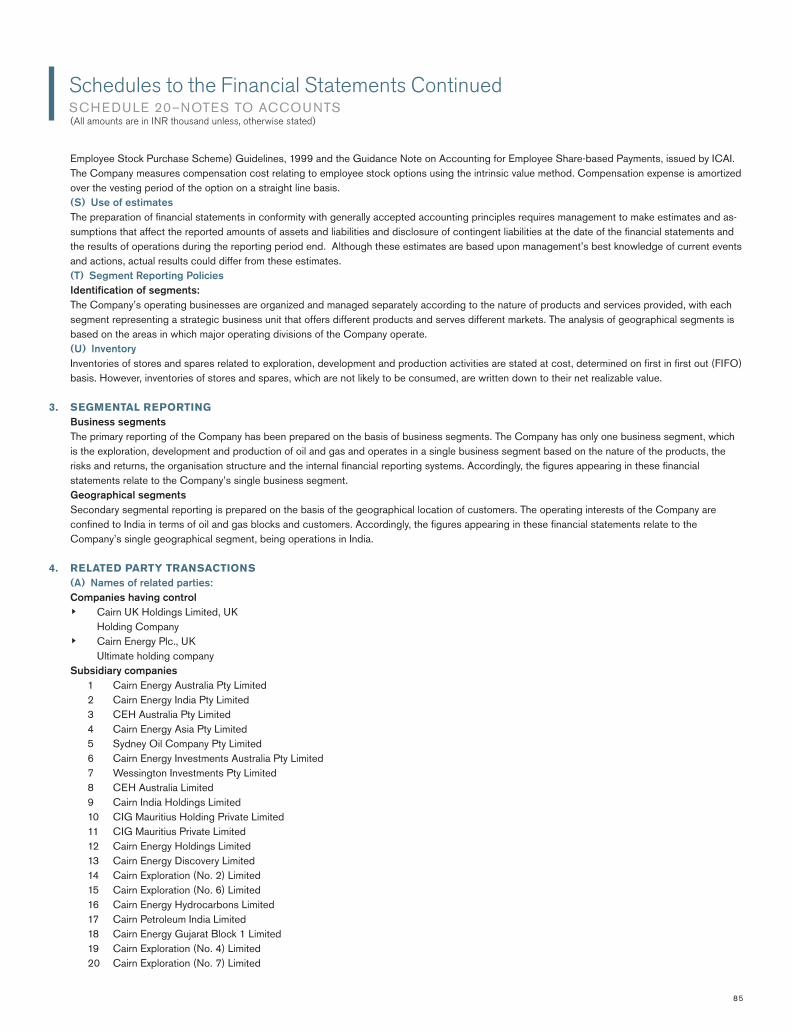
85
Employee Stock Purchase Scheme) Guidelines, 1999 and the Guidance Note on Accounting for Employee Share-based Payments, issued by ICAI.
The Company measures compensation cost relating to employee stock options using the intrinsic value method. Compensation expense is amortized
over the vesting period of the option on a straight line basis.
Use of estimates(S)
The preparation of fi nancial statements in conformity with generally accepted accounting principles requires management to make estimates and as-
sumptions that affect the reported amounts of assets and liabilities and disclosure of contingent liabilities at the date of the fi nancial statements and
the results of operations during the reporting period end. Although these estimates are based upon management’s best knowledge of current events
and actions, actual results could differ from these estimates.
Segment Reporting Policies(T)
Identifi cation of segments:
The Company’s operating businesses are organized and managed separately according to the nature of products and services provided, with each
segment representing a strategic business unit that offers different products and serves different markets. The analysis of geographical segments is
based on the areas in which major operating divisions of the Company operate.
Inventory(U)
Inventories of stores and spares related to exploration, development and production activities are stated at cost, determined on fi rst in fi rst out (FIFO)
basis. However, inventories of stores and spares, which are not likely to be consumed, are written down to their net realizable value.
SEGMENTAL REPORTING3.
Business segments
The primary reporting of the Company has been prepared on the basis of business segments. The Company has only one business segment, which
is the exploration, development and production of oil and gas and operates in a single business segment based on the nature of the products, the
risks and returns, the organisation structure and the internal fi nancial reporting systems. Accordingly, the fi gures appearing in these fi nancial
statements relate to the Company’s single business segment.
Geographical segments
Secondary segmental reporting is prepared on the basis of the geographical location of customers. The operating interests of the Company are
confi ned to India in terms of oil and gas blocks and customers. Accordingly, the fi gures appearing in these fi nancial statements relate to the
Company’s single geographical segment, being operations in India.
RELATED PARTY TRANSACTIONS4.
Names of related parties:(A)
Companies having control
‣ Cairn UK Holdings Limited, UK
Holding Company
‣ Cairn Energy Plc., UK
Ultimate holding company
Subsidiary companies
Cairn Energy Australia Pty Limited 1
Cairn Energy India Pty Limited2
CEH Australia Pty Limited3
Cairn Energy Asia Pty Limited4
Sydney Oil Company Pty Limited5
Cairn Energy Investments Australia Pty Limited6
Wessington Investments Pty Limited7
CEH Australia Limited8
Cairn India Holdings Limited9
CIG Mauritius Holding Private Limited 10
CIG Mauritius Private Limited 11
Cairn Energy Holdings Limited12
Cairn Energy Discovery Limited13
Cairn Exploration (No. 2) Limited14
Cairn Exploration (No. 6) Limited15
Cairn Energy Hydrocarbons Limited16
Cairn Petroleum India Limited17
Cairn Energy Gujarat Block 1 Limited18
Cairn Exploration (No. 4) Limited19
Cairn Exploration (No. 7) Limited20
Schedules to the Financial Statements ContinuedSCHEDULE 20–NOTES TO ACCOUNTS(All amounts are in INR thousand unless, otherwise stated)

CAIRN INDIA LIMITED AN N UAL R E PORT 2009-1086
Cairn Energy Development Pte Limited 21
Cairn Lanka (Pvt) Limited 22
Cairn Energy Group Holdings BV23
Cairn Energy India West BV24
Cairn Energy India West Holding BV25
Cairn Energy Gujarat Holding BV26
Cairn Energy India Holdings BV27
Cairn Energy Netherlands Holdings BV28
Cairn Energy Gujarat BV29
Cairn Energy Cambay BV30
Cairn Energy Cambay Holding BV31
Key Management Personnel
• Rahul Dhir, Managing Director and Chief Executive Offi cer
• Winston Frederick Bott Jr., Executive Director and Chief Operating Offi cer
(appointed on 29th April, 2008)
• Indrajit Banerjee, Executive Director and Chief Financial Offi cer
• Lawrence Smyth, Executive Director and Chief Operating Offi cer
(resigned on 21st January, 2008)
Transactions during the year/period:(B)
Schedules to the Financial Statements ContinuedSCHEDULE 20–NOTES TO ACCOUNTS(All amounts are in INR thousand unless, otherwise stated)
Nature of the Transactions Related Party Current year Previous period
Waiver of outstanding balance by the
parent companyCairn Energy Plc. 24,176 Nil
Expenses incurred by related party on
behalf of the Company
Cairn Energy India Pty Limited 15,938 93,757
Cairn Energy Plc. 8,120 Nil
Total 24,058 93,757
Expenses incurred by the Company on
behalf of related party
Cairn Energy India Pty Limited 190 256,499
Cairn Energy Plc Nil 854
CIG Mauritius Holdings Private Limited Nil 491
CIG Mauritius Private Limited Nil 264
Cairn Energy Gujarat Block 1 Limited Nil 10,648
Cairn Exploration (No. 4) Limited Nil 100
Cairn Exploration (No. 7) Limited Nil 13,668
Cairn Lanka Private Limited Nil 881
Cairn Energy Hydrocarbons Limited 836 30,597
Cairn Energy Development Pte Limited 694 Nil
Total 1,720 314,002
Equity contributions made during
the year/period
Cairn India Holdings Limited 23,337,922 1,440,804
CIG Mauritius Holding Private Limited 489,647 121,980
23,827,569 1,562,784
Assignment of interest in oil & gas
blocks from
Cairn Energy Gujarat Block 1 Limited Nil 89,513
Cairn Exploration (No. 2) Limited Nil 302,085
Cairn Exploration (No. 4) Limited Nil 68,462
Cairn Exploration (No. 6) Limited Nil 7,164
Cairn Exploration (No. 7) Limited Nil 160,166
Total Nil 627,390
Guarantees given Cairn Lanka Private Limited Nil 1,432,436
Recovery of share option charge Cairn Energy India Pty Limited 64,264 140,617
Shares issued including premium and
stock option charge
Rahul Dhir Nil 716,185
Lawrence Smyth Nil 126,758
Total Nil 842,943
RemunerationRahul Dhir 2,400 3,000
Winston Frederick Bott Jr. 1,200 950
Indrajit Banerjee 1,800 2,250
Total 5,400 6,200
Note The remuneration to the key managerial personnel does not include the provisions made for gratuity and leave benefi ts, as they are determined on an
actuarial basis for the Company as a whole.

87
Balances outstanding as at the end of the year/period:(C)
5. The shareholders of the Company in their meeting dated August 18, 2009 had revised the allocation of Initial Public Offer (IPO) proceeds within the
existing heads under the prospectus. As at 31st March 2010, the Company and its subsidiaries together have utilized the entire IPO proceeds
aggregating to INR 88,248,901 thousand in accordance with the revised approval received from the shareholders. The details of the revised approval
and utilization of funds is as follows:
6. EMPLOYEES STOCK OPTION PLANS
The Company has provided various share-based payment schemes to its employees. During the year ended 31st March 2010, the following schemes
were in operation:
Particulars Upto 31st March 2010 Upto 31st March 2009
Acquisition of shares of Cairn India Holdings Limited
from Cairn UK Holdings Limited59,580,837 59,580,837
Exploration and development expenses 26,838,445 21,152,714
General corporate purposes 230,000 230,000
Issue expenses 1,599,619 1,599,619
Total 88,248,901 82,563,170
The details of the unutilized monies out of the public issue proceeds is as follows:
Particulars 31st March 2010 31st March 2009
Mutual funds Nil 718,277
Balances with banks Nil 4,967,454
Total Nil 5,685,731
Schedules to the Financial Statements ContinuedSCHEDULE 20–NOTES TO ACCOUNTS(All amounts are in INR thousand unless, otherwise stated)
Nature of the Balance Related Party 31st March 2010 31st March 2009
Guarantees given Cairn Lanka Private Limited 1,267,674 1,432,436
Accounts receivable Cairn Energy India Pty Limited 208,512 160,563
CIG Mauritius Holdings Private Limited 491 491
CIG Mauritius Private Limited 264 264
Cairn Lanka Private Limited 881 881
Cairn Energy Hydrocarbons Limited 31,432 30,596
Cairn Energy Development Pte Limited 667 Nil
Total 242,247 192,795
Accounts payable Cairn Energy Plc Nil 24,109
Cairn Energy Gujarat Block 1 Limited 89,531 102,552
Cairn Exploration (No. 2) Limited 332,327 367,147
Cairn Exploration (No. 4) Limited 77,497 86,635
Cairn Exploration (No. 6) Limited 8,423 9,558
Cairn Exploration (No. 7) Limited 165,153 187,886
Total 672,931 777,887
Particulars CISMP CIPOP CIESOP
Date of Board Approval 17th Nov 2006 17th Nov 2006 17th Nov 2006
Date of Shareholder’s approval 17th Nov 2006 17th Nov 2006 17th Nov 2006
Number of options granted till March 2010 8,298,713 6,727,724 18,197,795
Method of Settlement Equity Equity Equity
Vesting Period Refer vesting conditions below 3 years from grant date 3 years from grant date
Exercise Period 18 months from vesting date 3 months from vesting date 7 years from vesting date
Number of options granted till March 2010
24th Nov 2006 8,298,713 - -
1st Jan 2007 - 1,708,195 3,467,702
20th Sept 2007 - 3,235,194 5,515,053
29th July 2008 - 789,567 3,773,856
10th Dec 2008 - - 36,040
29th July 2009 - 994,768 5,405,144
Total 8,298,713 6,727,724 18,197,795

CAIRN INDIA LIMITED AN N UAL R E PORT 2009-1088
The Vesting conditions of the above plans are as under:
CISMP plan
(A) 6,714,233 options are to be vested in the following manner:
• 1/3rd of the options will vest on the day following the date on which the equity shares have been admitted to listing on the Stock Exchanges
(‘admission date’). Listing date was 9th Jan 2007.
• 1/3rd of the options will vest 18 months after the admission date.
• 1/3rd of the options will vest on achieving 30 days’ consecutive production of over 150,000 bopd from the Rajasthan Block.
(B) 1,584,480 options are to be vested in the following manner:
• 1/2 of the options will vest on the day following the date on which the equity shares have been admitted to listing on the Stock Exchanges.
• 1/4th of the options will vest on the date on which all major equipment for the start-up of the Mangala fi eld is delivered to site.
• 1/4th of the options will vest on achieving 100,000 boepd from the Mangala Field.
CIPOP plan
Options will vest (i.e. become exercisable) at the end of a “performance period” which will be set by the remuneration committee at the time of grant
(although such period will not be less than three years). However, the percentage of an option which vests on this date will be determined by the
extent to which pre-determined performance conditions have been satisfi ed.
CIESOP plan
There are no specifi c vesting conditions under CIESOP plan.
Schedules to the Financial Statements ContinuedSCHEDULE 20–NOTES TO ACCOUNTS(All amounts are in INR thousand unless, otherwise stated)
Details of Activities under Employees Stock Option Plans
CISMP Plan Current year Previous period
Number of
options
Weighted average
exercise Price in INRNumber of options
Weighted average
exercise Price in INR
Outstanding at the beginning of the year 2,238,077 33.70 8,298,713 33.70
Granted during the year Nil NA Nil NA
Forfeited during the year Nil NA Nil NA
Exercised during the year Nil NA 5,268,396 33.70
Expired during the year Nil NA 792,240 33.70
Outstanding at the end of the year 2,238,077 33.70 2,238,077 33.70
Exercisable at the end of the year Nil NA Nil NA
Weighted average fair value of options granted
on the date of grant (INR)131.50 NA 131.50 NA
CIPOP Plan Current year Previous period
Number of
options
Weighted average
exercise Price in INR
Number of
options
Weighted average
exercise Price in INR
Outstanding at the beginning of the year 3,200,096 10.00 4,755,244 10.00
Granted during the year 994,768 10.00 789,567 10.00
Forfeited during the year Nil NA Nil NA
Exercised during the year 190,983 10.00 Nil NA
Expired during the year 1,377,051 10.00 2,344,715 10.00
Outstanding at the end of the year 2,626,830 10.00 3,200,096 10.00
Exercisable at the end of the year 168,382 10.00 Nil NA
CIESOP Plan Current year Previous period
Number of
options
Weighted average
exercise Price in INRNumber of options
Weighted average
exercise Price in INR
Outstanding at the beginning of the year 10,914,244 185.39 8,545,710 164.49
Granted during the year 5,405,144 240.05 3,809,896 226.21
Forfeited during the year Nil NA Nil NA
Exercised during the year 115,333 160.00 Nil NA
Expired during the year 1,557,846 179.09 1,441,362 169.33
Outstanding at the end of the year 14,646,209 206.43 10,914,244 185.39
Exercisable at the end of the year 1,981,770 160.00 Nil NA
Weighted average fair value of options granted
on the date of grant (INR)107.64 NA 101.47 NA

89
Inputs for Fair valuation of Employees Stock Option Plans
The Share Options have been fair valued using an Option Pricing Model (Black Scholes Model). The main inputs to the model and the Fair Value of
the options, based on an independent valuation, are as under:
Variables - CISMP A B
Grant date 24th Nov 2006 24th Nov 2006
Stock Price/fair value of the equity shares on the date of
grant (INR)160.00 160.00
Vesting date Refer vesting conditions Refer vesting conditions
Vesting % Refer vesting conditions Refer vesting conditions
Volatility (Weighted average) 44.08% 46.59%
Risk free rate (Weighted average) 7.05% 6.94%
Time to maturity in years (Weighted average) 2.45 2.00
Exercise price – INR 33.70 33.70
Fair Value of the options (Weighted average) - INR 131.69 130.69
Variables – CIESOP A B C D E
Grant date 1st Jan’07 20th Sept’07 29th July’08 10th Dec’08 29th July’09
Stock Price/fair value of the equity
shares on the date of grant (INR)160.00 166.95 228.55 150.10 234.75
Vesting date 1st Jan’10 20th Sept’10 29th Jul’11 10th Dec’11 29th July’ 12
Vesting % 100% 100% 100% 100% 100%
Volatility 41.04% 40.24% 39.43% 38.19% 39.97%
Risk free rate 7.50% 7.65% 9.20% 6.94% 6.91%
Time to maturity (years) 6.50 6.50 6.50 6.50 6.50
Exercise price (INR) 160.00 166.95 227.00 143.00 240.05
Fair Value of the options (INR) 87.30 90.72 130.42 79.80 122.24
Schedules to the Financial Statements ContinuedSCHEDULE 20–NOTES TO ACCOUNTS
Variables – CIPOP A B C D
Grant date 1st Jan’07 20th Sept’07 29th Jul’08 29th Jul’09
Stock Price/fair value of the equity shares
on the date of grant (INR)160.00 166.95 228.55 234.75
Vesting date 1st Jan’10 20th Sept’10 29th Jul’11 29th July’ 12
Vesting % Refer vesting conditions Refer vesting conditions Refer vesting conditions Refer vesting conditions
Volatility 41.61% 36.40% 37.49% 43.72%
Risk free rate 7.33% 7.23% 9.37% 5.78%
Time to maturity (years) 3.12 3.12 3.12 3.13
Exercise price (INR) 10.00 10.00 10.00 10.00
Fair Value of the options (INR) 152.05 158.97 221.09 226.40
The details of exercise price for stock options outstanding as at March 31, 2010 are:
(All amounts are in INR thousand unless, otherwise stated)
SchemeRange of exercise
price (INR)
No. of options
outstanding
Weighted average
remaining contractual
life of options
(in years)
Weighted average
exercise price (INR)
CISMP Plan 33.70 2,238,077 1.08 33.70
CIPOP Plan 10.00 2,626,830 1.36 10.00
CIESOP Plan 143-240 14,646,209 1.28 206.43
The details of exercise price for stock options outstanding as at March 31, 2009 are:
CISMP Plan 33.70 2,238,077 2.08 33.70
CIPOP Plan 10.00 3,200,096 1.51 10.00
CIESOP Plan 143-227 10,914,244 1.60 185.39

CAIRN INDIA LIMITED AN N UAL R E PORT 2009-1090
Volatility is the measure of the amount by which the price has fl uctuated or is expected to fl uctuate during the period. The measure of volatility used in
Black-Scholes option-pricing model is the annualized standard deviation of the continuously compounded rates of return on the stock over a period
of time. Time to maturity /expected life of options is the period for which the Company expects the options to be live. The time to maturity has been
calculated as an average of the minimum and maximum life of the options.
Effect of Employees Stock Option Plans on Financial Position
Effect of the employee share-based payment plans on the profi t and loss account and on its fi nancial position:
Impact of Fair Valuation Method on net profi ts and EPS
In March 2005, the Institute of Chartered Accountants of India has issued a guidance note on “Accounting for Employees Share Based Payments”
applicable to employee based share plan the grant date in respect of which falls on or after April 1, 2005. The said guidance note requires the
Proforma disclosures of the impact of the fair value method of accounting of employee stock compensation accounting in the fi nancial statements.
Applying the fair value based method defi ned in the said guidance note, the impact on the reported net profi t and earnings per share would be
as follows:
7. LEASE OBLIGATIONS DISCLOSURES
Operating Lease
The Joint Ventures, in which the Company has participating interest, have entered into operating lease for equipments and buildings. All such leases
are cancelable in nature. There are neither escalation clauses nor any restrictions in the lease agreements. There are no subleases.
8. DERIVATIVE INSTRUMENTS AND UNHEDGED FOREIGN CURRENCY EXPOSURE
The Company did not take any derivative instruments during the current year / previous period. Particulars of unhedged foreign currency exposures are as follows:
Particulars Current year Previous period
Total Employee Compensation Cost pertaining to equity settled share-
based payment plans (net of exceptional gain of INR 155,723 thousand
in the previous period)
39,385 (33,325)
Liability for employee stock options outstanding as at year/ period end 463,978 388,978
Deferred Compensation Cost 304,142 393,570
Particulars Current year Previous period
Profi t/(loss) as reported (689,534) 542,407
Add: Employee stock compensation under intrinsic value method 39,385 (33,325)
Less: Employee stock compensation under fair value method 427,537 451,826
Proforma profi t/(loss) (1,077,686) 57,256
Earnings Per Share in INR
Basic
- As reported (0.36) 0.29
- Proforma (0.57) 0.03
Diluted (current year is anti-dilutive)
- As reported (0.36) 0.29
- Proforma (0.57) 0.03
Particulars 31st March 2010 31st March 2009
Lease rentals recognized during the year/period 2,002 7,255
Schedules to the Financial Statements ContinuedSCHEDULE 20–NOTES TO ACCOUNTS
Particulars 31st March 2010 31st March 2009
Sundry debtors 15,728 17,942
Other current assets 49,984 16,925
Current liabilities 711,263 785,562
(All amounts are in INR thousand unless, otherwise stated)

91
9. The Company has a gratuity plan, wherein every employee who has completed fi ve years or more of service gets a gratuity on departure at 15 days
salary (last drawn salary) for each completed year of service. The gratuity plan of the Company is an unfunded scheme.
The following tables summarize the components of net benefi t expense recognised in the profi t and loss account and the amounts recognised
in the balance sheet for the gratuity plans.
Profi t and Loss account
Net employee benefi t expense (recognised in staff cost)
Balance sheet
Details of Provision for Gratuity
Note The estimates of future salary increases, considered in actuarial valuation, take account of infl ation, seniority, promotion and other relevant factors, such as
supply and demand in the employment market.
Gratuity liabilities are as follows:
Note The Company has adopted AS-15 (Revised 2005) Employee Benefi ts for the fi rst time during the previous period. Disclosures required by paragraph 120 (n) of
AS-15 (Revised 2005) are required to be furnished prospectively from the date of transition and hence have been furnished for the current and previous period only.
Particulars 31st March 2010 31st March 2009
Defi ned benefi t obligation 6,647 3,994
Surplus / (defi cit) (6,647) (3,994)
Experience adjustments on plan liabilities (loss) / gain (583) (45)
Particulars 31st March 2010 31st March 2009
Current service cost 1,605 1,011
Interest cost on benefi t obligation 319 200
Net actuarial (gain) / loss recognised in the year/period 729 2,509
Past service cost Nil Nil
Net benefi t expense 2,653 3,720
Particulars 31st March 2010 31st March 2009
Defi ned benefi t obligation 6,647 3,994
Less: Unrecognized past service cost Nil Nil
Plan asset / (liability) (6,647) (3,994)
Changes in the present value of the defi ned benefi t obligation are as follows:
Opening defi ned benefi t obligation 3,994 274
Current service cost 1,605 1,011
Interest cost 319 200
Benefi ts paid Nil Nil
Actuarial (gains) / losses on obligation 729 2,509
Closing defi ned benefi t obligation 6,647 3,994
The principal assumptions used in determining gratuity liability for the Group’s plans are shown below:
Discount rate 8.00% 7.00%
Future salary increase 10.00% 10.00%
Employee turnover 5.00% 13.13%
Mortality Rate LIC (1994-96) Ultimate Table LIC (1994-96) Ultimate Table
Schedules to the Financial Statements ContinuedSCHEDULE 20–NOTES TO ACCOUNTS(All amounts are in INR thousand unless, otherwise stated)

CAIRN INDIA LIMITED AN N UAL R E PORT 2009-1092
10. DETAILS OF MOVEMENT IN SHARE CAPITAL AND SECURITIES PREMIUM IS AS UNDER
11. In accordance with the provisions of Accounting Standard 22 ‘Accounting for taxes on income’, the Company would have had deferred tax assets
of approximately INR 361,000 thousand (previous period INR 511,000 thousand) primarily comprising of accumulated tax losses and unamortized
issue expenses. However, as the management is not virtually certain of subsequent realization of the asset, no deferred tax asset has been computed
or recognized in these fi nancial statements.
12. The Company and its wholly owned subsidiary Cairn Energy Hydrocarbons Limited (“CEHyL”) have entered into a loan facility for INR 40,000 million
(available to the Company) and USD 750 million (available to CEHyL) with a consortium of banks. The purpose of the loan facility is to fi nance the
RJ-ON-90/1 block expenditure and also the repayment of the earlier loan facility of USD 850 million. The main security for the INR loan facility is the
hypothecation of the 35% participating interest in RJ-ON-90/1 block held by Cairn Energy India Pty Limited, a wholly owned subsidiary of the
Company whereas for the USD loan facility, the entire shares of CEHyL has been provided as the main security.
13. The shareholders of the Company have approved a Scheme of Arrangement between the Company and some of its wholly owned subsidiaries, to
be effective from 1st January 2010. The Scheme of Arrangement has been approved by the Hon’ble High Court of Madras. However, it is pending for
approval from the Hon’ble High Court of Bombay and other regulatory authorities. Pending receipt of such approvals, no accounting impact of the
scheme has been given in these fi nancial statements. After the implementation of the scheme, the Company will directly own the Indian businesses,
which are currently owned by some of its wholly owned subsidiaries and as contemplated in the scheme, any goodwill arising in the Company
pursuant to the scheme, shall be adjusted against the securities premium account.
14. The reversal in fringe benefi t tax (FBT) is on account of the abolishment of FBT with effect from 1st April 2009, as the Company was accounting for
FBT liability on stock options on a pro-rata basis over the vesting period.
15. MANAGERIAL REMUNERATION
Note As the future liability for gratuity and leave benefi ts is provided on actuarial basis for the Company as a whole, the amount pertaining to the directors is not
included above.
Description No. of equity shares Issue price in INR Share capital Securities premium
Balance as on 1st January 2008 1,778,399,420 17,783,994 276,084,115
Exercise of stock options-CISMP 792,240 33.70 7,922 18,776
Preferential allotment of shares to non
promoter investors on 22nd April 2008113,000,000 224.30 1,130,000 24,215,900
Exercise of share options -CISMP 525,000 33.70 5,250 12,443
Exercise of share options-CISMP 1,713,078 33.70 17,131 40,600
Exercise of share options-CISMP 1,600,000 33.70 16,000 37,920
Exercise of share options-CISMP 638,078 33.70 6,381 15,122
Share options liability transferred to securities
premium upon exercise of the options665,398
Balance as on 31st March 2009 1,896,667,816 18,966,678 301,090,274
Exercise of share options-CIPOP 190,983 10.00 1,910 Nil
Exercise of share options-CIESOP 115,333 160.00 1,153 17,300
Share options liability transferred to securities
premium upon exercise of the options28,648
Waiver of parent company outstanding
balance, pertaining to share issue expenses
paid by parent company, which had earlier
been adjusted from securities premium
25,000
Balance as on 31st March 2010 1,896,974,132 18,969,741 301,161,222
Remuneration paid or payable to the Directors Current year Previous period
Salary 4,632 5,798
Contribution to provident fund 768 402
Total 5,400 6,200
Schedules to the Financial Statements ContinuedSCHEDULE 20–NOTES TO ACCOUNTS(All amounts are in INR thousand unless, otherwise stated)

93
16. EARNINGS IN FOREIGN CURRENCY (ACCRUAL BASIS)
17. EXPENDITURE IN FOREIGN CURRENCY (ACCRUAL BASIS)
18. IMPORTED AND INDIGENOUS SPARE AND PARTS CONSUMED IN OIL & GAS EXPLORATION ACTIVITIES
19. VALUE OF IMPORTS CALCULATED ON CIF BASIS
20. CAPITAL COMMITMENTS (NET OF ADVANCES)
21. DETAILS OF DUES TO MICRO, SMALL AND MEDIUM ENTERPRISES AS PER MSMED ACT, 2006
Particulars Current year Previous period
Parent company overhead 32,040 37,331
Interest 8 249
Total 32,048 37,580
Particulars Current year Previous period
Stores and spares 12,213 Nil
Particulars Current year Previous period
Company’s share of Joint Ventures’ exploration activities 1,296,011 3,517,376
Details of dues to Micro, Small and Medium Enterprises as per MSMED
Act, 2006Current year Previous period
The principal amount (interest-nil) remaining unpaid to any supplier as at the end of each
accounting year Nil 6
The amount of interest paid by the buyer in terms of section 16, of the Micro Small and Medium
Enterprise Development Act, 2006 along with the amounts of the payment made to the supplier
beyond the appointed day during each accounting year
Nil Nil
The amount of interest due and payable for the period of delay in making payment (which have been
paid but beyond the appointed day during the year) but without adding the interest specifi ed under
Micro Small and Medium Enterprise Development Act, 2006.
Nil Nil
The amount of interest accrued and remaining unpaid at the end of each accounting year; and Nil Nil
The amount of further interest remaining due and payable even in the succeeding years, until such
date when the interest dues as above are actually paid to the small enterprise for the purpose of
disallowance as a deductible expenditure under section 23 of the Micro Small and Medium
Enterprise Development Act, 2006
Nil Nil
Particulars Current year Previous period
Professional fees 27,409 128,251
Exploration cost 154,991 279,599
Assignment of interest in oil & gas blocks Nil 627,390
Other expenses 6,428 1,072
Total 188,828 1,036,312
Particulars Percentage of total consumption Amount
Current year Previous period Current year Previous period
Imported 29.10 Nil 11,529 Nil
Indigenous 70.90 Nil 28,083 Nil
Total 100.00 Nil 39,612 Nil
Schedules to the Financial Statements ContinuedSCHEDULE 20–NOTES TO ACCOUNTS(All amounts are in INR thousand unless, otherwise stated)

CAIRN INDIA LIMITED AN N UAL R E PORT 2009-1094
22. CURRENT INVESTMENTS - UNQUOTED AND NON TRADE (REFER SCHEDULE-7 OF THE FINANCIAL STATEMENTS):
The details of investments in mutual fund units are as tabulated under:
31st March 2010
124,000,000 units of Birla Sunlife mutual fund under Birla Sun Life Interval Income Fund - Quarterly
Plan - Series II - Daily Dividend Reinvestment plan241,596
2 117,443,151 units of Birla Sunlife mutual fund under Birla Sun Life Saving Funds - Daily Dividend Reinvestment plan 1,175,230
3 75,161,631 units of Birla Sunlife mutual fund under BSL Floating Rate Fund - Long Term - Daily Dividend Reinvestment plan 753,961
4 16,155,533 units of Canara Robeco mutual fund under Canara Robeco Treasury Advantage - Daily Dividend Reinvestment plan 200,443
5 1,074,176 units of DSP Blackrock mutual fund under DSP Blackrock Floating Rate - Daily Dividend Reinvestment plan 1,074,762
6219,994,508 units of HDFC mutual fund under HDFC Cash Management Fund - Treasury Advantage - Daily Dividend
Reinvestment plan2,206,875
722,933,236 units of ICICI Prudential mutual fund under ICICI Prudential Flexible Income Plan
Premium - Daily Dividend Reinvestment plan2,424,846
8 20,000,000 units of ICICI Prudential mutual fund under ICICI Prudential Interval Fund II - Daily Dividend Reinvestment plan 200,048
9115,624,830 units of IDFC mutual fund under IDFC Money Manager TP Super Institutional - Plan C - Daily Dividend
Reinvestment plan1,156,422
10 135,776,717 units of Kotak Mahindra mutual fund under Kotak Floater Long Term Fund - Daily Dividend Reinvestment plan 1,368,602
11 24,000,000 units of Kotak Mahindra mutual fund under Kotak Quarterly Interval Plan Series 8 - Daily Dividend Reinvestment plan 240,710
1222,430,929 units of Reliance mutual fund under Reliance Liquid Fund - Treasury Plan-Institutional
Option - Daily Dividend Reinvestment plan342,908
13 41,040,682 units of Reliance mutual fund under Reliance Medium Term Fund - Daily Dividend Reinvestment plan 701,627
14 128,910,540 units of SBI mutual fund under SBI SHF-Ultra Short Term Fund - Daily Dividend Reinvestment plan 1,289,879
15 130,570,088 units of Tata mutual fund under Tata Floater Fund - Daily Dividend Reinvestment plan 1,310,349
16 2,128,161 units of UTI mutual fund under UTI Treasury Advantage Fund - Daily Dividend Reinvestment plan 2,128,618
Total 16,816,876
31st March 2009
163,626,784 units, face value of Rs. 10 each, of Birla Cash Plus - Institutional Premium- Daily Dividend
Reinvestment plan637,509
2 21,126,235 units, face value of Rs. 10 each, of HDFC Liquid Fund - Premium Plan- Daily Dividend Reinvestment plan 259,003
326,081,126 units, face value of Rs. 10 each, of ICICI Prudential Institutional Liquid Plan - Super Iinst- Daily Dividend
Reinvestment plan260,824
415,494,677 units, face value of Rs. 10 each, of Reliance Liquid Fund - Treasury Plan-Institutional Option - Daily Dividend
Reinvestment plan236,870
5 191,352 units, face value of Rs. 1000 each, of Tata Liquid Fund - SHIP- Daily Dividend Reinvestment plan 213,266
Total 1,607,472
The following mutual fund units were purchased and sold during the current year:-
1 335,214,545 units of Birla Sunlife mutual fund under Birla Cash Plus - Institutional Premium - Daily Dividend Reinvestment
2 19,920,035 units of Canara Robeco mutual fund under Canara Robeco Liquid Collection - Daily Dividend Reinvestment
3 1,073,385 units of DSP Blackrock mutual fund under DSP Blackrock Liquidity Fund - Daily Dividend Reinvestment
4 332,343,248 units of HDFC mutual fund under HDFC Liquid Fund - Premium Plan - Daily Dividend Reinvestment
5 49,198,541 units of ICICI Prudential mutual fund under ICICI Prudential Flexible Income Plan Premium - Daily Dividend Reinvestment
6 368,973,177 units of ICICI Prudential mutual fund under ICICI Prudential Institutional Liquid Plan - Super Inst - Daily Dividend Reinvestment
7 115,181,352 units of IDFC mutual fund under IDFC Cash Fund Super Institutional - Plan C - Daily Dividend Reinvestment
8 8,927,386 units of Kotak Mahindra mutual fund under Kotak Floater Long Term Fund - Daily Dividend Reinvestment
9 173,076,949 units of Kotak Mahindra mutual fund under Kotak Liquid Fund - Institutional Premium - Daily Dividend Reinvestment
10 148,837,398 units of Reliance mutual fund under Reliance Liquid Fund - Treasury Plan - Institutional Option - Daily Dividend Reinvestment
11 76,780,784 units of SBI mutual fund under SBI Magnum Insta Cash Fund - Daily Dividend Reinvestment
12 39,908,068 units of Tata mutual fund under Tata Floater Fund - Daily Dividend Reinvestment
Schedules to the Financial Statements ContinuedSCHEDULE 20–NOTES TO ACCOUNTS(All amounts are in INR thousand unless, otherwise stated)

95
13 2,089,903 units of Tata mutual fund under Tata Liquid Fund - SHIP - Daily Dividend Reinvestment
14 4,152,801 units of UTI mutual fund under UTI Liquid Cash Plan - Inst - Daily Dividend Reinvestment
15 504,918 units of UTI mutual fund under UTI Treasury Advantage Fund - Daily Dividend Reinvestment
The following mutual fund units were purchased and sold during the previous period :-
1 288,767,315 units of Birla Sunlife mutual fund under Birla Sunlife Cash Plus - Institutional Premium - Daily Dividend Reinvestment
2 396,375,092 units of Birla Sunlife mutual fund under Birla Sunlife Cash Plus - Institutional Premium – Growth
3 22,951,572 units of Birla Sunlife mutual fund under Birla Sunlife Interval Income - Institutional - Quarterly - Series 2 – Growth
4 76,578,715 units of Birla Sunlife mutual fund under Birla Sunlife Liquid Plus - Institutional - Daily Dividend Reinvestment
5 185,222,322 units of Birla Sunlife mutual fund under Birla Sunlife Liquid Plus - Institutional – Growth
6 15,000,000 units of Canara Robeco mutual fund under Canara Robeco FMP - Series 3 - 90 Days - IP – Growth
7 48,919,527 units of Canara Robeco mutual fund under Canara Robeco Liquid Plus Super Institutional - Daily Dividend Reinvestment
8 31,366,504 units of Fidelity mutual fund under Fidelity Cash - SIP – Growth
9 62,263,786 units of Fidelity mutual fund under Fidelity Liquid Plus - SIP - Daily Dividend Reinvestment
10 57,042,071 units of Fidelity mutual fund under Fidelity Liquid Plus - SIP - Growth
11 128,735,017 units of HDFC mutual fund under HDFC Cash Mgmt - Savings Plan - Daily Dividend Reinvestment
12 193,231,349 units of HDFC mutual fund under HDFC Cash Mgmt - Savings Plus Plan - Wholesale - Daily Dividend Reinvestment
13 174,864,026 units of HDFC mutual fund under HDFC Cash Mgmt - Savings Plus Plan - Wholesale – Growth
14 166,891,418 units of HDFC mutual fund under HDFC Floating Rate Income - Short Term Plan - Wholesale - Daily Dividend Reinvestment
15 193,913,572 units of HDFC mutual fund under HDFC Floating Rate Income - Short Term Plan - Wholesale – Growth
16 24,000,000 units of HDFC mutual fund under HDFC FMP 90D (VIII)(3) - Wholesale - Growth
17 62,847,681 units of HDFC mutual fund under HDFC Liquid - Premium Plan - Daily Dividend Reinvestment
18 303,956,967 units of HDFC mutual fund under HDFC Liquid - Premium Plan – Growth
19 41,003,276 units of HDFC mutual fund under HDFC Liquid - Premium Plus Plan - Weekly Dividend Reinvestment
20 23,586,686 units of HDFC mutual fund under HDFC Quarterly Interval -Plan B Wholesale Growth – Growth
21 106,509,667 units of HSBC mutual fund under HSBC Cash - Inst Plus - Daily Dividend Reinvestment
22 155,825,133 units of HSBC mutual fund under HSBC Cash - Inst Plus - Growth
23 146,239,354 units of HSBC mutual fund under HSBC Liquid Plus - IP - Daily Dividend Reinvestment
24 229,632,812 units of HSBC mutual fund under HSBC Liquid Plus - IP - Growth
25 150,719,932 units of ICICI Prudential mutual fund under ICICI Prudential Flexible Income Plan - Daily Dividend Reinvestment
26 208,534,658 units of ICICI Prudential mutual fund under ICICI Prudential Flexible Income Plan – Growth
27 32,963,479 units of ICICI Prudential mutual fund under ICICI Prudential FRF - Plan D – Growth
28 475,076,846 units of ICICI Prudential mutual fund under ICICI Prudential Inst Liquid Plan - Super Iinst - Daily Dividend Reinvestment
29 446,678,300 units of ICICI Prudential mutual fund under ICICI Prudential Inst Liquid Plan - Super Iinst – Growth
30 24,485,319 units of ICICI prudential mutual fund under ICICI Prudential Interval II Quarterly Interval Plan B - Retail Cumulative – Growth
31 49,165,296 units of IDFC mutual fund under IDFC Cash - Super Institutional Plan C - Daily Dividend Reinvestment
32 81,765,530 units of IDFC mutual fund under IDFC Floating Rate -LT-Inst Plan B – Growth
33 24,000,000 units of IDFC mutual fund under IDFC FMP Qtr Series 31 - Growth
34 64,428,611 units of IDFC mutual fund under IDFC Liquid Plus - Investment Plan - Inst Plan B - Daily Dividend Reinvestment
35 15,341,934 units of IDFC mutual fund under IDFC Quarterly Interval - Plan A - Inst - Daily Dividend Reinvestment
36 15,984,797 units of IDFC mutual fund under IDFC Quarterly Interval - Plan A - Inst – Growth
37 18,000,000 units of ING mutual fund under ING Interval - Quarterly-C-Institutional – Growth
38 115,482,014 units of ING mutual fund under ING Liquid Super Institutional – Growth
39 128,337,221 units of ING mutual fund under ING Liquid Plus - Institutional – Growth
40 23,518,230 units of ING mutual fund under ING Vysya Liquid Plus - IP - Growth
41 66,088,565 units of JP Morgan mutual fund under JP Morgan India Liquid Plus – Growth
42 20,913,377 units of Kotak Mahindra mutual fund under Kotak Liquid - Institutional Premium – Growth
43 3,165,849 units of Principal mutual fund under Principal Cash Mgmt LO- Institutional Plan – Growth
44 50,350,378 units of Principal mutual fund under Principal Cash Mgmt LO- Institutional Premium Plan - Daily Dividend Reinvestment
45 150,114,425 units of Principal mutual fund under Principal Floating Rate - FMP - Institutional - Daily Dividend Reinvestment
46 197,490,161 units of Principal mutual fund under Principal Floating Rate - FMP - Institutional – Growth
Schedules to the Financial Statements ContinuedSCHEDULE 20–NOTES TO ACCOUNTS(All amounts are in INR thousand unless, otherwise stated)
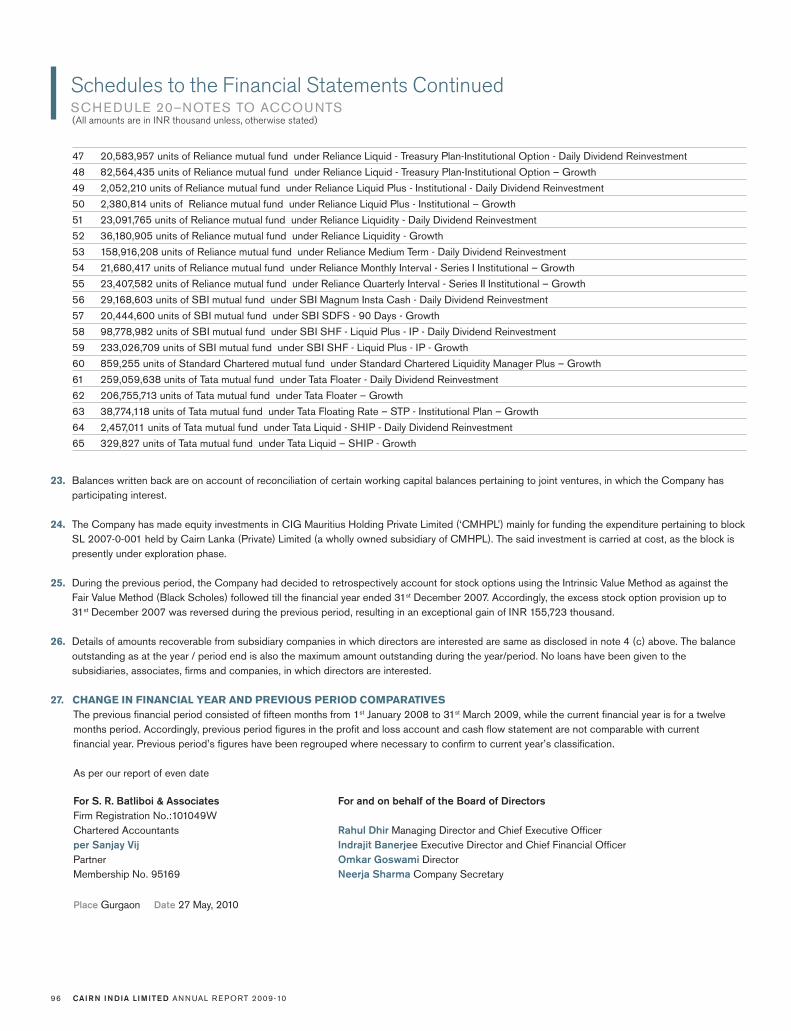
CAIRN INDIA LIMITED AN N UAL R E PORT 2009-1096
47 20,583,957 units of Reliance mutual fund under Reliance Liquid - Treasury Plan-Institutional Option - Daily Dividend Reinvestment
48 82,564,435 units of Reliance mutual fund under Reliance Liquid - Treasury Plan-Institutional Option – Growth
49 2,052,210 units of Reliance mutual fund under Reliance Liquid Plus - Institutional - Daily Dividend Reinvestment
50 2,380,814 units of Reliance mutual fund under Reliance Liquid Plus - Institutional – Growth
51 23,091,765 units of Reliance mutual fund under Reliance Liquidity - Daily Dividend Reinvestment
52 36,180,905 units of Reliance mutual fund under Reliance Liquidity - Growth
53 158,916,208 units of Reliance mutual fund under Reliance Medium Term - Daily Dividend Reinvestment
54 21,680,417 units of Reliance mutual fund under Reliance Monthly Interval - Series I Institutional – Growth
55 23,407,582 units of Reliance mutual fund under Reliance Quarterly Interval - Series II Institutional – Growth
56 29,168,603 units of SBI mutual fund under SBI Magnum Insta Cash - Daily Dividend Reinvestment
57 20,444,600 units of SBI mutual fund under SBI SDFS - 90 Days - Growth
58 98,778,982 units of SBI mutual fund under SBI SHF - Liquid Plus - IP - Daily Dividend Reinvestment
59 233,026,709 units of SBI mutual fund under SBI SHF - Liquid Plus - IP - Growth
60 859,255 units of Standard Chartered mutual fund under Standard Chartered Liquidity Manager Plus – Growth
61 259,059,638 units of Tata mutual fund under Tata Floater - Daily Dividend Reinvestment
62 206,755,713 units of Tata mutual fund under Tata Floater – Growth
63 38,774,118 units of Tata mutual fund under Tata Floating Rate – STP - Institutional Plan – Growth
64 2,457,011 units of Tata mutual fund under Tata Liquid - SHIP - Daily Dividend Reinvestment
65 329,827 units of Tata mutual fund under Tata Liquid – SHIP - Growth
23. Balances written back are on account of reconciliation of certain working capital balances pertaining to joint ventures, in which the Company has
participating interest.
24. The Company has made equity investments in CIG Mauritius Holding Private Limited (‘CMHPL’) mainly for funding the expenditure pertaining to block
SL 2007-0-001 held by Cairn Lanka (Private) Limited (a wholly owned subsidiary of CMHPL). The said investment is carried at cost, as the block is
presently under exploration phase.
25. During the previous period, the Company had decided to retrospectively account for stock options using the Intrinsic Value Method as against the
Fair Value Method (Black Scholes) followed till the fi nancial year ended 31st December 2007. Accordingly, the excess stock option provision up to
31st December 2007 was reversed during the previous period, resulting in an exceptional gain of INR 155,723 thousand.
26. Details of amounts recoverable from subsidiary companies in which directors are interested are same as disclosed in note 4 (c) above. The balance
outstanding as at the year / period end is also the maximum amount outstanding during the year/period. No loans have been given to the
subsidiaries, associates, fi rms and companies, in which directors are interested.
27. CHANGE IN FINANCIAL YEAR AND PREVIOUS PERIOD COMPARATIVES
The previous fi nancial period consisted of fi fteen months from 1st January 2008 to 31st March 2009, while the current fi nancial year is for a twelve
months period. Accordingly, previous period fi gures in the profi t and loss account and cash fl ow statement are not comparable with current
fi nancial year. Previous period’s fi gures have been regrouped where necessary to confi rm to current year’s classifi cation.
As per our report of even date
For S. R. Batliboi & Associates For and on behalf of the Board of Directors
Firm Registration No.:101049W
Chartered Accountants Rahul Dhir Managing Director and Chief Executive Offi cer
per Sanjay Vij Indrajit Banerjee Executive Director and Chief Financial Offi cer
Partner Omkar Goswami Director
Membership No. 95169 Neerja Sharma Company Secretary
Place Gurgaon Date 27 May, 2010
Schedules to the Financial Statements ContinuedSCHEDULE 20–NOTES TO ACCOUNTS(All amounts are in INR thousand unless, otherwise stated)

97
Balance Sheet Abstract and Company’s General Business Profi le
For and on behalf of the Board of Directors
Rahul Dhir Managing Director and Chief Executive Offi cer
Indrajit Banerjee Executive Director and Chief Financial Offi cer
Omkar Goswami Director
Neerja Sharma Company Secretary
Place Gurgaon Date 27 May, 2010
I) Registration Details
Registration No. L11101MH2006PLC163934
State Code 11
Balance Sheet Date 31/03/10
II) Capital raised during the year* (Amount in Rs. Thousands)
Public Issue -
Rights Issue -
Bonus Issue -
Private Placement (Includes stock options exercised) 3,063
*Does not include securities premium
III) Position of Mobilisation and Deployment of Funds (Amount in Rs. Thousands)
Total Liabilities 334,328,131
Total Assets 334,328,131
Source of Funds
Paid up Capital 18,969,741
Reserves & Surplus (Includes stock options outstanding) 301,625,200
Secured Loans 13,450,000
Unsecured Loans Nil
Application of Funds
Net Fixed Assets (Includes exploratory work-in-progress) 242,260
Investments 331,290,939
Net Current Assets 1,284,208
Miscellaneous Expenditure Nil
Accumulated losses 1,227,534
IV) Performance of the Company (Amount in Rs. Thousands)
Turnover (Total Income) 1,633,620
Total Expenditure 2,367,252
Profi t/(Loss) before tax (733,632)
Profi t/(Loss) after tax (689,534)
Profi t per Share in Rs. (Basic & Diluted) (0.36)
Dividend rate % Nil
V) Generic Names of Principal Products/Services of Company (as per monetary terms)
Item Code No. (ITC Code) 27090000
Product Description Crude Oil
Item Code No. (ITC Code) 27112100
Product Description Natural Gas

CAIRN INDIA LIMITED AN N UAL R E PORT 2009-1098
Auditor’s Report on Consolidated Financial Statements
To
The Board of Directors of Cairn India Limited
1. We have audited the attached Consolidated Balance Sheet of Cairn India Group, as at 31 March, 2010, and also the Consolidated Profi t and
Loss Account and the Consolidated Cash Flow Statement for the year ended on that date annexed thereto. These fi nancial statements are
the responsibility of the Cairn India Limited’s management. Our responsibility is to express an opinion on these fi nancial statements based
on our audit.
2. We conducted our audit in accordance with the auditing standards generally accepted in India. Those Standards require that we plan and
perform the audit to obtain reasonable assurance about whether the fi nancial statements are free of material misstatement. An audit includes
examining, on a test basis, evidence supporting the amounts and disclosures in the fi nancial statements. An audit also includes assessing the
accounting principles used and signifi cant estimates made by management, as well as evaluating the overall fi nancial statement presentation.
We believe that our audit provides a reasonable basis for our opinion.
3. The attached fi nancial statements include Cairn India Group’s share of net assets, expenses and cash fl ows aggregating to Rs. 799,846
thousand, Rs. 692,124 thousand and Rs. 9 thousand respectively in the unincorporated joint ventures not operated by the Company or its
subsidiaries, the accounts of which have been audited by the auditors of the respective unincorporated joint ventures and relied upon by us.
4. We report that the consolidated fi nancial statements have been prepared by the Cairn India Limited’s management in accordance with the
requirements of Accounting Standards (AS) 21, Consolidated fi nancial statements, notifi ed pursuant to the Companies (Accounting Standards)
Rules, 2006, (as amended).
5. In our opinion and to the best of our information and according to the explanations given to us, the consolidated fi nancial statements give a true
and fair view in conformity with the accounting principles generally accepted in India:
(a) in the case of the consolidated balance sheet, of the state of affairs of the Cairn India Group as at 31 March, 2010;
(b) in the case of the consolidated profi t and loss account, of the profi t for the year ended on that date; and
(c) in the case of the consolidated cash fl ow statement, of the cash fl ows for the year ended on that date.
For S.R. Batliboi & Associates
Firm registration number: 101049W
Chartered Accountants
per Sanjay Vij
Partner
Membership No.:95169
Place Gurgaon Date 27 May, 2010

99
Consolidated Balance SheetAS AT MARCH 31, 2010
(All amounts are in thousand Indian Rupees, unless otherwise stated)
Schedules As at March 31, 2010 As at March 31, 2009
Sources of Funds
Shareholders’ Funds
Share capital 1 18,969,741 18,966,678
Stock options outstanding 2 463,978 388,978
Reserves and surplus 3 319,249,603 308,667,596
338,683,322 328,023,252
Loan funds
Secured loans 4 34,007,131 222,402
Unsecured loans 5 - 43,341,500
34,007,131 43,563,902
Deferred tax liabilities (net) 6 4,619,418 5,623,782
377,309,871 377,210,936
Application of Funds
Fixed assets 7
Gross cost 2,227,578 1,434,686
Less: Accumulated depreciation / amortisation 958,067 801,843
Net book value 1,269,511 632,843
Exploration, Development and
Site-restoration costs8
Cost of producing facilities (net) 4,994,770 3,013,742
Exploratory & development work in progress 91,634,579 62,027,323
Net book value 96,629,349 65,041,065
Goodwill 253,192,675 253,192,675
Investments 9 17,124,133 1,712,806
Deferred tax assets (net) 6 166,215 83,935
Current assets, loans and advances
Inventories 10 2,909,438 1,682,808
Sundry debtors 11 3,067,474 1,516,418
Cash and bank balances 12 9,294,240 65,270,674
Other current assets 13 144,586 704,244
Loans and advances 14 8,317,866 3,505,102
23,733,604 72,679,246
Less: Current liabilities and provisions
Current liabilities 15 9,868,645 11,794,353
Provisions 16 4,936,971 4,337,281
14,805,616 16,131,634
Net Current assets 8,927,988 56,547,612
377,309,871 377,210,936
Notes to accounts 25
The schedules referred to above are an integral part of the consolidated balance sheet.
As per our report of even date
For S. R. Batliboi & Associates For and on behalf of the Board of Directors
Firm Registration No.:101049W
Chartered Accountants Rahul Dhir Managing Director and Chief Executive Offi cer
per Sanjay Vij Indrajit Banerjee Executive Director and Chief Financial Offi cer
Partner Omkar Goswami Director
Membership No. 95169 Neerja Sharma Company Secretary
Place Gurgaon Date 27 May, 2010
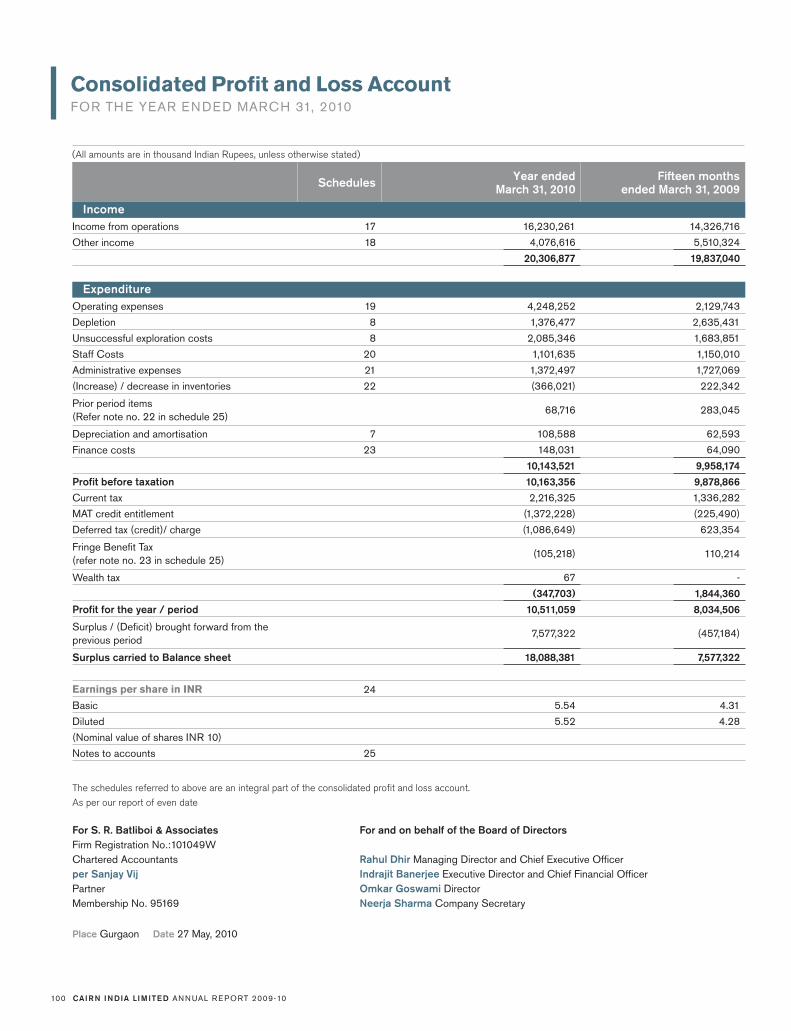
CAIRN INDIA LIMITED AN N UAL R E PORT 2009-10100
The schedules referred to above are an integral part of the consolidated profi t and loss account.
As per our report of even date
For S. R. Batliboi & Associates For and on behalf of the Board of Directors
Firm Registration No.:101049W
Chartered Accountants Rahul Dhir Managing Director and Chief Executive Offi cer
per Sanjay Vij Indrajit Banerjee Executive Director and Chief Financial Offi cer
Partner Omkar Goswami Director
Membership No. 95169 Neerja Sharma Company Secretary
Place Gurgaon Date 27 May, 2010
(All amounts are in thousand Indian Rupees, unless otherwise stated)
Consolidated Profi t and Loss AccountFOR THE YEAR ENDED MARCH 31, 2010
Schedules Year ended
March 31, 2010
Fifteen months
ended March 31, 2009
Income
Income from operations 17 16,230,261 14,326,716
Other income 18 4,076,616 5,510,324
20,306,877 19,837,040
Expenditure
Operating expenses 19 4,248,252 2,129,743
Depletion 8 1,376,477 2,635,431
Unsuccessful exploration costs 8 2,085,346 1,683,851
Staff Costs 20 1,101,635 1,150,010
Administrative expenses 21 1,372,497 1,727,069
(Increase) / decrease in inventories 22 (366,021) 222,342
Prior period items
(Refer note no. 22 in schedule 25) 68,716 283,045
Depreciation and amortisation 7 108,588 62,593
Finance costs 23 148,031 64,090
10,143,521 9,958,174
Profi t before taxation 10,163,356 9,878,866
Current tax 2,216,325 1,336,282
MAT credit entitlement (1,372,228) (225,490)
Deferred tax (credit)/ charge (1,086,649) 623,354
Fringe Benefi t Tax
(refer note no. 23 in schedule 25) (105,218) 110,214
Wealth tax 67 -
(347,703) 1,844,360
Profi t for the year / period 10,511,059 8,034,506
Surplus / (Defi cit) brought forward from the
previous period 7,577,322 (457,184)
Surplus carried to Balance sheet 18,088,381 7,577,322
Earnings per share in INR 24
Basic 5.54 4.31
Diluted 5.52 4.28
(Nominal value of shares INR 10)
Notes to accounts 25

101
Year ended
March 31, 2010
Fifteen months ended
March 31, 2009
Cash fl ow from operating activities
Profi t before taxation for the year / period 10,163,356 9,878,866
Adjustments for
- Employee compensation expense (equity settled stock
options) - net of exceptional gains 89,175 107,292
- Depreciation and depletion 1,780,276 2,949,665
- Loss / (Profi t) on sale / discard of fi xed assets (net) (313) 1,835
- Unsuccessful exploration costs 2,085,346 1,683,851
- Share issue expenses - 208,410
- Unrealised exchange loss / (gain) on restatement of assets
and liabilities (net) (2,604,018) (1,710,402)
- Interest expense 59,518 79,436
- Profi t on sale of non trade current investments (net) (2,385) (1,245,686)
- Interest income (1,375,578) (1,858,924)
- Dividend from investments (224,461) (221,876)
- Loan facility and management fees 103,834 -
- Unrealised loss on option contracts - 112,973
- Balances written back (net) (143,360) (143,285)
Operating profi t before working capital changes 9,931,390 9,842,155
Movements in working capital:
(Increase)/decrease in inventories (1,226,630) (466,761)
(Increase)/decrease in debtors (1,598,096) (108,344)
(Increase)/decrease in loans and advances and other
current assets (3,050,580) 186,699
Increase/(decrease) in current liabilities and provisions (1,206,652) 1,684,424
Cash generated from operations 2,849,432 11,138,173
Current tax/FBT paid (net of refunds) (1,752,558) (1,457,679)
Net cash from operating activities (A) 1,096,874 9,680,494
Cash fl ow from investing activities
Payments made for exploration, development activities and
purchase of fi xed assets (33,662,150) (30,133,147)
Short term investments in mutual funds (net) (15,416,641) 6,661,791
Fixed deposits made (16,716,524) (43,410,755)
Proceeds from matured fi xed deposits 57,327,022 11,686,817
Proceeds from sale of fi xed assets 313 202
Interest received 2,138,135 1,240,524
Dividend from short term investments received 222,195 -
Dividend from long term investments received - 216,589
Net cash used in investing activities (B) (6,107,650) (53,737,979)
Cash fl ow from fi nancing activities
Proceeds from issue of equity shares (including securities
premium) 20,363 25,523,445
Payments made for share issue expenses - (208,410)
Finance lease taken 9,406 175,645
Repayment of fi nance lease (91,483) (124,838)
Proceeds from long term borrowings 34,604,616 37,620,170
Repayment of long term borrowings (41,409,564) -
Loan facility and management fees paid (1,908,255) -
Consolidated Statement of Cash FlowsFOR THE YEAR ENDED MARCH 31, 2010
(All amounts are in thousand Indian Rupees, unless otherwise stated)

CAIRN INDIA LIMITED AN N UAL R E PORT 2009-10102
Interest paid (1,678,228) (1,464,603)
Net cash from/(used in) fi nancing activities (C) (10,453,145) 61,521,409
Net increase/(decrease) in cash and cash
equivalents (A+B+C) (15,463,921) 17,463,924
Cash and cash equivalents at the beginning of the year/ period 21,732,635 1,503,807
Cash and cash equivalents at the end of the year/ period 6,268,714 18,967,731
Unrealised exchange differences on closing cash and
cash equivalents 97,984 2,764,904
Cash and cash equivalents as per cash fl ow statement 6,366,698 21,732,635
Components of cash and cash equivalents as at March 31, 2010 March 31, 2009
Cash in hand 452 626
Balances with banks
on current accounts 390,057 228,024
on site restoration fund 143,703 -
on deposit accounts 8,760,028 65,042,024
Less: Deposits having maturity of over 90 days (2,927,542) (43,538,039)
6,366,698 21,732,635
Notes
i) The above Cash Flow Statement has been prepared under the ‘Indirect Method’ as set out in Accounting Standard-3 on “Cash fl ow statements”.
ii) Amounts in bracket indicate a cash outfl ow or reduction.
iii) Bank balance in deposit accounts includes INR 1,955,866 thousand, previous period INR 3,312,342 thousand, pledged with the banks.
As per our report of even date
For S. R. Batliboi & Associates For and on behalf of the Board of Directors
Firm Registration No.:101049W
Chartered Accountants Rahul Dhir Managing Director and Chief Executive Offi cer
per Sanjay Vij Indrajit Banerjee Executive Director and Chief Financial Offi cer
Partner Omkar Goswami Director
Membership No. 95169 Neerja Sharma Company Secretary
Place Gurgaon Date 27 May, 2010
Consolidated Statement of Cash Flows Continued
Year ended
March 31, 2010
Fifteen months ended
March 31, 2009
(All amounts are in thousand Indian Rupees, unless otherwise stated)

103
Notes
i) Issued, subscribed and fully paid up share capital includes 1,183,243,791 equity shares (previous period - 1,226,843,791 equity shares) of INR 10 each
held by Cairn UK Holdings Limited, the holding company, together with its nominees.
ii) Shares held by the holding company include 861,764,893 equity shares (previous period - 861,764,893 equity shares) of INR 10 each, allotted as fully
paid up pursuant to contracts for consideration other than cash.
iii) For stock options outstanding, refer note no. 7 in schedule 25.
Schedules to the Consolidated Financial Statements
As at
March 31, 2010
As at
March 31, 2009
Schedule 1
Share capital
Authorised:
2,250,000,000 (previous period 2,250,000,000) equity shares of
INR 10 each22,500,000 22,500,000
Issued, Subscribed and Paid up:
1,896,974,132 (previous period 1,896,667,816) equity shares of INR 10 each 18,969,741 18,966,678
18,969,741 18,966,678
Schedule 2
Stock options outstanding
Employee stock options outstanding 768,120 782,548
Less: Deferred employee compensation outstanding (304,142) (393,570)
Closing Balance 463,978 388,978
Schedule 3
Reserves and surplus
Securities premium account
Opening Balance 301,090,274 276,084,115
Add: Additions during the year/ period (refer note no. 14 in schedule 25) 70,948 25,006,159
Closing Balance 301,161,222 301,090,274
Profi t and Loss Account 18,088,381 7,577,322
319,249,603 308,667,596
Schedule 4
Secured loans
Finance lease liabilities (refer note no. 8 in schedule 25) 140,325 222,402
Long term loans (refer note no. 18 in schedule 25)
- from fi nancial institutions 5,092,111 -
- from banks 28,774,695 -
34,007,131 222,402
Schedule 5
Unsecured loans
Long term loans
- from fi nancial institutions - 7,648,500
- from banks - 35,693,000
- 43,341,500
(All amounts are in thousand Indian Rupees, unless otherwise stated)

CAIRN INDIA LIMITED AN N UAL R E PORT 2009-10104
As at
March 31, 2010
As at
March 31, 2009
(All amounts are in thousand Indian Rupees, unless otherwise stated)
Schedules to the Consolidated Financial Statements Continued
Schedule 6
Deferred tax asset / liabilities (net)
Effect of differences in block of fi xed assets/exploration and development
assets as per tax books and fi nancial books5,005,074 6,178,716
Gross deferred tax liabilities 5,005,074 6,178,716
Effect of lease accounting 7,877 8,972
Expenditure debited to profi t and loss account but allowed for tax purposes in following years 543,994 629,897
Gross deferred tax assets 551,871 638,869
Net deferred tax liabilities * 4,453,203 5,539,847
* After setting off net deferred tax assets aggregating to INR 166,215 thousand, previous period INR 83,935
thousand in respect of certain group companies
Notes
i) Furniture and fi ttings includes Leasehold improvements of INR 282,259 thousand (previous period INR 278,895 thousand), accumulated depreciation
thereon INR 168,063 thousand (previous period INR 110,482 thousand).
ii) Furniture and fi ttings and Offi ce equipments of INR 281,634 thousand (previous period INR 278,271 thousand) and INR 100,733 thousand (previous period
INR 210,192 thousand) respectively have been acquired under fi nance lease. The depreciation charge for the year/ period on these assets is INR 57,556
thousand (previous period INR 60,569 thousand) and INR 27,197 thousand (previous period INR 61,040 thousand) respectively and the accumulated depre-
ciation thereon is INR 167,910 thousand (previous period INR 110,355 thousand) and INR 43,514 thousand (previous period INR 139,781 thousand) respectively.
iii) Depreciation charge for the year/period includes INR 295,211 thousand (previous period INR 251,640 thousand) allocated to joint ventures.
iv) Fixed assets include INR 996,883 thousand (previous period INR 169,471 thousand) jointly owned with the joint venture partners. Accumulated depreciation on
these assets is INR 131,109 thousand (previous period INR 78,560 thousand) and net book value is INR 865,773 thousand (previous period INR 90,911 thousand).
Schedule 7
Fixed Assets
Description Gross Block Accumulated Depreciation / Amortisation Net Block
As on
01.04.2009 Additions Deletions
As on
31.03.2010
As on
01.04.2009
For the
year/period Deletions
As on
31.03.2010
As on
31.03.2010
As on
31.03.2009
A) Tangible Assets
Freehold land 43,583 - - 43,583 - - - - 43,583 43,583
Buildings 5,247 5,042 - 10,289 2,333 782 - 3,115 7,174 2,914
Plant and machinery - 777,549 - 777,549 - 21,845 - 21,845 755,704 -
Offi ce equipments 512,022 122,898 (165,296) 469,624 344,439 112,124 (165,165) 291,398 178,226 167,583
Furniture and fi ttings 299,870 13,080 (1,454) 311,496 126,760 61,319 (1,454) 186,625 124,871 173,110
Vehicles 10,983 582 - 11,565 2,660 2,608 - 5,268 6,297 8,323
B) Intangible Assets
Computer software 562,981 121,447 (80,956) 603,472 325,651 205,121 (80,956) 449,816 153,656 237,330
Grand Total 1,434,686 1,040,598 (247,706) 2,227,578 801,843 403,799 (247,575) 958,067 1,269,511 632,843
Previous period 1,092,632 462,608 (120,554) 1,434,686 606,126 314,233 (118,516) 801,843 632,843 486,506

105
Schedule 9
Investments
Long term investments (at cost)
Quoted and non-trade
Nil (previous period 755,275) equity shares of INR 10/- each fully paid up
in Videocon Industries Limited - 105,334
Current Investments (at lower of cost and market value)
Quoted and non-trade
755,275 (previous period Nil) equity shares of INR 10/- each fully paid up
in Videocon Industries Limited 105,334 -
Unquoted and non trade
Mutual Funds 17,018,799 1,607,472
17,124,133 1,712,806
Schedule 10
Inventories
Stores and spares 2,456,383 1,595,774
Finished goods 453,055 87,034
2,909,438 1,682,808
Schedule 11
Sundry Debtors
Debts - Unsecured and outstanding for a period exceeding six months :
- Considered good 78,687 94,261
Other unsecured debts :
- Considered good 2,988,787 1,422,157
3,067,474 1,516,418
Schedules to the Consolidated Financial Statements Continued
Schedule 8
Exploration, Development and Site restoration costs
Opening balance of producing properties 3,013,742 4,389,517
Additions / deletions / transfer for the year / period 3,357,505 1,259,656
6,371,247 5,649,173
Less: Depletion 1,376,477 2,635,431
Net producing properties 4,994,770 3,013,742
Opening balance of exploratory & development work in progress 62,027,323 24,670,264
Additions / deletions / transfer for the year / period 31,692,602 39,040,910
Less: Unsuccessful exploration costs for the year/ period 2,085,346 1,683,851
Exploration and Development work in progress 91,634,579 62,027,323
Net book value 96,629,349 65,041,065
Note Additions for the year includes borrowing costs (net of income on temporary investments INR 125,203 thousand, previous period INR 241,350 thousand)
aggregating to INR 2,442,547 thousand (previous period INR 1,620,043 thousand).
As at
March 31, 2010
As at
March 31, 2009
(All amounts are in thousand Indian Rupees, unless otherwise stated)

CAIRN INDIA LIMITED AN N UAL R E PORT 2009-10106
Schedule 12
Cash and bank balances
Cash in hand 452 626
Balances with banks:
- on current accounts 390,057 228,024
- on deposit accounts (including deposits with maturity of more than 3 months)* 8,760,028 65,042,024
- on site restoration fund 143,703 -
9,294,240 65,270,674
* includes INR 1,955,866 thousand, previous period INR 3,312,342 thousand, pledged with the banks
Schedule 13
Other Current Assets
Interest accrued on bank deposits 23,285 660,639
Dividend receivable 7,553 -
Outstanding option contracts 113,748 43,605
144,586 704,244
Schedule 14
Loans and advances
Unsecured and considered good, unless otherwise stated:
Advances recoverable in cash or in kind or for value to be received* 10,463,960 5,789,515
Deposits 197,740 169,469
Advance tax and tax deducted at source, net of tax provisions INR 3,697,411 thousand
(previous period INR 1,921,505 thousand) 365,392 599,367
MAT credit entitlement 950,733 -
Fringe benefi t tax paid (net of provisions INR 394,040 thousand, previous period INR
266,883 thousand) 4,329 13,290
11,982,154 6,571,641
Less: Provision for doubtful advances (3,664,288) (3,066,539)
8,317,866 3,505,102
*includes doubtful balances INR 3,664,288 thousand (previous period INR 3,066,539 thousand) and also capital advances INR 549,799 thousand
(previous period INR 835,486 thousand)
Schedule 15
Current liabilities
Amount payable to Cairn Energy Plc., the ultimate holding company 1,773 1,296,164
Sundry creditors 8,652,475 8,647,926
Lease equalisation liability 12,250 9,279
Interest accrued but not due 7,838 94,471
Other liabilities 1,194,309 1,746,513
9,868,645 11,794,353
Schedules to the Consolidated Financial Statements Continued
As at
March 31, 2010
As at
March 31, 2009
(All amounts are in thousand Indian Rupees, unless otherwise stated)

107
Schedule 16
Provisions
Provision for taxation (net of advance tax - INR 576,716 thousand, previous period INR 356,794
thousand) 52,031 250,643
Provision for fringe benefi t tax (net of advance tax payments INR Nil, previous
period - INR 127,956 thousand) - 105,235
Site restoration provision * 4,466,429 3,886,882
Provision for Government share of profi t petroleum ** - 11,444
Provision for leave encashment 22,840 16,305
Provision for gratuity 64,879 39,571
Provision for employee stock options (cash settled) *** 330,792 27,201
4,936,971 4,337,281
* Site restoration provision
Opening balance 3,886,882 2,714,913
Additions for the year /period 579,547 1,388,000
Reversed during the year /period - (216,031)
Closing balance 4,466,429 3,886,882
** Provision for Government share of profi t petroleum
Opening Balance 11,444 362,382
Additions for the year /period - 26,453
Written back during the year /period (11,444) -
Payments during the year /period - (377,391)
Closing Balance - 11,444
*** Provision for employee stock options (cash settled)
Opening Balance 27,201 -
Additions for the year /period 451,596 27,201
Payments during the year /period (144,762) -
Reversed during the year /period (3,243) -
Closing Balance 330,792 27,201
Schedule 17Year Ended
March 31, 2010
Fifteen Months
ended March 31, 2009
Income from operations
Revenue from sale of oil, gas and condensate 22,018,998 24,476,702
Less: Government share of Profi t Petroleum (6,396,752) (10,829,219)
15,622,246 13,647,483
Tolling income 41,406 50,391
Income received as operator from joint venture 566,609 628,842
16,230,261 14,326,716
Schedule 18
Other income
Interest on bank deposits 1,375,578 1,858,924
Profi t on sale of non trade current investments (net) 2,385 1,245,686
Dividend income from non trade current investments 222,195 216,589
Schedules to the Consolidated Financial Statements Continued
As at
March 31, 2010
As at
March 31, 2009
(All amounts are in thousand Indian Rupees, unless otherwise stated)

CAIRN INDIA LIMITED AN N UAL R E PORT 2009-10108
Dividend income from non trade long term investments 2,266 5,287
Exchange fl uctuation (net)* 2,325,709 1,884,830
Miscellaneous income 4,810 -
Profi t on sale of fi xed assets (net) 313 -
Balances written back (net) 143,360 143,285
Exceptional gain (refer note no. 24 in schedule 25) - 155,723
4,076,616 5,510,324
* Includes net gain on derivative contracts INR 450,547 thousand (previous period after setting off loss of INR 434,328 thousand).
Schedule 19
Operating expenses
Production expenses 1,130,815 821,016
Arbitration costs 71,431 7,582
Transportation expenses 1,198,660 123,912
Data acquisition and analysis 328,887 66,266
Insurance 52,164 56,677
Royalty 241,351 393,787
Cess 1,148,496 546,365
Production bonus 76,448 114,138
4,248,252 2,129,743
Schedule 20
Staff costs
Salaries, wages and bonus 3,763,973 3,359,347
Employee compensation expense (stock options) 537,529 454,546
Contribution to provident fund 177,970 97,356
Contribution to superannuation fund 68,753 53,226
Compensated absences 7,895 29,916
Gratuity expenses 53,570 40,888
Staff welfare expenses 325,567 329,288
4,935,257 4,364,567
Less: Cost allocated to joint ventures (3,833,622) (3,214,557)
1,101,635 1,150,010
Schedule 21
Administrative expenses
Contract employee charges 439,319 1,295,828
Legal and professional expenses 1,345,401 1,489,900
Share issue expenses - 208,410
Repairs and maintenance 275,984 260,933
Rent 305,214 455,648
Travelling and conveyance expenses 357,480 511,320
Communication expenses 158,900 150,906
Insurance 860 3,127
Inauguration expenses 93,149 -
Loss on sale / discard of fi xed assets (net) - 1,835
Miscellaneous expenses 334,943 357,706
3,311,250 4,735,613
Less: Cost allocated to joint ventures (1,938,753) (3,008,544)
1,372,497 1,727,069
Schedules to the Consolidated Financial Statements Continued
Year Ended
March 31, 2010
Fifteen Months
ended March 31, 2009
(All amounts are in thousand Indian Rupees, unless otherwise stated)

109
Schedule 22
(Increase) / Decrease in inventories
Inventories at the beginning of the year/ period
Finished goods 87,034 309,376
Inventories at the end of the year/period
Finished goods 453,055 87,034
(366,021) 222,342
Schedule 23
Finance costs
Interest
-on term loan 17,807 -
-others 11,681 38,581
-fi nance lease charges 30,030 40,855
Loan facility and management fees 103,834 -
Bank charges 12,153 20,734
175,505 100,170
Less: Cost allocated to joint ventures (27,474) (36,080)
148,031 64,090
Schedule 24
Earnings Per Share
Profi t for the year/period as per profi t and loss account 10,511,059 8,034,506
Weighted average number of equity shares in calculating basic earnings per share 1,896,696,475 1,866,146,993
Add: Number of equity shares arising on grant of stock options 8,321,392 10,052,076
Weighted average number of equity shares in calculating diluted earnings per share 1,905,017,867 1,876,199,069
Earnings per share in INR
Basic 5.54 4.31
Diluted 5.52 4.28
Year Ended
March 31, 2010
Fifteen Months
ended March 31, 2009
(All amounts are in thousand Indian Rupees, unless otherwise stated)
Schedules to the Consolidated Financial Statements Continued

CAIRN INDIA LIMITED AN N UAL R E PORT 2009-10110
(All amounts are in INR thousand unless, otherwise stated)
NATURE OF OPERATIONS1.
Cairn India Limited (‘the Company’) was incorporated in India on August 21, 2006 and is a subsidiary of Cairn UK Holdings Limited, which in turn is a
wholly owned subsidiary of Cairn Energy Plc., UK which is listed on London Stock Exchange.
The Company is primarily engaged in the business of surveying, prospecting, drilling, exploring, acquiring, developing, producing, maintaining,
refi ning, storing, trading, supplying, transporting, marketing, distributing, importing, exporting and generally dealing in minerals, oils, petroleum,
gas and related by-products and other activities incidental to the above. As part of its business activities, the Company also holds interests in its
subsidiary companies which have been granted rights to explore and develop oil exploration blocks in the Indian sub-continent.
The Company along with its subsidiaries is hereinafter collectively referred to as ‘Cairn India Group’. The entities under the Cairn India Group
are participants in various Oil and Gas blocks/fi elds (which are in the nature of jointly controlled assets), granted by the Government of India/Sri
Lanka through Production Sharing Contract (‘PSC’)/Production Resources Agreement (‘PRA’) entered into between these entities and Government
of India/Sri Lanka and other venture partners.
COMPONENTS OF THE CAIRN INDIA GROUP2.
The Consolidated Financial Statements represent consolidation of accounts of the Company and its subsidiaries as detailed below:
Schedules to the Consolidated Financial Statements ContinuedSCHEDULE 25–NOTES TO ACCOUNTS
S. No. Name of the Subsidiaries Country of Incorporation
1 Cairn Energy Australia Pty Limited Australia
2 Cairn Energy India Pty Limited Australia
3 CEH Australia Pty Limited Australia
4 Cairn Energy Asia Pty Limited Australia
5 Sydney Oil Company Pty Limited Australia
6 Cairn Energy Investments Australia Pty Limited Australia
7 Wessington Investments Pty Limited Australia
8 CEH Australia Limited British Virgin Islands
9 Cairn India Holdings Limited (‘CIHL’) Jersey
10 CIG Mauritius Holding Private Limited (‘CMHPL’) Mauritius
11 CIG Mauritius Private Limited Mauritius
12 Cairn Energy Holdings Limited United Kingdom
13 Cairn Energy Discovery Limited United Kingdom
14 Cairn Exploration (No. 2) Limited United Kingdom
15 Cairn Exploration (No. 6) Limited United Kingdom
16 Cairn Energy Hydrocarbons Limited United Kingdom
17 Cairn Petroleum India Limited United Kingdom
18 Cairn Energy Gujarat Block 1 Limited United Kingdom
19 Cairn Exploration (No. 4) Limited United Kingdom
20 Cairn Exploration (No. 7) Limited United Kingdom
21 Cairn Energy Development Pte Limited Singapore
22 Cairn Lanka (Pvt) Limited Sri Lanka
23 Cairn Energy Group Holdings BV Netherlands
24 Cairn Energy India West BV Netherlands
25 Cairn Energy India West Holding BV Netherlands
26 Cairn Energy Gujarat Holding BV Netherlands
27 Cairn Energy India Holdings BV Netherlands
28 Cairn Energy Netherlands Holdings BV Netherlands
29 Cairn Energy Gujarat BV Netherlands
30 Cairn Energy Cambay BV Netherlands
31 Cairn Energy Cambay Holding BV Netherlands

111
CIHL and CMHPL are wholly owned subsidiaries of the Company. All other abovementioned companies are direct or indirect wholly owned
subsidiaries of either CIHL or CMHPL.
Cairn India Group has interest in the following Oil & Gas blocks/fi elds:
STATEMENT OF SIGNIFICANT ACCOUNTING POLICIES3.
Basis of preparation(A)
The fi nancial statements have been prepared to comply in all material respects with the mandatory Accounting Standards notifi ed under the
Companies (Accounting Standard) Rules, 2006 under the historical cost convention and on an accrual basis. The accounting policies, in all material
respects, have been consistently applied by Cairn India Group and are consistent with those used in the previous period.
Principles of consolidation:
The consolidated fi nancial statements relate to the Cairn India Group. In the preparation of these consolidated fi nancial statements, investments
in subsidiaries have been accounted for in accordance with the provisions of Accounting Standard-21 (Consolidated Financial Statements). The
fi nancial statements of the subsidiaries have been drawn up to the same reporting date as of Cairn India Limited. The Consolidated Financial
Statements are prepared on the following basis:
The fi nancial statements of the Company and its subsidiary companies are consolidated on a line-by-line basis by adding together the 1
book values of the like items of assets, liabilities, income and expenses after eliminating all signifi cant intra-group balances and intra-group
transactions and also unrealised profi ts or losses in accordance with Accounting Standard-21 (Consolidated Financial Statements).
The Consolidated Financial Statements are prepared using uniform accounting policies for like transactions and other events in similar 2
circumstances and are presented, to the extent possible, in the same manner as the Company’s separate fi nancial statements. The fi nancial
statements of the subsidiaries are adjusted for the accounting principles and policies followed by the Company.
The difference between the cost to the Company of its investment in subsidiaries and its proportionate share in the equity of the investee 3
company at the time of acquisition of shares in the subsidiaries is recognized in the fi nancial statements as Goodwill or Capital Reserve, as
the case may be. Goodwill is tested for impairment by the management on each reporting date.
Oil and gas assets(B)
Cairn India Group follows the successful efforts method of accounting for oil and gas assets as set out by the Guidance Note issued by the Institute
of Chartered Accountants of India (ICAI) on “Accounting for Oil and Gas Producing Activities”.
Expenditure incurred on the acquisition of a license interest is initially capitalised on a license by license basis. Costs are held, undepleted,
within exploratory & development work in progress until the exploration phase relating to the license area is complete or commercial oil and gas
reserves have been discovered.
Exploration expenditure incurred in the process of determining exploration targets which cannot be directly related to individual exploration
wells is expensed in the period in which it is incurred.
Schedules to the Consolidated Financial Statements ContinuedSCHEDULE 25–NOTES TO ACCOUNTS
Oil & Gas blocks/fi elds Area Participating Interest
Operated block
Ravva block Krishna Godavari 22.50%
CB-OS/2 – Exploration Cambay Offshore 60%
CB-OS/2 - Development & production Cambay Offshore 40%
RJ-ON-90/1 – Exploration Rajasthan Onshore 100%
RJ-ON-90/1 – Development & production Rajasthan Onshore 70%
PR-OSN-2004 Palar Basin offshore 35%
SL 2007-01-001 North West Sri Lanka offshore 100%
KG-ONN-2003/1 Krishna Godavari Onshore 49%
Following blocks have been relinquished
GV-ONN-2002/1 in July 2009 Ganga Valley Onshore 50%
VN-ONN-2003/1 in Aug 2009 Vindhyan Onshore 49%
GV-ONN-2003/1 in Feb 2010 Ganga Valley Onshore 24%
Non – operated block
KG-DWN-98/2 Krishna Godavari Deep water 10%
GS-OSN-2003/1 Gujarat Saurashtra Onshore 49%
KK-DWN-2004 Kerala Konkan Basin offshore 40%
Following blocks have been relinquished
GV-ONN-97/1 in 2008 Ganga Valley Onshore 15%
CB-ONN-2002/1 in Jan 2009 Cambay Onshore 30%
RJ-ONN-2003/1 in Jan 2010 Rajasthan Onshore 30%
(All amounts are in INR thousand unless, otherwise stated)

CAIRN INDIA LIMITED AN N UAL R E PORT 2009-10112
Schedules to the Consolidated Financial Statements ContinuedSCHEDULE 25–NOTES TO ACCOUNTS(All amounts are in INR thousand unless, otherwise stated)
Exploration/appraisal drilling costs are initially capitalised within exploratory and development work in progress on a well by well basis until the
success or otherwise of the well has been established. The success or failure of each exploration/appraisal effort is judged on a well by well basis.
Drilling costs are written off on completion of a well unless the results indicate that oil and gas reserves exist and there is a reasonable prospect that
these reserves are commercial.
Where results of exploration drilling indicate the presence of oil and gas reserves which are ultimately not considered commercially
viable, all related costs are written off to the profi t and loss account. Following appraisal of successful exploration wells, when a well is ready for
commencement of commercial production, the related exploratory and development work in progress are transferred into a single fi eld cost centre
within producing properties, after testing for impairment.
Where costs are incurred after technical feasibility and commercial viability of producing oil and gas is demonstrated and it has been
determined that the wells are ready for commencement of commercial production, they are capitalised within producing properties for each cost
centre. Subsequent expenditure is capitalised when it enhances the economic benefi ts of the producing properties or replaces part of the existing
producing properties. Any costs remaining associated with such part replaced are expensed in the fi nancial statements.
Net proceeds from any disposal of an exploration asset within exploratory and development work in progress are initially credited against
the previously capitalised costs and any surplus proceeds are credited to the profi t and loss account. Net proceeds from any disposal of producing
properties are credited against the previously capitalised cost and any gain or loss on disposal of producing properties is recognised in the profi t and
loss account, to the extent that the net proceeds exceed or are less than the appropriate portion of the net capitalised costs of the asset.
Depletion(C)
The expenditure on producing properties is depleted within each cost centre
Depletion is charged on a unit of production basis, based on proved reserves for acquisition costs and proved and developed reserves for
other costs.
Site restoration costs(D)
At the end of the producing life of a fi eld, costs are incurred in restoring the site of production facilities. Cairn India Group recognizes the full cost of
site restoration as a liability when the obligation to rectify environmental damage arises. The site restoration expenses form part of the exploration &
development work in progress or cost of producing properties, as the case may be, of the related asset. The amortization of the asset, calculated on
a unit of production basis based on proved and developed reserves, is included in the depletion cost in the profi t and loss account.
Impairment(E)
The carrying amounts of assets are reviewed at each balance sheet date if there is any indication of impairment based on internal/external 1
factors. An impairment loss is recognized where the carrying amount of an asset exceeds its recoverable amount. The recoverable amount
is the greater of the asset’s net selling price and value in use. In assessing value in use, the estimated future cash fl ows are discounted to
their present value at the weighted average cost of capital.
After impairment, depreciation/depletion is provided in subsequent periods on the revised carrying amount of the asset over its remaining 2
useful life.
Tangible fi xed assets, depreciation and amortization(F)
Tangible assets are stated at cost less accumulated depreciation and impairment losses, if any. Cost comprises the purchase price and any
attributable cost of bringing the asset to its working condition for its intended use. Borrowing costs relating to acquisition of fi xed assets which take a
substantial period of time to get ready for its intended use are also included to the extent they relate to the period till such assets are ready to be put
to use.
Depreciation is provided using the Straight Line Method as per the useful lives of the assets estimated by the management, or at the rates
prescribed under Schedule XIV of the Companies Act 1956, whichever is higher. The expected useful economic lives are as follows:
Vehicles 2 to 5 years
Freehold buildings 10 years
Computers 2 to 5 years
Furniture and fi xtures 2 to 5 years
Offi ce equipments 2 to 5 years
Plant and Equipment 2 to 10 years
Leasehold land Lease period
Leasehold improvements are amortized over the remaining period of the primary lease or expected useful economic lives, whichever is shorter.
Intangible fi xed assets and amortization(G)
Intangible assets, other than oil and gas assets, have fi nite useful lives and are measured at cost and amortized over their expected useful economic
lives as follows:
Computer software 2 to 4 years
Goodwill arising on acquisition is capitalized and is tested for impairment.
Leases(H)
Finance leases, which effectively transfer substantially all the risks and benefi ts incidental to ownership of the leased item, are capitalised at the lower
of the fair value and present value of the minimum lease payments at the inception of the lease term and disclosed as leased assets. Lease payments

113
Schedules to the Consolidated Financial Statements ContinuedSCHEDULE 25–NOTES TO ACCOUNTS(All amounts are in INR thousand unless, otherwise stated)
are apportioned between the fi nance charges and reduction of the lease liability based on the implicit rate of return. Finance charges are charged
directly against income. Lease management fees, legal charges and other initial direct costs are capitalised.
If there is no reasonable certainty that Cairn India Group will obtain the ownership by the end of the lease term, capitalised leased assets are
depreciated over the shorter of the estimated useful life of the asset or the lease term.
Leases where the lessor effectively retains substantially all the risks and benefi ts of ownership of the leased item, are classifi ed as operating
leases. Operating lease payments are recognised as an expense in the profi t and loss account on a straight-line basis over the lease term.
Investments(I)
Investments that are readily realisable and intended to be held for not more than a year are classifi ed as current investments. All other investments
are classifi ed as long-term investments. Current investments are measured at cost or market value, whichever is lower, determined on an individual
investment basis. Long term investments are measured at cost. However, provision for diminution in value is made to recognise a decline other than
temporary in the value of the investments.
Inventory(J)
Inventories of oil and condensate held at the balance sheet date are valued at net realizable value based on the estimated selling price. Inventories
of stores and spares related to exploration, development and production activities are stated at cost, determined on fi rst in fi rst out (FIFO) basis.
However, inventories of stores and spares, which are not likely to be consumed, are written down to their net realizable value.
Joint Ventures(K)
Cairn India Group participates in several Joint Ventures involving joint control of assets for carrying out oil and gas exploration, development and
producing activities. Cairn India Group accounts for its share of the assets and liabilities of Joint Ventures along with attributable income and
expenses in such Joint Ventures, in which it holds a participating interest. Joint venture cash and cash equivalent balances are considered by the
Cairn India Group to be the amounts contributed in excess of the Cairn India Group’s obligations to the joint ventures and are, therefore, disclosed
within Loans and Advances.
Revenue recognition(L)
Revenue is recognized to the extent that it is probable that the economic benefi ts will fl ow to the Cairn India Group and the revenue can be
reliably measured.
Revenue from operating activities
From sale of oil, gas and condensate
Revenue represents the Cairn India Group’s share of oil, gas and condensate production, recognised on a direct entitlement basis, when signifi cant
risks and rewards of ownership are transferred to the buyers.
As operator from the joint venture
Cairn India Group recognizes parent company overhead as revenue from joint ventures based on the provisions of respective PSCs.
Tolling income
Tolling income represents Cairn India Group’s share of revenues from Pilotage and Oil Transfer Services from the respective joint ventures, which is
recognized based on the rates agreed with the customers, as and when the services are rendered.
Interest income
Interest income is recognised on a time proportion basis.
Dividend income
Revenue is recognized when the shareholders’ right to receive payment is established by the balance sheet date. Dividend from subsidiaries is
recognized even if same are declared after the balance sheet date but pertains to the period on or before the date of balance sheet as per the
requirement of schedule VI of the Companies Act, 1956.
Borrowing costs(M)
Borrowing costs include interest and commitment charges on borrowings, amortisation of costs incurred in connection with the arrangement of
borrowings, exchange differences to the extent they are considered a substitute to the interest cost and fi nance charges under leases. Costs
incurred on borrowings directly attributable to development projects, which take a substantial period of time to complete, are capitalised within the
development/producing asset for each cost-centre
All other borrowing costs are recognised in the profi t and loss account in the period in which they are incurred.
Foreign currency transactions and translations(N)
Cairn India Group translates foreign currency transactions into Indian Rupees at the rate of exchange prevailing at the transaction date. Monetary
assets and liabilities denominated in foreign currency are translated into Indian Rupees at the rate of exchange prevailing at the Balance Sheet date.
Non-monetary items which are carried in terms of historical cost denominated in a foreign currency are reported using the exchange rate at the date
of the transaction.
Exchange differences arising on the settlement of monetary items or on reporting Cairn India Group’s monetary items at rates different from
those at which they were initially recorded during the year, or reported in previous fi nancial statements, are recognised as income or as expenses in
the period in which they arise except those arising from investments in non-integral operations.
All transactions of integral foreign operations are translated as if the transactions of those foreign operations were the transactions of the
group itself. In translating the fi nancial statements of a non-integral foreign operation for incorporating in the consolidated fi nancial statements, Cairn

CAIRN INDIA LIMITED AN N UAL R E PORT 2009-10114
Schedules to the Consolidated Financial Statements ContinuedSCHEDULE 25–NOTES TO ACCOUNTS(All amounts are in INR thousand unless, otherwise stated)
India Group translates the assets and liabilities at the rate of exchange prevailing at the balance sheet date. Income and expenses of non-integral
operations are translated using rates at the date of transactions. Resulting exchange differences are disclosed under the foreign currency translation
reserve until the disposal of the net investment in non-integral operations.
Income taxes(O)
Tax expense comprises of current and deferred tax. Current income tax is measured at the amount expected to be paid to the tax authorities in
accordance with the income tax laws. Deferred income tax refl ects the impact of current period timing differences between taxable income and
accounting income for the period and reversal of timing differences of earlier period.
Deferred tax assets and liabilities are measured, based on tax rates and laws enacted or substantively enacted at the balance sheet date.
Deferred tax assets and deferred tax liabilities across various subsidiaries or countries of operation are not set off against each other as Cairn India
Group does not have a legal right to do so. Current and deferred tax assets and liabilities are only offset where they arise within the same entity and
tax jurisdiction.
Deferred tax assets are recognised only to the extent that there is reasonable certainty that suffi cient future taxable income will be available
against which such deferred tax assets can be realised. If Cairn India Group has carry forward of unabsorbed depreciation and tax losses, deferred
tax assets are recognised only if there is virtual certainty, supported by convincing evidence, that such deferred tax assets can be realised against
future taxable profi ts. Unrecognised deferred tax assets of earlier periods are re-assessed and recognised to the extent that it has become
reasonably certain or virtually certain, as the case may be, that future taxable income will be available against which such deferred tax assets can be
realised.
The carrying amount of deferred tax assets are reviewed at each balance sheet date. The Company writes-down the carrying amount of a
deferred tax asset to the extent that it is no longer reasonably certain or virtually certain, as the case may be, that suffi cient future taxable income will
be available against which deferred tax asset can be realised. Any such write-down is reversed to the extent that it becomes reasonably certain or
virtually certain, as the case may be, that suffi cient future taxable income will be available.
Minimum Alternative Tax (MAT) credit is recognised as an asset only when and to the extent there is convincing evidence that the company
will pay income tax under the normal provisions during the specifi ed period, resulting in utilization of MAT credit. In the year in which the MAT credit
becomes eligible to be recognized as an asset in accordance with the recommendations contained in Guidance Note issued by the Institute of
Chartered Accountants of India, the said asset is created by way of a credit to the profi t and loss account and shown as MAT Credit Entitlement.
Cairn India Group reviews the same at each balance sheet date and writes down the carrying amount of MAT Credit Entitlement to the extent there is
no longer convincing evidence to the effect that the individual company will utilize MAT credit during the specifi ed period.
Earnings Per Share(P)
Basic earnings per share are calculated by dividing the net profi t or loss for the year attributable to equity shareholders by the weighted average
number of equity shares outstanding during the period. The weighted average number of equity shares outstanding during the period is adjusted for
events of bonus issue, bonus element in a rights issue to existing shareholders, share split and reverse share split (consolidation of shares).
For the purpose of calculating diluted earnings per share, the net profi t or loss for the period attributable to equity shareholders and the
weighted average number of shares outstanding during the period are adjusted for the effects of all dilutive potential equity shares, if any.
Provisions(Q)
A provision is recognised when Cairn India Group has a present obligation as a result of past event and it is probable that an outfl ow of resources
will be required to settle the obligation, in respect of which a reliable estimate can be made. Provisions are not discounted to its present value and
are determined based on best estimate required to settle the obligation at the balance sheet date. These are reviewed at each balance sheet date
and adjusted to refl ect the current best estimates.
Cash and Cash equivalents(R)
Cash and cash equivalents in the cash fl ow statement comprise cash at bank and in hand and short-term investments, with an original maturity of 90
days or less.
Employee Benefi ts(S)
Retirement and Gratuity benefi ts
Retirement benefi ts in the form of provident fund and superannuation scheme are defi ned contribution schemes and the contributions are charged to
the profi t and loss account of the period when the contributions to the respective funds are due. There are no obligations other than the contribution
payable to the respective funds.
Gratuity liability is a defi ned benefi t obligation and is provided for on the basis of an actuarial valuation on projected unit credit method made
at the end of each fi nancial year. The scheme is maintained and administered by an insurer to which the trustees make periodic contributions.
Short term compensated absences are provided for based on estimates. Long term compensated absences are provided for based on
actuarial valuation made at the end of each fi nancial year. The actuarial valuation is done as per projected unit credit method.
Actuarial gains / losses are immediately taken to profi t and loss account and are not deferred.
Employee Stock Compensation Cost
Measurement and disclosure of the employee share-based payment plans is done in accordance with SEBI (Employee Stock Option Scheme and
Employee Stock Purchase Scheme) Guidelines, 1999 and the Guidance Note on Accounting for Employee Share-based Payments, issued by the
ICAI. Cairn India Group measures compensation cost relating to employee stock options using the intrinsic value method. Compensation expense is
amortized over the vesting period of the option on a straight line basis. The cost of awards to employees under the Company’s ultimate parent entity’s

115
Schedules to the Consolidated Financial Statements ContinuedSCHEDULE 25–NOTES TO ACCOUNTS(All amounts are in INR thousand unless, otherwise stated)
Long Term Incentive Plans (“the LTIP”) is recognised based on the amount cross charged by the parent entity.
Use of estimates(T)
The preparation of fi nancial statements in conformity with generally accepted accounting principles requires management to make estimates and
assumptions that affect the reported amounts of assets and liabilities and disclosure of contingent liabilities at the date of the fi nancial statements
and the results of operations during the reporting period. Although these estimates are based upon management’s best knowledge of current events
and actions, actual results could differ from these estimates.
Segment Reporting Policies(U)
Identifi cation of segments:
Cairn India Group’s operating businesses are organized and managed separately according to the nature of products and services provided,
with each segment representing a strategic business unit that offers different products and serves different markets. The analysis of geographical
segments is based on the areas in which major operating divisions of Cairn India Group operate.
Derivative Instruments(V)
As per the ICAI Announcement, accounting for derivative contracts, other than those covered under AS-11, is done on marked to market on a
portfolio basis, and the net loss is charged to the income statement. Net gains are ignored.
SEGMENTAL REPORTING4.
Business segments
The primary reporting of Cairn India Group has been prepared on the basis of business segments. Cairn India Group has only one business
segment, which is the exploration, development and production of oil and gas and operates in a single business segment based on the nature of the
products, the risks and returns, the organisation structure and the internal fi nancial reporting systems. Accordingly, the fi gures appearing in these
fi nancial statements relate to the Cairn India Group’s single business segment.
Geographical segments
Secondary segmental reporting is prepared on the basis of the geographical location of customers. The operating interests of the Cairn India
Group are confi ned to the Indian sub-continent in terms of oil and gas blocks and customers. Accordingly, the fi gures appearing in these fi nancial
statements relate to Cairn India Group’s single geographical segment, being operations in the Indian sub-continent.
RELATED PARTY TRANSACTIONS5.
Names of related parties:(A)
Companies having control
• Cairn UK Holdings Limited, UK
Holding Company
• Cairn Energy Plc., UK
Ultimate holding company
Key Management Personnel
• Rahul Dhir
Managing Director and Chief Executive Offi cer
• Winston Frederick Bott Jr.
Executive Director and Chief Operating Offi cer
(appointed on 29th April, 2008)
• Indrajit Banerjee
Executive Director and Chief Finacial Offi cer
• Philip Tracy
Alternate Director (from 18th March, 2009 till 26th May, 2009)
• Lawrence Smyth
Executive Director and Chief Operating Offi cer (resigned on 21st January, 2008)
Transactions during the year / period(B)
Nature of the Transactions Related Party Current year Previous period
Reimbursement of expenses to parent company Cairn Energy Plc. 39,919 279,725
Waiver of outstanding balance by the
parent companyCairn Energy Plc. 1,083,654 Nil
Shares issued including premium and stock
option charge
Rahul Dhir Nil 716,185
Lawrence Smyth Nil 126,758
Total Nil 842,943

CAIRN INDIA LIMITED AN N UAL R E PORT 2009-10116
Schedules to the Consolidated Financial Statements ContinuedSCHEDULE 25–NOTES TO ACCOUNTS(All amounts are in INR thousand unless, otherwise stated)
In addition to the above remuneration, incentives and bonus of INR 28,813 thousand (previous period INR 13,424 thousand), INR 69,151 thousand
(previous period INR 86,598 thousand), INR 38,123 thousand (previous period INR 8,099 thousand) and INR Nil (previous period INR 14,141
thousand) were paid to Rahul Dhir, Winston Frederick Bott Jr., Indrajit Banerjee and Lawrence Smyth respectively. Further, the remuneration does not
include provisions made for gratuity and leave benefi ts, as they are determined on an actuarial basis for the Cairn India Group as a whole.
Balances outstanding as at the end of the year / period:(C)
6. The shareholders of the Company in their meeting dated August 18, 2009 had revised the allocation of Initial Public Offer (IPO) proceeds within
the existing heads under the prospectus. As at 31st March 2010, the Company and its subsidiaries together have utilized the entire IPO proceeds
aggregating to INR 88,248,901 thousand in accordance with the revised approval received from the shareholders. The details of the revised
approval and utilization of funds is as follows:
The details of the unutilized monies out of the public issue proceeds is as follows:
7. EMPLOYEES STOCK OPTION PLANS
Cairn India Group has provided various share based payment schemes to its employees. During the period ended 31st March 2010, the following
schemes were in operation:
Nature of the Balance Related Party 31st March 2010 31st March 2009
Accounts payable Cairn Energy Plc. 1,773 1,296,164
Particulars Upto, 31st March 2010 Upto, 31st March 2009
Acquisition of shares of Cairn India Holdings Limited from Cairn
UK Holdings Limited59,580,837 59,580,837
Exploration and Development expenses 26,838,445 21,152,714
General corporate purposes 230,000 230,000
Issue expenses 1,599,619 1,599,619
Total 88,248,901 82,563,170
Particulars 31st March 2010 31st March 2009
Mutual funds Nil 718,277
Balances with banks Nil 4,967,454
Total Nil 5,685,731
Particulars CISMP CIPOP CIESOP CIPOP Phantom CIESOP Phantom
Date of Board Approval 17th Nov 2006 17th Nov 2006 17th Nov 2006 Not applicable Not applicable
Date of Shareholder’s approval 17th Nov 2006 17th Nov 2006 17th Nov 2006 Not applicable Not applicable
Number of options granted till
March 20108,298,713 6,727,724 18,197,795 1,883,339 573,918
Method of Settlement Equity Equity Equity Cash Cash
Vesting PeriodRefer vesting
conditions below
3 years from
grant date
3 years from
grant date
3 years from
grant date
3 years from
grant date
Exercise Period18 months from
vesting date
3 months from
vesting date
7 years from
vesting date
Immediately
upon vesting
Immediately
upon vesting
Number of options granted till 31st March 2010
24th Nov 2006 8,298,713 - - - -
1st Jan 2007 - 1,708,195 3,467,702 - -
20th Sept 2007 - 3,235,194 5,515,053 - -
29th July 2008 - 789,567 3,773,856 822,867 324,548
Remuneration Rahul Dhir 106,814 112,036
Winston Frederick Bott Jr. 95,593 95,890
Indrajit Banerjee 14,633 18,024
Lawrence Smyth Nil 25,195
Philip Tracy 3,865 1,354
Total 220,905 252,499
Nature of the Transactions Related Party Current year Previous period

117
Schedules to the Consolidated Financial Statements ContinuedSCHEDULE 25–NOTES TO ACCOUNTS(All amounts are in INR thousand unless, otherwise stated)
The Vesting conditions of the above plans are as under:
CISMP Plan
(A) 6,714,233 options are to be vested in the following manner-
• 1/3rd of the options will vest on the day following the date on which the equity shares have been admitted to listing on the Stock
Exchanges (‘admission date’). Listing date was 9th Jan 2007.
• 1/3rd of the options will vest 18 months after the admission date.
• 1/3rd of the options will vest on achieving 30 days’ consecutive production of over 150,000 bopd from the Rajasthan Block.
(B) 1,584,480 options are to be vested in the following manner-
• 1/2 of the options will vest on the day following the date on which the equity shares have been admitted to listing on the Stock
Exchanges.
• 1/4th of the options will vest on the date on which all major equipment for the start-up of the Mangala fi eld is delivered to site.
• 1/4th of the options will vest on achieving 100,000 bopd from the Mangala Field.
CIPOP plan (including phantom options)
Options will vest (i.e., become exercisable) at the end of a “performance period” which will be set by the remuneration committee at the time of grant
(although such period will not be less than three years). However, the percentage of an option which vests on this date will be determined by the
extent to which pre-determined performance conditions have been satisfi ed. Phantom options are exercisable proportionate to the period of service
rendered by the employee subject to completion of one year.
CIESOP plan (including phantom options)
There are no specifi c vesting conditions under CIESOP plan. Phantom options are exercisable proportionate to the period of service rendered by the
employee subject to completion of one year.
Details of activities under employees stock option plans
CISMP Plan Current year Previous period
Number of
options
Weighted average
exercise Price in INR
Number of
options
Weighted average
exercise Price in INR
Outstanding at the beginning of the year 2,238,077 33.70 8,298,713 33.70
Granted during the year Nil NA Nil NA
Forfeited during the year Nil NA Nil NA
Exercised during the year Nil NA 5,268,396 33.70
Expired during the year Nil NA 792,240 33.70
Outstanding at the end of the year 2,238,077 33.70 2,238,077 33.70
Exercisable at the end of the year Nil NA Nil NA
Weighted average fair value of options granted
on the date of grant (INR)131.50 NA 131.50 NA
CIPOP Plan Current year Previous period
Number of
options
Weighted average
exercise Price in INR
Number of
options
Weighted average
exercise Price in INR
Outstanding at the beginning of the year 3,200,096 10.00 4,755,244 10.00
Granted during the year 994,768 10.00 789,567 10.00
Forfeited during the year Nil NA Nil NA
Exercised during the year 190,983 10.00 Nil NA
Expired during the year 1,377,051 10.00 2,344,715 10.00
Outstanding at the end of the year 2,626,830 10.00 3,200,096 10.00
Exercisable at the end of the year 168,382 10.00 Nil NA
Weighted average fair value of options granted
on the date of grant (INR)174.47 NA 165.46 NA
Particulars CISMP CIPOP CIESOP CIPOP Phantom CIESOP Phantom
10th Dec 2008 - - 36,040 - 38,008
29th July 2009 - 994,768 5,405,144 1,060,472 211,362
Total 8,298,713 6,727,724 18,197,795 1,883,339 573,918

CAIRN INDIA LIMITED AN N UAL R E PORT 2009-10118
Schedules to the Consolidated Financial Statements ContinuedSCHEDULE 25–NOTES TO ACCOUNTS(All amounts are in INR thousand unless, otherwise stated)
CIPOP Plan – Phantom options Current year Previous period
Number of
options
Weighted average
exercise Price in INR
Number of
options
Weighted average
exercise Price in INR
Outstanding at the beginning of the year 784,859 10.00 Nil NA
Granted during the year 1,977,426 10.00 822,867 10.00
Forfeited during the year Nil NA Nil NA
Exercised during the year 795,230 10.00 Nil NA
Expired during the year 238,414 10.00 38,008 10.00
Outstanding at the end of the year 1,728,641 10.00 784,859 10.00
Exercisable at the end of the year, subject to
vesting conditions812,543 10.00 Nil NA
Weighted average fair value of options granted
on reporting date (INR)296.39 NA 175.40 NA
CIESOP Plan – Phantom options Current year Previous period
Number of
options
Weighted average
exercise Price in INR
Number of
options
Weighted average
exercise Price in INR
Outstanding at the beginning of the year 362,556 218.19 Nil NA
Granted during the year 936,862 181.98 362,556 218.19
Forfeited during the year Nil NA Nil NA
Exercised during the year 392,977 178.22 Nil NA
Expired during the year 61,753 240.05 Nil NA
Outstanding at the end of the year 844,688 195.03 362,556 218.19
Exercisable at the end of the year, subject
to vesting conditions695,079 185.34 Nil NA
Weighted average fair value of options
granted on reporting date (INR)136.51 NA 48.13 NA
The details of exercise price for stock options outstanding as at March 31, 2010 are:
SchemeRange of exercise
price (INR)
No. of options
outstanding
Weighted average
remaining contractual
life of options (in years)
Weighted average
exercise Price in INR
CISMP Plan 33.70 2,238,077 1.08 33.70
CIPOP Plan 10.00 2,626,830 1.36 10.00
CIESOP Plan 143-240 14,646,209 1.28 206.43
CIPOP Plan – Phantom options 10.00 1,728,641 1.71 10.00
CIESOP Plan – Phantom options 143-240 844,688 1.09 195.03
CIESOP Plan Current year Previous period
Number of
options
Weighted average
exercise Price in INR
Number of
options
Weighted average
exercise Price in INR
Outstanding at the beginning of the year 10,914,244 185.39 8,545,710 164.49
Granted during the year 5,405,144 240.05 3,809,896 226.21
Forfeited during the year Nil NA Nil NA
Exercised during the year 115,333 160.00 Nil NA
Expired during the year 1,557,846 179.09 1,441,362 169.33
Outstanding at the end of the year 14,646,209 206.43 10,914,244 185.39
Exercisable at the end of the year 1,981,770 160.00 Nil NA
Weighted average fair value of options granted
on the date of grant (INR)107.64 NA 101.47 NA

119
Schedules to the Consolidated Financial Statements ContinuedSCHEDULE 25–NOTES TO ACCOUNTS(All amounts are in INR thousand unless, otherwise stated)
Effect of Employees Stock Option Plans on Financial Position
Effect of the employee share-based payment plans on the profi t and loss account and on its fi nancial position:
Inputs for Fair valuation of Employees Stock Option Plans
The Share Options have been fair valued using an Option Pricing Model (Black Scholes Model). The main inputs to the model and the Fair Value of
the options, based on an independent valuation, are as under:
Particulars Current year Previous period
Total Employee Compensation Cost pertaining to share-based payment plans
(including exceptional gain of INR 155,723 thousand in the previous period)552,002 134,493
Compensation Cost pertaining to equity-settled employee share-based
payment plan included above103,649 107,292
Compensation Cost pertaining to cash-settled employee share-based
payment plan included above448,353 27,201
Liability for equity settled employee stock options outstanding as at year /
period end463,978 388,978
Liability for cash settled employee stock options outstanding as at year /
period end (current year amount excludes INR 46,381 thousand payable
towards options vested but not exercised)
284,411 27,201
Deferred compensation cost of equity settled options 304,142 393,570
Deferred compensation cost of cash settled options 315,490 94,719
Variables - CISMP A B
Grant date 24th Nov 2006 24th Nov 2006
Stock Price/fair value of the equity shares on the date of grant (INR) 160.00 160.00
Vesting date Refer vesting conditions Refer vesting conditions
Vesting % Refer vesting conditions Refer vesting conditions
Volatility (Weighted average) 44.08% 46.59%
Risk free rate (Weighted average) 7.05% 6.94%
Time to maturity in years (Weighted average) 2.45 2.00
Exercise price – INR 33.70 33.70
Fair Value of the options (Weighted average) - INR 131.69 130.69
Variables – CIESOP
Grant date 1st Jan 2007 20th Sept 2007 29th July 2008 10th Dec 2008 29th July 2009
Stock Price/fair value of the
equity shares on the date of
grant (INR)
160.00 166.95 228.55 150.10 234.75
Vesting date 1st Jan 2010 20th Sept 2010 29th July 2011 10th Dec 2011 29th July 2012
Vesting % 100% 100% 100% 100% 100%
Volatility 41.04% 40.24% 39.43% 38.19% 39.97%
Risk free rate 7.50% 7.65% 9.20% 6.94% 6.91%
Time to maturity (years) 6.50 6.50 6.50 6.50 6.50
Exercise price (INR) 160.00 166.95 227.00 143.00 240.05
Fair Value of the options (INR) 87.30 90.72 130.42 79.80 122.24
The details of exercise price for stock options outstanding as at March 31, 2009 are:
CISMP Plan 33.70 2,238,077 2.08 33.70
CIPOP Plan 10.00 3,200,096 1.51 10.00
CIESOP Plan 143-227 10,914,244 1.60 185.39
CIPOP Plan – Phantom options 10.00 784,859 2.33 10.00
CIESOP Plan – Phantom options 143-227 362,556 2.37 218.19
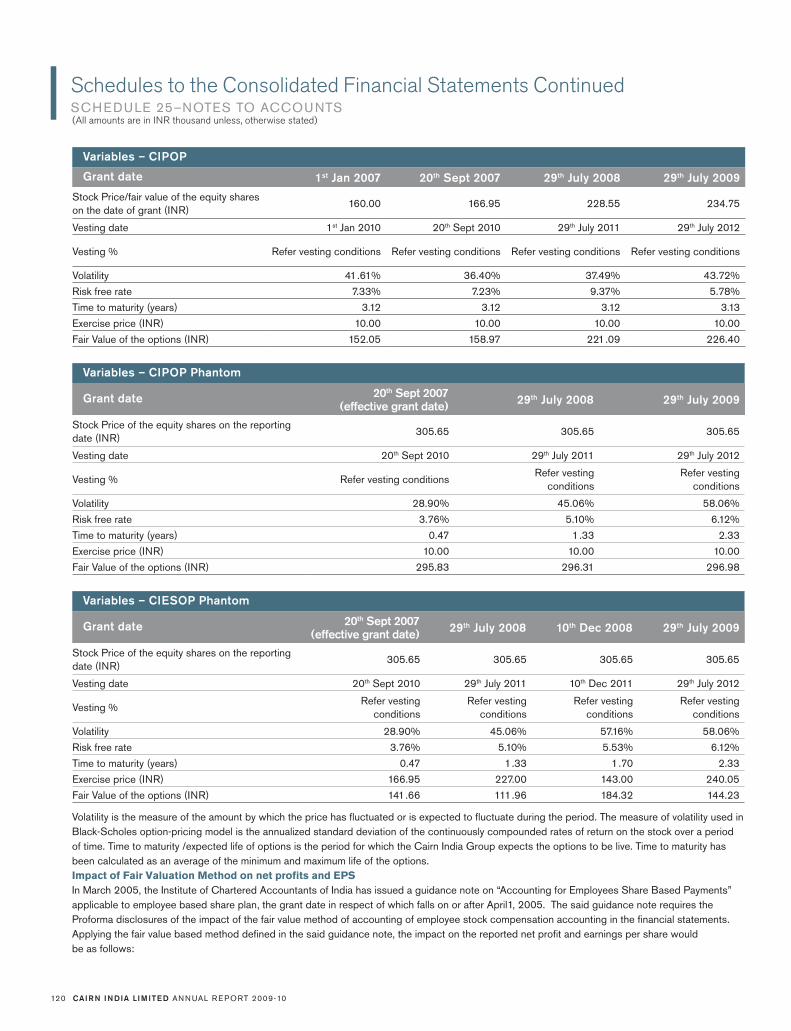
CAIRN INDIA LIMITED AN N UAL R E PORT 2009-10120
Schedules to the Consolidated Financial Statements ContinuedSCHEDULE 25–NOTES TO ACCOUNTS(All amounts are in INR thousand unless, otherwise stated)
Volatility is the measure of the amount by which the price has fl uctuated or is expected to fl uctuate during the period. The measure of volatility used in
Black-Scholes option-pricing model is the annualized standard deviation of the continuously compounded rates of return on the stock over a period
of time. Time to maturity /expected life of options is the period for which the Cairn India Group expects the options to be live. Time to maturity has
been calculated as an average of the minimum and maximum life of the options.
Impact of Fair Valuation Method on net profi ts and EPS
In March 2005, the Institute of Chartered Accountants of India has issued a guidance note on “Accounting for Employees Share Based Payments”
applicable to employee based share plan, the grant date in respect of which falls on or after April1, 2005. The said guidance note requires the
Proforma disclosures of the impact of the fair value method of accounting of employee stock compensation accounting in the fi nancial statements.
Applying the fair value based method defi ned in the said guidance note, the impact on the reported net profi t and earnings per share would
be as follows:
Variables – CIPOP Phantom
Grant date20th Sept 2007
(effective grant date)29th July 2008 29th July 2009
Stock Price of the equity shares on the reporting
date (INR)305.65 305.65 305.65
Vesting date 20th Sept 2010 29th July 2011 29th July 2012
Vesting % Refer vesting conditionsRefer vesting
conditions
Refer vesting
conditions
Volatility 28.90% 45.06% 58.06%
Risk free rate 3.76% 5.10% 6.12%
Time to maturity (years) 0.47 1.33 2.33
Exercise price (INR) 10.00 10.00 10.00
Fair Value of the options (INR) 295.83 296.31 296.98
Variables – CIESOP Phantom
Grant date20th Sept 2007
(effective grant date)29th July 2008 10th Dec 2008 29th July 2009
Stock Price of the equity shares on the reporting
date (INR)305.65 305.65 305.65 305.65
Vesting date 20th Sept 2010 29th July 2011 10th Dec 2011 29th July 2012
Vesting %Refer vesting
conditions
Refer vesting
conditions
Refer vesting
conditions
Refer vesting
conditions
Volatility 28.90% 45.06% 57.16% 58.06%
Risk free rate 3.76% 5.10% 5.53% 6.12%
Time to maturity (years) 0.47 1.33 1.70 2.33
Exercise price (INR) 166.95 227.00 143.00 240.05
Fair Value of the options (INR) 141.66 111.96 184.32 144.23
Variables – CIPOP
Grant date 1st Jan 2007 20th Sept 2007 29th July 2008 29th July 2009
Stock Price/fair value of the equity shares
on the date of grant (INR)160.00 166.95 228.55 234.75
Vesting date 1st Jan 2010 20th Sept 2010 29th July 2011 29th July 2012
Vesting % Refer vesting conditions Refer vesting conditions Refer vesting conditions Refer vesting conditions
Volatility 41.61% 36.40% 37.49% 43.72%
Risk free rate 7.33% 7.23% 9.37% 5.78%
Time to maturity (years) 3.12 3.12 3.12 3.13
Exercise price (INR) 10.00 10.00 10.00 10.00
Fair Value of the options (INR) 152.05 158.97 221.09 226.40

121
Schedules to the Consolidated Financial Statements ContinuedSCHEDULE 25–NOTES TO ACCOUNTS(All amounts are in INR thousand unless, otherwise stated)
8. LEASE OBLIGATIONS DISCLOSURES
Finance Lease:
Fixed assets include offi ce equipments and leaseholds improvements obtained under fi nance lease. The lease is secured by way of hypothecation of
the respective assets acquired under lease. The lease term is for 3 to 6 years and renewable for further period/years at the option of the Cairn India
Group. There is no escalation clause in the lease agreements. There are no restrictions imposed by lease arrangements and there are no subleases.
Note The interest rate on fi nance lease ranges from 3.77 % to 14.61%
Operating Lease:
Cairn India Group has entered into operating leases for offi ce premises and offi ce equipments, some of which are cancellable and some are non-
cancellable. The leases have a life of 3 to 6 years. There is an escalation clause in the lease agreement during the primary lease period. There are no
restrictions imposed by lease arrangements and there are no subleases. There are no contingent rents.
9. CONTINGENT LIABILITIES
(A) Ravva Joint Venture Arbitration proceedings : ONGC Carry
Ravva is an unincorporated Joint Venture (JV) in which Cairn India Group has an interest. The calculation of the Government of India’s (GoI) share
of petroleum produced from the Ravva oil fi eld has been a matter of disagreement for some years. An arbitration panel opined in October 2004 and
Cairn has been willing to be bound by the award, although it was not as favourable as had been hoped. The GoI, however, had lodged an appeal in
the Malaysian courts in respect of one element of the award which was in Cairn’s favour, namely the “ONGC Carry” issue. The “ONGC Carry” issue
relates to whether Contractor Parties under Ravva PSC are entitled to include in their accounts for the purposes of calculating the PTRR certain
Current Year Minimum lease payments Principal amount due Interest due
Within one year of the balance sheet date 72,047 60,928 11,119
Due in a period between one year and fi ve years 85,391 79,397 5,994
Due after fi ve years Nil Nil Nil
Total 157,438 140,325 17,113
Previous Period Minimum lease payments Principal amount due Interest due
Within one year of the balance sheet date 97,740 80,366 17,374
Due in a period between one year and fi ve years 160,058 142,036 18,022
Due after fi ve years Nil Nil Nil
Total 257,798 222,402 35,396
Particulars 31st March 2010 31st March 2009
Lease payments made during the period 132,390 120,173
Within one year of the balance sheet date 140,321 124,628
Due in a period between one year and fi ve years 34,536 150,536
Due after fi ve years Nil Nil
Current year Previous period
Profi t as reported 10,511,060 8,034,506
Add: Employee stock compensation under intrinsic
value method (net of exceptional gain of INR 155,723
thousand in the previous period)
552,002 134,493
Less: Employee stock compensation under fair value
method948,058 622,866
Proforma profi t 10,115,004 7,546,133
Earnings Per Share (in INR)
Basic
- As reported 5.54 4.31
- As reported 5.33 4.04
Diluted
- As reported 5.52 4.28
- Proforma 5.31 4.02

CAIRN INDIA LIMITED AN N UAL R E PORT 2009-10122
Schedules to the Consolidated Financial Statements ContinuedSCHEDULE 25–NOTES TO ACCOUNTS(All amounts are in INR thousand unless, otherwise stated)
costs paid by Contractor Parties in consideration for ONGC having paid 100% of costs prior to the signing of the Ravva PSC in 1994.
Cairn India Group challenged both the GoI’s right to appeal and the grounds of that appeal.
A judgment was delivered by the Malaysian High Court on 12th January 2009, ruling in favour of the GoI and setting the arbitration award
aside. This had the effect of negating the original award in favour of Cairn India Group.
Cairn India Group appealed against above judgment to the Malaysian Court of Appeal. A judgment was delivered by the Malaysian Court of
Appeal on 15th September 2009, which reversed the ruling of the High Court in Malaysia of 12th January 2009 and had the effect of reinstating the
original award in favour of Cairn India Group. The Government of India has applied for leave to appeal this judgment to the Federal Court of Malaysia
(the apex court).
In addition, consistent with GoI’s view that the set-aside meant they have a binding judgment in their favour, GoI has demanded and
commenced recovery from Cairn’s buyers, of revenues from sale proceeds to set-off against the sums they claim are due as a result of the Malaysian
judgment being in their favour. This recovery action was contested by Cairn in the Indian courts, pursuant to which, the Government has given an
undertaking to stop recoveries post January 2010. The amounts recovered by the Government aggregate to approximately INR 7,230,000 thousand
(USD 160 million). The net effective deduction as on 31st March 2010, after adjusting the current year’s profi t petroleum, amounts to approximately
INR 2,291,000 thousand (USD 51 million).
In the event that the GoI’s appeal is successful, then Cairn India Group would be required to pay approximately INR 2,888,000 thousand
(USD 64 million) and potential interest of INR 1,398,000 thousand (USD 31 million). The same dispute existed at the end of the previous period.
(B) Ravva Joint Venture Arbitration Proceedings : Base Development Cost
Ravva joint venture had received a claim from the Director General of Hydrocarbons (DGH) for the period from 2000-2005 for USD 166.4 million
for an alleged underpayment of profi t petroleum to the Indian Government, out of which, Cairn India Group’s share will be USD 37.4 million
(approximately INR 1,688,000 thousand) plus potential interest at applicable rate (LIBOR plus 2% as per PSC).
This claim relates to the Indian Government’s allegation that the Ravva JV has recovered costs in excess of the Base Development Costs
(“BDC”) cap imposed in the PSC and that the Ravva JV has also allowed these excess costs in the calculation of the Post Tax Rate of Return
(PTRR). Cairn believes that such a claim is unsustainable under the terms of the PSC because, amongst other reasons, the BDC cap only applies to
the initial development of the Ravva fi eld and not to subsequent development activities under the PSC. Additionally the Ravva JV has also contested
the basis of the calculation in the above claim from the DGH. Even if upheld, Cairn believes that the DGH has miscalculated the sums that would
be due to the Indian Government in such circumstances. Companies have initiated the arbitration proceedings, the arbitration panel has been fully
constituted and one hearing has taken place. A further hearing has been scheduled for oral closing arguments. The same dispute existed at the end
of the previous period.
(C) Service Tax
One of the subsidiary companies of the Cairn India Group has received four show cause notices from the tax authorities in India for nonpayment of
service tax as a recipient of services from foreign suppliers.
These notices cover periods from 16th August 2002 to 31st March 2009. A writ petition(s) has been fi led with Chennai High Court
challenging the liability to pay service tax as recipient of services in respect of fi rst show cause notice (16th August 2002 to 31st March 2006) and
challenging the scope of some services in respect of second show cause notice (1st April 2006 to 31st March 2007). The reply for second and third
show cause notice has also been fi led before the authorities.
Should the adjudication go against Cairn India Group, it will be liable to pay the service tax of approximately INR 1,679,000 thousand
(previous period INR 978,000 thousand) plus potential interest of approximately INR 634,000 thousand (previous period INR 395,000 thousand),
although this could be recovered in part, where it relates to services provided to Joint Venture of which Cairn India is operator.
Tax holiday on gas production(D)
Section 80-IB (9) of the Income Tax Act, 1961 allows the deduction of 100% of profi ts from the commercial production or refi ning of mineral oil. The
term ‘mineral oil’ is not defi ned but has always been understood to refer to both oil and gas, either separately or collectively.
The 2008 Indian Finance Bill appeared to remove this deduction by stating [without amending section 80-IB (9)] that “for the purpose of
section 80-IB (9), the term ‘mineral oil’ does not include petroleum and natural gas, unlike in other sections of the Act”. Subsequent announcements
by the Finance Minister and the Ministry of Petroleum and Natural Gas have confi rmed that tax holiday would be available on production of crude oil
but have continued to exclude gas.
Cairn India Group fi led a writ petition to the Gujarat High Court in December 2008 challenging the restriction of section 80-IB to the
production of oil. Gujarat High Court did not admit the writ petition on the ground that the matter needs to be fi rst decided by lower tax authorities.
A Special Leave Petition has been fi led before Supreme Court against the decision of Gujarat High court.
In the event this challenge is unsuccessful, the potential liability for tax and related interest on tax holiday claimed on gas production for all
periods to 31st March 2010 is approximately INR 2,321,000 thousand (previous period INR 2,370,000 thousand).
Based on the legal opinions received, the management is of the view that the liability in the cases mentioned in (A) to (D) above are not probable and
accordingly no provision has been considered necessary there against.
10. Balances written back are net of INR 450,217 thousand, being the adjustment arising on account of reconciliation of certain working capital balances
pertaining to joint ventures, in which Cairn India Group has participating interest.

123
Schedules to the Consolidated Financial Statements ContinuedSCHEDULE 25–NOTES TO ACCOUNTS(All amounts are in INR thousand unless, otherwise stated)
11. CAPITAL COMMITMENTS (NET OF ADVANCES)
In respect of Cairn India Group’s share of Joint Ventures’ Exploration activities – INR 11,688,763 thousand (previous period – INR 1
11,324,140 thousand).
In respect of the Cairn India Group’s share of Joint Ventures’ Development activities – INR 28,096,949 thousand (previous year – INR 2
34,536,062 thousand).
12. DERIVATIVE INSTRUMENTS AND UNHEDGED FOREIGN CURRENCY EXPOSURE
Cairn India Group has taken USD put/INR call options to hedge the risk of foreign currency exposure. The amount of outstanding options as at 31st
March 2010 aggregated to USD 233,000 thousand (previous period USD 214,000 thousand)
Particulars of Unhedged Foreign Currency Exposure at the Balance Sheet date
13. Cairn India Group has a defi ned benefi t gratuity plan. Every employee who has completed fi ve years or more of service gets a gratuity on departure at
15 days salary (last drawn salary) for each completed year of service. The scheme is funded with an insurance company in the form of a qualifying
insurance policy.
The following tables summarize the components of net benefi t expense recognised in the profi t and loss account, the funded status and
amounts recognised in the balance sheet for the gratuity plans.
Profi t and Loss account
Net employee benefi t expense (recognised in staff cost)
Balance sheet
Details of Provision for Gratuity
Particulars 31st March 2010 31st March 2009
Defi ned benefi t obligation 161,887 108,425
Fair value of plan assets 97,008 68,854
Less: Unrecognized past service cost Nil Nil
Plan asset / (liability) (64,879) (39,571)
Changes in the present value of the defi ned benefi t obligation are as follows:
Particulars 31st March 2010 31st March 2009
Opening defi ned benefi t obligation 108,425 66,142
Current service cost 31,030 23,529
Interest cost 8,674 6,051
Benefi ts paid (4,038) (5,306)
Actuarial (gains) / losses on obligation 17,796 18,009
Closing defi ned benefi t obligation 161,887 108,425
Particulars 31st March 2010 31st March 2009
Loan 20,416,806 43,341,500
Sundry Debtors 3,067,474 1,516,418
Investments 201,923 Nil
Cash and Bank 3,894,233 31,366,364
Other current Assets 13,543,767 2,266,955
Current Liabilities 4,545,666 5,623,077
Particulars 31st March 2010 31st March 2009
Current service cost 31,030 23,529
Interest cost on benefi t obligation 8,674 6,051
Expected return on plan assets (3,598) (3,666)
Net actuarial (gain) / loss recognised in the year 17,464 14,974
Past service cost Nil Nil
Net benefi t expense 53,570 40,888
Actual return on plan assets 6,604 6,700

CAIRN INDIA LIMITED AN N UAL R E PORT 2009-10124
Schedules to the Consolidated Financial Statements ContinuedSCHEDULE 25–NOTES TO ACCOUNTS(All amounts are in INR thousand unless, otherwise stated)
Note The Group’s expected contribution to the fund in the next year is INR 40,582 thousand (previous period INR 34,725 thousand).
The major categories of plan assets as a percentage of the fair value of total plan assets are as follows:
The overall expected rate of return on assets is determined based on the market prices prevailing on that date, applicable to the period over which
the obligation is to be settled.
The principal assumptions used in determining gratuity liability for the Group’s plans are shown below:
Note The estimates of future salary increases, considered in actuarial valuation, take account of infl ation, seniority, promotion and other relevant
factors, such as supply and demand in the employment market.
Gratuity liabilities for the current and previous period are as follows:
Notes
i) The Group has adopted AS 15 (Revised 2005) Employee Benefi ts for the fi rst time during the year ended December 31, 2007. Disclosures
required by paragraph 120 (n) of AS-15 (Revised 2005) are required to be furnished prospectively from the date of transition and hence
have been furnished for year/period ended December 31, 2007 onwards.
ii) The Group is maintaining a fund with the Life Insurance Corporation of India (LIC) to meet its gratuity liability. The present value of the plan
assets represents the balance available with the LIC as at the end of the year. The total value of plan assets amounts to INR 97,008 thou-
sand (Previous period INR 68,854 thousand) is as certifi ed by the LIC.
Particulars 31st March 2010 31st March 2009
Discount rate 8.00% 7.00%
Future salary increase 10.00% 10.00%
Expected rate of return on assets 9.40% 9.35%
Employee turnover 5.00% 13.13%
Mortality Rate LIC (1994-96) LIC (1994-96)
Ultimate Table Ultimate Table
Particulars 31st March 2010 31st March 2009
Changes in the fair value of plan assets are as follows:
Particulars 31st March 2010 31st March 2009
Opening fair value of plan assets 68,854 29,163
Expected return 3,598 3,666
Contributions by employer 28,262 38,296
Benefi ts paid (4,038) (5,306)
Actuarial gains / (losses) 332 3,035
Closing fair value of plan assets 97,008 68,854
Particulars 31st March 2010 31st March 2009 31st December 2007
Defi ned benefi t obligation 161,887 108,425 66,142
Plan assets 97,008 68,854 29,163
Surplus / (defi cit) (64,879) (39,571) (36,979)
Experience adjustments on plan assets (loss)/gain 365 3,132 2,970
Experience adjustments on plan liabilities (loss)/gain (13,839) (11,964) (6,960)

125
Schedules to the Consolidated Financial Statements ContinuedSCHEDULE 25–NOTES TO ACCOUNTS(All amounts are in INR thousand unless, otherwise stated)
14. DETAILS OF MOVEMENT IN SHARE CAPITAL AND SECURITIES PREMIUM IS AS UNDER
15. The price contract for sale of gas with one customer is due for revision with effect from December 2008 and currently the same is under negotiation.
Pending fi nalization of the price contract, revenue has been recognised based on the last agreed prices on a conservative basis, as the management
is expecting an upward price revision.
16. The goodwill of Cairn India Group amounting to INR 253,192,675 thousand has arisen on consolidation of fi nancial statements of the Company
with its subsidiaries and represents the difference between the cost of its investment in Cairn India Holdings Limited (which largely represent
Cairn India Group’s operations in India through its subsidiaries) and consolidated net book value of assets in Cairn India Holdings Limited, at
the time of acquisition of shares in Cairn India Holdings Limited. The management has carried out the tests for impairment of goodwill at the
year-end as per requirements of AS 28 (Impairment of Assets) by computing the value in use of the assets and comparing the same with the
carrying amount of the net assets. Value in use is based on the discounted future net cash fl ows of the oil and gas assets held by the Cairn
India Group. For all blocks in the exploration stage, valuation has been carried out using risked net present value per barrel of oil equivalent. The
result of the impairment tests indicate that the value in use is higher than the carrying amounts and no impairment provision is required to be
created at the reporting date.
17. The current tax and deferred tax provisions have been computed on the basis of the standalone fi nancial statements of the Company’s subsidiaries,
i.e. not based on the consolidated fi nancial statements of Cairn India Limited and its subsidiaries. For computing deferred tax liability in relation to
the Rajasthan fi eld, Cairn India Group has considered fi eld life as stipulated in the Production Sharing Contract instead of the economic useful life of
the fi eld considered in earlier years. This change has resulted in reversal of opening deferred tax liability by INR 1,760,519 thousand.
18. The Company and its wholly owned subsidiary Cairn Energy Hydrocarbons Limited (“CEHyL”) have entered into a loan facility for INR 40,000
million (available to the Company) and USD 750 million (available to CEHyL) with a consortium of banks. The purpose of the loan facility is to fi nance
the RJ-ON-90/1 block expenditure and also the repayment of the earlier loan facility of USD 850 million. The main security for the INR loan facility is
the hypothecation of the 35% participating interest in RJ-ON-90/1 block held by Cairn Energy India Pty Limited, a wholly owned subsidiary of the
Company whereas for the USD loan facility, the entire shares of CEHyL has been provided as the main security.
19. The shareholders of the Company have approved a Scheme of Arrangement between the Company and some of its wholly owned subsidiaries, to
be effective from 1st January 2010. The Scheme of Arrangement has been approved by the Hon’ble High Court of Madras. However, it is pending for
approval from the Hon’ble High Court of Bombay and other regulatory authorities. Pending receipt of such approvals, no accounting impact of the
scheme has been given in these fi nancial statements. After the implementation of the scheme, the Company will directly own the Indian businesses,
which are currently owned by some of its wholly owned subsidiaries and as contemplated in the scheme, any goodwill arising in the Company
pur suant to the scheme, shall be adjusted against the securities premium account.
DescriptionNo. of equity
shares
Issue price
in INRShare capital
Securities
premium
Balance as on 1st January 2008 1,778,399,420 17,783,994 276,084,115
Exercise of stock options-CISMP 792,240 33.70 7,922 18,776
Preferential allotment of shares to non promoter inves-
tors on 22nd April 2008113,000,000 224.30 1,130,000 24,215,900
Exercise of share options -CISMP 525,000 33.70 5,250 12,443
Exercise of share options-CISMP 1,713,078 33.70 17,131 40,600
Exercise of share options-CISMP 1,600,000 33.70 16,000 37,920
Exercise of share options-CISMP 638,078 33.70 6,381 15,122
Share options liability transferred to securities premium
upon exercise of the options665,398
Balance as on 31st March 2009 1,896,667,816 18,966,678 301,090,274
Exercise of share options-CIPOP 190,983 10.00 1,910 Nil
Exercise of share options-CIESOP 115,333 160.00 1,153 17,300
Share options liability transferred to securities premium
upon exercise of the options28,648
Waiver of parent company outstanding balance, pertaining
to share issue expenses paid by parent company, which
had earlier been adjusted from securities premium
25,000
Balance as on 31st March 2010 1,896,974,132 18,969,741 301,161,222
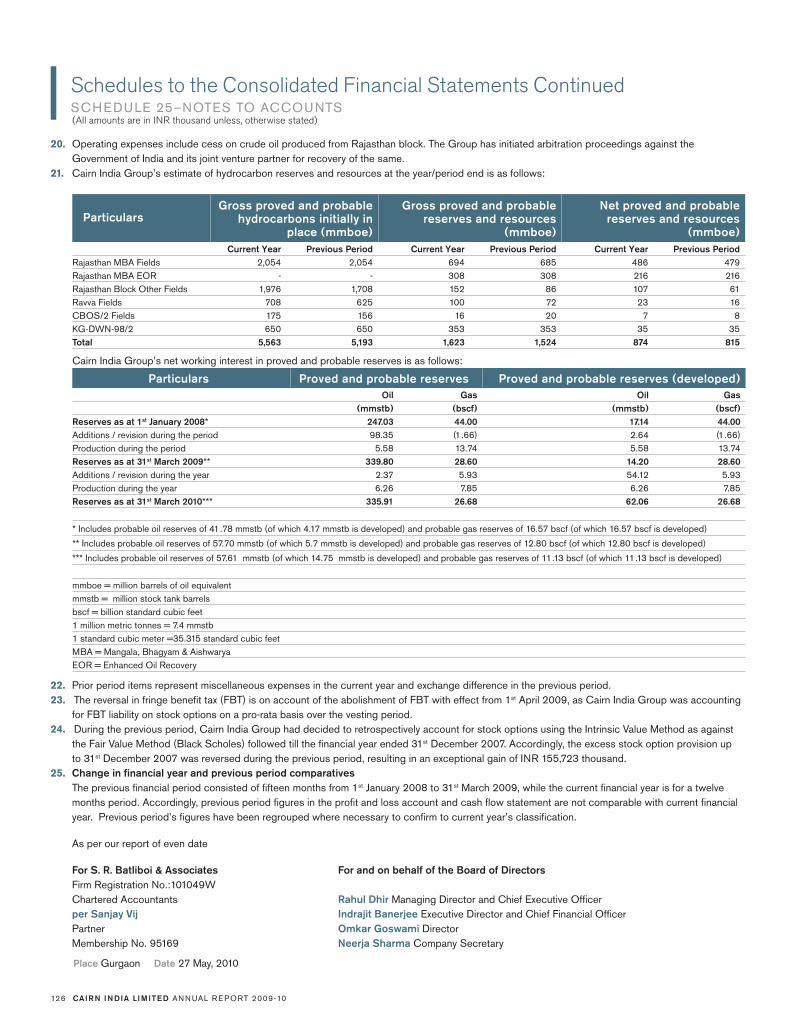
CAIRN INDIA LIMITED AN N UAL R E PORT 2009-10126
ParticularsGross proved and probable
hydrocarbons initially in
place (mmboe)
Gross proved and probable
reserves and resources
(mmboe)
Net proved and probable
reserves and resources
(mmboe)
Current Year Previous Period Current Year Previous Period Current Year Previous Period
Rajasthan MBA Fields 2,054 2,054 694 685 486 479
Rajasthan MBA EOR - - 308 308 216 216
Rajasthan Block Other Fields 1,976 1,708 152 86 107 61
Ravva Fields 708 625 100 72 23 16
CBOS/2 Fields 175 156 16 20 7 8
KG-DWN-98/2 650 650 353 353 35 35
Total 5,563 5,193 1,623 1,524 874 815
(All amounts are in INR thousand unless, otherwise stated)
20. Operating expenses include cess on crude oil produced from Rajasthan block. The Group has initiated arbitration proceedings against the
Government of India and its joint venture partner for recovery of the same.
21. Cairn India Group’s estimate of hydrocarbon reserves and resources at the year/period end is as follows:
22. Prior period items represent miscellaneous expenses in the current year and exchange difference in the previous period.
23. The reversal in fringe benefi t tax (FBT) is on account of the abolishment of FBT with effect from 1st April 2009, as Cairn India Group was accounting
for FBT liability on stock options on a pro-rata basis over the vesting period.
24. During the previous period, Cairn India Group had decided to retrospectively account for stock options using the Intrinsic Value Method as against
the Fair Value Method (Black Scholes) followed till the fi nancial year ended 31st December 2007. Accordingly, the excess stock option provision up
to 31st December 2007 was reversed during the previous period, resulting in an exceptional gain of INR 155,723 thousand.
25. Change in fi nancial year and previous period comparatives
The previous fi nancial period consisted of fi fteen months from 1st January 2008 to 31st March 2009, while the current fi nancial year is for a twelve
months period. Accordingly, previous period fi gures in the profi t and loss account and cash fl ow statement are not comparable with current fi nancial
year. Previous period’s fi gures have been regrouped where necessary to confi rm to current year’s classifi cation.
As per our report of even date
For S. R. Batliboi & Associates For and on behalf of the Board of Directors
Firm Registration No.:101049W
Chartered Accountants Rahul Dhir Managing Director and Chief Executive Offi cer
per Sanjay Vij Indrajit Banerjee Executive Director and Chief Financial Offi cer
Partner Omkar Goswami Director
Membership No. 95169 Neerja Sharma Company Secretary
Place Gurgaon Date 27 May, 2010
Cairn India Group’s net working interest in proved and probable reserves is as follows:
Particulars Proved and probable reserves Proved and probable reserves (developed)
Oil Gas Oil Gas
(mmstb) (bscf) (mmstb) (bscf)
Reserves as at 1st January 2008* 247.03 44.00 17.14 44.00
Additions / revision during the period 98.35 (1.66) 2.64 (1.66)
Production during the period 5.58 13.74 5.58 13.74
Reserves as at 31st March 2009** 339.80 28.60 14.20 28.60
Additions / revision during the year 2.37 5.93 54.12 5.93
Production during the year 6.26 7.85 6.26 7.85
Reserves as at 31st March 2010*** 335.91 26.68 62.06 26.68
* Includes probable oil reserves of 41.78 mmstb (of which 4.17 mmstb is developed) and probable gas reserves of 16.57 bscf (of which 16.57 bscf is developed)
** Includes probable oil reserves of 57.70 mmstb (of which 5.7 mmstb is developed) and probable gas reserves of 12.80 bscf (of which 12.80 bscf is developed)
*** Includes probable oil reserves of 57.61 mmstb (of which 14.75 mmstb is developed) and probable gas reserves of 11.13 bscf (of which 11.13 bscf is developed)
mmboe = million barrels of oil equivalent
mmstb = million stock tank barrels
bscf = billion standard cubic feet
1 million metric tonnes = 7.4 mmstb
1 standard cubic meter =35.315 standard cubic feet
MBA = Mangala, Bhagyam & Aishwarya
EOR = Enhanced Oil Recovery
Schedules to the Consolidated Financial Statements ContinuedSCHEDULE 25–NOTES TO ACCOUNTS

127
S.
No
.N
am
e o
f th
e
Su
bsid
iary
Co
mp
an
yC
ap
ita
lR
ese
rve
sTo
tal A
s-
se
tsTo
tal
Lia
bilit
ies
Inve
stm
en
ts
(exclu
din
g
Inve
stm
en
ts in
S
ub
sid
iari
es
)
De
tails
of
Inve
stm
en
tT
urn
ove
r
Pro
fi t
/
(Lo
ss)
be
fore
ta
xa
tio
n
Pro
vis
ion
fo
r ta
xa
tio
n
Pro
fi t
/
(Lo
ss)
aft
er
taxa
tio
n
Pro
po
se
d
div
ide
nd
1C
airn E
xplo
ration (
No
.7)
Lim
ited
-
(13
,231
) -
-
-
-
-
5
35
-
5
35
N
IL
2C
airn E
xplo
ration (
No
.4)
Lim
ited
-
(2
52
) -
-
-
-
-
9
39
-
9
39
N
IL
3C
airn E
xplo
ration (
No
.2)
Lim
ited
-
(31
,221
) -
-
-
-
-
9
,79
3
-
9,7
93
N
IL
4C
airn E
nerg
y D
iscove
ry L
imited
1,9
56
(
63
,110
) -
-
-
-
-
8
,34
0
-
8,3
40
N
IL
5C
airn E
nerg
y H
ydro
carb
ons
Lim
ited
21,
39
9,5
02
3
,615
,314
5
3,9
81,5
94
5
3,9
81,5
94
1
0,710
M
utu
al Funds
3,5
47,73
9
5,6
46
,472
(
54
5,7
29
) 6
,19
2,2
01
NIL
6C
airn E
nerg
y P
etr
ole
um
India
Lim
ited
-
-
-
-
-
-
-
-
-
-
NIL
7C
airn E
nerg
y H
old
ings
Lim
ited
19
,02
6,7
56
8
,72
7,0
60
2
7,470
,88
0
27,
470
,88
0
-
-
53
4,5
69
6
52
,39
6
-
65
2,3
96
N
IL
8C
airn E
nerg
y N
eth
erlands
Hold
ings
B.V
. 7
60
2
3,4
12,4
92
2
3,4
29
,84
5
23
,42
9,8
45
-
-
-
(
5,107
) -
(
5,107
) N
IL
9C
airn E
nerg
y G
roup H
old
ings
B.V
. 4
,276
2
6,0
98
,477
2
6,0
86
,673
2
6,0
86
,673
-
-
-
5
,20
8,8
62
-
5
,20
8,8
62
N
IL
10C
airn E
nerg
y In
dia
Hold
ings
B.V
. 7
90
6
,88
6
4,5
03
4
,50
3
1,2
67
M
utu
al Funds
-
5,14
2,0
58
-
5
,14
2,0
58
N
IL
11C
airn E
nerg
y G
uja
rat
Hold
ing B
.V.
79
0
(18
) 7
90
7
90
-
-
-
8
41,2
38
-
8
41,2
38
N
IL
12C
airn E
nerg
y G
uja
rat
B.V
. 7
90
6
45
,52
6
1,16
0,0
17
1,16
0,0
17
2,3
81
Mutu
al Funds
88
2,5
53
5
98
,80
5
119
,978
4
78
,82
8
NIL
13C
airn E
nerg
y In
dia
West
Hold
ing B
.V.
791
(1
8)
79
0
79
0
-
-
-
1,0
74,9
13
-
1,0
74,9
13
NIL
14C
airn E
nerg
y In
dia
West
B.V
. 7
90
8
50
,46
2
1,717
,52
0
1,717
,52
0
25
,479
M
utu
al Funds
1,16
4,9
72
8
22
,774
2
13,4
74
60
9,3
00
N
IL
15C
airn E
nerg
y C
am
bay
Hold
ing B
.V.
78
9
52
8
59
8
59
-
-
-
8
41,2
38
-
8
41,2
38
N
IL
16C
airn E
nerg
y C
am
bay
B.V
. 7
90
6
67,
681
1
,171
,378
1
,171
,378
4
,42
8
Mutu
al Funds
891
,375
5
71,6
04
1
12,2
42
4
59
,36
2
NIL
17C
airn E
nerg
y A
ust
ralia
Pty
Lim
ited
23
,33
8,0
51
5,7
91,6
34
2
9,2
18,4
35
2
9,2
18,4
35
-
-
-
(1
9,4
17)
-
(19
,417
) N
IL
18C
EH
Aust
ralia
Lim
ited
6,3
41,4
56
-
6
,341
,45
6
6,3
41,4
56
-
-
-
-
-
-
N
IL
19C
EH
Aust
ralia
Pty
Lim
ited
6,3
41,4
56
-
6
,341
,45
6
6,3
41,4
56
-
-
-
-
-
-
N
IL
20
Cairn E
nerg
y A
sia P
ty L
imited
20
,015
,011
1
,691
,773
2
1,6
43
,98
9
21,
64
3,9
89
-
-
-
(
42
,217
) -
(
42
,217
) N
IL
21W
ess
ing
ton Inve
stm
ents
Pty
. Lim
ited
19
4,5
43
(1
94
,54
3)
-
-
-
-
-
-
-
-
NIL
22
Cairn E
nerg
y In
vest
ments
Aust
ralia
P
ty L
imited
22
,419
,091
(1
,49
4,8
07
) 2
0,9
24
,28
4
20
,92
4,2
84
-
-
-
-
-
-
N
IL
23
Syd
ney
Oil
Com
pany
Pty
. Lim
ited
20
,99
2,10
4
971
,72
7
21,
96
3,8
30
2
1,9
63
,83
0
-
-
-
-
-
-
NIL
24
Cairn E
nerg
y In
dia
Pty
Lim
ited
21,
94
5,3
24
1
5,718
,73
4
67,
951
,574
6
7,9
51,5
74
173
,58
4
Curr
ent
Inve
stm
ents
(at
low
er
of
cost
and m
ark
et
valu
e)
- unquote
d a
nd t
rade:
75
5,2
75
equity
share
s of
Rs.10
each
fully
paid
up in V
idecon Indust
ries
/L
imited &
inve
stm
ent
in M
utu
al Funds
9,177,
014
5
,89
6,16
8
(2
03
,570
) 6
,09
9,7
38
N
IL
25
Cairn India
Hold
ing
s L
imited
48
,99
3,0
44
2
1,5
93
,90
0
56
,231
,46
5
56
,231
,46
5
89
,407
M
utu
al Funds
-
(3
,678
,18
8)
-
(3
,678
,18
8)
NIL
26
Cairn E
nerg
y G
uja
rat
Blo
ck 1
Lim
ited
46
5
4,5
75
-
-
-
-
-
(
8,3
78
) -
(
8,3
78
) N
IL
27
Cairn E
xplo
ration (
No
.6)
Lim
ited
-
(4
87
) -
-
-
-
-
(
60
) -
(
60
) N
IL
28
Cairn L
anka P
riva
te L
imited
60
6,4
18
(6
27,
231
) 7
4,0
83
7
4,0
83
-
-
-
(
55
9,0
74)
-
(5
59
,074
) N
IL
29
Cairn E
nerg
y D
eve
lopm
ents
Pte
Lim
ited
-
(5
95
) 2
58
2
58
-
-
-
(
59
5)
-
(5
95
) N
IL
30
CIG
Mauritius
Hold
ing P
vt L
imited
611
,62
7
(4
,14
5)
60
8,0
93
6
08
,09
3
-
-
-
(6
27
) -
(
62
7)
NIL
31C
IG M
auritius
Priva
te L
imited
60
6,9
89
(
43
3)
607,
49
5
607,
49
5
-
-
-
(1,0
97
) -
(1
,097
) N
IL
(All
am
ounts
are
in t
housa
nd India
n R
upees
unle
ss, o
therw
ise s
tate
d)
Purs
uant
to s
ection 2
12 (
8)
of
the C
om
panie
s A
ct, 1
95
6, t
he c
om
pany
has
obta
ined e
xem
ption f
rom
the M
inis
try
of
Corp
ora
te A
ffairs, N
ew
Delh
i, vi
de its
lett
er
No.4
7/2
47/
201
0-C
L-I
II date
d 1
3/0
5/2
010
to a
ttach
accounts
of
subsi
dia
ries. T
he a
ccounts
of
subsi
dia
ries
are
ava
ilable
for
insp
ection o
f m
em
bers
on a
ny
work
ing
day
at
the r
eg
iste
red o
ffi c
e o
f th
e c
om
pany
betw
een 1
0 a
m a
nd 1
2 n
oon. A
sta
tem
ent
purs
uant
to a
bove
ord
er
giv
ing
deta
ils o
f su
bsi
dia
ries
is g
iven b
elo
w:
Sta
tem
en
t P
urs
ua
nt
to S
ecti
on
212
(8
) o
f th
e C
om
pa
nie
s A
ct,
19
56
Fo
r a
nd
on
be
ha
lf o
f th
e B
oa
rd o
f D
ire
cto
rs
Ra
hu
l D
hir
Manag
ing
Directo
r and
Chie
f E
xecutive
Offi c
er
Ind
rajit
Ba
ne
rje
e E
xecutive
Directo
r and
Chie
f F
inancia
l O
ffi c
er
Om
ka
r G
osw
am
i D
irecto
r
Ne
erj
a S
ha
rma
Co
mp
any
Secre
tary
Pla
ce G
urg
aon D
ate
27
May,
2010

CAIRN INDIA LIMITED AN N UAL R E PORT 2009-10128
G LO S S A RY
abbreviations and full forms for main terms used in this report
CORPORATE
AGM Annual General Meeting
Board The Board of Directors of Cairn India Limited
BSE Bombay Stock Exchange Ltd
Cairn Cairn India Limited and its subsidiaries
CEIL or CEIPL Cairn Energy India Pty Limited
CIG Cairn India Group
CIHL Cairn India Holdings Limited
Company Cairn India Limited
DGH Director General of Hydrocarbons
EGM Extraordinary General Meeting
FDP Field Development Plan
GDP Gross Domestic Product
GoI Government of India
IP Institutional Plan
IPO Initial Public Offering
ISIN International Securities Identifying Number
ITC Item code No.
LTIP Long Term Incentive Plans
MoPNG Ministry of Petroleum and Natural Gas
MPT Mangala Processing Terminal
NELP New Exploration Licensing Policy
NRI Non Resident Indian
NSE National Stock Exchange of India Limited
ONGC Oil and Natural Gas Corporation Limited
OPEC Organisation of Petroleum Exporting Countries
PICL PETRONAS International Corporation Ltd
PRA Production Resources Agreement
PSC Production Sharing Contract
PSU Public Sector Undertaking
RoU Right of Use
SEBI Securities and Exchange Board of India
SIPD Shell India Production Development B.V.
TECHNICAL
1P Proved
2P Proved plus Probable
3D 3 Dimensional
3P Proved plus Probable and Possible
AGI Above Ground Installation
API American Petroleum Institute
ASP Alkali Surfactant Polymer
boepd barrels of oil equivalent per day
bopd barrels of oil per day
bscf billion standard cubic feet
°C Celcius
CO2 Carbon Dioxide
E & P Exploration and Production
EOR Enhanced Oil Recovery
GBA Gas Balancing Agreement
GHG Green House Gas
GIIP Gross Intial In Place
HDPE High Density Polyethylene
HPSV High Power Sodium Vapour
HSE Health, Safety and Environment
ISO International Organisation for Standardization
JIP Joint Industry Project
Km Kilometre
Km2 Square Kilometre
LTIFR Lost Time Injury Frequency Rate
MARS Mangala, Aishwariya, Raageshwari and Saraswati
MBA Mangala, Bhagyam and Aishwariya
mmbbls million barrels
mmboe million barrels of oil equivalent
mmscfd million standard cubic feet of gas per day
mmstb million stock tank barrels
MW Mega Watt
pigs pipeline inspection gauges
PDC Polycrystalline Diamond Compact
PE Polyethylene
PUF Polyurethane Foam
PWRI Produced Water Re Injection
OHSAS Occupational Health & Safety Advisory Services
SEHMS Skin Effect Heat Management System
STOIIP Stock Tank Oil Initially in Place
TRIFR Total Recordable Incident Frequency Rate
ACCOUNTING
ADR American Depository Receipt
AS Accounting Standard
BDC Base Development Costs
CAGR Compounded Annual Growth Rate
CIESOP Cairn India Employee Stock Option Plan
CIPOP Cairn India Performance Option Plan
CISMP Cairn India Senior Management Plan
CY Calendar Year
EPS Earnings per share
ESOP Employee Stock Option Plan
FBT Fringe Benefi t Tax
FY Financial Year
GDR Global Depository Receipt
H1 First Half
ICAI Institute of Chartered Accounts of India
IFC International Finance Corporation
IFRS International Financial Reporting Standards
INR Indian Rupees
MAT Minimum Alternate Tax
PTRR Post Tax Rate of Return
Q3 Third Quarter
USD United States Dollar
CORPORATE RESPONSIBILITY
CEDPA Centre for Development and Population Activities
CSR Corporate Social Responsibility
EC Enterprise Centre
MCX Multi Commodity Exchange of India Limited
MDG Millennium Development Goals
NGO Non Government Organisation
NGRI National Geophysical Research Centre
UNDP United Nations Development Programme

N OT E S

N OT E S

N OT E S

C O M PA N Y I N F O R M AT I O N
BOARD OF DIRECTORS
Sir William B.B. Gammell (Chairman)
Malcolm Shaw Thoms (Deputy Chairman)
Jann Brown
Naresh Chandra
Dr Omkar Goswami
Aman Mehta
Edward T. Story
Rahul Dhir (Managing Director & Chief Executive Offi cer)
Indrajit Banerjee (Executive Director & Chief Financial Offi cer)
Rick Bott (Executive Director & Chief Operating Offi cer)
BOARD COMMITTEES
Audit Committee
Aman Mehta (Chairman)
Naresh Chandra
Dr Omkar Goswami
Edward T. Story
Jann Brown
Remuneration Committee
Naresh Chandra (Chairman)
Sir William B.B. Gammell
Malcolm Shaw Thoms
Aman Mehta
Dr Omkar Goswami
Nomination Committee
Sir William B.B. Gammell (Chairman)
Rahul Dhir
Jann Brown
Malcolm Shaw Thoms
Edward T. Story
Shareholders’ / Investors’ Grievance Committee
Dr Omkar Goswami (Chairman)
Edward T. Story
Rahul Dhir
COMPANY SECRETARY
Neerja Sharma
STATUTORY AUDITORS
S.R. Batliboi & Associates
Golf View Corporate Tower B
Sector 42, Sector Road
Gurgaon 122 002, India
BANKERS
State Bank of India | Standard Chartered Bank |
Deutsche Bank | Citibank
STOCK EXCHANGES LISTED ON
Bombay Stock Exchange Limited
Phiroze Jeejeebhoy Towers,
Dalal Street, Mumbai – 400 001
Tel +91 22 22721233/4
Fax +91 22 22721919
National Stock Exchange of India Limited
Exchange Plaza,
Plot No, C/1, G Block,
Bandra-Kurla Complex,
Bandra (E),
Mumbai – 400 051
Tel +91 22 26598100-8114
Fax +91 22 26598120
REGISTERED OFFICE
101, West View
Veer Savarkar Marg
Prabhadevi
Mumbai 400 025, India
Tel +91 22 24338306
Fax +91 22 24311160
CORPORATE OFFICE
3rd & 4th Floors, Vipul Plaza
Sun City, Sector 54
Gurgaon 122 002, India
Tel +91 124 2703000
Fax +91 124 2889320
REGISTRAR & SHARE TRANSFER AGENT
Link Intime India Private Limited
C-13, Pannalal Silk Mills Compound
L.B.S. Marg, Bhandup (West)
Mumbai 400 078, India
Contents
Board of Directors
Chairman's letter
Managing Director and CEO's letter
Management Discussion and Analysis
Securing Energy, Fuelling Growth
Delivering to the Nation
Corporate Social Responsibility
Report on Corporate Governance
Additional Shareholder Information
Directors’ Report
Auditors’ Report
Balance Sheet
Profi t and Loss Account
Statement of Cash Flows
Schedules to the Financial Statements
Balance Sheet Abstract and Company’s General Business Profi le
Auditors’ Report on Consolidated Financial Statements
Consolidated Balance Sheet
Consolidated Profi t and Loss Account
Consolidated Statement of Cash Flows
Schedules to Consolidated Financial Statements
Glossary
2
5
6
8
20
42
44
48
56
62
68
72
73
74
76
97
98
99
100
101
103
128

Energy for India
ANNUAL REPORT & FINANCIAL STATEMENTS
Securing EnergyFuelling Growth
Desig
ned
by
ww
w.ic
din
dia
.co
m &
Printe
d a
t H
T B
urd
a M
ed
ia L
td.
Cairn India Limited
3rd & 4th Floors, Vipul Plaza, Sun City
Sector 54, Gurgaon 122 002, India
+91 124 270 3000
www.cairnindia.com
Cairn
Ind
ia L
imite
d A
nnual R
ep
ort &
Fin
ancia
l Sta
tem
ents
20
09
–10