energy fact book 2016–2017 - natural resources canada · energy fact book — 2016–2017 v...
TRANSCRIPT

Energy Fact Book 2016–2017


Energy Fact Book 2016–2017

Information contained in this publication or product may be reproduced, in part or in whole, and by any means, for personal or public non-commercial purposes, without charge or further permission, unless otherwise specified.
You are asked to:
• Exercise due diligence in ensuring the accuracy of the materials reproduced.• Indicate the complete title of the materials reproduced and the name of the author
organization.
• Indicate that the reproduction is a copy of an official work that is published by Natural Resources Canada (NRCan) and that the reproduction has not been produced in affiliation with, or with the endorsement of, NRCan.
Commercial reproduction and distribution is prohibited except with written permission from NRCan. For more information, contact NRCan at [email protected].
Cat. No. M136-1E (Print)ISSN 2291-9066Cat. No. M136-1E-PDF (Online)ISSN 2291-9074
Aussi disponible en français sous le titre : Cahier d’information sur l’énergie, 2016-2017
Recycled paper

vEnergy Fact Book — 2016–2017
PrefaceThe purpose of the Energy Fact Book is to provide key information on energy markets in Canada in a format that is easy to consult.
This edition is based on data and information available as of June 2016. All data is subject to revisions by statistical sources. In some instances, more than one source may be available and discrepancies in numbers may occur because of conceptual or methodological differences. In addition, some numbers may not add up precisely due to rounding.
This publication was assembled by the Energy and Economic Analysis division of the Energy Policy branch with the help of subject experts from across the Energy sector, the Minerals and Metals sector, the Innovation and Energy Technology sector, and other sectors of Natural Resources Canada.


viiEnergy Fact Book — 2016–2017
ContentsPage
1 Energy industries 1
2 Crude oil 27
3 Petroleum products 41
4 Hydrocarbon gas liquids 49
5 Natural gas 51
6 Coal 63
7 Uranium and nuclear power 69
8 Renewable energy 77
9 Electricity 93
10 Energy demand 99
11 Greenhouse gas emissions 115
Annex 1 Units and conversion factors 119
Annex 2 Abbreviations 123
Annex 3 Sources 125


1Energy Fact Book — 2016–2017
Energy industries1 DefinitionIn this publication, the following industries are considered to be energy industries:
• oil and gas extraction
• coal mining
• uranium mining
• support activities for oil and gas extraction
• electric power generation, transmission and distribution
• pipeline transportation
• natural gas distribution
• biofuels production
• petroleum refineries
Clean energy industries such as renewable and nuclear electricity generation, biofuels production and carbon capture and storage (CCS) facilities are contained within the definition of energy industries. Some energy-related industries (e.g. petroleum product wholesaler-distributors and coal product manufacturing) are excluded because of a lack of data.

2
Energy industries
Energy Fact Book — 2016–2017
Energy flow
Primary sources
Fossil fuels Renewables Nuclear
Coal Hydro, Wind, Tidal, Solar, Geothermal,
Biomass
Uranium
Natural gas
HGLs
Crude oil
Transformation
Coke Refined petroleum products (e.g. gasoline, diesel, heating oil, and polyethylene)
Secondary electricity
Energy final demand Other uses
• residential
• commercial/institutional
• industrial
• transportation
• producer use
• energy losses duringtransformation
• non-energy uses(e.g. feedstockfor chemicals)
Electricity mix

3
Energy industries
Energy Fact Book — 2016–2017
Canada’s position in the world (2015)
Resource Proved reserve/ capacity
Production Exports
Crude oil 3rd 4th 3rd
Natural gas 17th 5th 4th
Coal 15th 12th 8th
Uranium 4th 2nd 2nd
Electricity 7th 6th 3rd
Renewable energy – 7th –
Hydroelectricity 4th 2nd –
Wind 7th – –
Biofuels – 5th –
Note: Rankings are based on proved reserves for oil, natural gas, coal and uranium, and capacity for the other energy sources.

4
Energy industries
Energy Fact Book — 2016–2017
North American Cooperation on Energy Information (NACEI)As part of the trilateral memorandum of understanding (MoU) concerning climate change and energy collaboration, the Energy Ministers from Canada, Mexico and the United States (U.S.) have created an institutional framework for consultation and sharing publicly available energy information among the countries.
The areas of focus as they relate to collaboration on energy information include:
• Energy trade statistics: Comparing, validating and improving respective energy import and export information;
• Geographical energy information: Sharing publicly available geospatial information related to energy infrastructure;
• Outlooks for energy supply and demand: Exchanging views and information on projections of cross-border energy flows; and
• Cross reference for energy terminology: Harmonizing terminology, concepts and definitions of energy products.
To access related products, visit the NACEI web portal at www.nacei.org, where you will find:
• Data tables for trade flows of energy products and a methodological guide explaining the various sources of data;
• Static and dynamic maps of North America’s energy infrastructure and renewable energy resource potential;
• A report on the framework required to develop more harmonized North American energy outlooks; and
• A cross-referenced guide of terms relevant to each of the above three areas of analysis.
Note that the product offering from this trilateral collaboration will continue to be developed and updated on a regular basis.

5
Energy industries
Energy Fact Book — 2016–2017
Energy in the Canadian economy (2015)
Nominal gross domestic product (in 2015 prices)
Industry Nominal GDP* ($ billions)
% of Canadian GDP
Energy (Direct)• Oil and gas**• Electricity
1369835
7.35.31.9
Energy (Indirect)***• Oil and gas
6445
3.52.4
Total (Direct + Indirect)• Oil and gas
200142
10.87.7
Employment
Industry Employment (jobs)
% of total employment
Energy (Direct)• Oil and gas**• Electricity
280,365191,415
78,270
1.51.00.4
Energy (Indirect)***• Oil and gas• Oil and gas construction
625,033518,133203,065
3.42.81.1
Total (Direct + Indirect)• Oil and gas
905,398709,548
5.03.9
* Natural Resources Canada (NRCan) estimates
** Oil and gas includes oil and gas extraction, support activities for oil and gas extraction, natural gas distribution, petroleum refineries, and pipeline transportation.
*** These NRCan estimates include industries that supply goods and services to the energy industry, such as equipment manufacturing, construction and financial services.
Revised Statistics Canada data shows that direct and indirect employment in the oil and gas sector has declined by 47,225 (6.2%) since 2014, as a result of the low oil price environment.
About 16,200 Aboriginal people living off-reserve are directly employed in the energy sector.

6
Energy industries
Energy Fact Book — 2016–2017
Provincial/territorial nominal gross domestic product (in 2015 prices)
Province/territory Energy sector nominal GDP ($ millions)
% of total GDP
British Columbia 9,201 4.4
Alberta 64,007 21.7
Saskatchewan 10,456 17.9
Manitoba 3,178 5.8
Ontario 15,383 2.5
Quebec 13,028 4.2
New Brunswick 1,968 7.4
Nova Scotia – –
Prince Edward Island 159 3.4
Newfoundland and Labrador
5,018 19.7
Yukon 39 1.8
Northwest Territories 260 6.8
Nunavut – –

7
Energy industries
Energy Fact Book — 2016–2017
Provincial/territorial employment
Province/territory Energy sector employment (jobs)
% of total employment
British Columbia 20,400 0.9
Alberta 162,280 6.9
Saskatchewan 19,910 3.3
Manitoba 8,425 1.3
Ontario 37,290 0.5
Quebec 18,880 0.5
New Brunswick 3,300 0.9
Nova Scotia 2,645 0.6
Prince Edward Island – –
Newfoundland and Labrador
5,630 2.4
Yukon 215 0.8
Northwest Territories 835 2.6
Nunavut – –

8
Energy industries
Energy Fact Book — 2016–2017
Energy trade
Resource/product
Exports* Imports
% of Canadian production
% to U.S.
% of U.S. imports
% of U.S. consumption
% of Canadian consumption
Crude oil 78 99 43 20 33
Refined petroleum products
26 95 29 3 13
Natural gas
51 100 97 10 21
Coal 49 4 10 0.1 19
Uranium 86 33 18 17 –
Electricity 9 100 89 2 2
Exports*
• $102 billion
• 21% of Canadian domestic merchandise exports
• 94% ($96 billion) of total Canadian energy exports are to the U.S.
• Oil and gas domestic exports totaled $93 billion, of which 98% were to the U.S.
Imports
• $40 billion
• 8% of Canadian merchandise imports
• 69% ($28 billion) of total energy imports are from the U.S.
* Exports refers to domestic exports, which exclude the re-export of goods that have previously entered Canada and exit in the same condition.

9
Energy industries
Energy Fact Book — 2016–2017
Capital expenditures*
• $90 billion, a decrease of over $27 billion or 23% from 2014.
• 36% of total investments in non-residential and machinery and equipment in Canada.
• Oil and gas industries accounted for $65 billion or 26% of the Canadian total.
• Oil and gas companies spent an additional $5.2 billion on exploration in 2014.
* excludes residential expenditures and intellectual property investments such as exploration expenses
Capital expenditures in the energy industry
$ bi
llion
Other Oil and gas extraction
2015
2014
2013
2012
2011
2010
2009
2008
2007
0
20
40
60
80
100
120

10
Energy industries
Energy Fact Book — 2016–2017
Government revenues
• Federal and provincial and territorial (P/T) governments in Canada receive direct revenues from energy industries through:
• corporate income taxes
• indirect taxes, such as sales and payroll taxes
• Crown royalties, which are the share of the value of oil and gas extracted that is paid to the Crown as the resource owner
• Crown land sales, which are paid to the Crown in order to acquire the resource use for specific properties
Source 2010–2014 average ($ billions)
Income tax 4.9
Indirect taxes 2.2
Royalties 12.3
Land sales 2.8
Total 22.2
• The largest share of government revenues is collected from the oil and gas industry, which averaged $20.3 billion over the last five years, including $17.7 billion from upstream oil and gas extraction and its support activities.
• Between 2010 and 2014, the energy sector’s share of total taxes paid was 9.1% and its share of operating revenues was 13.0%.

11
Energy industries
Energy Fact Book — 2016–2017
Total taxes paid by energy industries
Total oil and gas Crown royalties and land sales in Canada
$ bi
llion
Pipelines
Utilities
Petroleum and coal product manufacturing
Oil and gas extraction and support activities
14
12
10
8
6
4
2
0
2007
2006
2005
2004
2008
2009
2010
2011
2012
2013
2014
$ bi
llion
Oil sands Conventional oil and gas
2007
2006
2005
2004
2008
2009
2010
2011
2012
2013
2014
30
25
20
15
10
5
0

12
Energy industries
Energy Fact Book — 2016–2017
Energy and clean technology (Cleantech)
• There is no generally accepted definition of the Cleantech sector, nationally or internationally. NRCan is leading work with Statistics Canada and Innovation, Science and Economic Development to better define the sector and enhance data collection.
• Most definitions include a number of different industry sub-sectors, some of which overlap with the energy sector.
Clean Technology
includes
• Transportation
• Air, water, environmental, remediation
• Waste and recycling
• Water production, treatment, efficiency
• Agricultural practices and
land use
• Advanced materials
Energy Sectorincludes
• Extraction• Transformation
• Generation• Transmission
• Distribution
and the use of
• Crude oil• Refined petroleum products• Natural gas
• Coal• Uranium
• Electricity
Renewable/non-emittingtechnologies
• Solar• Wind
• Hydro/wave/tidal• Geothermal
• Biofuels/biomass• Nuclear
• Carbon capture and storage
Transmission:• Smart grid
• Energy storage
Energy efficiency fechnologies
• Green buildings• Cogeneration

13
Energy industries
Energy Fact Book — 2016–2017
Market structure
• The majority of Cleantech companies are early-stage firms and small and medium-sized enterprises (SMEs), with a small number of firms large enough to be listed on stock exchanges.
• The TSX and TSX-Venture exchanges list 110 companies in the Cleantech* sector, with a total market capitalization of $31 billion. Ninety-six of those companies are headquartered in Canada, with a total market cap of $27 billion (as of April 30, 2016).
Key facts
• Canada ranked sixth in the world for investment in new domestic clean energy generation projects in 2014. From 2010 to 2014, Canada’s cumulative national investment in the clean technology sector amounted to over $31 billion.
• According to industry estimates, Canadian pure play** Cleantech companies generated over $11 billion of revenues and employed over 50,000 people in 2014.
• Estimated R&D spending of Canadian pure play Cleantech companies was over $1.2 billion in 2014, 70% of which came from SMEs.
* The TSX/TSXV defines Cleantech companies as companies whose operations fall under one of five environmental categories: Energy Efficiency; LowImpact Material and Products; Renewable Energy Equipment Manufacturing and Technology; Renewable Energy Production and Distribution; and Waste Reduction and Water Management.
** A pure play company solely operates in one line of business. In this case, a pure play Cleantech company solely operates under one of the five environmental categories listed above.

14
Energy industries
Energy Fact Book — 2016–2017
• As depicted in a new on-line map of Clean Energy Resources and Projects (CERP) in Canada (http://atlas.gc.ca/cerp-rpep/en/), Canada has 42 clean energy test centres and 57 research development & demonstration (RD&D) projects. Canada also has a large number of renewable energy projects, which are described in more detail in the “Renewable energy” chapter.
• Canada is home to 3 of the world’s 15 large-scale operational CCS projects: Boundary Dam, Quest and Weyburn-Midale. In total, Canada’s key CCS projects include:
• SaskPower’s Boundary Dam project, launched in October 2014, is the first commercial CCS project at a coal-fired power plant.
• The Shell Quest Project, launched in November 2015, is the first industrial CCS project designed to capture and store over 1 million tonnes of CO2 per year.
• The Weyburn-Midale Project is the largest ongoing CO2-enhanced oil recovery (EOR) project with over 30 million tonnes of stored CO2 since 2000.
• The PTRC’s Aquistore project is the largest CO2 monitoring and storage infrastructure, with investments of $40 million in installed monitoring equipment.
• The North West Redwater Sturgeon Refinery in Alberta is the only refinery being constructed with CCS integrated.
• Nova Scotia-based CarbonCure’s CO2 recycling technology was used by concrete manufacturer Argos in the first delivery of ready-mixed concrete manufactured with recycled CO2.
• The Field Research Station in Alberta is the only site to study CO2 injected at intermediate subsurface depths.

15
Energy industries
Energy Fact Book — 2016–2017
Energy research, development and demonstration
Canadian public expenditures on total energy RD&D
• Combined federal/provincial/territorial energy RD&D expenditures of about $936 million in 2014/15, down from $1.3 billion in 2013/14.
• Due largely to a decrease in provincial spending on carbon, capture and storage projects transitioning to commercial operation.
• Federal energy RD&D expenditures of $416 million in 2014/15.
• Key organizations: AECL ($100 million), NRCan ($99 million), NSERC ($88 million), and SDTC ($57 million).
• Accounted for approximately 6.2% of federal R&D expenditures in all economic sectors ($6,758 million).
• P/T government energy RD&D expenditures of $520 million in 2014/15.
• Includes expenditures of $424 million by utilities and other publicly owned entities.
• The Canadian industry spent about $2 billion on energy R&D in 2013.
Canadian public expenditures on total energy RD&D
* Provincial and territorial includes utilities and other publicly owned entities.
Provincial and territorial RD&D*
$ m
illio
n
Federal RD&D
0
200
400
600
800
1,000
1,200
1,400
2014–20152013–20142012–20132011–20122010–2011

16
Energy industries
Energy Fact Book — 2016–2017
Expenditures on total energy RD&D by technology area
Federal (2014/15)
Provincial and territorial (2014/15)
Industry (2013)
($ millions)
Fossil fuels supply (including carbon capture and storage)
99 274 1,532
Renewable and clean energy supply
217 167 273
Energy end use 100 79 197
Total energy RD&D
416 520 2,001
Mission Innovation – Clean energy RD&D
• Through Mission Innovation (http://mission-innovation.net/), Canada, along with 19 other countries and the European Union, have expressed a shared desire to accelerate global clean energy innovation.
• All Mission Innovation members intend on doubling clean energy R&D investment over five years.
• Through Mission Innovation, the Government of Canada established Canada’s energy RD&D baseline level at $387 million* for 2014/2015, and intends to increase spending to $775 million by 2019/2020.
* Canada’s Mission Innovation baseline of $387 million is a subset of Canada’s federal energy RD&D spending of $416 million that excludes nuclear activities not directly related to clean energy RD&D.

17
Energy industries
Energy Fact Book — 2016–2017
Investment in Canadian energy industriesCanada’s energy industries operate within open markets, where investments by both Canadian and foreign companies ensure an efficient, competitive and innovative energy system.
Direct investment in Canada and abroad
Direct investment is defined as a company owning voting equity interest in a foreign enterprise and is measured as the total equity value at the time of acquisition.
Stock of foreign direct investment in Canada and Canadian direct investment abroad in the energy industry
Stock of foreign direct investment in Canada
• The stock of foreign direct investment (FDI) in the energy sector is estimated to have reached $208 billion in 2015, up from $81 billion in 2006.
• The energy industry’s share of overall FDI in Canada has also been steadily increasing, reaching more than 27% in 2015, up from 18% in 2006.
• The stock of FDI from the U.S. in Canada’s oil and gas extraction industry, including support services, more than tripled from $18.9 billion in 2000 to $69.4 billion in 2015.
$ bi
llion
CDIA FDI
0
50
100
150
200
250
2015
2014
2013
2012
2011
2010
2009
2008
2007
2006

18
Energy industries
Energy Fact Book — 2016–2017
Stock of Canadian direct investment abroad
• The stock of Canadian direct investment abroad (CDIA) from the energy sector is estimated to have reached $148 billion in 2015, up from $71 billion in 2006.
• Investment in oil and gas extraction accounted for $80 billion of the CDIA stock in 2015.
• Investment by Canada’s energy companies in the U.S. accounts for 48% of the stock of energy CDIA and has grown from $26 billion in 2000 to $71 billion in 2015.
Foreign control of Canadian assets
Foreign control is a measure of the extent to which foreign entities operate in Canada. Generally, a corporation is deemed to be foreign-controlled if more than 50% of its shares are owned by one or more foreign companies.
Foreign control of Canadian assets
2013
2012
2011
2010
2009
2008
2007
2006
2005
2004
0
10
20
30
40
50
Oil and gas extraction and support activities
Utilities
All non-financial industries
Perc
enta
ge c
ontro
lled
(%)

19
Energy industries
Energy Fact Book — 2016–2017
Mergers and acquisitionsIn 2015, Canadian energy companies and assets were involved in 247 merger and acquisition* (M&A) transactions worth $24.9 billion, a 50% decline from 2014 M&A activity ($50.1 billion).
Canadian companies were the most active buyers of Canadian energy companies and assets, accounting for 9 of the top 10 M&A transactions by value. Canadian buyers represented 82% of total M&A activity in Canada’s energy sector, as compared to 42% of transaction value in 2014 and 25% of transaction value in 2012.
M&A activity in Canada’s energy sector
* Merger and acquisition deals are attributed to the year during which they were announced and are valued on a net transaction basis.
Domestic Foreign
Deal
val
ue($
bill
ions
)
Unknown
0
10
20
30
40
50
60
2015201420132012
4%
71%
25%
8%
45%
47%
3%
55%
42%
6%
12%
82%

20
Energy industries
Energy Fact Book — 2016–2017
There were 186 oil and gas deals (75% of total) at a transaction value of $21.9 billion (88% of total value).
Electricity and renewables transactions accounted for $2.5 billion from 32 deals.
Coal and uranium deals were valued at just under $400 million from 29 deals.
Value (millions)
Count
Oil and gas $21,940.3 186
Electricity and renewables $2,530.6 32
Uranium $245.8 20
Coal $133.7 9
Total $24,850.4 247

21
Energy industries
Energy Fact Book — 2016–2017
Mergers and Acquisitions – Major Recent Deals
January 2016: Irving Infrastructure Corporation (United Kingdom) acquired Capstone Infrastructure Corporation for $2.1 billion.
November 2015: Suncor Energy Inc. (Canada) acquired 84.2% of Canadian Oil Sands Limited for $6 billion.
November 2015: PrairieSky Royalty Ltd. (Canada) acquired a portion of Royalty Assets from Canadian Natural Resources Limited for $1.7 billion.
June 2015: Natural Resources Group (Canada) acquired Heritage Royalty Limited Partnership from Cenovus Energy Inc. for $3.3 billion.
May 2015: Crescent Point Energy Corp. (U.S.) acquired Legacy Oil + Gas Inc. for $1.5 billion.
May 2015: Berkshire Hathaway Energy (U.S.) acquired AltaLink from SNC-Lavalin Transmission Ltd. for $3.1 billion.
December 2014: Repsol S.A. (Spain) acquired Talisman Energy Inc. for $16.3 billion.
May 2014: Crescent Point Energy Corp. (U.S.) acquired Canera Energy Corp. for $1 billion.
April 2014: PetroChina (China), through its wholly owned subsidiary Phoenix Energy Holdings Limited (China), acquired the remaining 40% stake in Dover Commercial Project from Athabasca Oil Corporation for $1.23 billion.
March 2014: Progress Energy Resources Corp. (Malaysia) acquired a stake in Montney acreage in northeast British Columbia from Talisman Energy Inc. for $1.5 billion.
February 2014: Canadian Natural Resources Limited (Canada) acquired certain Canadian conventional assets of Devon Canada Corporation for $3.1 billion.
January 2014: Indian Oil Corp. (India) purchased Canadian shale gas assets from Progress Energy Resources Corp. (Malaysia) for $1 billion.
January 2014: Compañía Española de Petróleos, S.A.U. (CEPSA) (Spain) acquired Coastal Energy Company for $2.3 billion.

22
Energy industries
Energy Fact Book — 2016–2017
Canadian energy assetsIn 2014, 435 Canadian energy companies* were identified as having energy assets either in Canada or abroad:
• 59 companies (14%) had energy assets with a value in excess of $1 billion.
• 214 companies (49%) had interests outside of Canada (in 75 countries).
• 166 companies (38%) had energy assets in at least two countries.
Canadian energy assets grew to $543.9 billion in 2014, an increase of 12% from $484.9 billion in 2013. Canadian energy assets abroad totaled $149.7 billion in 2014, an increase of 28% over the 2013 value of $116.9 billion.
In 2014, Canadian energy companies were present in 75 countries, with the majority (70%) of Canadian energy assets abroad value located in the U.S.
* A Canadian company is here defined as a publicly traded company headquartered in Canada and not foreign controlled.

23
Energy industries
Energy Fact Book — 2016–2017
Canadian energy assets by region, 2013 and 2014
Region Canadian energy assets
($ billions)**
Variation in
percentage
2013r 2014
Africa 4.47 4.93 10%
North America (U.S. and Mexico)
77.84 107.03 38%
Americas (South and Central America, Caribbean)
13.31 14.41 8%
Asia 5.45 5.21 -4%
Europe 11.83 13.99 18%
Oceania 4.00 4.10 2%
Total Canadian energy assets abroad
116.90 149.66 28%
Canada 368.00 394.21 7%
Total Canadian energy assets
484.89 543.88 12%
** Source: NRCan; Values may not sum due to rounding.
2013r: 2013 figures were revised using 2014 company filings.

24
Energy industries
Energy Fact Book — 2016–2017
Glo
bal
dis
trib
utio
n o
f C
anad
ian
ener
gy a
sset
s
Ene
rgy
Ass
et V
alue
$0 M
$0 M
– $
10 M
$10
M –
$10
0 M
$100
M –
$1
B$1
B –
$10
B>
$10
B

25
Energy industries
Energy Fact Book — 2016–2017
Canadian energy production
Primary energy production*, by source, 2014
“Other renewables” includes wind, solar, wood/wood waste, biofuels and municipal waste.
Primary energy production by region and source, 2014
* The primary energy equivalent of hydroelectricity is calculated using the physical energy content method, as applied by the International Energy Agency and Statistics Canada, in which hydroelectricity is defined as a primary energy form. This differs from the partial substitution method applied by the Energy Information Administration (U.S.), where the primary energy equivalent of hydroelectricity is calculated as the amount of fossil fuel required to generate the same volume of electricity in a thermal power station.
Otherrenewables
4% Nuclear2%
Coal8%
Hydro7%
NGLs3%
Crude oil43%
Natural gas33%
0
1,00
0
2,00
0
3,00
0
4,00
0
5,00
0
6,00
0
7,00
0
8,00
0
9,00
010
,000
11,0
0012
,000
13,0
00
Maritimes
N.L.
Que.
Ont.
Man.
Sask.
Alta.
B.C.
TERR
Other renewables
Coal
Natural gas
Hydro
NGLs
Crude oil
Nuclear
Petajoules

26
Energy industries
Energy Fact Book — 2016–2017
Canadian primary energy supply
Total primary energy supply*, by source, 2014
Renewable energy sources made up 17.7% of Canada’s TPES in 2014.
* Not including electricity trade.
** “Other renewables” includes wind, solar, wood/wood waste, biofuels and geothermal.
Otherrenewables**
6.1%
Waste0.1%
Nuclear9.9%
Crude oiland NGLs
29.8%
Hydro11.6%
Coal8.2%
Natural gas34.2%
Total primary energy supply (TPES) is calculated as production plus imports, less exports and +/- stock changes.
For the purposes of TPES, electricity production and trade are calculated using the energy content of the electricity (i.e. at a rate of 1 TWh = 0.086 million tonnes of oil equivalent (Mtoe)), with the exception of nuclear electricity, which is calculated assuming a 33% conversion efficiency factor increase (i.e. 1 TWh = (0.086 ÷ 0.33) Mtoe). This conversion factor explains the difference in the share of nuclear energy between primary energy production and TPES.

27Energy Fact Book — 2016–2017
Crude oil2 Canadian industry structure• The upstream oil and gas industry comprises several hundred
companies that engage in activities such as exploration, drilling, production and field processing.
• The 5 largest companies are responsible for over half of oil production in Canada.
• A variety of firms provide support services to oil extraction operations such as contract drilling and maintenance.
• Oil pipelines, as well as trucks, tanker ships and railways, transport crude oil between production areas, refineries, and export/import border points.
Main associations
• Canadian Association of Petroleum Producers (CAPP)
• Explorers and Producers Association of Canada (EPAC)
• Canadian Association of Oilwell Drilling Contractors (CAODC)
• Canadian Energy Pipeline Association (CEPA)
• Petroleum Services Association of Canada (PSAC)
• The Explorers and Producers Association of Canada (EPAC)
Regulatory authority
• Primarily with provincial governments, e.g. Alberta Energy Regulator.
• The National Energy Board (NEB) has federal jurisdiction over interprovincial and international oil pipelines and trade.
• The Canada-Newfoundland and Labrador Offshore Petroleum Board and Canada-Nova Scotia Offshore Petroleum Board are responsible for the regulation of oil and gas activities in their corresponding offshore areas.

28
Crude oil
Energy Fact Book — 2016–2017
International context
World production* – 93.9 MMb/d (2015, preliminary)1) United States ............................................................... 14%2) Saudi Arabia ................................................................ 13%3) Russia .......................................................................... 12%4) Canada ..........................................................................5%5) China ............................................................................ 5%
World exports* – 44.5 MMb/d (2014)1) Saudi Arabia ................................................................ 17%2) Russia .......................................................................... 11%3) Canada ..........................................................................7%4) United Arab Emirates ..................................................... 6%5) Iraq ............................................................................... 6%
World proved reserves – 1,656 billion barrels (at the end of 2015)1) Venezuela .................................................................... 18%2) Saudi Arabia** ............................................................ 16%3) Canada ........................................................................10%
(97% of which is oil sands)4) Iran ............................................................................. 10%5) Iraq ............................................................................... 9%
* includes crude oil, NGL, additives and other hydrocarbons (including the receipts of additives).
** Saudi Arabia and Kuwait reserves include the Saudi-Kuwaiti “neutral zone,” with total proved reserves of 5 billion barrels.

29
Crude oil
Energy Fact Book — 2016–2017
Canadian resources
Remaining established reserves (latest available data as of May 2016)reserves known to exist and are recoverable under current technological and economic conditions
Billion barrels
Canada total .............................................................169.9
• conventional* ..........................................................4.5
• oil sands ..............................................................165.4
• mining .............................................................32.1
• in situ ............................................................133.3
* Reserves also include proved reserves of pentanes plus (a crude-oil equivalent that is associated with oil production).
Oil wells completed and average metres drilled in western Canada
Oil w
ell c
ount
s
Aver
age
met
res
drill
ed
2003
2004
2005
2006
2007
2008
2009
2010
2011
2012
2013
2014
2015
Wells completed Average metres drilled
0
2,000
4,000
6,000
8,000
10,000
12,000
0
400
800
1,200
1,600
2,000
2,400

30
Crude oil
Energy Fact Book — 2016–2017
Canadian productionOil sands production has exceeded conventional production since 2010.
In 2015, oil sands production was 2.4 MMb/d compared to 1.5 MMb/d of conventional oil.
Production by type
Production by province, 2015
“Other”: Nova Scotia, Ontario and the Northwest Territories
2005
2006
2007
2008
2009
2010
2011
2012
2013
2014
2015
Mill
ion
barr
els
per d
ay
4.0
3.5
3.0
2.5
2.0
1.5
1.0
0.5
0.0
Conventional
Oil sands
Alta.80.0%
Sask.12.6%
N.L.4.4%
B.C.1.4%
Man.1.2%
Other0.4%

31
Crude oil
Energy Fact Book — 2016–2017
Canadian supply and demand* (2015)
Canadian production ................................................3.9 MMb/d
Imports** .................................................................0.9 MMb/d
Exports .....................................................................3.0 MMb/d
Crude oil shipped to domestic refineries ....................1.7 MMb/d
* includes condensates and pentanes plus
** includes both imports to refineries (0.6 MMb/d) and those delivered to upgraders or fields for use as diluent
Trade
Canadian trade of crude oil
Key facts
• 99% of Canadian crude oil exports are to the U.S.
• Canada was the largest foreign supplier of crude oil to the U.S., accounting for 43% of total U.S. crude oil imports and for 20% of U.S. refinery crude oil intake.
• Imports of crude oil and equivalents come from a wide range of countries, including the U.S. (69%), Saudi Arabia (9%), Nigeria (4%), Algeria (4%), and Norway (4%).
Mill
ion
barr
els
per d
ay
Exports Imports
2005
2006
2007
2008
2009
2010
2011
2012
2013
2014
2015
0.0
0.5
1.0
1.5
2.0
2.5
3.0
3.5

32
Crude oil
Energy Fact Book — 2016–2017
Prices
West Texas Intermediate (WTI)
• Reference price for light crude oil delivered at Cushing, Oklahoma (a major pipeline hub)
• Used as the benchmark price for North American crudes
• Underlies oil futures contracts on the NYMEX
Brent
• Reference price for light crude oil delivered at the Sullom Voe terminal in the U.K.
• Used as a benchmark price for North Sea crudes, as well as for many other crudes around the world
• During the 2000s, Brent and WTI traded within a few dollars of each other.
Canadian Light Sweet
• Reference price for light crude oil (similar quality to WTI) delivered at Edmonton
Western Canada Select (WCS)
• Reference price for heavy crude oil (e.g. blended bitumen) delivered at Hardisty, Alta.
• It takes more energy to produce refined products (e.g. gasoline) from heavy crudes, therefore WCS trades at a discount to lighter crudes.
Maya
• Reference price for heavy oil produced in Mexico (similar quality to WCS)

33
Crude oil
Energy Fact Book — 2016–2017
Highlights for WTIPeak on July 11, 2008 ......................................US$147 per barrelAverage: 2012 ...................................................US$94 per barrelAverage: 2013 ...................................................US$98 per barrelAverage: 2014 ...................................................US$93 per barrelPeak on June 20, 2014 .....................................US$107 per barrelAverage: 2015 ...................................................US$49 per barrelLow on February 11, 2016 .................................US$26 per barrelAverage: 2016 (first 5 months) ..........................US$37 per barrel
Brent versus WTI monthly average prices
Maya versus WCS monthly average prices
US$
per b
arre
l
US$
diffe
rent
ials
0
20
40
60
80
100
120
140
-10
0
10
20
30
40
50
60
2016201520142013201220112010200920082007
Differential Brent WTI
US$
per b
arre
l
US$
diffe
rent
ials
0
20
40
60
80
100
120
140
-10
10
30
50
70
90
110
130
2016201520142013201220112010200920082007
Differential Maya WCS

34
Crude oil
Energy Fact Book — 2016–2017
Oil sands
Strategic importance
• 97% of Canada’s proved reserves
• 61% of Canada’s oil production in 2015 or 2.4 MMb/d
• An estimated $271 billion of capital investment to date, including $22.5 billion in 2015
Mining method
• For shallow formations of 75 m or less
• 46% of current production, 19% of oil sand resources
• Process: remove overburden, extract oil sands ore, separate oil from sand using steam, pump tailings into settling basins
• Six large projects in Alberta: Syncrude Mining Project, Suncor Base Mine, CNRL Horizon Mine, Athabasca Oil Sands Project – Muskeg River and Jackpine Mine, and Imperial’s Kearl Mine
In situ method
• For formations deeper than 75 m
• 54% of current production, 81% of resources
• Process: drill vertical and/or horizontal wells, inject steam to facilitate the flow of oil
• More than 20 projects in Alberta – largest are Cold Lake (Imperial Oil) and Firebag (Suncor)
Bitumen upgrading
• Crude bitumen from oil sands may be transported to upgraders for processing to make it lighter – “synthetic crude oil.”
• Bitumen may also be blended and sold directly to refineries capable of processing heavier oils.
• Major companies with upgrading capacity: Syncrude, Suncor, Shell, Canadian Natural Resources, Husky and Nexen-CNOOC
• Total upgrading capacity in Canada of 1,428,000 b/d (facilities are listed in the Petroleum products section)

35
Crude oil
Energy Fact Book — 2016–2017
Oil sands: environmental challenges
Water
• mining method: 3 to 4 barrels of new water required per barrel of bitumen
• in situ method: an average of 0.4 barrels of fresh water required per barrel of bitumen
• Oil sands producers recycle around 80% of the water used in established mines and approximately 94% for in situ production.
Greenhouse gases
• 9.3% of Canada’s total GHG emissions
• GHG emissions per barrel of oil produced in the oil sands in 2014 were 31% below 1990 levels.
Land
• area of oil sand resources ..............................142,200 km²
• total mineable area .......................................... 4,800 km²
• total area being mined ......................................... 904 km²
• tailings ponds ..................................................... 220 km²
For comparison:• Canada’s total area ..................................10,000,000 km²
• Canadian boreal forest ...............................3,200,000 km²
• 22% of the Lower Athabasca Region is comprised of conservation areas

36
Crude oil
Energy Fact Book — 2016–2017
Key existing pipelines• The current crude oil pipeline capacity exiting in Western
Canada is estimated at about 3.9 million barrels per day.
Enbridge
• World’s largest pipeline system for crude oil and petroleum products, serving Canada and the U.S. with an estimated capacity to transport 2,621,000 barrels of oil per day
• Mainline: Alberta to the U.S. Midwest and Ontario
• Norman Wells Pipeline: from the Northwest Territories to Alberta
• Line 9: from Sarnia to Montréal, returned to eastward flow and capacity expanded to 300,000 barrels per day in 2015
• Southern Lights: diluent from Chicago to Edmonton
Kinder Morgan
• North America’s largest pipeline company and largest transporter of refined products.
• Trans Mountain Line: has the capacity to transport 300,000 barrels per day from Edmonton to British Columbia (crude oil and petroleum products).
• Puget Sound System: via the Trans Mountain Line ships crude oil from Abbotsford, B.C., to Washington State with a capacity of 180,000 barrels per day.
• Cochin Pipeline: transports diluents from Illinois to Fort Saskatchewan with a capacity of 95,000 barrels per day.
Pembina
• Second-largest oil pipeline system in western Canada
• 9 pipelines for conventional and unconventional oil
• Bitumen Line: from Fort McMurray to Edmonton

37
Crude oil
Energy Fact Book — 2016–2017
Portland-Montreal Pipe Line
• Crude oil ships from Portland, Maine to Montréal
TransCanada Pipeline
• Keystone Pipeline (2010): has the capacity to transport 591,000 barrels of oil per day from Hardisty, Alta. to the U.S. Midwest
Spectra Energy
• Express-Platte: has the capacity to transport 280,000 barrels of oil per day from Hardisty, Alta. to the U.S. Midwest

38
Crude oil
Energy Fact Book — 2016–2017
Rail transportationEnergy-related products accounted for 17% of the total tonnage transported by rail in Canada in 2015, which is consistent with the average of 17% between 1999 and 2014.
In 2015, coal accounted for 54% of all energy products transported by rail in Canada, a decrease from 77% in 1999.
The tonnage of fuel oils and crude petroleum transported by rail almost tripled between 2011 and 2014; however, it decreased by 16% from 2014 to 2015 because of poorer economics in the current low oil price environment.
The estimated rail loading capacity out of western Canada in 2015 is approximately 1.0 MMb/d.
Railway carloads for energy commodities in Canada
1999
2000
2001
2002
2003
2004
2005
2006
2007
2008
2009
2010
2011
2013
2012
2014
2015
Other refined petroleum and coal products
Fuel oils and crude petroleum
Coal coke and petroleum cokeGasoline and aviation turbine fuel
Gaseous hydrocarbons, including LPGs
Coal
70
60
50
40
30
20
10
0
Mill
ions
of t
onne
s

39
Crude oil
Energy Fact Book — 2016–2017
Exports
Quarterly volumes of crude oil exported to the U.S. by rail
Major western Canada crude by rail on-loading facilities in operation, 2015 (>30,000 b/d)
Operator Location Province Capacity (b/d)
Cenovus Energy
Bruderheim Alberta 100,000
Keyera/Enbridge
Cheecham Alberta 32,000
Kinder Morgan/Imperial
Strathcona County
Alberta 210,000
Pembina Edmonton Alberta 40,000
Keyera/Kinder Morgan
Edmonton Alberta 40,000
Gibson/USDG Hardisty Alberta 120,000
Altex Lashburn Saskatchewan 88,000
Crescent Point Stoughton Saskatchewan 45,000
Tundra Cromer Manitoba 30,000
Barr
els
per d
ay
0
20,000
40,000
60,000
80,000
100,000
120,000
140,000
160,000
180,000
Q4Q3Q2Q1Q4Q3Q2Q1Q4Q3Q2Q1Q4
2015201420132012
Q3Q2Q1

40
Crude oil
Energy Fact Book — 2016–2017
Light tight oil/Shale oil
Definition
• Light oil found in sedimentary rock characterized by very low permeability – typically shale.
• The oil is extracted by using horizontal drilling combined with multi-stage hydraulic fracturing – the same techniques used for shale gas extraction.
Note: “Shale oil” should not be confused with “oil shale,” which are shale rocks rich in decomposed matter still in a solid state.
Potential in Canada and the U.S.
• Tight oil resources are largely found in a belt ranging from central Alberta to southern Texas.
• The Bakken (North Dakota, Montana, Saskatchewan, Manitoba) and Eagle Ford (south Texas) tight oil formations are the largest sources of tight oil production in North America.
• Prospective resources have also been identified throughout the Rocky Mountain region, the U.S. Gulf Coast and the northeastern U.S./eastern Canada (including Anticosti Island and western Newfoundland and Labrador).
World technically recoverable shale oil* resources 419 billion barrels (2015)1) United States ............................................................... 19%2) Russia .......................................................................... 18%3) China ............................................................................ 8%4) Argentina ....................................................................... 6%5) Libya ............................................................................. 6%…13) Canada ........................................................................2%
* Shale formations are a subset of low permeability tight oil formations.

41Energy Fact Book — 2016–2017
Petroleum products3 Canadian industry structure• Petroleum refineries transform crude oil into a wide range
of refined petroleum products (e.g. gasoline, diesel).
• Other facilities such as asphalt plants, lubricant plants, upgraders and some petrochemical plants also process crude oil to produce a limited range of products.
• A variety of firms, including integrated oil companies, refiners and independent fuel retailers, distribute refined petroleum products at the wholesale and retail levels.
• Pipelines and tanker ships are commonly used to transport products over long distances, while tanker trucks and trains are more often used for regional and local distribution.
• Liquefied petroleum gas (LPG) produced by refineries is included in this chapter and in the “Hydrocarbon gas liquids” chapter.
Main associations
• Canadian Fuels Association (CFA)
• Canadian Independent Petroleum Marketers Association (CIPMA)
Regulatory authority
• Primarily with provincial governments

42
Petroleum products
Energy Fact Book — 2016–2017
• LPGs (propane and butane from refineries)
• petrochemical feedstocks (sold to petrochemical plants for the production of primary petrochemicals)
• aviation fuels
• motor gasoline
• diesel fuel (for transportation and electricity generation)
• heating oil
• heavy fuel oil (for industrial steam, marine transportation and electricity generation)
• other products (e.g. kerosene, lubricating oils, greases, waxes, petroleum coke, asphalt)
Petroleum refineries
• crude oil distillation
• additional processing (e.g. catalytic cracking and reforming)
• product blending

43
Petroleum products
Energy Fact Book — 2016–2017
Canadian supply and demand (2015)Crude oil shipped to domestic refineries ...................... 1.7 MMb/d
(98 billion L)
Canadian production ................................................. 1.9 MMb/d (108 billion L)
Imports ...................................................................... 0.2 MMb/d (14 billion L)
Exports ...................................................................... 0.5 MMb/d (28 billion L)
Domestic sales ........................................................... 1.8 MMb/d (104 billion L)
Sales by product, 2015*
* Certain product shares are based on NRCan estimates.
** “Other” includes LPGs, petro-chemical feedstocks, lubricating oils, petroleum coke, asphalt, etc.
Diesel28%
Gasoline43%
Other**17%
Heavy fuel oil3%
Heating oil2%
Aviation fuels7%

44
Petroleum products
Energy Fact Book — 2016–2017
Trade (2015)
Canadian trade of refined petroleum products
Key facts
• 26% of Canadian production of refined petroleum products is exported:
• 95% of Canadian refined petroleum product exports are to the U.S.
• 24% of U.S. imports come from Canada.
• 13% of Canadian consumption of refined petroleum products is imported:
• 75% of Canadian imports come from the U.S.
• Other Canadian imports come from a wide range of countries, including the Netherlands (10%), the U.K. (2%) and Russia (2%).
Exports Imports
Billi
on li
tres
0
5
10
15
20
25
30
35
20152014201320122011201020092008200720062005

45
Petroleum products
Energy Fact Book — 2016–2017
Retail prices (in cents per litre)
Gasoline Diesel
2015
average Canadian pump price 108.9 109.2
estimated crude cost 38.8 38.8
refining and marketing 31.8 38.8
federal taxes* 15.5 9.1
provincial taxes** 22.9 22.4
2016
average Canadian pump price (first five months)
98.3 92.7
* includes the GST and federal excise tax** includes the provincial portion of the HST
Changes in retail prices for fuel tend to mimic those for crude oil.
Weekly retail gasoline and diesel prices
2008
2009
2010
2011
2012
2013
2014
2016
2015
Gasoline Diesel
60
80
100
120
140
160
Cent
s pe
r litr
e

46
Petroleum products
Energy Fact Book — 2016–2017
Canadian petroleum refineries
Location Refinery Capacity
British ColumbiaPrince George Husky Energy 12,000 b/d
Burnaby Chevron Canada 57,000 b/d
AlbertaEdmonton Imperial Oil 187,000 b/d
Edmonton Suncor Energy 142,000 b/d
Fort Saskatchewan Shell Canada 100,000 b/d
SaskatchewanRegina Federated
Co-operatives130,000 b/d
OntarioSarnia Imperial Oil 121,000 b/d
Nanticoke Imperial Oil 112,000 b/d
Sarnia Suncor Energy 85,000 b/d
Corunna Shell Canada 75,000 b/d
QuebecLevis Valero (formerly
Ultramar)265,000 b/d
Montréal Suncor Energy 137,000 b/d
New BrunswickSaint John Irving Oil 318,000 b/d
Newfoundland and LabradorCome by Chance North Atlantic 115,000 b/d
Total refining capacity 1,856,000 b/d

47
Petroleum products
Energy Fact Book — 2016–2017
Other plants with crude oil processing
Location Plant Capacity
Asphalt plants
Saskatchewan Lloydminster Husky Energy 29,000 b/d
Moose Jaw Moose Jaw Refinery 16,000 b/d
Total processing capacity 45,000 b/d
Lubricant plants (currently using crude oil as feedstock)OntarioMississauga Suncor Energy 17,000 b/d
Total processing capacity 17,000 b/d
Upgraders*
AlbertaFort McMurray Syncrude 465,000 b/d
Fort McMurray Suncor Base U1/U2/Millenium
438,000 b/d
Fort Saskatchewan Shell Scotford 240,000 b/d
Fort McKay CNRL Horizon 135,000 b/d
Wood Buffalo Nexen-CNOOC 72,000 b/d
SaskatchewanLloydminster Husky Energy 78,000 b/d
Total upgrading capacity 1,428,000 b/d
* Although upgraders primarily transform heavy crudes into lighter crudes, they also produce some refined products, such as diesel. The capacities reported are with regard to inputs of heavy crude oil or bitumen.


49Energy Fact Book — 2016–2017
Hydrocarbon gas liquids4 Definition• Hydrocarbon gas liquids (HGLs) include natural gas liquids
(NGLs) (propane, butane, and ethane) and olefins produced by natural gas processing plants and upstream processing or by crude oil refineries.
• Propane and butane, which are produced from natural gas processing plants or from refining crude oil, can be liquefied and sold as liquefied petroleum gas (LPG).
• Condensates and pentanes plus are also HGLs obtained directly from the field or from a natural gas processing plant. However, because these HGLs are considered to be a crude oil equivalent, they are included in the “Crude oil” chapter.
Notes
• These gases can be easily liquefied, and therefore are commonly referred to as “liquids.”
• When these liquids are present in natural gas, it is called “wet” gas; when they are not present or have been extracted, the natural gas is called “dry” gas.

50
Hydrocarbon gas liquids
Energy Fact Book — 2016–2017
Canadian supply* (2015)Canadian production ................................................ 562.4 Mb/d
– propane ............................................................191.4 Mb/d
– butane ............................................................. 130.0 Mb/d
– ethane ..............................................................241.0 Mb/d
Exports ..................................................................... 136.8 Mb/d
Imports ....................................................................... 70.6 Mb/d
* excludes condensates and pentanes plus, which are included as part of crude oil, and includes refinery-produced LPGs
Production of NGLs by province*, 2015
* includes only gas processing plant production
Alta.88%
N.S.1%
B.C.9%
Sask.2%

51Energy Fact Book — 2016–2017
Natural gas5 Canadian industry structure• The upstream oil and gas industry comprises several hundred
companies that engage in activities such as exploration, drilling and production of raw natural gas. Some upstream companies also own and operate gathering pipelines and field processing facilities.
• The midstream natural gas industry operates natural gas processing plants, which remove impurities and natural gas liquids (NGLs), natural gas storage facilities, gathering pipelines and NGL facilities. Pipeline-quality natural gas is then transported through pipelines from processing plants to transmission pipelines or consuming areas.
• The downstream natural gas industry comprises long-haul transmission pipelines and distribution companies, also called local distribution companies (LDCs). LDCs receive gas from pipelines and then distribute it to end-use consumers via extensive networks of local distribution pipelines.
Main associations
• Canadian Association of Oilwell Drilling Contractors (CAODC)
• Canadian Association of Petroleum Producers (CAPP)
• Petroleum Services Association of Canada (PSAC)
• Canadian Energy Pipeline Association (CEPA)
• Canadian Gas Association (CGA)
• Canadian Society for Unconventional Resources (CSUR)
• Explorers and Producers Association of Canada (EPAC)
• Industrial Gas Users Association (IGUA)
Regulatory authority
• Primarily with provincial and territorial governments
• The National Energy Board (NEB) has federal jurisdiction over interprovincial and international natural gas pipelines and trade.
• The Canada-Nova Scotia Offshore Petroleum Board and Canada-Newfoundland and Labrador Offshore Petroleum Board are responsible for regulations of oil and gas activities in their corresponding offshore areas.

52
Natural gas
Energy Fact Book — 2016–2017
International context
World production – 347 Bcf/d (9.8 Bcm/d) (2015, preliminary)1) United States ............................................................... 21%2) Russia .......................................................................... 18%3) Iran ............................................................................... 5%4) Qatar ............................................................................ 5%5) Canada ..........................................................................5%
World exports – 102 Bcf/d (2.9 Bcm/d) (2015, preliminary)1) Russia .......................................................................... 19%2) Qatar .......................................................................... 11%3) Norway........................................................................ 11%4) Canada ..........................................................................7%5) Netherlands ................................................................... 5%
World proved reserves – 6,950 Tcf (197 Tcm) (beginning of 2016)1) Russia .......................................................................... 24%2) Iran ............................................................................. 17%3) Qatar .......................................................................... 12%4) United States ................................................................. 5%5) Saudi Arabia .................................................................. 4%…17) Canada ........................................................................1%

53
Natural gas
Energy Fact Book — 2016–2017
Canada-U.S. resources• The natural gas markets in Canada and the U.S. are highly
integrated.
• Canadian marketable resources could sustain current production levels for up to 300 years.
Proved reserves* (at the end of 2014)Canada ............................................................................70 TcfU.S. ...............................................................................369 TcfTotal .............................................................................439 Tcf
Marketable/technically recoverable resources**Canada total .......................................................... 879–1,560 Tcf
Canadian conventional ........................................... 299–305 TcfCanadian unconventional .................................... 580–1,255 Tcf
(coal-bed methane, shale and tight gas)
U.S. total .......................................................................2,431 Tcfportion that is shale and tight gas ...................................664 Tcfportion that is other ....................................................1,766 Tcf
World total ..................................................................28,499 Tcfportion that is conventional ......................................16,421 Tcfportion that is unconventional ...................................12,078 Tcf
* Proved reserves are known to exist and are recoverable under current technological and economic conditions.
** Canadian marketable resources: natural gas that is in a marketable condition, after the removal of impurities and after accounting for any volumes used to fuel surface facilities. Marketable resources are recoverable using existing technologies, based on geological information, but much of the drilling necessary to produce the natural gas has not yet been performed.
U.S. technically recoverable resources: gas estimated to be recoverable as drilling and infrastructure expands (similar to Canadian marketable resources).

54
Natural gas
Energy Fact Book — 2016–2017
Shale and tight gas
Features of shale
• Ultra-low permeability sedimentary rock containing natural gas
• Gas is extracted by using horizontal drilling and hydraulic fracturing.
Hydraulic fracturing (fracking)
• Creates fractures in sedimentary rock formations by using pressurized water, mixed with small amounts of sand and additives, to release the natural gas
Potential in Canada
• Shale gas resources are found in British Columbia, Alberta, Saskatchewan, Manitoba, Ontario, Quebec, New Brunswick, Nova Scotia and the territories.
• Technological advancements in drilling (long-reach horizontal well bores) and completion techniques (multistage hydraulic fracturing) enable commercial production of shale gas.
• These advancements have increased the long-term prospects for the supply of natural gas in North America.
Global potential
• A 2012 U.S. Energy Information Administration assessment of 137 shale formations in 41 countries, in addition to the U.S. basins, found a total of 7,299 Tcf (207 Tcm) of technically recoverable shale gas resources.
World technically recoverable shale resources – 7,299 Tcf (2012)1) China .......................................................................... 15%2) Argentina ..................................................................... 11%3) Algeria ......................................................................... 10%4) United States ................................................................. 9%5) Canada ..........................................................................8%6) Mexico........................................................................... 7%7) Australia ........................................................................ 6%

55
Natural gas
Energy Fact Book — 2016–2017
Canada-U.S. market (2015)Canada-U.S. market .....................................................89.0 Bcf/d
(2.5 Bcm/d)
Canadian average marketable production .....................14.4 Bcf/d (0.4 Bcm/d)
conventional .................................................................... 26%unconventional* ............................................................... 74%
U.S. average marketable production..............................74.2 Bcf/d (2.1 Bcm/d)
conventional .................................................................... 27%unconventional* ............................................................... 73%
North American LNG imports .......................................0.31 Bcf/d (0.01 Bcm/d)
* Unconventional gas includes tight gas, coalbed methane and shale gas.
Natural gas wells completed and average metres drilled in western Canada
Gas
wel
l cou
nts
Aver
age
met
res
drill
ed
2003
2004
2005
2006
2007
2008
2009
2010
2011
2012
2013
2014
2015
Gas well counts Average metres drilled
0
2,000
4,000
6,000
8,000
10,000
12,000
14,000
16,000
18,000
0
500
1,000
1,500
2,000
2,500
3,000
3,500
4,000
4,500

56
Natural gas
Energy Fact Book — 2016–2017
Canadian production (2015)
Canadian and U.S. marketable production of natural gas
Marketable production by province, 2015
Billi
on c
ubic
feet
per
day
2014
2015
16.514.4
49.5
74.2
2005
2006
2007
2008
2009
2010
2011
2012
2013
0
10
20
30
40
50
60
70
80
Canada
United States
Sask.2%
Ont.0.1%
N.B.0.0%
N.S.1%
TERR1.1%
B.C.24%
Alta.72%

57
Natural gas
Energy Fact Book — 2016–2017
Trade (2015)
Canadian trade of natural gas
Canadian exports ...........................................................7.3 Bcf/d (0.21 Bcm/d)
Canadian imports ..........................................................1.9 Bcf/d (0.05 Bcm/d)
Key facts
• 51% of Canadian production is exported
• All Canadian exports go to the U.S.
• 97% of U.S. imports and 10% of U.S. consumption come from Canada.
• The value of Canadian net exports (exports minus imports) was $7.2 billion in 2015.
• 20% of Canadian consumption is imported from the U.S.
• Since 2009, Canada has also imported small amounts of natural gas liquids from other countries through the Canaport LNG terminal in Saint John, N.B.
Billi
on c
ubic
feet
per
day
2014
2015
2004
2003
2005
2006
2007
2008
2009
2010
2011
2012
2013
0
3
6
9
12
15
ImportsExports

58
Natural gas
Energy Fact Book — 2016–2017
Upstream prices (AECO hub* average prices)
Average: 2005–2013 .................................................... $5.54/GJ
Average: 2014 .............................................................. $4.74/GJ
Average: 2015 .............................................................. $2.69/GJ
Average: 2016 .............................................................. $1.36/GJ (first four months)
* The AECO hub is Canada’s largest natural gas trading hub, and the AECO price serves as a benchmark for Alberta wholesale natural gas transactions.
Monthly average natural gas spot prices
$/GJ
2014
2015
2016
2006
2007
2008
2009
2010
2011
2012
2013
Start of the North American shale gas revolution
2013–2014 Polar Vortex
0
3
6
9
12
15
18
21
24 Henry hub
Dawn hub
AECO hub

59
Natural gas
Energy Fact Book — 2016–2017
Key existing pipelines
TransCanada Pipelines
• Canada’s leading natural gas pipeline company serving markets in Canada, the U.S. and Mexico, tapping into virtually all natural gas basins in North America
• Nova Gas Transmission Ltd (NGTL) System: serving Alberta and British Columbia
• Canadian Mainline: several pipelines in the same corridor from the Alberta/Saskatchewan border to Québec (city) with several interconnections to the U.S. along the way
• Foothills: from Alberta to Idaho via British Columbia and from Alberta to Montana via Saskatchewan
Spectra Energy
• Canada’s second-largest gas pipeline company
• Maritimes & Northeast Pipeline: Nova Scotia and New Brunswick to the U.S.
• Union Gas: gas distribution and transmission in Ontario and eastern U.S.
• West Coast Energy: a pipeline in British Columbia
Enbridge Inc.
• Third-largest gas pipeline company in Canada (and largest oil pipeline)
• Largest local gas distribution company in Canada (Enbridge Gas Distribution of Toronto)
• Alliance Line (50% owner): British Columbia through Alberta; and Saskatchewan to Chicago
• Vector Line (60% owner): Chicago to Ontario
ATCO Pipeline
• Gathering and distribution lines within Alberta
TransGas Ltd.
• Gathering, transmission and storage facilities in Saskatchewan
• Owned by SaskEnergy Inc. (provincial distributor)

60
Natural gas
Energy Fact Book — 2016–2017
Liquefied natural gasTwenty-six liquefied natural gas (LNG) export facilities have been proposed for Canada – 20 in British Columbia, 2 in Quebec, 1 in New Brunswick and 3 in Nova Scotia – with a total proposed export capacity of 355 mtpa of LNG (or approximately 48 Bcf/d of natural gas). Since 2011, 24 LNG projects have been issued long-term export licenses.
Proposed Canadian LNG export terminals (as of June 1, 2016)
Project Location Export license
Total capacity
Natural gas (Bcf/d)
LNG (mtpa)
British Columbia
Kitimat LNG Kitimat √ 1.30 10.00
LNG Canada Kitimat √ 3.47 26.00
Cedar LNG Project Kitimat √ 0.83 6.40
Pacific Northwest LNG
Prince Rupert √ 2.74 19.68
Prince Rupert LNG Prince Rupert √ 2.91 21.60
Woodfibre LNG Squamish √ 0.33 2.10
WCC LNG Prince Rupert √ 4.00 30.00
Triton LNG Kitimat or Prince Rupert
√ 0.32 2.30
Aurora LNG Prince Rupert √ 3.10 24.00
Kitsault Energy Project
Kitsault √ 2.70 20.00
WesPac Marine Terminal
Delta √ 0.50 3.00
Steelhead LNG Sarita Bay √ 4.30 30.00
Grassy Point LNG Grassy Point √ 2.70 20.00
Project status:
Project on hold Application not yet filed

61
Natural gas
Energy Fact Book — 2016–2017
Project Location Export license
Total capacity
Natural gas (Bcf/d)
LNG (mtpa)
Discovery LNG Campbell River
√ 2.63 20.00
Orca LNG Prince Rupert √ 3.20 24.00
Stewart LNG Stewart √ 3.99 30.00
NewTimes Energy Prince Rupert √ 1.60 12.00
Malahat LNG Mill Bay √ 0.85 6.00
Watson Island LNG Prince Rupert Not applied
Unknown Unknown
Nisga’a LNG Nasoga Gulf Not applied
Unknown Unknown
East Coast
Énergie Saguenay La Baie, Que. √ 1.56 11.00
Stolt LNGaz Becancour, Que.
√ 0.07 0.50
Saint John LNG Saint John, N.B.
√ 0.68 5.00
Goldboro LNG Guysborough County, N.S.
√ 1.40 10.00
Bear Head LNG Richmond County, N.S.
√ 1.59 12.00
A C LNG Middle Melford, N.S.
√ 2.07 15.50
Proposed Canadian LNG export terminals (as of June 1, 2016) (continued)
Project status:
Project on hold Application not yet filed


63Energy Fact Book — 2016–2017
Coal6 Canadian industry structure• The Canadian coal industry produces coal for use in:
• metallurgical applications
• thermal applications (e.g. electricity generation)
• Numerous firms provide services to coal producers such as exploration, equipment supply, engineering services and transportation.
• Some power-generating companies not only use coal for electricity generation but also own coal mines or are involved in coal production. Other companies generate electricity from purchased coal.
Main association
• Coal Association of Canada
Regulatory authority
• Primarily with provincial governments

64
Coal
Energy Fact Book — 2016–2017
International context
World production – 7.7 billion t (2015, preliminary)1) China .......................................................................... 46%2) United States ............................................................... 11%3) India .............................................................................. 9%4) Australia ........................................................................ 7%5) Indonesia ....................................................................... 6%…12) Canada ........................................................................1%
World exports – 1.3 billion t (2015, preliminary)1) Australia ...................................................................... 30%2) Indonesia ..................................................................... 28%3) Russia .......................................................................... 12%4) Columbia ....................................................................... 6%5) South Africa ................................................................... 6%…8) Canada ..........................................................................2%
World proved reserves – 892 billion t (at the end of 2011)1) United States ............................................................... 27%2) Russia .......................................................................... 18%3) China .......................................................................... 13%4) Australia ........................................................................ 9%5) India .............................................................................. 7%…15) Canada ........................................................................1%
The above data excludes coal products such as coke.

65
Coal
Energy Fact Book — 2016–2017
Canadian supply and demand (2015)
Canadian production ........................................................ 62 Mt
Exports ............................................................................. 30 Mt• major export destinations (by $ value):
1) Japan .....................28% 2) South Korea ...........20% 3) China .....................16%• 4% of Canadian exports are to the U.S., representing 10% of
U.S. coal imports
Imports .............................................................................. 8 Mt• 75% of Canadian imports are from the U.S.
• Close to half of imports are destined for use in steel manufacturing (metallurgical coal); the rest are for electricity generation (thermal coal).
Domestic availability .........................................................39 Mt• mostly for electricity generation in Alberta and Saskatchewan
• also for metallurgical applications
Canadian trade of coal
Mill
ion
tonn
es
2014
2015
2005
2004
2006
2007
2008
2009
2010
2011
2012
2013
Exports Imports
0
5
10
15
20
25
30
35
40
45

66
Coal
Energy Fact Book — 2016–2017
Production and use, by province
Production by province, 2015*
* NRCan estimate
Coal used for electricity generation by province, 2014
Alta.43%
Sask.14%
B.C.43%
Alta.71%
Man.0.1%
Sask.20%
Ont.0%
N.S.6% N.B.
3%

67
Coal
Energy Fact Book — 2016–2017
Coal-fueled power plants in Canada >500 MW (2016)
Facility Province Total capacity (MW)
Sundance Alberta 2,141
Genesee Alberta 1,376
Keephills Alberta 1,285
Sheerness Alberta 816
Battle River Alberta 689
Boundary Dam* Saskatchewan 672
Lingan Nova Scotia 620
Poplar River Saskatchewan 582
* As of October 2014, SaskPower’s Boundary Dam (unit 3 – 120 MW electricity production) became the world’s first commercial-scale coal-fired power station equipped with CCS technology.
Data includes facilities that burn petroleum coke as their primary fuel.
Coal-fired generating capacity by province (2016)
Province Total coal generating capacity (MW)
Share of total capacity (%)
Alberta 6,457 65.7
Saskatchewan 1,530 15.6
Nova Scotia 1,252 12.7
New Brunswick 490 5.0
Manitoba** 105 1.1
TOTAL 9,834 100
** As per provincial regulations, the Brandon coal-fired power plant may be used
only in emergency situations.


69Energy Fact Book — 2016–2017
Uranium and nuclear power7
Canadian uranium industry structure• Canada has an abundant supply of uranium, including large
high-grade deposits in northern Saskatchewan.
• Key producers are Cameco Corporation and AREVA Resources Canada Inc. – two of the world’s largest uranium mining companies.
• Once mined, uranium ore is milled to produce a uranium oxide concentrate (U3O8) commonly known as “yellowcake.”
• A large portion of the uranium concentrates from Canada and around the world is shipped to a refinery in Blind River, Ontario, to produce high-purity uranium trioxide (UO3), an intermediate product.
• The UO3 from Blind River is transported to a uranium conversion facility in Port Hope, Ontario, to produce:
• uranium dioxide (UO2) to supply CANDU-type heavy water reactors
• uranium hexafluoride (UF6), which is exported to be enriched and used as fuel in light water reactors (LWR)
• Key users in Canada are power generators with nuclear reactors (e.g. Ontario Power Generation (OPG)).
Regulatory authority• Mining in Canada is generally governed by provincial
regulations, but uranium mining is also under federal jurisdiction.
• The Canadian Nuclear Safety Commission regulates mines and mills and all subsequent stages of the nuclear-fuel cycle, including conversion, refining, fuel fabrication, nuclear reactor operation and nuclear fuel waste management.

70
Uranium and nuclear power
Energy Fact Book — 2016–2017
Uranium – international context
World production – 60.5 kt (2015, preliminary)1) Kazakhstan .................................................................. 39%2) Canada ........................................................................22%3) Australia ........................................................................ 9%4) Niger ............................................................................. 7%5) Russia ............................................................................ 5%
World exports – 51.3 kt (2015, preliminary)1) Kazakhstan .................................................................. 46%2) Canada ........................................................................23%3) Australia ...................................................................... 11%4) Niger ............................................................................. 8%5) Namibia ........................................................................ 6%
World known recoverable resources – 5.9 Mt (at the beginning of 2013)1) Australia ...................................................................... 29%2) Kazakhstan .................................................................. 12%3) Russia ............................................................................ 9%4) Canada ..........................................................................8%5) Niger ............................................................................. 7%

71
Uranium and nuclear power
Energy Fact Book — 2016–2017
Uranium – Canadian supply and demand (2015)
Canadian production .......................................................13.3 kt
• All uranium comes from mines in Saskatchewan.
• Annual value ≈ $2 billion
Exports ....................................................... ≈ 86% of production
• Based on long-term contracts*, uranium from Canadian mines is generally sold in
1) Asia ................................................49%2) North America/Latin America ..........31%3) Europe ............................................20%
• 30% of uranium purchased by U.S. nuclear reactors in 2015 came from Canada, making Canada the largest foreign supplier of uranium to the U.S.
Domestic use ............................................... ≈14% of production
• to Canada’s CANDU reactors (Ontario and New Brunswick)
* These values can vary based on changes in regional demand.

72
Uranium and nuclear power
Energy Fact Book — 2016–2017
Primary energy productionThe primary energy equivalent of nuclear energy is defined by the International Energy Agency as the amount of heat produced in a reactor. Following this method and including both domestic use and exports, the primary energy equivalent for Canada’s total uranium production is estimated by NRCan at over 5.5 million TJ in 2014, or 22% of Canada’s total primary energy production.
Uranium’s share of total primary energy production, 2014
Spot prices*
* The majority of Canadian uranium production is sold via long-term contract, as opposed to on the spot market. In the short term, spot prices do not have a significant impact on the annual value of Canada’s uranium production.
22%
● Total primary energy production
● Uranium
US$
per l
b. o
f U3O
8
2014
2015
2016
2005
2004
2003
2006
2007
2008
2009
2010
2011
2012
2013
0
20
40
60
80
100
120
140

73
Uranium and nuclear power
Energy Fact Book — 2016–2017
Canadian nuclear industry structure• There are three nuclear power plant operators in Canada:
• OPG owns and operates the Pickering and Darlington power plants in Ontario.
• Bruce Power operates the Bruce A and Bruce B power plants in Ontario on a long-term lease from OPG, which owns the site. The Bruce generating station is the largest operating nuclear power plant in the world.
• New Brunswick Power owns and operates the Point Lepreau power plant.
• In Ontario, planned investments of $25 billion over the next 15 years will extend the life of 10 nuclear reactors for another 25 to 30 years.
• Nuclear power plant operators are supported by a supply chain of major equipment and component manufacturers and engineering service suppliers.
• Canada has nuclear R&D capabilities that are supported by academic research centres, the private sector, and government laboratories, including Chalk River Laboratories, Canada’s largest science and technology facility. Research is focused on existing reactor technologies as well as on next-generation nuclear energy systems and other nuclear science applications.
Main Associations• Canadian Nuclear Association (CNA)
• Organization of Canadian Nuclear Industries (OCI)
Regulatory Authority• Decisions about the use of nuclear energy to produce electric
power falls under provincial and territorial jurisdiction, whereas the development, regulation and licensing of nuclear energy are federal responsibilities.
• The Canadian Nuclear Safety Commission regulates all aspects of nuclear energy, including the development, production and operation of nuclear power and research reactors, and the production, possession and use of nuclear substances.
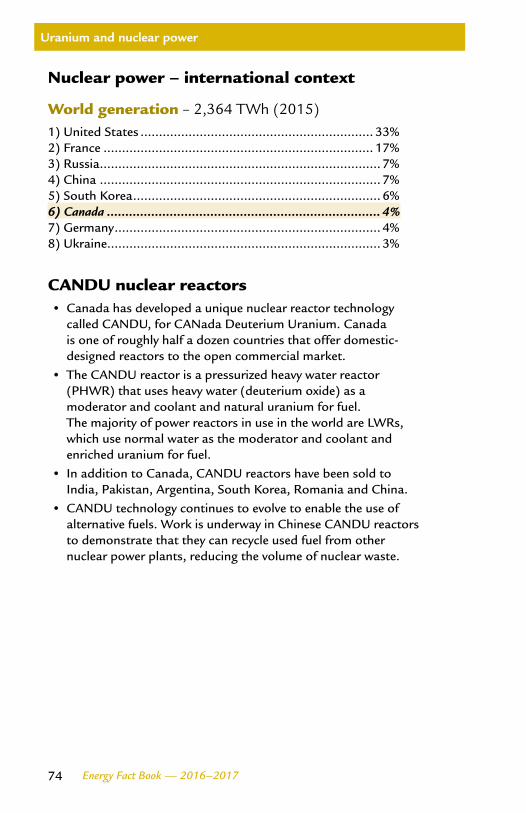
74
Uranium and nuclear power
Energy Fact Book — 2016–2017
Nuclear power – international context
World generation – 2,364 TWh (2015)1) United States ............................................................... 33%2) France ......................................................................... 17%3) Russia ............................................................................ 7%4) China ............................................................................ 7%5) South Korea ................................................................... 6%6) Canada ..........................................................................4%7) Germany ........................................................................ 4%8) Ukraine .......................................................................... 3%
CANDU nuclear reactors• Canada has developed a unique nuclear reactor technology
called CANDU, for CANada Deuterium Uranium. Canada is one of roughly half a dozen countries that offer domestic-designed reactors to the open commercial market.
• The CANDU reactor is a pressurized heavy water reactor (PHWR) that uses heavy water (deuterium oxide) as a moderator and coolant and natural uranium for fuel. The majority of power reactors in use in the world are LWRs, which use normal water as the moderator and coolant and enriched uranium for fuel.
• In addition to Canada, CANDU reactors have been sold to India, Pakistan, Argentina, South Korea, Romania and China.
• CANDU technology continues to evolve to enable the use of alternative fuels. Work is underway in Chinese CANDU reactors to demonstrate that they can recycle used fuel from other nuclear power plants, reducing the volume of nuclear waste.

75
Uranium and nuclear power
Energy Fact Book — 2016–2017
Gross capacity of nuclear power plants in Canada (2015)
Facility Province Total capacity (MW)
Units
Darlington Ontario 3,740 4
Bruce A Ontario 3,220 4
Bruce B Ontario 3,390 4
Pickering A Ontario 1,084 4
Pickering B Ontario 2,160 2
Point Lepreau New Brunswick 705 1


77Energy Fact Book — 2016–2017
Renewable energy8 What is renewable energy?• Renewable energy is obtained from natural resources that can
be naturally replenished or renewed within a human lifespan – that is, the resource is a sustainable source of energy.
• Some natural resources, such as moving water, wind and sunshine, are not at risk of depletion.
• Biomass is a renewable resource only if its rate of consumption does not exceed its rate of production.
• A wide range of energy-producing technologies and equipment has been developed over time to take advantage of these natural resources.
• Usable energy can be produced in the form of electricity, industrial heat, thermal energy for space and water conditioning, and transportation fuels.
Major associations• Canadian Hydropower Association
• Canadian Wind Energy Association
• Canadian Solar Industries Association (CanSIA)
• Canadian Geothermal Energy Association (CanGEA)
• Canadian Renewable Fuels Association (CRFA)

78
Renewable energy
Energy Fact Book — 2016–2017
Main sources and uses in Canada
Hydro
Wind
Tidal
Earth– high temperature– geothermal heat
pump
Solar– photovoltaic– thermal (air/water)
Biomass– wood waste– pulping liquor– landfill gas– municipal and
industrial wastes– firewood– grains and oilseeds
Electricity
Heat(e.g. space heating,
industrial process)
Fuels

79
Renewable energy
Energy Fact Book — 2016–2017
International context
World production – 79,299 PJ or 1,894 Mtoe (2014)1) China .......................................................................... 18%2) India ............................................................................ 11%3) United States ................................................................. 8%4) Brazil ............................................................................. 6%5) Nigeria .......................................................................... 6%6) Indonesia ....................................................................... 4%7) Canada ..........................................................................3%
Share of energy supply from renewable sources (2014)World .............................................................................. 13.8%OECD countries only .......................................................... 9.4%Canada .............................................................................17.7%

80
Renewable energy
Energy Fact Book — 2016–2017
Canadian production (2014)
Total renewable energy – 2,097 PJ or 50 Mtoe
Hydro .......................................................................... 65.400%Solid biomass (e.g. wood/waste) .................................. 26.700%Wind .............................................................................3.850%Biogasoline .................................................................... 1.780%Municipal waste/landfill gas ........................................... 1.110%Solar photovoltaic ..........................................................0.470%Biodiesel ........................................................................0.300%Industrial and other waste ..............................................0.300%Solar thermal .................................................................0.080%Tidal ..............................................................................0.003%
Canadian renewable energy capacity
Meg
awat
ts
Solar Wind Hydro
40,000
50,000
60,000
70,000
80,000
90,000
100,000
2015201420132012201120102009200820072006

81
Renewable energy – Hydro
Energy Fact Book — 2016–2017
Hydroelectricity – international context
World generation of hydroelectricity – 3,895 TWh (2014)
1) China .......................................................................... 27%2) Canada ........................................................................10%3) Brazil ........................................................................... 10%4) United States ................................................................. 7%5) Russia ............................................................................ 5%
Share of hydroelectricity in net electricity generation (2013)
1) Norway........................................................................ 96%2) Brazil ........................................................................... 69%3) Venezuela .................................................................... 68%4) Canada ........................................................................63%
By comparison:China ............................................................................... 17%United States ..................................................................... 7%

82
Renewable energy – Hydro
Energy Fact Book — 2016–2017
Hydroelectricity
Hydroelectricity capacity in Canada – 78,317 MW (2014)
Major hydro facilities in Canada* (≥1,000 MW)
Power plant Province Total capacity (MW)
Robert-Bourassa Que. 5,616
Churchill Falls N.L. 5,428
La Grande 4 Que. 2,779
Gordon M. Shrum B.C. 2,730
Revelstoke B.C. 2,480
La Grande 3 Que. 2,417
La Grande 2A Que. 2,106
Beauharnois Que. 1,853
Mica B.C. 1,805
Manic 5 Que. 1,596
Sir Adam Beck 2 Ont. 1,499
La Grande 1 Que. 1,436
Limestone Man. 1,340
Manic 3 Que. 1,326
Manic 2 Que. 1,229
Kettle Man. 1,220
Bersimis 1 Que. 1,178
Manic 5 PA Que. 1,064
Robert H. Saunders Ont. 1,045
Outardes 3 Que. 1,026
Long Spruce Man. 1,010
Kemano B.C. 1,000
* There are 576 hydro facilities in Canada with a capacity of at least 0.8 MW.

83
Renewable energy – Hydro
Energy Fact Book — 2016–2017
Hydroelectricity
Major projects under construction
Project Province Total capacity (MW)
Expected in-service
Site C B.C. 1,100 2024
La Romaine Complex Que. 1,550 2017–2020
Muskrat Falls N.L. 824 2018
Keeyask Man. 695 2021
Lower Mattagami Complex
Ont. 438 2016
Total 4,607
TidalCanada currently has 1 tidal facility in operation. Annapolis Tidal Station, located in Nova Scotia, has a generation capacity of 20 MW.

84
Renewable energy – Wood and wood waste
Energy Fact Book — 2016–2017
Wood and wood waste (2014)Wood and wood waste account for the largest share of renewable energy production in the OECD, at 34.9%. In Canada, that share is 26.7% – the second largest after hydro’s 65.4%.
Canadian production
Wood fuel use, by sector (2014)
There are 135 facilities in Canada with a capacity of at least 0.8 MW that use biomass to generate electricity. Together they have an aggregate capacity of about 3,000 MW. Additionally, there are 282 bio-heat facilities.
Peta
joul
es
Wood pellets
Firewood
Liquid wood waste
Solid wood waste
2005
2004
2003
2002
2001
2000
2006
20
07
2008
20
09
2010
20
11
2012
20
13
2014
0
100
200
300
400
500
600
700
Residential28.1%
Industrial64.4%
Electricity7.5%

85
Renewable energy – Wind
Energy Fact Book — 2016–2017
Wind power – international context
World capacity of wind power – 432,883 MW (2015)
1) China .......................................................................... 34%2) United States ............................................................... 17%3) Germany ...................................................................... 10%4) Spain ............................................................................. 5%5) India .............................................................................. 6%6) United Kingdom ............................................................. 3%7) Canada ..........................................................................3%
Wind power in CanadaGeneration (2014) – 22.3 TWh, a 25% increase from 2013, representing 3.6% of total electricity
Capacity (at the end of 2015) – 11,205 MW
Installed capacity
Meg
awat
ts
Cumulative Annual additions
2005
2004
2006
2007
2008
2009
2010
2011
2012
2013
2014
2015
0
2,000
4,000
6,000
8,000
10,000
12,000

86
Renewable energy – Wind
Energy Fact Book — 2016–2017
Wind power
Capacity by province, 2015
Selected largest wind farms in Canada* (≥150 MW)
Facility Province Total capacity (MW)
Lac Alfred (I and II) Que. 300
Blackspring Ridge Alta. 299
Seigneurie de Beaupré 2 and 3 Que. 272
South Kent Wind Farm Ont. 270
K2 Wind Farm Ont. 270
Riviere du Moulin Phase II Que. 200
Wolfe Island Ont. 198
Prince Project Ont. 189
Kincardine Ont. 182
Armow Wind Farm Ont. 180
Comber East and West Ont. 166
Kent Hills 1 and 2 N.B. 150
Massif du Sud Que. 150
Riviere du Moulin Phase I Que. 150
* There are 217 wind power facilities in Canada with a capacity of at least 0.8 MW.
Que.29%
N.B.3%
P.E.I.2%
N.W.T.0.1%
B.C.4%
Alta.13%
Man.2%
Ont.39%
Sask.2%
Yukon0.01%
N.L.1%
N.S.5%

87
Renewable energy – Solar
Energy Fact Book — 2016–2017
Solar photovoltaic – international context
World capacity of solar PV – 227,000 MW (2015)
1) China .......................................................................... 19%2) Germany ...................................................................... 17%3) Japan ........................................................................... 15%4) United States ............................................................... 11%5) Italy ............................................................................... 8%… Canada .........................................................................1%
Solar PV in CanadaCapacity (at the end of 2015) – 2,517 MW, a 37% increase since 2014
Installed capacity
2006
2005
2007
2008
2009
2010
2011
2012
2013
2014
2015
Meg
awat
ts
Cumulative Annual additions
0
500
1,000
1,500
2,000
2,500
3,000

88
Renewable energy – Solar
Energy Fact Book — 2016–2017
Solar photovoltaic
Selected largest solar PV farms in Canada* (≥20 MW)
Facility Province Total capacity (MW)
Sol-Luce Kingston Ont. 100
Grand Renewable Energy Park Ont. 100
Sarnia Solar Project 2 Ont. 60
Sault Ste. Marie 2 Ont. 34
Stardale Ont. 33
Sault Ste. Marie 1 Ont. 24
Elmsley East/West Ont. 24
Arnprior Ont. 23
Sarnia Solar Project 1 Ont. 20
Belmont Ont. 20
Amherstburg-1 Ont. 20
St. Clair Moore Ont. 20
St. Clair Sombra Ont. 20
Walpole Ont. 20
* There are 136 solar PV facilities in Canada with a capacity of at least 0.8 MW.

89
Renewable energy – Biofuels
Energy Fact Book — 2016–2017
Biofuels – international context
World production of biofuels – 118.5 billion L (2015)
1) United States ............................................................... 50%2) Brazil ........................................................................... 25%3) European Union ........................................................... 10%4) China ............................................................................ 2%5) Canada ..........................................................................2%
World biofuels production
U.S.China EU Brazil
Billi
on li
tres
2006
2007
2008
2009
2010
2011
2012
2013
2014
2015
Canada Rest of the world
0
20
40
60
80
100
120

90
Renewable energy – Biofuels
Energy Fact Book — 2016–2017
Biofuels
Canadian supply and demand
Activity Ethanol (2015)
Biodiesel (2015)
Mb/d (million L)
Canadian production 29.6(1,720)
5.3(307)
Imports 19.0(1,100)
6.6(383)
Exports 0 4.1(238)
Domestic use 48.6(2,820)
7.8(452)
Chicago ethanol market price
Jan-
14
Apr-1
4
Jul-1
4
Oct-1
4
Oct-1
5
Jul-1
5
Apr-1
5
Jan-
15
US$
per g
allo
n
0.0
0.5
1.0
1.5
2.0
2.5
3.0
3.5
4.0

91
Renewable energy – Biofuels
Energy Fact Book — 2016–2017
Biofuels
Regulations (2015)
Gasoline Diesel
(% of renewable fuels content)
Canada 5.0 2
British Columbia 5.0 4
Alberta 5.0 2
Saskatchewan 7.5 2
Manitoba 8.5 2
Ontario 5.0 2
Quebec 5.0* –
* Not regulated, target only
• The federal Renewable Fuels Regulations, administered by Environment and Climate Change Canada, require fuel producers and importers to have an average renewable content of at least 5% based on the volume of gasoline that they produce or import commencing on December 15, 2010.
• Fuel producers and importers of diesel fuel are also required to have an average annual renewable fuel content of at least 2% of the volume of diesel fuel that they produce and import commencing July 1, 2011 (heating distillate oil volumes for space heating purposes were excluded from the diesel regulations starting January 1, 2013).

93Energy Fact Book — 2016–2017
Electricity9 Canadian industry structureThe electricity industry performs three main activities:• generating electricity by using various energy sources and
technologies
• high-voltage transmission of electricity, usually over long distances, from power plants to end-use markets
• distributing electricity to end users, usually through low-voltage, local power distribution lines
In some provinces, electricity is provided by vertically integrated electric utilities that are often provincial Crown corporations.
Major associations
• Canadian Electricity Association
• Provincially focused independent power producers’ societies
• Source-specific associations (e.g. Canadian Hydropower Association and Canadian Wind Energy Association)
Regulatory authority
• Primarily under provincial jurisdiction
• Provincial governments exercise their jurisdiction through provincial Crown utilities and regulatory agencies.
• The NEB regulates international power lines and electricity exports.

94
Electricity
Energy Fact Book — 2016–2017
International context
World generation – 23,903 TWh (2014)
1) China .......................................................................... 24%2) United States ............................................................... 18%3) India .............................................................................. 5%4) Russia ............................................................................ 4%5) Japan ............................................................................. 4%6) Canada ..........................................................................3%7) Germany ........................................................................ 3%8) Brazil ............................................................................. 2%
World exports – 690 TWh (2014)1) France ......................................................................... 11%2) Germany ...................................................................... 11%3) Canada ..........................................................................8%4) Paraguay ....................................................................... 6%5) Switzerland .................................................................... 5%6) Sweden .......................................................................... 4%

95
Electricity
Energy Fact Book — 2016–2017
Canadian supply
Generation in Canada – 639 TWh (2014)
Generation by source, 2014
Generation from renewable sources: 64%, first in the G7
Generation from non-GHG emitting sources: 80%, second in the G7 after France
Provincial characteristics
Hydro59.3%
Non-hydrorenewables
5.1%
Gas/oil/others10.2%
Coal9.5%
Nuclear15.9%
100%90%
80%
70%
60%
50%
40%
30%
20%
10%0%
P.E.I.
Nunavut
N.S.
Sask.
N.B.
Ont.
B.C.
Yukon
N.L.
Man.
Que.
N.W.T.
Alta.
Petroleum
Hydro
Nuclear Coal Natural gas
Biomass Wind
Other
SolarTidal

96
Electricity
Energy Fact Book — 2016–2017
Trade (2015)
Canada’s electricity trade with the U.S.*
* includes only electricity traded under purchased contracts; excludes electricity transferred under non-financial agreements (e.g. under treaty obligations)
Exports ................................................... 68 TWh
Imports ..................................................... 9 TWh
Key facts (2015)
• All Canadian electricity trade is with the U.S.
• Canada exports 9% of its electricity to the U.S., which meets 2% of U.S. consumption.
2005
2006
2007
2008
2009
2010
2011
2012
2013
2014
2015
Tera
wat
t hou
rs
Exports Imports Net trade
0
10
20
30
40
50
60
70

97
Electricity
Energy Fact Book — 2016–2017
Retail prices
Average residential electricity prices, including taxes, April 2015 (cents/kWh)
Average large industrial electricity prices, including taxes, April 2015 (cents/kWh)
13.19
17.80
16.83
13.90
8.27
16.40
9.38
16.53
12.12
11.00
5.39
10.15
11.52
8.06
5.63
6.27
4.50
7.89
4.44
6.54
0 5 10 15 20
St. John’s, N.L.
Charlottetown, P.E.I.
Halifax, N.S.
Moncton, N.B.
Montréal, Que.
Toronto, Ont.
Winnipeg, Man.
Regina, Sask.
Edmonton, Alta.
Vancouver, B.C.
0 2 4 8 14 16 1812106 20
St. John’s, N.L.
Charlottetown, P.E.I.
Halifax, N.S.
Moncton, N.B.
Montréal, Que.
Toronto, Ont.
Winnipeg, Man.
Regina, Sask.
Edmonton, Alta.
Vancouver, B.C.


99Energy Fact Book — 2016–2017
Energy demand10 Primary energy use• Primary energy use measures the total energy requirements
of all users of energy.
• Primary energy use includes secondary energy use. Additionally, primary energy use includes the energy required to transform one form of energy into another (e.g. coal to electricity); the energy used to bring energy supplies to the consumer (e.g. pipeline); and the energy used to feed industrial production processes (e.g. NGLs used as feedstock by the chemical industries).
• In 2013, the total amount of primary energy consumed was estimated at 12,681.4 PJ.
Secondary energy use• Secondary energy use accounts for the energy used by final
consumers in various sectors of the economy.
• Secondary energy use includes the energy used to run vehicles in the transportation sector; the energy used to heat and cool buildings in the residential and commercial/institutional sectors; and the energy required to run machinery in the industrial and agricultural sectors.
• In 2013, secondary energy use accounted for about 70% of primary energy use, or 8,924.0 PJ.
All subsequent use of the phrase “energy use” in this section refers to secondary energy use, unless otherwise stated.

100
Energy demand
Energy Fact Book — 2016–2017
Factors affecting energy use• level of activity – the number of households and the floor space
of residences; short-term variations in industrial output
• sectoral structure (e.g. growth and decline of industries with varied energy intensity)
• weather – leading to changes in heating and cooling requirements
• service level (i.e. the penetration rate of devices and equipment, such as residential air conditioners)
• capacity utilization rate – the proportion of the installed production capacity that is in use
• energy efficiency
Energy efficiency• a measure of how effectively energy is used for a given purpose
• providing a similar (or better) level of service with less energy consumption on a per-unit basis is considered an improvement in energy efficiency
Energy intensity• the ratio of energy use per unit of activity (such as floor space,
GDP, Pkm, Tkm, etc.)

101
Energy demand
Energy Fact Book — 2016–2017
Primary and secondary energy use by sector, 2013
Not every fuel is consumed predominantly as secondary energy. For example, about 68% of the hydrocarbon gas liquid supply in Canada is used as a non-energy feedstock in the petrochemical industry.
Canada’s secondary energy use – 8,924 PJ (2013)
Energy use by fuel type, 2013
* “Other” includes coal, coke, coke oven gas, NGLs and steam and waste.
Non-coveredproducer consumption
7%
Non-energy8%
Energylosses
(conversion)13%
Pipeline1% Industrial
28%
Residential12%
Agriculture2%
Commercialand
institutional7%
Transportation21%
Secondary 70.4%
Primary Secondary
Other*4%
Biomass7%
Other oil products8%
Oil16%
Motor gasoline17%
Natural gas29%
Electricity19%

102
Energy demand
Energy Fact Book — 2016–2017
Natural gas energy use (2013)
Total natural gas energy use was 2,573.9 PJ in 2013.
Sector Energy use (PJ)
% of the total
Residential 685.3 26.6%
Commercial 496.7 19.3%
Industrial 1,351.9 52.5%
Transportation 1.5 0.1%
Agriculture 38.5 1.5%
Total 2,573.9 100%
Natural gas energy use by province, 2013
* Atlantic provinces.
ATL*1% Que.
9%
Ont.32%
Man.3%Sask.
5%
Alta.41%
B.C. and TERR9%

103
Energy demand
Energy Fact Book — 2016–2017
Natural gas liquids energy use (2013)
Total natural gas liquids energy use was 139.0 PJ in 2013.
Sector Energy use (PJ)
% of the total
Residential 14.6 10.5%
Commercial 35.0 25.2%
Industrial 70.7 50.9%
Transportation 10.4 7.5%
Agriculture 8.2 5.9%
Total 139.0 100%
Natural gas liquids energy use by province, 2013
ATL5%
Que.12%
Ont.29%
Man.3%
Sask.4%
Alta.40%
B.C. and TERR7%

104
Energy demand
Energy Fact Book — 2016–2017
Electricity energy use (2013)
Total electricity energy use was 1,720.9 PJ in 2013.
Sector Energy use (PJ)
% of the total
Residential 566.4 32.9%
Commercial 359.2 20.9%
Industrial 755.1 43.9%
Transportation 4.4 0.3%
Agriculture 35.9 2.1%
Total 1,720.9 100%
Electricity energy use by province, 2013
ATL7%
Que.36%
Ont.24%
Man.4%
Sask.4%
Alta.13%
B.C. and TERR12%

105
Energy demand
Energy Fact Book — 2016–2017
Energy efficiency• Energy efficiency in Canada improved by 24.2% between
1990 and 2013.
• Efficiency improvements slow the rate of growth in energy use:
• Energy use grew by 28% between 1990 and 2013.
• Without energy efficiency improvements, energy use would have grown by 51%.
• Energy efficiency savings of 1,613 PJ in 2013:
• equivalent to end-user savings of $37.6 billion
Secondary energy use with and without energy efficiency improvements 1990–2013
Peta
joul
es
11,000
10,500
10,000
9,500
9,000
8,500
8,000
7,500
7,000
6,500
6,000
1998
1999
1997
1996
1995
1990
1991
1992
1994
1993
2000
2002
2001
2004
2003
2006
2005
2008
2007
2010
2009
2012
2013
2011
Energy use including energy efficiency effect
Energy use excluding energy efficiency effect
Energy Efficiency Savings

106
Energy demand
Energy Fact Book — 2016–2017
Energy intensity• Canada used 25% less energy per dollar of GDP in 2013 than
in 1990.
Total secondary energy use intensity per capita and unit of GDP index 1990–2013 (1990=1)
Inde
x
2000
1999
1998
1997
1996
1991
1990
1993
1992
1995
1994
2001
2002
2004
2005
2003
2006
2007
2008
2009
2010
2012
2013
2011
Energy use intensity per GDP
Energy use intensity per capita
0.70
0.75
0.80
0.85
0.90
0.95
1.00
1.05
1.10

107
Energy demand
Energy Fact Book — 2016–2017
Trends in energy use and intensity by subsector, 1990–2013
Energy use¹ Energy intensity²
Residential 7% -35%
Commercial 23% -15%
Transportation (passenger)
20% -21%
Freight 78% 11%
Industrial (forestry, mining, manufacturing, construction)
30% -9%
Industry (w/o upstream mining)
-1% -31%
¹ energy used by final consumers to deliver energy services in various sectors of the economy (e.g. space heating, process heating and lighting)
² the amount of energy used per unit of activity (i.e. floor space – residential, floor space – commercial, Pkm, Tkm and GDP)
• Most industries saw a reduction in their energy intensity due in part to gains in energy efficiency.

108
Energy demand
Energy Fact Book — 2016–2017
Canadian households
Household expenditures on residential and transportation
• Canadian households spent $4,735 on average on energy in 2014.
• Residential energy expenditures averaged $2,265.
• Transportation energy expenditures averaged $2,470.
• Energy accounted for 8% of current household consumption.
• Lower-income households spend a larger share of their disposable income on energy.
Energy retail prices
• The “energy” component of the consumer price index (CPI) has been volatile in recent years.
• This volatility reflects mostly the variations of upstream oil and gas prices and their impact on consumer products such as gasoline.
Consumer price index (2002=100)
Inde
x
2002
2004
2005
2003
2006
2007
2008
2009
2010
2012
20
13
2014
2016
2015
2011
Energy CPI Total CPI CPI excluding energy
80
100
120
140
160
180

109
Energy demand
Energy Fact Book — 2016–2017
Residential sector
Overview – 1990–2013 period
• Residential energy efficiency improved by 45%, saving 639 PJ of energy and $12 billion in energy costs.
• Residential energy use increased by 6.5%, but would have increased by 51% without energy efficiency improvements.
• Energy intensity decreased by 24% per household, while energy use per square metre decreased even more, at 35%.
Energy use by end use, 2013
Space heating62%
Water heating19%
Appliances13%
Lighting4%
Space cooling1%

110
Energy demand
Energy Fact Book — 2016–2017
Residential space heating by fuel type, 2013
Residential water heating by fuel type, 2013
Electricity25%
Natural gas50%
Heating oil7%
Other1%
Wood17%
Natural gas68%
Heating oil4%
Other1%
Wood2%
Electricity25%

111
Energy demand
Energy Fact Book — 2016–2017
Commercial and institutional sectors
Overview – 1990–2013 period
• Energy efficiency in the commercial/institutional sector improved by 33%, saving Canadians 241.8 PJ of energy and $5.4 billion in energy costs in 2013.
• Energy use increased by 23%, but would have increased by 55% without energy efficiency improvements.
• Energy intensity (GJ/m²) decreased by 15%.
Energy use by end use, 2013
Auxiliary equipment14%
Auxiliary motors7%
Street lighting1%
Space cooling4%
Lighting11%
Water heating8%
Space heating55%

112
Energy demand
Energy Fact Book — 2016–2017
Industrial sector
Overview – 1990–2013 period
• The Canadian industry saved $3.0 billion in energy costs because of an 8.1% energy efficiency improvement, saving 220.1 PJ.
• Industrial energy use increased by 30%, but would have increased by 38% without energy efficiency improvements.
• Energy intensity (MJ/$ of GDP) decreased by 9%.
The industrial sector includes all manufacturing, mining (including oil and gas extraction), forestry and construction activities, and in 2013, these industries spent $47.6 billion on energy.
Energy use by fuel type, 2013
* “Other” includes HFO, coal, LPGs, NGL, steam and waste.
Diesel fuel oil,light fuel oil
and kerosene6%
Still gas andpetroleum coke
14%
Coke and cokeoven gas
3%
Wood waste andpulping liquor
10%
Other*6%
Electricity21%
Natural gas38%

113
Energy demand
Energy Fact Book — 2016–2017
Transportation sector
Over the 1990–2013 period
• Energy efficiency in the transportation sector improved by 29%, saving Canadians 512.1 PJ of energy and $17.1 billion in energy costs in 2013.
• Total transportation energy use increased by 43%.
Energy use by transportation type, 2013
Energy use by fuel type, 2013
Freighttransportation
45%
Passengertransportation
51%
Off-road4%
Diesel fuel oil32%
Heavy fuel oil2%
Aviation fuel10%
Ethanol2%
Other (propane,natural gas,electricity)
1%
Motor gasoline53%


115Energy Fact Book — 2016–2017
Greenhouse gas emissions11 Canadian GHG emissions (2014)
Total* .................................................... 732 Mt CO2 equivalent
* excludes land use, land-use change and forestry estimates
Between 2005 and 2014, Canada’s GHG emissions decreased 2.0% while the economy grew 13.9%.
Over the same period, emissions from electricity production decreased 33.9% and emissions from fossil fuel production increased 21.0%, leading to an overall decrease of 2.1% in emissions from energy production.
GHG emissions by economic sector, 2014
* includes coal production
** EITE: emissions intensive, trade exposed (Mining; Smelting and Refining of Non-Ferrous Metals; Pulp and Paper; Iron and Steel; Cement; Lime and Gypsum; Chemicals and Fertilizers)
Fossil fuel production*27%Agriculture
10%
Buildings 12%
EITE industry**10%
Waste and other7%
Electricity11%
Transportation 23%

116
Greenhouse gas emissions
Energy Fact Book — 2016–2017
GHG emissions by fossil fuel subsector, 2014
* See Chapter 2, “Crude oil”, for more information on GHG emissions from the oil sands.
GHG emissions by province, 2014
Oil and gas pipelinesand natural gas distribution
6%
Coal production2%
Oil sands*34%
Natural gas 29%
Petroleumrefining
11%
Conventional oil18%
Maritimes 4.5%
Man.2.9%
N.L.1.4% TERR
0.3%
Alta.37.4%
Ont.23.2%
B.C.8.6%
Sask.10.3%
Que.11.3%

117
Greenhouse gas emissions
Energy Fact Book — 2016–2017
GHG emissions, 1990–2014
GHG emissions, selected economic sectors, 1990–2014
Mt C
O 2 equ
ival
ent
2002
2000
1998
1996
1994
1992
1990
2004
2006
2008
2010
2012
2014
550
600
650
700
750
800
Mt C
O 2 equ
ival
ent
Fossil fuels Electricity
Transportation Buildings
2002
2000
1998
1996
1994
1992
1990
2004
2006
2008
2010
2012
2014
0
50
100
150
200
250


119Energy Fact Book — 2016–2017
Annex 1: Units and conversion factors
Prefixes and equivalents
Prefix Equivalent
SI/Metric Imperial
k kilo M thousand 103
M mega MM million 106
G giga B billion 109
T tera T trillion 1012
P peta – quadrillion 1015
Notes• Tonne may be abbreviated to “t” and is not to be confused
with “T” for tera or trillion.
• Roman numerals are sometimes used with imperial units (this can create confusion with the metric “M”).
Crude oil
Upstream
• reserves/production usually in barrels or multiples (million barrels)
• production/capacity often in barrels per day or multiples (thousand barrels/day or Mb/d, million barrels/day or MMb/d)
• metric: 1 cubic metre = 6.2898 barrels
• International Energy Agency: uses weight (tonnes) rather than volume
Downstream
• volumes of refined products usually in litres
• 1,000 litres = 1 cubic metre
• U.S.: 1 U.S. gallon = 3.785 litres

120
Annex 1: Units and conversion factors
Energy Fact Book — 2014–2014
Natural gas
Volume
• reserves/production usually in cubic feet or multiples (billion cubic feet or Bcf, trillion cubic feet or Tcf)
• production/capacity often in cubic feet per day or multiples (Bcf/d, Tcf/d)
• metric: 1 cubic metre = 35.3147 cubic feet
Density
• 1 million t LNG = 48.0279 billion cubic feet
Pricing
volume based:
• cents per cubic metre (¢/m³) (customer level in Canada)
• $ per hundred cubic feet ($/CCF) (customer level in the U.S.)
energy content based:
• $ per gigajoule ($/GJ) (company level in Canada)
• $ per million British thermal units ($/MMBTU) (company level in the U.S., LNG)
Coal
• 1 metric tonne = 1,000 kilograms
• U.S.: 1 short ton = 2,000 pounds
• 1 metric tonne = 1.10231 short tons
Uranium
• 1 metric tonne = 1,000 kilograms of uranium metal (U)
• U.S.: in pounds of uranium oxide (U3O8)
• 1 lb. U3O8 = 0.84802 lb. U = 0.38465 kg U

121
Annex 1: Units and conversion factors
Energy Fact Book — 2016–2017
Electricity
Capacity
• maximum rated output that can be supplied at an instant, commonly expressed in megawatts (MW)
Total capacity
• installed generator nameplate capacity
Generation/sales
• flow of electricity over time, expressed in watt-hours, or multiples:
• kilowatt-hours or kWh (e.g. customer level)
• megawatt-hours or MWh (e.g. plant level)
• gigawatt-hours or GWh (e.g. utility level)
• terawatt-hours or TWh (e.g. country level)
From capacity to generation
• A 1-MW unit operating at full capacity over one hour generates 1 MWh of electricity.
• Over one year, this unit could generate up to 8,760 MWh (1 MW × 24 hr × 365 days).
• Units are rarely used at full capacity over time because of factors such as maintenance requirements, resource limitations and low demand.
• “Capacity factor” is the ratio of actual generation to full capacity potential.

122
Annex 1: Units and conversion factors
Energy Fact Book — 2014–2014
Energy contentRather than using “natural” units (e.g. volume, weight), energy sources can be measured according to their energy content – this allows comparison between energy sources.
• metric: joules or multiples (gigajoules or GJ, terajoules or TJ, petajoules or PJ)
• U.S.: 1 British thermal unit (BTU) = 1,055.06 joules
• IEA: energy balances expressed in oil equivalent
• thousand tonnes of oil equivalent (ktoe)
• million tonnes of oil equivalent (Mtoe)
Typical values
• 1 m³ of crude oil = 39.0 GJ
• 1,000 m³ of natural gas = 38.3 GJ
• 1 MWh of electricity = 3.6 GJ
• 1 metric tonne of coal = 29.3 GJ
• 1 metric tonne of wood waste = 18.0 GJ
• 1 metric tonne of uranium = 420,000 GJ to 672,000 GJ

123Energy Fact Book — 2016–2017
Annex 2: Abbreviations
b/d barrels per dayBcf/d billion cubic feet per dayBcm/d billion cubic metres per dayCCS carbon capture and storageCDIA Canadian direct investment abroadCO2 equivalent carbon dioxide equivalentEIA Energy Information Administration (U.S.)FDI foreign direct investmentG7 Seven wealthiest major developed nations:
Canada, France, Germany, Italy, Japan, U.K. and U.S.
GDP gross domestic productGHG greenhouse gasGJ gigajouleGST Goods and Services taxHGL hydrocarbon gas liquidsHST Harmonized Sales taxIEA International Energy Agencykg kilogramkm kilometrekm² square kilometrekt kilotonnelb. poundL litreLNG liquefied natural gasLPG liquefied petroleum gasesm metrem² square metrem³ cubic metreMb/d thousand barrels per dayMMb/d million barrels per dayMMcf/d million cubic feet per dayMt million tonnes; megatonneMtoe million tons of oil equivalentmtpa million tonnes per annumMW megawatt

124
Annex 2: Abbreviations
Energy Fact Book — 2016–2017
NEB National Energy BoardNGL natural gas liquidsNRCan Natural Resources CanadaNSERC National Science and Engineering Research
Council of CanadaOECD Organisation for Economic Co-operation
and DevelopmentPJ petajoulePkm passenger-kilometreProvinces Alta. – Alberta B.C. – British Columbia Man. – Manitoba N.B. – New Brunswick N.L. – Newfoundland and Labrador N.S. – Nova Scotia N.W.T. – Northwest Territories Ont. – Ontario P.E.I. – Prince Edward Island Que. – Quebec Sask. – SaskatchewanP/T provincial/territorialPV photovoltaicRD&D research, development and demonstrationR&D research and developmentRPP refined petroleum productsSDTC Sustainable Development Technology CanadaTcf trillion cubic feetTcm trillion cubic metresTkm tonne-kilometret tonnesTPES total primary energy supplyTWh terawatt-hourUAE United Arab EmiratesU.K. United KingdomU.S. United StatesUS$ United States dollarsWCS Western Canada SelectWTI West Texas Intermediate

125Energy Fact Book — 2016–2017
Annex 3: Sources
1. Energy industryCanada’s position in the world: electricity capacity from the United Nations; for other data, see relevant chapters
Gross domestic product: StatCan CANSIM Table 379-0029, nominal values for recent years estimated by NRCan
Employment: CANSIM Table 383-0031, StatCan Aboriginal People and the Labour Market Estimates from the Labour Force Survey, 2014
Provincial/territorial gross domestic product: StatCan CANSIM tables 379-0030 and 384-0037
Provincial/territorial employment: StatCan CANSIM Table 383-0029
Capital expenditures: StatCan CANSIM tables 029-0045, 029-0046, and 029-0051
Exports/imports: StatCan International Merchandise Trade Database (TRAGS Database)
Government revenues: StatCan CANSIM Table 180-0003, StatCan special tabulation (royalties), Canadian Association of Petroleum Producers, Statistical Handbook, Table 01-01C
Energy and Cleantech: BNEF & Frankfurt School FS-UNEP Collaborating Centre for Climate and Sustainable Energy Finance (2015) Global Trends in Renewable Energy Investment; Tracking the Energy Revolution; and, Analytica Advisors, Canadian Clean Technology Industry Report, 2016
Expenditure on energy RD&D: IEA RD&D Budget database; Statistics Canada, CANSIM Table 358-0142, Federal Expenditures on Science and Technology and its Components in Current Dollars and 2007 Constant Dollars, Research and Development in Current Dollars for 2014-15; Statistics Canada, Energy R&D Expenditures by Area of Technology for industry expenditures; and data compiled by NRCan
Foreign control: StatCan CANSIM tables 179-0004, 179-0005, and 180-0003 and StatCan document 61-220-X

126
Annex 3: Sources
Energy Fact Book — 2016–2017
Investment: StatCan CANSIM Table 376-0052
Major recent deals: S&P Capital IQ, Canoils, Bloomberg (based on closing dates when available)
Canadian energy assets: NRCan estimates based on company financial statements and annual reports
Canadian production: StatCan CANSIM tables 127-007, 128-0016, and 128-0007, and NRCan estimates
Total primary energy supply: IEA Annual Database, World Energy Balances and IEA SLT questionnaire
2. Crude oilWorld production and exports: International Energy Agency (IEA Online Data Services)
World proved reserves: Oil and Gas Journal, Survey: Worldwide Look at Reserves and Production
Canadian resources: CAPP Statistical Handbook, May 2016; Alberta Energy Regulator (AER), Alberta’s Energy Reserves 2015 and Supply/Demand Outlook 2016–2025
Wells completed and metres drilled in western Canada: JuneWarren-Nickle’s Energy Group, Canadian Association of Oilwell Drilling Contractors (CAODC)
Canadian production: StatCan CANSIM Table 126-0001 and NRCan analysis
Canadian supply and demand: StatCan CANSIM tables 126-0001, 134-0001, and 133-0003
Trade: StatCan CANSIM Table 126-0001 and StatCan International Merchandise Trade Database (TRAGS Database), U.S. Energy Information Administration, Imports by Country of Origin, Refinery and Blender Net Input for Crude Oil
Prices: U.S. EIA Tables on Spot Prices for Crude Oil and Sproule Worldwide Petroleum Consultants
Pipelines: compiled by NRCan

127
Annex 3: Sources
Energy Fact Book — 2016–2017
Oil sands: CAPP Statistical Handbook, Table 4-16B, Statistics Canada CANSIM tables 029-0046 and 126-0001, Alberta Energy Regulator (AER) Alberta’s Energy Reserves 2015 and Supply/Demand Outlook 2016–2025, Table R3.2, and NRCan analysis
Light tight Oil/Shale Oil: U.S. EIA, Technically Recoverable Shale Oil Resources
Environmental challenges: compiled by NRCan
Crude by rail: CANSIM Table 404-0002, CAPP Crude Oil Forecast, Markets & Transportation, NEB Canadian Crude Oil Exports by Rail – Quarterly Data, Oil Sands Magazine, and company websites.
3. Petroleum productsCanadian refineries: compiled by NRCan from company information and Conference Board of Canada, Canada’s Petroleum Refining Sector, and other published sources
Canadian supply and demand: StatCan CANSIM tables 134-0001 and 134-0004, NRCan analysis
Trade: StatCan CANSIM Table 134-0004
Trade, Key Facts: StatCan CANSIM Table 134-0004, U.S. EIA, U.S. Imports by Country of Origin for Petroleum and Other Liquids, and StatCan International Merchandise Trade Database (percentage of dollar value)
Gasoline prices: Kent Group Ltd, average retail prices for regular gasoline and diesel fuel, and data compiled by NRCan
Canadian petroleum refineries: Canadian Fuels Association, Canadian Association of Petroleum Producers
4. Hydrocarbon gas liquidsCanadian supply: StatCan CANSIM tables 134-004 and 131-0002
Trade: NEB for Exports; and StatCan International Merchandise Trade Database (TRAGS Database) for Imports
Production by province: CAPP Statistical Handbook, tables 3.5a, 3.6a, and 3.14a

128
Annex 3: Sources
Energy Fact Book — 2016–2017
5. Natural gasWorld production and exports: International Energy Agency, IEA Natural Gas Information
World proved reserves: Oil and Gas Journal
Canada reserves: CAPP Statistical Handbook, Table 02-13B
Canada resources: NEB, Canada’s Energy Future 2013
U.S. reserves: U.S. EIA, Natural Gas Reserves Summary, dry gas
U.S. resources: Potential Gas Committee, Report of Potential Supply of Natural Gas in the United States, 2013 and U.S. EIA, Technically Recoverable Shale Oil and Shale Gas Resources: An Assessment of 137 Shale Formations in 41 Countries Outside the United States, June 2013
World resources: International Energy Agency, World Energy Outlook 2015, Table 5.3
Shale gas: U.S. EIA, Technically Recoverable Shale Gas Resources, June 2013, Table 6
Canada-U.S. market: compiled by NRCan from StatCan, U.S. EIA, US Natural Gas Imports by Country, National Energy Board, Natural Gas Imports, Exports and Liquefied Natural Gas Statistics, Commodity Statistics for LNG imports, LNG Shipment Details
Wells completed and metres drilled in western Canada: JuneWarren-Nickle’s Energy Group and CAODC
Canadian production: StatCan CANSIM Table 131-0001
U.S production: U.S. EIA Table Natural Gas Gross Withdrawals and Production
Trade: NEB, Natural Gas Imports, Exports and Liquefied Natural Gas Statistics, Commodity Statistics for pipeline trade, Gas Monthly Summary for the Year, U.S. EIA, Natural Gas Consumption by End Use and calculations by NRCan
Canadian domestic demand: StatCan CANSIM tables 128-0017 and 129-0002

129
Annex 3: Sources
Energy Fact Book — 2016–2017
Prices: GLJ Energy Publications, Canadian National Gas Focus, 2002–2014
Pipelines: compiled by NRCan
LNG export applications: compiled by NRCan
6. CoalWorld production and exports: International Energy Agency, IEA Coal Information
World proved reserves: World Energy Council
Canadian supply and demand: StatCan CANSIM Table 135-0002 and StatCan International Merchandise Trade Database (TRAGS Database)
Coal-fueled power plants: compiled by NRCan from StatCan and other public sources
7. Uranium and nuclear powerWorld production and exports: World Nuclear Association
World known recoverable resources: Organisation for Economic Co-operation and Development, Nuclear Energy Agency, International Atomic Energy Agency
Canadian supply and demand: compiled by NRCan from company information; also published by the World Nuclear Association
Purchases by U.S. nuclear reactors: U.S. EIA Table Uranium Purchases by Owners and Operators of Civilian Nuclear Power Reactors
Spot prices: Ux Consulting Company
Nuclear power world generation: U.S. EIA Table Nuclear Electricity Net Generation
Nuclear power plants in Canada: compiled by NRCan from StatCan and other public sources

130
Annex 3: Sources
Energy Fact Book — 2016–2017
8. Renewable energyInternational context: International Energy Agency (IEA Renewables Information)
Domestic production: International Energy Agency (IEA Renewables Information), based on StatCan and NRCan data
Hydro – international context: International Energy Agency (IEA Electricity Information, Energy Balances of OECD Countries, and Energy Balances of Non-OECD Countries)
Hydro – capacity in Canada: StatCan CANSIM Table 127-0009 and compiled by NRCan
Hydro – facilities and projects: compiled by NRCan from StatCan and other public sources
Wood and wood waste – share of renewables: International Energy Agency (IEA Renewables Information)
Wood and wood waste – production: StatCan CANSIM Table 128-0018, StatCan International Merchandise Trade Database (TRAGS), NRCan
Wood and wood waste – wood fuel use by sector: International Energy Agency, IEA Renewables Information
Wood and wood waste – trade: StatCan International Merchandise Trade Database (TRAGS)
Wind – international context: Global Wind Energy Council
Wind – generation in Canada: StatCan CANSIM Table 127-0007
Wind – capacity in Canada: compiled by NRCan from multiple sources (e.g. Canadian Wind Energy Association, StatCan, NRCan)
Wind – wind farms: compiled by NRCan from StatCan and other public sources
Solar PV – international context: Renewable Energy Policy Network for the 21st Century
Solar PV – capacity in Canada: Canada’s Annual Report to the IEA Implementing Agreement on PV and compiled by NRCan

131
Annex 3: Sources
Energy Fact Book — 2016–2017
Solar PV – solar PV farms: compiled by NRCan from StatCan and other public sources
Biofuels – Canadian production of biofuels; World production of biofuels: Bloomberg New Energy Finance, F.O. Licht, FAPRI
Biofuels – supply and demand: production:, Bloomberg New Energy Finance, FO Licht; imports/exports: StatCan
Biofuels – ethanol prices: Oil Price Information Service, Chicago Ethanol Market Price
Biofuels – regulations: compiled by NRCan
9. ElectricityWorld generation and exports: International Energy Agency, IEA Electricity Information, note: IEA production/generation data is expressed on a “gross” basis, i.e. before generating station use
Canadian supply: compiled by StatCan and NRCan
Trade: National Energy Board Table Electricity Exports and Imports Statistics, StatCan, and U.S. EIA Table Retail Sales of Electricity to Ultimate Customers
Domestic demand: StatCan CANSIM Table 128-0017
Prices: Hydro-Québec report Comparison of Electricity Prices in Major North American Cities
10. Energy demandPrimary and secondary energy use: Office of Energy Efficiency’s National Energy Use Database based on StatCan data
Canada’s secondary energy use: Office of Energy Efficiency’s National Energy Use Database based on StatCan data
Natural gas energy use: Office of Energy Efficiency’s National Energy Use Database based on StatCan data
Electricity energy use: Office of Energy Efficiency’s National Energy Use Database based on StatCan data

132
Annex 3: Sources
Energy Fact Book — 2016–2017
Natural gas liquids energy use: Office of Energy Efficiency’s National Energy Use Database based on StatCan data
Energy efficiency: Office of Energy Efficiency’s National Energy Use Database
Energy intensity: Office of Energy Efficiency’s National Energy Use Database
Household expenditures: StatCan CANSIM Table 203-0021
Consumer prices: StatCan CANSIM Table 326-0020
Residential sector: Office of Energy Efficiency’s National Energy Use Database based on StatCan data
Commercial and institutional sector: Office of Energy Efficiency’s National Energy Use Database based on StatCan data
Industrial sector: Office of Energy Efficiency’s National Energy Use Database based on StatCan data
Transportation sector: Office of Energy Efficiency’s National Energy Use Database based on StatCan data
11. Greenhouse gas emissionsGreenhouse gas emissions: Environment and Climate Change Canada’s National Inventory Report 1990–2014: Greenhouse Gas Sources and Sinks in Canada and NRCan analysis