energy efficiency, the value of buildings and the payment ... · today, buildings account for 40%...
TRANSCRIPT
Energy efficiency, the value of buildings and the payment default risk
Zancanella, P., Bertoldi, P., Boza-Kiss, B.
2018

This publication is a Science for Policy report by the Joint Research Centre (JRC), the European Commission’s science and knowledge service. It aims to provide evidence-based scientific support to the European policymaking process. The scientific output expressed does not imply a policy position of the European Commission. Neither the European Commission nor any person acting on behalf of the Commission is responsible for the use that might be made of this publication. Contact information Name: Paolo Bertoldi Address: European Commission, Joint Research Centre, Via E. Fermi 2749, TP 450, 21027 Ispra (VA), Italy Email: [email protected] Tel.: +39 0332 78 9299 EU Science Hub
https://ec.europa.eu/jrc JRC113215 EUR 29471 EN
PDF ISBN 978-92-79-97751-0 ISSN 1831-9424 doi:10.2760/267367
Luxembourg: Publications Office of the European Union, 2018 © European Union, 2018 The reuse policy of the European Commission is implemented by Commission Decision 2011/833/EU of 12 December 2011 on the reuse of Commission documents (OJ L 330, 14.12.2011, p. 39). Reuse is authorised, provided the source of the document is acknowledged and its original meaning or message is not distorted. The European Commission shall not be liable for any consequence stemming from the reuse. For any use or reproduction of photos or other material that is not owned by the EU, permission must be sought directly from the copyright holders. All content © European Union, 2018, except: Cover page, ©BillionPhotos.com, #88512866. Source: stock.adobe.com
How to cite this report: Zancanella, P., Bertoldi, P., Boza-Kiss, B., Energy efficiency, the value of buildings and the
payment default risk, EUR 29471 EN, Publications Office of the European Union, Luxembourg, 2018, ISBN 978-92-79-97751-0, doi:10.2760/267367, JRC113215.

i
Contents
Abstract ............................................................................................................... 1
Acknowledgements ............................................................................................... 2
Executive summary ............................................................................................... 3
1 Introduction ..................................................................................................... 5
2 The impact of energy efficiency improvements on the value of buildings .................. 6
2.1 Valuation methods for buildings and properties ............................................... 6
2.2 “Green value” and “brown discount” .............................................................. 8
2.3 Calculation options of the “Green value” ........................................................ 9
2.3.1 Methods to calculate the added value of energy performance .................. 10
2.3.2 The hedonic pricing method ................................................................. 10
2.3.3 The method based on the direct comparison between transaction prices ... 11
2.3.4 Method based on the willingness to payback investments in energy efficiency measures .................................................................................................... 11
2.3.5 Calculation of the net present value of costs of energy savings ................ 12
2.3.6 Calculation of the net present value of investment ................................. 12
2.4 Valuing energy efficiency by the market ........................................................ 15
2.4.1 Claimed value, willingness to pay ......................................................... 16
2.4.2 Impacts observed at the property markets ............................................ 16
2.4.3 Details on selected examples of green premium and brown discount through certificates and labels ................................................................................... 23
2.5 Rental vs. sale prices .................................................................................. 25
2.6 Summary and conclusion: the impact of EE on the building value ..................... 27
3 The role of energy efficiency in payment default risk ............................................ 28
3.1 Commercial mortgages and environmentally certified buildings ........................ 30
3.2 Energy efficiency to hedge against energy price risk ....................................... 31
3.3 Mechanisms to further decrease payment default risk ..................................... 33
4 Conclusions ..................................................................................................... 34
References .......................................................................................................... 36
List of abbreviations ............................................................................................. 42
List of boxes ........................................................................................................ 43
List of figures ...................................................................................................... 44
List of tables ....................................................................................................... 45

1
Abstract
Energy efficiency delivers energy savings and therefore energy cost savings, as well as direct environmental benefits. Besides, as an indirect effect, it has smaller or larger consequences on other economic values.
This report reviews current knowledge about the impact of energy efficiency improvements on the value of buildings. In particular, the methodology that can be applied to quantify the increase or decrease of property value linked to the energy performance and sustainability components is explained and different methods are compared.
Secondly, the report demonstrates the impact of energy efficiency on the payment default risk namely the link between energy efficiency investment and ability of borrowers to repay their loans.

2
Acknowledgements
We are grateful for the useful and constructive comments from our reviewers, in particular through the iterative process with the European Commission's Directorate-General for Energy (DG ENER).
Authors
Zancanella, Paolo; Bertoldi, Paolo; Boza-Kiss, Benigna

3
Executive summary
Energy efficiency is "an energy source in its own right"1. By 2030 more energy will be saved than the amount of oil-based energy then2, thus energy efficiency is expected to actually become the “first fuel”.
Policy context
Today, buildings account for 40% of Europe's total energy consumption. Around 75% of the building stock is energy inefficient. At the current 1% annual renovation rate it would take around a century to decarbonise the building stock to modern, low-carbon levels.
To realise the sustainable energy potential in buildings, a number of social, financial, technical barriers or administrative challenges need to be overcome. In this context, the European Commission launched the “Smart Finance for Smart Buildings” initiative in November 2016 to unlock private financing for energy efficiency investments in buildings. An important objective of this initiative is to “de-risk” investments. Fundamentals such as the lower probability of default in the case of energy saving loans or an increased value of assets due to higher energy performance need to be progressively recognised by banks and reflected in the pricing of their financing products.
Content
This report supports “de-risking” activities by evaluating existing literature about the impact of energy efficiency improvements on the value of buildings by increasing its actual value and through the impact on operational costs. The specific impacts of labels and certificates to create “green premium” and “brown discount” are analysed.
The report also looks at the impact of energy efficiency on the payment default risk. The analysis shows that higher energy efficiency is clearly linked to lower default risk, which should be reflected in financial products.
Main findings
As a rule of thumb an increase of 3-8% in the price of residential assets as a result of energy efficiency improvements, and an increase of around 3-5% in residential rents compared to similar properties can be observed. For commercial buildings, the premium seems to be higher, over 10%, and in some studies even over 20% of sales price increase compared to similar properties has been reported. Rental prices of commercial buildings have also been positively affected by 2-5%. Differences across regions and countries, as well as different property types (e.g. apartments vs. houses) are shown. A change over time is also seen, because the labels and schemes become more well-known and understood. It is shown that higher energy performance is becoming the norm, therefore higher values are associated with better performance in latter times.
Energy efficiency upgrades change the basic characteristics of the buildings affected and thus have an impact on other value drivers: comfort, safety, maintenance, etc. Not only the energy performance, but rather the connotated features can influence the value of a property. Current demand for housing and location are still the main drivers to a building’s appraisal value and for a tenant’s selection of housing, however energy performance is becoming increasingly important across all reviewed countries.
Related and future JRC work
The JRC has been deeply involved in the technical and scientific support of EU energy efficiency policies and in particular policies related to financing energy efficiency investments and creating a market for energy efficiency. Several reports have been published on the
1 European Commission strategy for a resilient energy union. URL: https://ec.europa.eu/jrc/en/news/europe-
2030-energy-saving-become-first-fuel 2 Saheb, Yamina and Ossenbrink, Heinz. 2015. Securing Energy Efficiency to Secure the Energy Union: How
Energy Efficiency meets the EU Climate and Energy Goals. Ispra, Italy: Publications Office of the European Union. URL: https://ec.europa.eu/jrc/en/publication/eur-scientific-and-technical-research-reports/securing-energy-efficiency-secure-energy-union-how-energy-efficiency-meets-eu-climate-and

4
topic by the JRC and are available on the E3P Platform. The JRC will further investigate the One-stop Shop concept, the values of non-energy benefits in valuating energy efficiency projects and the latest development in the energy services markets.
Quick guide
The current report is a stepping stone in the journey towards establishing more information, data and evidence, as well as to identify knowledge gaps in two critical aspects related to energy efficiency investments.
Firstly, it evaluates existing literature that discuss the impact of energy efficiency improvements on the value of buildings, the methodology that can be applied to quantify the increase or decrease of property value linked to the energy performance and sustainability components.
Secondly, it demonstrates the impact of energy efficiency on the payment default risk namely the link between energy efficiency investment and ability of borrowers to repay their loans.

5
1 Introduction
Energy efficiency improvement means using less energy to deliver the same service. Putting energy efficiency first can be an underlying direct or indirect driver of a number of key European targets, when energy efficiency is acknowledged as "an energy source in its own right", or otherwise put, the “first fuel” considering that more energy will be saved by 2030 than the amount of oil-based energy then (Saheb & Ossenbrink, Securing Energy Efficiency to Secure the Energy Union: How Energy Efficiency meets the EU Climate and Energy Goals, 2015).
In particular, the European building sector still offers large savings potentials, which have been only superficially tapped. The sector accounts for 40% of Europe's total final energy consumption and is the main contributor to GHG emissions3. Around 75% of the building stock is energy inefficient, and at the current 1% annual renovation rate it would take around a century to decarbonise the building stock to modern, low-carbon levels.
Accordingly, investing in an increased renovation rate of the European buildings and homes offers various benefits for citizens, for the society, as well as for different segments of the economy. To realise the sustainable energy potential in buildings, a number of social, financial, technical barriers or administrative challenges need to be overcome. Even more financing energy demand side projects is seen more challenging compared to financing energy supply projects, according to EEFIG (2017), for reasons including:
a. benefits are in the form of savings rather than revenues
b. savings can be hard to measure, and Measurement and Verification protocols are complicated and expensive
c. projects are generally small and fragmented when compared to supply side projects
d. projects can be embedded into wider projects with other purposes e.g. building modernization, which may jeopardize the economic benefits
e. the split incentive in commercial or residential property whereby the tenant benefits from energy savings whereas the landlord makes the investment.
Therefore; the EU has increased efforts on several fronts to contribute to a more sustainable building stock. Notably, a package of various legislative pieces has been under review with direct benefit for the building sector (including the Energy Performance of Buildings Directive (2010/31/EU) and the Energy Efficiency Directive (2012/27/EU)), the amount of public funds has been increased and tailored for direct investments4, for research and market preparation, etc.
Specifically, for energy efficiency financing for buildings, the European Commission launched the “Smart Finance for Smart Buildings” initiative in November 2016 to unlock private financing for energy efficiency investments in buildings.
An important objective of this initiative is to “de-risk” investments. This means that investors and financiers need to better understand the real risks and benefits of sustainable energy building investments based on market evidence and performance track record. Fundamentals such as the lower probability of default in the case of energy saving loans or an increased value of assets due to higher energy performance need to be progressively recognised by banks and reflected in the pricing of their financing products.
3 Data from Eurostat: http://ec.europa.eu/eurostat/web/environmental-data-centre-on-natural-
resources/resource-efficiency-indicators/resource-efficiency-scoreboard/thematic-indicators/key-areas/improving-buildings
4 The European Structural and Investment Funds (ESIF) of EUR 18 billion between 2014-2020 is considered to be the most important financing stream in Europe for energy efficiency, indicating a tripling compared to the previous period. However, there are other European sources, such as the European Energy Efficiency Fund, the Private Finance for Energy Efficiency, EIB funds, etc. See more in the Impact Assessment SWD (2016) 414 final, Accompanying the Proposal for a Directive of the European Parliament and of the Council amending Directive 2010/31/EU on the energy performance of buildings.

6
2 The impact of energy efficiency improvements on the value of buildings
Properties and buildings are sold, marketed, rented, and renovated. Along these processes, their values are estimated. How much a property is worth depends on a large number of factors, some of them are intrinsic and others are external or even incidental.
The value of the property will essentially depend on both these characteristics and on the type of valuation that is being carried out. Out of these one characteristic to be taken into account can be the property’s energy efficiency level or energy performance per se, but more importantly several other characteristics that are directly related to energy performance. For example, renovating the lighting system usually also contributes to higher fire security, and when using CFLs or LED lighting the lower lighting temperature reduces both the risk of fire and the need for excessive cooling.
2.1 Valuation methods for buildings and properties
Hartenberger et al. (2017) provide an excellent overview of valuation definitions and practices that have to be considered when understanding the link between energy efficiency characteristics and the value of buildings in theory. Building on their assessment, the following context should be considered.
Valuation of a building or property occurs at many stages and for many purposes, and can actually take an official, or more “home-made techniques”. Even properties in the same neighbourhood and with similar characteristics are different enough and the market varies from day to day, making it impossible to come up with a hard and fast formula for determining a price for a property. Residential property owners typically look at property values in two ways. Either compare their home to similar ones on offer, - or if data allows – those sold recently, or they will calculate the invested costs (the land and the construction costs) to try to estimate the current value of their properties.
Official valuation techniques are based on data and evidence-based methods, are replicable and are officially validated. Since valuation is widely used by banks for lending, by financial markets for inclusion in financial statements, for regulatory compliance, for taxing purposes, for individual transactions, for hereditary decisions, etc., the reliability and replicability of the methods is of outmost importance. The following regulations and guidance books are most widely accepted:
— The International Valuation Standards (IVS) are standards for undertaking valuation assignments using generally recognised concepts and principles that promote transparency and consistency in valuation practice.
— The RICS5 publishes the “Red Book” (latest in 2017: Global Red Book) to provide the mandatory requirements and advisory Valuation Practice Guidance Applications (VGPAs) that should be followed by valuers to remain consistent with IVSC international standards.
— TEGoVA6 publishes the European Valuation Standards (focused on 5 topics) since the early 1980s as part of the European Valuation Standards (EVS), i.e. the “Blue Book”.
Overall, three key definitions of “value” should be differentiated:
— Transaction value (TV): is the amount for which the property actually exchanges owner or that is rented, which is based on both personal and non-personal factors. Such a value is influenced not only by the persons involved, but also by the status of the market, by other markets (especially relevant here is the energy market), and by the moment of the transaction.
5 Royal Institution of Chartered Surveyors (RICS) is a professional body that accredits professionals within the
land, property, construction, and infrastructure sectors worldwide 6 The European Group of Valuers' Associations is a European non profit association composed of 71 valuers'
associations from 37 countries representing more than 70.000 valuers in Europe (as of 2018).

7
— Market Value (MV): “the estimated amount for which an asset or liability should exchange on the valuation date between a willing buyer and a willing seller in an arm’s length transaction, after proper marketing and where the parties had each acted knowledgeably, prudently and without compulsion.”7
The MV is not the actual transaction price, which may be highly influenced by a number of personal factors (e.g. emotional bond both from the buyer and the seller’s point of view, the need for a quicker transaction or conversely the time that the seller can wait until a “better offer” arrives, etc.)
The MV assumes that each participant is knowledgeable, has all important information, and they are not under other pressures.
As Hartenberger et al. (2017) have put it, the MV is a “moment in time” value, as it can change through time.
— Mortgage Lending Value (MLV) is defined as “the value of immovable property as determined by a prudent assessment of the future marketability of the property taking into account long-term sustainable aspects of the property, the normal and local market conditions, the current use and alternative appropriate uses of the property.”8
As opposed to MV, the MLV involves the analysis of risks or future perspective from the lender (bank) perspective.
The methodologies for valuation can be categorized into “market approach”, “income approach”, and “cost approach”. They are all based on the economic principles of price equilibrium, anticipation of benefits or substitution. The choice of approach for any given asset depends on the particular circumstances, and none of them is applicable in every possible situation. The choice should be influenced by (a) the appropriate bases of value, determined by the terms and purpose of the valuation assignment, (b) the respective strengths and weaknesses of the possible valuation approaches and methods, (c) the reliable information needed to apply the method(s) (IVSC, 2016). The following categories are defined in (IVSC, 2016):
1. The market approach provides an indication of value by comparing the asset with identical or comparable (that is similar) assets for which price information is available. When reliable, verifiable and relevant market information is available, the market approach is the preferred valuation approach.
(a) The comparable transactions method, also known as the guideline transactions method, utilises information on transactions involving assets that are the same or similar to the subject asset to arrive at an indication of value.
(b) The guideline publicly-traded method utilises information on publicly-traded comparables that are the same or similar to the subject asset to arrive at an indication of value.
(c) Other market approaches, such as Anecdotal or “rule-of-thumb” valuation benchmarks are sometimes used as a short-cut market approach, however should be avoided as much as possible.
2. The income approach provides an indication of value by converting future cash flow to a single current value. Under the income approach, the value of an asset is determined by reference to the value of income, cash flow or cost savings generated by the asset. There are many ways to implement the income approach, all methods under the income approach are effectively based on discounting future amounts of cash flow to present value.
3. The cost approach provides an indication of value using the economic principle that a buyer will pay no more for an asset than the cost to obtain an asset of equal utility, whether by purchase or by construction, unless undue time, inconvenience, risk or other
7 International Valuation Standards 104 paragraph 30.1, published by the International Valuation Standards
Committee (IVSC) 8 defined in article 4 (74) of EU regulation 575/2013

8
factors are involved. The approach provides an indication of value by calculating the current replacement or reproduction cost of an asset and making deductions for physical deterioration and all other relevant forms of obsolescence.
(a) replacement cost method: a method that indicates value by calculating the cost of a similar asset offering equivalent utility,
(b) reproduction cost method: a method under the cost that indicates value by calculating the cost to recreating a replica of an asset, and
(c) summation method: a method that calculates the value of an asset by the addition of the separate values of its component parts.
Adjustments can be made “manually” to adjust for differences between the subject asset and the guideline transactions or publicly traded securities. These can be different premiums, such as the topic of the current report: “green premium”.
The Revalue project has summarized the Key Performance Indicators that are relevant in the above three valuation approaches (Reuter & Spaeh, 2017):
Figure 1. The three key valuation approaches and the valuation parameters.
Source: Reuter & Spaeh (2017)
2.2 “Green value” and “brown discount”
Appraisers will be able to produce better results, and a more realistic valuation, if they consider green features of the property, such as energy efficiency, or the indoor air quality, existing, conventional buildings will become obsolete, and experience the so-called “brown discount”. Due to increasing stringency of regulatory requirements and standards, these latter buildings and properties fall below standards and become less attractive due to increasing level of necessary economic input for upgrading. On the other hand, properties

9
that achieve or rather overpass the sustainability requirements or other green features (such as solar panels, low-flow water faucets, energy-efficient lighting, automation) can experience a “green premium”, which is a higher value assigned by potential buyers or renters related to their lower operational costs or the better living conditions they offer. An example of market development in the US was reported by Green Energy Money blog (2016) (see Figure 2).
Figure 2. The future trend of green buildings taking over the market because of non-sustainable buildings going obsolete (US market situation)
Source: Green Energy Money (2016)
The concept of “green value” or “green premium” was introduced in 2005 by RICS and was used more widely in the real estate business from 2010 (Hartenberger, Lorenz, Sayce, & Toth, 2017). While in the US, “Green Value” is used to refer to a variety of sustainability and environmental properties (including water and waste efficiency and resilience to flooding, even for social aspects), in Europe the term refers mostly only to energy efficiency and low carbon features. It has been long and often discussed whether more sustainable buildings are valued somewhat higher as a direct result of their better performance.
2.3 Calculation options of the “Green value”
According to EPBD 2010/31/EU, the energy efficiency recommendations included in the energy performance certificate can provide an estimate for the range of payback periods or cost-benefits over its economic lifecycle (European Commission, 2010). Article 5 points out that a new comparative methodology framework for calculating cost-optimal levels of minimum energy performance requirements for buildings and building elements is needed (D'Agostino & Parker, 2017). To accomplish the task, experts had to answer several questions such as: "Should a future higher sale or rent value for a more energy efficient building be taken into account already in the global cost calculation and if so, what should that value be?" (European Commission, 2011). Popescu et al. (2012) studied the opportunity of including a future higher sale value due to energy performance into economic calculations. The analysis provides information on how and when it is appropriate to take the added value due to energy performance into consideration in such methodologies focussing on various energy efficiency measures such as: thermal insulation of the walls, floor and attic, the

10
replacement of old windows with energy efficient ones, natural efficient lighting, better HVAC equipment, the integration of renewable energy systems, demand driven control, passive design BEMS9, etc. Classic energy audit methodologies are based on the calculation of the net present value of the costs of energy savings compared to the price of investments for energy efficiency measures.
Nonetheless, the result presented by this study Popescu suggests that energy efficiency measures produce two main financial benefits:
— firstly, they reduce the operation expenses and
— secondly, they increase the value of the building.
In this case, part of the investments in energy efficiency measures pay off immediately, due to the increased value of the property and only the rest has to be recovered by savings on energy expenses. As a result of this, the investments for energy efficiency measures (I) are considered profitable if they are lower than the net present value of the cost of energy savings (NPV) plus the added value of the building due to energy performance (�V),
I < NPV+�V
The added value due to energy performance (�V) represents the net additional value obtainable on the real-estate market after applying energy efficiency measures. �V = P2 - P1
Where P1 represents the transaction price of the property before retrofitting, and P2 is the transaction price after retrofitting. To include this in the energy audit methodology, the quantification of the added value due to energy performance (�V) is needed. So far, few markets have been studied from this point of view and generalizing their results is not possible since real estate markets are different and evaluated in different ways (Popescu, Bienert, Schützenhofer, & Boazu, 2012).
2.3.1 Methods to calculate the added value of energy performance
Three main procedures can be identified for calculating the added value due to energy performance (Popescu, Bienert, Schützenhofer, & Boazu, 2012), (Lorenz, Trück, & Lützkendorf, 2007) (Jim & Chen, 2006): the hedonic pricing model, the method based on the direct comparison between transaction prices and the method based on the willingness to payback investments in energy efficiency measures . In addition to these, a classical method to calculate the net present value of costs of energy savings will be discussed here10. Although it seems logical that consumers should be prepared to pay a higher price for energy efficient buildings compared to less efficient buildings that are below current energy performance standards, in reality this is more complex and evidence is needed in each studied market.
2.3.2 The hedonic pricing method
In the real-estate economic theory, the building is considered a good value for its characteristics. A hedonic price function describes how the quantity and quality of these characteristics determine the building’s price in a particular market. Such method can derive the quantitative impact of the energy performance on the value of the property. Lorentz et al. (2007) used hedonic analysis to explore the relationship between the sustainability features and the market value of residential properties from Stuttgart. The hedonic pricing model was also applied by Jim and Chen (2006) to study the impact of crucial environmental elements on real estate transaction prices. Brounen et al. (2009) investigated the economic
9 Building Energy Management Systems monitor and control services such as heating, ventilation and air-
conditioning, ensuring the building operates at maximum levels of efficiencycy and removing wasted energy usage and associated costs. The optimal level of efficiency is achieved by continuously maintaining the correct balance between operating requirements, external and internal environmental conditions, and energy usage. https://www.trendcontrols.com/en-GB/bmssystem/Pages/default.aspx
10 The Net Present Value is the difference between the present value of cash inflows and the present value of cash outflows. NPV is used in energy efficiency investments to analyse the profitability of a projected investment. The discount rate (DR) is the main financial parameter influencing investors' choices.

11
value of the European energy performance certificates by using the energy labels, as inputs. Other studies (Sayce, Sundberg, & Clements, 2010), (Leopoldberger, Bienert, Brunauer, Bobsin, & Schutzenhofer, 2010) had quantified the added value due to energy performance of a wide range of numerous buildings.
However, according to Popescu (2012), the use of hedonic pricing methods is complex. It requires large databases holding detailed features of buildings and it requires corresponding information on realistic prices, which limits the analysis to develop a completely transparent picture of the property markets. Further issues are that transaction data expires fast due to the volatility of prices and results of the hedonic pricing model applied to data collected from specific real estate markets, cannot be extrapolated for other markets or other periods. Due to the increased interest on ‘‘green value’’, ‘‘sustainability’’ or ‘‘energy efficiency’’, real estate experts and national property valuation bodies are supposed to provide information obtained by the hedonic pricing model in the near future. It can be argued that when such information will be available, based on the known value of the buildings, the added value due to energy performance could be calculated.
2.3.3 The method based on the direct comparison between transaction prices
Following the research by Popescu et al, the method based on the direct comparison between transaction prices needs a link between the energy auditor and an appraiser, because it includes valuation techniques specific to the sales comparison approach (see above in section 2.1.). The sales comparison approach is based on the theory that same properties should have the same prices. It uses transaction prices of highly comparable properties that have been recently sold or currently for sale. The price of a property is affected by various characteristics and the effect of each feature on the value, must be analysed separately. There are national valuation organizations that have potentials on how to take into consideration the main characteristics of the building, for adjusting the value accordingly. Following this methodology (Popescu, Bienert, Schützenhofer, & Boazu, 2012) two databases should be created; one containing information on buildings that had undergone energy efficiency measures and the other one including information on non-retrofitted buildings. The impact of location on transaction prices is significant and therefore data must be grouped by location, in each one. Besides transaction prices, for each building, the databases must contain a description in terms of age, location, size, floor area, neighbourhoods, view, facilities, existence of an elevator, etc. Finally, adjustments of value in accordance with specific differences (age, floor area, etc.), except location, are applied to the sale price of each comparable property. The meaning of the final adjusted value of each property would be the transaction price of the subject property if it was sold in the same district, where the comparable property is built. The added value of a retrofitted property is the difference between its value after retrofitting and the value before retrofitting.
The added value due to energy performance can also be calculated as a percent for each retrofitted property, to extrapolate the results, an average added value for energy performance must be calculated in each location. The result is the average rate for all the retrofitted properties located in the specific location. When the financial analysis of investments in energy efficiency measures has to be done for a property which has to be retrofitted, only the value of the property before retrofitting is known. By applying the transaction coefficient on the value of the property before retrofitting, the added value due to energy performance can be calculated.
2.3.4 Method based on the willingness to payback investments in energy efficiency measures
This procedure uses a scoring model to quantify the willingness to payback investments in energy efficiency measures. It is very simple and once the main criteria of the scoring model are defined, the energy auditor can apply it for different scenarios. A technique that could be considered to be a scoring model based on the sustainable characteristics and their future development, was used in the calculation of the Swiss Economic Sustainability Indicator (ESI) (Meins & Burkhard, 2009) (Meins, Wallbaum, Hardziewski, & Feige, 2010). In this

12
paper a scoring model based on how the energy efficiency affects the buyer’s willingness to pay back investments in energy efficiency measures is presented. In this model, the main political, social and psychological factors that can affect the willingness to pay more for energy efficiency are the following: energy efficiency is promoted by mass media, energy expenses represent an important part of household income; the market reflects higher prices for energy efficient buildings, sellers/buyers/tenants focus on energy efficiency aspects during transactions, operating expenses and energy costs are high compared to the rent/price for the property, energy prices increase fast and significantly, energy efficient buildings are rare and represent unique selling propositions, monetary penalties/restrictions are applied for non-energy-efficient properties, the studied building achieves passive houses standards. It may be noticed that if in the studied country/region such conditions are met and well-known, the market coefficient (�) might be significant, � = [0.75, 1]. If not, the impact of energy efficiency on transaction prices is low �= [0, 0.25]. Whether investments in energy efficiency measures are completely neglected if the property is sold, � = 0. Once the analysis by the scoring method is done, the market coefficient (�) is settled and the added value due to energy performance can be calculated by the equation: ∆�� = � ∗ where I represents the cost of investments in energy efficiency measures. The way the scoring model is established may vary from country to country and from period to period.
2.3.5 Calculation of the net present value of costs of energy savings
The calculation of the potential costs of energy savings is typically the only parameter taken into consideration in the analysis of investments in energy efficiency measures. A high number of energy audit methodologies use a simple formula, like the following:
��� = �(��)� ∗ (��)� ∗�� 11 + �� ������
����
where ES represent the annual energy savings, j represents the type of energy (e.g. j = 1 for gas, j = 2 for electricity, j = 3 for district heating, etc.), CE is the actual cost of energy, i is the discount rate, tR is the lifetime (in years) of the retrofitting. The annual energy savings ES represents the difference between the energy demand of the building before retrofitting ED1 and the energy demand after retrofitting ED2:
ES= ED1- ED2
The calculation of the net present value of costs of energy savings should theoretically include the forecast of energy prices. However, in practice this is difficult to predict since energy prices fluctuate at unexpected rate. According to the Popescu study, the best way to study the impact of the volatility of energy prices is to use the real option approach, based on data from reliable sources, such as well-known energy agencies. For research studies this is the recommended procedure, but energy auditors will not necessarily apply the same (Popescu, Bienert, Schützenhofer, & Boazu, 2012). Methods for calculating the net present value of costs of energy savings (NPV) depend on national energy assessment procedures that might include fluctuations of energy prices.
2.3.6 Calculation of the net present value of investment
The calculation of the NPV of investment is also an important factor taken into account during feasibility studies before investing in energy efficiency measures. This is a very basic, though still relevant, metric that influences the investor's choice to invest in a project. A commonly used methodology to calculate the NPV of investment uses a simple formula similar to the following:
���I = " − I��� …� (1 + �)�

13
Where:
NPV I = net present value of the investment
It = investment at year t
F = financial savings
i = discounted rate
t = years of investment or years of financial saving
n = life expectancy of investment or financial saving
If the Net Present Value (NPV) is greater than 0, then the energy efficiency measure provides a better return than the alternative investment. The NPV is calculated by adding up all the benefits of the efficiency measure over its life and subtracting the costs. Benefits and costs are "discounted" to account for the time-value of money (the ability of money to earn interest).
The Net Present Value is a better measure to use than Internal Rate of Return when comparing a number of possible efficiency measures that are "mutually exclusive", meaning only one can be implemented. For example, NPV is a good measure to use when trying to determine what level of insulation to add to an attic. Only one level of insulation can be chosen, i.e. they are mutually exclusive.
The Net Present Value method requires that you enter a discount rate for your money (%/year.) The higher the risk of your project, the higher the discount rate you should use. Lighting projects for instance usually should not be very risky, so a rate of 7% /year could be applied.
A study conducted by JRC on the renovation of buildings (Saheb et al. (2015)) summarises the main financial and economic parameters influencing the cost-effectiveness of energy efficiency (Box 1 and Box 2).

14
Box 1. Financial and economic parameters of cost-effectiveness of energy efficiency
Financial parameters influencing the cost-effectiveness of EE investment:
The discount rate (DR) is the main financial parameter influencing investors’ choices; it takes two forms the financial discount rate (FDR) and the social discount rate (SDR).
The financial discount rate is the opportunity cost of capital. We decide to use capital for one project and sacrifice another. The loss of income from the sacrificed project has an implicit cost.
There are three main ways of determining the FDR: - estimating the actual weighted average cost of capital; - establishing a maximum limit value for the FDR; and - considering the cut-off as a planning parameter.
The social discount rate (SDR) reflects society’s view as to how future benefits and costs should be evaluated as compared with the present. The SDR takes into account market failures in financial markets.
There are various ways of determining the SDR: - expecting marginal public investment to have the same return as private investment; - using estimates based on the predicted long-term growth of the economy; and - using variable rates over time.
Economic parameters influencing the cost-effectiveness of EE investment:
The performance indicator used to assess the project is the main economic parameter that will influence the decision-maker. For EE investments, one of the following indicators is generally used - internal rate of return (IRR); - pay-back time (PBT); - net present value (NPV); or - benefit/cost ratio (B/C).
Net present value (NPV) is the sum of the discounted net flows of a project; it represents the present net benefits flow generated by the investment. NPV is calculated using the following formula:
��� = %�������
where: St is the balance of cash flow at time t, at is the discount rate chosen for discounting over time t
The choice of discount rate and time horizon are crucial for determining the NPV of a project. A positive NPV means that the project generates a net benefit, which is what investors look for. However, the balance is usually negative in the first few years of the project.
Internal rate of return (IRR) expresses the relative efficiency of an investment. It is the discount rate that zeroes out the NPV value of flows of costs and benefits of an investment, as given by the formula below:
���(�) = ��1 + &&� = 0 IRR is independent of the size of the project, while very sensitive to the economic conditions and the timing of benefits. IRR cannot be applied where time-varying discount rates are used, so the NPV is usually preferred. When details of the investors’ capital costs are not available, IRR can be used as indicative.
Payback time (PBT) is the period required to recover the cost of an investment. It is calculated as a ratio of the cost of the project to annualised cash flows. Typically, longer PBTs are not desirable for investors.
�%()%*+,�-. = �/0,/1,ℎ.34/5.*,6778%9�0.:*%0ℎ19/;0 PBT does not measure profitability, as it ignores the benefits that accrue after the payback period. It also ignores the time value of money.
Benefit/cost ratio (B/C) is the present value of project benefits divided by the present value of project costs or investments. <� =��() ��(=)>
where ' I' is the inflows and O the outflows.
If B/C >1, the benefits measured by the present value of the total inflows are greater than the costs, measured by the present value of total outflows. The project is therefore suitable for investors.
Like IRR, B/C is independent of the size of the investment. It rewards low-cost projects and is not appropriate for mutually exclusive projects, as it does not take account of the total amount of net benefits.
Source: Saheb et al. (2015)

15
Box 2. Impact of discount rate choices on the cost-effectiveness of EE investment
To illustrate the impact of the discount rate on the attractiveness of energy renovation, we calculated the NPV for the renovation of 11 buildings using discount rates of 5%, 10%, 15% and 20%.
The attractiveness of the projects for investors is very sensitive to the discount rate chosen (Figure 4.2). With a discount rate of 5%, the 11 projects would have a positive NPV, making them all attractive to investors. However, with a rate of 10%, five of the 11 projects would have a negative NPV and would not be attractive to investors.
Impact of discount rate choices on the cost-effectiveness of energy renovation
Key point: The higher the discount rate, the less attractive energy renovation is to investors.
The higher the discount rate, the less attractive energy renovation would be for investors. When competing with alternative investment opportunities close to 20% (e.g. other energy investments), less than half of the projects would be attractive to investors. To make the 11 projects attractive, the capital cost should be 5%, which is close to the social discount rate.
Source: Saheb et al. (2015)
2.4 Valuing energy efficiency by the market
The value of a property is expected to be affected when improving its energy performance, because it is associated by lower operating costs, and therefore higher cash flow of the owner, as well as because there are numerous co-benefits associated with buildings that are more energy efficient, which are seen to provide a greater level of services (Urge-Vorsatz, Novikova, & Sharmina, 2009). Therefore, actors expect the energy performance of buildings to affect the value of buildings as it saves money and is also in line with changing social norms vis-à-vis the environment.
On the other hand, barriers, such as the split incentive have been shown to undermine the theoretical potential that information provision can be expected to assure. According to Kok and Jennen (2012) part of the return to energy efficiency improvements consists of relatively predictable energy savings, but under lease contracts and in multi-tenant buildings, these savings typically flow to the occupants.11 For investors, the return is thus uncertain, consisting of better marketability of properties (e.g., lower risk of vacancy, higher rents, shorter rent-free periods) and higher valuations (e.g., less depreciation). In this context, the implementation of energy performance certificates can improve the transparency of energy consumption in buildings, enabling private and corporate occupiers to take energy efficiency into account when making housing decisions. Recent evidence shows that the EU energy label is effective as a signalling device in the residential housing market (Brounen & Kok, 2011). Information provision through certificates or energy performance labelling can help render the differences between otherwise comparable
11 For details on split incentive please see "Overcoming the split incentive barrier in the building sector"
http://publications.jrc.ec.europa.eu/repository/bitstream/JRC90407/2014_jrc_sci_pol_rep_cov_template_online_final.pdf
16
properties more readable, enabling market actors to act on this information when they perceive it to be salient to them (Mudgal, Lyons, Cohen, Lyons, & Fedrigo-Fazio, 2013).
2.4.1 Claimed value, willingness to pay
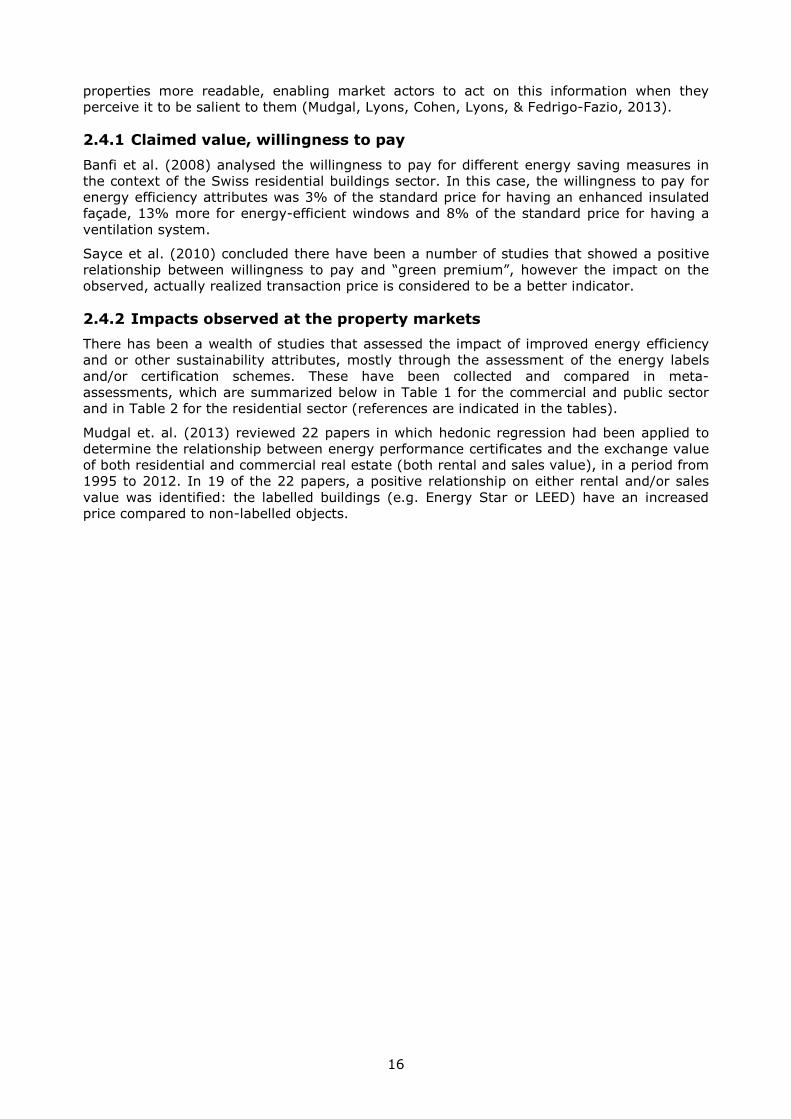
Banfi et al. (2008) analysed the willingness to pay for different energy saving measures in the context of the Swiss residential buildings sector. In this case, the willingness to pay for energy efficiency attributes was 3% of the standard price for having an enhanced insulated façade, 13% more for energy-efficient windows and 8% of the standard price for having a ventilation system.
Sayce et al. (2010) concluded there have been a number of studies that showed a positive relationship between willingness to pay and “green premium”, however the impact on the observed, actually realized transaction price is considered to be a better indicator.
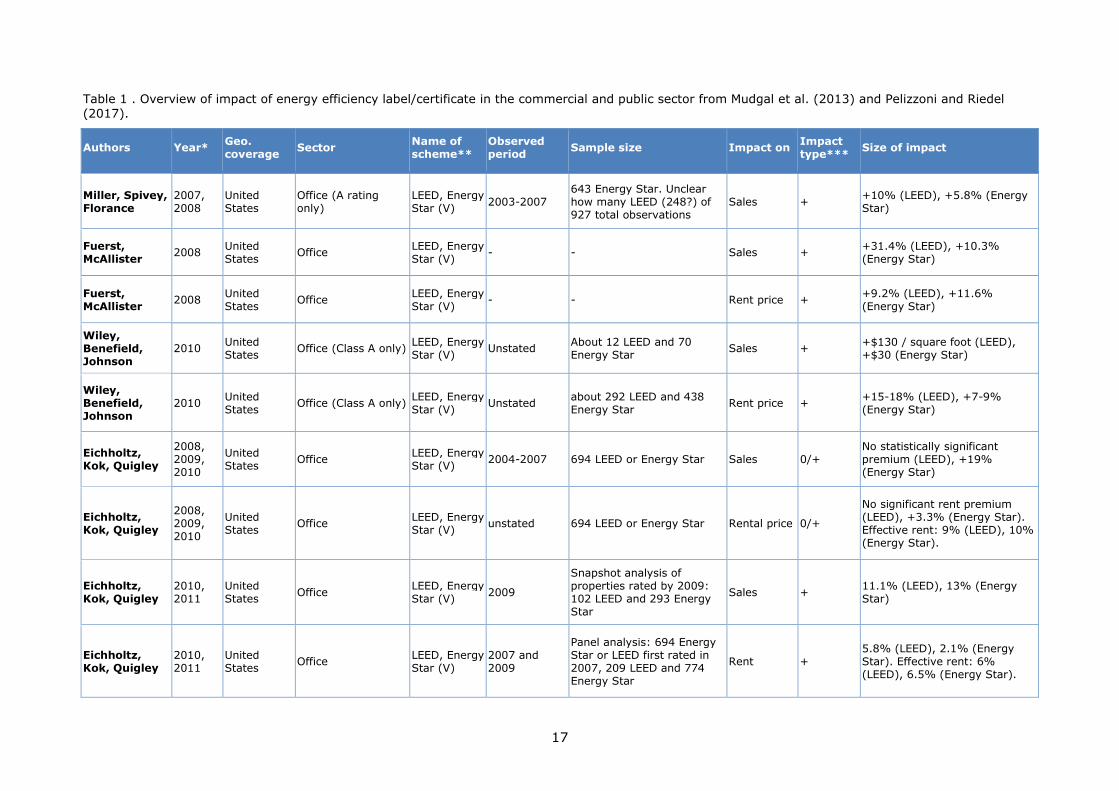
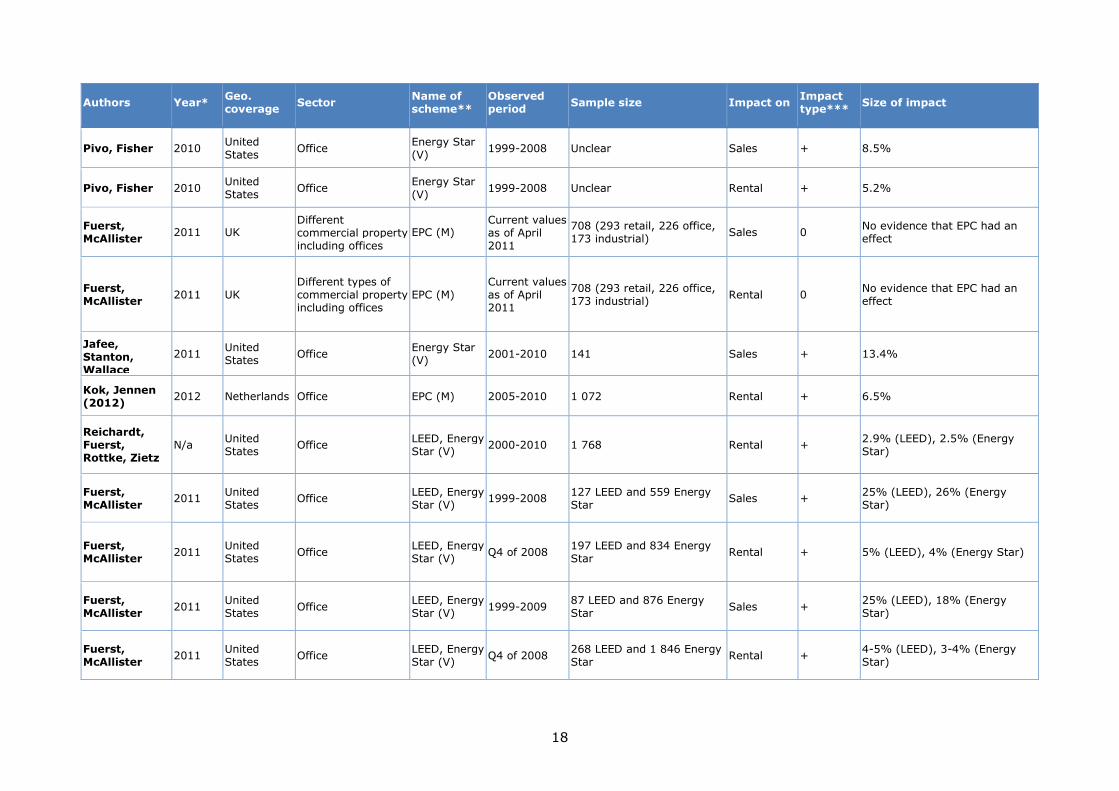
2.4.2 Impacts observed at the property markets
There has been a wealth of studies that assessed the impact of improved energy efficiency and or other sustainability attributes, mostly through the assessment of the energy labels and/or certification schemes. These have been collected and compared in meta-assessments, which are summarized below in Table 1 for the commercial and public sector and in Table 2 for the residential sector (references are indicated in the tables).
Mudgal et. al. (2013) reviewed 22 papers in which hedonic regression had been applied to determine the relationship between energy performance certificates and the exchange value of both residential and commercial real estate (both rental and sales value), in a period from 1995 to 2012. In 19 of the 22 papers, a positive relationship on either rental and/or sales value was identified: the labelled buildings (e.g. Energy Star or LEED) have an increased price compared to non-labelled objects.
17
Table 1 . Overview of impact of energy efficiency label/certificate in the commercial and public sector from Mudgal et al. (2013) and Pelizzoni and Riedel (2017).
Authors Year* Geo. coverage
Sector Name of scheme**
Observed period
Sample size Impact on Impact type***
Size of impact
Miller, Spivey, Florance
2007, 2008
United States
Office (A rating only)
LEED, Energy Star (V)
2003-2007 643 Energy Star. Unclear how many LEED (248?) of 927 total observations
Sales + +10% (LEED), +5.8% (Energy Star)
Fuerst, McAllister
2008 United States
Office LEED, Energy Star (V)
- - Sales + +31.4% (LEED), +10.3% (Energy Star)
Fuerst, McAllister
2008 United States
Office LEED, Energy Star (V)
- - Rent price + +9.2% (LEED), +11.6% (Energy Star)
Wiley, Benefield, Johnson
2010 United States
Office (Class A only) LEED, Energy Star (V)
Unstated About 12 LEED and 70 Energy Star
Sales + +$130 / square foot (LEED), +$30 (Energy Star)
Wiley, Benefield, Johnson
2010 United States
Office (Class A only) LEED, Energy Star (V)
Unstated about 292 LEED and 438 Energy Star
Rent price + +15-18% (LEED), +7-9% (Energy Star)
Eichholtz, Kok, Quigley
2008, 2009, 2010
United States
Office LEED, Energy Star (V)
2004-2007 694 LEED or Energy Star Sales 0/+ No statistically significant premium (LEED), +19% (Energy Star)
Eichholtz, Kok, Quigley
2008, 2009, 2010
United States
Office LEED, Energy Star (V)
unstated 694 LEED or Energy Star Rental price 0/+
No significant rent premium (LEED), +3.3% (Energy Star). Effective rent: 9% (LEED), 10% (Energy Star).
Eichholtz, Kok, Quigley
2010, 2011
United States
Office LEED, Energy Star (V)
2009
Snapshot analysis of properties rated by 2009: 102 LEED and 293 Energy Star
Sales + 11.1% (LEED), 13% (Energy Star)
Eichholtz, Kok, Quigley
2010, 2011
United States
Office LEED, Energy Star (V)
2007 and 2009
Panel analysis: 694 Energy Star or LEED first rated in 2007, 209 LEED and 774 Energy Star
Rent + 5.8% (LEED), 2.1% (Energy Star). Effective rent: 6% (LEED), 6.5% (Energy Star).
18
Authors Year* Geo. coverage
Sector Name of scheme**
Observed period
Sample size Impact on Impact type***
Size of impact
Pivo, Fisher 2010 United States
Office Energy Star (V)
1999-2008 Unclear Sales + 8.5%
Pivo, Fisher 2010 United States
Office Energy Star (V)
1999-2008 Unclear Rental + 5.2%
Fuerst, McAllister
2011 UK Different commercial property including offices
EPC (M) Current values as of April 2011
708 (293 retail, 226 office, 173 industrial)
Sales 0 No evidence that EPC had an effect
Fuerst, McAllister
2011 UK Different types of commercial property including offices
EPC (M) Current values as of April 2011
708 (293 retail, 226 office, 173 industrial)
Rental 0 No evidence that EPC had an effect
Jafee, Stanton, Wallace
2011 United States
Office Energy Star (V)
2001-2010 141 Sales + 13.4%
Kok, Jennen (2012)
2012 Netherlands Office EPC (M) 2005-2010 1 072 Rental + 6.5%
Reichardt, Fuerst, Rottke, Zietz
N/a United States
Office LEED, Energy Star (V)
2000-2010 1 768 Rental + 2.9% (LEED), 2.5% (Energy Star)
Fuerst, McAllister
2011 United States
Office LEED, Energy Star (V)
1999-2008 127 LEED and 559 Energy Star
Sales + 25% (LEED), 26% (Energy Star)
Fuerst, McAllister
2011 United States
Office LEED, Energy Star (V)
Q4 of 2008 197 LEED and 834 Energy Star
Rental + 5% (LEED), 4% (Energy Star)
Fuerst, McAllister
2011 United States
Office LEED, Energy Star (V)
1999-2009 87 LEED and 876 Energy Star
Sales + 25% (LEED), 18% (Energy Star)
Fuerst, McAllister
2011 United States
Office LEED, Energy Star (V)
Q4 of 2008 268 LEED and 1 846 Energy Star
Rental + 4-5% (LEED), 3-4% (Energy Star)

19
Authors Year* Geo. coverage
Sector Name of scheme**
Observed period
Sample size Impact on Impact type***
Size of impact
Newell et al. 2011 Australia Office NABERS n/a n/a Rental +/- Both premium and brown discount shown
Cheghut et al. 2013 UK Commercial BREEAM n/a n/a Rental ? Affects neighborhood rents, however as more houses are certified, less effect
Das and Wiley 2014 USA Office LEED, Energy Star (V)
n/a n/a Sales + LEED: +10.6% (due to marketing), Energy Star + 16.4% but very varied
Newell et al. 2014 Australia Office NABERS n/a n/a Performance ? Very variable
Jasimin et al. 2014 Japan Office GBI-Gold n/a n/a Rents 0 Soft benefits observed only
Fuerst et al. 2015 UK Office BREEAM n/a n/a Rents ? Depends very much on the year of construction
Yoshida et al. 2016 Japan office Various labels
Rents Premium related to cost savings on water and electricity
Fuerst et al. 2017 UK Office BREEAM n/a n/a sales
Price effect mainly on Class A, which may be due to the highest efficiency class being expected as a norm
Notes: * Year of publication; ** V = voluntary, M = mandatory, *** + = positive, - = negative, 0 = no impact, ? = impact could not be clearly identified

20
Table 2. Overview of impact of energy efficiency label/certificate in the residential sector from Mudgal et al. (2013) and Pelizzoni and Riedel (2017).
Authors Year* Geo. coverage Sector Name of scheme** Observed period
Sample size Impact on Impact type***
Size of impact
Soriano 2008 Australia, ACT Residential ACTHER S (1-10) (M) 2005, 2006 2385 (2005), 2719 (2006)
Sales + +3% per star level
Salvi, Horehajova, Müri
2008 Switzerland, Zurich
Residential Minergie (V) 1998-2008 259 Sales + +7% (single- family homes), +3.5% (flats)
Salvi, Horehajova, Neeser
2010 Switzerland Residential Minergie (V) 2002-2009 1173 Rental + 6% net rent (i.e. minus running costs), 4.9% gross rent
Brounen, Kok 2010, 2011
Netherlands Residential EPC (M) January 2008 – Summer 2009
31993 Sales + 3.6%
Bloom, Nobe, Nobe
2011 United States Residential Energy Star (V) 1995-2005 150 Sales + $8.66 per square foot
Addae- Dapaah, Su Jen Chieh
2011 Singapore Residential Green Mark (V) July 2005 - June 2009
34 projects (21 000 dwelling units)
Sales + 9.2-27.8% depending on rating
Yoshida, Sigiura 2011 Japan, Tokyo Residential TGLSC (M, new or renovated)
2002-2009 1 472 Sales - -5.5%
Deng, Li, Quigley 2012 Singapore Residential Green Mark (V) 2000 – June 2010
62 projects (18 296 dwelling unit transactions)
Sales + 4%
Kok, Kahn 2012 United States Residential LEED, Energy, GreenPoint (V)
2007-2012 4 321 (1.6 million control)l
Sales + 9% (+/-4%)
Australian Dept. Environment, Water etc
2008 Australia Residential Energy Efficiency star rating (o.5 increments 1‑10
n/a n/a Sales price + 1.23% to 1.91% per 0.5 star
Salvi et al 2008 Switzerland Residential MINERGIE label n/a n/a Sales price √ 7% houses; 3.5% flats
Griffin et al 2009 USA (Portland/Seattle)
Residential Variety: Built Green; Earth Advantage; Energy Star; LEED
n/a n/a Time to sell √ Reduced by 18 days
Salvi et al 2010 Switzerland Residential MINERGIE label n/a n/a Rental + 6%

21
Authors Year* Geo. coverage Sector Name of scheme** Observed period
Sample size Impact on Impact type***
Size of impact
Wameling 2010 Germany Residential Primary energy demand per m2
n/a n/a Sales price + €1.4 per reduced kWh/m2
Brouen &Kok 2010 Netherlands Residential EPC (grades A, B ,C n/a n/a Sales price + 2.90%
Yoshida and Suigiura
2010 Japan Residential Tokyo Geen Labeling system
n/a n/a Sales price -- minus 6%‑11%
Wuerst und Partner
2011 Switzerland Residential MINERGIE label n/a n/a Sales price + 4.90%
Muri et al 2011 Switzerland Residential Noise Exposure n/a n/a Rental + 0.19% per decibel
Amecke 2012 Germany Residential impact of EPC on purchasing decisions
n/a n/a Consumer preference
0 does not influence decision‑ making
Feige et al. 2012 Switzerland Residential Economic Sustainability Indicator (ESI)
n/a n/a Rental + 15% (resource use); 11% health/comfort; 11% security
Deng and Quigley
2012 Singapore Residential Green Mark n/a n/a Sales price + 4% to 6%
City of Darmstadt 2012 Germany Residential Primary energy value below 250 kWh/m2 or below 175 kWh/m2
n/a n/a Rental + €0.38 to €0.50 per m2
Hyland et al. 2013 Ireland Residential EPC rating n/a n/a Rental/Sales + generally positive but more likely to matter when economy poor
Cajias & Piazolo 2013 Germany Residential Energy consumption/EPC category (M)
n/a n/a Rental/Sales/ Return
+
1% decline in energy use leads to ).15% increase in return; 0.08% increase in rents and 0.45% increase in CV
Stanley et al. 2015 Ireland Residential Energy Performance Indicators
n/a n/a Sales price +
increase of 1% per grade – but need to be careful on interpretation re age of building
Yang et al. 2015 Denmark Residential Energy source and products
n/a n/a N/A 0
Different types of consumers adopt differing approaches – depending on their priorities (VFM; green etc.)

22
Authors Year* Geo. coverage Sector Name of scheme** Observed period
Sample size Impact on Impact type***
Size of impact
Fuerst et al. 2015 UK (England) Residential Energy efficiency n/a n/a Sales price + positive influence‑but more for flats/ terraced than detached
de Ayala et al. 2016 Spain Residential Energy efficiency judged through household surveys
n/a n/a Sales price + 5.4% and 9.8%
Notaries of France
2017 France Houses and apartments
EPC (energy and climate indicators)
2016 notarial building bases of 2014
Sale price +
For houses: -6% to -17% brown discount and + 6% to + 13% premium (depending on the region)
For apartments: -6% to -10% brown discount and + 3% to + 19% premium
Bond and Devine 2016 USA Residential LEED (V) n/a n/a Rental + 8.90%
Brouen and Aydin
2016 Netherlands Residential transparent EPC on sales (M)
n/a n/a Sales price +
A label quicker to sell and 2% premium against a D; G rated slower and 13% brown discount
Fuerst et al 2016 UK (Wales) Residential EPC grade (M) n/a n/a Sales price -- higher grade sell for more – but not necessarily due to EPC label
Wahlström 2016 Sweden Residential Energy efficiency feature /energy consumption
n/a n/a Sales price mixed
Consumption has no impact; presence of construction features that lead to efficiency are desired
Notes: * Year of publication; ** V = voluntary, M = mandatory, *** + = positive, - = negative, 0 = no impact, ? = impact could not be clearly identified

23
In the residential market they found that transaction prices are central, but findings are overall conflicting. Some studies showed evidence that a positive relationship exists between energy efficiency labels and transaction prices. However, these studies did not investigate occupancy premiums and only three studies investigated rental premiums. Regarding these factors and the effect on time to sale the existing literature is thin. All studies in Europe show price premiums for energy efficient buildings, though some are unquantified.
There seem to be more studies available for the commercial and service segment than for the residential sector. Of the studies examining the impact on sales value, 90% found that the presence of energy/environmental labelling had a positive impact on the sales value (European Commission, 2016).
The REVALUE project (Pelizzon & Riedel, 2017) also provided an overview of past literature and the impacts found that green value had a positive impact on either the prices or other selling/renting attributes, such as transaction time. The commercial sector was found to see a lot of benefits, although not always quantifiable (e.g. through soft impacts). As seen from Table 1 and Table 2 above, the increase of both the sale price and of the renting rate and both for non-residential and residential (respectively) buildings has been observed in the large majority of the reviewed studies. Only rarely a negative impact has been seen, or some cases could not indicate an impact. In more recent studies (probably due to more detailed assessments) varied types of impacts were found, e.g. impact depended on the location or on the availability of properties in the neighbourhood.
The ranges across countries are difficult to compare, because of the different methodologies and because of the different market structures and label/certification information.
As a rule of thumb from the above meta-studies, an increase of 3-8% in the price of residential assets, and an increase of around 3-5% in residential rents compared to similar properties can be observed. Some studies also proved brown discount, e.g. the French national study based on notaries' database could compare premium and discount both amongst houses and amongst apartments. They found -6% to -17% brown discount and + 6% to + 13% premium for houses (depending on the region), and -6% to -10% brown discount and + 3% to + 19% premium for apartments.
For commercial buildings, the premium seems to be higher, over 10%, and in some studies even over 20% of sales price increase compared to similar properties has been reported. Rental prices have also been positively affected by 2-5%.
2.4.3 Details on selected examples of green premium and brown discount
through certificates and labels
When a building is evaluated through an official certification scheme and labelled, i.e. through a known energy performance scheme, such as LEED, BREEAM or voluntary labels, and or through the EPBD energy performance certificates (EPC), the impact can be measured. These schemes provide information to the market, allowing the transactions to be based on more precise data and evidence. More and more studies find that such labels directly influence the value of the buildings and properties (see examples above).
For instance, a US study from ASHRAE12 describes the high performance of green building as a building designed, constructed and capable of being operated in a manner that increases environmental performance and economic value over time (Kok & Jennen, 2012). According to the authors of this study, the statement that such buildings have increased economic value is clearly logical, however it can only be considered as an assumption, until more evidence is available.
Pivo and Fisher (2009) conducted a study on 336 green and 1114 non green buildings and found that the former have 5.9% higher net income, 9.8% fewer utility expenses, 4.8% higher rents and 13.5% higher market values. McGraw-Hill Construction’s report for 2008 concludes that during 2007, commercial Energy Star rated buildings were sold for approximately 15% higher prices, had 8% more in rental income, and saved 10–20% in operating expenses. Miller et al. (2006) compared data on Energy Star and LEED-certified 12 The ASHRAE Standard 189.1

24
buildings versus non-Energy Star or non-LEED-certified office property. Their study reveals that Energy Star certification produced an increase of 5.76% on selling prices, while LEED certification produced an increase of 9.94%. Fuerst and McAllister (2008) analysed 3600 commercial buildings by using a hedonic price model controlled by location and found out that there was a rental premium for green buildings and an 11.8% selling premium for Energy Star certified properties. A study conducted on 10,000 properties by Eichholtz et al. (2009) emphasizes that there was an effective rental premium of 6% and a selling premium of 16% for green office buildings, during 2008. All the outcomes and the diversity of results can be explained by the use of different databases from various real estate markets and different methods of analysis.
Further US literature (Marks, 2014) focuses on how to integrate energy efficiency into mortgage financing in the residential, commercial and public building sector. The study argues that aligning energy efficiency with the mortgage refinancing process can be an option to make energy efficiency a more mainstream practice, though each submarket is characterised by the different use of energy, different ownership and leasing structure that drive the decision-making process and. The same study shows that by expanding its energy efficiency offerings, in 2008 the Community Preservation Corporation (CPC)13 has deployed more than $8 billion in the New York area and financed the construction or restoration of more than 93,000 units of housing in 2008. According to the study, another good example of how to fully benefit from energy efficiency mortgage was the launch of the Neighbourhood Energy Loan Program. A $50 million loan financed by HSBC, Deutsche Bank, Morgan Stainley and Goldman Sachs to make energy efficiency construction loans addressing rehabs centres that were undergoing refinancing. With CPC's Green Initiative, 44 buildings containing 3126 units of affordable multifamily apartments have been retrofitted. Though at the beginning of the refinancing programme, the loan officers were reluctant to take into account in their assumptions the reduction of cost due to energy efficiency improvements in the buildings to be financed, lately they were involved in a case studying particular type of buildings so that lenders could have a clear idea and a better understanding of the technical aspects of how these buildings operate which resulted in more comfortable downward adjustments to utility costs to reflect anticipated savings especially for renovation of non-efficient buildings.
US literature on residential energy efficiency focus more on how to overcome the financing obstacles that prevent moderate and middle-income homebuyers and owners from enjoying the benefits of energy efficiency. Though in the US a range of energy efficiency funding mechanisms exist today, i.e.: state and local energy efficiency loan funds, on-bill repayment and PACE bonds,14 their scale is still vastly lower than what is required. Some may argue that an important way to encourage greater adoption of residential energy efficiency measures is for mortgage pricing or underwriting flexibility to reflect the savings that come as a result of energy efficiency. However, lenders and investors have been reluctant to do so, due to the lack of reliable loan performance data on which to base underwriting decisions (Quercia, Sahadi, Stellberg, Kaza, & Tian, 2013). Given that in financing energy efficiency the most frequently used mechanism is direct borrowing, and that most energy improvements for existing buildings can be financed through: consumers loans, equity loan secured by property or a traditional or specialized mortgage, such type of financing typically require that consumers have substantial equity in their existing homes or a considerable deposit for purchasing a home. In this context energy efficiency mortgages (EEM), can offer a solution for many first-time buyers and moderate-income owners who do not have substantial financial resources. According to Quercia, Sahadi and Stellberg, the advantages of EEMs are plentiful. 1) They allow consumers to finance efficiency improvements at mortgage rates, as opposed to high commercial credit rates. 2) They have a lower risk than those on less efficient homes therefore reducing the default risk. 3) With more detailed information on risks, lenders may be able to develop tailor-made mortgage products to suit the needs of both the consumers and the investors.
13 Community Preservation Corporation (CPC) is a 43-year old non-profit specialized in mortgage lending that
provided technical assistance to affordable and rent-stabilized buildings 14 Property Assessed Clean Energy is an instrument to finance energy renovations through the use of specific
bonds offered by municipal government to the investors.

25
Brounen et al. analysed more than 100,000 transactions from the Netherlands and reveal that the transaction price of a dwelling with an A, B or C label in the energy performance certificate is higher by 3.4–6.6% than of a dwelling with a D label or less (Brounen, Kok, & Menne, 2009).
Recently, a wide-scale French study has been conducted to compare the impact of EPC labels across different regions and types of residential properties (see figure 3). The study was based on data from Notaries in 2016 repeating a research in 2014. They not only showed the different impact levels across regions and types of houses but have also found that the impact has changed over time. The effect of labels C and E, expressed as a proportion of the price of the good, is still almost symmetrical.
The effect linked to low performance (FG) was always greater than the positive impact of AB labels, but the discount slightly decreased between 2014 and 2016 on houses, while the premium has increased. For apartments, such a change in time was not observed.
Figure 3. The impact of EPC categories on sale price of houses in French regions in 2016
Source: Notaires de France, 2017
2.5 Rental vs. sale prices
Mudgal et al. (2013) conducted a detailed and quantitative analysis to show the impact of the European Energy Performance Certificates (EPC) (see figure 4). These observations were conducted in selected European countries (NL, UK and Ireland) and show the increase of the sale prices relative to a EPC D-label. Noted must be that, by far, not all European countries are represented in the existing literature. In all four countries for which information on both sales and rental markets was available – Austria, Belgium, The Netherlands and Ireland – there is a positive significant effect on rental prices. However, according to three of these studies the estimated rental premium for energy efficiency was smaller than the estimated sales price premium. This attenuated rental effect suggests that owners reap a benefit that is additional to the ongoing monthly benefits, i.e. reduced energy bills, which accrue to all occupiers including tenants. In addition, there is contrasting evidence about how the energy efficiency premium varies by location (cities or non-city areas). In Ireland and in Belgium, the effect is smaller – in percentage terms – in cities than in non-city areas. This seems

26
plausible, as potential savings (in €/m²terms) would not vary much by location, while the €/m²cost of a dwelling will be significantly greater in central urban areas. Nonetheless, in Austria, the evidence is to the contrary: the percentage effect is larger in Vienna than in the surrounding area. An explanation may lie in market conditions as Vienna has a relatively high share of social housing. Further research on whether market conditions matter to the value market agents place on energy efficiency ratings would be necessary, but comparing across countries, the percentage effect of the EPC appears stronger where selling conditions are easier.
According to the existing scientific literature, there are more studies available for the commercial and service segment than for residential buildings. The studies within this research that were concerned with the non-residential (office/commercial) sector were geographically a lot more homogeneous, with the majority focusing on the United States, one study on the Netherlands and two studies on the UK. Of the studies examining the impact on sales value, 90% found that the presence of energy/environmental labelling had a positive impact on the sales value (Mudgal, et. al., 2013). The results on the impact of energy performance on the value of buildings presented in this impact assessment are therefore based on the finding of empirical research.
Figure 4. Impact of one-letter improvement in the EPC label category on the transaction price and rental prices in selected regions of the EU
Source: Mudgal, Lyons, Cohen, Lyons, & Fedrigo-Fazio (2013) in Brocklehurst (2017). Note: “Oxford potential” is a category created by the authors based on (Killip, 2011) meaning the EPC category the building could receive were it renovated, as opposed to the EPC label it fits into in the current state. Ex-cities in Ireland means non-urban areas.
27
A UK study conducted by UK Green Building Council and UCL (Griffiths, Hamilton, & Huebner, 2015) analyses the impact of energy performance ratings on the mortgage lender when providing a loan to a customer and whether lenders should take into consideration relevant building energy performance information which can have a positive impact on the customers' capability to make monthly repayments considering their income and other expenses. Nowadays, mortgage lenders could estimate the energy costs of certain buildings using available information such as EPC rating which in turn could help banks to better manage the risk associated with their lending. The findings of this research show that mortgage lenders could include more accurate estimates of energy costs in their lending assessment which could reduce the risk of over or under lending capital to a customer over the life of a mortgage. Responsible lenders should be pursuing to take energy costs into account when deciding how much to lend and as a result, buying an efficient home could be offered a larger or cheaper loan than those purchasing homes that are badly insulated. In this context, by including such information in the mortgage affordability calculations, EPC have a significant role to play in order to take the final decision when assessing the borrowers’ affordability to repay the loan and as a result, to offer them a fair interest rate on their mortgage.
2.6 Summary and conclusion: the impact of EE on the building value
Implementing energy efficiency measures in buildings have important benefits for the developer/owner, the tenants, the society and the environment. They can reduce operation costs, improve the image and reputation; they have low impact on the environment and most importantly, they cut the use of primary resources. All these qualities have a theoretical basis for increasing building value and worth, advantages in tendering processes and increased marketability.
According to the literature reviewed energy efficiency and energy certification produce tangible benefits. They have been expressed in a number of studies through willingness of pay. Since reliable proof exist, market driven reasons such as higher prices for energy performance buildings can be included in the impact assessment of energy policies (Popescu, Bienert, Schützenhofer, & Boazu, 2012). Recommendation to incorporate the sale value information in the financial analysis of investments in energy efficiency measures should be done, with caution, only when and where there are reliable proofs that the studied real-estate market reacts to energy performance.
As a rule of thumb an increase of 3-8% in the price of residential assets as a result of energy efficiency improvements, and an increase of around 3-5% in residential rents compared to similar properties can be observed. For commercial buildings, the premium seems to be higher, over 10%, and in some studies even over 20% of sales price increase compared to similar properties has been reported. Rental prices have also been positively affected by 2-5%. Differences across regions and countries, as well as different property types (e.g. apartments vs. houses) are shown. The change over time is also seen, because the labels and schemes become more well-known and understood. It is shown that higher energy performance is becoming the norm; therefore higher values are associated with better performance recently.

28
3 The role of energy efficiency in payment default risk
Credit risk or payment default risk15 is the probability of loss of the lender due to late or non-payment. From the other perspective, at the individual level, the payment default risk is the potential of a borrower or another counterparty to fail to meet its payment obligations in time, i.e. in accordance with contractually agreed terms (Basel Committee, 2000).
A theoretical argument why owners and tenants of more sustainable (more energy efficient/green/better performing) buildings are less prone to default in their payments has been established by Pelizzon and Riedel (2017) within the EeMAP project16 building on recent literature. Hereby, a summary and extension of their argumentation is given.
On one hand, the financial status of the borrower will be affected:
1.1. As has been shown in this report, the operational costs (energy bill) of an energy efficient building are lower, therefore the cashflow and the disposable income of the borrower are higher (EEFIG, 2017), which remains available for errands and unexpected events, etc.
1.2. The financial stability is also underpinned by the fact that the costs are more predictable according to Burt et al. (2010).
1.3. Furthermore, energy price fluctuations do not affect the operational costs of the building as much as those of the standard buildings.
1.4. The Green Mortgages project17 in Romania further established an indirect link between the financial stability of the borrower and his/her reduced health related costs due to healthier homes.
On the other hand, energy efficiency improvement investments have a positive impact on the value of the property (see Section 2 of this report), which is used as an equity.
2.1. The attractiveness of the building is increased or even ensured as opposed to standard buildings. First, more sustainable buildings may be valued higher by potential buyers/renters.
2.2. Second, following current regulatory trends, low energy performing buildings may fall below standards for a next transaction.
However, only very little evidence is available to prove especially the first point above in practice (Pelizzon & Riedel, 2017). According to Pelizzon and Riedel (2017), only three studies have tried to measure the direct impact of energy efficiency on mortgage default risk, and only one of them was targeted at the residential sector, while all studies originate from the USA. Nevertheless, these studies did find evidence.
Data of a national sample of 71,000 ENERGY STAR rated and non-ENERGY STAR homes in the USA were analysed by Quercia and colleagues (Quercia, Sahadi, Stellberg, Kaza, & Tian, 2013) to determine whether residential energy efficiency was associated with lower default and prepayment risks. Two key messages are drawn:
1) “The study finds that default risks are on average 32 percent lower in energy-efficient homes, controlling for other loan determinants. This finding is robust, significant, and consistent across several model specifications.”
2) “Within ENERGY STAR-rated homes, default risk is lower for more energy-efficient homes.”
The impact of energy efficiency and environmental performance at the corporate building level has been shown, for instance, by Iichholtz et al. (2012), who documented that Real Estate Investment Trust (REITs) owning a larger fraction of energy performance and environmentally certified buildings demonstrate enhanced operating performance measured by return on assets (ROA), return on equity (ROE). In addition to these, certified buildings
15 And many other denotations, such as non-payment risk, credit payment risk, etc. 16 http://energyefficientmortgages.eu/ 17 rogbc.org/en/projects/green-homes

29
are associated with a significantly lower systematic risk. The analysis (Iichholtz, Holtermans, Kok, & Yonder, 2012) demonstrated the existence of a negative relationship between environmental performance and risk, i.e. environmentally certified real estate assets tended to have higher and more stable occupancy rates that are easier to sell and have lower systematic risk.
The impact of the existence of a certification/label as opposed to a building with the same characteristics, including energy performance but without a certificate has not been studied to the knowledge of the authors of this report. This could also be an interesting research question, in order to determine whether the main causal relationship between avoiding payment default is with the higher financial stability (lower actual operational costs), or it is also with the information (and thus probably higher market value).
It is evident that much more research and data collection are needed in this field, and especially studies focused on the European Member States would be critical, because payment default functions can vary widely between localities due to cultural, behavioural, and economic aspects. We need to understand three critical issues:
- What is the function between the borrower’s default risk and energy efficiency investments, and/or the value of the equity as compensation and energy efficiency investment?
- Are there (or is there any interest from) banks or financial institutions that value a higher rating in energy efficiency performance, and is this linked to the fact of being more energy efficient or to the existence of a certification about it?
- What additional mechanisms exist to decrease the default risk in relation to energy efficiency investments?
The second and third points are discussed in the next two sections below.
In recent years more and more open source databases and platforms appear that are able to substantiate financial decisions, or economic valuations of building projects. None has been found to deal with the payment default per se, but they can be used as examples for the establishment for one. The DEEP (DE-RISKING Energy Efficiency Platform),18 monitors and benchmarks energy efficiency performance in the building and industry sector to evidence the actual performance and payback-time of energy efficiency investments and financial risks.
Figure 5. Double impact of energy efficiency on the value of the building.
Source: EEFIG report
While research is very scarce on the topic so far, a promising European project has been identified (and quoted above). The EeMAP (Energy Efficient Mortgages Action Plan) is a market-led initiative focused on the design and delivery of an “energy efficient mortgage”, which is intended to incentivise and channel private capital into energy efficiency investments. The initiative is based on the assumption that energy efficiency has a risk
18 Further information can be viewed here: https://deep.eefig.eu/factsheet/quick/

30
mitigation effect for banks as a result of its impact on a borrower’s ability to service their loan and on the value of the property. The EeMAP project has a strong data and evidence collection phase, whose result shall be soon available. See more at: http://energyefficientmortgages.eu/
More European projects, such as EeMAP and wide-scale studies like the one carried out by Quercia et al. (2013) should be enabled in order to collect European, up-to-date and relevant data, establish evidence and explore the needs and interests of market players.
3.1 Commercial mortgages and environmentally certified buildings
In principle, creditors have two distinct goals, first to get receivables paid faster and second, to reduce the number/value of invoices that are written off as uncollectable (Budde, 2016). The longer an invoice goes unpaid, the greater the chance of it eventually being written off.
For financial institutions, managing payment default risk at the level of individual credits or transactions, as well as at the level of portfolio remains a key for successful lending practices.
As shown above, energy efficiency is seen as a possible way to reduce the risk of payment default of loans and mortgages (Haggett, Sayce, Parnell, & Toth, 2017), and the lower risk is expected to be translated into a lower risk premium required, i.e. lower cost of debt (Pelizzon & Riedel, 2017). In line with the data scarcity described already, information is very rare on whether and how financial organisations can consider energy efficiency in their valuation practices and whether they reduce costs for borrowers on these grounds.
Pelizzon and Riedel show that – based again on US-oriented studies – in some cases, the financing markets do capitalize on information related to energy efficiency or sustainability.
An and Pivo (2015) also confirmed that commercial mortgages collateralized by environmentally certified buildings had a lower default risk, which was realized in lower risk premium and potentially a lower cost of debt. US analyses on the impact of energy efficiency and the environmental performance of the collateral of the mortgage spread show that less risky firms have lower spreads and that riskier firms have higher loan to value levels but most importantly it can be observed that if a mortgage contract is collateralized by an environmentally certified asset, the borrower faces significantly lower spreads (Iichholtz, Holtermans, Kok, & Yonder, 2012).
Further analyses have also evaluated the impact of environmental certification schemes such as LEED and Energy Star on the mortgage spreads.19 The results show that if the building collateralizing the mortgage was LEED certified, borrowers faced 38 to 39 basis points20 lower mortgage spreads. Based on this analysis, LEED certification had a stronger impact than Energy Star certification with a difference in spread equal to 75 to 78 basis points for the most sustainable buildings that are labelled with a LEED Platinum certification. In addition to this, there are also voluntary "green" certification schemes which have developed fast in both the US and the EU market. Voluntary Building Certification Schemes have been around for some years now in Europe, with the British Scheme (BREEAM) taking the lead in terms of pioneering, closely followed by the American one (LEED). After the launch of these two schemes, others followed, mostly dedicated to a national reality, but not exclusively. Haute Qualité Environnementale – (HQE) in France, Passivhaus and DGNB in Germany, Minergie in Switzerland. Note: some of these schemes go beyond energy performance in terms of the overall requirements for a building to be certified and achieve higher grades. While some schemes go for a percentage reduction approach, comparing with a standard building, others take into account other criteria where an Energy Performance Ratio should be calculated. The different requirements are outlined in Table 3.
Other voluntary tools that can be used to assess the energy performance of buildings are Energy Management Systems and more specifically one of its main components, the Energy
19 Mortgage spread is the difference in interest rate between the 10 years UST (US Treasury Government) bond
and the average rate on a 30 years mortgage. 20 A basis point is a mortgage term to describe differences and changes in interest rates. One basis point is one
one-hundredth of a percent, or 0.01 percent. Therefore one hundred basis points is one percent.

31
Audits, which are systematic evaluations of the energy use and energy consumption of an organization, a building or a site. Energy Audits are based on up-to-date energy consumption data, contain a detailed review of the energy consumption profile of the buildings and ideally address life-cycle costs rather than simple payback periods in their evaluation. Energy Audits allow for the individuals or organizations performing the audit in their buildings, to identify the greatest opportunities for energy savings, allowing for reduced energy costs, thus improving profitability and enhancing competitiveness.
Table 3. Comparison of Voluntary labelling and certification schemes
BREEAM LEED HQE Passivhaus Minergie DGNB
Types of buildings
Commercial, Education, Hotels,
Non-standard building (Administration, Hospitals, research…)
New Construction, Core and Shell, Schools, Retail, Healthcare Data Centres, Hospitality, Warehouses and Distribution Centres
New and Renovation non-residential buildings
New and Renovation Offices, Schools, swimming pools, hospital, cafeterias and commercial kitchens, retail.
Administration, Schools, Retail, Restaurants, Meeting Places, Hospitals, Warehouses, Sporting facilities, Swimming Pools
New offices, Existing offices, Healthcare, Education, Hotels, Retail, Assembly buildings, Industrial
Energy assessment method
Energy Performance Ratio (EPR)
Energy performance comparison with similar modelled building
Energy reduction through Dynamic simulation model
Energy performance calculation
Energy performance calculation
Life Cycle Energy Modelling
Maximum level criteria for new buildings
Zero emissions 50% Positive building
No value for Heating and cooling;
Renewable Energy generation > 120kWh/(m²a)
15 kW/m2 for industry, 20 for sporting facilities, 25 for Administration, Schools, meeting places, 40 for Restaurants, 45 for Hospitals
NA
Multi-criteria weighing
Minimum level criteria for new buildings
0.06 EPR 5% 10%
heating demand < 15 kWh/(m2a)or heating load < than 10 W/m² ;
cooling < 15 kWh/(m²a);
Renewable Primary Energy <60 kWh/(m²a)
20 kW/m2 for industry, 25 for sporting facilities, 40 for Administration, Schools, meeting places, 45 for Restaurants, 70 for Hospitals
Multi-criteria weighing
Baseline case
Local Building Regulations
Compliance with ASHRAE/IESNA
90.1-2004
or Dynamic building model
Local Building regulation or Dynamic Building Model
NA NA LCA Reference Building calculation
Certification fee (EUR)
6000-15000 3000-25000 12000-250000
- 1000-10000 5000-15000
3.2 Energy efficiency to hedge against energy price risk
Energy consuming assets represent a "short" position in the energy markets. A "short" position is the risk terminology that implies a relationship between future energy prices and price risks. Modern energy supply markets allow energy producers and end users to protect against volatility by using financial instruments known as hedges. Hedges are effectively

32
insurance instruments where a market participant can pay a relatively small amount to reduce the uncertainty in future prices (Bertoldi & Kromer, 2006). In this context, energy efficiency has significant well-documented economic environmental benefits, especially in regions with a history of high energy prices and high energy intensity. Companies' energy costs are often as large as or even higher than profits. This indicates the significant financial benefits that can result from reducing energy costs by improving efficiency. Up to now less attention has been paid to how these benefits can flow through to financial institutions as a result of reducing the default risk of borrowers. Reducing energy consumption lowers the exposure of companies to volatile energy prices, making their profits more secure and lowering the risk of their defaulting on loans (Blyth & Savage, 2011), see also Figure 6.
Figure 6. Multifaceted benefits of improved energy performance
Source: Based on Blyth & Savage (2011)
The attractiveness of energy efficiency as an investment proposition depends on a variety of factors including the policy environment, the energy market structure and the existence of suitable supply chains for energy efficiency projects.21 According to Blyth and Savage (2011), "Perhaps most fundamentally, the investment case depends on energy prices". As prices rise, the payback on energy efficiency investment becomes more attractive. However, project finances depend not only on the absolute level of energy prices but also on their volatility. Price volatility creates systemic risks to companies and to the wider economy. Energy efficiency can help to offset some of these risks, giving companies that invest in energy efficiency a different risk profile from their competitors.
According to the literature review collected for this analysis (Blyth & Savage, 2011) (Bertoldi & Kromer, 2006) energy efficiency can also be important to hedge against energy price risks. Though separate energy efficiency projects can be financially attractive, banks generally make decisions not on the basis of project cash flow but rather on the strength of the host company's balance sheet because of the need for collateral. Companies with tight margins are exposed to significant financial risk from the increase and volatile energy prices and other commodities. Because energy markets show a high degree of volatility and uncertainty, going forward, companies with significant energy costs will be exposed to significant financial risk and energy efficiency can help reducing this exposure (Blyth & Savage, 2011). For instance, a company that can bring the energy cost down below those of its competitors may find that its returns have a reverse correlation with energy price movements: if the market price of goods rises in response to energy price rises, energy efficient companies stand to gain more than their competitors, and profits may increase in line with energy prices. Reducing volatility in the asset value therefore reduces a company's risk of default and should also reduce the company's cost of capital. Banks and other investors seeking to hedge themselves against energy price risk should therefore see energy efficiency as an attractive investment class.
21 For a review of barriers to energy efficiency, see Mind the Gap, International Energy Agency, 2007

33
3.3 Mechanisms to further decrease payment default risk
As shown above, a higher energy performance of a building is already an indicator for lowered payment default risk. This credit risk can be further decreased by payment policy mechanisms.
On-bill recovery (OBR) (EEFIG, 2017) is used in several states of the USA for residential energy efficiency loans22. The clients repay their loans - taken for energy efficiency investments - directly linked to their electricity bill. This has a number of benefits related to the reliability of repayment. Usually, the OBR component is set in an amount that is less than the cost saving, in order to leave the client with a positive cash flow, and encourage the use. The OBR is billed together with electricity; therefore, it makes the payments easy to handle for both the client and the bank. Billing with the electricity is also informative at the decision phase, as credit risk can be linked to bill default rates. There are additional benefits for the financial institutions, such as reduction of overhead (using an existing billing and marketing route), access to a larger customer base, more reliable repayment, and transferability. Finally, linking the repayment with the electricity bill means also transferability in case of sale or renting. On the other hand, with the liberal market, where customers can choose their electricity suppliers, transferability becomes difficult and clarified regulations would be needed on how these obligations can and have to be handled in case of sale or rent and in case of supplier switch.
The design of the OBR programme is critical (as always). The most well-known example of the UK Green Deal, which was launched in 2013 and ended in 2015, generated a number of important lessons for the European markets. The mechanism should be tested carefully before launch, the list of eligible measures should be representative of the market needs and drives, interest rates should be competitive, the transaction costs/time shall be limited, and the marketing message should be tailored to the stakeholders (for example, the financial benefits were overemphasized for the UK Green Deal, while clients were found later to be more attracted by warmer homes) (EEFIG, 2017).
Another real example of repayment mechanisms is also found in the USA23. Property Assessed Clean Energy (PACE) loans are repaid as an additional payment on a property’s regular local property tax. Naturally, a prerequisite is that there is local property tax, and that linking it with a commercial loan is regulated by the local or municipal legislative level, in order to ensure that the loan repayment can be collected and enforced in the same way as the linked tax (EEFIG, 2017).
22 And in some states also for commercial and industry loans. 23 PACE legislation is active in 33 states plus the District of Columbia (DC) and there are active programmes in 19
states plus DC.

34
4 Conclusions
This overview of literature on the impact of energy efficiency improvements on the value of buildings provides an indication that energy efficiency and sustainability matters in the rental and real estate markets. Rental growth in efficient and less efficient buildings differs noticeably. Sustainability has a direct impact on the evaluation of "non green" and more efficient buildings.
However, a more systematic and comparable evidence is missing on what the exact level of impact is, and how this could be integrated into investment and financing decisions to consider the rental and sale price increase as a co-benefit of energy efficiency improvements. More academic evidence would be helpful to confirm how investments in energy performance really translate into economic value, because investors remain reluctant to invest in energy efficiency measures and retrofitting of existing properties.
Real estate appraisers should integrate the most important elements of sustainability (energy efficiency, carbon emission reduction) in the evaluation of properties, for instance less sustainable implies lower income (and quite possible higher risk). Banks and other real estate financiers can exploit the measurable elements of sustainability in the evaluation of existing and future lending agreements. For less efficient office properties that are not adequately improved, the credit risk faced by banks may be affected through lower cash flows and also maybe by the lower values of the financed properties leading to a higher loan compared to the value of the property.
Notably this overview offers insights into the profit opportunities of building retrofits as well. Sustainability is a key element for real estate investors. Innovative financing mechanisms such as "retrofit funds" "on bill financing through utility companies", "ESCOs" enable large scale inflows of private capital to invest in energy efficiency (Kok & Jennen, 2011). Using Third Party capital, real estate investors can improve the quality of their real estate portfolio, profit from lower operational costs, benefit from an improvement in the marketability of the properties and ultimately they are hedged against the market and macroeconomic trends that will affect the value of their property portfolio.
At the European level, the volume of outstanding mortgage loans was €7 trillion at the end of 2016, representing 30% of total assets in the EU banking sector (€23.6 trillion in 2016) and equalling 47% of EU GDP (Pelizzon & Riedel, 2017). The decisions and methods the financing sector, in particular banks employ have a significant impact on the construction sector, and in particular on the energy efficiency sector, and may be among the key game-changers in relation to the EU’s energy savings targets.
This and many quoted reports have shown clear evidence for the economics of energy efficiency investments in buildings to reduce credit risk when pricing loans, through the increased creditworthiness of the client/the asset owner and also due to the increased value of the buildings, assets.
International Financial Institutions (IFIs) could and should intervene through provision of risk guarantees priced against the ‘real’ as opposed to the ‘perceived’ risk profile of such investments. Such guarantees could help catalyse a scaling up of energy efficiency financing. Initially, guarantees would encourage banks to explore default risk beyond their current conservative horizons with respect to energy efficiency lending. The banks would then gain from the reduced risks, and in the long run this should lead to a greater willingness to lend to energy efficiency and more favourable lending terms, stimulating greater demand for loans without the need for guarantees.
Regarding the impact of energy performance certification on commercial mortgages this overview demonstrates that energy efficiency plays a crucial role. Lower risk associated with energy efficiency should be taken into account when underwriting mortgage risks. As a result, efficient homes should have lower default risks than less efficient homes because the former are associated with lower energy costs, which in theory should leave more money to pay the mortgage.

35
To conclude the transition to a more sustainable built environment not only contributes to mitigating carbon emissions, but in tandem it will yield the opportunity for the creation of shareholder value through energy efficiency and a decrease financial risks.

36
References
Akerlof, G. A. (1970). The Market for "Lemons": Quality Uncertainty and the Market Mechanism. The
Quarterly Journal of Economics, 84(3), 488-500.
An, X., & Pivo, G. (2015). Default risk of Securitized Commercial Mortgages: Do Sustainability Property
Features Matters? . RERI Working Paper.
ASHRAE. (2010). ASHRAE Standard 189.1P. Standard for the design of high – performance green buildings
except low-rise residential buildings. Atlanta, USA: ASHRAE.
Banfi, S., Farsi, M., Filippini, M., & Jakob, M. (2008). Willingness to pay for energy saving measures in
residential buildings. Energy Economics, 30, 503-516.
Basel Committee. (2000). Principles for the Management of Credit Risk - final document. Retrieved from
http://www.bis.org/publ/bcbs75.htm
Bertoldi, P., & Kromer, S. (2006). Risk assessment in efficiency valuation: concepts and practice.
Proceedings of the ACEEE 2006 Summer Study on Energy Efficiency in Buildings, (pp. 13-22).
Pacific Grove, CA, USA.
Bertoldi, P., Rezessy, S., & Vine, E. (2006). Energy service companies in European countries: current
status and a strategy to foster their development. Energy Policy, 34(14), 1818–1832.
Bing, L., Akintoye, A., Edwards, P. J., & Hardcastle, C. (2005). The allocation of risk in PPP/PFI construction
projects in the UK. International Journal of project management, 23(1), 25-35.
Blyth, W., & Savage, M. (2011). Financing Energy Efficiency: A Strategy for Reducing Lending Risk.
London, the UK: Chatham House. Retrieved from
https://www.chathamhouse.org/sites/files/chathamhouse/19462_0511pp_blythsavage.pdf
Brocklehurst, F. (2017). What will you pay for an "A"? - a review of the impact of building energy
efficiency labelling on building value. ECEEE Summer Study (pp. 1259-1269). Nice, France: ECEEE.
Brounen, D., & Kok, N. (2011). On the economics of energy labels in the housing market. Journal of
Environmental Economics and Management, 62(2), 166-179.
Brounen, D., Kok, N., & Menne, J. (2009). Energy Performance Certification in the Housing Market
Implementation and Valuation in the European Union. Maastricht, the Netherlands: European
Centre for Corporate Engagement. Retrieved from
http://www.fdewb.unimaas.nl/finance/news/energy.pdf
Budde, N. (2016, July 6). Proven Tips to Reduce Credit Risk and Default Receivables. Retrieved from
Construction Executive:
http://enewsletters.constructionexec.com/riskmanagement/2016/07/proven-tips-to-reduce-
credit-risk-and-default-receivables/
Burt, L., Goldstein, D. B., & Leeds, S. (2010). A path towards incorporating energy and transportation
costs into mortgage underwriting: shifting to fact-based analysis. 2010 ACEEE Summer Study on
Energy Efficiency in Buildings. Pacific Grove, CA, USA: ACEEE. Retrieved from
https://aceee.org/files/proceedings/2010/data/papers/2172.pdf

37
Cappelli, S. (2017). Energy Efficiency: Impact on real estate values and risks. CRIF. Retrieved from
https://ec.europa.eu/energy/sites/ener/files/documents/013_1a_silvia_capelli_seif_milan_16-
11-17.pdf
Chegut, A., Eichholtz, P., Kok, N., & Quigley, J. (2010). The Value of green buildings new evidence from
the United Kingdom. 17th ERES annual conference (p. ID 150). Milan, Italy: ERES. Retrieved from
http://www.eres2010.org/contents/papers/id150.pdf
D'Agostino, D., & Parker, D. (2017). A model for cost-optimal simulation of new Nearly Zero Energy
Buildings (NZEBs) in Europe. Ispra, Italy: European Commission, Joint Research Center.
Economidou, M., & Bertoldi, P. (2014). Financing Building energy renovations. Ispra, Italy: European
Commission, Joint Research Center.
EEFIG. (2017). EEFIG Underwriting Toolkit: Value and risk appraisal for energy efficiency financing.
Brussels, Belgium: EEFIG, European Union. doi:ISBN: 978-1-5272-1107-0
Eichholtz, P., Kok, N., & Quigley, J. M. (2009). Doing good by doing well? Green office buildings. Institute
of Business and Economic Research. Berkeley, CA, USA: University of California, Berkeley.
Retrieved from http://www.ucei.berkeley.edu/PDF/seminar20090130.pdf
Ekins, P., & Lees, E. (2008). The impact of EU policies on energy use in and the evolution of the UK built
environment. Energy Policy, 36, 4580–3.
Entrop, A. G., Brouwers, H. J., & Reinders, A. H. (2010). Evaluation of energy performance indicators and
financial aspects of energy saving techniques in residential real estate. Energy and Buildings,
42(5), 618-629.
European Commission. (2010). Directive 2010/31/EC of the European Parliament and the Council of 19
May 2010 on the energy performance of buildings. Brussels, Belgium: Official Journal of the
European Union. Retrieved from
http://eurlex.europa.eu/LexUriServ/LexUriServ.do?uri=OJ:L:2010:153:0013:0035:EN:PDF
European Commission. (2011). Meeting document for the expert workshop on the comparative
framework methodology for cost optimal minimum energy performance requirements. Brussels,
Belgium: European Commission. Retrieved from
http://ec.europa.eu/energy/efficiency/buildings/doc/meeting_document_16_march_final.pdf
European Commission. (2016). COMMISSION STAFF WORKING DOCUMENT, IMPACT ASSESSMENT:
Proposal for a Directive of the European Parliament and of the Council amending Directive
2010/31/EU on the energy performance of buildings. Brussels, Belgium: SWD(2016) 414 final.
Fuerst, F., & McAllister, P. (2008). Green noise or green value? Measuring the price effects of
environmental certification in commercial buildings. Reading, the UK: University of Reading.
Gram-Hanssen, K., Bartiaux, F., Jensen, O., & Cantaert, M. (2007). Do homeowners use energy labels? A
comparison between Denmark and Belgium. Energy Policy, 35, 2879–88.
Green Energy Money blog. (2016, February 16). Brown Discounts & Green Premium Value Trends–New
Real Estate Market Emerging Risk. Retrieved from http://www.greenenergy.money/brown-
discounts-green-premium-value-trends-new-real-estate-market-emerging-risk/
38
Griffiths, R., Hamilton, I., & Huebner, G. (2015). The Role of Energy Bill Modelling in Mortgage
Affordability Calculations. London, the UK: UK Green Building Council & UCL Energy Institute.
Retrieved from http://www. ukgbc. org/sites/default/files/The% 20role% 20of% 20energy%
20bill% 20modelling% 20in% 20mortgage% 20affordability% 20calculations
Haggett, F., Sayce, S., Parnell, P., & Toth, Z. (2017). Connecting Building Performance and Value: The
State of Play. Ecobuild conference. London.
Hartenberger, U., Lorenz, D., Sayce, S., & Toth, Z. (2017). Crerating an energy efficient mortgage for
Europe: Mortgage lending valuation and the impact of energy efficiency: an overview of current
practice. London, UK: RICS. Retrieved from http://energyefficientmortgages.eu/wp-
content/uploads/2017/10/EeMAP-Technical-Report-on-Mortgage-Lending-Valuation-and-the-
Impact-of-Energy-Efficiency.pdf
Högberg, L., Lind, H., & Grange, K. (2009). Incentives for improving energy efficiency when renovating
large-scale housing estates: a case study of the Swedish million homes program. Sustainability, 1,
1349–65.
Hu, J., & Enyi, Z. (2011). Engineering risk management planning in energy performance contracting in
China. Systems Engineering Procedia, 1, 195-205.
Iichholtz, P., Holtermans, R., Kok, N., & Yonder, E. (2012). Environmental Performance and the Cost of
Capital: Evidence from Commercial Mortgages and REITs Bonds. Maastricht, the Netherlands:
Maastricht University.
IVSC, I. V. (2016). IVS 105: VALUATION APPROACHES AND METHODS. London, the UK: IVSC. Retrieved
from https://www.ivsc.org/files/file/view/id/648
Jank, R. (2008). Net Zero and Low Energy Buildings: Theory and European Practice. EnEff: stadt. Fourth
workshop, Energy-Efficient Technologies for Government Buildings New and Retrofits, (pp. 16-
18).
Jim, C. Y., & Chen, W. Y. (2006). Impacts of urban environmental elements on residential housing prices
in Guangzhou (China). Landscape and Urban Planning, 78(4), 422-434.
Kaza, N., Quercia, R. G., & Tian, C. Y. (2014). Home energy efficiency and mortgage risk. Cityscape: A
Journal of Policy Development and Research, 16(1), 263-282.
Keohane, N., Revesz, R., & Stavins, R. (1998). The Choice of Regulatory Instruments in Environmental
Policy. Harvard Environmental Law Review, 22(2), 313-367.
Killip, G. (2011). Can Market Transformation approaches apply to service markets? An investigation of
innovation, learning, risk and reward in the case of low refurbishment in the UK. Proceedings of
ECEEE Summer Study (pp. 1185-1196). Belambra Presqu'île de Giens, France: European Council
for an Energy-Efficient Economy.
Koehler, D. A. (2007). The Effectiveness of Voluntary Environmental Programs -- A Policy at a Crossroads?
The Policy Studies Journal, 35(4), 689-722.
Kok, N., & Jennen, M. (2011). The value of energy labels in the European Office Market. Maastrict and
Rotterdam, the Netherlands: Maastrict University and RSM Erasmus.

39
Kok, N., & Jennen, M. (2012). The impact of energy labels and accessibility on office rents. Energy Policy,
46(C), 489-497.
Leopoldberger, G., Bienert, S., Brunauer, W., Bobsin, K., & Schutzenhofer, C. (2010). Energising property
valuation in Europe. Putting a value on energy efficient buildings. 17th ERES annual conference
(pp. June 23–26, 2010). Milan, Italy: ERES.
Lior, N. (2011). The ECOS 2009 World Energy Panel: an introduction to the Panel and to the present
(2009) situation in sustainable energy development. Energy, 36, 3620–8.
Lorenz, D. P., Trück, S., & Lützkendorf, T. (2007). Exploring the relationship between the sustainability of
construction and market value: Theoretical basics and initial empirical results from the
residential property sector. Property Management, 25(2), 119-149.
Marks, S. (2014). Integrating energy efficiency into mortgage financing: promising efforts in the New York
City multifamily building sector. Deutsche Bank. Retrieved from
http://www.frbsf.org/community-development/publications/community-development-
investment-review/2014/march/integrating-energy-efficiency-mortgage-financing-new-york-
city-multifamily-building-sector/
McGraw-Hill Construction. (2009). Green outlook 2009: Trends driving change. Columbus, OH, USA:
McGraw Hill Publishing.
McKinsey Global Institute, N., Dobbs, R., Oppenheim, J., Thompson, F., Brinkman, M., Zornes, M., & al., e.
(2011). Resource Revolution: Meeting the world's energy, materials, food, and water needs. New
York, NY (USA): McKinsey & Company.
Meins, E., & Burkhard, H. (2009). Der Nachhaltigkeit von Immobilien einen finanziellen Wert geben: ESI
Immobilienbewertung – Nachhaltigkeit inclusive. Zürich, Switzerland: University of Zürich.
Retrieved from https://www.zora.uzh.ch/19637/2/ESI_Nachhaltigkeit_inklusive_V.pdf
Meins, E., Wallbaum, H., Hardziewski, R., & Feige, A. (2010). Sustainability and property valuation: a risk-
based approach. Building Research & Information, 38(3), 280-300.
Miller, N., Spivey, J., & Florance. (2008). Journal of Real Estate Portfolio Management, 14(4), 385-400.
Mills, E., Kromer, S., Weiss, G., & Matthew, P. (2006). From volatility to value: Analysing and managing
financial and performance risk in energy savings projects. Energy Policy, 34(2), 188-199.
Mudgal, S., Lyons, L., Cohen, F., Lyons, R., & Fedrigo-Fazio, D. (2013). Energy performance certificates in
buildings and their impact on transaction prices and rents in selected EU countries. Brussels,
Belgium: Bio Intelligence Service.
Murphy, L., Meijer, F., & Visscher, H. (2009). Improving the energy performance of Dutch houses:
drawing lessons from neighbours. Proceedings of RICS COBRA research conference. (pp. 1697-
709). Cape Town, South Africa: University of Cape Town.
Nair, G., Gustavsson, L., & Mahapatra, K. (2010). Owners perception on the adoption of building
envelope energy efficiency measures in Swedish detached houses. Applied Energy, 87, 2411–9.

40
Notaires de France. (2017). Valeur verte des logements en 2016 : nouvelle étude de l’association
DINAMIC. Actualisation de l’étude menée par l’association DINAMIC sur les données. Retrieved
from http://www.planbatimentdurable.fr/IMG/pdf/cp_valeur_verte_logement_2016_-
_octobre_2017_0.pdf
Pelizzon, L., & Riedel, M. (2017). Creating an energy efficient mortgage for Europe: Review of the impact
of energy efficiency on probability of default. Frankfurt am Main, Germany: EeMAP project:
Research Center SAFE, Goethe University Frankfurt.
Pivo, G., & Fisher, J. D. (2009). Investment returns from responsible property investments: Energy
efficient, transit-oriented and urban regeneration office properties in the us from 1998–2007.
Responsible Property Investing Center, Boston College, University of Arizona, Benecki Center for
Real Estate Studies, and Indiana University.
Popescu, D., Bienert, S., Schützenhofer, C., & Boazu, R. (2012). Impact of energy efficiency measures on
the economic value of buildings. Applied Energy, 89(1), 454-463.
Quercia, R., Sahadi, R., Stellberg, S., Kaza, N., & Tian, C. (2013). Home energy efficiency and mortgage
risks. UNC Center for Community Capital. Retrieved from
http://www.issuelab.org/resource/home_energy_efficiency_and_mortgage_risks_research_fun
ded_by_the_institute_for_market_transformation
Reuter, F., & Spaeh, J. (2017). Comparison of the Valuation Techniques based on Key Performance
Indicators. LUWOGE consult, REVALUE project.
Rezessy, S., & Bertoldi, P. (2010). Financing Energy Efficiency: Forging the link between financing and
project implementation. Ispra, Italy: European Commission, Joint Research Center.
Saheb, Y., & Ossenbrink, H. (2015). Securing Energy Efficiency to Secure the Energy Union: How Energy
Efficiency meets the EU Climate and Energy Goals. Ispra, Italy: Publications Office of the
European Union. Retrieved from https://ec.europa.eu/jrc/en/publication/eur-scientific-and-
technical-research-reports/securing-energy-efficiency-secure-energy-union-how-energy-
efficiency-meets-eu-climate-and
Saheb, Y., Bodis, K., Szabo, S., Ossenbrink, H., & Panev, S. (2015). Energy Renovation: The Trump Card for
the New Start for Europe. Ispra, Italy: European Commission Joint Research Center. Retrieved
from
http://publications.jrc.ec.europa.eu/repository/bitstream/JRC92284/eur26888_buildingreport_o
nline_2015-03-25.pdf
Salvi, M., Horejajova, A., & Muri, R. (2008). Minergie macht sich bezahlt. Zurich, Switzerland: Centre for
Corporate Responsibility and Sustainability, University of Zurich. Retrieved from
https://www.minergie.ch/tl_files/download/ZKB_MINERGIE_Studie_2008.pdf
Sayce, S., Sundberg, A., & Clements, B. (2010). Is sustainability reflected in commercial property prices: an
analysis of the evidence base. London, the UK: Kingston University.
Singhal, D., & Swarup, K. S. (2011). Electricity price forecasting using artificial neural networks.
International Journal of Electrical Power & Energy Systems, 33(3), 550-555.

41
Tronchin, L., & Fabbri, K. (2010). A round robin test for buildings energy performance in Italy. Energy
Build, 42, 1862–77.
Uihlein, A., & Eder, P. (2010). Policy options towards an energy efficient residential building stock in the
EU-27. Energy and Buildings, 42(6), 791-798.
Urge-Vorsatz, D., Novikova, A., & Sharmina, M. (2009). Counting good: quantifying the co-benefits of
improved efficiency in buildings. ECEEE 2009 Summer Study. ACT! INNOVATE! DELIVER!
REDUCING ENERGY DEMAND SUSTAINABLY, 185-195.
Wouters, P., Van Dijk, D., Elsberger, M., Miladinova, G., Maldonado, E., Sutherland, G., & al., e. (2008).
Implementation of energy performance of buildings directive-country reports. Brussels, Belgium.
Retrieved from http://www.buildup.eu/publications/1302

42
List of abbreviations
EE Energy Efficiency
IEA International Energy Agency
EPC Energy Performance Certification
EPBD Energy Performance of Building Directive
ESI Swiss Economic Sustainability Indicator
KPI Key Performance Indicators
RICS Royal Institution of Chartered Surveyors
WEO World Energy Outlook

43
List of boxes
Box 1. Financial and economic parameters of cost-effectiveness of energy efficiency .... 14
Box 2. Impact of discount rate choices on the cost-effectiveness of EE investment ....... 15

44
List of figures
Figure 1. The three key valuation approaches and the valuation parameters. ................ 8
Figure 2. The future trend of green buildings taking over the market because of non-sustainable buildings going obsolete (US market situation) ......................................... 9
Figure 3. The impact of EPC categories on sale price of houses in French regions in 201625
Figure 4. Impact of one-letter improvement in the EPC label category on the transaction price and rental prices in selected regions of the EU ................................................. 26
Figure 5. Double impact of energy efficiency on the value of the building. ................... 29
Figure 6. Multifaceted benefits of improved energy performance ................................ 32

45
List of tables
Table 1 . Overview of impact of energy efficiency label/certificate in the commercial and public sector from Mudgal et al. (2013) and Pelizzoni and Riedel (2017). .................... 17
Table 2. Overview of impact of energy efficiency label/certificate in the residential sector from Mudgal et al. (2013) and Pelizzoni and Riedel (2017). ....................................... 20
Table 3. Comparison of Voluntary labelling and certification schemes ......................... 31

GETTING IN TOUCH WITH THE EU
In person
All over the European Union there are hundreds of Europe Direct information centres. You can find the address of the centre nearest you at: https://europa.eu/european-union/contact_en
On the phone or by email
Europe Direct is a service that answers your questions about the European Union. You can contact this service:
- by freephone: 00 800 6 7 8 9 10 11 (certain operators may charge for these calls),
- at the following standard number: +32 22999696, or
- by electronic mail via: https://europa.eu/european-union/contact_en
FINDING INFORMATION ABOUT THE EU
Online
Information about the European Union in all the official languages of the EU is available on the Europa website at: https://europa.eu/european-union/index_en
EU publications You can download or order free and priced EU publications from EU Bookshop at: https://publications.europa.eu/en/publications. Multiple copies of free publications may be obtained by contacting Europe Direct or your local information centre (see https://europa.eu/european-union/contact_en).

KJ-N
A-2
9471-E
N-N
doi:10.2760/267367
ISBN 978-92-79-97751-0