energy efficiency in municipal services: assessment of
TRANSCRIPT
Energy Efficiency in municipal Services: Assessment
of Building Level Energy Consumption in Water
Services
India-UK Joint
Integrated Urban Model for Built Environment Energy Research
(iNUMBER)
June 2020


Document No: Work Package 2/Task No/17-21
India-UK Joint Integrated Urban Model for Built Environment Energy Research (iNUMBER)
Work Package 2 (WP2): Incorporate Municipal Energy Services
Energy Efficiency in Municipal Services: Assessment
of building level energy consumption in water
services
June 2020
Authors:
Palak Patel, Mona Iyer, Sachin S, Rajan Rawal
Centre for Advanced Research in Building Science and Energy
CEPT University, Ahmedabad


Acknowledgments
The Department of Science and Technology (DST), Government of India, the UK Engineering and
Physical Sciences Research Council (EPSRC) and Economic and Social Research Council (ESRC), as
part of the Newton Bhabha Fund, provided joint funding to “Integrated Urban Model for Built
Environment Energy Research (iNUMBER)”. The EPSRC and ESRC support the UK iNUMBER
activity to University College London. The DST, Government of India supports the Indian iNUMBER
activity to CEPT University under sanction order number DST/TMD/UK-BEE2017/18(C) and
DST/TMD/UK-BEE2017/18(G) dated 29 December 2017.
iNUMBER (iNtegrated Urban Model for Built Environment Energy Research) is a four-year (2017-
2021) research project to help cities reduce their energy demand and improve their municipal services.
This goal is led by CEPT University, Ahmedabad and supported in India by Indian Institute of
Technology Bombay, Mumbai. It is led by University College London, London, and supported by the
University of Oxford, Oxford.
Authors also acknowledge guidance from Prof. Mona Iyer, Professor. Rajan Rawal, Executive
Director and Mr. Sachin. S, Research Associate and Ms. Himani pandya, Senior Research Associate at
Centre for Advanced Research in Building Science and Energy (CARBSE), CEPT University.
Please cite this document as: Patel. P., Iyer. M., Sachin. S., Rawal, R., (2020). Energy Efficiency in Municipal Services:
Assessment of building level energy consumption in water services, Ahmedabad, India: Centre for
Advanced Research in Building Science and Energy (CARBSE), CEPT University. Submitted to
the UK-India Joint Integrated Urban Model for Built Environment Energy Research (iNUMBER)


i
CONTENTS
1. Introduction ..................................................................................................................................... 1 1.1. Aim 2 1.2. Objectives ................................................................................................................................ 2 1.3. About the iNumber project ...................................................................................................... 2 1.4. Research methodology ............................................................................................................. 3
2. Review of the studies related to Energy Efficiency ...................................................................... 5 2.1. An Overview of Energy Efficiency in India ............................................................................ 5 2.2. Relation of Energy and Urban morphology ............................................................................. 9 2.3. Energy Efficiency in municipal water services ..................................................................... 14 2.4. Key takeaways ....................................................................................................................... 17
3. Building level energy consumption in water pumping – A case of Ahmedabad ..................... 19 3.1. The land use of the Ahmedabad city ..................................................................................... 19 3.2. Pilot study .............................................................................................................................. 20 3.3. Confining the further study .................................................................................................... 22 3.4. Scaling up the surveys for residential buildings .................................................................... 22
3.4.1. Sampling methodology .............................................................................................. 23 3.4.2. Data collection methodology ..................................................................................... 23 3.4.3. Measuring of the electricity consumed for pumping water........................................ 24 3.4.4. Collected data ............................................................................................................. 25
4. Assessment of the data in comparison to urban morphology ................................................... 27 4.1. How the height of the building influences the electricity consumption for water pumping? 28 4.2. Does the total population matter when compared to the per capita electricity consumption?30 4.3. Does the operational time of the pump increase the electricity used for pumping water? .... 32 4.4. Is the age of the building significant for the use of the electricity for water pumping? ........ 34 4.5. What is the role of the floor space area in the electricity consumption? ............................... 35 4.6. Synthesis of the study ............................................................................................................ 36 4.7. Way forward .......................................................................................................................... 38
References ............................................................................................................................................ 41 Appendix A Pilot Survey ................................................................................................................. 1 Appendix B Low rise survey........................................................................................................... 4 4 Appendix C Mid rise survey ........................................................................................................... 6 6 Appendix D High rise survey .......................................................................................................... 7 Appendix E City level services ....................................................................................................... 8
ii
List of Figures
Figure 1: Research methodology ............................................................................................................. 4 Figure 2: Conceptual diagram for a review of the studies ....................................................................... 5 Figure 3: Ranking of the countries for energy efficiency by ACEEE ..................................................... 6 Figure 4: Timeline of Demand side management initiatives in India .................................................... 8 Figure 5: Economic lifespan of energy consuming equipments ............................................................ 10 Figure 6: Interpretation of urban form and morphology ....................................................................... 12 Figure 7: Building sector emission by world region, projection of 2010 & 2030 ................................. 13 Figure 8: DP of Ahmedabad city ........................................................................................................... 19 Figure 9: Data points for pilot study ..................................................................................................... 20 Figure 10: Electricity consumed in different typologies ....................................................................... 21 Figure 11: Distribution of land use in Ahmedabad ............................................................................... 22 Figure 12: Building footprints of Ahmedabad ...................................................................................... 23 Figure 13: Grid No.8, east zone ............................................................................................................ 24 Figure 14: Grid No. 4, west zone .......................................................................................................... 24 Figure 15: Motor starter for the pump capacity of 1-5 HP .................................................................... 24 Figure 16: Motor starter for the pump capacity of 7-15 HP .................................................................. 24 Figure 17: Data points for residential typologies .................................................................................. 25 Figure 18: Graphical representation of correlation ............................................................................... 26 Figure 19: Percentage of electricity used in water pumping for residential buildings .......................... 27 Figure 20: Per capita electricity consumption in residential typologies ................................................ 29 Figure 21: Per capita consumption of electricity compared to the total population in low rise ............ 30 Figure 22: Per capita consumption of electricity compared to the total population in mid-rise............ 30 Figure 23: Per capita consumption of electricity compared to the total population in high rise ........... 31 Figure 24: Per capita consumption of electricity compared to the operational time of pump for low rise ............................................................................................................................................................... 32 Figure 25: Per capita consumption of electricity compared to the operational time of pump for mid-rise ............................................................................................................................................................... 32 Figure 26: Per capita consumption of electricity compared to the operational time of the pump for high rise ......................................................................................................................................................... 33 Figure 27: Per capita consumption of electricity in residential typologies of different age group........ 34 Figure 28: Per capita consumption of electricity compared to the building age ................................... 35 Figure 29: Per capita consumption of electricity compared to floor space area .................................... 36

iii
Abbreviations ACEEE The American Council for an Energy-Efficient Economy AEEE Alliance for an Energy Efficient Economy AEC Ahmedabad Electricity company BEE Bureau of Energy Efficiency DSM Demand Side Management DISCOM Distribution Company ECBC Energy Conservation Building Code EE Energy Efficiency EESL Energy Efficiency Services Limited GHG Green House Gases GUDC Gujarat Urban Development Corporation JNNURM Jawaharlal Nehru National Urban Rejuvenation Mission MEEP Municipal Energy Efficiency Programme MNRE Ministry of New and Renewable Energy MoHUA Ministry of Housing and Urban Affairs MuDSM Municipal Demand Side Management NAPCC National Action Plan for Climate Change NUSP National Urban Sanitation Policy SBM Swachh Bharat Mission SDA State Designated Agencies SME Small Medium Enterprise ULB Urban Local Body UNDP United Nations Development Programme UNEP United Nations Environment Programme UNFCCC United Nations Framework Convention on Climate Change UN-HSP United Nations Human Settlement Programme

iv

v
This page is intentionally left blank.


1
Energy Efficiency in municipal Services: Assessment of Building Level Energy Consumption
in Water Services: WP2 | CARBSE, CEPT University
1. Introduction Energy Efficiency (EE) plays an important role in preserving the growth of the economy of India and
also help in accomplishing sustainability goals (AEEE, 2018). India utilizes only 6% of energy at a
global level and comprises 18% of the total population of the world. The energy utilization of India
has almost become twice since 2000 and the probability for future growth remains excessive, creating
more demand (India energy outlook report (IEA, 2015). After the United States, Russia, and China,
India is the 4th largest user of energy in the world and is assured to become the 3rd highest economy of
the world by 2030. India ranked 3rd for distribution and transmission network and possess the world’s
5th largest grid for electricity supply (Harish & Kumar, 2014). Considerable progress has been made
in improving energy access in the country in the past few years. However it still faces the trilemma of
achieving objectives of higher energy access alongside higher energy security and higher sustainability
(NITI Aayog, 2017). The evaluation of energy conservation programs in India has acquired
insubstantial attention, despite expanding expeditiously with regards to the scale of the project
(Mrudula Kelkar, Aditya Chunekar, Sanjana Mulay, 2018).
Bureau of Energy Efficiency (BEE) was established in March 2002, with an aim to reduce the cost of
energy consumption considering the economic aspect of the country. It was launched under the
Ministry of Power (MoP) in align with the assistance of the Energy Conservation Act, 2001. The
major focus was on developing the programs of energy efficiency and its conservation at the national
level. The work carried out by BEE focuses on drafting action plans and framing the Demand Side
Management (DSM) program, which functions as a central organization of the country for the energy
efficiency measures (Harish & Kumar, 2014). Situational surveys were conducted in 175 ULBs across
the country and, based on a techno-commercial assessment, 134 bankable detailed project reports were
prepared. Based on the generating capacity, 120 MW of electricity is anticipated to be conserved
through energy effective projects in the 134 Urban Local Bodies. But the execution of water and
wastewater energy efficiency projects is yet not happening at a large scale(Pradeep Kumar, 2012).
The requirement for energy had been predominated by the buildings sector (which includes
commercial, residential, and institutional), however, the demand has increased exponentially in the
industrial sector as well. The true measure of progress in building energy efficiency is determined by
outcome-based indicators such as energy intensity of buildings (kWh per m2), energy savings (kWh or
ktoe) achieved from EE initiatives, penetration of ECBC-compliant and green buildings and
penetration of EE appliances in the market (AEEE, 2018). Due to an increase in ownership of
appliances because of the higher standard of living the demand for electricity has also increased
significantly.
Bureau of Energy Efficiency (BEE) commenced a program for municipal services in the 12th five-year
plan, that concentrated on determining the energy-saving potential in the municipal sector and

2
Energy Efficiency in municipal Services: Assessment of Building Level
Energy Consumption in Water Services: WP2 | CARBSE, CEPT University
designed a “Manual for the development of the Energy Efficiency Projects”. The manual state that
“The major energy loads in municipalities are the water pumping systems, street lighting, sewage
treatment and electricity distribution. Municipal buildings such as hospitals, offices, schools also
contribute to the high municipal energy bills”(BEE, 2006). However, there are no initiatives in India
that leads to the energy-saving potential in water at the building level.
This study intends to study the building level energy consumption for water pumping system in
respect to the urban morphology of the city.
1.1. Aim The study aims to assess the building level energy consumption in water pumping services and
comprehend the impact concerning urban morphology for different residential typologies.
1.2. Objectives To achieve the aim, the following objectives were undertaken:
1) Review of the studies related to the overall energy efficiency, in relation to urban form and
Municipal services.
2) Comprehend the urban factors that affect the energy consumption and develop a methodology
to identify the residential.
3) Measuring the residential building level energy consumption for water pumping services and
establish the relationship of urban form with energy consumption at the building level.
1.3. About the iNumber project The project iNtegrated Urban Model for Built Environment Energy Research is a research
collaboration between India and the United Kingdom which focuses on helping cities to minimize
their energy demand and enhance the water and electricity services. The project consists of three work
packages and this study is carried out under work package 2 which focuses on incorporating the
municipal energy services. The work includes the electricity used for street lighting, water pumping
and sanitation. The work package 2 intends to work for 5-6 ULBs regarding buildings, energy and
water services. From these, a detailed work will be carried out for 2-3 ULBs.
This study focuses on the electricity consumption for water supply service at the building level. There
are two sources for the water supply in the buildings, one is municipal connection and private bore
well. The water is stored in the underground water tank supplied by either source, further pumped to
the overhead tank. These energy consumptions are different in various typologies, therefore to assess

3
Energy Efficiency in municipal Services: Assessment of Building Level Energy Consumption
in Water Services: WP2 | CARBSE, CEPT University
the same various samples are collected from the different areas of the city. The data required for the
study to measure the electricity consumption in the buildings is listed below:
• Operational time of pump
• Capacity of pump
• Total electric units consumed (kWh)
• Per capita electric units consumed per month
1.4. Research methodology The research methodology consists of four sections as shown in Figure 1, Which includes 1. Review
of the studies related to energy efficiency 2. Understanding the electricity consumption at the building
level for water supply 3. Scaling up the surveys for residential buildings 4. Assessment of the data in
comparison to urban morphology.
The first section has been further categorized into three parts, with the first part consisting of the
review of studies related to the synopsis of the energy efficiency in India. In this part the reviewed
studies focused on the initiatives taken for the energy efficiency in the country. Literature for the best
practices on energy efficiency measures were reviewed in this part. Further, in the second part the
courses that focused upon the relationship of urban morphology with the energy utilization were
reviewed. Since this study is limited to assessing the energy used for water services, literature related
to the same was reviewed in the third part. It also explored a few case studies intended to increase the
energy efficiency for water pumping. The second section was followed by the first section, which
involved the understanding of the land use pattern of the city and incorporate it in identifying the
building typologies. This was further taken forward by conducting the pilot surveys for the major
typologies like residential, commercial and institutional. The collected data was analyzed that helped
in confining the research for further study. Followed by the learnings from the second section, this part
focused on the residential typology for the further study. The sampling strategy was identified for the
residential buildings and the relationship of urban morphology with the energy use was examined.
Based on the sampling strategy the data collection methodology was formed and the data was
collected for the residential typology of low rise, mid-rise and high rise. This section also specifies the
method used for analyzing the data for the analysis included in the fourth section. Further, in the
fourth section the data collected was analyzed concerning the urban factors that affect the energy
consumption, followed by the conclusion and way forward.

4
Energy Efficiency in municipal Services: Assessment of Building Level
Energy Consumption in Water Services: WP2 | CARBSE, CEPT University
Review of the studies
• Part A – Overview of Energy Efficiency at
global and national level
• Part B – Relationship of energy consumption with urban form
• Part C – Energy Efficiency in municipal water supply services
Understanding the electrical energy consumption at building level
for water pumping
• the land use of the Ahmedabad city
• Pilot study
• Confining the further study
Scaling up the surveys for residential buildings
• Sampling strategy for residential buildings
• Understanding the relationship of urban Morphology with
energy consumption.
• Framing of Data collection methodology
• Data collected
• Statistical methods used for analysis
Assessment of the data in comparison to urban morphology
• Urban morphology affecting energy
consumption at the building level
• Synthesis of the study
• Way forward
Figure 1: Research methodology

5
Energy Efficiency in municipal Services: Assessment of Building Level Energy Consumption
in Water Services: WP2 | CARBSE, CEPT University
2. Review of the studies related to Energy Efficiency
Figure 2: Conceptual diagram for a review of the studies
The literature review consists of three parts based on the aim and objective of the study as shown in
Figure 2 The first part of the study describes the overview of energy efficiency measures taken at the
global and national levels. It reviews the acts and policies adopted in India for the implementation of
energy saving programs. Another part of the study reviews the reports and articles which discuss the
idea of integrating urban planning with energy planning and determines the urban morphology which
accounts for height, area and density of the buildings that affect the electricity consumption pattern. It
briefly reviews the programs and guidelines that explain the density, urban form and urban structure to
understand the factors that affect the energy consumption. The third part of the study describes the
issues and challenges faced by the country in terms of implementing the energy efficient municipal
services for water and sanitation. It also illustrates the initiative taken at the building level to reduce
the use of energy consumption. The last part of the study is followed by a conclusion which narrates
the takeaway from the study.
2.1. An Overview of Energy Efficiency in India Internationally, The American Council for an Energy Efficient Economy (ACEEE) a non-
profit organization, evaluates the energy performance of the world’s top energy consuming
countries based on four categories: Buildings, Industry, transportation and overall EE
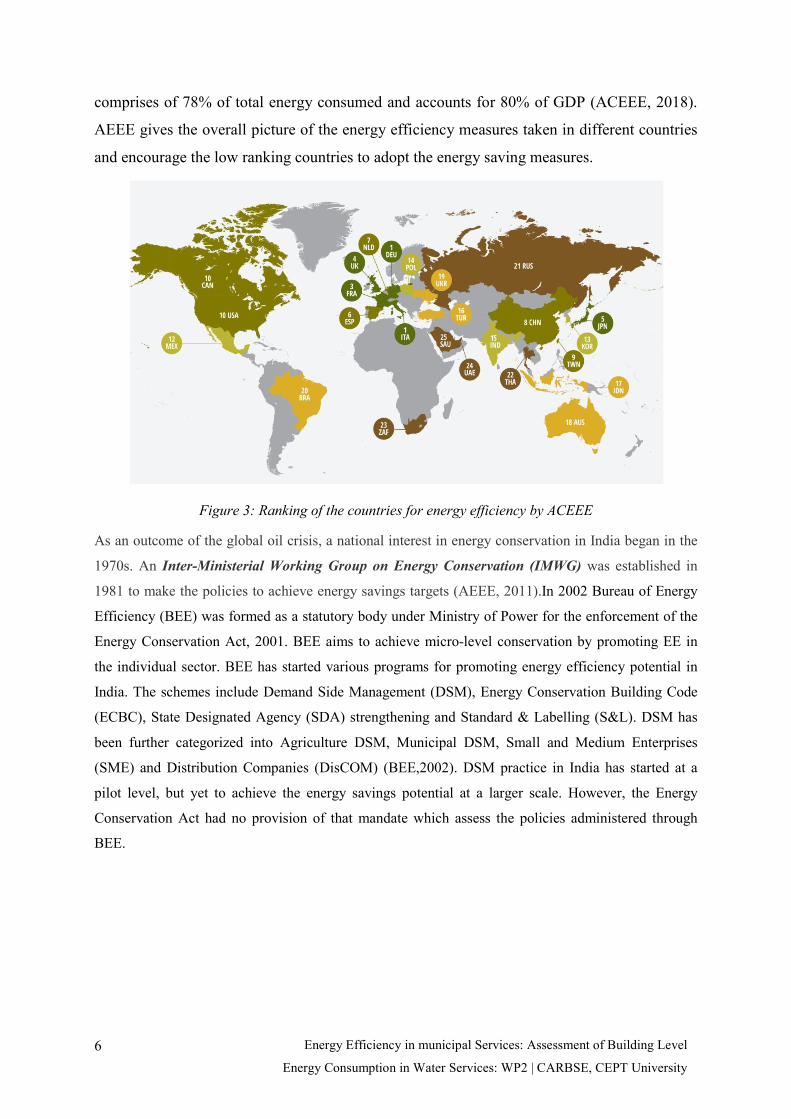
progress. According to the 2018 scorecard shown in Figure 3, India stood 15th amongst other
countries, whereas Italy and Germany were in the first place. All 25 countries evaluation
6
Energy Efficiency in municipal Services: Assessment of Building Level
Energy Consumption in Water Services: WP2 | CARBSE, CEPT University
comprises of 78% of total energy consumed and accounts for 80% of GDP (ACEEE, 2018).
AEEE gives the overall picture of the energy efficiency measures taken in different countries
and encourage the low ranking countries to adopt the energy saving measures.
Figure 3: Ranking of the countries for energy efficiency by ACEEE
As an outcome of the global oil crisis, a national interest in energy conservation in India began in the
1970s. An Inter-Ministerial Working Group on Energy Conservation (IMWG) was established in
1981 to make the policies to achieve energy savings targets (AEEE, 2011).In 2002 Bureau of Energy
Efficiency (BEE) was formed as a statutory body under Ministry of Power for the enforcement of the
Energy Conservation Act, 2001. BEE aims to achieve micro-level conservation by promoting EE in
the individual sector. BEE has started various programs for promoting energy efficiency potential in
India. The schemes include Demand Side Management (DSM), Energy Conservation Building Code
(ECBC), State Designated Agency (SDA) strengthening and Standard & Labelling (S&L). DSM has
been further categorized into Agriculture DSM, Municipal DSM, Small and Medium Enterprises
(SME) and Distribution Companies (DisCOM) (BEE,2002). DSM practice in India has started at a
pilot level, but yet to achieve the energy savings potential at a larger scale. However, the Energy
Conservation Act had no provision of that mandate which assess the policies administered through
BEE.

7
Energy Efficiency in municipal Services: Assessment of Building Level Energy Consumption
in Water Services: WP2 | CARBSE, CEPT University
The Electricity Act, 2003; National Electricity policy,2005 and National Tariff policy, 2006, describes
the importance of distribution companies in implementing the DSM programs(Mrudula Kelkar, Aditya
Chunekar, Sanjana Mulay, 2018) however it falls short in terms of giving an appropriate
implementation and evaluation strategy for DSM projects.
Alliance for an Energy Efficient Economy (AEEE), developed the State Energy Efficiency (EE) Index
for each of the 29 Indian states, under the guidance and leadership of BEE and NITI Aayog. The State
Energy Efficiency Index created 21 indicators that apprehend the initiatives at the state level and
growth of energy efficient measures in buildings. It covers the diverse factors such as Energy
Conservation Building Code (ECBC), schemes for building construction and energy effective
appliances, , energy savings, energy intensity and capacity building for institutions to support energy
efficiency in buildings (AEEE, 2018).
According to the “National Energy Policy” the change in behaviour towards energy consumption and
the substituted measure that retains the service level but reduce the requirement of energy, are the two
demand-side management intervention that should be given priority to reduce the energy consumption.
The former being referred as energy conservation and the latter as energy efficiency (NITI Aayog,
2017).
The National Mission on Enhanced Energy Efficiency (NMEEE) is based on the 2001 Electricity Law
and is also overseen by BEE was launched under the National Action Plan on Climate Change
Energy Conservation Bill was introduced in February 2000 and was passed in September 2001.
The key mandated of EC act 2001:
• It Specifies the process and energy use of an equipment that consumes, transmits,
produces and supply energy.
• There are very less standards for energy use by appliances and its categorization.
• It also specifies the prohibition of manufacturing, sale and import of equipment and
appliances which do not conform to the standards.
• It is required to specify the energy intensive industries to conduct the energy auditing
which should be carried out by official energy auditor.
• Act also imposes rule of preparing a proposition for effective energy use, its conservation
and implementation keeping in view of economic feasibility.
• According to local climatic condition it is suggested to prescribe the Energy Conservation
Building Codes(ECBC) for buildings construction.
• To create the awareness for energy conservation, state level designated agencies should
enforce the act.
8
Energy Efficiency in municipal Services: Assessment of Building Level
Energy Consumption in Water Services: WP2 | CARBSE, CEPT University
(NAPCC). National Mission on Sustainable habitat to integrate both climate action and mitigation into
urban planning and several activities that were conducted under AMRUT was envisaged under
NAPCC (TERI, 2019). According to NMEEE, the residential sector shows the enormous potential for
DSM projects by the replacement of appliances, whereas agriculture and Industry are the huge markets
for Demand Side management projects.
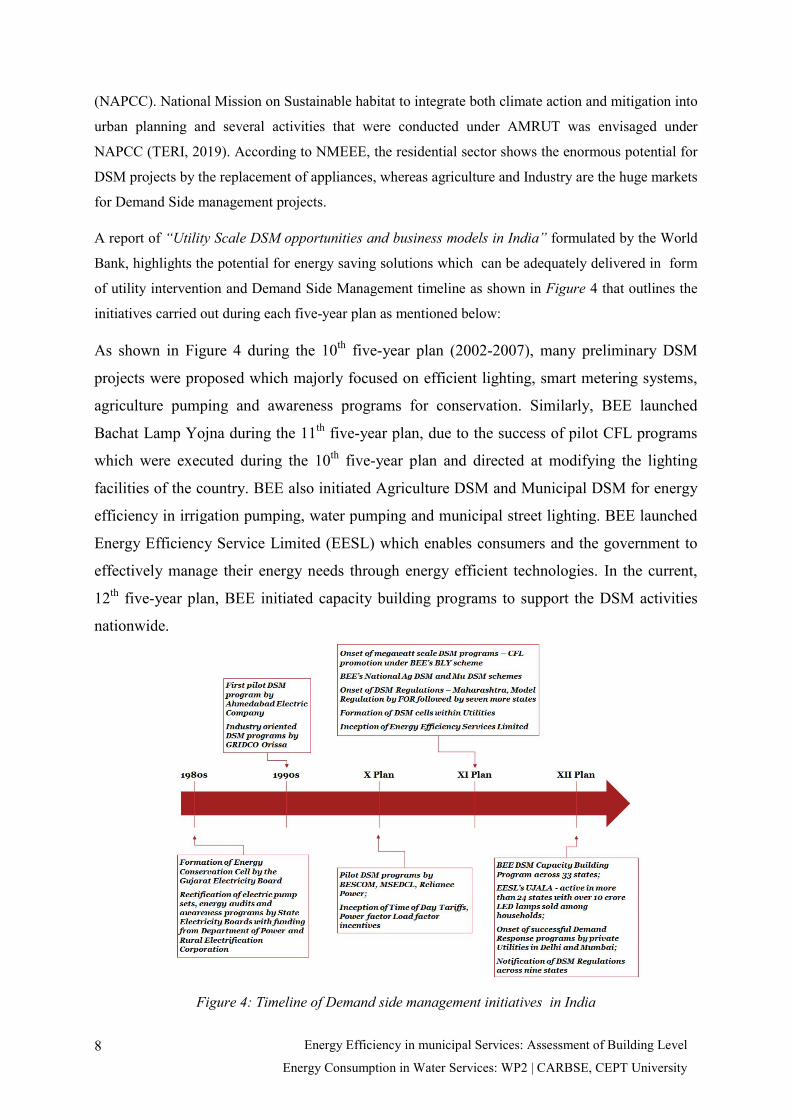
A report of “Utility Scale DSM opportunities and business models in India” formulated by the World
Bank, highlights the potential for energy saving solutions which can be adequately delivered in form
of utility intervention and Demand Side Management timeline as shown in Figure 4 that outlines the
initiatives carried out during each five-year plan as mentioned below:
As shown in Figure 4 during the 10th five-year plan (2002-2007), many preliminary DSM
projects were proposed which majorly focused on efficient lighting, smart metering systems,
agriculture pumping and awareness programs for conservation. Similarly, BEE launched
Bachat Lamp Yojna during the 11th five-year plan, due to the success of pilot CFL programs
which were executed during the 10th five-year plan and directed at modifying the lighting
facilities of the country. BEE also initiated Agriculture DSM and Municipal DSM for energy
efficiency in irrigation pumping, water pumping and municipal street lighting. BEE launched
Energy Efficiency Service Limited (EESL) which enables consumers and the government to
effectively manage their energy needs through energy efficient technologies. In the current,
12th five-year plan, BEE initiated capacity building programs to support the DSM activities
nationwide.
Figure 4: Timeline of Demand side management initiatives in India
9
Energy Efficiency in municipal Services: Assessment of Building Level Energy Consumption
in Water Services: WP2 | CARBSE, CEPT University
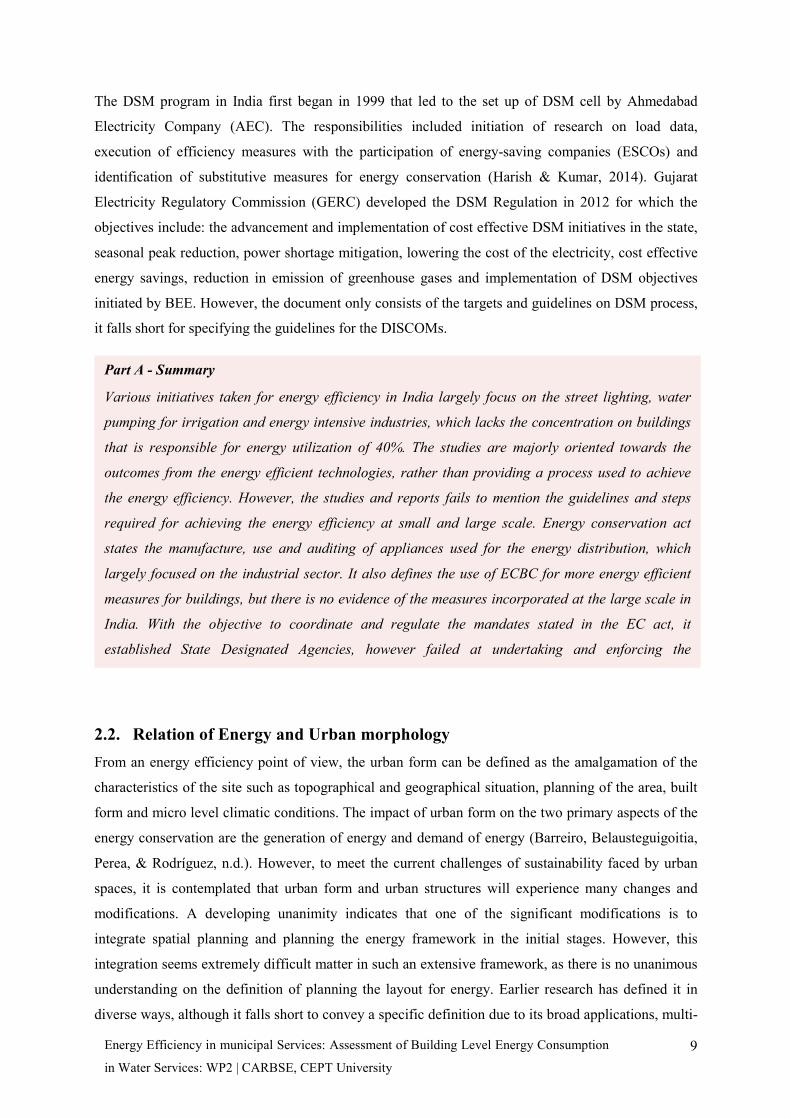
The DSM program in India first began in 1999 that led to the set up of DSM cell by Ahmedabad
Electricity Company (AEC). The responsibilities included initiation of research on load data,
execution of efficiency measures with the participation of energy-saving companies (ESCOs) and
identification of substitutive measures for energy conservation (Harish & Kumar, 2014). Gujarat
Electricity Regulatory Commission (GERC) developed the DSM Regulation in 2012 for which the
objectives include: the advancement and implementation of cost effective DSM initiatives in the state,
seasonal peak reduction, power shortage mitigation, lowering the cost of the electricity, cost effective
energy savings, reduction in emission of greenhouse gases and implementation of DSM objectives
initiated by BEE. However, the document only consists of the targets and guidelines on DSM process,
it falls short for specifying the guidelines for the DISCOMs.
2.2. Relation of Energy and Urban morphology From an energy efficiency point of view, the urban form can be defined as the amalgamation of the
characteristics of the site such as topographical and geographical situation, planning of the area, built
form and micro level climatic conditions. The impact of urban form on the two primary aspects of the
energy conservation are the generation of energy and demand of energy (Barreiro, Belausteguigoitia,
Perea, & Rodríguez, n.d.). However, to meet the current challenges of sustainability faced by urban
spaces, it is contemplated that urban form and urban structures will experience many changes and
modifications. A developing unanimity indicates that one of the significant modifications is to
integrate spatial planning and planning the energy framework in the initial stages. However, this
integration seems extremely difficult matter in such an extensive framework, as there is no unanimous
understanding on the definition of planning the layout for energy. Earlier research has defined it in
diverse ways, although it falls short to convey a specific definition due to its broad applications, multi-
Part A - Summary
Various initiatives taken for energy efficiency in India largely focus on the street lighting, water
pumping for irrigation and energy intensive industries, which lacks the concentration on buildings
that is responsible for energy utilization of 40%. The studies are majorly oriented towards the
outcomes from the energy efficient technologies, rather than providing a process used to achieve
the energy efficiency. However, the studies and reports fails to mention the guidelines and steps
required for achieving the energy efficiency at small and large scale. Energy conservation act
states the manufacture, use and auditing of appliances used for the energy distribution, which
largely focused on the industrial sector. It also defines the use of ECBC for more energy efficient
measures for buildings, but there is no evidence of the measures incorporated at the large scale in
India. With the objective to coordinate and regulate the mandates stated in the EC act, it
established State Designated Agencies, however failed at undertaking and enforcing the

10
Energy Efficiency in municipal Services: Assessment of Building Level
Energy Consumption in Water Services: WP2 | CARBSE, CEPT University
scale aspects and perspectives that it implies (Cajot, Peter, Bahu, Koch, & Maréchal, 2015). As
described by (Cajot et al., 2015) in the paper “ Energy planning in the urban context: challenges and
perspectives” Thery et al. underlines the common challenges: “Energy planning consists of
determining the ideal use of energy sources to accomplish the given energy demand. The major
complication of this issue lies in its multi scales aspect (geographical and temporal), but also in the
obligation to take into account the qualitative (environmental impact, social criterion) but also
quantitative (economic, technical) criteria”.
Buildings are significant users of water, materials and other types of equipment, in addition to being
large energy consumers as shown in Figure 5. There can be many building determinants that can
increase the water efficiency of the urban water systems, including installing low-flow faucets,
showers, toilets, washers, and repairing leaks along with energy efficiency (Becqué et al., 2015).
Figure 5: Economic lifespan of energy consuming equipments
Within planning research, it is commonly counterfeited that the location and design of residential areas
have a significant consequence for households’ consumption of energy. However, it is believed that
concrete planning and design makes it possible to achieve a more sustainable electricity consumption
pattern(Khalil, 2009). With respect to the location of a residential building, (Doherty, Nakanishi, Bai,
Meyers, & Ecosystems, 2009b) in their paper on the relationship of urban form, density and
morphology; mentions that the interrelation of energy consumption and spatial density is
contradicting. Also, the adaptations by urban form and spatial density relates to the increase or
decrease of household sizes, upsurge of dwellings and increment in the disposable income levels. The
concept of integrated neighborhood development describes the formation of energy clusters with
respect to neighborhood with similar characteristics. Large homogenous housing can be converted into

11
Energy Efficiency in municipal Services: Assessment of Building Level Energy Consumption
in Water Services: WP2 | CARBSE, CEPT University
“model energy – efficient districts” and provide good examples of consolidation(Beratungs- und
Service-Gesellschaft Umwelt mbH, 2011).
Also, earlier research indicates that concentrated urban form is proven to be more energy efficient
compared to sparse urban form (Große, Fertner, & Groth, 2016). A similar concept of compact urban
form has been explored in the study called “Energy and the form of cities: the counterintuitive impact
of disruptive technologies” by (Ahmadian et al., 2019) which outlines energy as a factor of urban
morphology, bring forward a notion that a compact form, especially for residential dwelling units can
conserve more energy. Additionally, there is an assumption that the energy is supplied from a central
source for both fuel and electricity. Therefore it can be stated that dispersed cities or towns will use a
significant amount of energy than compact cities as the distance traveled will be more for vehicles
(Guhathakurta & Williams, 2015). Also, due to the reduced ratio of surface area to the urban
structures, buildings will consume significantly less energy(Rode, Keim, Robazza, Viejo, & Schofield,
2014).
As mentioned by (Doherty et al., 2009) in their study of “Relationships between form,
morphology, density and energy” stated that urban morphology deals with the aggregation
and dimension of building types, whereas urban form refers to the major functional
organization of a city, which reflects the earlier and recent development. As defined in certain
studies urban form deal with the spatial organization and morphology defines the structure of
the built form. This configuration of the cities influences the indoor and outdoor climates and
have an impact on the energy use. The concept of density is defined based on the urban form
which deals with the overall functional organization of the city. whereas, urban morphology is
referred to as Urban structure that comprises of the proportions of built forms. The density
defined for various urban environments depends on the varied purpose, however, the
confusion arises due to the density being referred to either household or population per
hectare. However, most of the calculations are based on the assumption of number of people
residing in a household (Mike Jenks, n.d.). Many literature tries to identify the definition of
density in terms of high medium and low but such categories differ among different countries.
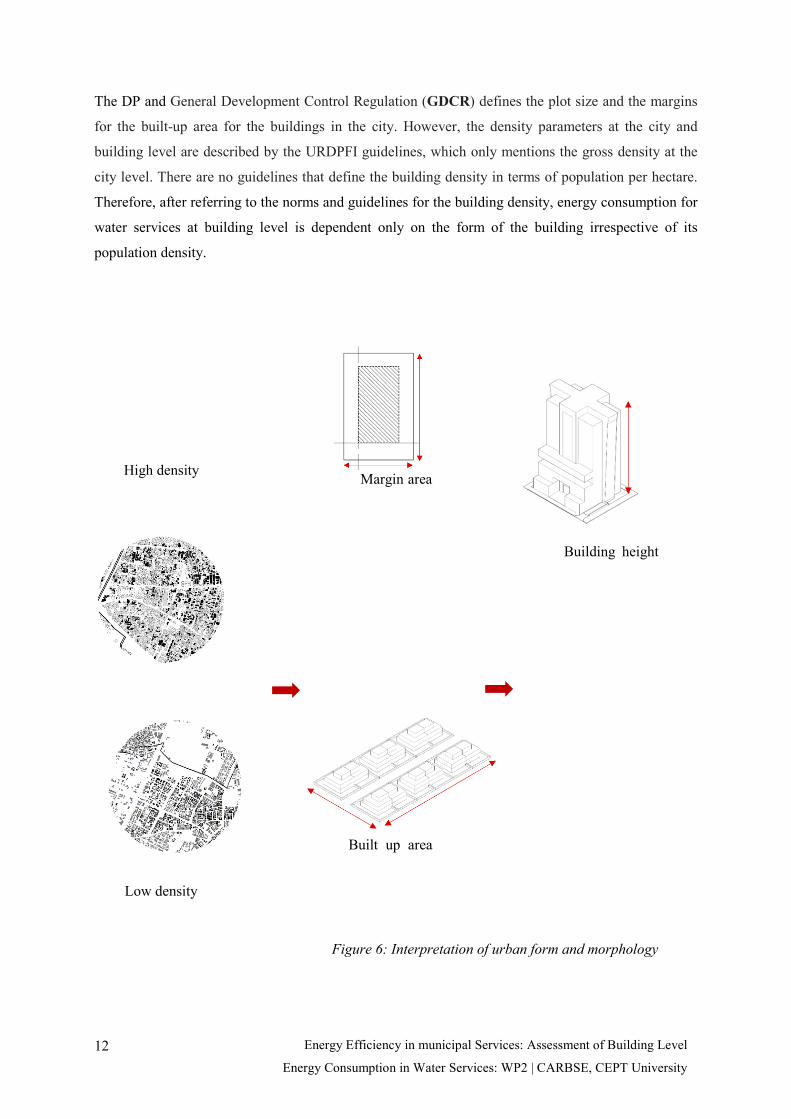
The relationship of urban form and energy consumption is contradictory, as the alteration in
the urban form widely refers to the change in demographics like the increasing number of
households, decreasing household size and population density (Doherty et al., 2009). This
study concentrates on the electricity consumption at the building level, hence it deals with the
urban morphology which accounts for the form and height of the building and not the urban
form of the city as represented in Figure 6.
12
Energy Efficiency in municipal Services: Assessment of Building Level
Energy Consumption in Water Services: WP2 | CARBSE, CEPT University
The DP and General Development Control Regulation (GDCR) defines the plot size and the margins
for the built-up area for the buildings in the city. However, the density parameters at the city and
building level are described by the URDPFI guidelines, which only mentions the gross density at the
city level. There are no guidelines that define the building density in terms of population per hectare.
Therefore, after referring to the norms and guidelines for the building density, energy consumption for
water services at building level is dependent only on the form of the building irrespective of its
population density.
Low density
Margin area
Built up area
Building height
Figure 6: Interpretation of urban form and morphology
High density

13
Energy Efficiency in municipal Services: Assessment of Building Level Energy Consumption
in Water Services: WP2 | CARBSE, CEPT University
Energy among the other resources is the utmost crucial resource that exists in urban surroundings. It is
a predominant source of greenhouse gas (GHG) emissions, which act as a primary source for the
change in environmental systems. Therefore, it becomes necessary to direct the use of energy and
substituting it with effective measures (Doherty, Nakanishi, Bai, Meyers, & Ecosystems, 2009a).
urban form can have a significant influence on CO2 emissions, for example, management of thermal
energy (heating and cooling); combined heat and power generation; and carbon dioxide contained in
roads, built form, and other infrastructural facilities(Marshall, 2008). There should be a holistic
approach to work towards the energy and reduction of GHG emissions by involving various
stakeholders and communities that will also help in spreading awareness for energy conservation.
(International Energy Agency (IEA), 2014).
Figure 7: Building sector emission by world region, projection of 2010 & 2030
14
Energy Efficiency in municipal Services: Assessment of Building Level
Energy Consumption in Water Services: WP2 | CARBSE, CEPT University
2.3. Energy Efficiency in municipal water services Due to the growth in urbanization, it becomes difficult for municipalities to provide drinking water to
the urban population in a cost-effective and energy efficient way(G. Rao & Sharma, 2012). Generally,
the major portion of the expense for electricity is spent towards the operation and maintenance of
water and sewage pumping, which contributes to the use of 40% to 60% of electricity. However, out
of the total revenue expenditure; 10-20% account for the cost of electricity (BEE, 2006). The
electricity charges on water supply pumping systems also occupies a major portion of the electricity
bills(M-tech & Khan, 2015).
Part B - Summary
Referring to the studies concerning about urban planning and energy, majorly highlights
the integration of urban form with the energy consumption, but has failed to provide a
practical solution of the integration. However, there are very less studies which focuses
on explaining the overall concept of energy efficient environment and incorporating with
urban fabric with more economically viable options. Various tools have been invented to
assess the energy consumption with respect to urban structure, for instance; a tool to
balance the planning of energy framework, a bilateral 3D model of urban form and
energy demand and detailed monitoring of energy supply and demand at individual
building level. However, these tools majorly deal with the consumption of energy, but fails
to consider the aspect of energy generation.
The discussion of energy consumption in buildings is majorly about the solar energy,
heat-energy demand, active passive cooling and other energy consuming equipment’s.
The studies specify the relation between urban morphology and energy consumption,
whereas it has not been compared to the municipal services like water supply and
electricity consumed in water pumping systems for various building typologies.
15
Energy Efficiency in municipal Services: Assessment of Building Level Energy Consumption
in Water Services: WP2 | CARBSE, CEPT University
In India the electrical energy consumption compared to national electricity production is over 5% for
the proportion of urban water utilities. The energy cost of the total operating cost for an urban water
supply system is usually between 50 to 60%. However, 90% of this electrical energy is consumed by
pumps in urban water supply systems (G. R. N. Rao, 2014). Through economically feasible and
energy saving options, the cost can be reduced to at least 25% in water supply systems. Effectiveness
in the delivery of water and energy is among the few profitable possibilities, that can meet its ever
increasing energy demand for those bearing the financial authority of local public services (BEE,
2006).
Through planning water pumping operations according to the daily electricity tariff, improvement in
the efficiency of the system can be achieved. Pumping the water in peak hours can help in managing
the operations and reduce the daily costs. This requires the application of analytical augmentation
methods and information on the anticipated water consumption so that the operations can be planned
in prior (Ramos, Vieira, & Covas, 2010).
Using solar energy for water pumping is an optimistic alternative to conventional electricity and diesel
based pumping systems to meet the demand of inadequacy in fuel and electricity. Except that the
source of the power is solar energy, the mechanism of the system is identical to any other standard
water pumping system. An accurately designed photovoltaic systems can result in significant long-
term cost savings as compared to traditional pumping systems. With the launch of Jawaharlal Nehru
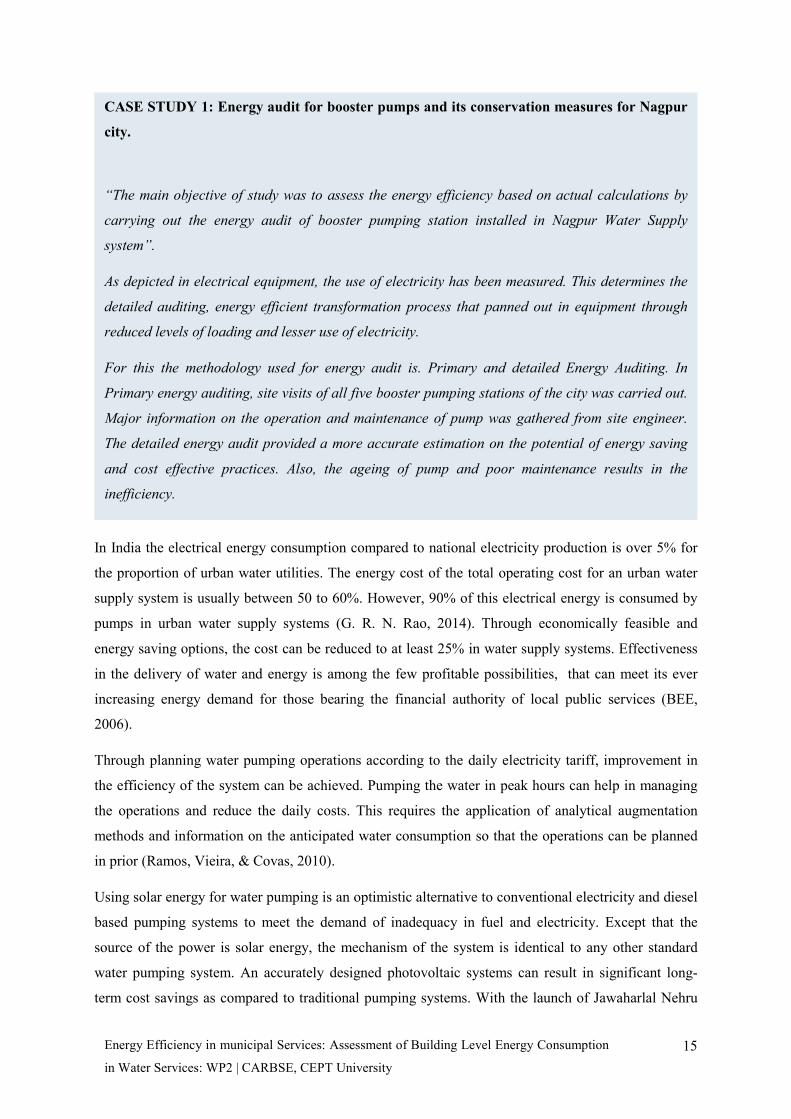
CASE STUDY 1: Energy audit for booster pumps and its conservation measures for Nagpur
city.
“The main objective of study was to assess the energy efficiency based on actual calculations by
carrying out the energy audit of booster pumping station installed in Nagpur Water Supply
system”.
As depicted in electrical equipment, the use of electricity has been measured. This determines the
detailed auditing, energy efficient transformation process that panned out in equipment through
reduced levels of loading and lesser use of electricity.
For this the methodology used for energy audit is. Primary and detailed Energy Auditing. In
Primary energy auditing, site visits of all five booster pumping stations of the city was carried out.
Major information on the operation and maintenance of pump was gathered from site engineer.
The detailed energy audit provided a more accurate estimation on the potential of energy saving
and cost effective practices. Also, the ageing of pump and poor maintenance results in the
inefficiency.
16
Energy Efficiency in municipal Services: Assessment of Building Level
Energy Consumption in Water Services: WP2 | CARBSE, CEPT University
National Solar Mission (JNNSM) in 2010, solar pumping systems were identified to be efficient
measures for future electricity demand (Chandel, Nagaraju Naik, & Chandel, 2015). The advantages
of photovoltaic water pumps include, effortless installation, reliable and automated operation and
avoid environmental pollution (Padmavathi & Daniel, 2011).
CASE STUDY 2: Installation of solar water pumps in Bangalore city.
A study of the Bangalore city for installing the solar water pumps signifies the importance of solar
energy over conventional use of electricity. It was observed that the maximum electricity was
consumed in the morning for two hours, which was eliminated by replacing pump with the solar
pumps. The results obtained suggested that the electricity of 55.5 KW can be reduced if 150 out of
216 households replaces the water pumps with solar water pumps.
The data gathered determines that PV panels of 60 Wp to 500 Wp are sufficient for residential
buildings to reduce the electricity cost in Bangalore city. Additionally, these installations are
found to be most effective in order to reduce the load in the peak time and avoids the loses in the
distribution lines.
Viewing from the demand side management, the solar water pumps reduces the electrical energy
demand by 14,610 KWh/year.

17
Energy Efficiency in municipal Services: Assessment of Building Level Energy Consumption
in Water Services: WP2 | CARBSE, CEPT University
Part C – Summary
Some of the smart building energy solutions like smart metering, smart grid, smart lighting, solar
rooftop is already being implemented in Indian cities. However, there are very less studies which
focuses on EE focusing on the building level energy consumption for water and waste water
pumping. Certain initiatives like replacement of solar pumps with water pumps has been observed,
which has great energy saving potential. Also, a case study of Nagpur booster pumps also suggest
that the regular auditing of pumping system can help in enhancing the water pumping system and
also shows the potential of changing the existing equipments with the energy efficient equipments
to increase the energy saving potential.
2.4. Key takeaways Transformation of energy efficiency sector of India will require an integration of energy with various
sectors, which can only be achieved by collaborative efforts of various governments, utilities and
community participation. Based on the studies referred to in this literature, there are many fall back
CASE STUDY 3: Water Supply and financial feasibility in Residential Buildings.
The study explores the convenience of water pumping systems in residential building of the
Zaragoza city, in which the energy saving potential and financial recovery was estimated. The
major building typology of the city is block of flats and different structures were selected to carry
out the study.
The samples were extracted from 151 buildings, and for each building the pressure was calculated
which has direct municipal grid connection.
The steps carried out to calculate the potential of energy saving was: 1. The consumption of
electricity in KWh/m2 for individual building 2. Average height of the building up till water is
raised 3. Operational design of water pumping unit. The aim was to authorize the buildings that
can eradicate the pumping unit, that should add a pressurized tank and an adapted pumping
system for water supply to upper level, and finally determine the buildings that cannot be upgraded
by modifications. The conclusion drawn from the study is that, the buildings with the greater height
has higher energy saving potential than that of the smaller height as the pressure of the mains in
hi h b ildi b f f ll th th t f th b ildi ith ll h i ht

18
Energy Efficiency in municipal Services: Assessment of Building Level
Energy Consumption in Water Services: WP2 | CARBSE, CEPT University
criteria like lack of awareness, aversion to risk, lack of implementation of the project at a larger scale
and financial viability leads to loss in energy and increases the carbon footprints. Demand Side
Management plays an important role in accomplishing the energy conservation targets and is crucial
for a sustainable future. However, various initiatives taken for Energy Efficiency in India are for
lighting, pumping in irrigation and water pumping, which lack the concentration on the building sector
which constitutes the highest energy consumption. Many state Designated agencies were established
under BEE, to enforce the mandates of the EC act, but due to the lack of responsibility taken by such
agencies led to poor supervision and lack of implementation of regulations. There should be more
specific regulations for the evaluation of the programs for a better understanding of the energy saving
potential. The data related to the progress of work on such programs and policies should be made
available to the public to be useful for further interventions.
Urban morphology plays an important role in energy conservation and therefore there is a need to
integrate energy planning at the earlier stage of urban planning. However, there is no evidence of the
studies or initiatives that leads to the efficient integration of energy and urban planning. The energy
consumption related to water end uses in a building should be incorporated along with urban structure
and a holistic approach to reduce losses. Certain studies investigate the factors that affect the energy
use at the building level, which include socio-economic factors, urban morphology factors and
appliance factors. This study focuses on the urban morphology factors which affect the energy
consumption like dwelling type, age of the building, floor space area and the height of the building.
These factors are summarized in the reviewed studies for the overall energy consumption of the
buildings. However, this particular study only deals with the electricity used for pumping the water
from an underground water tank to an overhead tank. These factors are further explored about its
effect on the electricity used for water pumping. Further, as the energy saving potential in sectors like
water is huge, while the demand of the service is more. As suggested in certain studies, energy
consumed in this service can be reduced to a great extent with the proper use of equipment and regular
auditing. Many cities in India face the problem of water loss as well as energy loss due to a lack of
metered connection. However, earlier research indicates that the initiatives like replacement of regular
water pumps with solar pumps show an enormous potential in the market for cost and energy saving.
Although, this study is confined to the inspection of the energy used for the water service in the
building and change of its consumption in align to the factors affecting its consumption.
19
Energy Efficiency in municipal Services: Assessment of Building Level Energy Consumption
in Water Services: WP2 | CARBSE, CEPT University
3. Building level energy consumption in water pumping – A case
of Ahmedabad This study focuses on the electricity consumption for water pumping in residential buildings and
collates evidences that demonstrates whether urban form affects the energy consumption at buildings
level. There are studies which determine that the “Urban form” and “Urban morphology” affects the
energy use in the city, which is explored in this study by examining the various urban factors.
Therefore, to understand the consumption pattern various buildings of different typologies like
residential, commercial, and institutional buildings were surveyed which gave an overall result of per
capita use of electricity and the efficiency of water pumping service. Further, the research emphasized
on the residential building and 150 samples were collected with a stratified sampling methodology
which comprised of low rise, medium-rise and high-rise typology. The results obtained from the
surveys for per capita energy consumption was compared with various urban and other factors to form
a relation of urban form and energy consumption. Based on the studies reviewed for the relationship of
urban form and energy consumption, various urban factors like the height of the building, population
density, area of the building, building age and the operational time of pump has been compared with
the per capita electricity used for water pumping in this buildings. The analysis is carried out using the
tool of correlation and regression method. This section comprises of the pilot surveys done for the
various building typology like commercial, institutional, and residential as mentioned above.
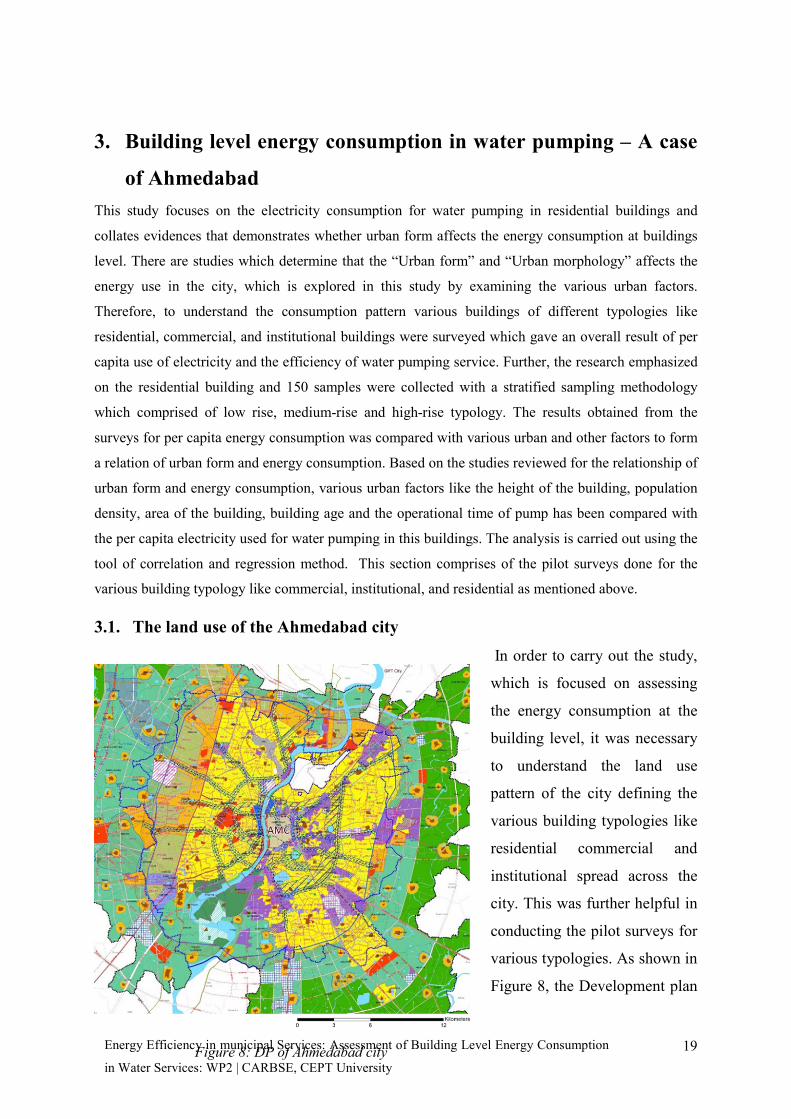
3.1. The land use of the Ahmedabad city In order to carry out the study,
which is focused on assessing
the energy consumption at the
building level, it was necessary
to understand the land use
pattern of the city defining the
various building typologies like
residential commercial and
institutional spread across the
city. This was further helpful in
conducting the pilot surveys for
various typologies. As shown in
Figure 8, the Development plan
Figure 8: DP of Ahmedabad city
20
Energy Efficiency in municipal Services: Assessment of Building Level
Energy Consumption in Water Services: WP2 | CARBSE, CEPT University
of Ahmedabad presents the growth pattern and predominant land use of the city. There is a
significant residential area and bit of institutional on the western part of the city, whereas the
eastern part has predominantly residential and industrial areas. The commercial area is at the
center of the city, which has a majority commercial uses of mixed commercial (43%) and
retail shopping (38%). However, there is a variation in residential typologies based on the
consumption, density, design of the building, height of the building and age of the structure.
The majority of the residential typology on the east side is a low rise, high density in the core
city and the west side has a high rise, low density bungalows. Hence, the three major land use
has been taken into consideration for the pilot surveys which are residential, commercial and
institutional.
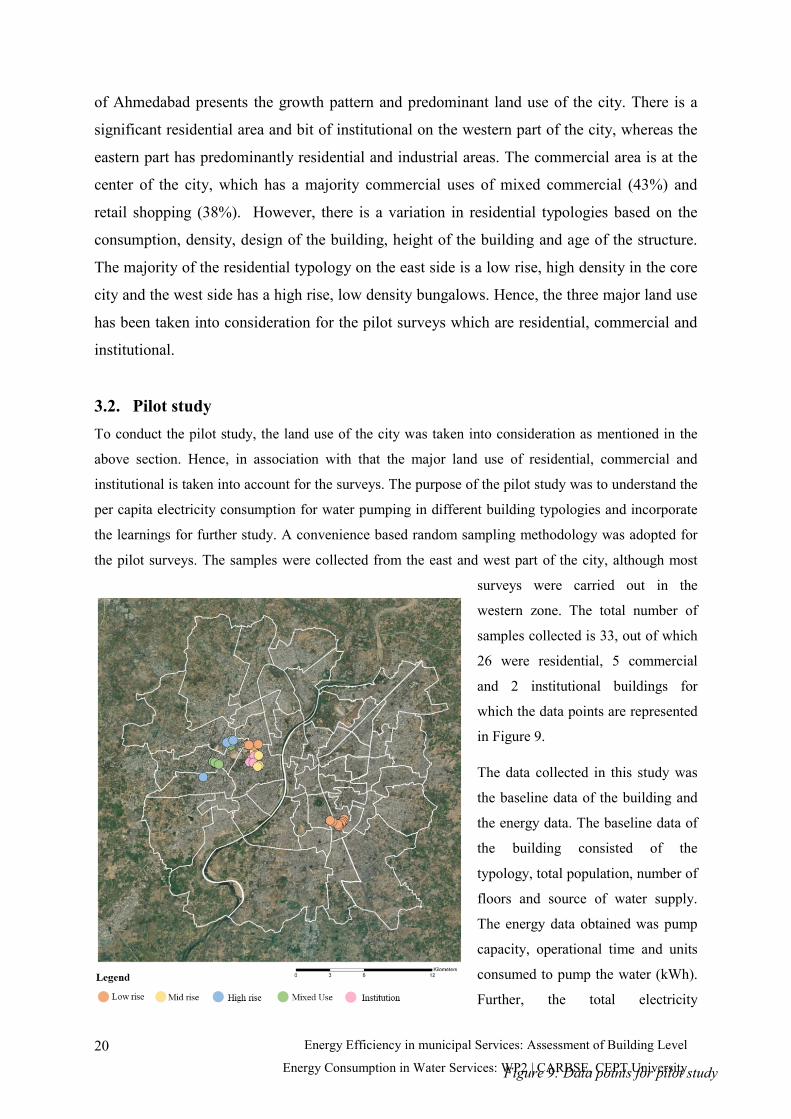
3.2. Pilot study To conduct the pilot study, the land use of the city was taken into consideration as mentioned in the
above section. Hence, in association with that the major land use of residential, commercial and
institutional is taken into account for the surveys. The purpose of the pilot study was to understand the
per capita electricity consumption for water pumping in different building typologies and incorporate
the learnings for further study. A convenience based random sampling methodology was adopted for
the pilot surveys. The samples were collected from the east and west part of the city, although most
surveys were carried out in the
western zone. The total number of
samples collected is 33, out of which
26 were residential, 5 commercial
and 2 institutional buildings for
which the data points are represented
in Figure 9.
The data collected in this study was
the baseline data of the building and
the energy data. The baseline data of
the building consisted of the
typology, total population, number of
floors and source of water supply.
The energy data obtained was pump
capacity, operational time and units
consumed to pump the water (kWh).
Further, the total electricity
Figure 9: Data points for pilot study
21
Energy Efficiency in municipal Services: Assessment of Building Level Energy Consumption
in Water Services: WP2 | CARBSE, CEPT University
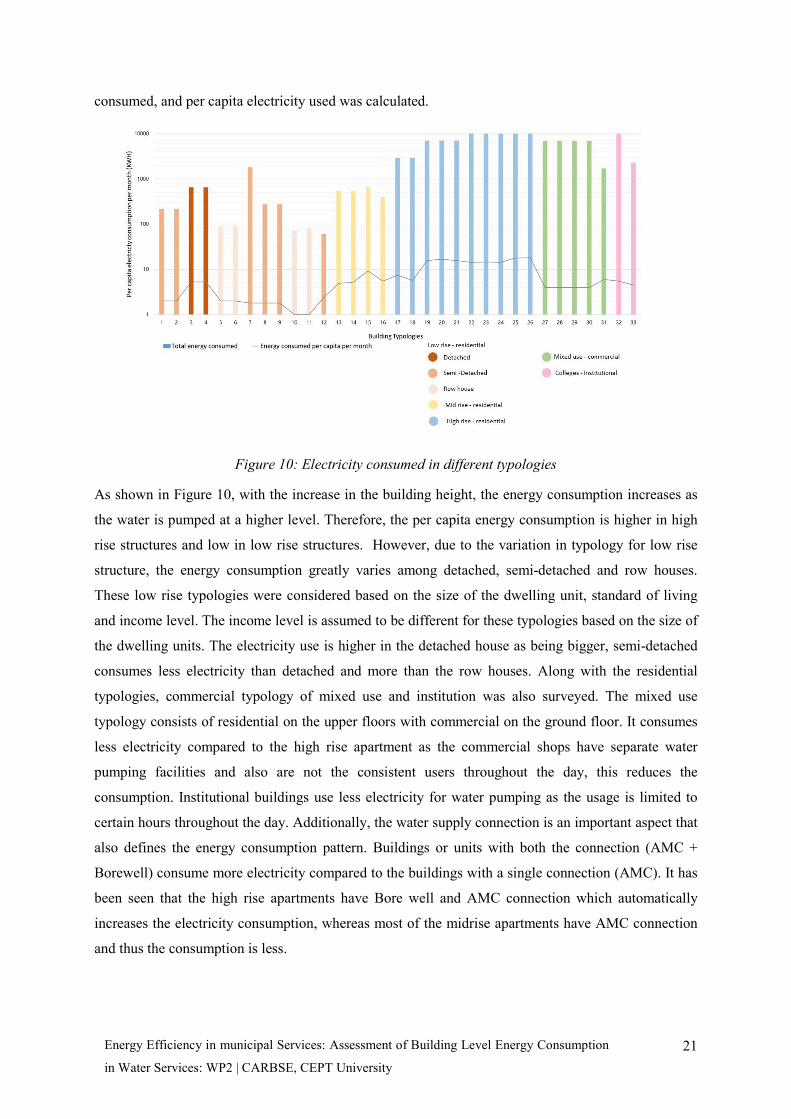
consumed, and per capita electricity used was calculated.
Figure 10: Electricity consumed in different typologies
As shown in Figure 10, with the increase in the building height, the energy consumption increases as
the water is pumped at a higher level. Therefore, the per capita energy consumption is higher in high
rise structures and low in low rise structures. However, due to the variation in typology for low rise
structure, the energy consumption greatly varies among detached, semi-detached and row houses.
These low rise typologies were considered based on the size of the dwelling unit, standard of living
and income level. The income level is assumed to be different for these typologies based on the size of
the dwelling units. The electricity use is higher in the detached house as being bigger, semi-detached
consumes less electricity than detached and more than the row houses. Along with the residential
typologies, commercial typology of mixed use and institution was also surveyed. The mixed use
typology consists of residential on the upper floors with commercial on the ground floor. It consumes
less electricity compared to the high rise apartment as the commercial shops have separate water
pumping facilities and also are not the consistent users throughout the day, this reduces the
consumption. Institutional buildings use less electricity for water pumping as the usage is limited to
certain hours throughout the day. Additionally, the water supply connection is an important aspect that
also defines the energy consumption pattern. Buildings or units with both the connection (AMC +
Borewell) consume more electricity compared to the buildings with a single connection (AMC). It has
been seen that the high rise apartments have Bore well and AMC connection which automatically
increases the electricity consumption, whereas most of the midrise apartments have AMC connection
and thus the consumption is less.
22
Energy Efficiency in municipal Services: Assessment of Building Level
Energy Consumption in Water Services: WP2 | CARBSE, CEPT University
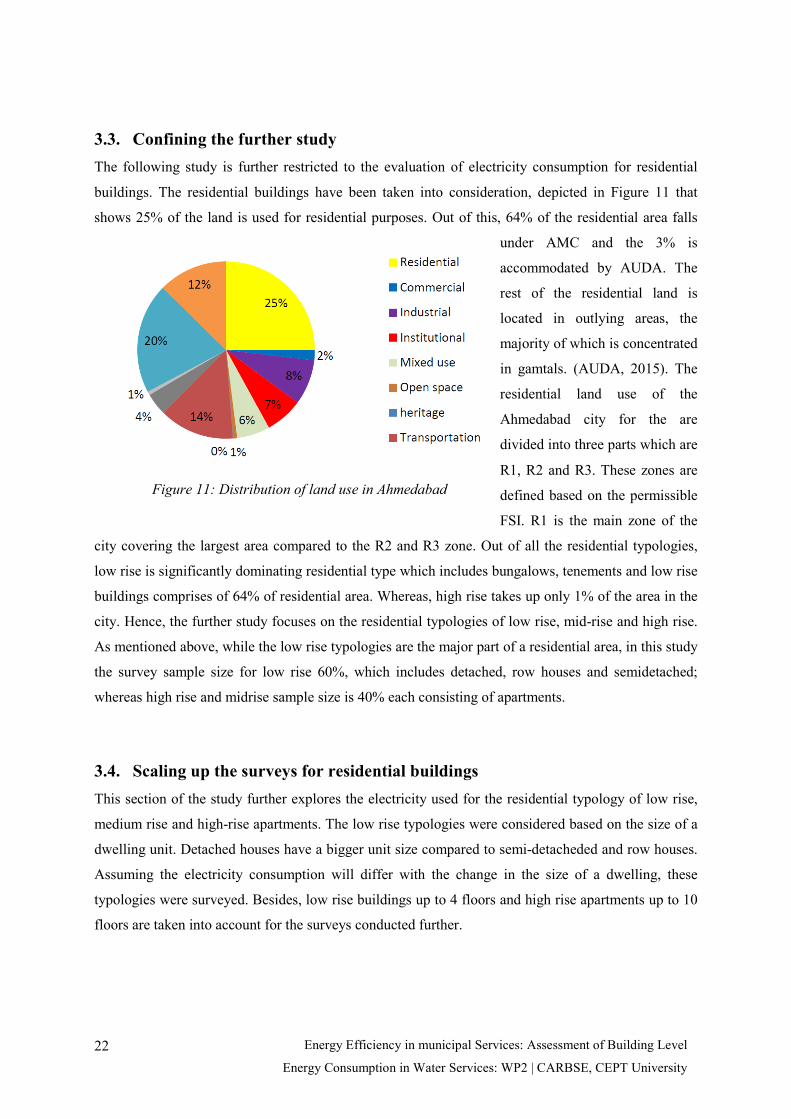
3.3. Confining the further study The following study is further restricted to the evaluation of electricity consumption for residential
buildings. The residential buildings have been taken into consideration, depicted in Figure 11 that
shows 25% of the land is used for residential purposes. Out of this, 64% of the residential area falls
under AMC and the 3% is
accommodated by AUDA. The
rest of the residential land is
located in outlying areas, the
majority of which is concentrated
in gamtals. (AUDA, 2015). The
residential land use of the
Ahmedabad city for the are
divided into three parts which are
R1, R2 and R3. These zones are
defined based on the permissible
FSI. R1 is the main zone of the
city covering the largest area compared to the R2 and R3 zone. Out of all the residential typologies,
low rise is significantly dominating residential type which includes bungalows, tenements and low rise
buildings comprises of 64% of residential area. Whereas, high rise takes up only 1% of the area in the
city. Hence, the further study focuses on the residential typologies of low rise, mid-rise and high rise.
As mentioned above, while the low rise typologies are the major part of a residential area, in this study
the survey sample size for low rise 60%, which includes detached, row houses and semidetached;
whereas high rise and midrise sample size is 40% each consisting of apartments.
3.4. Scaling up the surveys for residential buildings This section of the study further explores the electricity used for the residential typology of low rise,
medium rise and high-rise apartments. The low rise typologies were considered based on the size of a
dwelling unit. Detached houses have a bigger unit size compared to semi-detacheded and row houses.
Assuming the electricity consumption will differ with the change in the size of a dwelling, these
typologies were surveyed. Besides, low rise buildings up to 4 floors and high rise apartments up to 10
floors are taken into account for the surveys conducted further.
Figure 11: Distribution of land use in Ahmedabad

23
Energy Efficiency in municipal Services: Assessment of Building Level Energy Consumption
in Water Services: WP2 | CARBSE, CEPT University
3.4.1. Sampling methodology
A stratified sampling methodology was adopted to select the areas for survey points based on the
land use of Ahmedabad city. The survey samples were selected considering the predominant typology
of residential buildings in the western and eastern parts of the city. Considering the DP of Ahmedabad
in the initial level to define the land use followed by the footprints of the buildings of the city to
determine the sample data points. However, the urban form of the city also plays an important role in
the energy consumption along with the land use.
3.4.2. Data collection methodology
As specified in the
Development Plan report by
AUDA, there is a variation
in residential typologies on
the eastern and western
sides of the city. Therefore,
to cover all the typologies,
grids with the building
footprints in west and east
zone has been considered
for conducting the surveys
as shown in Figure 12. The
grid 4,5 and 6 forms the
west part of the city that
consists of mid-rise, high
rise apartments, detached
and semi-detached
bungalows as predominant typologies, shown in Figure 14. Whereas, The grids representing the
eastern part of the city which are 1 and 8 have the semi-detached and row houses as the major
typology as shown in Figure 13. Hence a maximum number of samples for mid-rise and high rise
apartments were surveyed from the western part of the city. Whereas, low rise structures of semi-
detached and detached households were surveyed from the western part and row houses as well as few
semi-detached households were surveyed from the eastern part of the city.
Figure 12: Building footprints of Ahmedabad

24
Energy Efficiency in municipal Services: Assessment of Building Level
Energy Consumption in Water Services: WP2 | CARBSE, CEPT University
3.4.3. Measuring of the electricity consumed for pumping water
The electricity consumed for pumping the water from an underground water tank to an overhead tank
was measured using an instrument called clamp meter. The clamp meter is an electrical test tool used
to measure current in the form of voltage and ampere. The readings were taken using this instrument
for the motor starters having a pump capacity of 1-2 HP, specifically used for pumping water in low
rise households, shown in Figure 15. However, the measurements were taken directly in case of the
buildings with the motor starter panel for pump capacity of 7-15 HP, particularly used in mid-rise and
high rise apartments, as shown in Figure 16. The measurements were taken for the units consumed in a
day, which has been further calculated for the per capita electricity consumed per month.
Figure 14: Grid No. 4, west zone
Figure 15: Motor starter for the pump capacity of 1-5 HP
Figure 16: Motor starter for the pump capacity of 7-15 HP
Figure 13: Grid No.8, east zone
25
Energy Efficiency in municipal Services: Assessment of Building Level Energy Consumption
in Water Services: WP2 | CARBSE, CEPT University
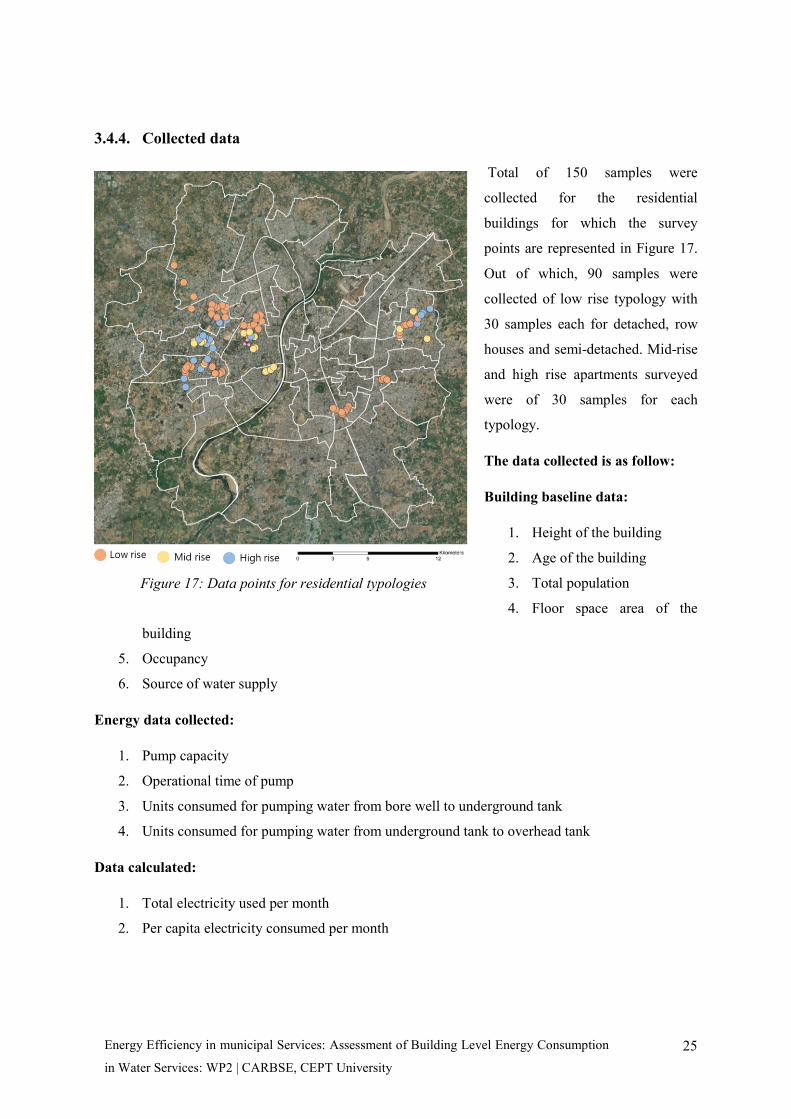
3.4.4. Collected data
Total of 150 samples were
collected for the residential
buildings for which the survey
points are represented in Figure 17.
Out of which, 90 samples were
collected of low rise typology with
30 samples each for detached, row
houses and semi-detached. Mid-rise
and high rise apartments surveyed
were of 30 samples for each
typology.
The data collected is as follow:
Building baseline data:
1. Height of the building
2. Age of the building
3. Total population
4. Floor space area of the
building
5. Occupancy
6. Source of water supply
Energy data collected:
1. Pump capacity
2. Operational time of pump
3. Units consumed for pumping water from bore well to underground tank
4. Units consumed for pumping water from underground tank to overhead tank
Data calculated:
1. Total electricity used per month
2. Per capita electricity consumed per month
Figure 17: Data points for residential typologies

26
Energy Efficiency in municipal Services: Assessment of Building Level
Energy Consumption in Water Services: WP2 | CARBSE, CEPT University
Note: The electricity supplied in Ahmedabad is directly from Torrent Power Limited, therefore this
study does not demand the sample collection for various electricity supply sources.
Statistical method used for data analysis
The method of Correlation and Regression is used for analysing the relationship of per capita
electricity consumption with the factor affecting its consumption.
Correlation – This method is applied to quantify as an association between two continuous variables,
out of which one is the dependent variable and another is the independent variable. The correlation
coefficient is measured on a scale of +1 to -1. With the increase in one variable, if another variable
also increases then it determines the positive correlation; whereas with the decrease in one variable, if
another increases then it is a negative correlation. The absolute absence of the correlation is
represented by 0. Figure 18 shows a graphical representation of the correlation.
Figure 18: Graphical representation of correlation
Regression – the relationship is represented by an algebraic equation called the regression equation. If
the Y is a dependent variable and X is the independent variable than the regression equation means
that the Y is the function of X. This representation is shown by the line on the scatter plot diagram.

27
Energy Efficiency in municipal Services: Assessment of Building Level Energy Consumption
in Water Services: WP2 | CARBSE, CEPT University
4. Assessment of the data in comparison to urban morphology The energy demand in buildings varies according to the standard of living, climate, geography, culture
and also depends on the type of use, age, ownership and location. Figure 19 shows the percentage of
the electricity used for water pumping for all the typologies. The electricity consumed for water
pumping in the low rise varies from 2-4%, whereas it is almost four times more in the mid-rise and
high rise apartments. This could be due to increase in height, the electricity used for pumping also
increases. Mid-rise and high rise apartments being higher is size consumes more energy. Also, the
electricity used in the low rise for water pumping is very less compared to the total electricity used.
Nevertheless, electricity consumption for water pumping is higher than the overall electricity use in
mid-rise and high rise typology.
Figure 19: Percentage of electricity used in water pumping for residential buildings
This study concentrates only on the small fraction of the electricity used for water pumping. Further,
the data has been analyzed by comparing the various urban parameters with the per capita energy
consumption to understand the correlation of those relationships among the residential typologies.
Urban morphology affecting the energy consumption at the building level
28
Energy Efficiency in municipal Services: Assessment of Building Level
Energy Consumption in Water Services: WP2 | CARBSE, CEPT University
Various factors affect the electrical energy consumption at the household level for water pumping
which is categorized into urban factors like are residential typology, the height of the building, number
of person in the household, floor space area of household and other factors like age of the building and
operational time of pump.
Urban factors:
1. Height of the building – It is one of the significant factors that affect the electricity
consumption in households for water pumping. Water pumping consumes more units (kWh)
to pump the water from ground level to overhead tank as the height of the building increases.
This relationship has been further explained in the study considering all the residential
typologies.
2. Total population – Household size or family size is an important factor for evaluating the
electricity consumption. The increase or decrease of population affects the energy
consumption.
3. Floor space area – Building floor space area is used to understand the variation in the
dwelling unit size and its impact on the per capita energy consumption.
Other factors:
1. Age of the building – As the age of the building increases, the installations for the services
also get older which affects the energy consumption. Therefore, this factor has been
considered to better understand how age has an impact on different typologies.
2. Operational time of pump and source of water supply – The operational time of the pump
varies with different residential typologies. For instance, low rise houses operate the pump for
an average of 10-15 minutes, whereas high rise buildings use it for more than 6-7 hours. Also,
the households with only AMC connection of water supply consumed less energy compared to
the houses with both the connection of AMC and Borewell.
Therefore, these factors have been compared with the per capita energy consumption for all the
residential typology in the further study.
4.1. How the height of the building influences the electricity consumption for
water pumping? The hypothesis suggests that with an increase in height of the building the electricity use increases as
mentioned in the above section. A similar relationship has been demonstrated in earlier literature. This
relation has been represented in a study by Myors, O’Leary, and Helstroom (2005), in which the
energy data for 3854 houses of different typology in Australia was used to measure the energy
consumption. The results indicated that, the high rise buildings are the least energy efficient compared

29
Energy Efficiency in municipal Services: Assessment of Building Level Energy Consumption
in Water Services: WP2 | CARBSE, CEPT University
to detached houses which are more energy efficient. However, as reported by (Heinonen & Junnila,
2014) in their research about the “Residential energy consumption patterns and the overall housing
energy requirements of urban and rural households in Finland” describes that the low rise houses
consume less energy compared to the high rise buildings based on the electricity used per person
despite of the climate change. The comparable results were also found by (I. Hamilton et al., 2017) ”
Impact of Building morphology on energy demand in London”, concluded that the high rise buildings
consume more energy than the low rise households. The referred studies have considered the overall
energy consumption for residential buildings, but relates to this study that the electrical energy
consumption for the water pumping may increase with the increase in the height just as the other
energy consumption at the building level.
Figure 20: Per capita electricity consumption in residential typologies
To examine this hypothesis, the total energy consumption for all the residential typology has been
measured and further calculated the per capita energy consumption in order to determine the energy
usage pattern in the households. As shown in Figure 20 the electricity consumption differs in different
typology based on the height of the building. Among the low rise typologies detached houses
consumed more electricity due to the stand of living as well as the size of the building compared to the
semi-detached and row houses. However, the results show with the increase in the height of the
building the electricity consumption also increases. Hence, it can be argued that the height of the
building has a major impact on the electricity consumption for pumping the water from ground level to
overhead tank.

30
Energy Efficiency in municipal Services: Assessment of Building Level
Energy Consumption in Water Services: WP2 | CARBSE, CEPT University
4.2. Does the total population matter when compared to the per capita electricity
consumption? The total population considered for this study is at the society level and the person per household has
been assumed constant of 4.5 persons per household, as suggested in URDPFI guidelines. The
increase or decrease in the total population depends on the number of households in the society or an
apartment. It is obvious that with the increase in total population the per capita electricity consumption
decreases, however, the relationship obtained shows variation across the typologies.
Figure 21: Per capita consumption of electricity compared to the total population in low rise
The correlation coefficient obtained is -0.3 for the low rise as shown in Figure 21 which indicates a
weak negative relationship. As the population is higher compared to the electricity used, per capita
electricity consumption decreases with an increase in population, hence it shows a weak negative
relationship.
Figure 22: Per capita consumption of electricity compared to the total population in mid-rise
31
Energy Efficiency in municipal Services: Assessment of Building Level Energy Consumption
in Water Services: WP2 | CARBSE, CEPT University
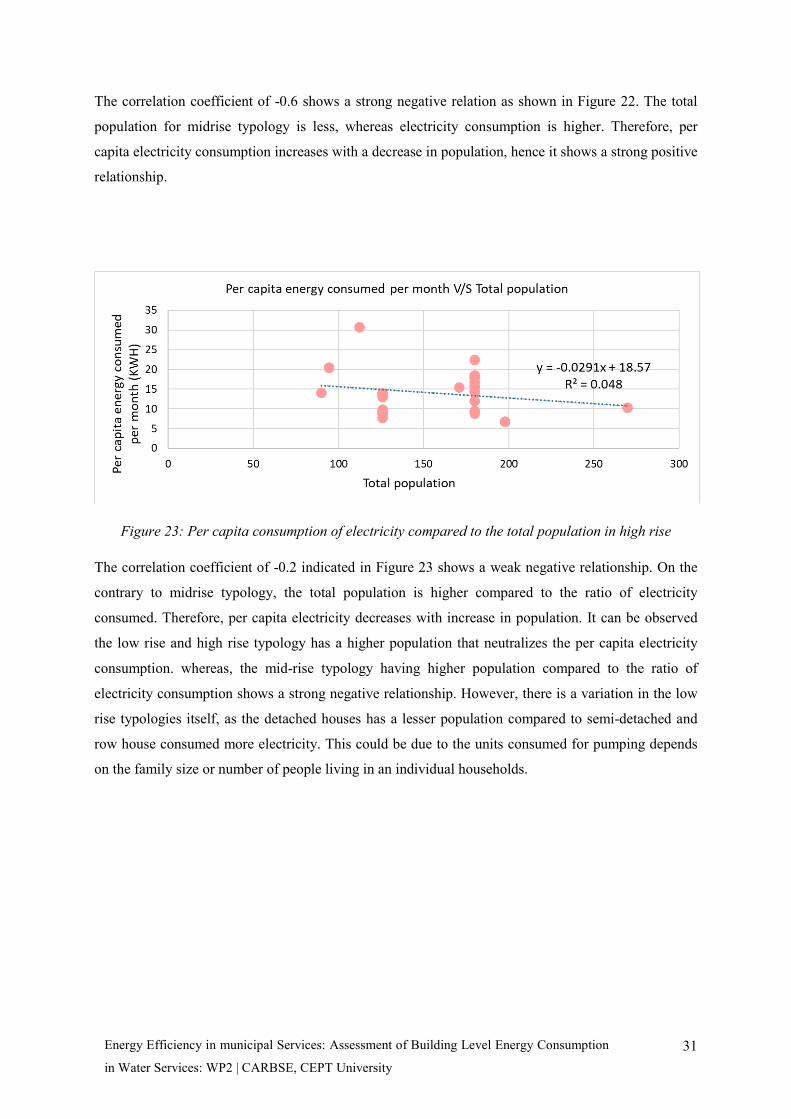
The correlation coefficient of -0.6 shows a strong negative relation as shown in Figure 22. The total
population for midrise typology is less, whereas electricity consumption is higher. Therefore, per
capita electricity consumption increases with a decrease in population, hence it shows a strong positive
relationship.
Figure 23: Per capita consumption of electricity compared to the total population in high rise
The correlation coefficient of -0.2 indicated in Figure 23 shows a weak negative relationship. On the
contrary to midrise typology, the total population is higher compared to the ratio of electricity
consumed. Therefore, per capita electricity decreases with increase in population. It can be observed
the low rise and high rise typology has a higher population that neutralizes the per capita electricity
consumption. whereas, the mid-rise typology having higher population compared to the ratio of
electricity consumption shows a strong negative relationship. However, there is a variation in the low
rise typologies itself, as the detached houses has a lesser population compared to semi-detached and
row house consumed more electricity. This could be due to the units consumed for pumping depends
on the family size or number of people living in an individual households.
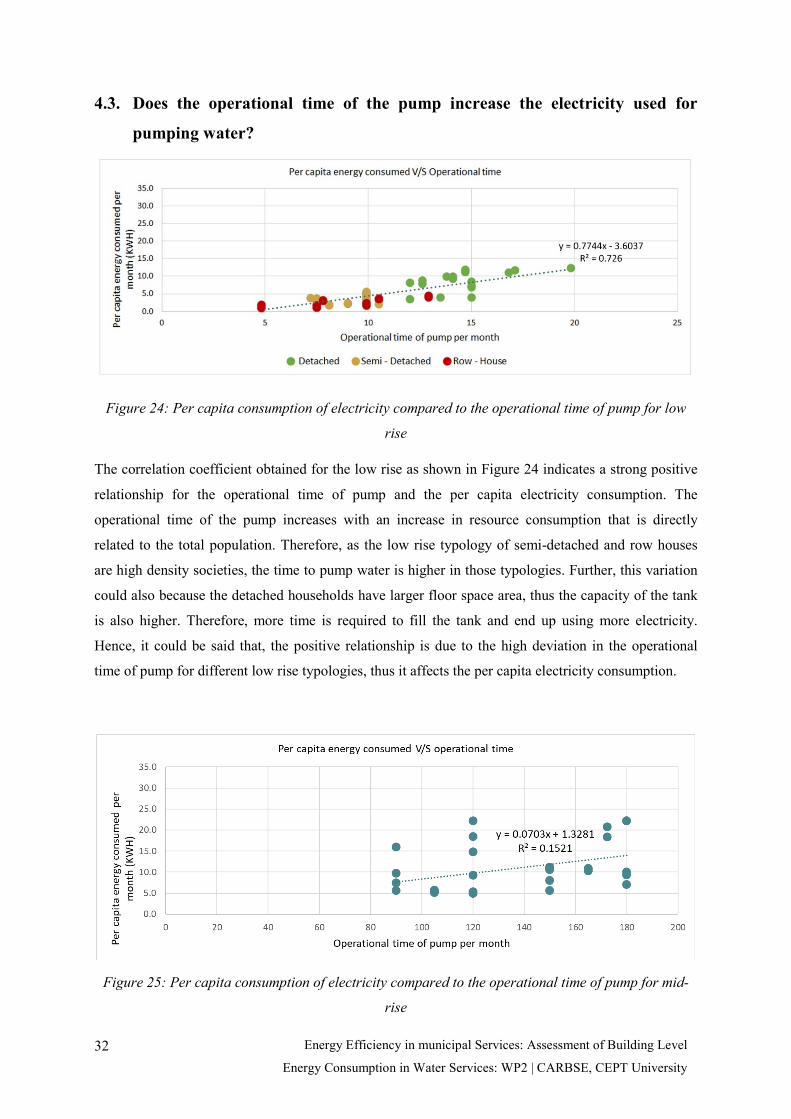
32
Energy Efficiency in municipal Services: Assessment of Building Level
Energy Consumption in Water Services: WP2 | CARBSE, CEPT University
4.3. Does the operational time of the pump increase the electricity used for
pumping water?
Figure 24: Per capita consumption of electricity compared to the operational time of pump for low
rise
The correlation coefficient obtained for the low rise as shown in Figure 24 indicates a strong positive
relationship for the operational time of pump and the per capita electricity consumption. The
operational time of the pump increases with an increase in resource consumption that is directly
related to the total population. Therefore, as the low rise typology of semi-detached and row houses
are high density societies, the time to pump water is higher in those typologies. Further, this variation
could also because the detached households have larger floor space area, thus the capacity of the tank
is also higher. Therefore, more time is required to fill the tank and end up using more electricity.
Hence, it could be said that, the positive relationship is due to the high deviation in the operational
time of pump for different low rise typologies, thus it affects the per capita electricity consumption.
Figure 25: Per capita consumption of electricity compared to the operational time of pump for mid-
rise
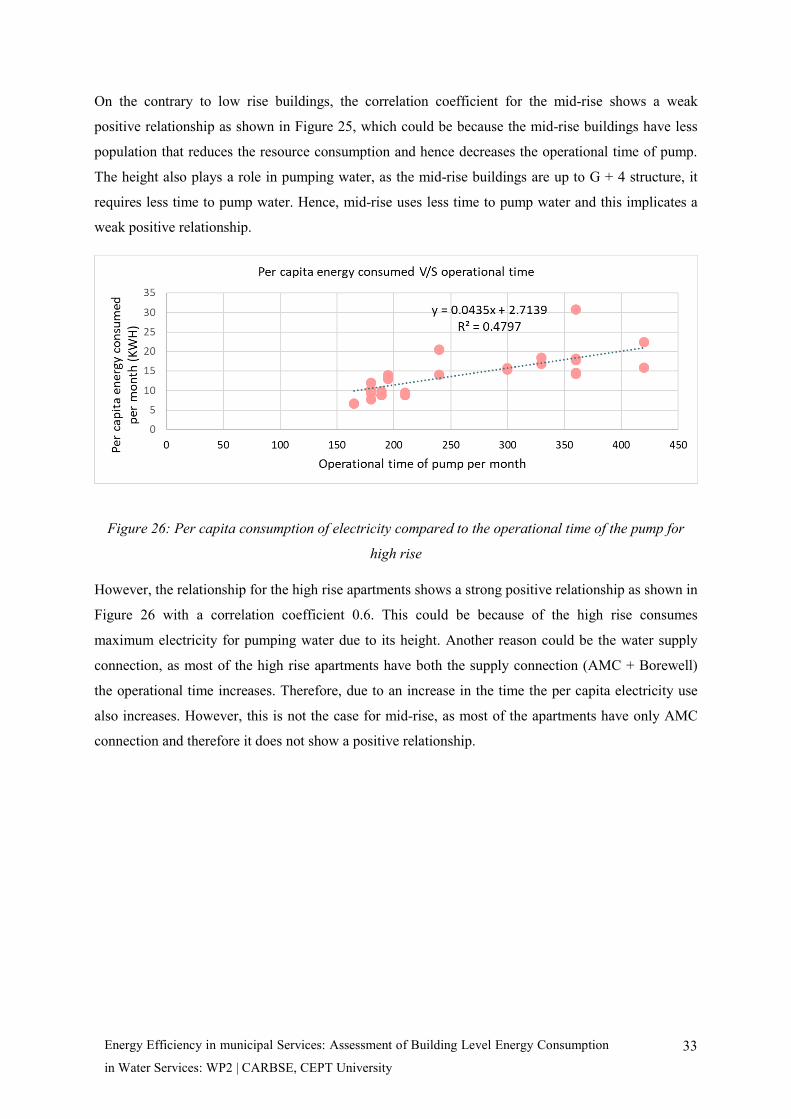
33
Energy Efficiency in municipal Services: Assessment of Building Level Energy Consumption
in Water Services: WP2 | CARBSE, CEPT University
On the contrary to low rise buildings, the correlation coefficient for the mid-rise shows a weak
positive relationship as shown in Figure 25, which could be because the mid-rise buildings have less
population that reduces the resource consumption and hence decreases the operational time of pump.
The height also plays a role in pumping water, as the mid-rise buildings are up to G + 4 structure, it
requires less time to pump water. Hence, mid-rise uses less time to pump water and this implicates a
weak positive relationship.
Figure 26: Per capita consumption of electricity compared to the operational time of the pump for
high rise
However, the relationship for the high rise apartments shows a strong positive relationship as shown in
Figure 26 with a correlation coefficient 0.6. This could be because of the high rise consumes
maximum electricity for pumping water due to its height. Another reason could be the water supply
connection, as most of the high rise apartments have both the supply connection (AMC + Borewell)
the operational time increases. Therefore, due to an increase in the time the per capita electricity use
also increases. However, this is not the case for mid-rise, as most of the apartments have only AMC
connection and therefore it does not show a positive relationship.

34
Energy Efficiency in municipal Services: Assessment of Building Level
Energy Consumption in Water Services: WP2 | CARBSE, CEPT University
4.4. Is the age of the building significant for the use of the electricity for water
pumping?
Figure 27: Per capita consumption of electricity in residential typologies of different age group
Figure 27 depicts the per capita electricity consumption of the buildings, that are categorized into
various age groups. High rise and mid-rise buildings majorly falls into the category of 0-20 years, the
sum of per capita consumption of electricity is higher for those typologies. Also, with the increase in
height the electricity used for pumping increases, therefore it shows a higher trend for high rise and
mid-rise typology. However, for the low rise buildings, row houses and semi-detached are old
compared to the detached household. Hence, the graph shows a lower trend for semi-detached and row
houses as it consumes less electricity than the detached houses. Consequently, a relationship was
further developed to comprehend the influence of building age on electricity consumption.
The electricity utilization very much depends on the efficiency of equipments used for the services in
the residential buildings. However, there is no justified argument whether the age of the building
affects the electricity consumption. The analysis done for this study suggests that there is no positive
relationship between building age and electricity consumption in case of water pumping as shown in
Figure 28 with a correlation coefficient of 0.2.

35
Energy Efficiency in municipal Services: Assessment of Building Level Energy Consumption
in Water Services: WP2 | CARBSE, CEPT University
Figure 28: Per capita consumption of electricity compared to the building age
Similar results have been depicted in the studies carried out by authors that say the effect of dwelling
age is insignificant on electricity consumption. As mentioned by (I. G. Hamilton, Steadman, Bruhns,
Summerfield, & Lowe, 2013) in their study on energy efficiency in British housing stock evaluated
that the electricity utilization was mostly similar in both new and old buildings, with only a moderate
increase in newer buildings. Similar to this, (Kavousian, Rajagopal, & Fischer, 2013) attributed that
there is no impact of building age on the electricity use, however, there is a mild difference which is
possible due to the obligation of building regulations. However, in this study one argument could be
that with the age of the building, the pumping system for water also gets old and can affect electricity
use. Hence, to obtain accurate results the age of the pump will be required. Thus, the per capita
electricity consumption remains unaffected when compared to the building of any age.
4.5. What is the role of the floor space area in the electricity consumption? It is noted that there is an impact of floor space area of the household on the electricity consumption.
As shown in Figure 29, it is representing the moderate correlation with a coefficient of 0.7, between
floor space area (m2) and per capita energy consumption for water pumping. Hence, it proves that, as
the floor space area of the building increases, the per capita electricity consumption also increases.

36
Energy Efficiency in municipal Services: Assessment of Building Level
Energy Consumption in Water Services: WP2 | CARBSE, CEPT University
Figure 29: Per capita consumption of electricity compared to floor space area
There are literature which widely reports the impact of the floor space area of a household on the
electricity consumption. As mentioned by Filippini and Pachauri in their study on electricity
consumption of urban Indian households quoted by (Jones, Fuertes, & Lomas, 2015) in their study
“The socio-economic, dwelling and appliance-related factors affecting electricity consumption in
domestic buildings” described that there is an increase of 0.2% in household electricity consumption
with raise in floor space area of the building by 1%. Building morphology, size and use are one of the
most influential factors for the energy consumption at the building level (Kontokosta & Tull, 2017).
Yi-Tui Chen stated in the study for factors affecting electricity consumption for residential buildings
in Taiwan that bigger residential floor space implies a bigger household size and thus the electricity
demand is more for those households. However, in this studies the overall electricity consumption of a
household has been taken into consideration thus seems to have a positive relationship. As, this
particular research only focuses on the electricity use for water pumping, the floor space area does not
affect the electricity use to a great extent. Hence, based on the use of the resource which is directly
proportional to the family size and the size of the dwelling unit it shows a moderate relationship.
4.6. Synthesis of the study Municipal energy services for buildings remain unexplored and lack the concentration on policies and
programs at the national level. The study has tried to measure the use of electricity at the building
level for one of the municipal services of water supply. It covered the aspects of the electricity
consumption to pump the water from ground to terrace level of the building. Further, to understand the
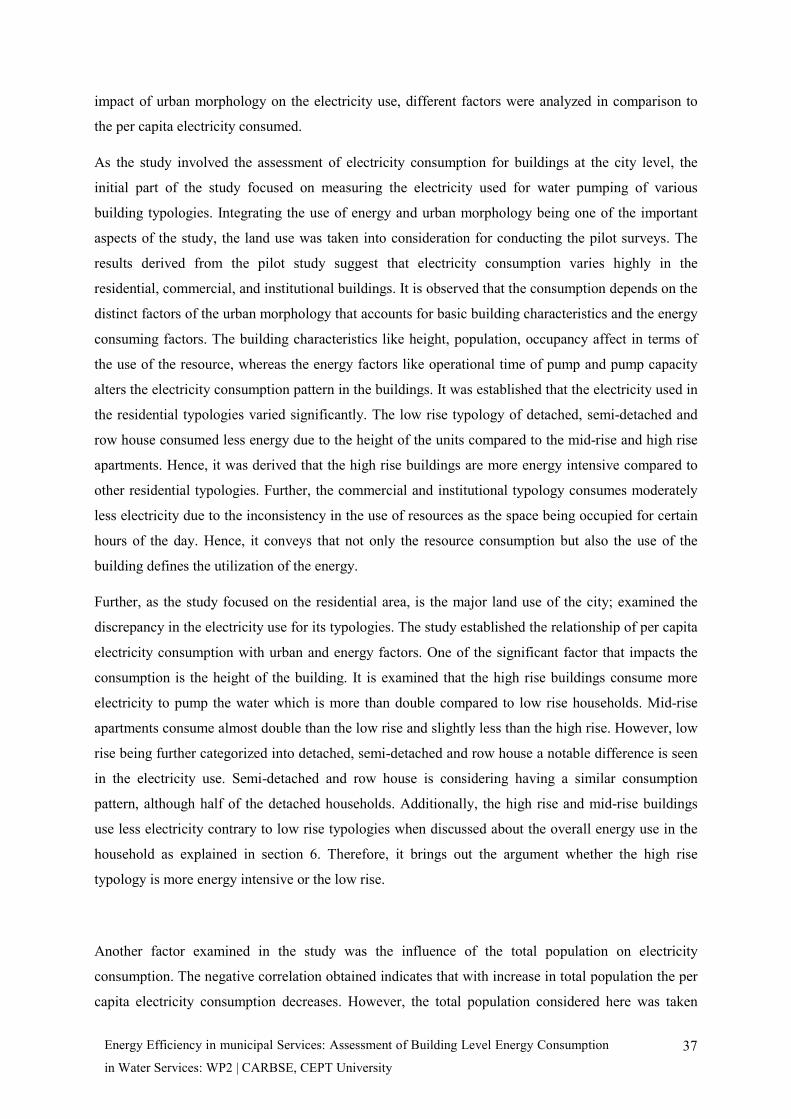
37
Energy Efficiency in municipal Services: Assessment of Building Level Energy Consumption
in Water Services: WP2 | CARBSE, CEPT University
impact of urban morphology on the electricity use, different factors were analyzed in comparison to
the per capita electricity consumed.
As the study involved the assessment of electricity consumption for buildings at the city level, the
initial part of the study focused on measuring the electricity used for water pumping of various
building typologies. Integrating the use of energy and urban morphology being one of the important
aspects of the study, the land use was taken into consideration for conducting the pilot surveys. The
results derived from the pilot study suggest that electricity consumption varies highly in the
residential, commercial, and institutional buildings. It is observed that the consumption depends on the
distinct factors of the urban morphology that accounts for basic building characteristics and the energy
consuming factors. The building characteristics like height, population, occupancy affect in terms of
the use of the resource, whereas the energy factors like operational time of pump and pump capacity
alters the electricity consumption pattern in the buildings. It was established that the electricity used in
the residential typologies varied significantly. The low rise typology of detached, semi-detached and
row house consumed less energy due to the height of the units compared to the mid-rise and high rise
apartments. Hence, it was derived that the high rise buildings are more energy intensive compared to
other residential typologies. Further, the commercial and institutional typology consumes moderately
less electricity due to the inconsistency in the use of resources as the space being occupied for certain
hours of the day. Hence, it conveys that not only the resource consumption but also the use of the
building defines the utilization of the energy.
Further, as the study focused on the residential area, is the major land use of the city; examined the
discrepancy in the electricity use for its typologies. The study established the relationship of per capita
electricity consumption with urban and energy factors. One of the significant factor that impacts the
consumption is the height of the building. It is examined that the high rise buildings consume more
electricity to pump the water which is more than double compared to low rise households. Mid-rise
apartments consume almost double than the low rise and slightly less than the high rise. However, low
rise being further categorized into detached, semi-detached and row house a notable difference is seen
in the electricity use. Semi-detached and row house is considering having a similar consumption
pattern, although half of the detached households. Additionally, the high rise and mid-rise buildings
use less electricity contrary to low rise typologies when discussed about the overall energy use in the
household as explained in section 6. Therefore, it brings out the argument whether the high rise
typology is more energy intensive or the low rise.
Another factor examined in the study was the influence of the total population on electricity
consumption. The negative correlation obtained indicates that with increase in total population the per
capita electricity consumption decreases. However, the total population considered here was taken

38
Energy Efficiency in municipal Services: Assessment of Building Level
Energy Consumption in Water Services: WP2 | CARBSE, CEPT University
constant for the society or a building which varies based on the number of households. However, the
strong reasons can only be derived through collecting the appropriate information of the above stated
aspects. Nonetheless, it is also argued that the per capita electricity use might get influenced by the
size of the family and the resource consumed.
Besides the urban morphology factors, the study also analyze the influence of the operational time of
the pump on the per capita electricity consumed. The correlation shows a positive relationship
between operational time of pump and per capita electricity consumption. The operational time highly
varies in the low rise residential typologies of detached, semi-detached and row houses assumed to be
because of a tangible factor which is the capacity of the tank and a non-tangible factor of standard of
living. The operational time of the pump also differs due to the source of water supply. The buildings
with the single connection of water supply of either AMC or bore well consumes less electricity
compared to the buildings having both the connections. However, by relating the operational time of
the pump with pump capacity might give the appropriate results for per capita electricity used.
The study also examines the relationship of building age with the per capita electricity consumption.
The correlation obtained showed a negative relationship indicating that the age of the building does
not affect the per capita electricity used. The argument was made based on the fact that; this factor
might influence if the age of the pump would have been considered. It is assumed that with the
building age the appliances used for the services also ages. Hence, the old pump would prove to be
inefficient and may end up using more electricity. Therefore, to explore the relationship in detail and
accurate data will be required to draw appropriate results.
Earlier literature inspects the floor space area of the building closely to determine its impact on the per
capita energy consumption. Although, these studies largely focused on the total energy consumed at
the building level for space cooling and appliances used. The results obtained from the studies showed
a positive relationship. On the contrary, this study only focused on the electricity utilized for pumping
the water, floor space area proved to be moderately influential. The assumption made is that the
amount of electricity consumed for pumping is negligible compared to the total energy used by a
household, the area of the building remains insignificant.
The factors considered in this study can be further used for the building energy stock model. The data
collected about the height of the building, floor space area, the total population can be considered
proxy and the values obtained from the surveys of total electricity consumed per month and per capita
electricity consumed per month and can be fed into the energy stock model.
4.7. Way forward To establish the relationship between electricity consumption and factors of urban morphology, the
data collection focused on the predominant typologies in the western and eastern parts of the city. In

39
Energy Efficiency in municipal Services: Assessment of Building Level Energy Consumption
in Water Services: WP2 | CARBSE, CEPT University
this study the data collected for high rise and midrise apartments are majorly from the western zone,
whereas the data for low rise typology was collected from both the parts of the city based on the
predominance of typologies in the particular areas. However, there has been an observation that the
electricity consumption pattern in the eastern and western parts of the city is not similar. Therefore, to
compare and estimate the pattern of electricity used to pump water for all the residential typologies,
more number of samples for high rise and midrise shall be collected from the eastern zone of the city.
Further, the water supply connection in the city has both the sources to supply water which is a piped
connection from municipal corporation (AMC) and bore well. It has been noted that the electricity
used to pump water from bore well is higher compared to the piped connection. Also, the depth of the
bore well is an important aspect when measuring the electricity consumption. The samples collected
for this study are a mixture of building with a single connection and with both the connections.
Therefore, to understand this aspect in depth it is required to collect the equal number of samples for
the buildings having a single connection (AMC or bore well) and both the connection (AMC +
Borewell).
Along with these parameters, the study has dealt with the factors of urban morphology. It has been
found out that with the increase in floor space area of the building the per capita electricity
consumption increases. However, it remains unclear whether the floor space area has a direct impact
on electricity consumption. To achieve definite results, a factor of dwelling space can be considered
and a relationship can be established of per capita dwelling space with per capita electricity
consumption. In this study the family size has been taken constant as per URDFI guidelines, hence to
establish the relation with per capita dwelling space it will be required to have the exact number of
people staying in the dwelling units. Further, this study has largely focused on measuring the
electricity consumption for the residential building typology, whereas a factor of resource
consumption has not been taken into consideration. The electricity consumption to pump water varies
depending on the water consumed in the households. It is found out that the water supplied to each
household in terms of LPCD and the water consumed are important aspects to estimate the electricity
consumption pattern with an increase or decrease in resource consumption. Therefore, the further
study shall focus on the estimating the resource consumption along with the electricity consumption to
pump water.
The typologies considered in this study show a significant variation in the use of electricity which
indicates that apart from the urban and other energy related factors, socio-economic factor of standard
of living might have an influence that directly relates to the household income. Therefore, in a further
study a factor of disposal income can be considered to compare it to the per capita electricity
consumption per month. The income levels can also be comprehended with the land rates which can
be referred from the Jantri rates, in order to understand the relation of land rates and the income of the
households in the particular areas. The reason to make this argument was the high diversity in the
40
Energy Efficiency in municipal Services: Assessment of Building Level
Energy Consumption in Water Services: WP2 | CARBSE, CEPT University
standard of the living of the households in the eastern and western parts of the city, which are
predominantly considered to conduct this study. This may provide the results of the variation in
electricity consumption in different typologies as well as the similar typology located in the different
zones of the city. Hence, a comparison can be made by comparing the household income with the cost
borne by the users for electricity and its impact on the use of electricity to pump the water at the
building level.

41
Energy Efficiency in municipal Services: Assessment of Building Level Energy Consumption
in Water Services: WP2 | CARBSE, CEPT University
References ACEEE, 2018. (2018). The 2018 International Energy Efficiency Scorecard. American Council for an
Energy-Efficient Economy, (June), 125. https://doi.org/Report Number E1602
AEEE. (2011). Energy Efficiency in India History and Overview. Alliance for an Energy Efficient
Economy, 1–120. Retrieved from http://www.indiaenvironmentportal.org.in/files/file/aeee energy
efficiency final.pdf
AEEE, 2018. (2018). STATE ENERGY EFFICIENCY PREPAREDNESS INDEX,2018. 1–81.
Ahmadian, E., Byrd, H., Sodagar, B., Matthewman, S., Kenney, C., & Mills, G. (2019). Energy and
the form of cities: the counterintuitive impact of disruptive technologies. Architectural Science
Review, 62(2), 145–151. https://doi.org/10.1080/00038628.2018.1535422
AUDA. (2015). Comprehensive Development Plan 2021 ( Second Revised ). 2021(JANUARY).
Barreiro, E., Belausteguigoitia, J., Perea, E., & Rodríguez, R. (n.d.). City planning and energy
efficiency : towards an integrated urban design and planning process. 120, 43–51.
https://doi.org/10.2495/SDP090051
Becqué, R., Mackres, E., Layke, J., Aden, N., Liu, S., Managan, K., … Graham, P. (2015).
Accelerating Building Efficiency: Eight Actions for Urban Leaders. 1–160.
BEE. (2006). Manual for the Development of Municipal Energy Efficiency Projects. 183.
Beratungs- und Service-Gesellschaft Umwelt mbH. (2011). Integrated Urban Development Approach
Targeting at Energy Efficient Residential Areas: WP 3 Transnational Manual. 1–70.
Cajot, S., Peter, M., Bahu, J. M., Koch, A., & Maréchal, F. (2015). Energy planning in the urban
context: Challenges and perspectives. Energy Procedia, 78(November), 3366–3371.
https://doi.org/10.1016/j.egypro.2015.11.752
Chandel, S. S., Nagaraju Naik, M., & Chandel, R. (2015). Review of solar photovoltaic water
pumping system technology for irrigation and community drinking water supplies. Renewable
and Sustainable Energy Reviews, 49, 1084–1099. https://doi.org/10.1016/j.rser.2015.04.083
Doherty, M., Nakanishi, H., Bai, X., Meyers, J., & Ecosystems, C. S. (2009a). GEA Background
Paper , prepared by : 1–28.
Doherty, M., Nakanishi, H., Bai, X., Meyers, J., & Ecosystems, C. S. (2009b). Relationship Between
from, Morphology, Density and Energy in Urban Environments. 1–28.
Große, J., Fertner, C., & Groth, N. B. (2016). Urban structure, energy and planning: Findings from
three cities in Sweden, Finland and Estonia. Urban Planning, 1(1), 24–40.
42
Energy Efficiency in municipal Services: Assessment of Building Level
Energy Consumption in Water Services: WP2 | CARBSE, CEPT University
https://doi.org/10.17645/up.v1i1.506
Guhathakurta, S., & Williams, E. (2015). Impact of Urban Form on Energy Use in Central City and
Suburban Neighborhoods: Lessons from the Phoenix Metropolitan Region. Energy Procedia, 75,
2928–2933. https://doi.org/10.1016/j.egypro.2015.07.594
Hamilton, I., Evans, S., Steadman, P., Godoy-Shimizu, D., Donn, M., Shayesteh, H., & Moreno, G.
(2017). All the way to the top! the energy implications of building tall cities. Energy Procedia,
122, 493–498. https://doi.org/10.1016/j.egypro.2017.07.302
Hamilton, I. G., Steadman, P. J., Bruhns, H., Summerfield, A. J., & Lowe, R. (2013). Energy
efficiency in the British housing stock: Energy demand and the Homes Energy Efficiency
Database. Energy Policy, 60(September), 462–480. https://doi.org/10.1016/j.enpol.2013.04.004
Harish, V. S. K. V., & Kumar, A. (2014). Planning and implementation strategy of Demand Side
Management in India. 1st International Conference on Automation, Control, Energy and Systems
- 2014, ACES 2014, (May 2016). https://doi.org/10.1109/ACES.2014.6808001
Heinonen, J., & Junnila, S. (2014). Residential energy consumption patterns and the overall housing
energy requirements of urban and rural households in Finland. Energy and Buildings, 76, 295–
303. https://doi.org/10.1016/j.enbuild.2014.02.079
India energy outlook report (IEA). (2015). India Energy Outlook. World Energy Outlook Special
Report, 1–191. Retrieved from
http://www.worldenergyoutlook.org/media/weowebsite/2015/IndiaEnergyOutlook_WEO2015.pd
f
International Energy Agency (IEA). (2014). Energy Efficient Communities: Case Studies and
Strategic Guidance for Urban Decision Makers (Annex 51). (October).
Jones, R. V., Fuertes, A., & Lomas, K. J. (2015). The socio-economic, dwelling and appliance related
factors affecting electricity consumption in domestic buildings. Renewable and Sustainable
Energy Reviews, 43, 901–917. https://doi.org/10.1016/j.rser.2014.11.084
Kavousian, A., Rajagopal, R., & Fischer, M. (2013). Determinants of residential electricity
consumption: Using smart meter data to examine the effect of climate, building characteristics,
appliance stock, and occupants’ behavior. Energy, 55, 184–194.
https://doi.org/10.1016/j.energy.2013.03.086
Khalil, H. A. E. E. (2009). Energy efficiency strategies in urban planning of cites. 7th International
Energy Conversion Engineering Conference, (August 2009). https://doi.org/10.2514/6.2009-
4622
43
Energy Efficiency in municipal Services: Assessment of Building Level Energy Consumption
in Water Services: WP2 | CARBSE, CEPT University
Kontokosta, C. E., & Tull, C. (2017). A data-driven predictive model of city-scale energy use in
buildings. Applied Energy, 197, 303–317. https://doi.org/10.1016/j.apenergy.2017.04.005
M-tech, G. R., & Khan, Z. J. (2015). Nagpur Booster Pumping Stations Energy Audit and its Energy
Conservation measures. (4), 425–430.
Marshall, J. D. (2008). Energy-efficient urban form. Environmental Science and Technology, 42(9),
3133–3137. https://doi.org/10.1021/es087047l
Mike Jenks, E. B. and K. W. (n.d.). (1996)The.Compact.City_A.Sustainable.Urban.Form.pdf.
Mrudula Kelkar, Aditya Chunekar, Sanjana Mulay, 2018. (2018). Evaluating Energy Efficiency. 277–
356. https://doi.org/10.1007/978-3-319-16033-7_11
NITI Aayog, 2017. (n.d.). India ’ s Energy and E missions Outlook : Results from India Energy Model.
NITI Aayog, 2017. (2017). Draft National Energy Policy.
Padmavathi, K., & Daniel, S. A. (2011). Studies on installing solar water pumps in domestic urban
sector. Sustainable Cities and Society, 1(3), 135–141. https://doi.org/10.1016/j.scs.2011.06.002
Pradeep Kumar, M. M. and C. S. (2012). MAINSTREAMING ENERGY EFFICIENCY IN URBAN
WATER AND WASTEWATER MANAGEMENT IN THE WAKE OF CLIMATE CHANGE. (21),
1–26.
Ramos, H. M., Vieira, F., & Covas, D. I. C. (2010). Energy efficiency in a water supply system:
Energy consumption and CO2 emission. Water Science and Engineering, 3(3), 331–340.
https://doi.org/10.3882/j.issn.1674-2370.2010.03.009
Rao, G. R. N. (2014). Energy Efficiency in Urban Water Supplies Need for Web Interactive Tool.
Rao, G., & Sharma, K. (2012). Energy conservation opportunities in municipal water supply systems:
a case study. Journal of Resources, Energy and Development, 9(1), 35–48.
https://doi.org/10.3233/RED-120003
Rode, P., Keim, C., Robazza, G., Viejo, P., & Schofield, J. (2014). Cities and energy: Urban
morphology and residential heat-energy demand. Environment and Planning B: Planning and
Design, 41(1), 138–162. https://doi.org/10.1068/b39065
TERI, 2019. (2019). MAKING INDIAN CITIES ENERGY SMART. Economic and Political Weekly,
48(17), 15–18.

44
Energy Efficiency in municipal Services: Assessment of Building Level
Energy Consumption in Water Services: WP2 | CARBSE, CEPT University
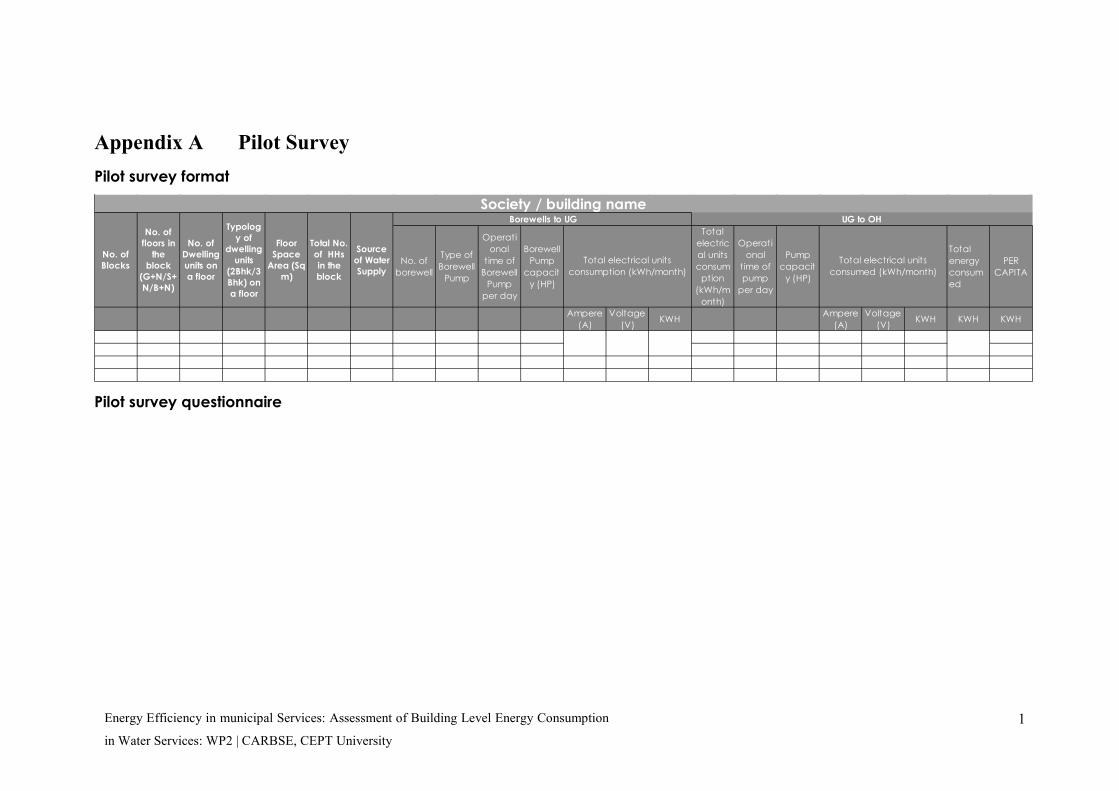
1
Energy Efficiency in municipal Services: Assessment of Building Level Energy Consumption
in Water Services: WP2 | CARBSE, CEPT University
Appendix A Pilot Survey Pilot survey format
Pilot survey questionnaire
No. of borewell
Type of Borewell
Pump
Operational
time of Borewell
Pump per day
Borewell Pump
capacity (HP)
Total electrical units consum
ption (kWh/m
onth)
Operational
time of pump
per day
Pump capacit
y (HP)
Total energy consumed
PER CAPITA
Ampere(A)
Voltage(V) KWH Ampere
(A) Voltage
(V) KWH KWH KWH
Total electrical units consumption (kWh/month)
Total electrical units consumed (kWh/month)
Society / building name
No. of Blocks
No. of floors in
the block
(G+N/S+N/B+N)
No. of Dwelling units on a floor
Typology of
dwelling units
(2Bhk/3Bhk) on a floor
Floor Space
Area (Sq m)
Total No. of HHs in the block
Source of Water Supply
Borewells to UG UG to OH
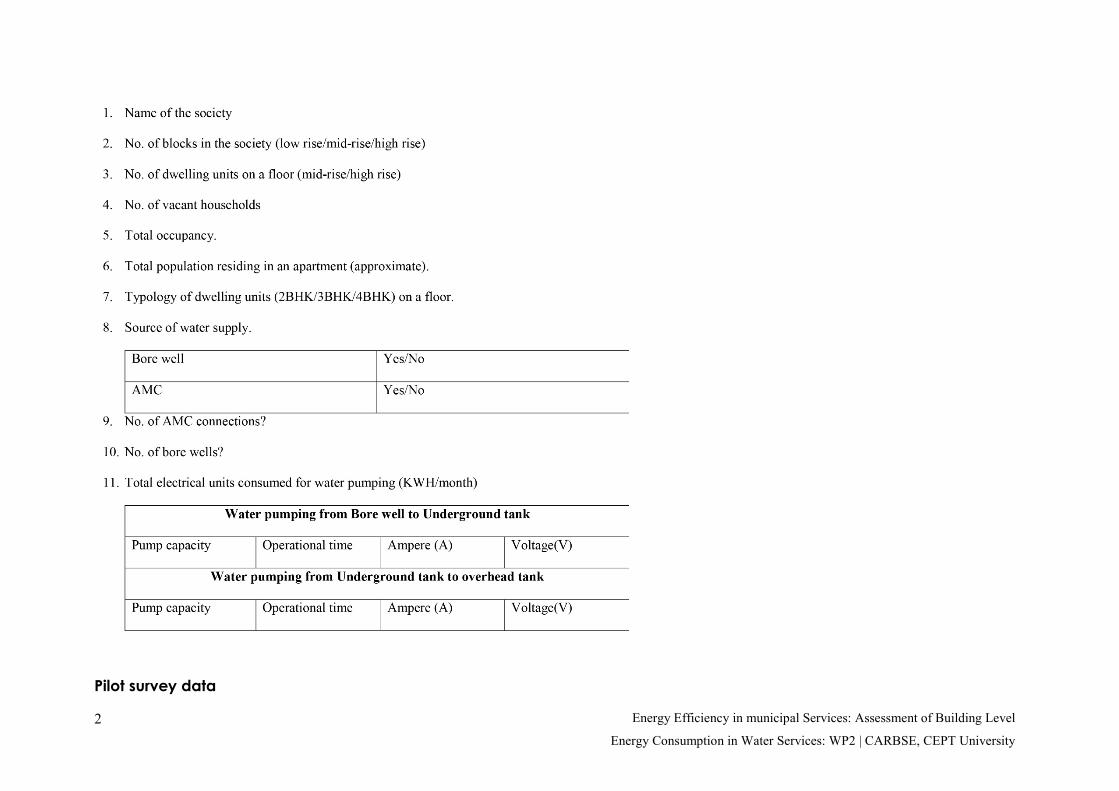
2
Energy Efficiency in municipal Services: Assessment of Building Level
Energy Consumption in Water Services: WP2 | CARBSE, CEPT University
Pilot survey data

3
Energy Efficiency in municipal Services: Assessment of Building Level Energy Consumption
in Water Services: WP2 | CARBSE, CEPT University
No. of borewellType of Borewell
Pump
Operational time of
Borewell Pump per
day
Borewell Pump
capacity (HP)
Total electrical units consumption (kWh/month)
Operational time of
pump per day
Pump capacity
(HP)
Ampere(A) Voltage(V) Ampere(A) Voltage(V)Block A G + 10 4 3BHK 104 40 AMC+Borewell 1 1 hour 15 HP 1 hourBlock B G + 10 6 2BHK 71 60 AMC+Borewell 1 1 hour 15 HP 1 hour
Block L G + 10Block M G + 10Block N G + 10
Source of Water Supply
No. of Blocks Total electrical units
consumption (kWh/month)
20 415
Total electrical units consumed (kWh/month)
12 …
Society 1-SARJAN PARK SOCIETY Borewells
7.5 HP
Overhead PumpNo. of floors in
the block (G+N/S+N/B+
N)
No. of Dwelling units on a
floor
Typology of dwelling units
(2Bhk/3Bhk) on a floor
Floor Space Area (Sq m)
Total No. of HHs in the
block
No. of borewellType of Borewell
Pump
Operational time of
Borewell Pump per
day
Borewell Pump
capacity (HP)
Total electrical units consumption (kWh/month)
Operational time of
pump per day
Pump capacity
(HP)
Ampere(A) Voltage(V) Ampere(A) Voltage(V)Block A G + 10 4 2BHK 40 AMC+Borewell 15-20 HP 16 310Block B G + 10 4 3BHK 40 AMC+Borewell 15-20HPBlock C G + 10 4 2BHK 40 AMC+Borewell 1 10 400
1 Automated system
Automated system
Overhead Pump
Total electrical units consumption (kWh/month)
Total electrical units consumed (kWh/month)
12 420
No. of Dwelling units on a
floor
Typology of dwelling units
(2Bhk/3Bhk) on a floor
Floor Space Area (Sq m)
Total No. of HHs in the
block
Source of Water Supply
BorewellsSociety 2- GURUKUL PARK SOCIETY
No. of Blocks
No. of floors in the block
(G+N/S+N/B+N)
Total electrical units
consumption (kWh/month)
Operational time of
pump per day
Pump capacity
(HP)
Ampere(A) Voltage(V)
Block A G + 3 4 3BHK 112 12 AMC+Borewell 7.5 2.4 400Block B G + 3 4 3BHK 112 12 AMC+Borewell
Overhead Pump
Total electrical units consumed (kWh/month)
No. of Blocks
No. of floors in the block
(G+N/S+N/B+N)
No. of Dwelling units on a
floor
Typology of dwelling units
(2Bhk/3Bhk) on a floor
Floor Space Area (Sq m)
Total No. of HHs in the
block
Source of Water Supply
Society 3 - RANGDEEP APARTMENTS
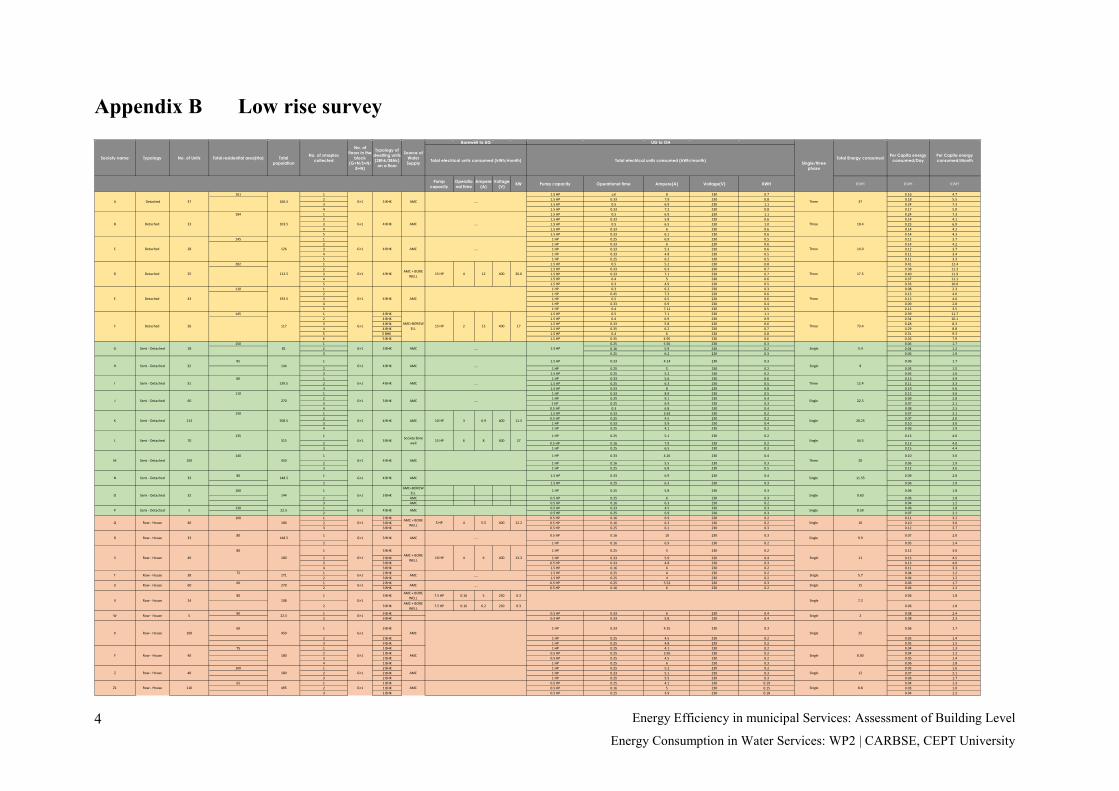
4
Energy Efficiency in municipal Services: Assessment of Building Level
Energy Consumption in Water Services: WP2 | CARBSE, CEPT University
Appendix B Low rise survey
Total population
Pump capacity
Operational time
Ampere(A)
Voltage(V) KW Pump capacity Operational time Ampere(A) Voltage(V) KWH KWH KWH KWH
161 1 1.5 HP cal 8 230 0.7 0.16 4.72 1.5 HP 0.33 7.9 230 0.8 0.18 5.53 1.5 HP 0.5 6.9 230 1.1 0.24 7.34 1.5 HP 0.33 7.2 230 0.8 0.17 5.0
184 1 1.5 HP 0.5 6.9 230 1.1 0.24 7.32 1.5 HP 0.33 5.8 230 0.6 0.14 4.13 1.5 HP 0.5 6.5 230 1.0 0.23 6.94 1.5 HP 0.33 6 230 0.6 0.14 4.25 1.5 HP 0.33 6.1 230 0.6 0.14 4.3
145 1 1 HP 0.25 6.9 230 0.5 0.12 3.72 1 HP 0.33 6 230 0.6 0.14 4.23 1 HP 0.33 5.3 230 0.6 0.12 3.74 1 HP 0.33 4.8 230 0.5 0.11 3.45 1 HP 0.25 6.2 230 0.5 0.11 3.3
282 1 1.5 HP 0.5 5.2 230 0.8 0.41 12.42 1.5 HP 0.33 6.3 230 0.7 0.38 11.33 1.5 HP 0.33 7.1 230 0.7 0.40 11.94 1.5 HP 0.4 5 230 0.6 0.37 11.15 1.5 HP 0.3 4.9 230 0.5 0.33 10.0
110 1 1 HP 0.3 6.2 230 0.3 0.08 2.32 1 HP 0.45 7.3 230 0.6 0.13 4.03 1 HP 0.5 6.5 230 0.6 0.13 4.04 1 HP 0.33 6.9 230 0.4 0.09 2.85 1 HP 0.4 7.11 230 0.5 0.12 3.5
145 1 4 BHK 1.5 HP 0.5 7.1 230 1.1 0.39 11.72 4 BHK 1.5 HP 0.4 6.9 230 0.9 0.34 10.13 4 BHK 1.5 HP 0.33 5.8 230 0.6 0.28 8.34 4 BHK 1.5 HP 0.35 6.2 230 0.7 0.29 8.85 5 BHK 1.5 HP 0.4 6 230 0.8 0.31 9.36 5 BHK 1.5 HP 0.35 4.95 230 0.6 0.26 7.9
150 1 0.25 5.56 230 0.3 0.06 1.72 0.16 5.9 230 0.2 0.04 1.23 0.25 6.2 230 0.3 0.06 1.9
95 1 1.5 HP 0.33 4.14 230 0.3 0.06 1.7
2 1 HP 0.25 5 230 0.2 0.05 1.53 1.5 HP 0.25 5.2 230 0.2 0.05 1.6
80 1 1 HP 0.33 5.6 230 0.6 0.13 3.92 1.5 HP 0.25 6.3 230 0.5 0.11 3.33 1.5 HP 0.33 8 230 0.8 0.19 5.6
110 1 1 HP 0.33 8.9 230 0.5 0.12 3.62 1 HP 0.25 9.1 230 0.4 0.09 2.83 1 HP 0.25 6.9 230 0.3 0.07 2.14 0.5 HP 0.3 6.8 230 0.4 0.08 2.5
150 1 1.5 HP 0.33 3.63 230 0.2 0.07 2.12 0.5 HP 0.25 4.5 230 0.2 0.07 2.03 1 HP 0.33 5.9 230 0.4 0.10 3.04 1 HP 0.25 4.1 230 0.2 0.06 1.9
135 1 1 HP 0.25 5.1 230 0.2 0.13 4.0
2 0.5 HP 0.16 7.9 230 0.2 0.13 4.03 1 HP 0.25 6.5 230 0.3 0.15 4.4
140 1 1 HP 0.33 4.26 230 0.4 0.10 3.0
2 1 HP 0.16 5.5 230 0.3 0.06 1.93 1 HP 0.25 6.8 230 0.5 0.12 3.6
80 1 1.5 HP 0.33 6.9 230 0.4 0.09 2.8
2 1.5 HP 0.25 6.3 230 0.3 0.06 1.9
100 1AMC+BOREW
ELL1 HP 0.25 5.8 230 0.3 0.06 1.8
2 AMC 0.5 HP 0.25 6 230 0.3 0.06 1.83 AMC 0.5 HP 0.16 6.3 230 0.2 0.04 1.2
120 1 0.5 HP 0.33 4.5 230 0.3 0.06 1.82 0.5 HP 0.25 6.9 230 0.3 0.07 2.1
100 1 2 BHK 0.5 HP 0.16 6.9 230 0.2 0.11 3.22 3 BHK 0.5 HP 0.16 6.3 230 0.2 0.10 3.03 3 BHK 0.5 HP 0.25 6.1 230 0.3 0.12 3.7
80 1 0.5 HP 0.16 10 230 0.3 0.07 2.0
2 1 HP 0.16 6.9 230 0.2 0.05 1.4
80 1 3 BHK 1 HP 0.25 5 230 0.2 0.12 3.6
2 2 BHK 1 HP 0.33 5.9 230 0.4 0.15 4.53 3 BHK 0.5 HP 0.33 4.8 230 0.3 0.13 4.04 3 BHK 1.5 HP 0.16 6 230 0.2 0.11 3.3
75 1 2 BHK 1.5 HP 0.25 4 230 0.2 0.04 1.22 3 BHK 1.5 HP 0.25 4 230 0.2 0.04 1.2
60 1 2 BHK 0.5 HP 0.25 5.52 230 0.3 0.06 1.72 3 BHK 0.5 HP 0.16 6 230 0.2 0.04 1.2
80 1 3 BHKAMC + BORE
WELL7.5 HP 0.16 5 230 0.3 0.06 1.8
2 3 BHKAMC + BORE
WELL7.5 HP 0.16 6.2 230 0.3 0.06 1.8
80 1 3 BHK 0.5 HP 0.33 6 230 0.4 0.08 2.42 3 BHK 0.5 HP 0.33 5.8 230 0.4 0.08 2.3
60 1 3 BHK 1 HP 0.33 4.25 230 0.3 0.06 1.7
2 2 BHK 1 HP 0.25 4.5 230 0.2 0.05 1.43 3 BHK 1 HP 0.25 4.8 230 0.2 0.05 1.5
75 1 1 BHK 1 HP 0.25 4.1 230 0.2 0.04 1.32 1 BHK 0.5 HP 0.25 3.95 230 0.2 0.04 1.23 2 BHK 0.5 HP 0.25 4.5 230 0.2 0.05 1.44 1 BHK 1 HP 0.25 6 230 0.3 0.06 1.8
100 1 2 BHK 1 HP 0.25 5.2 230 0.2 0.05 1.62 2 BHK 1 HP 0.33 5.1 230 0.3 0.07 2.13 2 BHK 1 HP 0.25 5.5 230 0.3 0.06 1.7
65 1 1 BHK 0.5 HP 0.25 4.1 230 0.19 0.04 1.32 1 BHK 0.5 HP 0.16 5 230 0.15 0.03 1.03 1 BHK 0.5 HP 0.25 3.9 230 0.18 0.04 1.2
18.4
15 HP 4 12 400
Total electrical units consumed (kWh/month)
14.0
Total Energy consumed
…..
….
…..
Borewell to UG
37
Single/three phase
Three
Three
Three
Three
Z Row - House G+1
25
43
26
G+1
G+1
G+1
G+1
G+1
270
G+1
H
Semi - Detached
Semi - Detached 32
40
Row - HouseU 60
C
Semi - Detached
AMC 1240
Z1 G+1 AMC 8.8110
Y Row - House 40 G+1 AMC 8.00
X Row - House 100 G+1 AMC450
180
Detached
Detached
Detached
Single
Single
G+1
W 5 G+1
108
22.5
Single
Single
V
Row - House
Row - House 24
G
G+1 4 BHK139.5
Society name No. of UnitsTypology No. of smaples collected
No. of floors in the
block (G+N/S+N/
B+N)
144
60
P
N
O
28
A Detached 37
103.5
166.5
B Detached
D
E
F
Detached
Source of Water Supply
Total residential area(Ha)
1.5 HP81
126
112.5
193.5
117
G+1 5 BHK
AMC
26.6
4 BHK
4 BHK
15 HP
33 3 BHK
G+1
Typology of dwelling units (2Bhk/3Bhk)
on a floor
23
4 BHK
G+1
G+1
4 BHK
4 BHK
33
AMC148.5
Q Row - House
11.5
5 HP
450 G+1 4 BHK
AMC
J Semi - Detached
R
113
32
G+1 3 BHK
40
T 5.7AMCRow - House G+1
4006 13.3
38 171
180
Three
Single
Single
12.25.5
Semi - Detached
AMC
I Semi - Detached 31
18 G+1 3 BHK
15 400
10 HP
2
AMC
AMC22.5
AMC
AMC
AMC
AMC
AMC
AMC + BORE WELL
AMC+BOREWELL
AMC
K Semi - Detached G+1
180
508.5
270
L 70 G+1 3 BHKSociety Bore
well
Semi - DetachedM 100
G+1 3 BHK
AMC
S Row - House G+1
15
28.25
10
315
G+1 4 BHK
G+1 4 BHK
148.5
4 BHK 6.9 400
144
AMC + BORE WELL
AMC
AMC + BORE WELL
…..
…..
5.4
Per Capita energy consumed/Day
Per Capita energy consumed/Month
8 400 27 44.5
Total electrical units consumed (kWh/month)
UG to OH
Three
Three
Single
Single
Three
Single
Single
Single
17
8
17.5
73.4
Row - House
180
495
Semi - Detached
Row - House
Semi - Detached 5
22.5
12.4
3
15 HP
Single
….
…..
6
20
Single
Single
Single
7.2
2
….
…..
….
10 HP 4
11.55
9.60
Single
25
Single 11
4
0.59
400
9.9
Single
Single

5
Energy Efficiency in municipal Services: Assessment of Building Level Energy Consumption
in Water Services: WP2 | CARBSE, CEPT University

6
Energy Efficiency in municipal Services: Assessment of Building Level
Energy Consumption in Water Services: WP2 | CARBSE, CEPT University
Appendix C Mid rise survey

7
Energy Efficiency in municipal Services: Assessment of Building Level Energy Consumption
in Water Services: WP2 | CARBSE, CEPT University
Appendix D High rise survey
Pump capacity
Operational time
Ampere(A)
Voltage(V) KW
Pump capaci
ty
Operational time
Ampere(A)
Voltage(V) KW KWH KWH KWH
A 1 38 171 1176 G+10 2 BHKHigh
densityAMC+BOREWELL
15 HP 4 20 400 44.3 10 HP 6 13 400 43.2 87.5 0.5115.3
B 1 40 180 866 G+10 3 BHKHigh
densityAMC+BOREWELL
15 HP 8 22 400 97.4 10 HP 6 11 400 36.5 134.0 0.7422.3
C 1 25 112.5 600 G+10 3 BHKLow
densityAMC+BOREWELL
15 HP 8 20 400 88.6 15 HP 4 12 400 26.6 115.1 1.0230.7
1 40 180 561 15 HP 3 10 400 16.6 0.298.8
2 40 180 15 HP 3 12 400 19.9 0.31 9.3
E 1 20 90 929 G+10 4 BHKLow
densityAMC+BOREWELL
15 HP 6 10 400 33.2 10 HP 2 8 400 8.9 42.1 0.4714.0
1 44 198 646 2 BHK 10 HP 3 12 400 19.9 0.226.6
2 44 198 3 BHK 10 HP 3 12 400 19.9 0.22 6.6
G 1 40 180 774 G+10 4 BHKLow
densityAMC+BOREWELL
15 HP 8 20 400 88.6 10 HP 3 13 400 21.6 110.2 0.6118.4
1 40 180 510 G+10 3 BHKAMC+BOREWELL
15 HP 7.5 HP 4 12 400 26.6 0.257.4
2 60 270 G+10 2 BHKAMC+BOREWELL
15 HP 7.5 HP 4 11 400 24.4 0.195.7
1 40 180 419 G+10 2 BHK 10 HP 6 12 400 39.9 0.52 15.62 40 180 G+10 3 BHK 10 HP 7 12 400 46.5 0.56 16.83 40 180 G+10 2 BHK 8 18 310 61.8 10 HP 6 10 400 33.2 95.0 0.52 15.71 40 180 483 G+10 2 BHK 7.5 HP 6 4.1 400 13.6 0.48 14.32 40 180 G+10 2 BHK 7.5 HP 6 4.5 400 14.9 0.48 14.53 40 180 G+10 2 BHK 7.5 HP 6 4.1 400 13.6 0.48 14.34 40 180 G+10 2 BHK 7.5 HP 6 5 400 16.6 0.59 17.85 40 180 G+10 2 BHK 7.5 HP 6 5.6 400 18.6 0.60 18.1
1 21 94.5 504 G+7 4 BHK 10 HP 4 12 400 26.6 0.6820.4
2 21 94.5 G+7 4 BHK 10 HP 4 12 400 26.6 0.68 20.41 28 126 757 G+7 3 BHK 7.5 HP 3 8 400 13.3 0.26 7.72 28 126 G+7 3 BHK 7.5 HP 3 12 400 19.9 0.31 9.21 28 126 340 G+7 3 BHK 7.5 HP 4 13 400 28.8 0.43 12.92 28 126 G+7 3 BHK 7.5 HP 4 15 400 33.2 0.46 13.93 28 126 G+7 3 BHK 7.5 HP 4 14.1 400 31.2 0.45 13.44 28 126 G+7 3 BHK 7.5 HP 4 15 400 33.2 0.46 13.9
1 28 126 250 G+7 2 BHK 7.5 HP 4 8 400 17.7 0.299
2 28 126 G+7 2 BHK 7.5 HP 4 10 400 22.1 0.33 103 28 126 G+7 2 BHK 7.5 HP 4 8 400 17.7 0.29 9
AMC+BOREWELL
15 HP 7 15 400 58.1 115.7
Per Capita energy
consumed
400 199.3
221.4 263.6
234.5
Total Energy consumed
45.9 96.9
53.1 140
84.1 120.7
89.7
UG to OH
N
H
M
I
F
JHigh
densityAMC+BOREWELL
15 HP 20
Low/High
density
Source of
Water Supply
40015 HP 20
G+10High
densityAMC+BOREWELL
15 HP
High density
High density
AMC+BOREWELL
15 HP
Building name No. of blocks
No. of dwelling
units
No. of floors in the block (G+N/S+N/B
+N)
Typology of dwelling units
(2Bhk/3Bhk) on a floor
8 19
Borewell to UG
building area
D
Total population Total electrical units consumed (kWh/month)
G+10 2 & 3 BHKHigh
densityAMC+BOREWELL
15 HP
Per Capita energy
consumed/ Month
10 20 400 110.7
49.8
Total electrical units consumed (kWh/month)
8 16 300
400
400
400
20
18
4 20 415
5 18
AMC+BOREWELL
15 HP
88.6 141.7
L AMC+BOREWELL
15 HP
15 HP 6 12 400 39.9 73.1
KAMC+BOREWELL
8 20
237.2

8
Energy Efficiency in municipal Services: Assessment of Building Level
Energy Consumption in Water Services: WP2 | CARBSE, CEPT University
Appendix E City level services The city of Ahmedabad is spread over 442 sq.km. with the population of 55 lakhs. The water services in the city is provided by Ahmedabad Municipal
Corporation which has 95% of water network coverage. The piped connection consists of 250km of trunk main and 3600km of distribution network. Water
treated from water treatment plant is supplied to 226 water distribution systems in the city. Around 1330 MLD of water is supplied from 226 water
distribution station, that receives water from a decentralized systems of four treatment plants. However, along with the piped connection users also use water
from bore well. As observed from the data collected most of the low rise typology has piped connection with few having both the connections. Similarly,
midrise has mixture of buildings with piped connection as well as piped + bore well connection; whereas high rise buildings use both piped water supply and
bore well due to the high demand of the water in this typology. It is also noted that the electricity used to pump water from bore well is higher compared to
piped connection. The classification of sample based on source of water supply are below:
Source of water
supply
Low rise Mid rise High rise
Piped (AMC) 62 18 -
Piped(AMC) + Bore
well
28 12 30
Total 90 30 30

Kasturbhai Lalbhai Campus, University Road, Ahmedabad - 380009, Gujarat, India www.cept.ac.in/carbse www.inumber.org