energy effective coexistence of lte-wcdma multi-rat systems · energy effective coexistence of...
TRANSCRIPT

1
Energy effective coexistence of LTE-WCDMAmulti-RAT systems
Istvan Toros, Member, IEEE, Peter Fazekas, Member, IEEE,
Abstract—As the amount of today’s mobile traffic, includinginternet data and voice calls, highly increases, more effectivetechnologies have to be integrated into the cellular wirelessnetworks to serve the new demands. Actually the ”green” net-works conception is highly promoted, so the coexistence of radiotechnologies is very important in terms of energy consumption.By energy effective radio network planning procedure, this paperpresents the energy consumption of multi-RAT (Radio AccessTechnology) structure. During analyses the traffic distributionamong RATs is changed representing the user’s traffic transition.The primary purpose is to examine the energy consumption inthe phases of transition between telecommunication technologiesdemonstrating the energy efficiency of the multi-RAT systems.
I. INTRODUCTION
The mobile telecommunication is one of the most dy-namically developing services in the world. The traffic viamobile networks has exploded in the last few years, so theinvestments in more effective telecommunication technologiesand equipments have become more important to serve theincreased size of data. As the occupied bandwidth used by atelecommunication technology is limited and the data transferconditions over this bandwidth are defined, to follow theincreasing traffic the providers have to install more and moreequipments in the radio access networks. The total numberof mobile subscriptions in the world has passed 5 billion bythe end of 2010, more than 70 % of the population of theplanet. The number of worldwide base station sites is circa5.5 million and the total global RAN (Radio Access Network)power consumption is 70 TWh, which equals to the totalannual electricity consumption of the countries of Ireland andPortugal together.
The service providers and the largest mobile telecommu-nications equipment vendors collaborate to research moreand more innovative solutions, by which the modern mobiletelecommunication systems can be improved. One of the mostimportant criteria is the energy efficiency. Taking the EARTHproject for example, which aims to improve the energy effi-ciency of mobile communication systems, from componentsover protocols up to the system level. The main target is anaverage 50 % reduction of electricity consumption of wirelessnetworks [1].
Numerous cellular network planning algorithms are pre-sented in the literature [2], [3], [4], [5], [12], [13], andthese can be classified into three major groups. One class
I. Toros is with Dept. of Networked Systems and Services, BudapestUniversity of Technology and Economics, Magyar tudosok korutja 2., 1117Budapest, Hungary Email: [email protected]
P. Fazekas is with Dept. of Networked Systems and Services, BudapestUniversity of Technology and Economics, Magyar tudosok korutja 2., 1117Budapest, Hungary Email: [email protected]
uses exact algorithms as core mechanisms. Although exactalgorithms are able to find optimal solution, they are often toocomputationally intensive and time consuming to be appliedeven to a relatively small data set. The other, more popularclass includes the heuristic algorithms, for example simulatedannealing, clustering methods, or any others. The disadvan-tages of these are the long running time, the hard verificationas well as the chance of stopping in a local optimum. Ourmulti-RAT method is the member of this group. Finally thelast group is the genetic algorithms, which transform theoptimization problem to a simplified representation.
The radio network planning algorithms are the members oflocation-allocation problems. The target is to find the locationsconsidering to be optimal depending on the pursued objectives,such as minimal transportation costs or maximal accessibility,which are reflected in the location-allocation models used.
The Facility Location Problem (FLP) is a classical questionin computer science and one of the NP-complete problems.The capacitated version of FLP (CFLP) contains the capacitiesof subsets, which is called supplies. The energy efficient cel-lular network planning can be identified with facility locationproblem, where the supplies change dynamically taking thesignal propagation and the used radio resource managementinto account.
minPin =k∑
j=1
P0(j) +k∑
j=1
∆ ∗ Pout(j). (1)
where k is the number of sectors, P0(j) is the staticpower consumption and ∆ ∗ Pout(j) is the dynamic powerconsumption. In the case of LTE (Long Term Evolution), thePout depends on the used resources near linearly, and P0(j)is a technology specific value.
Actually the cellular wireless networks are made up ofmultiple access technologies. This multi-RAT topology is aheterogeneous network including the mixture of different gen-eration standards starting with 2G, 3G and 3.5G technologies.This solution increases the capacity of system, because the dif-ferent standards use different carrier frequencies avoiding theinterferences between technologies. Furthermore, the multi-RAT system represent many generations of mobile technolo-gies, so this heterogeneous wireless network is available formore subscribers. As the traffic increases the data are sharedamong RANs. The high demands, like internet multimediaservice, are served by the highest capacity RAN. The other,low demand services are served by other technologies. Thedensity of stations of actually highest capacity RAN increasesmore and more following the traffic explosion. The coexistenceof multi-RAT systems is an interesting question. The daily

2
energy consumption of mobile systems can be reduced byeffective base station cooperation [14], [15]. The electricityconsumption of an access network can be predicted. Thisanalysis requires a cellular network planning procedure, whichdetermines the positions of necessary stations of every RATto serve the predefined demand generations. Under demandgeneration can be understood 2G,3G or 4G subscribers withtraffic data.
Our work deals with the multi-RAT energy consumptionmentioned above. The analyses are based on a feasible cellularnetwork planning algorithm, which focuses on the energy ef-ficiency. It determines the topologies of radio access networksone by one optimizing the energy consumption of multi-RATsystem. The dimensioning phase of planning is not necessary,the algorithm can start with an empty environment placing andconfiguring the stations of the different RAT layers. When thealgorithm plans a radio access network, it is assumed, thatthe topologies of earlier planned standards (reference system)have already known. So first the reference topology has tobe determined by planning algorithm symbolizing the startingstate, when only one type of telecommunication technologywas installed.
Furthermore, the network planning algorithm determinesan effective coexistence of the analyzed technologies. Thesubscriber attraction by new generation standard affects theother RATs reducing their total traffic, hence these oldertopologies can be changed by shutting off stations, reducingtransmitter power, orientating antenna main lobes, etc..
The rest of this paper is organized as follows. In Section IIthe models used in this study are presented, and we describethe multi-RAT planning and transmitter power reduction meth-ods, which are used in the analyses. In Section III the resultsof algorithms are provided, and the conclusion is given inSection IV.
II. SYSTEM MODEL AND USED ALGORITHMS
This section introduces the system model and the submeth-ods of planning algorithms used for investigation of energyeffective coexistence of LTE-WCDMA multi-RAT systems.The examined scenario can be simply described by the setof applicable coordinates over the area and the given trafficamount per generations of technologies (GSM-Global Sys-tem for Mobile Communications,WCDMA-Wideband CodeDivision Multiple Access,LTE) over the area, assigned to anysubset of the coordinates on the terrain. We suppose that theamount of traffic demands is given by a set of discrete coor-dinates (denoted as Demand Positions, DPs), along with theamount of traffic generated at that position. This approach isflexible to describe any kind of traffic distribution (continuous,if every point of the area is a DP, discrete service areas if thereare much smaller number of DPs). The set of DPs is denotedby:
DPs = {∪mi=0DP si }; (2)
where m denotes the number of DP si s in the traffic environ-
ment of sth demand generation. These points are representedby (xi,yi,demi), where xi, yi are the coordinates and demi is
the traffic demand of DP si , expressed in kbps. DP is an input
parameter.We assume that a base station (BS) operates three cells
through three sectorized antennas. The resources are givento the radio access networks by these equipments to servethe users. Some equipment can be shared by different accessnetworks to reduce the installation and energy consumptioncosts.
The stations are represented by
BSs = {∪tj=0BSsj }; BS = {∪ns=0BSs} (3)
where t is the number of BSsj s in the traffic environment of
sth demand generation.We suppose that base stations cannot be placed arbitrarily,
but to given possible (e.g. in an urban environment to rooftops)candidate positions (CP):
CPs = {∪rj=0CP sj }; CP = {∪ns=0CP s} (4)
where r is the number of CP sj s in the traffic environment of
sth demand generation.The stations of other RATs (GSM,WCDMA...) were placed
also to any candidate positions.
CPE ⊆ CP; (5)
where CPE denotes the candidate positions of the earlierplaced stations (reference topology).
We use COST 231 Okumura-Hata path loss model for bigcity environment in our simulations. This has the advantagethat it can be implemented easily without expensive geo-graphical database, yet it is accurate enough, captures majorproperties of propagation and used widely in cellular networkplanning. A sector is defined as the set of DPs that are coveredby a given transmitter. The ”best server” policy is followedwithin the network, namely a demand is served by the sectorwhose signal strength is the highest in the position of DPi
[6].The resources of network can be managed by frequency
adaptation and power management. Our planning procedureuses the properties of 3GPP LTE radio resource management(RRM). The relationship between SINR (Signal to Interferenceplus Noise Ratio) and spectral efficiency is given by the socalled Alpha-Shannon Formula which is suggested to be usedfor LTE networks in [7].
The RRM of LTE is modelled in our case by a semidynamic frequency allocation strategy. It is the so calledC/I scheduler. The sectors allocate Physical Resource Blocks(PRBs) to the demands in the order of decreasing SINRs.The frequency allocation simultaneously deals the PRBs oneby one in every sector. Note that the amount of traffic aPRB can carry is determined from the SINR by the alpha-Shannon formula. If a sector is ready (serves all DP s sets)then it won’t transmit on the remaining PRBs (hence theSINR on these PRBs will be better for the neighbours). Thismethod is very fast and reasonably high SINR values can beachieved by cell borders as well. It has to be emphasized,that any RRM algorithm can be supposed for our planningmechanism, RRM function is actually an input to the planning

3
(and thus affects final results). In practice LTE base stations aretransmitting with constant power spectral density (regardlessthe number of PRBs actually used), hence using less PRBsrequire proportionally less transmit power, as described belowin (6).
The transmitter output power, Pout can be described by
Pout =usedPRB
allPRB∗ Pmax (6)
where Pmax is the maximum top of cabinet output powerof transmitter, usedPRB and allPRB are the number ofactually used PRBs and all PRBs respectively. This latterdepends on the configured bandwidth of the system, that isalso a parameter of the deployment method. Namely, as a PRBis a 180 kHz wide chunk of the channel, in a 1 ms subframe,e.g. a 20 MHz bandwidth configuration typically means 100PRBs in every 1 ms subframe.
In practice LTE base stations are transmitting with con-stant power spectral density (regardless the number of PRBsactually used), hence using less PRBs require proportionallyless transmit power. Furthermore, it is assumed, that the Pout
depends on the allocated resources also linearly in the casesof the other standards (GSM,WCDMA).
The power consumption of the base station follows thelinear model:
PCons = P0 +∆ ∗ Pout (7)
where the first part (P0) describes the static power con-sumption. Depending on the load situation, a dynamic powerconsumption (∆ ∗ Pout) part adds to the static power. Thefactor ∆ is mainly due to the power amplifier inefficiency andfeeder loss.
A. Base station placement and multi-RAT planning methods
This subsection deals with the base station placement andmulti-RAT planning methods. To analyze the energy consump-tion of multi-RAT system, first the network topology hasto be planned. These methods determine the quasi optimalstation position and configuration for every RAN and reducethe number of applied equipments. The explaining of thesealgorithms are necessary to understand the numerical results.
The base station placement method can be configured forgiven coverage (in terms of percentage of the area coveredby at least a minimum signal strength) and service (in termsof percentage of total traffic requirements served) criteria.The default is 100% for both. The input parameters arethe used bandwidth, maximum transmit power parameters oftransmitters as well as the DP scenario of every demandgeneration. The geographical area is fixed. The output dataare the base station topology (BS) [9].
1) Base Station Placement Algorithm (BSPA): This algo-rithm determines a base station topology, which guarantees theserving and coverage criteria on the given demand scenario.
The BSPA is based on K-means dynamic clustering method.The clusters are the sites of stations including the coveredsubscribers. The criterion function of K-means, which hasto be minimized, is the sum of squared Euclidean distances
Algorithm 1: K-meansInput: K is the number of centroids/clusters.
M is the number of objects.O = {∪Mi=0oi(i, x, y)} is the set of position ofobjects.I is the number of iterations.map is the maxx ∗maxy scenario.
Output: C is the set of positions of centroids afterclusterization.
beginInitialization Step:C = {∪Kj=0c
0j}
∀c0j .x← random(maxx)∀c0j .y ← random(maxy)S = {∪Kk=0Sk}∀Sk ← ∅Iteration Step:for t← 0 to I do
Reassignment Step:∀Sk ← ∅for i← 0 to M do
min←∞id← −1for j ← 0 to K do
if distance(oi, cj) < min thenmin← distance(oi, cj)id← j
endendoi joins to the Sid
endUpdate Step:for k ← 0 to K do
c(t+1)k ← 1
#Stk
∑i⊂St
koi
endend
end
between the locations of demands and the position of servingbase station.
K-means is one of the simplest unsupervised learning al-gorithms that solve the well known clustering problem. Itis a dynamic clustering method which attempts to directlydecompose the data into disjoint clusters. The number ofclusters (K) is fixed a priori. The different located centroidsof clusters cause different results, so the algorithm has to bestarted with different initial states and run as much as possible.
Briefly overview the K-means, it can be composed of thefollowing steps:
1. Place K (parameter) points into the space represented bythe objects that are being clustered.
2. Assign each object to the group (cluster) that has theclosest centroid. (Reassignment step)
3. When all objects have been assigned, recalculate theproperties of the K centroids. (Update step)
4. Repeat Steps 2 and 3 until the centroids no longer move
4
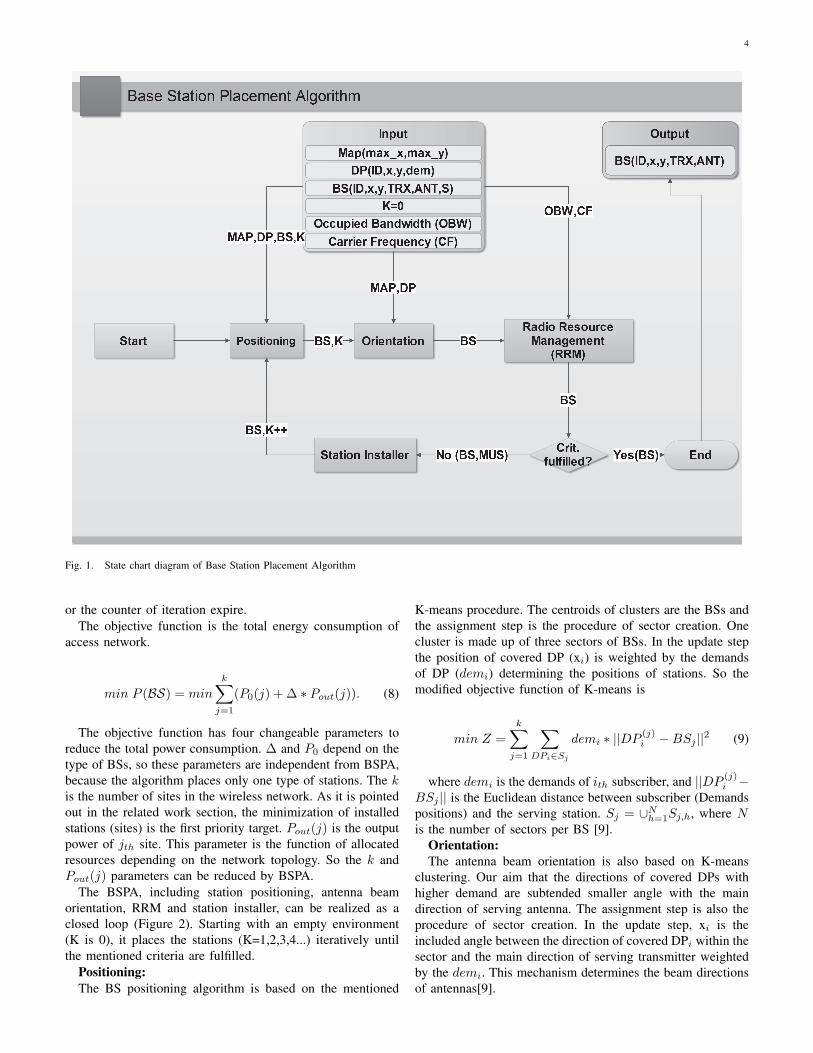
Fig. 1. State chart diagram of Base Station Placement Algorithm
or the counter of iteration expire.The objective function is the total energy consumption of
access network.
min P (BS) = min
k∑j=1
(P0(j) + ∆ ∗ Pout(j)). (8)
The objective function has four changeable parameters toreduce the total power consumption. ∆ and P0 depend on thetype of BSs, so these parameters are independent from BSPA,because the algorithm places only one type of stations. The kis the number of sites in the wireless network. As it is pointedout in the related work section, the minimization of installedstations (sites) is the first priority target. Pout(j) is the outputpower of jth site. This parameter is the function of allocatedresources depending on the network topology. So the k andPout(j) parameters can be reduced by BSPA.
The BSPA, including station positioning, antenna beamorientation, RRM and station installer, can be realized as aclosed loop (Figure 2). Starting with an empty environment(K is 0), it places the stations (K=1,2,3,4...) iteratively untilthe mentioned criteria are fulfilled.
Positioning:The BS positioning algorithm is based on the mentioned
K-means procedure. The centroids of clusters are the BSs andthe assignment step is the procedure of sector creation. Onecluster is made up of three sectors of BSs. In the update stepthe position of covered DP (xi) is weighted by the demandsof DP (demi) determining the positions of stations. So themodified objective function of K-means is
min Z =
k∑j=1
∑DPi∈Sj
demi ∗ ||DP(j)i −BSj ||2 (9)
where demi is the demands of ith subscriber, and ||DP(j)i −
BSj || is the Euclidean distance between subscriber (Demandspositions) and the serving station. Sj = ∪Nh=1Sj,h, where Nis the number of sectors per BS [9].
Orientation:The antenna beam orientation is also based on K-means
clustering. Our aim that the directions of covered DPs withhigher demand are subtended smaller angle with the maindirection of serving antenna. The assignment step is also theprocedure of sector creation. In the update step, xi is theincluded angle between the direction of covered DPi within thesector and the main direction of serving transmitter weightedby the demi. This mechanism determines the beam directionsof antennas[9].

5
Fig. 2. State chart diagram of Multi-RAT planning
Radio Resource Management:The radio resource management is described in model
section as a parameter. In our investigations, the RRM is a maxC/I scheduler. It is executed after base station positioning andantenna beam orientation to analyze the loads of sectors. Theradio resource management is an input parameter of BSPA.The target of this method is to determine the required/usednumber of PRBs per sector and to give these informations tothe station installer as results.
Station Installer:After RRM the most unserved sector (MUS) has to be
found, which is the sector with the highest total unservedtraffic (DPs with not enough PRBs allocated to) under itscoverage. If the number of required PRBs is less than thenumber of available PRBs within all sectors then there is noMUS and the algorithm stops. Otherwise the algorithm locatesa new base station near the serving antenna of MUS in themain direction and runs the positioning, rotation and RRMmechanisms again. So our clustering algorithm is an increasingnumber of K-means (X-mean) [11].
Figure 3 shows the mentioned station movement, as thealgorithm runs iteratively. Actually the black sector is theMUS, so the station installer places the new station near theserving antenna of this.
The complexities of BSPA is O(IK2NM), where I is the
Fig. 3. Station movement within placement algorithm
fix number of iterations, N is the number of DPs, K is thenumber of BSs in the final state, and O(M) is the operationcost (signal propagation).
2) Multi-RAT planning method: This method uses theBSPA to plan an energy effective multi-RAT topology. Firstit plans a reference network topology using an older telecom-munication standard (WCDMA,GSM). As the subscribers areattracted by new standard, the stations of reference RAN canbe shut off, because the reduced overall demands can beserved by fewer capacities. Furthermore, the high demands,like internet multimedia service, connect with the highestcapacity RAN (LTE).
The reference system contains the stations of older topol-ogy determining the candidate positions of transition phases(CPE). The second procedure is the planning of transitioncases. The traffic scenarios contains the demand generations(DP i
s) starting with the reduced number of subscribers ofolder generation and ending with the new generation demands.

6
Fig. 4. The power consumption of multi-RAT systems as a function of the increase in the traffic demands and demands migration between standards(WCDMA,LTE).
The BSPA installs the stations only to the reference candidatepositions (CPE), which denote base stations of referencetopology, so the new multi-RAT structure reuses the elementsof older topology. If a CPE is empty on every scenario, thenthe station can be removed. If the number of CPE is not enoughin the case of new generation demands, then the set of CPEneed to be complemented with the rest of candidate positions(CP \ CPE).
III. NUMERICAL RESULTS
The analyses discussed below use the multi-RAT planningalgorithm. The geographical topology is constant, the sizesof total demands and the ratio of traffic attracted by LTEfrom WCDMA (reference) are changed illustrating the phasesof transition between telecommunication technologies. Themulti-RAT planning algorithm gets the WCDMA and LTEdemand scenarios as input parameters and gives back aWCDMA-LTE multi-RAT topology. Table III shows the maininput parameters of algorithm derived from [16].
Input parametersCarrier frequency 2 GHzOccupied bandwidth of WCDMA 5 MHzOccupied bandwidth of LTE 10 MHzFrequency reuse factor 1Static power of stations 300 WMax top of cabinet output power of tx 30 WInefficiency of power amplifier 3Size of environments 9km2
Default traffic 85 Mbps/9km2
The analyses were run with same parameters on the studiedscenario and the results were averaged.
Figure 4 shows total power consumption of multi-RATnetworks as a function of size of traffic demands (left) anda function of the ratio of traffic attracted by LTE fromWCDMA (right). The new demands always connect with theLTE system. The different lines of the figures represent thehorizontal axis of other one, and vice versa. The curves cannot intersect each other, because more data traffic requiresmore stations increasing the power consumption of system.The reasons of high steps (left figure dotted line 100 % and
right figure at the end of lines) are caused by the establishmentof new technology and the complete removing of the other one.In the establishment phase the service providers have to placemany new transmitters to guarantee the coverage criterion ofnew telecommunication technology. In the complete removingphase the transmitters of WCDMA system can be switchedoff totally, reducing the energy consumption. These simulationresults show that the LTE system is more effective than theWCDMA (wider bandwidth) one, so the service providers cansave the budget of energy consumption if the users change overfrom 3G to 4G.
IV. CONCLUSION
In this paper we examined the energy consumptions ofmulti-RAT network topologies focussing on WCDMA-LTEcoexistence. In the analyzed cases it was assumed, that thefuture demands would connect with the new LTE network,furthermore, some percents of 3G users would change tech-nology. The results showed that the energy consumption ofcellular system could be reduced by LTE technology. Assum-ing same overall demands, the energy efficiency of networkincreased as the LTE gains ground.
ACKNOWLEDGMENT
The research leading to these results has received fundingfrom the European Community’s Seventh Framework Pro-gramme ([FP7/2007-2013]) under grant agreement no INFSO-ICT-247733 EARTH Project. The support of the Hungar-ian Government through the TMOP-4.2.1/B-09/1/KMR-2010-0002 project at the Budapest University of Technology andEconomics is also acknowledged.
REFERENCES
[1] Gergely Biczok, Jens Malmodin, Albrecht Fehske, ”INFSO-ICT-247733EARTH Deliverable D2.1”, Economic and Ecological Impact of ICT(2011)
[2] Omar H. Karam, Lamia Fattouh, Nourhan Youssef, Ahmad E. Abdelazim,”Employing Clustering Techniques in Planning Wireless Local LoopCommunication Systems: PlanAir”,11th International Conference OnArtificial Intelligence Applications Cairo, Egypt, February 23-26, (2005)
[3] Harish Ramamurthy, Abhay Karandikar: ”B-Hive: A cell planning tool forurban wireless networks”, 9th National Conference on Communications,(2003)

7
[4] Kurt Tutschku, ”Demand-based Radio Network Planning of CellularMobile Communication Systems”, INFOCOM, pp. 1054–1061 (1998)
[5] Hurley, S., ”Planning effective cellular mobile radio networks.” IEEETrans. Vehicular Technol. v51 i2. 243-253. (2002)
[6] Les Barclay, ”Propagation of Radiowaves, p. 194, The Institution ofElectrical Engineers”, London (2003)
[7] Abdul Basit, ”Dimensioning of LTE Network, Description of Models andTool, Coverage and Capacity Estimation of 3GPP Long Term Evolutionradio interface” (2009)
[8] O. Arnold, F. Richter, G. Fettweis, and O. Blume, ”Power consumptionmodeling of different base station types in heterogeneous cellular net-works” in Proc. of 19th Future Network & MobileSummit 2010, Florence,Italy, (June 2010)
[9] Istvan Toros, Peter Fazekas, ”Automatic Base Station Deployment Algo-rithm in Next Generation Cellular Networks”, Accessnet 2010 Budapest(2010)
[10] J. B. MacQueen, ”Some Methods for classification and Analysis ofMultivariate Observations, Proceedings of 5-th Berkeley Symposiumon Mathematical Statistics and Probability”, Berkeley, University ofCalifornia Press, 1:281-297 (1967)
[11] Dan Pelleg, Andrew Moore, ”X-means: Extending K-means with Ef-ficient Estimation of the Number of Clusters”, Proceedings of the 17thInternational Conf. on Machine Learning 2000
[12] Gonzlez-Brevis P., Gondzio J., Fan Y., Poor H.V., Thompson J.S.,Krikidis I., Chung P., ”Base Station Location Optimization for MinimalEnergy Consumption in Wireless Networks.”, In VTC Spring(2011)1-5
[13] Z. Zheng, S. He, L. X. Cai, X. Shen, ”Constrained Green BaseStation Deployment with Resource Allocation in Wireless Networks”,Handbook on Green Information and Communication Systems, EditorsM. S. Obaidat, A. Anpalagan, and I. Woungang, John Wiley & Sons,Inc., 2012.
[14] F. Han, Z. Safar, W.S. Lin, Y. Chen, and K.J.R. Liu, ”Energy-efficientcellular network operation via base station cooperation”, ;in Proc. ICC,2012, pp.4374-4378.
[15] Istvan Toros, Peter Fazekas, ”Planning and network management forenergy efficiency in wireless systems”, In Future Network & MobileSummit (FutureNetw), 2011
[16] Gunther Auer (DOCOMO), Oliver Blume (ALUD), Vito Giannini(IMEC), Istvan Godor (ETH), Muhammad Ali Imran (UNIS), Ylva Jading(EAB), Efstathios Katranaras (UNIS), Magnus Olsson (EAB), DarioSabella (TI), Per Skillermark (EAB), Wieslawa Wajda (ALUD), ”INFSO-ICT-247733 EARTH Deliverable D2.3”, Energy efficiency analysis of thereference systems, areas of improvements and target breakdown (2012)
Author Biographies
Istvan Toros was born in Pecs,Hungary in 1985. He received hisIng. (MSc.) degree in 2009 at theDepartment of Telecommunications,Budapest University of Technologyand Economics. His recent researchinterests are wireless network plan-ning based on energy consump-tion optimization and repeaters intelecommunication systems.
Peter Fazekas received an MSc de-gree in electrical engineering fromthe Technical University of Bu-dapest (now Budapest Universityof Technology and Economics) in1998. Currently he is with the De-partment of Networked Systems andServices where he received his PhDin 2013. His research area includesthe performance analysis of cel-lular networks, mobility modeling,and packet scheduling disciplines inwireless environment.