end-to-end radiosurgery tests with lucy phantom … · 1 end-to-end radiosurgery tests with lucy®...
TRANSCRIPT

1
End-to-End Radiosurgery tests with Lucy® Phantom
Radiation Therapy Department
Southeast Missouri Hospital Cape Girardeau, MO
performed by
Sam S. Hancock, PhD May – June, 2008
1. Introduction
1.1 Materials This is a report of a series of tests conducted with the Lucy® phantom, shown in Figure 1, to test end-to-end performance of the SRS process. The Equipment used for the SRS planning and treatment process includes: • Varian Clinac 600N (Novalis) SN 0790 • BrainLAB iPlan Image v3.0.1 • BrainLAB iPlan Dose v3.0.2 • ExacTrac v3.5 • Siemens Symphony 1.5T MRI • Philips Brilliance Big Bore CT
1.2 Method The tests involve every step in the SRS process, including: • MRI scan • CT scan • Target contouring on MRI scan • MRI/CT image fusion • Treatment planning • Localization with either head frame or image guidance • Dose delivery
Dosimetric analysis was performed by point dose measurement with ion chamber to evaluate absolute dosimetric accuracy. Film dosimetry was used to evaluate the accuracy of the dose distribution as compared to that predicted by the planning system, including localization accuracy. Film dosimetry analysis was performed in each of three orthogonal planes intersecting the center of the target volume.
Figure 1 Lucy phantom with BrainLAB headframe

2
2. Imaging
2.1 Imaging insert Imaging was performed with a prototype imaging insert provided by Standard Imaging, Inc. This imaging insert, shown in Figures 2 and 3, includes a centrally-located target volume. Two additional circular volumes were included to enhance the accuracy of image fusion. The three volumes consist of cavities filled with mineral oil that is visible on either CT or MRI.
2.2 MRI MRI scan was performed on 4/28/08 on a Siemens Symphony 1.5T scanner at Southeast Missouri Hospital. A volumetric T1-weighted scan of the entire phantom was obtained for treatment planning, with 1.2 mm axial cuts and 0.6 mm pixel size.
2.3 CT CT scans for treatment planning were performed on the Philips Brilliance Big Bore scanner in the Radiation Therapy Department of Southeast Missouri Hospital. The spiral scans with 1 mm spacing were obtained and reconstructed to 2 mm slices with 2 mm spacing. A 512x512 matrix yields a pixel size of 0.7 mm. A scan with head frame localizer was obtained on 4/25/08. For x-ray image localization, scans were obtained that included four CT marker cylinders that each contain five 2 mm aluminum beads (Figure 4). A scan was performed on 4/25/08, with the imaging insert oriented in the transverse plane. On 5/1/08, a scan was obtained with the imaging insert oriented in the sagittal plane.
Figure 3 Prototype imaging insert
Figure 4 CT marker cylinders
Figure 2 Schematic of prototype imaging insert

3
3. Treatment planning
3.1 Planning system Treatment planning was performed using BrainLAB iPlan Image 3.0.1 and iPlan Dose 3.0.2.
3.2 Image fusion and contouring Fusion of CT and MR image data sets was performed using the autofusion function in iPlan Image. Figure 5 illustrates the successful performance of the autofusion function.
3.3 Head frame localizer – Transverse orientation A treatment plan was developed with four dynamic arcs, illustrated by Figure 6, to produce a conformal dose distribution to the target volume, illustrated by Figure 7.
The plan parameters are detailed in Figure 8.
Figure 5 Results of autofusion in iPlan Image
Figure 6 Four Dynamic conformal arcs Figure 7 Conformal distribution from four dynamic conformal arcs

4
Figure 8 Plan parameters for Head Frame localizer plan with four dynamic arcs
5
3.4 X-ray image localization – Transverse orientation of imaging insert A treatment plan was developed with four dynamic arcs, illustrated by Figure 6, to produce a conformal dose distribution to the target volume, illustrated by Figure 7. The plan parameters are detailed in Figure 9.
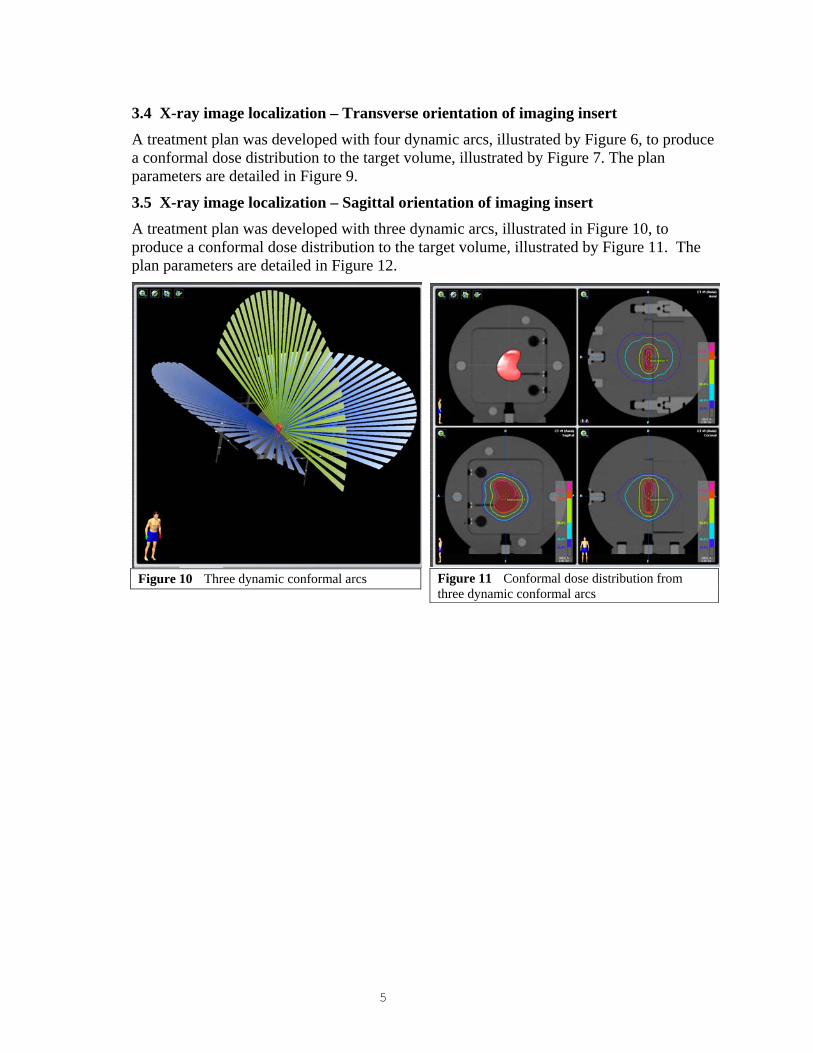
3.5 X-ray image localization – Sagittal orientation of imaging insert A treatment plan was developed with three dynamic arcs, illustrated in Figure 10, to produce a conformal dose distribution to the target volume, illustrated by Figure 11. The plan parameters are detailed in Figure 12.
Figure 10 Three dynamic conformal arcs Figure 11 Conformal dose distribution from
three dynamic conformal arcs

6
Figure 9 Plan parameters for no localizer with four dynamic arcs to treat target in transverse orientation

7
Figure 12 Plan parameters for no localizer with three dynamic arcs to treat target in sagittal orientation
8
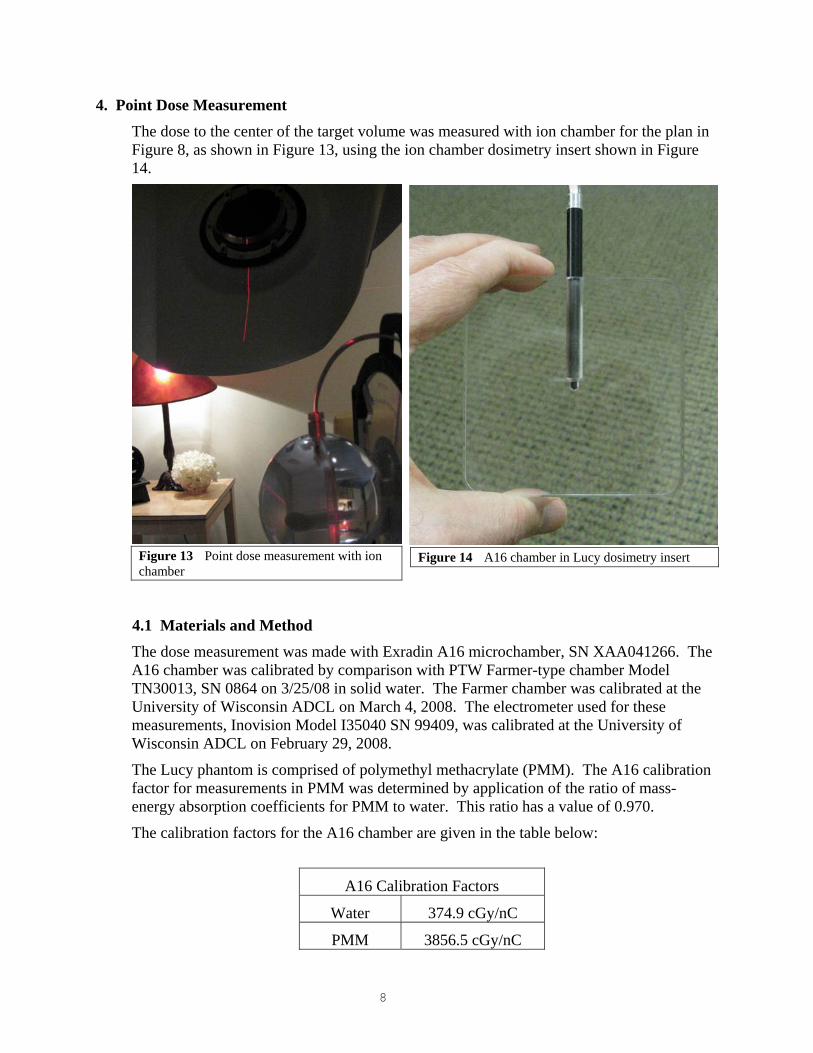
4. Point Dose Measurement The dose to the center of the target volume was measured with ion chamber for the plan in Figure 8, as shown in Figure 13, using the ion chamber dosimetry insert shown in Figure 14.
4.1 Materials and Method The dose measurement was made with Exradin A16 microchamber, SN XAA041266. The A16 chamber was calibrated by comparison with PTW Farmer-type chamber Model TN30013, SN 0864 on 3/25/08 in solid water. The Farmer chamber was calibrated at the University of Wisconsin ADCL on March 4, 2008. The electrometer used for these measurements, Inovision Model I35040 SN 99409, was calibrated at the University of Wisconsin ADCL on February 29, 2008.
The Lucy phantom is comprised of polymethyl methacrylate (PMM). The A16 calibration factor for measurements in PMM was determined by application of the ratio of mass-energy absorption coefficients for PMM to water. This ratio has a value of 0.970.
The calibration factors for the A16 chamber are given in the table below:
A16 Calibration Factors
Water 374.9 cGy/nC
PMM 3856.5 cGy/nC
Figure 13 Point dose measurement with ion chamber
Figure 14 A16 chamber in Lucy dosimetry insert

9
4.2 Results The dose at the center of the target volume was calculated to be 216 cGy using iPlan Dose. The measured dose using the A16 chamber was 218.9. The difference was 1.3%.
Review of routine QA output checks for the Novalis linac yields a calibrated output of 1.006 cGy/MU. Correction for this calibrated output yields a measured dose discrepancy of 0.7%.
5. Film Dosimetry Dosimetric evaluation of each treatment plan was performed by film analysis. The Lucy phantom was localized and treated, in the same manner as for patient treatments, with Kodak EDR2 film in a light-tight film cassette within the phantom, as shown in Figure 15. The film cassette includes fiducial alignment pins, shown in Figure 16, that mark the film to allow registration of the measured dose distribution to the calculated distribution.
For those treatments with head-frame localization, the film was exposed in each of three orthogonal planes intersecting the center of the phantom. For x-ray image-guided localization, the film was oriented the same as the target imaging insert.
5.1 Film Analysis For dosimetric analysis, the films were scanned with a Vidar VXR 16 Dosimetry Pro film scanner. The films were analyzed using RIT113 Dosimetry Software, Version 5.0, from Radiological Imaging Technology, Inc.
5.2 Head Frame Localization
For the head-frame localized plan, the phantom was aligned for treatment in the usual manner as shown in Figure 17. The treatment was delivered with an EDR2 film in the film cassette as shown in Figure 18. A film was exposed in each of the transverse, sagittal, and coronal planes through the center of the phantom.
Figure 15 Film cassette in Lucy phantom
Figure 16 Open film cassette showing fiducial alignment pins
10
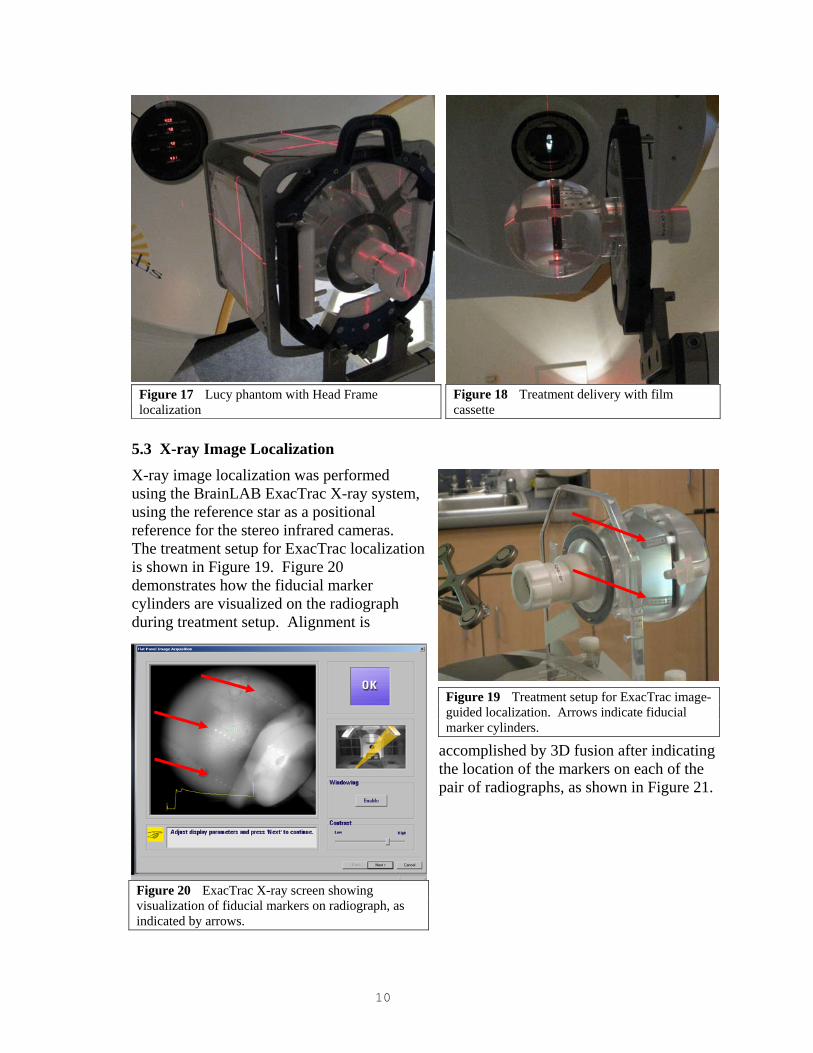
5.3 X-ray Image Localization X-ray image localization was performed using the BrainLAB ExacTrac X-ray system, using the reference star as a positional reference for the stereo infrared cameras. The treatment setup for ExacTrac localization is shown in Figure 19. Figure 20 demonstrates how the fiducial marker cylinders are visualized on the radiograph during treatment setup. Alignment is
accomplished by 3D fusion after indicating the location of the markers on each of the pair of radiographs, as shown in Figure 21.
Figure 17 Lucy phantom with Head Frame localization
Figure 18 Treatment delivery with film cassette
Figure 19 Treatment setup for ExacTrac image-guided localization. Arrows indicate fiducial marker cylinders.
Figure 20 ExacTrac X-ray screen showing visualization of fiducial markers on radiograph, as indicated by arrows.
11
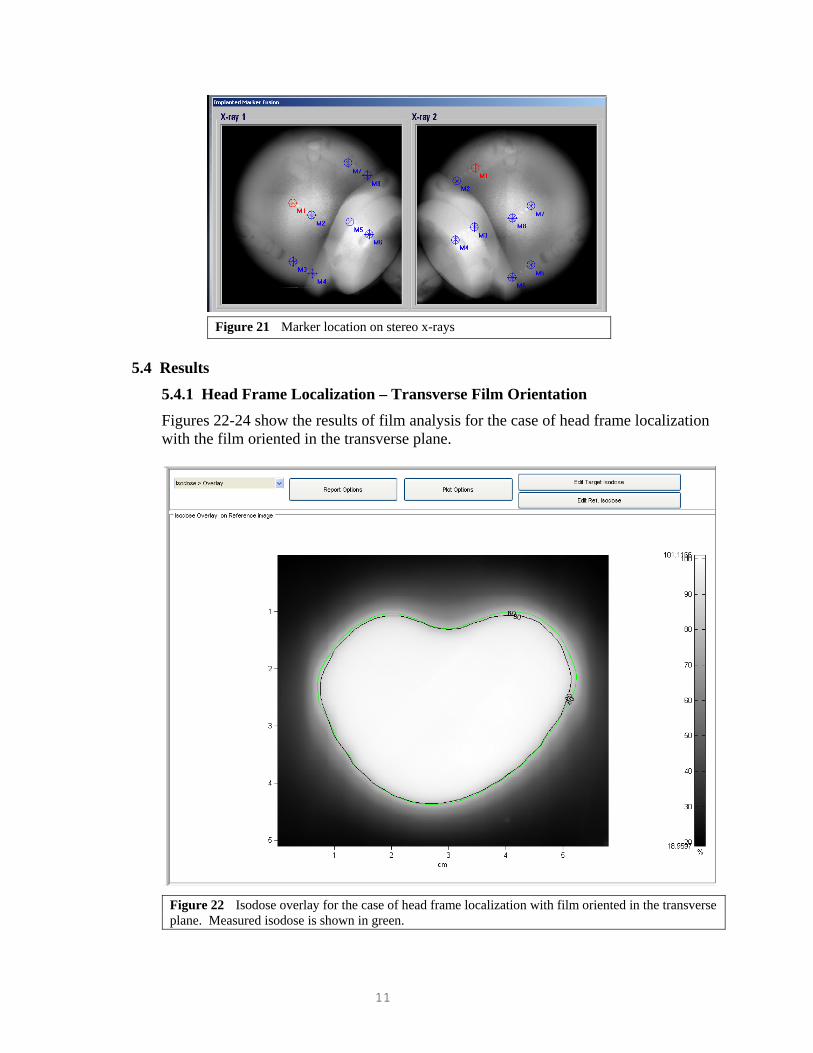
Figure 22 Isodose overlay for the case of head frame localization with film oriented in the transverse plane. Measured isodose is shown in green.
5.4 Results
5.4.1 Head Frame Localization – Transverse Film Orientation Figures 22-24 show the results of film analysis for the case of head frame localization with the film oriented in the transverse plane.
Figure 21 Marker location on stereo x-rays
12
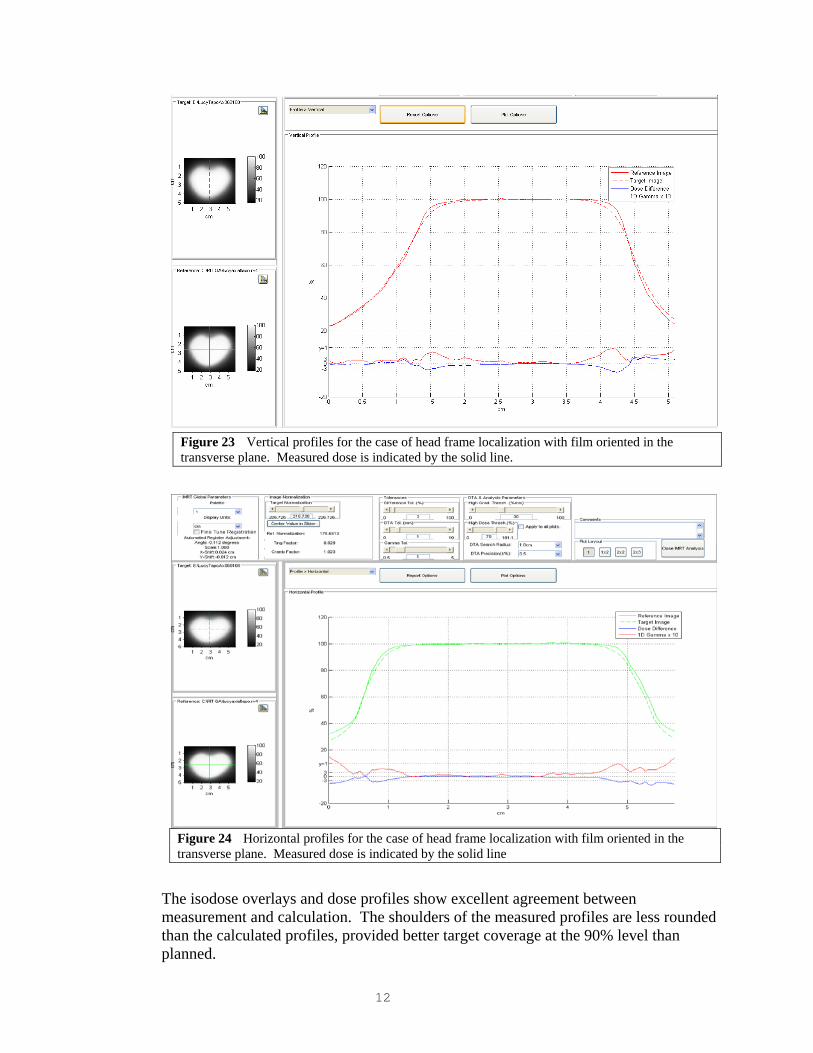
Figure 23 Vertical profiles for the case of head frame localization with film oriented in the transverse plane. Measured dose is indicated by the solid line.
Figure 24 Horizontal profiles for the case of head frame localization with film oriented in the transverse plane. Measured dose is indicated by the solid line
The isodose overlays and dose profiles show excellent agreement between measurement and calculation. The shoulders of the measured profiles are less rounded than the calculated profiles, provided better target coverage at the 90% level than planned.

13
5.4.2 Head Frame Localization – Sagittal Film Orientation Figures 25-27 show the results of film analysis for the case of head frame localization with the film oriented in the sagittal plane.
Figure 25 Isodose overlay for the case of head frame localization with film oriented in the sagittal plane. The measured dose is indicated by the green curve.

14
The isodose overlays and dose profiles show excellent agreement between measurement and calculation.
Figure 26 Vertical profiles for the case of head frame localization with film oriented in the sagittal plane. The measured dose is indicated by the solid line.
Figure 27 Horizontal profiles for the case of head frame localization with film oriented in the sagittal plane. The measured dose is indicated by the solid line.

15
5.4.3 Head Frame Localization – Coronal Film Orientation Figures 28-30 show the results of film analysis for the case of head frame localization with the film oriented in the sagittal plane.
Figure 28 Isodose overlay for the case of head frame localization with film oriented in the coronal plane. The measured dose is indicated by the green curve.

16
The isodose overlays and dose profiles show excellent agreement between measurement and calculation.
Figure 29 Vertical profiles for the case of head frame localization with film oriented in the coronal plane. The measured dose is indicated by the solid line.
Figure 30 Horizontal profiles for the case of head frame localization with film oriented in the coronal plane. The measured dose is indicated by the solid line.

17
5.4.4 ExacTrac X-ray Localization –Transverse Film Orientation Figures 31-33 show the results of film analysis for the case of ExacTrac X-ray localization with the film oriented in the transverse plane.
Figure 31 Isodose overlay for the case of ExacTrac X-ray localization with film oriented in the transverse plane. The measured dose is indicated by the green curve.

18
The isodose overlays and dose profiles show good agreement between measurement and calculation. The measured distribution is shifted laterally approximately 1 mm.
Figure 32 Vertical profiles for the case of ExacTrac X-ray localization with film oriented in the transverse plane. The measured dose is indicated by the solid line.
Figure 33 Horizontal profiles for the case of ExacTrac X-ray localization with film oriented in the transverse plane. The measured dose is indicated by the solid line.

19
5.4.5 ExacTrac X-ray Localization –Sagittal Film Orientation Figures 34-36 show the results of film analysis for the case of ExacTrac X-ray localization with the film oriented in the sagittal plane.
Figure 34 Isodose overlay for the case of ExacTrac X-ray localization with film oriented in the sagittal plane. The measured dose is indicated by the green curve.
20
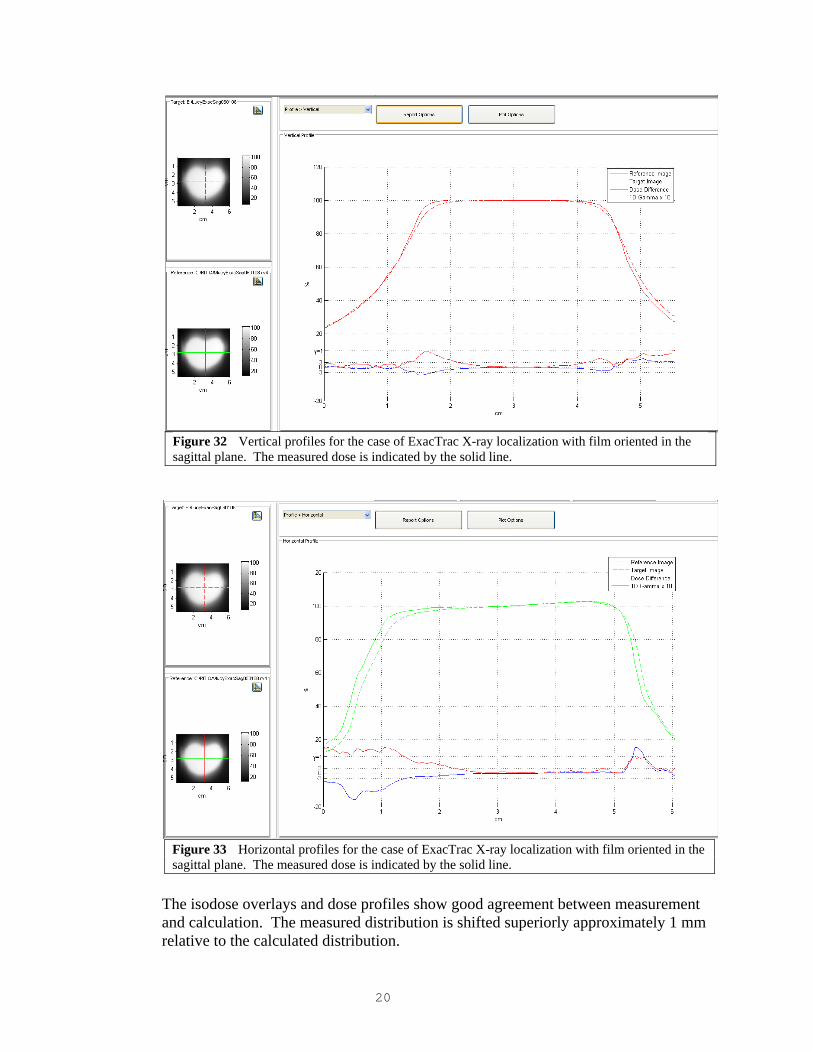
The isodose overlays and dose profiles show good agreement between measurement and calculation. The measured distribution is shifted superiorly approximately 1 mm relative to the calculated distribution.
Figure 32 Vertical profiles for the case of ExacTrac X-ray localization with film oriented in the sagittal plane. The measured dose is indicated by the solid line.
Figure 33 Horizontal profiles for the case of ExacTrac X-ray localization with film oriented in the sagittal plane. The measured dose is indicated by the solid line.

21
6.0 Conclusions The results of the end-to-end tests with the Lucy phantom demonstrates that the radiosurgery processes, with the physical components included in the tests, deliver dose distributions as planned with spatial and dosimetric accuracy appropriate for stereotactic radiosurgery.
The measured distributions had generally sharper shoulders than the planned distributions, suggesting that measured beam profiles for beam modeling was possibly affected by volume averaging of the detector.
Both tests with x-ray image localization resulted in a 1 mm horizontal shift parallel to the plane of the imaging insert.
_________________________________
Sam S. Hancock, PhD, DABR, DABMP