enabling the circular economy
TRANSCRIPT

1
ENABLING THECIRCULAR ECONOMYINVESTOR PRESENTATION | COMPANY DESCRIPTION 2021
AMG ADVANCED
METALLURGICAL GROUP N.V.

CAUTIONARY NOTE
2
This document contains proprietary information and is being provided solely for information purposes by
AMG Advanced Metallurgical Group N.V. (The “Company”) and may not be reproduced in any form or further
distributed to any other person or published, in whole or in part, for any purpose, except with the prior written consent
of the company. Failure to comply with this restriction may constitute a violation of applicable securities laws.
This presentation does not constitute or form part of, and should not be construed as, an offer to sell or issue or the solicitation of an offer to buy or acquire securities of the Company or any of its subsidiaries nor should it or any part of it, nor the fact of its distribution, form the basis of, or be relied on in connection with, any contract or commitment whatsoever.
This presentation has been prepared by, and is the sole responsibility of, the Company. This document, any presentation made in conjunction herewith and any accompanying materials are for information only and are not a prospectus, offering circular or admission document. This presentation does not form a part of, and should not be construed as, an offer, invitation or solicitation to subscribe for or purchase, or dispose of any of the securities of the companies mentioned in this presentation. These materials do not constitute an offer of securities for sale in the United States or an invitation or an offer to the public or form of application to subscribe for securities. Neither this presentation nor anything contained herein shall form the basis of, or be relied on in connection with, any offer or commitment whatsoever. The information contained in this presentation has not been independently verified. No representation or warranty, express or implied, is made as to, and no reliance should be placed on, the fairness, accuracy or completeness of the information or the opinions contained herein. The Company and its advisors are under no obligation to update or keep current the information contained in this presentation. To the extent allowed by law, none of the Company or its affiliates, advisors or representatives accept any liability whatsoever (in negligence or otherwise) for any loss howsoever arising from any use of this presentation or its contents or otherwise arising in connection with the presentation.
Certain statements in this presentation constitute forward-looking statements, including statements regarding the Company's financial position, business strategy, plans and objectives of management for future operations. These statements, which contain the words "believe,” “expect,” “anticipate,” “intends,” “estimate,” “forecast,” “project,” “will,” “may,” “should” and similar expressions, reflect the beliefs and expectations of the management board of directors of the Company and are subject to risks and uncertainties that may cause actual results to differ materially. These risks and uncertainties include, among other factors, the achievement of the anticipated levels of profitability, growth, cost and synergy of the Company’s recent acquisitions, the timely development and acceptance of new products, the impact of competitive pricing, the ability to obtain necessary regulatory approvals, and the impact of general business and global economic conditions. These and other factors could adversely affect the outcome and financial effects of the plans and events described herein.
Neither the Company, nor any of its respective agents, employees or advisors intend or have any duty or obligation to supplement, amend, update or revise any of the forward-looking statements contained in this presentation.
The information and opinions contained in this document are provided as at the date of this presentation and are subject to change without notice.
This document has not been approved by any competent regulatory or supervisory authority.

GLOBAL TRENDS
CO2 emission reduction,
circular economy,
population growth,
increasing affluence,
and energy efficiency
DEMAND
Innovative new products
that are lighter, stronger,
and resistant to higher
temperatures
SUPPLY
AMG sources, processes,
and supplies the critical
minerals that the market
demands
AMG IS A
CRITICAL
MATERIALS
COMPANY
3

AMG:
ENABLING TECHNOLOGIES
Products and processes saving CO2
emissions during use (e.g., light-weighting
and fuel efficiency in the aerospace and
automotive industries)
LEADER IN ADVANCED TECHNOLOGIES
TO ADDRESS CO2 REDUCTION
A GLOBAL IMPERATIVE
FOR THE 21ST CENTURY
CO2 REDUCTION
AMG:
MITIGATING TECHNOLOGIES
Products and processes saving raw
minerals, energy and CO2 emissions
during manufacturing (e.g., recycling
of Ferrovanadium)
4
6.1%CAGR
AMG’S ENABLED CO2 EMISSION REDUCTIONS
(Million MT)
42.0
43.4
45.6
50.8
67.8
56.6
2015
2016
2017
2018
2019
2020
* 2020 decrease due to the global pandemic significantly
impacting volumes in our aerospace exposed businesses.
*

51% Critical
Materials
Technologies
23% Critical
Minerals
AMG AT A GLANCE
AMG IS A
GLOBAL SUPPLIER
OF CRITICAL
MINERALS TO:
FY 2020 REVENUE
TRANSPORTATIONENERGY INFRASTRUCTURE SPECIALTY METALS
AND CHEMICALS
BY
SEGMENT
20% Infrastructure
22% Specialty Metals
& Chemicals
40% Transportation
18% Energy
Market leading producer of highly
engineered specialty metals and
vacuum furnace systems
~3,000Employees
~$1 billionAnnual Revenues
At the forefront of
CO2 Reduction
5
BY END
MARKET
26% Clean Energy
Materials
40% Europe
32% North America
23% Asia
5% ROW
BY
REGION

AMG BUSINESS SEGMENTS
AMG CRITICAL MINERALSAMG CLEAN ENERGY MATERIALS
AMG’s mining and recycling business AMG’s conversion and mining business
• Silicon Metal
• Graphite
• Antimony
6
32% Infrastructure
12%
Specialty Metals
& Chemicals 32% Transportation
24% Energy
2020 REVENUE
• Vanadium
• Mineração (Tantalum & Lithium)
• Aluminum (Master Alloys)
27% Infrastructure
35%
Specialty Metals
& Chemicals
28% Transportation
10% Energy2020
REVENUE
AMG BUSINESS SEGMENTS
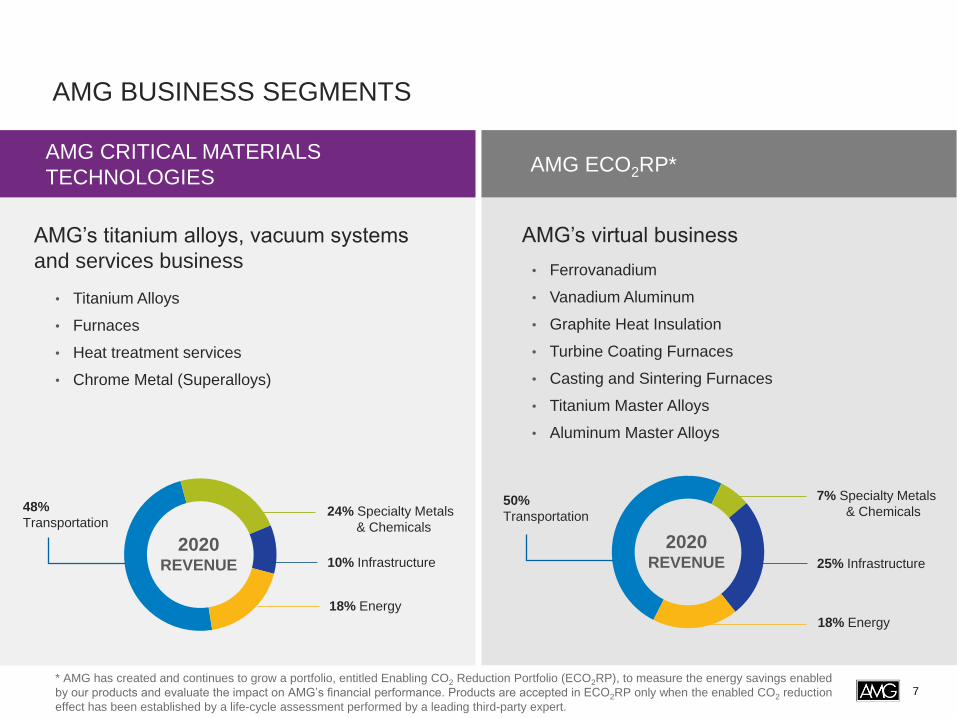
AMG ECO2RP*AMG CRITICAL MATERIALS
TECHNOLOGIES
AMG’s virtual business
• Ferrovanadium
• Vanadium Aluminum
• Graphite Heat Insulation
• Turbine Coating Furnaces
• Casting and Sintering Furnaces
• Titanium Master Alloys
• Aluminum Master Alloys
7
25% Infrastructure
7% Specialty Metals
& Chemicals 50%
Transportation
18% Energy
2020 REVENUE
AMG’s titanium alloys, vacuum systems
and services business
• Titanium Alloys
• Furnaces
• Heat treatment services
• Chrome Metal (Superalloys)
10% Infrastructure
24% Specialty Metals
& Chemicals
48%
Transportation
18% Energy
2020 REVENUE
* AMG has created and continues to grow a portfolio, entitled Enabling CO2 Reduction Portfolio (ECO2RP), to measure the energy savings enabled
by our products and evaluate the impact on AMG’s financial performance. Products are accepted in ECO2RP only when the enabled CO2 reduction
effect has been established by a life-cycle assessment performed by a leading third-party expert.

STRONG FUNDAMENTALS, ADAPTIVE TO GLOBAL DISRUPTION
Business
Resilience
Optimized
Capital Structure
• Focus on operational efficiency
• Reduction of operating costs and capital expenditures
• Momentum on positive business gains, strong backlogs into early 2021
• Robust liquidity: AMG issued 3.1 million new shares in April 2021, generating
$119 million of net proceeds and increasing current liquidity to approximately
$500 million
• Covenant-lite Term Loan B matures in 2025
• $307M 30-year 4.3% Municipal Bond finances 100% of the ferrovanadium
expansion in Zanesville, OH
Disciplined
Approach to
Growth
• Shell & AMG Recycling B.V. joint venture operational
• Ohio ferrovanadium expansion underway
• Lithium hydroxide refining plant in Germany
The fundamental positions of our businesses are sound, and AMG
remains focused on disciplined, sustainable growth
8

STRATEGY
INDUSTRY
CONSOLIDATION
PROCESS INNOVATION
& PRODUCT DEVELOPMENT
Pursue opportunities for
horizontal and vertical industry
consolidation across AMG’s
critical minerals portfolio
Continue to focus on process
innovation and product
development to improve the
market position of AMG’s
businesses
AMG’s strategy is to build its critical minerals business through industry
consolidation, process innovation and product development
EXPANSION OF EXISTING
HIGH-GROWTH BUSINESSES
Pursue opportunities in
high-growth areas within the
existing product portfolio
AMG’s overriding strategic objective is to achieve industry leadership while being
the low-cost producer
9

CRITICAL RAW MATERIALS: AMG PRESENCE
10
US Critical Materials EU Critical Materials• AMG has a unique
critical materials
portfolio comprising
of 9 EU critical
materials and 10 US
critical materials
• The EU identifies
30 total critical raw
materials, the US 35
*AMG possesses technology license patent for production of Magnesium products
Sources: The 2020 EU Critical Raw Materials List, published September 2020; and the U.S. list of Critical
Materials per the May 2018 announcement by the U.S. Department of the Interior.
Magnesium*Germanium
Gallium
Beryllium
PGMs
PhosphateRock
Borate
Antimony
Silicon Metal
Light REE
Heavy REE
Niobium
Natural Graphite
Tungsten
Chromium Metal Vanadium
Tantalum
Baryte
Bismuth
Cobalt
Fluorspar
Hafnium
ScandiumIndium
PhosphorusHelium
Aluminum
Tin
Titanium
Lithium
Potash
Cesium
Manganese
Strontium
Rubidium
Tellurium
Rhenium
Uranium
ZirconiumCoking Coal
NaturalRubber

AMG GLOBAL FOOTPRINT: CLEAN ENERGY MATERIALS
11
U.S.A.
Brazil
China
U.K.

AMG GLOBAL FOOTPRINT: CRITICAL MINERALS
12
China
Germany
France
Sri Lanka
Mozambique

AMG GLOBAL FOOTPRINT: CRITICAL MATERIALS TECHNOLOGIES
13
New Castle(PA), USA
East Windsor(CT), USA
RotherdamU.K.
LimbachGERMANY GERMANY
Port Huron(MI), USA
Mexico CityMEXICO
SuzhouCHINA
GrenobleFRANCE
FrankfurtGERMANYHead Office

HEALTH AND SAFETY FOCUS
Internal safety performance
in both lost time incidence
rate and recordable
incidence rate has
improved year-over-year.
YEARLOST TIME INCIDENTS
IN THE LAST 12 MONTHS
12 MONTH AVERAGE
LOST TIME INCIDENT RATE
12 MONTH AVERAGE
TOTAL INCIDENT RATE
2019 25 0.80 1.46
2020 16 0.62 1.05
Safety Indicators
AMG compares itself to the industry average
for Primary Metal Manufacturing (NAICS 331).
The most recent data provided in 2019 by the
United States Bureau of Labor Statistics
reports that the Primary Metal Manufacturing
industry’s total recordable case rate was 4.40
and the lost time rate was 2.70.
14

CLEAN ENERGY MATERIALS – MARKET TRENDS
CRITICAL MINERALS MAJOR END MARKETS MARKET TRENDS MAJOR CUSTOMERS
AMG VANADIUM
FERROVANADIUM
FERRONICKEL-MOLYBDENUM
INFRASTRUCTURE
INFRASTRUCTURE
GROWTH
VANADIUM REDOX FLOW
BATTERIES
AMG BRAZIL
TANTALUM & NIOBIUM
MICRO CAPACITORS,
SUPERALLOYS
COMMUNICATIONS &
ELECTRONICS
FUEL EFFICIENCY
AMG LITHIUM
LITHIUM CONCENTRATE
(SPODUMENE)
BATTERIES
RENEWABLE ENERGY
COMMUNICATIONS &
ELECTRONICS
AMG ALUMINUM
ALUMINUM MASTER ALLOYS
ALUMINUM POWDERS
AEROSPACE,
AUTOMOTIVEFUEL EFFICIENCY
ENERGY TRANSPORTATION INFRASTRUCTURE SPEC. METALS AND CHEM.
15
CONFIDENTIAL

CRITICAL MINERALS – MARKET TRENDS
CRITICAL MINERALS MAJOR END MARKETS MARKET TRENDS MAJOR CUSTOMERS
AMG GRAPHITE
NATURAL GRAPHITE
EXPANDED POLYSTYRENE
(EPS),BATTERY ANODES
ENERGY SAVING
ENERGY STORAGE
AMG ANTIMONY
ANTIMONY TRIOXIDE
ANTIMONY MASTERBATCHES
ANTIMONY PASTES
FLAME RETARDANTS PLASTICS
AMG SILICON
SILICON METAL
ALUMINUM ALLOYS,
SOLAR
FUEL EFFICIENCY
CLEAN ENERGY
ENERGY TRANSPORTATION INFRASTRUCTURE SPEC. METALS AND CHEM.
16

CRITICAL MATERIALS TECHNOLOGIES – MARKET TRENDS
CRITICAL MINERALS MAJOR END MARKETS MARKET TRENDS MAJOR CUSTOMERS
AMG TITANIUM ALLOYS
TITANIUM MASTER ALLOYS
& COATINGS
AEROSPACEFUEL EFFICIENCY
ENERGY SAVING
AMG ENGINEERING
CAPITAL GOODS
(VACUUM FURNACES)
AEROSPACE,
AUTOMOTIVE
FUEL EFFICIENCY
ELECTRONICS
AMG ENGINEERING
VACUUM HEAT
TREATMENT SERVICES
AEROSPACE,
AUTOMOTIVEFUEL EFFICIENCY
AMG CHROME
CHROMIUM METAL
AEROSPACE, DISTRIBUTED
ENERGY, FUEL CELLSFUEL EFFICIENCY
ENERGY TRANSPORTATION INFRASTRUCTURE SPEC. METALS AND CHEM.
17

FINANCIALHIGHLIGHTS
18
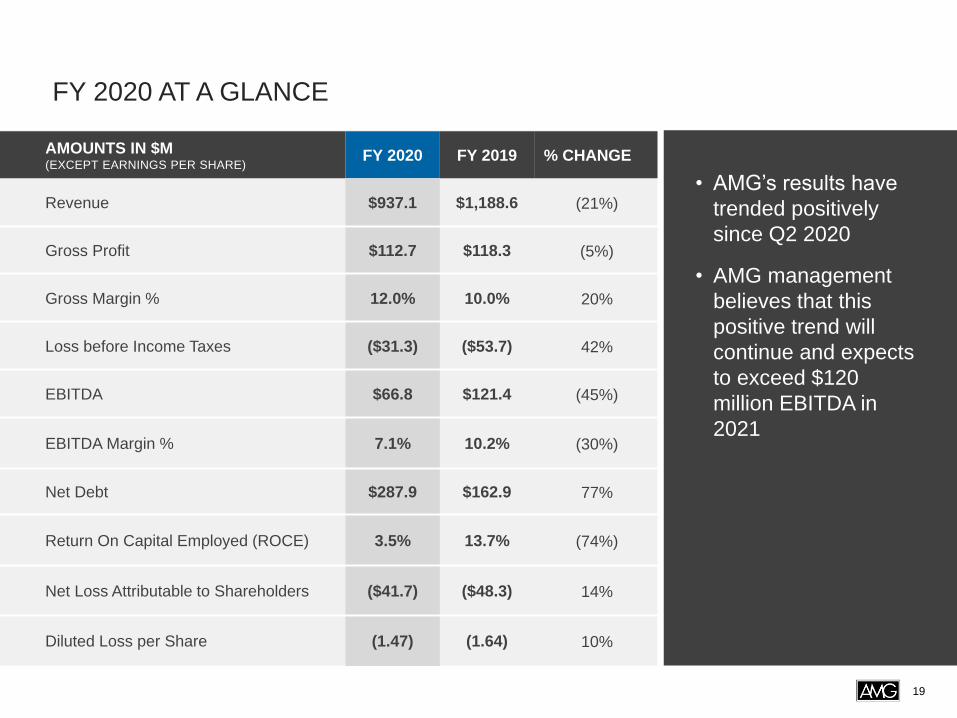
FY 2020 AT A GLANCE
• AMG’s results have
trended positively
since Q2 2020
• AMG management
believes that this
positive trend will
continue and expects
to exceed $120
million EBITDA in
2021
19
AMOUNTS IN $M (EXCEPT EARNINGS PER SHARE)
FY 2020 FY 2019 % CHANGE
Revenue $937.1 $1,188.6 (21%)
Gross Profit $112.7 $118.3 (5%)
Gross Margin % 12.0% 10.0% 20%
Loss before Income Taxes ($31.3) ($53.7) 42%
EBITDA $66.8 $121.4 (45%)
EBITDA Margin % 7.1% 10.2% (30%)
Net Debt $287.9 $162.9 77%
Return On Capital Employed (ROCE) 3.5% 13.7% (74%)
Net Loss Attributable to Shareholders ($41.7) ($48.3) 14%
Diluted Loss per Share (1.47) (1.64) 10%

CONSOLIDATED BALANCE SHEET
AS OFIN MILLIONS OF US DOLLARS
DECEMBER 31, 2020 DECEMBER 31, 2019
Fixed assets 551.9 430.0
Goodwill and intangibles 43.2 41.9
Other non-current assets 96.0 96.5
Restricted cash 208.9 309.6
Inventories 152.3 204.2
Receivables 122.4 119.1
Other current assets 56.9 44.5
Cash 207.4 226.2
TOTAL ASSETS 1,439.0 1,472.0
TOTAL EQUITY 141.3 184.4
Long-term debt 673.3 669.5
Long-term lease liabilities 47.1 46.5
Employee benefits 197.2 175.9
Other long-term liabilities 37.7 41.2
Current debt 31.0 29.2
Current lease liabilities 4.8 4.2
Accounts payable and accruals 231.1 217.6
Advance payments 29.9 57.6
Other current liabilities 45.6 45.9
TOTAL LIABILITIES 1,297.7 1,287.6
TOTAL EQUITY AND LIABILITIES 1,439.0 1,472.0
20

CONSOLIDATED INCOME STATEMENT
FOR THE YEAR ENDED IN MILLIONS OF US DOLLARS
DECEMBER 31, 2020 DECEMBER 31, 2019
Revenue 937.1 1,188.6
Cost of sales 824.5 1,070.3
Gross profit 112.6 118.3
Selling, general & administrative 117.8 143.5
Environmental expense 4.3 0.7
Other income, net (0.2) (0.2)
Operating loss (9.3) (25.8)
Net finance costs 21.1 27.9
Share of loss of associates (0.9) –
Loss before income taxes (31.3) (53.7)
Income tax expense (benefit) 11.2 (5.1)
Loss for the year (42.5) (48.6)
Shareholders of the Company (41.7) (48.3)
Non-controlling interest (0.8) (0.3)
ADJUSTED EBITDA 66.8 121.4
21

CONSOLIDATED STATEMENT OF CASH FLOWS
FOR THE YEAR ENDED IN MILLIONS OF US DOLLARS
DECEMBER 31, 2020 DECEMBER 31, 2019
EBITDA 66.8 121.4
Change in working capital and deferred revenue 10.8 76.2
Other operating cash flow (30.0) (103.3)
Cash generated from operating activities 47.6 94.3
Finance costs paid, net (19.4) (23.1)
Income tax paid (8.6) (24.6)
Net cash flow from operating activities 19.6 46.6
Capital expenditures (137.7) (79.4)
Change in restricted cash (municipal bond) 100.7 (307.9)
Other investing activities (0.9) (22.6)
Net cash flow used in investing activities (37.9) (409.9)
Net cash flow (used in) from financing activities (9.2) 208.7
Net decrease in cash and equivalents (27.5) (154.6)
Cash and equivalents at January 1 226.2 381.9
Effect of exchange rate fluctuations on cash held 8.7 (1.1)
CASH AND EQUIVALENTS AT DECEMBER 31 207.4 226.2
22

NET LOSS TO EBITDA RECONCILIATION
23
FOR THE YEAR ENDEDIN MILLIONS OF US DOLLARS
DECEMBER 31, 2020 DECEMBER 31, 2019
Net loss for the year (42,460) (48,586)
Income tax expense (benefit) 11,184 (5,119)
Net finance cost * 23,524 27,626
Equity-settled share-based payment transactions ** 3,792 5,514
Restructuring expense 5,700 3,265
Inventory cost adjustment 6,219 87,792
Asset impairment expense 664 4,519
Environmental provision 4,342 725
Exceptional legal expense 1,353 3,133
Strategic project expense 7,085 –
Share of loss of associates 947 –
Others 756 546
EBIT 23,106 79,415
Depreciation and amortization 43,661 41,967
EBITDA 66,767 121,382
*Excludes foreign exchange (gain) loss.
**Amount includes variable compensation expense which is expected to be share-settled in 2021.
24