enabling sustainable urban growth - ani dasgupta - wri ross center for sustainable cities
TRANSCRIPT
1 1
ANI DASGUPTA, GLOBAL DIRECTOR, WRI ROSS CENTER FOR SUSTAINABLE CITIES, WORLD RESOURCES INSTITUTE (WRI)
ENABLING SUSTAINABLE URBAN GROWTH
Deutsche Institut für Entwicklungspolitik (DIE) – German Development Institute – February 11, 2015
Implementing Effective, Efficient, Equitable Urban Solutions
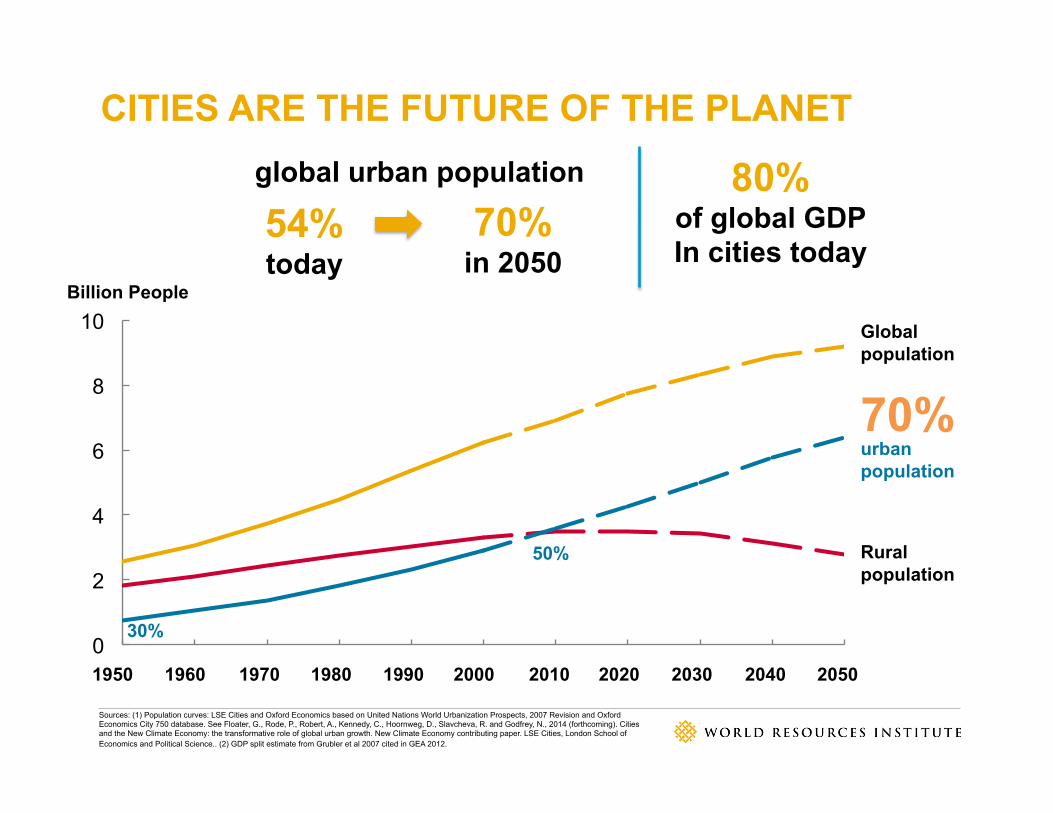
CITIES ARE THE FUTURE OF THE PLANET
Sources: (1) Population curves: LSE Cities and Oxford Economics based on United Nations World Urbanization Prospects, 2007 Revision and Oxford Economics City 750 database. See Floater, G., Rode, P., Robert, A., Kennedy, C., Hoornweg, D., Slavcheva, R. and Godfrey, N., 2014 (forthcoming). Cities and the New Climate Economy: the transformative role of global urban growth. New Climate Economy contributing paper. LSE Cities, London School of Economics and Political Science.. (2) GDP split estimate from Grubler et al 2007 cited in GEA 2012.
Billion People
0
2
4
6
8
10
2050 2040 2030 2020 2010 2000 1990 1980 1970 1960 1950
Global population
urban population
Rural population
70%
50%
30%
54% today
70% in 2050
80% of global GDP In cities today
global urban population
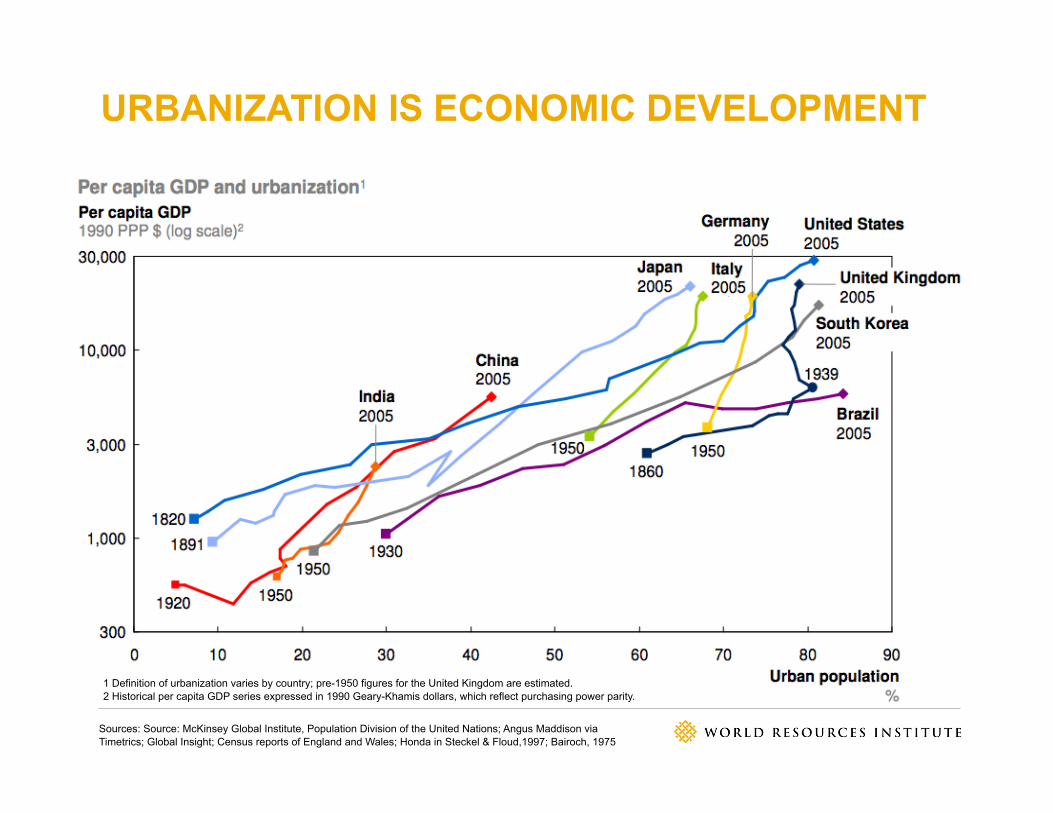
URBANIZATION IS ECONOMIC DEVELOPMENT
Sources: Source: McKinsey Global Institute, Population Division of the United Nations; Angus Maddison via Timetrics; Global Insight; Census reports of England and Wales; Honda in Steckel & Floud,1997; Bairoch, 1975
1 Definition of urbanization varies by country; pre-1950 figures for the United Kingdom are estimated. 2 Historical per capita GDP series expressed in 1990 Geary-Khamis dollars, which reflect purchasing power parity.
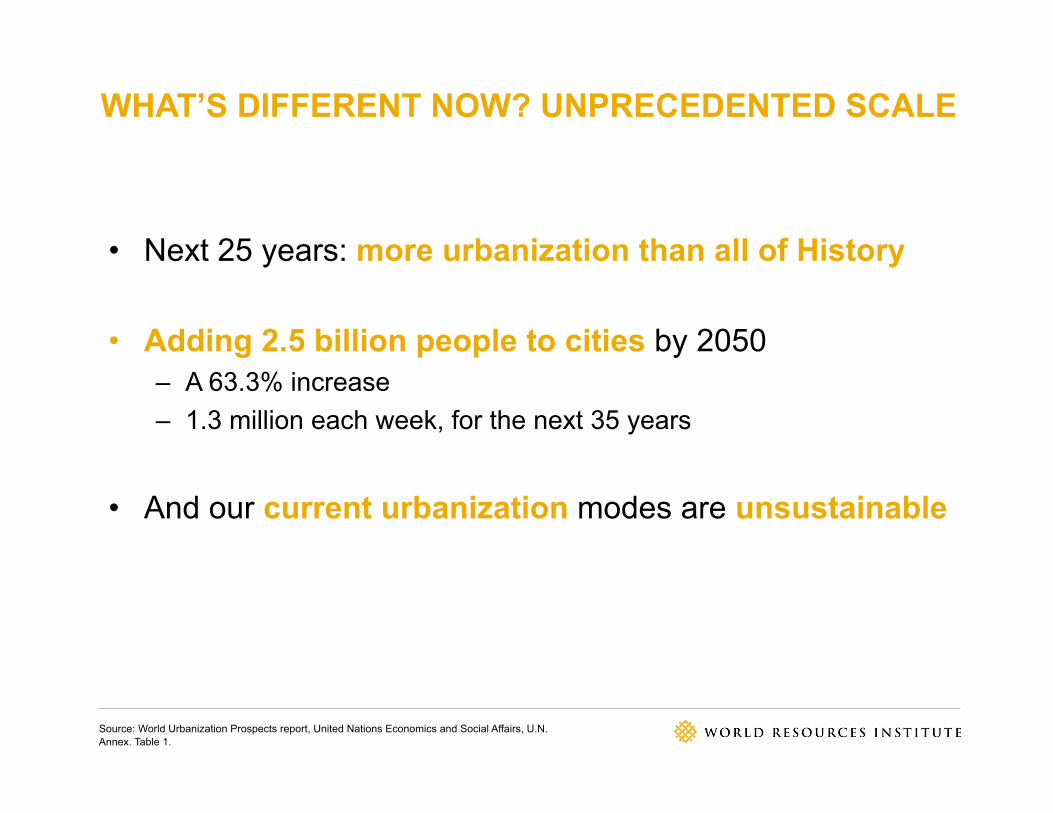
WHAT’S DIFFERENT NOW? UNPRECEDENTED SCALE
Source: World Urbanization Prospects report, United Nations Economics and Social Affairs, U.N. Annex. Table 1.
• Next 25 years: more urbanization than all of History
• Adding 2.5 billion people to cities by 2050 – A 63.3% increase – 1.3 million each week, for the next 35 years
• And our current urbanization modes are unsustainable
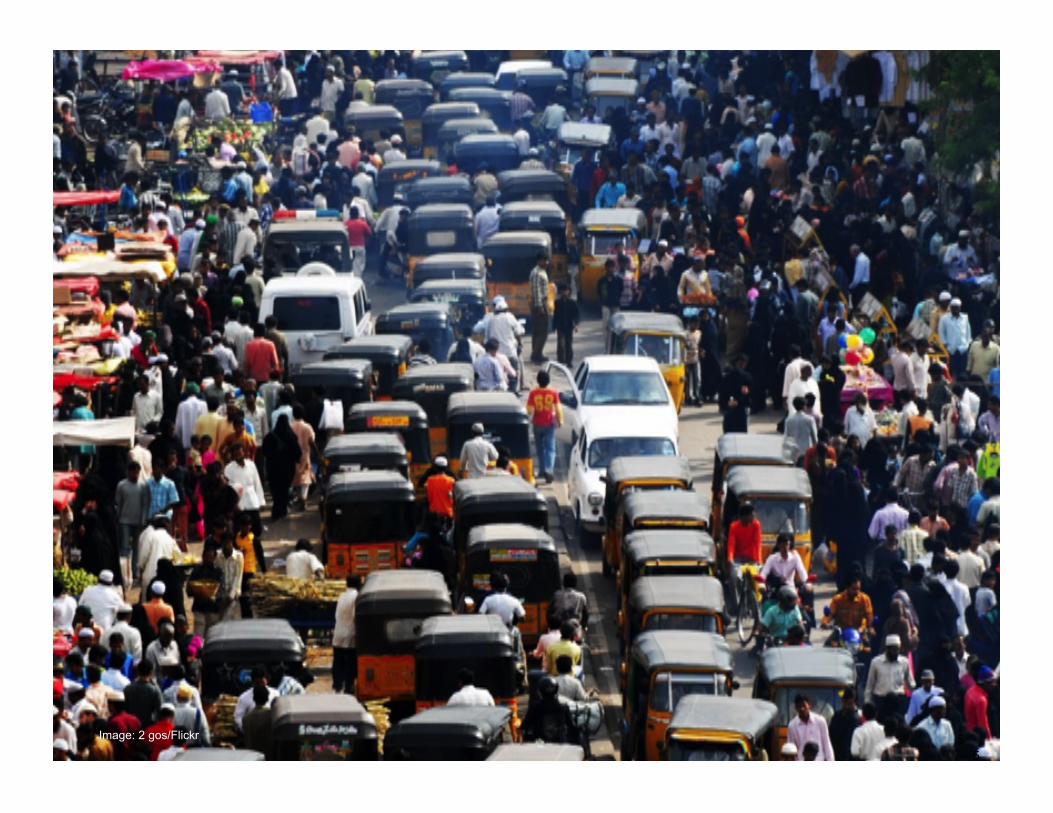
5 5
Image: 2 gos/Flickr
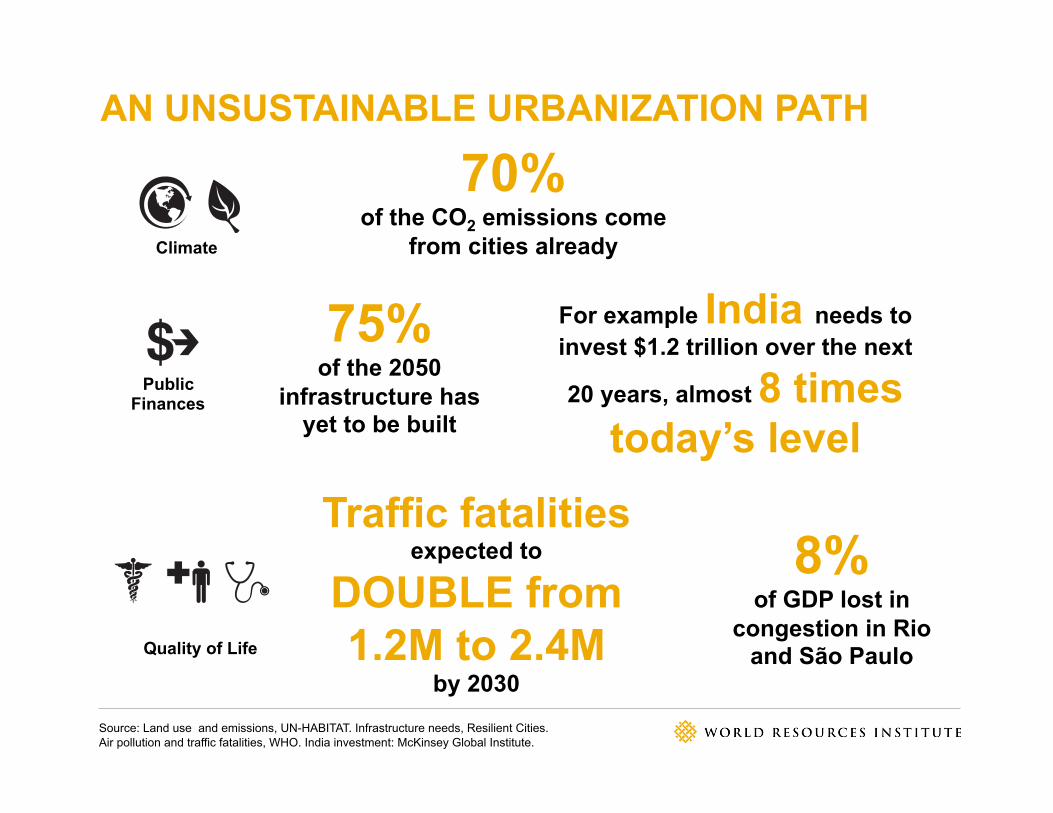
AN UNSUSTAINABLE URBANIZATION PATH
Source: Land use and emissions, UN-HABITAT. Infrastructure needs, Resilient Cities. Air pollution and traffic fatalities, WHO. India investment: McKinsey Global Institute.
70% of the CO2 emissions come
from cities already
75% of the 2050
infrastructure has yet to be built
Climate
Public Finances
Quality of Life
Traffic fatalities expected to
DOUBLE from 1.2M to 2.4M
by 2030
For example India needs to invest $1.2 trillion over the next
20 years, almost 8 times today’s level
8% of GDP lost in
congestion in Rio and São Paulo
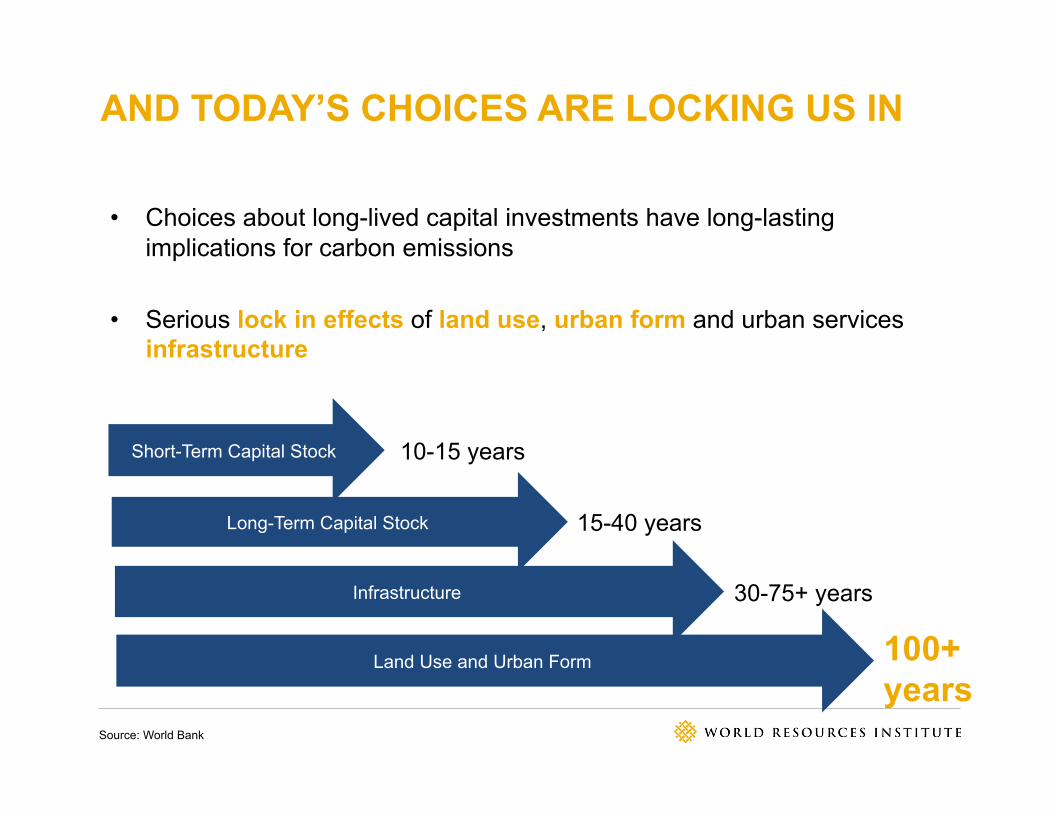
AND TODAY’S CHOICES ARE LOCKING US IN
• Choices about long-lived capital investments have long-lasting implications for carbon emissions
• Serious lock in effects of land use, urban form and urban services infrastructure
Source: World Bank
Short-Term Capital Stock�
Long-Term Capital Stock�
Infrastructure �
Land Use and Urban Form�
10-15 years�
15-40 years�
30-75+ years�
100+ years�
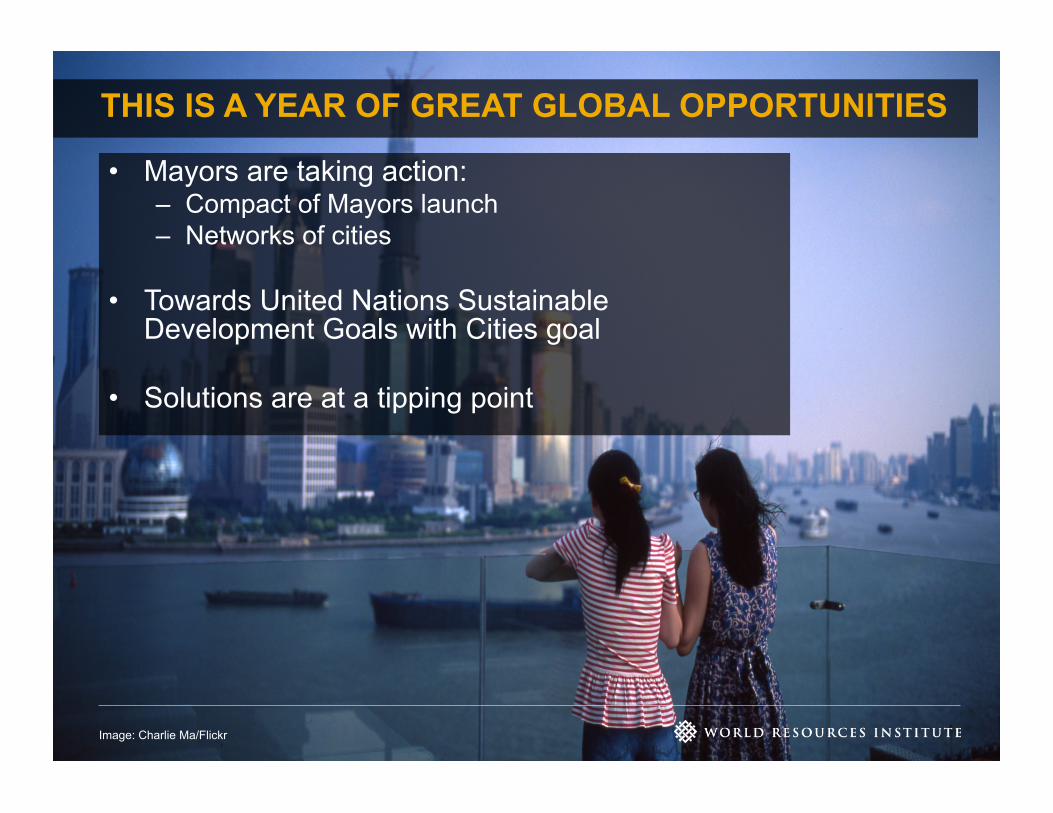
THIS IS A YEAR OF GREAT GLOBAL OPPORTUNITIES
• Mayors are taking action: – Compact of Mayors launch – Networks of cities
• Towards United Nations Sustainable Development Goals with Cities goal
• Solutions are at a tipping point
Image: Charlie Ma/Flickr
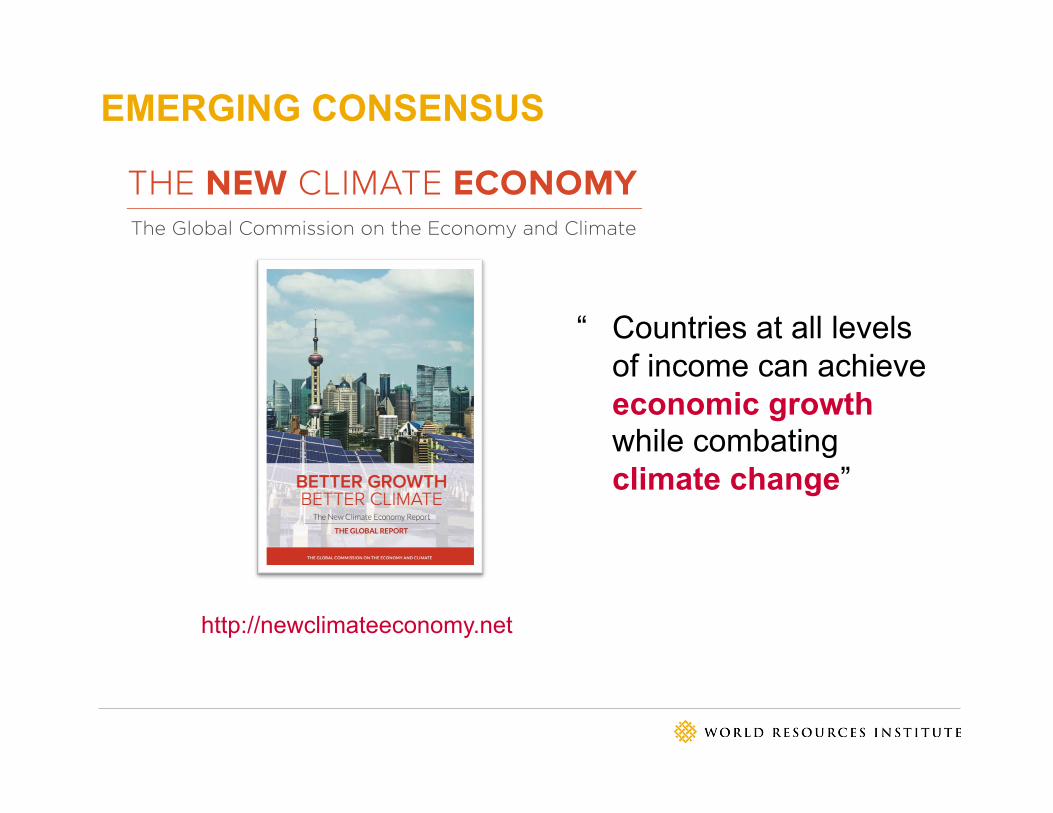
EMERGING CONSENSUS
“ Countries at all levels of income can achieve economic growth while combating climate change”
http://newclimateeconomy.net
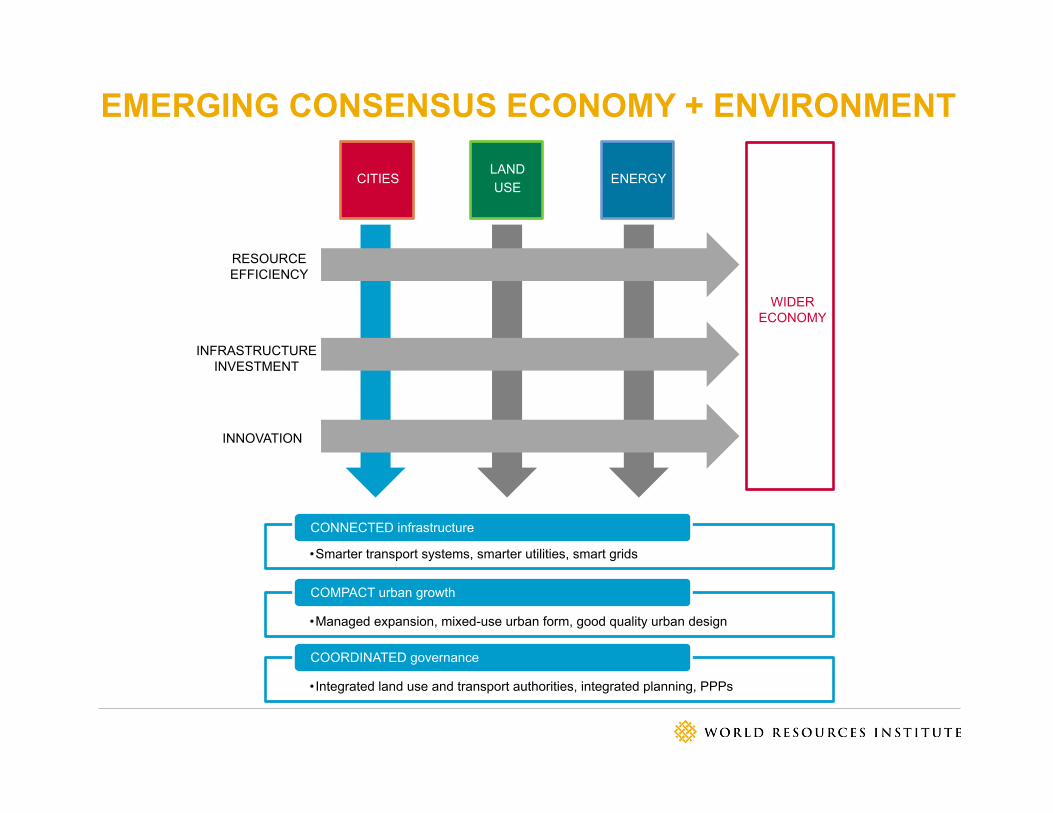
EMERGING CONSENSUS ECONOMY + ENVIRONMENT
RESOURCE EFFICIENCY
INNOVATION
INFRASTRUCTURE INVESTMENT
ENERGY LAND USE CITIES
WIDER ECONOMY
• Smarter transport systems, smarter utilities, smart grids
CONNECTED infrastructure
• Managed expansion, mixed-use urban form, good quality urban design
COMPACT urban growth
• Integrated land use and transport authorities, integrated planning, PPPs
COORDINATED governance

Atlanta’s built-up area Barcelona’s built-up area
Population: 2.5 million Urban area: 4,280 km2
Transport carbon emissions: 7.5 tonnes CO2 per person (public+ private transport)
Population: 2.8 million Urban area: 162 km2
Transport carbon emissions: 0.7 tonnes CO2 per person (public+ private transport)
ATLANTA BARCELONA
DIFFERENT MODELS, VERY DIFFERENT OUTCOMES

Source: The New Climate Economy, 2014
DECOUPLING GDP <> EMISSIONS

Source: Axel Baeumler, Sustainable Low-Carbon City Development in China, The World Bank. June 2012.
DENSITY MATTERS TO BE LOW-CARBON
Cities density and emissions per capita
Shanghai
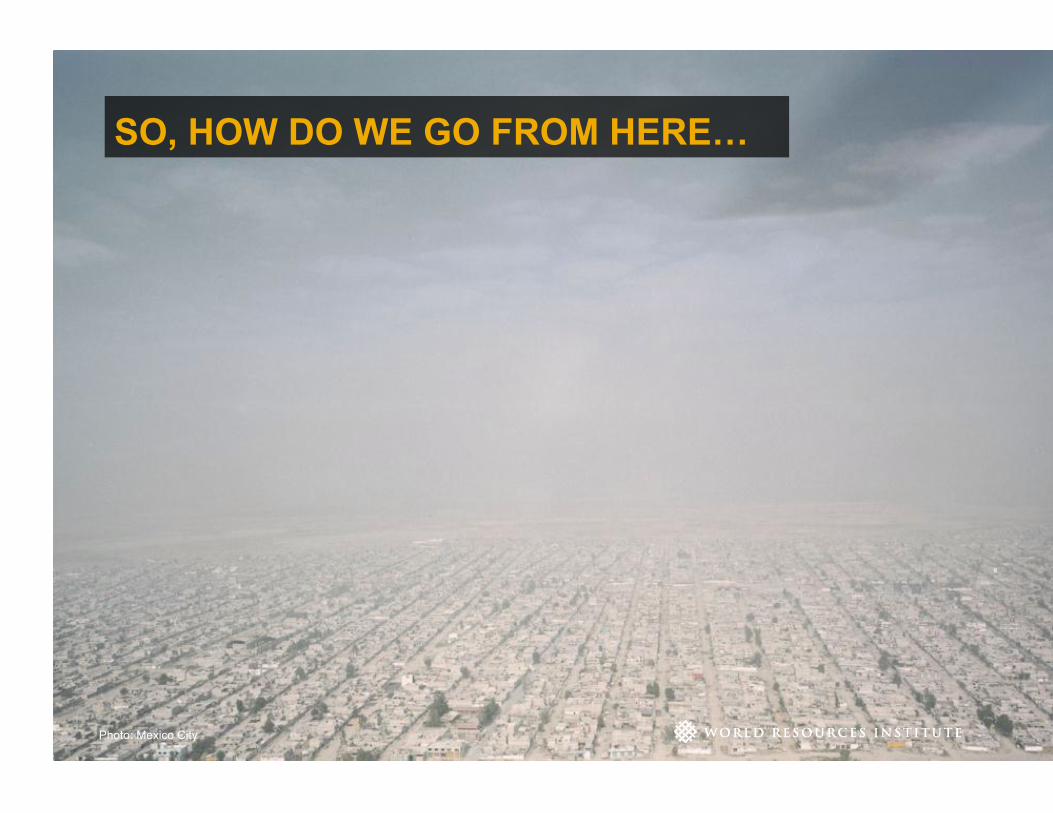
Photo: Mexico City
SO, HOW DO WE GO FROM HERE…
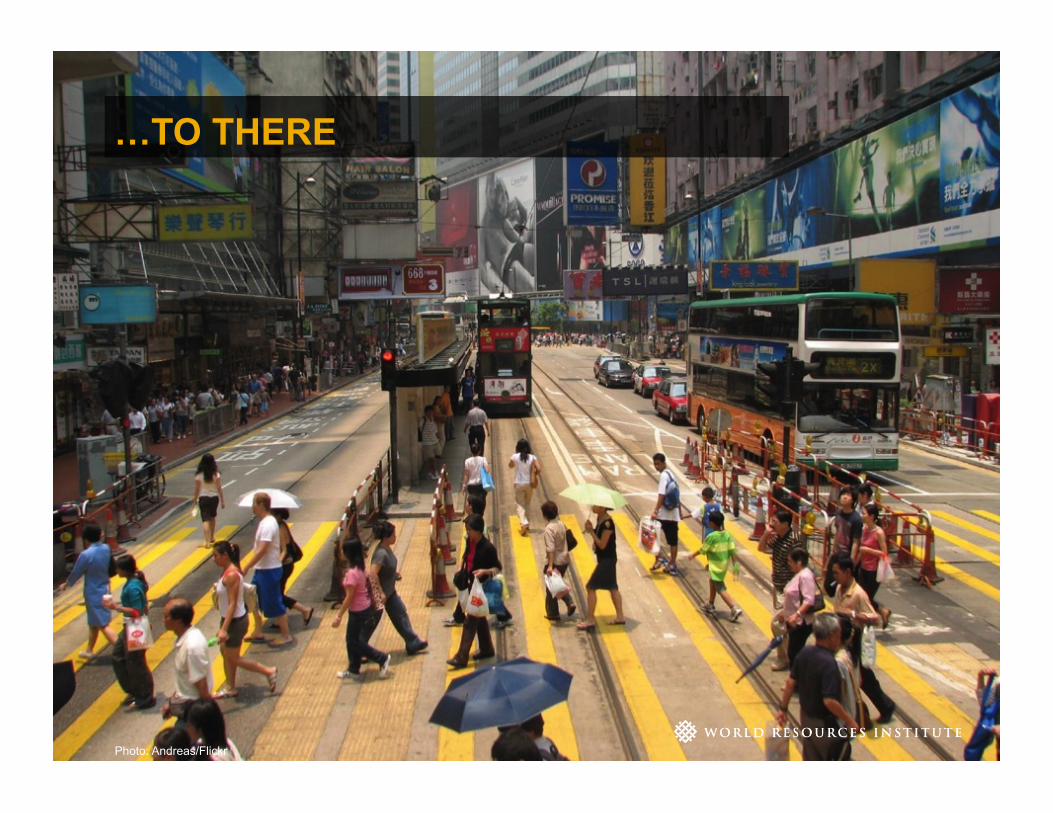
…TO THERE
Photo: Andreas/Flickr
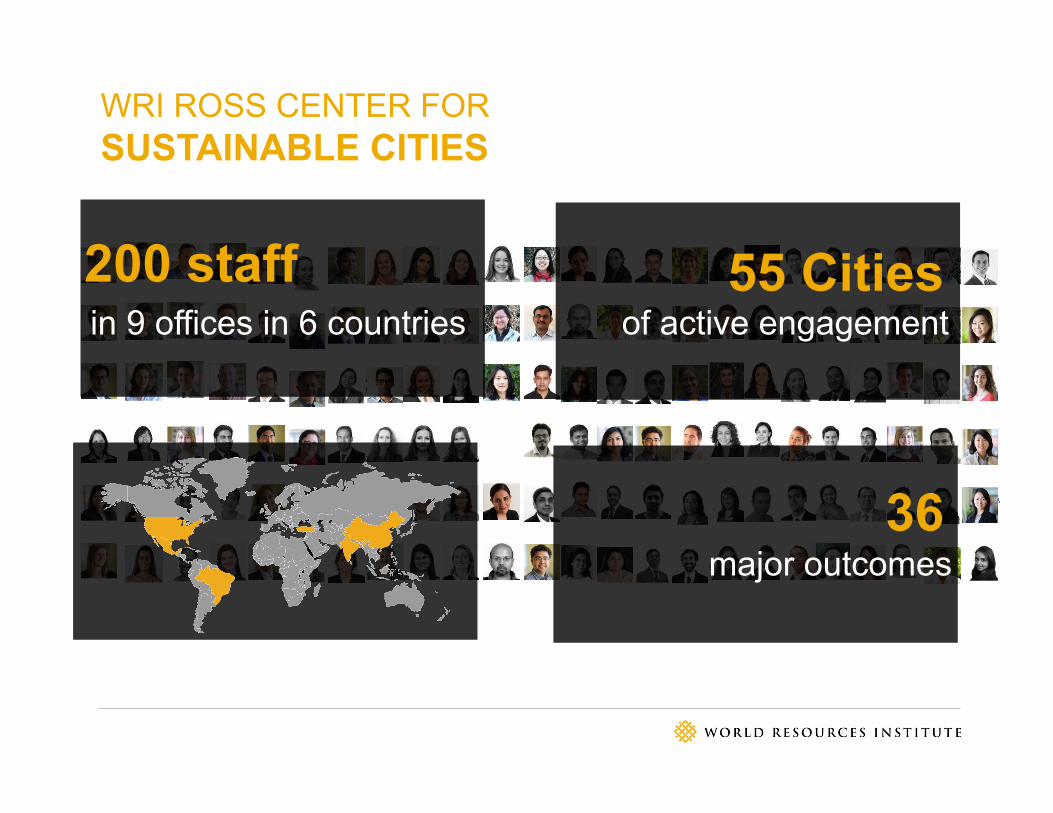
WRI ROSS CENTER FOR SUSTAINABLE CITIES
200 staff in 9 offices in 6 countries
55 Cities of active engagement
36 major outcomes

WRI ROSS CENTER FOR SUSTAINABLE CITIES
• Supporting partners to create local solutions by adapting, learning, course correcting
• Using evidence and measurement to shift policy
• Through systematic learning, building consensus to shift local, national policies, and the global agenda

Deep local collaboration
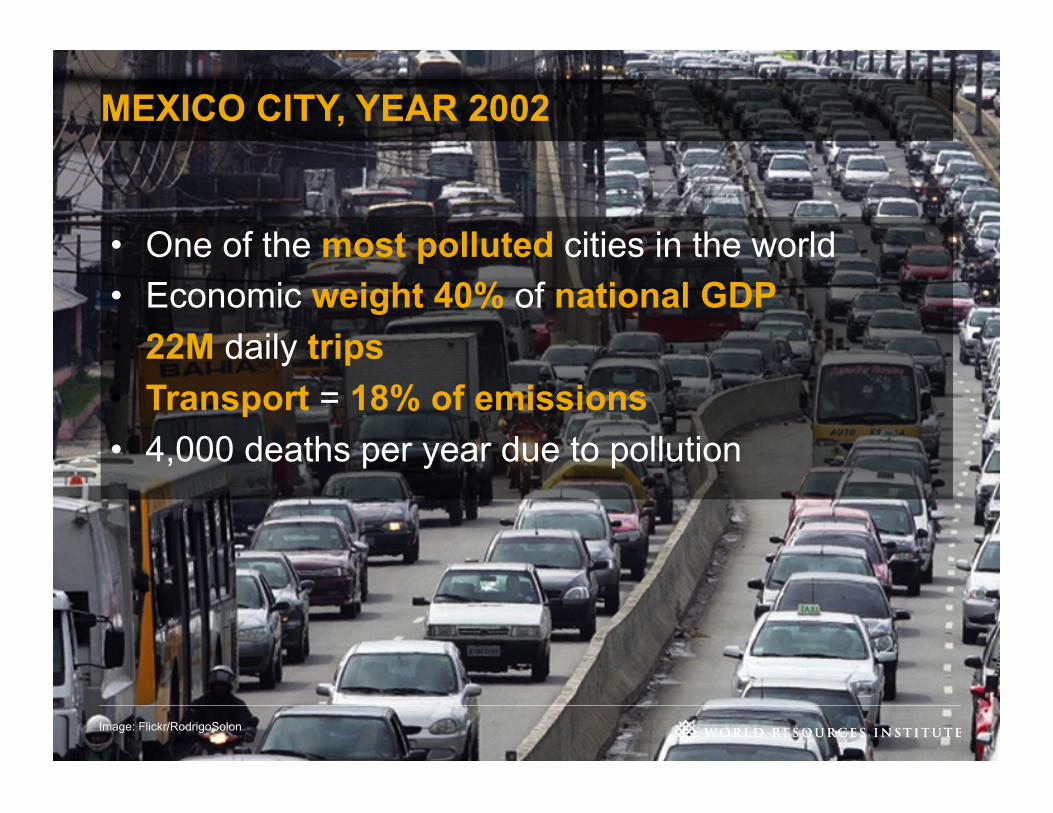
Image: Flickr/RodrigoSolon
MEXICO CITY, YEAR 2002
• One of the most polluted cities in the world • Economic weight 40% of national GDP • 22M daily trips • Transport = 18% of emissions • 4,000 deaths per year due to pollution
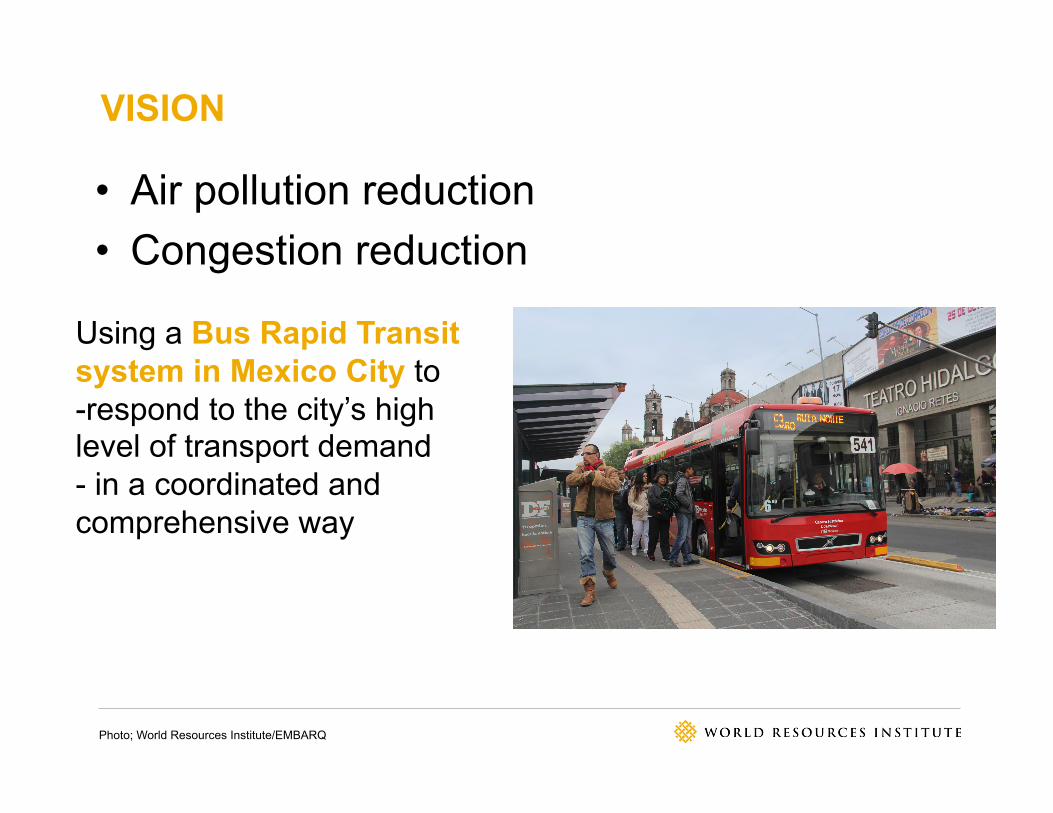
VISION
• Air pollution reduction • Congestion reduction
Photo; World Resources Institute/EMBARQ
Using a Bus Rapid Transit system in Mexico City to - respond to the city’s high level of transport demand - in a coordinated and comprehensive way
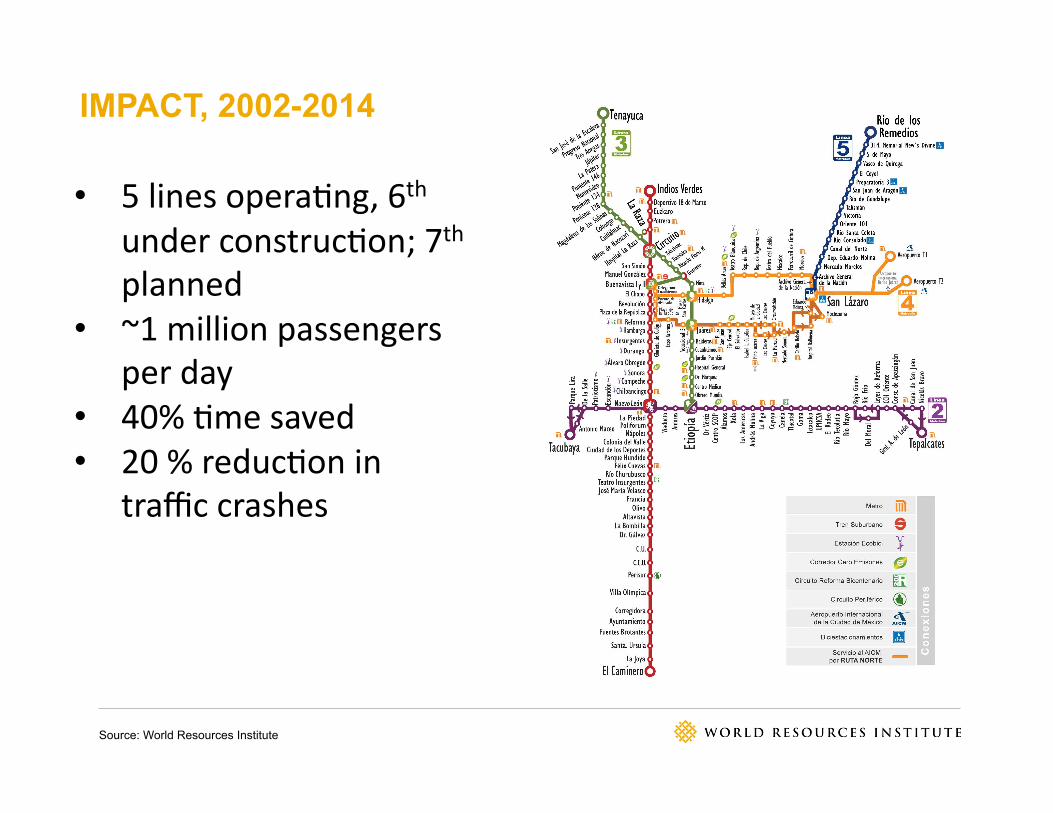
IMPACT, 2002-2014
Source: World Resources Institute
• 5 lines opera,ng, 6th under construc,on; 7th planned
• ~1 million passengers per day
• 40% ,me saved • 20 % reduc,on in
traffic crashes

HOW DID WE GET THERE?
Photos by EMBARQ Mexico
Before After
• Created a local Center for Sustainable Transport, and signed an MoU with Mexico City government, partnerships with local NGOs
• Creation of a multi-sector team of consultants, partners to address emerging issues in real-time
• Long presence in the city, collaboration across agencies and sectors • Convincing city officials, in coordination with Ministry of Environment • Convincing concessionaries that BRT will be a high capacity financially viable solution • Led the creation of Metrobús to plan, program, manage, and regulate the public
transport system
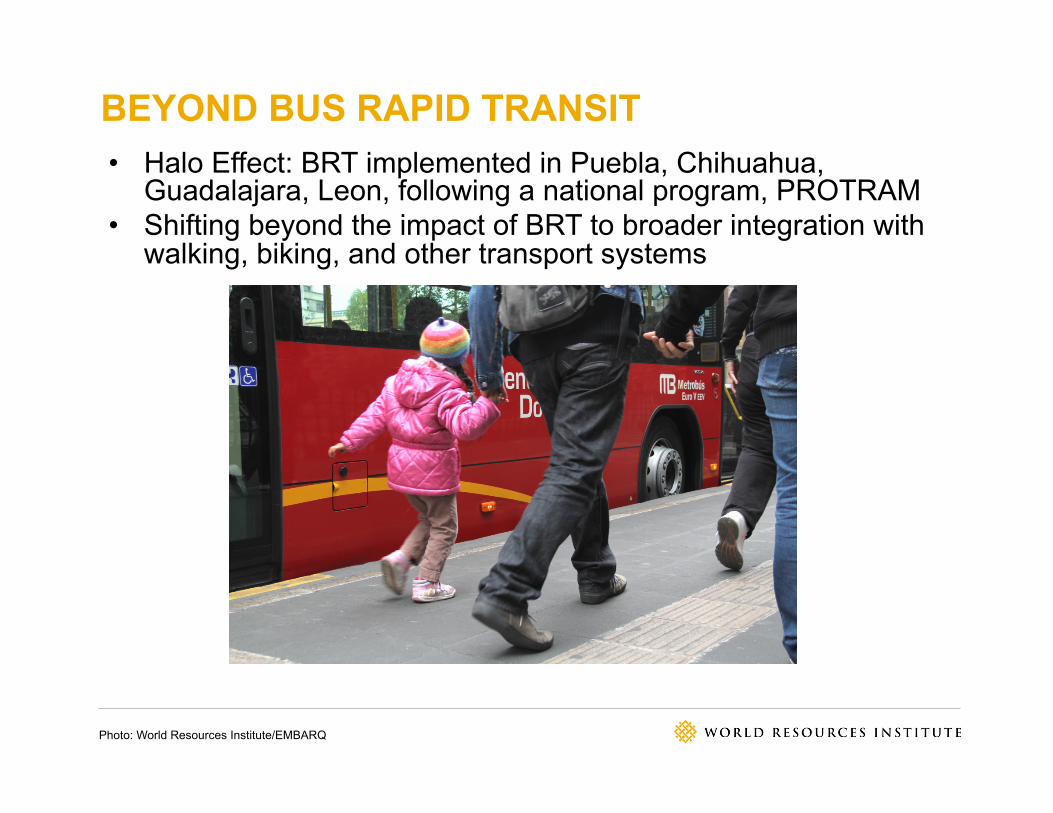
BEYOND BUS RAPID TRANSIT • Halo Effect: BRT implemented in Puebla, Chihuahua,
Guadalajara, Leon, following a national program, PROTRAM • Shifting beyond the impact of BRT to broader integration with
walking, biking, and other transport systems
Photo: World Resources Institute/EMBARQ
Using evidence to shift paradigms

THE HUMAN COST OF TRAFFIC CRASHES
1.2M annual traffic fatalities per year
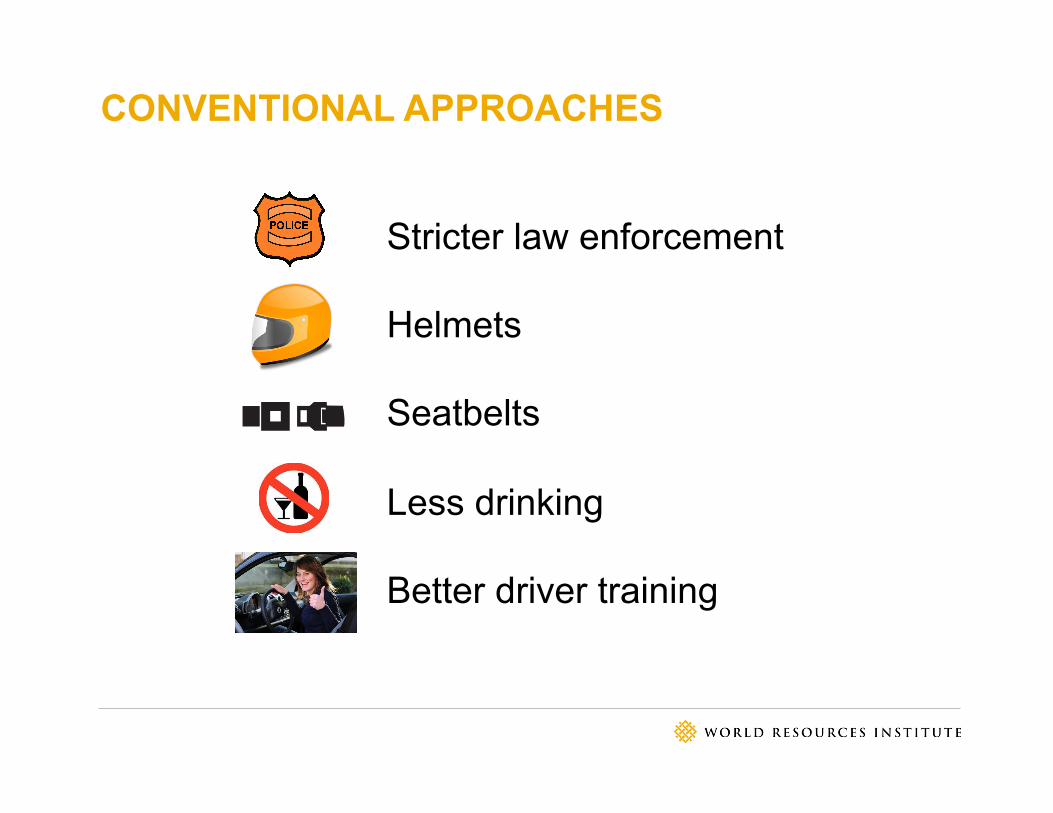
CONVENTIONAL APPROACHES
Stricter law enforcement
Helmets
Seatbelts
Less drinking
Better driver training
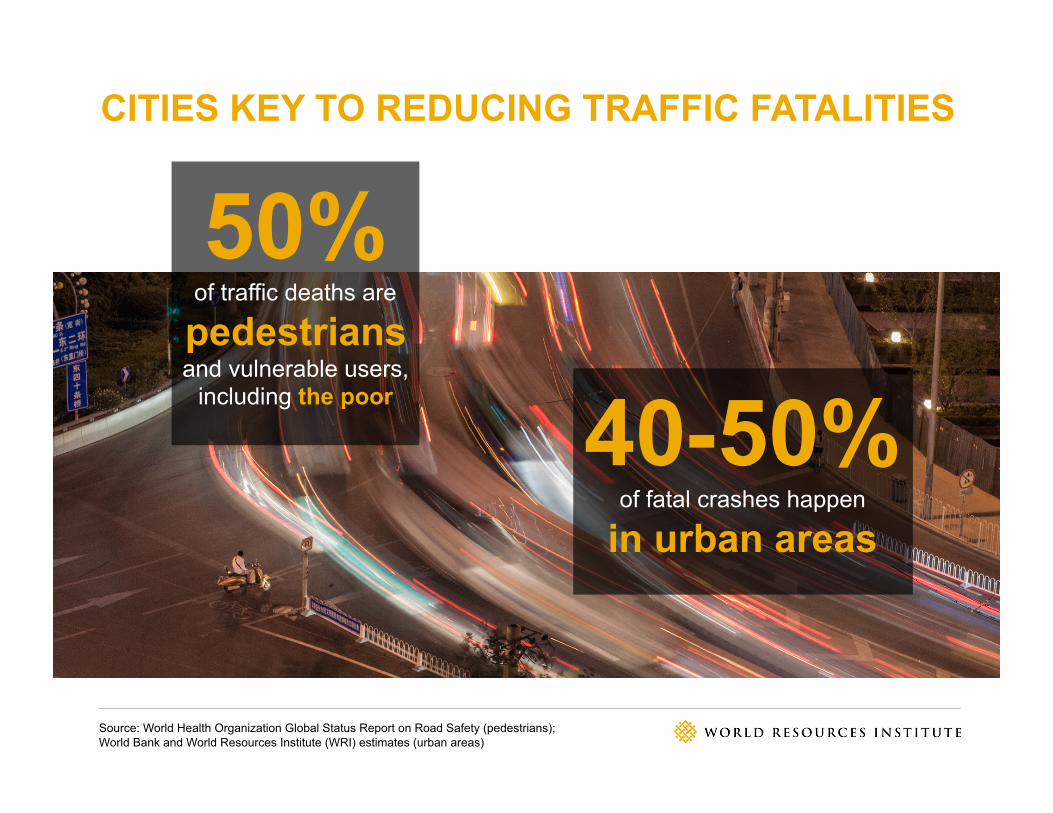
CITIES KEY TO REDUCING TRAFFIC FATALITIES
Source: World Health Organization Global Status Report on Road Safety (pedestrians); World Bank and World Resources Institute (WRI) estimates (urban areas)
50% of traffic deaths are
pedestrians and vulnerable users,
including the poor 40-50% of fatal crashes happen
in urban areas
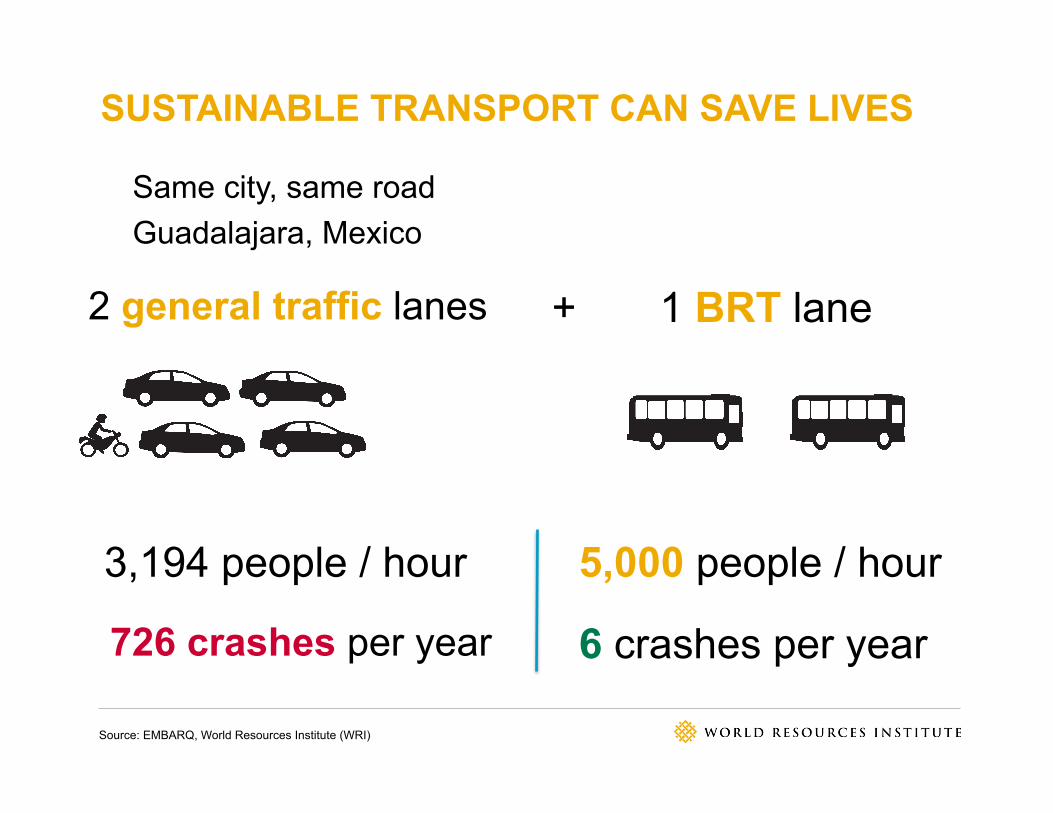
SUSTAINABLE TRANSPORT CAN SAVE LIVES
Source: EMBARQ, World Resources Institute (WRI)
Same city, same road Guadalajara, Mexico
2 general traffic lanes 1 BRT lane
3,194 people / hour 5,000 people / hour
726 crashes per year 6 crashes per year
+
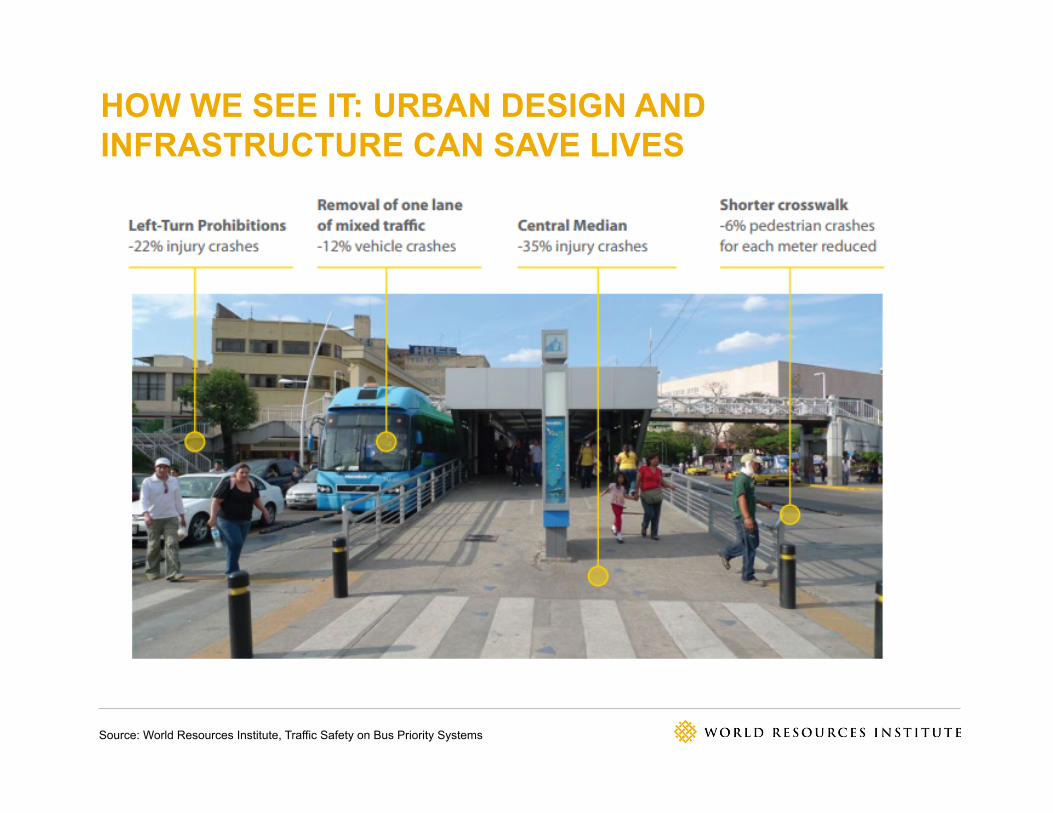
HOW WE SEE IT: URBAN DESIGN AND INFRASTRUCTURE CAN SAVE LIVES
Source: World Resources Institute, Traffic Safety on Bus Priority Systems
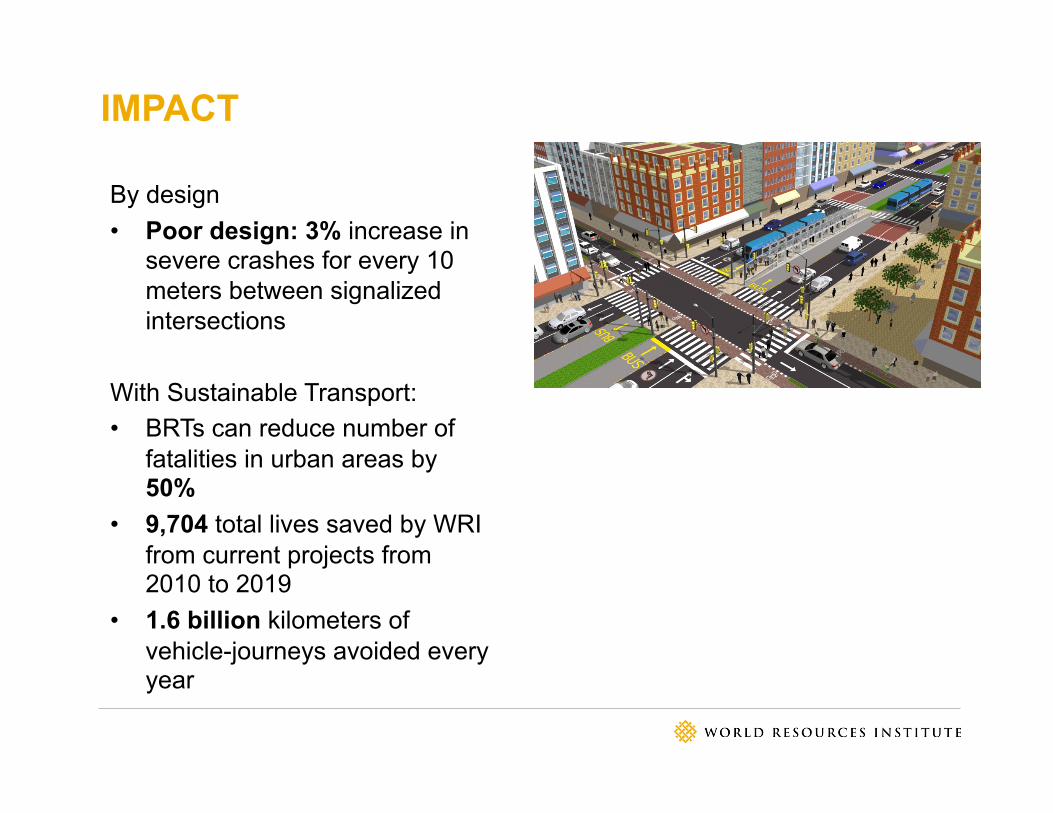
IMPACT
By design • Poor design: 3% increase in
severe crashes for every 10 meters between signalized intersections
With Sustainable Transport: • BRTs can reduce number of
fatalities in urban areas by 50%
• 9,704 total lives saved by WRI from current projects from 2010 to 2019
• 1.6 billion kilometers of vehicle-journeys avoided every year
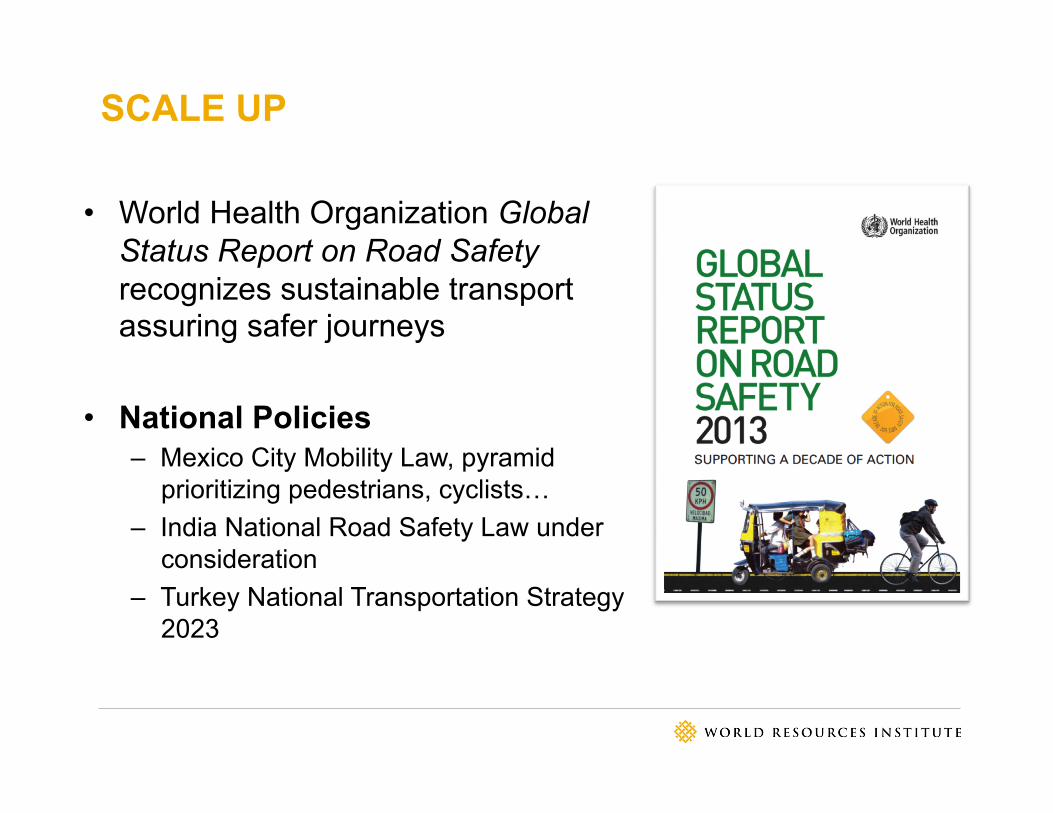
SCALE UP
• World Health Organization Global Status Report on Road Safety recognizes sustainable transport assuring safer journeys
• National Policies – Mexico City Mobility Law, pyramid
prioritizing pedestrians, cyclists… – India National Road Safety Law under
consideration – Turkey National Transportation Strategy
2023
Wide-scale adoption of tools to shift behaviors
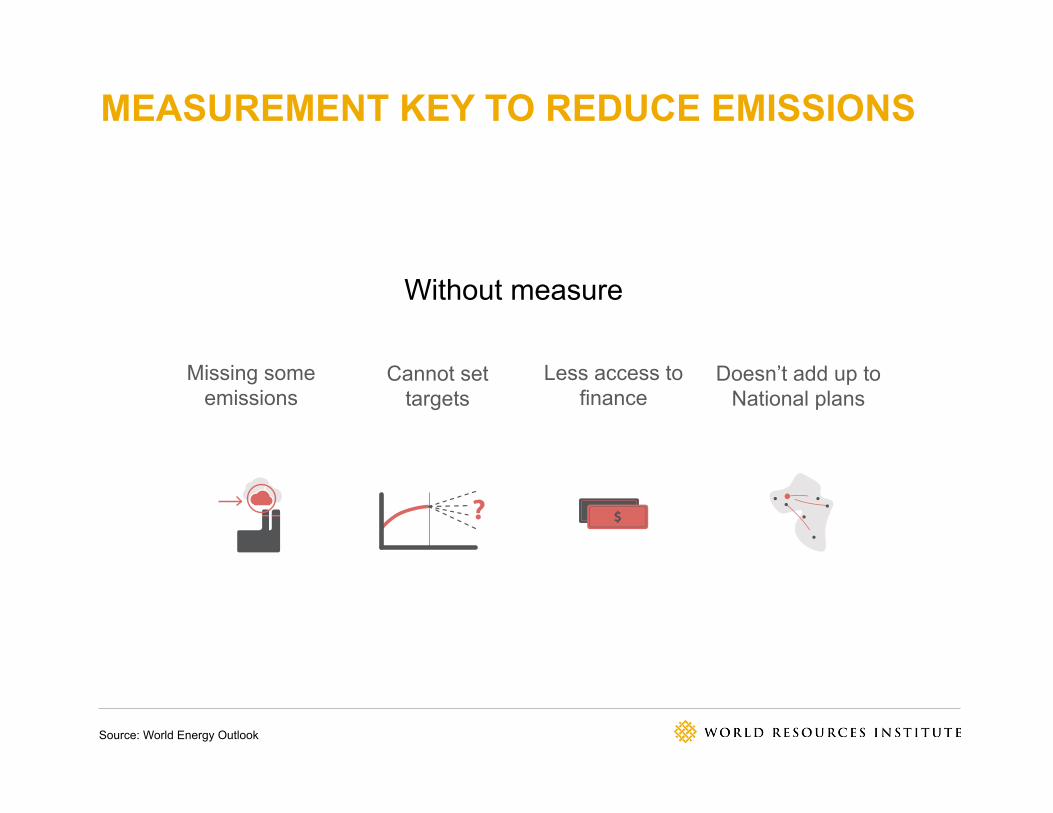
MEASUREMENT KEY TO REDUCE EMISSIONS
Source: World Energy Outlook
WITHOUT GPC
WITH GPC
Different types of measurements
Account for only a portion of emissions
Unclear if climate
targets will be met
Incomplete data limits investment
Unable to relate to national climate
action
Onemeasurement
Consistently account for all
emissions
Emissions trajectory well
understood
Good data drives investment
Can measure city’s contribution to national
climate efforts
?
?⅔
⅞
Φ
Σ
x
y
1
6
Missing some emissions
Cannot set targets
Less access to finance
Doesn’t add up to National plans
WITHOUT GPC
WITH GPC
Different types of measurements
Account for only a portion of emissions
Unclear if climate
targets will be met
Incomplete data limits investment
Unable to relate to national climate
action
Onemeasurement
Consistently account for all
emissions
Emissions trajectory well
understood
Good data drives investment
Can measure city’s contribution to national
climate efforts
?
?⅔
⅞
Φ
Σ
x
y
1
6
Without measure
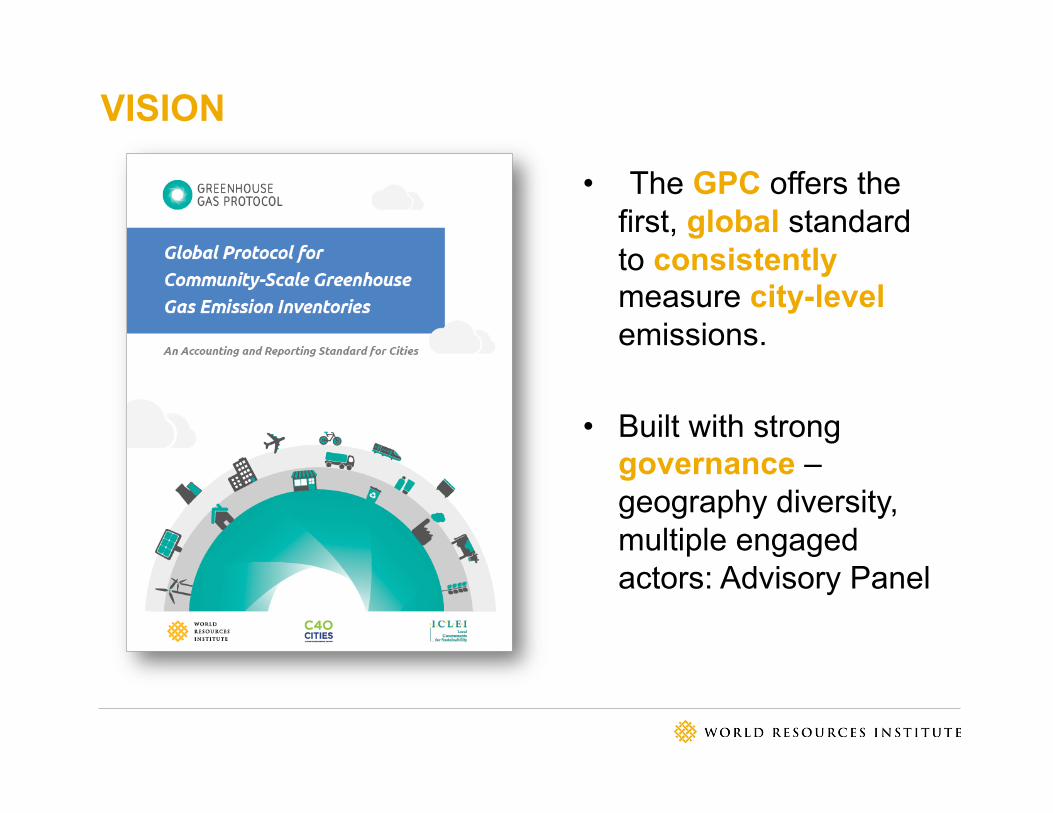
VISION
• The GPC offers the first, global standard to consistently measure city-level emissions.
• Built with strong governance – geography diversity, multiple engaged actors: Advisory Panel
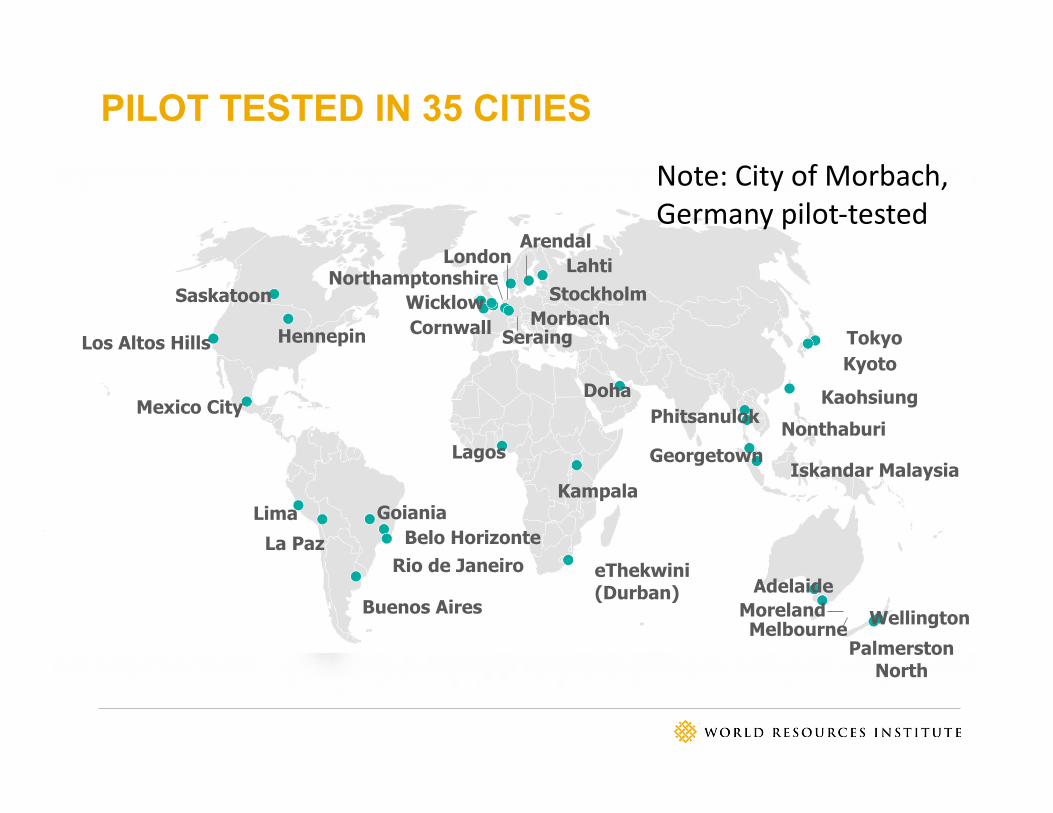
PILOT TESTED IN 35 CITIES
Tokyo �Kyoto �
Iskandar Malaysia�
Nonthaburi
Melbourne�Moreland �
Adelaide�eThekwini (Durban) �
Kampala �
Stockholm �
Cornwall�
London� Lahti �
Wicklow�Morbach �
Seraing �
Saskatoon �
Los Altos Hills�
Belo Horizonte�Goiania�
Rio de Janeiro �
Northamptonshire�
Arendal�
Hennepin �
Georgetown �Lagos�
Kaohsiung
La Paz�
Buenos Aires�
Mexico City�
Palmerston North�
Phitsanulok
Lima �
Wellington �
Doha�
Note: City of Morbach, Germany pilot-‐tested
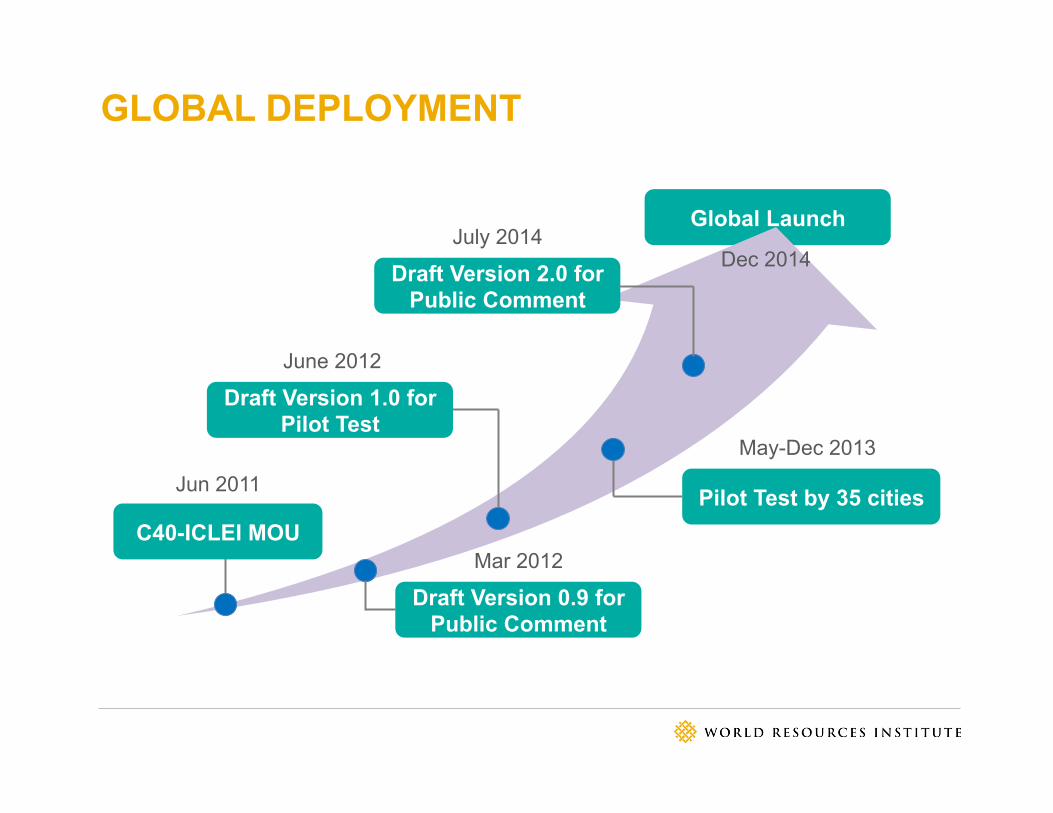
GLOBAL DEPLOYMENT
Global Launch
June 2012
Draft Version 1.0 for Pilot Test
Jun 2011
C40-ICLEI MOU Mar 2012
Draft Version 0.9 for Public Comment
May-Dec 2013
Pilot Test by 35 cities
July 2014
Draft Version 2.0 for Public Comment
Dec 2014

IMPACT
• Endorsed by the Compact of Mayors
• Rio used GPC to establish 2005 base year emissions and track 2013 progress

Comprehensive solutions now, to prevent lock-in effect in Bangalore
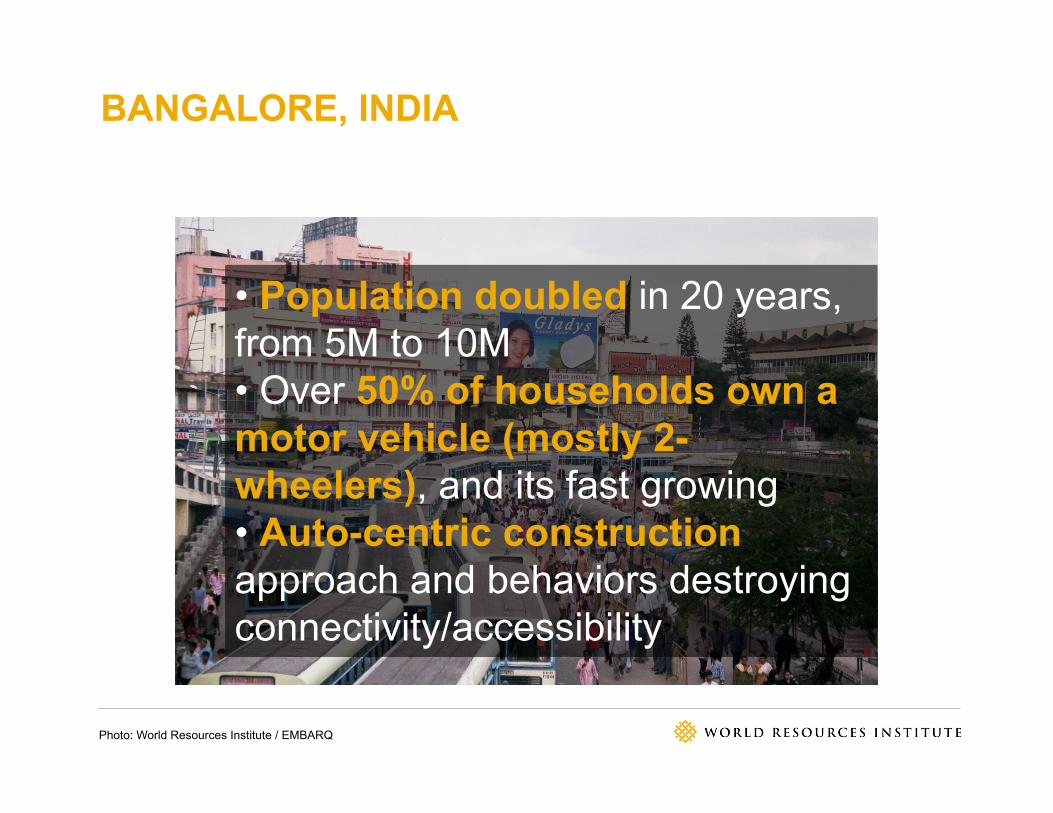
BANGALORE, INDIA
Photo: World Resources Institute / EMBARQ
• Population doubled in 20 years, from 5M to 10M • Over 50% of households own a motor vehicle (mostly 2-wheelers), and its fast growing • Auto-centric construction approach and behaviors destroying connectivity/accessibility
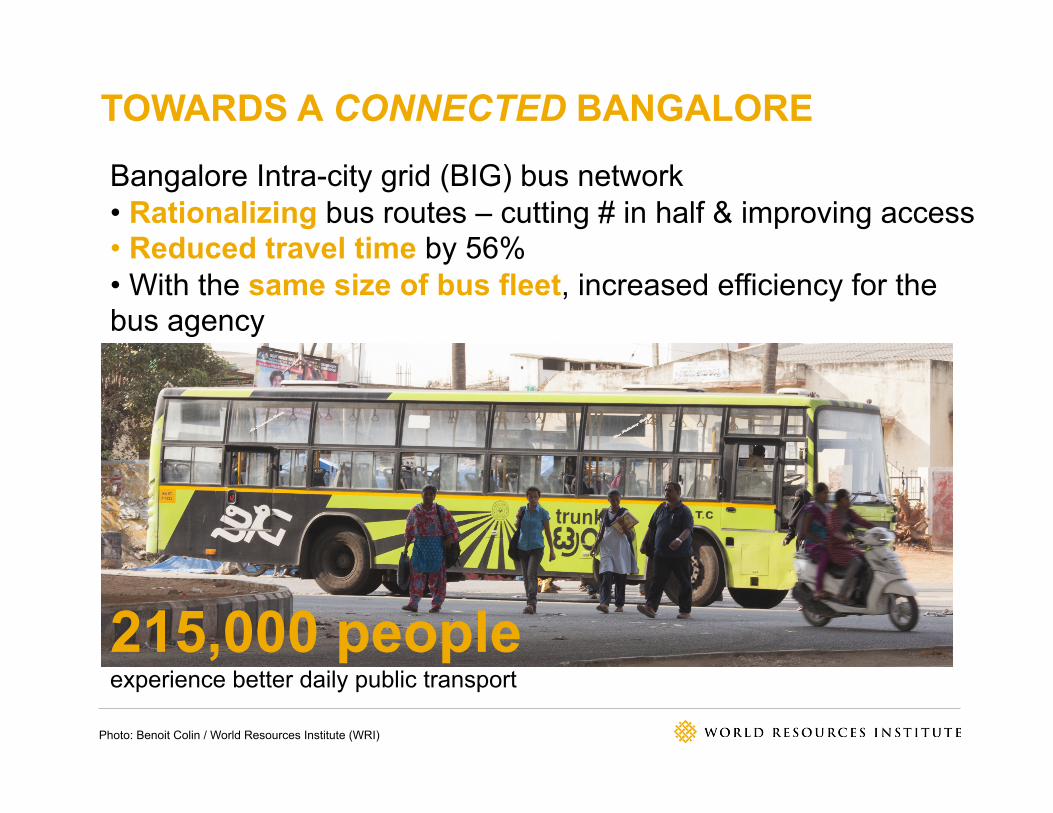
TOWARDS A CONNECTED BANGALORE
Photo: Benoit Colin / World Resources Institute (WRI)
Bangalore Intra-city grid (BIG) bus network • Rationalizing bus routes – cutting # in half & improving access • Reduced travel time by 56% • With the same size of bus fleet, increased efficiency for the bus agency
215,000 people experience better daily public transport
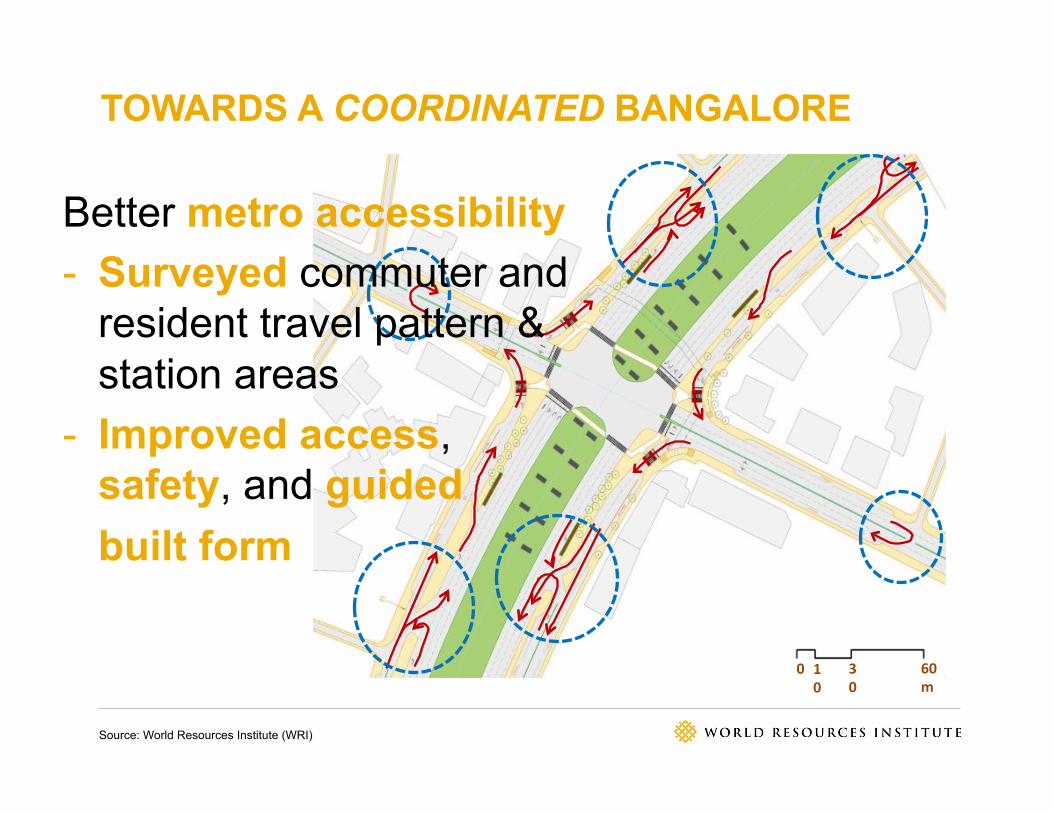
TOWARDS A COORDINATED BANGALORE
Source: World Resources Institute (WRI)
0 10
30
60m
Better metro accessibility - Surveyed commuter and
resident travel pattern & station areas
- Improved access, safety, and guided built form
TOWARDS A COORDINATED BANGALORE
Source: World Resources Institute (WRI)
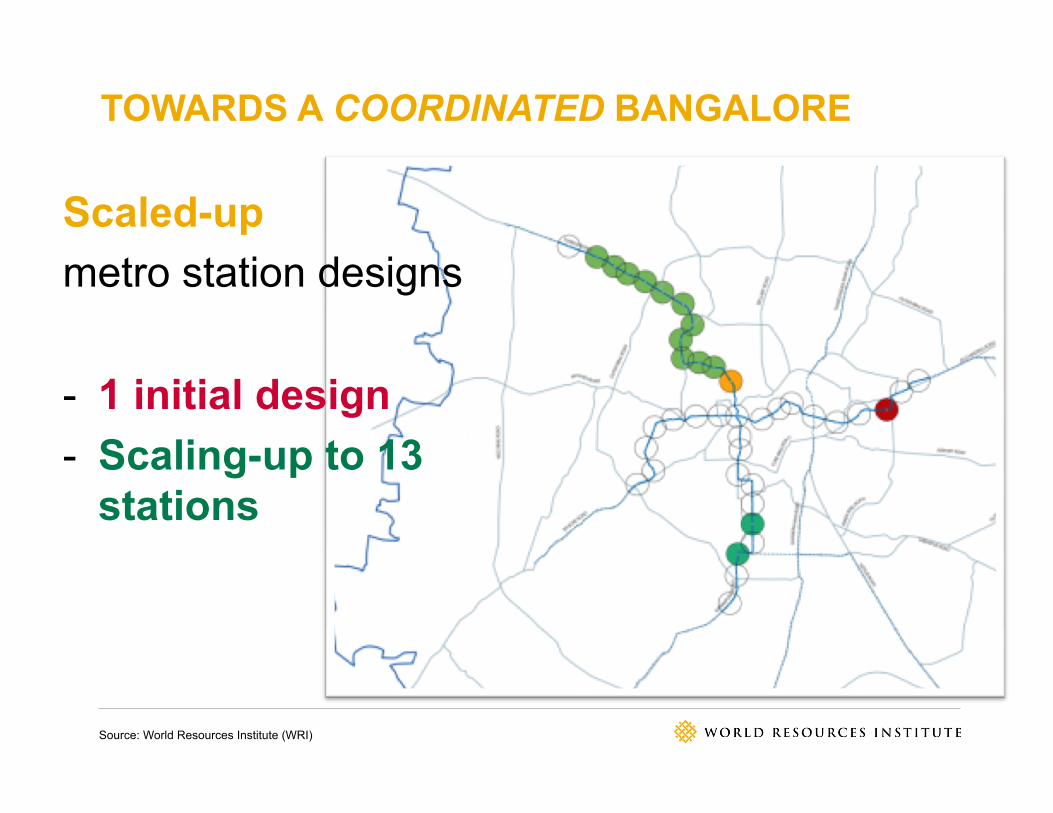
Scaled-up metro station designs
- 1 initial design - Scaling-up to 13
stations
TOWARDS A COORDINATED BANGALORE
Source: World Resources Institute (WRI)
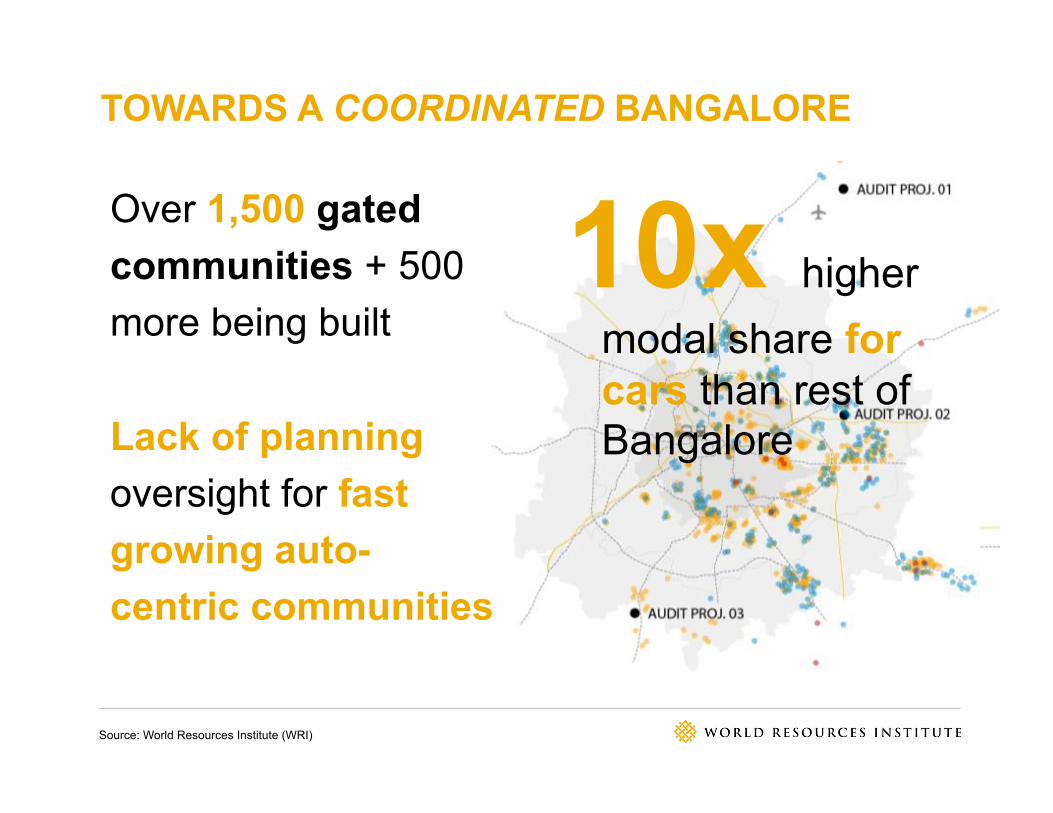
Over 1,500 gated communities + 500 more being built
Lack of planning oversight for fast growing auto- centric communities
10x higher modal share for cars than rest of Bangalore
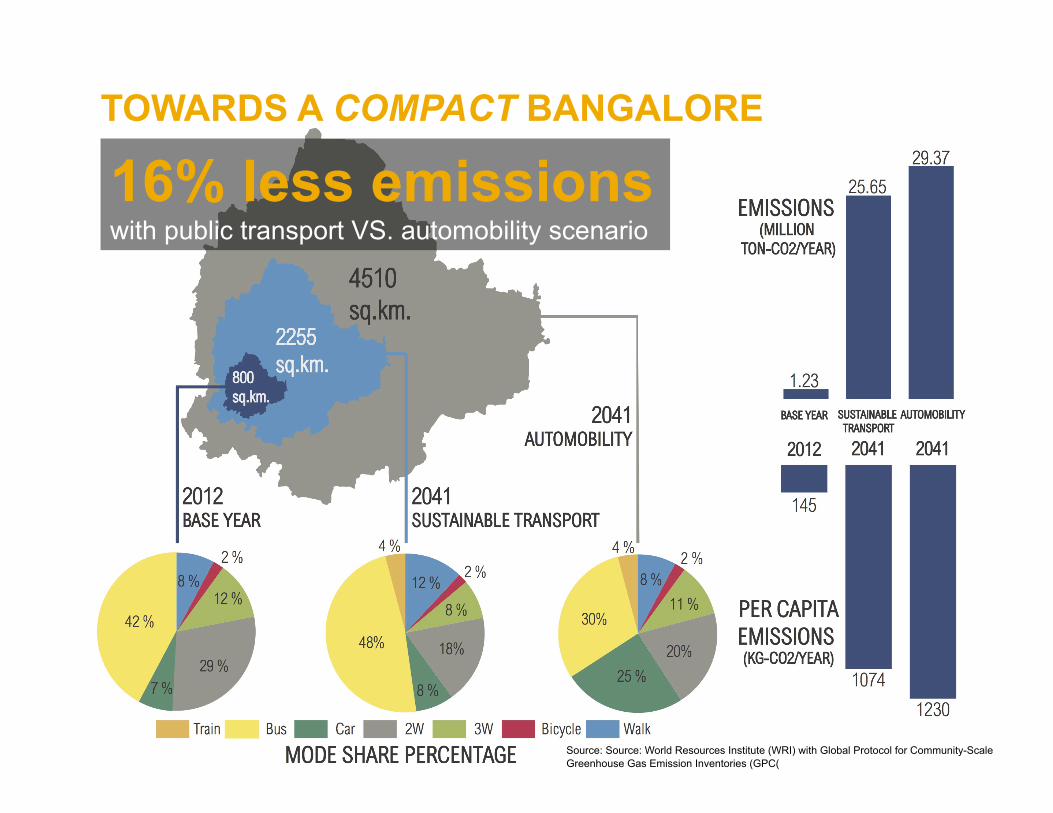
TOWARDS A COMPACT BANGALORE
Source: Source: World Resources Institute (WRI) with Global Protocol for Community-Scale Greenhouse Gas Emission Inventories (GPC(
16% less emissions with public transport VS. automobility scenario
Lessons learned
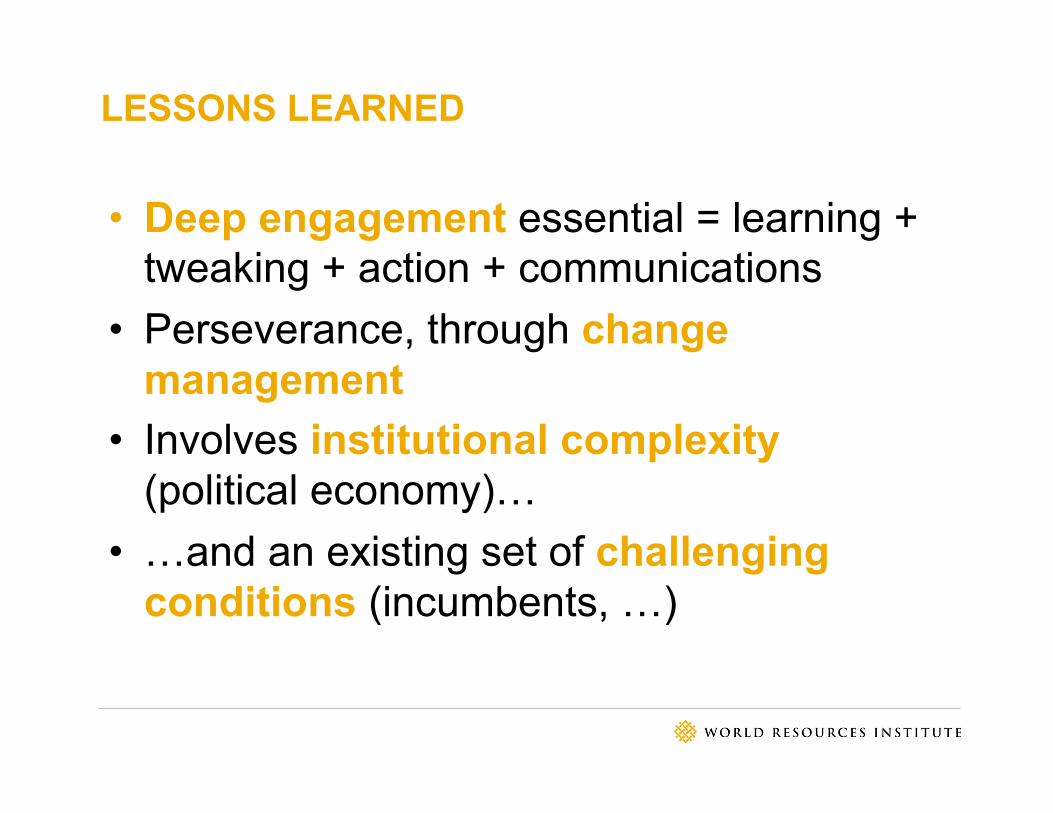
LESSONS LEARNED
• Deep engagement essential = learning + tweaking + action + communications
• Perseverance, through change management
• Involves institutional complexity (political economy)…
• …and an existing set of challenging conditions (incumbents, …)
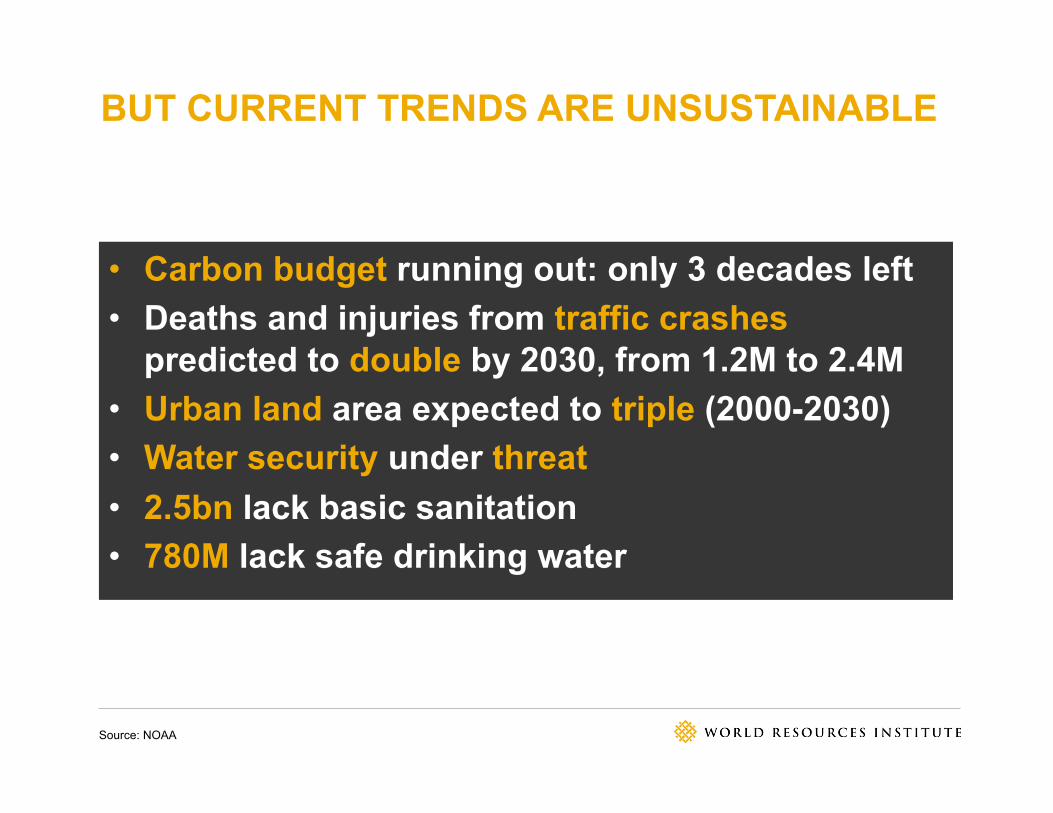
BUT CURRENT TRENDS ARE UNSUSTAINABLE
Source: NOAA
• Carbon budget running out: only 3 decades left • Deaths and injuries from traffic crashes
predicted to double by 2030, from 1.2M to 2.4M • Urban land area expected to triple (2000-2030) • Water security under threat • 2.5bn lack basic sanitation • 780M lack safe drinking water
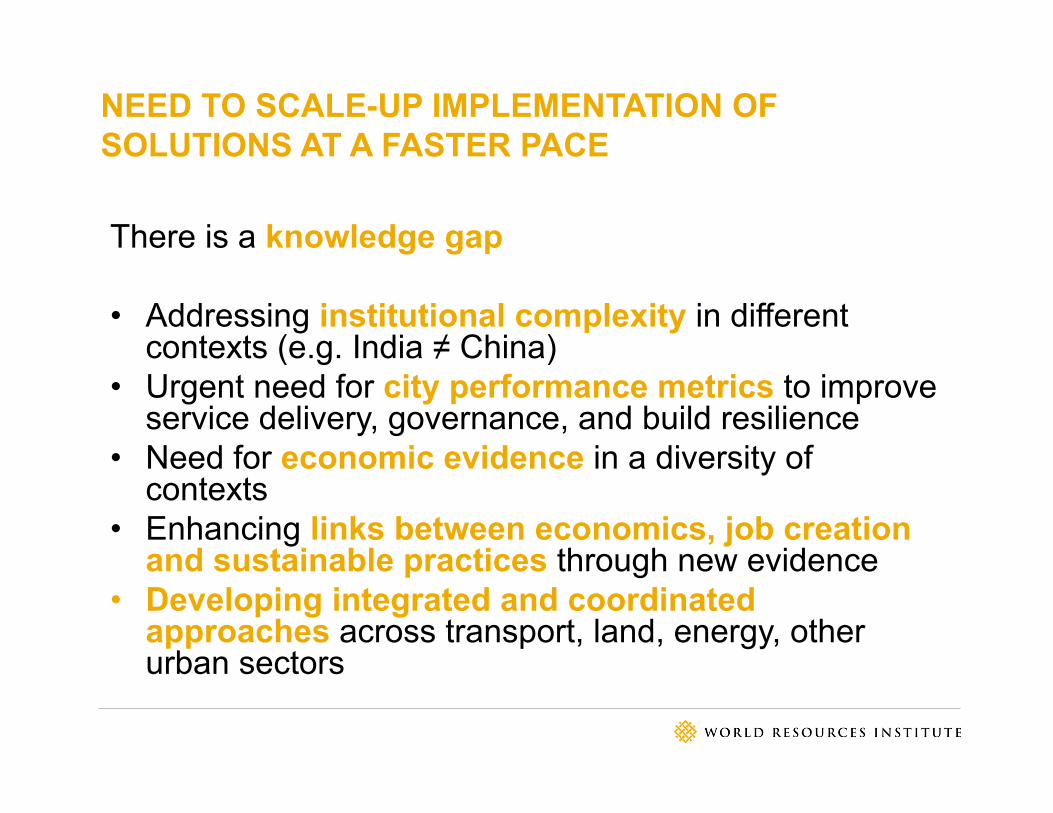
NEED TO SCALE-UP IMPLEMENTATION OF SOLUTIONS AT A FASTER PACE
There is a knowledge gap
• Addressing institutional complexity in different contexts (e.g. India ≠ China)
• Urgent need for city performance metrics to improve service delivery, governance, and build resilience
• Need for economic evidence in a diversity of contexts
• Enhancing links between economics, job creation and sustainable practices through new evidence
• Developing integrated and coordinated approaches across transport, land, energy, other urban sectors
WORLD RESOURCES REPORT KEY QUESTION
How can we help city leaders deliver thriving economies, thriving citizens and a thriving environment?

WORLD RESOURCES REPORT AS A PLATFORM
• Engage target decision-makers, particularly those from developing countries, – as collaborators, – co-authors, and – Messengers
• Establish a knowledge sharing platform and become an agenda setting resource for policy makers, funders
• Influence – Global Agenda on cities – Sustainable Development Goals process through metrics – HABITAT-III

WORLD RESOURCES REPORT
• Present a range of solutions to “bend the curve” and manage urban challenges – Case studies highlighting successes and failures
• Investigate underexplored solutions of the “how” to achieve 3 objectives together – Addressing city leaders concerns – Addressing resource and environmental challenges – Improve quality of life for people
• Highlight regional differences through deep analysis in a few cities
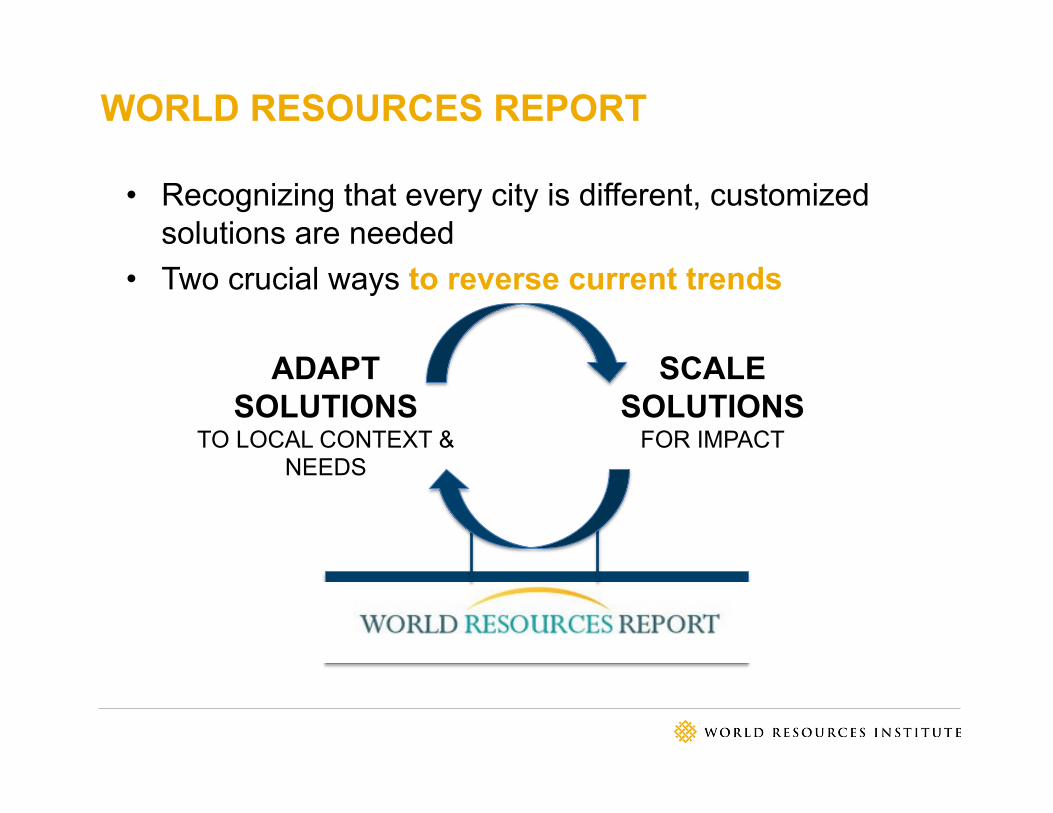
WORLD RESOURCES REPORT
• Recognizing that every city is different, customized solutions are needed
• Two crucial ways to reverse current trends
ADAPT SOLUTIONS
TO LOCAL CONTEXT & NEEDS
SCALE SOLUTIONS
FOR IMPACT
53 53
Ani Dasgupta Global Director, WRI Ross Center for Sustainable Cities World Resources Institute (WRI) [email protected]
WRI.org/cities TheCityFix.com
Learn more at WRI.org/cities