enabling smarter government with analytics to … · social services don edwards chuck ballard jeff...
TRANSCRIPT

ibm.com/redbooks
IBM® Information Management Software
Enabling Smarter Government with Analytics to Streamline Social Services
Don EdwardsChuck Ballard Jeff Butcher
Rena Burns Allen DreibelbisMichael Fernandes Jerome Graham
Julie Monahan Celeste RobinsonReuven Stepansky Vanessa Velasco
Building a flexible infrastructure for growth
Integrating social services data sources
Tracking effectiveness of programs
Front cover


Enabling Smarter Government with Analytics to Streamline Social Services
July 2012
International Technical Support Organization
SG24-7903-00

© Copyright International Business Machines Corporation 2012. All rights reserved.Note to U.S. Government Users Restricted Rights -- Use, duplication or disclosure restricted by GSA ADPSchedule Contract with IBM Corp.
First Edition (July 2012)
This edition applies to IBM InfoSphere Identity Insight V4.2, IBM InfoSphere Warehouse Enterprise Edition V9.5.1, IBM DB2 Enterprise Server Edition V9.5.5, IBM InfoSphere Balanced Warehouse V9.5.5.1, and IBM Cognos V8.4.
Note: Before using this information and the product it supports, read the information in “Notices” on page v.

Contents
Notices . . . . . . . . . . . . . . . . . . . . . . . . . . . . . . . . . . . . . . . . . . . . . . . . . . . . . . . vTrademarks . . . . . . . . . . . . . . . . . . . . . . . . . . . . . . . . . . . . . . . . . . . . . . . . . . . . vi
Preface . . . . . . . . . . . . . . . . . . . . . . . . . . . . . . . . . . . . . . . . . . . . . . . . . . . . . . viiThe team who wrote this book . . . . . . . . . . . . . . . . . . . . . . . . . . . . . . . . . . . . . viiiNow you can become a published author, too! . . . . . . . . . . . . . . . . . . . . . . . . . xiComments welcome. . . . . . . . . . . . . . . . . . . . . . . . . . . . . . . . . . . . . . . . . . . . . xiiStay connected to IBM Redbooks . . . . . . . . . . . . . . . . . . . . . . . . . . . . . . . . . . xii
Chapter 1. Introduction . . . . . . . . . . . . . . . . . . . . . . . . . . . . . . . . . . . . . . . . . . 11.1 Achieving smarter government . . . . . . . . . . . . . . . . . . . . . . . . . . . . . . . . . . 21.2 Achieving Smarter Social Services . . . . . . . . . . . . . . . . . . . . . . . . . . . . . . . 8
1.2.1 Business challenges . . . . . . . . . . . . . . . . . . . . . . . . . . . . . . . . . . . . . . 91.2.2 The Smarter Social Services. . . . . . . . . . . . . . . . . . . . . . . . . . . . . . . 111.2.3 The journey to Smarter Social Services . . . . . . . . . . . . . . . . . . . . . . 131.2.4 Summary. . . . . . . . . . . . . . . . . . . . . . . . . . . . . . . . . . . . . . . . . . . . . . 14
Chapter 2. The business environment and requirements . . . . . . . . . . . . . 152.1 Alameda County . . . . . . . . . . . . . . . . . . . . . . . . . . . . . . . . . . . . . . . . . . . . 162.2 Key business drivers . . . . . . . . . . . . . . . . . . . . . . . . . . . . . . . . . . . . . . . . . 162.3 Starting the journey . . . . . . . . . . . . . . . . . . . . . . . . . . . . . . . . . . . . . . . . . . 182.4 Overcoming hurdles . . . . . . . . . . . . . . . . . . . . . . . . . . . . . . . . . . . . . . . . . 20
2.4.1 Budgetary constraints . . . . . . . . . . . . . . . . . . . . . . . . . . . . . . . . . . . . 202.4.2 Privacy constraints . . . . . . . . . . . . . . . . . . . . . . . . . . . . . . . . . . . . . . 21
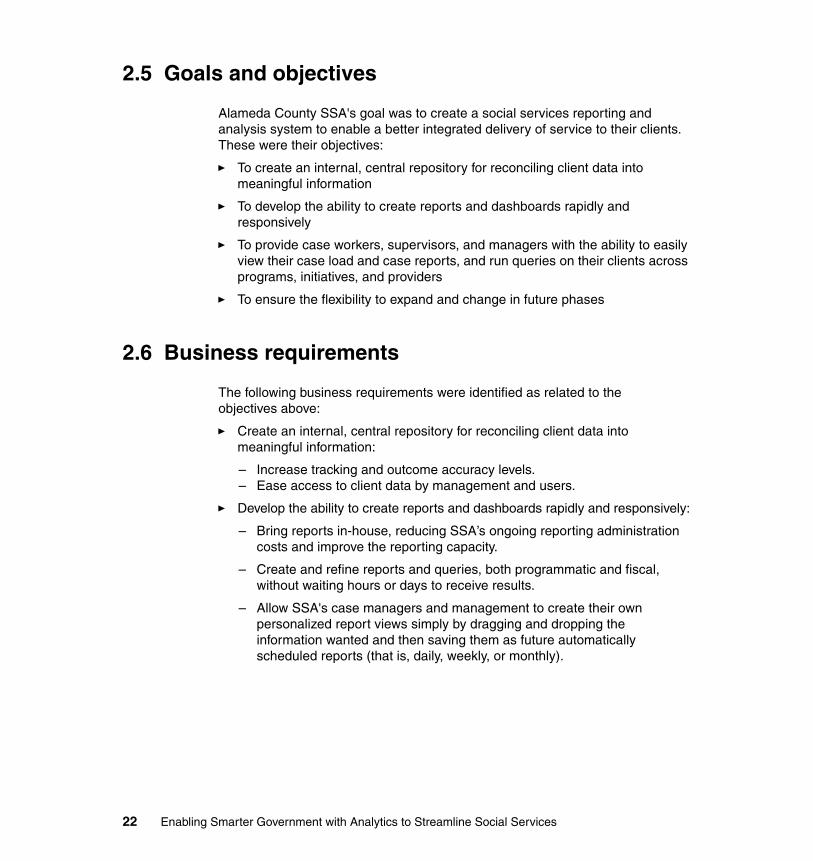
2.5 Goals and objectives . . . . . . . . . . . . . . . . . . . . . . . . . . . . . . . . . . . . . . . . . 222.6 Business requirements . . . . . . . . . . . . . . . . . . . . . . . . . . . . . . . . . . . . . . . 22
Chapter 3. Developing the solution . . . . . . . . . . . . . . . . . . . . . . . . . . . . . . . 253.1 Beginning systems environment . . . . . . . . . . . . . . . . . . . . . . . . . . . . . . . . 263.2 Solution environment. . . . . . . . . . . . . . . . . . . . . . . . . . . . . . . . . . . . . . . . . 46
3.2.1 Data requirements. . . . . . . . . . . . . . . . . . . . . . . . . . . . . . . . . . . . . . . 473.2.2 The need for data integration . . . . . . . . . . . . . . . . . . . . . . . . . . . . . . 473.2.3 Using analytics to find data relationships . . . . . . . . . . . . . . . . . . . . . 503.2.4 The data repository . . . . . . . . . . . . . . . . . . . . . . . . . . . . . . . . . . . . . . 52
3.3 Solution architecture and description . . . . . . . . . . . . . . . . . . . . . . . . . . . . 543.3.1 Data sources . . . . . . . . . . . . . . . . . . . . . . . . . . . . . . . . . . . . . . . . . . . 563.3.2 Data transformation and loading . . . . . . . . . . . . . . . . . . . . . . . . . . . . 643.3.3 Preparing the data. . . . . . . . . . . . . . . . . . . . . . . . . . . . . . . . . . . . . . . 733.3.4 Data warehouse environment . . . . . . . . . . . . . . . . . . . . . . . . . . . . . . 78
© Copyright IBM Corp. 2012. All rights reserved. iii

3.3.5 Visualization and reporting . . . . . . . . . . . . . . . . . . . . . . . . . . . . . . . . 883.4 The team players. . . . . . . . . . . . . . . . . . . . . . . . . . . . . . . . . . . . . . . . . . . . 94
Chapter 4. Business outcomes . . . . . . . . . . . . . . . . . . . . . . . . . . . . . . . . . . 994.1 Key business benefits . . . . . . . . . . . . . . . . . . . . . . . . . . . . . . . . . . . . . . . 100
4.1.1 Business Value Assessment. . . . . . . . . . . . . . . . . . . . . . . . . . . . . . 1014.1.2 Business Value Assessment results . . . . . . . . . . . . . . . . . . . . . . . . 102
4.2 Lessons learned . . . . . . . . . . . . . . . . . . . . . . . . . . . . . . . . . . . . . . . . . . . 1044.2.1 Selling the concept . . . . . . . . . . . . . . . . . . . . . . . . . . . . . . . . . . . . . 1044.2.2 Sharing information across organizations . . . . . . . . . . . . . . . . . . . . 1064.2.3 Building the right team . . . . . . . . . . . . . . . . . . . . . . . . . . . . . . . . . . 1074.2.4 Starting small and planning for continued growth . . . . . . . . . . . . . . 1084.2.5 User acceptance . . . . . . . . . . . . . . . . . . . . . . . . . . . . . . . . . . . . . . . 109
4.3 The journey continues . . . . . . . . . . . . . . . . . . . . . . . . . . . . . . . . . . . . . . . 110
Chapter 5. Government Industry Framework . . . . . . . . . . . . . . . . . . . . . . 1135.1 IBM Government Industry Framework overview . . . . . . . . . . . . . . . . . . . 1145.2 Single view of a citizen . . . . . . . . . . . . . . . . . . . . . . . . . . . . . . . . . . . . . . 1195.3 Government Industry Framework use cases. . . . . . . . . . . . . . . . . . . . . . 125
5.3.1 Safety and security . . . . . . . . . . . . . . . . . . . . . . . . . . . . . . . . . . . . . 1265.3.2 Optimizing citizen-centric services . . . . . . . . . . . . . . . . . . . . . . . . . 1305.3.3 Tax and revenue management . . . . . . . . . . . . . . . . . . . . . . . . . . . . 134
Appendix A. SVoC ABB services . . . . . . . . . . . . . . . . . . . . . . . . . . . . . . . . 139SVoC ABB component view. . . . . . . . . . . . . . . . . . . . . . . . . . . . . . . . . . . . . . 140
Master data management services . . . . . . . . . . . . . . . . . . . . . . . . . . . . . . 142Information Integration Services . . . . . . . . . . . . . . . . . . . . . . . . . . . . . . . . 144Identity Analytics services . . . . . . . . . . . . . . . . . . . . . . . . . . . . . . . . . . . . . 145
SVoC operational perspective . . . . . . . . . . . . . . . . . . . . . . . . . . . . . . . . . . . . 147
Glossary . . . . . . . . . . . . . . . . . . . . . . . . . . . . . . . . . . . . . . . . . . . . . . . . . . . . 151
Abbreviations and acronyms . . . . . . . . . . . . . . . . . . . . . . . . . . . . . . . . . . . 157
Related publications . . . . . . . . . . . . . . . . . . . . . . . . . . . . . . . . . . . . . . . . . . 161IBM Redbooks . . . . . . . . . . . . . . . . . . . . . . . . . . . . . . . . . . . . . . . . . . . . . . . . 161Other publications . . . . . . . . . . . . . . . . . . . . . . . . . . . . . . . . . . . . . . . . . . . . . 161Online resources . . . . . . . . . . . . . . . . . . . . . . . . . . . . . . . . . . . . . . . . . . . . . . 161How to get Redbooks . . . . . . . . . . . . . . . . . . . . . . . . . . . . . . . . . . . . . . . . . . . 162Help from IBM . . . . . . . . . . . . . . . . . . . . . . . . . . . . . . . . . . . . . . . . . . . . . . . . 162
Index . . . . . . . . . . . . . . . . . . . . . . . . . . . . . . . . . . . . . . . . . . . . . . . . . . . . . . . 163
iv Enabling Smarter Government with Analytics to Streamline Social Services

Notices
This information was developed for products and services offered in the U.S.A.
IBM may not offer the products, services, or features discussed in this document in other countries. Consult your local IBM representative for information on the products and services currently available in your area. Any reference to an IBM product, program, or service is not intended to state or imply that only that IBM product, program, or service may be used. Any functionally equivalent product, program, or service that does not infringe any IBM intellectual property right may be used instead. However, it is the user's responsibility to evaluate and verify the operation of any non-IBM product, program, or service.
IBM may have patents or pending patent applications covering subject matter described in this document. The furnishing of this document does not give you any license to these patents. You can send license inquiries, in writing, to: IBM Director of Licensing, IBM Corporation, North Castle Drive, Armonk, NY 10504-1785 U.S.A.
The following paragraph does not apply to the United Kingdom or any other country where such provisions are inconsistent with local law: INTERNATIONAL BUSINESS MACHINES CORPORATION PROVIDES THIS PUBLICATION "AS IS" WITHOUT WARRANTY OF ANY KIND, EITHER EXPRESS OR IMPLIED, INCLUDING, BUT NOT LIMITED TO, THE IMPLIED WARRANTIES OF NON-INFRINGEMENT, MERCHANTABILITY OR FITNESS FOR A PARTICULAR PURPOSE. Some states do not allow disclaimer of express or implied warranties in certain transactions, therefore, this statement may not apply to you.
This information could include technical inaccuracies or typographical errors. Changes are periodically made to the information herein; these changes will be incorporated in new editions of the publication. IBM may make improvements and/or changes in the product(s) and/or the program(s) described in this publication at any time without notice.
Any references in this information to non-IBM Web sites are provided for convenience only and do not in any manner serve as an endorsement of those Web sites. The materials at those Web sites are not part of the materials for this IBM product and use of those Web sites is at your own risk.
IBM may use or distribute any of the information you supply in any way it believes appropriate without incurring any obligation to you.
Information concerning non-IBM products was obtained from the suppliers of those products, their published announcements or other publicly available sources. IBM has not tested those products and cannot confirm the accuracy of performance, compatibility or any other claims related to non-IBM products. Questions on the capabilities of non-IBM products should be addressed to the suppliers of those products.
This information contains examples of data and reports used in daily business operations. To illustrate them as completely as possible, the examples include the names of individuals, companies, brands, and products. All of these names are fictitious and any similarity to the names and addresses used by an actual business enterprise is entirely coincidental.
COPYRIGHT LICENSE:
This information contains sample application programs in source language, which illustrate programming techniques on various operating platforms. You may copy, modify, and distribute these sample programs in any form without payment to IBM, for the purposes of developing, using, marketing or distributing application programs conforming to the application programming interface for the operating platform for which the sample programs are written. These examples have not been thoroughly tested under all conditions. IBM, therefore, cannot guarantee or imply reliability, serviceability, or function of these programs.
© Copyright IBM Corp. 2012. All rights reserved. v

Trademarks
IBM, the IBM logo, and ibm.com are trademarks or registered trademarks of International Business Machines Corporation in the United States, other countries, or both. These and other IBM trademarked terms are marked on their first occurrence in this information with the appropriate symbol (® or ™), indicating US registered or common law trademarks owned by IBM at the time this information was published. Such trademarks may also be registered or common law trademarks in other countries. A current list of IBM trademarks is available on the Web at http://www.ibm.com/legal/copytrade.shtml
The following terms are trademarks of the International Business Machines Corporation in the United States, other countries, or both:
AIX®Balanced Warehouse®Cognos®DataStage®DB2 Universal Database™DB2®Distributed Relational Database
Architecture™
DRDA®FileNet®IBM®Information Agenda®InfoSphere®Initiate®MQSeries®QualityStage®
Redbooks®Redbooks (logo) ®Smarter Planet™SPSS®WebSphere®
The following terms are trademarks of other companies:
Linux is a trademark of Linus Torvalds in the United States, other countries, or both.
Microsoft, Windows, and the Windows logo are trademarks of Microsoft Corporation in the United States, other countries, or both.
Java, and all Java-based trademarks and logos are trademarks or registered trademarks of Oracle and/or its affiliates.
Intel, Intel logo, Intel Inside, Intel Inside logo, Intel Centrino, Intel Centrino logo, Celeron, Intel Xeon, Intel SpeedStep, Itanium, and Pentium are trademarks or registered trademarks of Intel Corporation or its subsidiaries in the United States and other countries.
Other company, product, or service names may be trademarks or service marks of others.
vi Enabling Smarter Government with Analytics to Streamline Social Services

Preface
In this IBM® Redbooks® publication, we describe a centralized reporting and alerting system for governmental social service organizations. Included are suggestions about how to integrate key IBM building blocks that bring social services data sources together into an effective structure that allows for these:
� Reporting on key metrics required by higher levels of government to help secure funding
� Reporting on the effectiveness of the various social service programs, case workers, and providers
� Quick and easy access to all the services ever provided to a person and his family
� Aiding in the reduction of duplicate persons and therefore payments
� Aiding in the reduction of fraud and abuse of social services funds
The target customers for this solution are state or county social service organizations responsible for services, such as these:
� Caring for the welfare of children � Caring for the adult and aging� Getting people back to work who have fallen on hard times
Each of the following components of the solution is described in the chapters of this book:
� Introduction� Business environment and requirements� Developing the solution� Business outcomes
In addition, we describe the IBM Government Industry Framework in Chapter 5, “Government Industry Framework” on page 113.
The intent of this book is to provide information to help with building your own similar system. We have also included an appendix containing information about the IBM Government Industry Framework and services for additional guidance and use.
© Copyright IBM Corp. 2012. All rights reserved. vii

The team who wrote this book
Thisbook was produced by a team of specialists from around the world working with the International Technical Support Organization. The team members are depicted below, along with a short biographical sketch of each:
Chuck Ballard is a Project Manager at the International Technical Support organization in San Jose, California. He has over 35 years of experience, holding positions in the areas of Product engineering, sales, marketing, technical support, and management. His expertise is in the areas of database, data management, data warehousing, business intelligence, and process re-engineering. He has written extensively on these subjects, taught classes, and presented at conferences and seminars worldwide. Chuck
has both BS and MS degrees in industrial engineering from Purdue University.
Rena Burns is a Government Health and Human Services Program and Solutions Specialist, and has worked closely with the SSIRS Alameda County and IBM design and development team. She continues to support expansion of the solution with new programs and enhancements. She has worked with federal, state, and local government agencies nationally since the early 1990s, and her team has won national recognition. As an example, the One Stop Operating System (OSOS) requirements developed by her
team for Utah was named a national standard by the U.S. Department of Labor.
Jeff Butcher is a Solution Architect at IBM specializing in Identity Analytics. He has over 25 years of experience in this field and has applied it to several industries, including hospitality, retail, banking, homeland security, and social services. Jeff was one of the principal architects of the Identity Analytics product and came to IBM through the acquisition of Systems Research and Development in 2005. He was the principal technical sales representative who performed the initial proof of concept for Alameda County
and helped architect the complete solution. Jeff has since moved back into engineering to help develop the next-generation sensemaking technology code named G2.
viii Enabling Smarter Government with Analytics to Streamline Social Services

Allen Dreibelbis has over 32 years of experience in the IT industry with IBM that includes enterprise architecture, systems integration and consulting, solutions development, and world-wide software and services sales support. Allen, who is an IBM Senior Certified Executive Architect and published author, joined the IBM SWG Master Data Management Center of Excellence in 2006, supporting world-wide sales opportunities for master data management. He developed and published the Master Data
Management Reference Architecture in 2008, which became the basis for the Single View of a Person/Citizen Reference Architecture. He is now part of the IBM Software Group Integration and Solutions Engineering Team developing software accelerators for Single View of a Person/Citizen engagements, supporting world-wide Single View sales and customer implementations.
Don Edwards has been Assistant Agency Director of the Alameda County Social Services Agency, in Oakland, California since 2004. He joined the agency in 2000 as its Director of Information Systems and has worked since then as an integrator of technology into the business practices of social services. Prior to joining the county, Don worked for 12 years at Wells Fargo Bank and nine years at Kaiser Permanente as a Computer Operations Manager and Data Center Manger, respectively. Don is the sponsor of the
multi-award winning Social Service Integrated Reporting System (SSIRS), which includes the 2011 Nucleus Research's ROI Top Ten Award, a 2010 Computerworld Laureate and Computerworld's 21st Century Achievement Award Winner for Government, and 2009 IBM's Innovation Award: Outstanding IBM Smarter Planet™ Solution. He is a strong believer in continuous improvement on behalf of the customer, worker, organization, and community.
Michael Fernandes is an Information Systems Analyst at the Alameda County Social Services Agency in Oakland, CA. In his current position his responsibilities include architecting the SSIRS data mart and working with the ETL processes, BI reporting requirements, and IBM InfoSphere® Entity Analytics Solutions (EAS, now known as IBM InfoSphere Identity Insight) for the SSIRS project. Michael has a BS from Bombay University.
Preface ix

Jerome Graham is an Information Systems Manager for the Alameda County Social Services Agency, located in Oakland, CA. Jerome has over 10 years of experience in the field of Social Welfare Technology, working toward the use of technology to facilitate the effective delivery of Human Services. He received his bachelor’s degree in psychology from Rutgers University and a master’s degree from San Francisco State University, with a concentration in administration and planning. He has served as Project
Manger for the SSIRS for two years.
Julie Monahan is a Government Industry Consultant with the IBM Information Agenda® Team. She has 25 years of experience applying technology to build information technology solutions that help governments be more effective and efficient. She has an extensive background selling, defining, and delivering Business Intelligence solutions to solve client business problems. In her current position, she works with state, local, and federal governments to help define solutions leveraging the IBM
software portfolio, including IBM InfoSphere Master Data Management and Business Analytics and Optimization.
Celeste Robinson is an Information Systems Analyst for Alameda County Social Services Agency. She has over 30 years of experience with information systems. Celeste began her career working as a systems engineer for IBM and a telecommunications network. After that, she established a business and worked as a Desktop Database Developer for over 20 years. In her current position she develops and maintains ETL processes for SSIRS, the agency’s data warehouse. She is the author of several
how-to computer books, and was a contributing editor for PC World. Celeste has a BA in math from Northwestern University.
Reuven Stepansky is a Senior IBM DB2® Consultant in the North America Lab Services. He has extensive experience in architecting, guiding, and implementing large-scale data warehouses across many industries, with a focus on performance and business intelligence. Ruby is a Certified UDB 9 DBA and IBM Certified IT Specialist.
x Enabling Smarter Government with Analytics to Streamline Social Services

Vanessa Velasco is an Information Systems Analyst at Alameda County Social Services Agency in Oakland, California. She has positions ranging from Data Analyst, Business Analyst, Web Developer/Administrator, and Technical Lead. Her expertise is in areas of report automation, database, business intelligence, and business process improvement. Vanessa has conducted classes and presented at conferences throughout California on these subjects. Vanessa has a BS in Computer Science from San
Jose State University.
Other contributorsIn this section we thank others who contributed to this IBM Redbooks publication, in the form of written content, advice, and project support.
From IBM Locations Worldwide
� Barbara Guzak, Client Technical Architect, Global Solution Center, IBM Sales and Distribution, Dallas, TX
� Jim Patriquin, Principle Consultant in IBM Cognos® Professional Services, IBM Software Group, Information Management, San Diego, CA
From the International Technical Support Organization
� Mary Comianos, Publications Management
� Ann Lund, Residency Administration
� Emma Jacobs, Graphics Support
Now you can become a published author, too!
Here’s an opportunity to spotlight your skills, grow your career, and become a published author—all at the same time! Join an ITSO residency project and help write a book in your area of expertise, while honing your experience using leading-edge technologies. Your efforts will help to increase product acceptance and customer satisfaction, as you expand your network of technical contacts and relationships. Residencies run from two to six weeks in length, and you can participate either in person or as a remote resident working from your home base.
Find out more about the residency program, browse the residency index, and apply online at:
ibm.com/redbooks/residencies.html
Preface xi
Comments welcome
Your comments are important to us!
We want ourbooks to be as helpful as possible. Send us your comments about thisbook or other IBM Redbooks publications in one of the following ways:
� Use the online Contact us review Redbooks form found at:
ibm.com/redbooks
� Send your comments in an email to:
� Mail your comments to:
IBM Corporation, International Technical Support OrganizationDept. HYTD Mail Station P0992455 South RoadPoughkeepsie, NY 12601-5400
Stay connected to IBM Redbooks
� Find us on Facebook:
http://www.facebook.com/IBMRedbooks
� Follow us on Twitter:
http://twitter.com/ibmredbooks
� Look for us on LinkedIn:
http://www.linkedin.com/groups?home=&gid=2130806
� Explore new Redbooks publications, residencies, and workshops with the IBM Redbooks weekly newsletter:
https://www.redbooks.ibm.com/Redbooks.nsf/subscribe?OpenForm
� Stay current on recent Redbooks publications with RSS Feeds:
http://www.redbooks.ibm.com/rss.html
xii Enabling Smarter Government with Analytics to Streamline Social Services

Chapter 1. Introduction
IBM has an initiative that is called the Smarter Planet. A goal of that initiative is to help industries, cities, and entire societies to be more productive, efficient, and responsive. Being smarter means becoming instrumented, interconnected, and intelligent.
In this IBM Redbooks publication, we discuss and describe how the Alameda County Department of Social Services in Oakland, California is going about their goal of building a smarter government. In this ongoing implementation, they are building a solution to address the area of Smarter Social Services. As examples, for Alameda County being smarter meant becoming these:
� Instrumented: Information about beneficiary and program status is gathered through existing means, including telephone response, website input, and in-person interviews.
� Interconnected: The Social Services Integrated Reporting System (SSIRS) combines data to provide an agency-wide case view with evaluation capability, tracking individuals and establishing relationships.
� Intelligent: Near-real-time tracking and alerting, combined with analytic capabilities, enables elimination of waste, better control of fraud and abuse, and better compliance with regulations.
1
© Copyright IBM Corp. 2012. All rights reserved. 1

For an example of being smarter in action, a near-real-time view of cases gives workers deeper insight, enabling service flexibility, avoiding regulatory sanctions, and saving money by reducing fraud and waste (such as payment to individuals who are no longer eligible for assistance).
Having already met with significant success, they are continuing to enhance their solution to make their department even more efficient and effective.
How are they doing it? The answer to that is the basis for this book. In this book we discuss the ongoing implementation of Smarter Social Services. We start by describing the Alameda County Social Services environment prior to describing the journey, the issues encountered, and the solutions developed during initial implementations. Knowing that this is an ongoing and evolutionary direction, we describe the plans for continuing to enhance the smarter government initiative at the Alameda County Department of Social Services.
1.1 Achieving smarter government
Building a smarter planet is the IBM point of view on how interconnected technologies are changing the way that the world literally works. That is, the systems and processes that enable physical goods to be developed, manufactured, bought and sold; services to be delivered; everything from people and money to oil and water and billions of people to work, govern, themselves and live. It is the convergence of four kinds of infrastructure:
� The physical� The digital � The natural� The human
Real stimulus will combine these elements in the most productive ways to leave a lasting impression for good.
2 Enabling Smarter Government with Analytics to Streamline Social Services

Citizens around the world are calling for change, and many government leaders are the ones who are being handed a mandate for change. As government organizations begin to respond to their constituents, government leaders must lead through the unknown (Figure 1-1). A 2008 IBM CEO study spoke to changing expectations and the gap between envisioned change and past successes in managing through the change, resulting in a change gap of 23%. In a Smarter world, organizations will need balance the potential of new technology to meet demands within tight financial constraints.
Figure 1-1 Changing the way the world works
As government leaders look to develop strategies for change, those strategies must align with global challenges brought on by key drivers identified in a recent IBM white paper “Government 2020 and the perpetual collaboration mandate”:
� Changing demographics: Median ages are rising in the developed countries of Italy, Germany, and Japan, but dropping in developing ones such as India.
� Rising environmental concerns: Societies and governments are becoming more attuned to what the earth can provide and what it can tolerate.
� Growing threats to social stability and order: From terrorism to armed conflict to pandemics to natural disasters, the character of threats is changing.
CHANGE NEEDED
PAST CHANGE SUCCESS
CHANGE NEEDED
PAST CHANGE SUCCESS
21% 23%CHANGE GAP
CHANGE GAP
8%15%
77%
17%
27%
56%
27%
16%
55%
9%
12%
78%
2006 2008
No/Limited Change
Moderate Change
Substantial Change
No/Limited Success
Moderate Success
Successful
CHANGE NEEDED PAST CHANGE Success
The way the world works is changing . . . .. . . . and leaders must lead through the unknown
Gap between envisioned change and past success at managing it.
Public sector leaders anticipate substantial change ahead.
8 in 10
23%
Source: 2008 IBM CEO Study
© 20 09 IBM Corporation
Building a smarter planet: Government
Chapter 1. Introduction 3

� Accelerating globalization: Countries and societies are becoming more economically interdependent across social, political, and cultural boundaries, as illustrated by the current economic conditions.
� Evolving societal relationships: Today, governments are expected to deliver results and value through secure, private services that are available anywhere at any time.
� Expanding impact of technology: The adoption of the internet is remaking the landscape of business, healthcare, and government.
The catalyst for change is the transformation of the world's infrastructure. Virtually everything, process, and way of working is becoming more intelligent in how challenges are met and problems are solved, thus laying the foundation for governments to respond with smart solutions. People, systems, and objects can communicate and interact with each other in entirely new ways. The internet provides connectivity to over 1 billion people, and there are about four times that many mobile phone subscribers worldwide. Every day, nearly 15 petabytes of new information is being generated.
This unprecedented “information explosion” both facilitates and complicates the ability of governments and institutions to achieve and influence desirable outcomes. The volume of data and its increasingly diverse and interactive nature can paralyze organizations as they try to sort through the volume of data. A tremendous opportunity exists to use the growing mountain of data to make better, secure, fact-based decisions. Furthermore, there are opportunities to move traditional analytics from the “backroom” earlier into a business process to optimize business processes. Governments now have these ability:
� To respond to changes quickly and accurately and to get better results by optimizing for future events
� To analyze, apply, and share information from multiple sources to assess situations and react quickly
Government is at the core of ensuring the economic health, welfare, and security of citizens and societies. A smarter government leads by setting agendas based on priority initiatives focused on these:
� Citizen-centered experiences� Government accountability� Green solutions� Sense and respond (national and public safety) initiatives
4 Enabling Smarter Government with Analytics to Streamline Social Services

This is depicted in Figure 1-2.
Figure 1-2 Government priority initiatives
Smarter governments are acting upon high-priority initiatives through innovative collaborative networking and technology to protect and connect citizens, increase shared information awareness, and speed communications to ultimately elevate smart decision making. Governments are acting in new ways through innovations approaches to take these actions:
� Improving citizen and business services by taking these actions:
– Organizing agency services around the needs of the client
– Moving away from a transaction-based system to an ongoing client relationship model
– Sharing client information and collaborating with service providers
– Maximizing the value to taxpayers by reducing costs and optimizing business processes
� Managing resources effectively and efficiently by taking these actions:
– Integrating budget planning with performance objectives to measure and manage results
– Moving beyond physical records retention to electronic history, reporting, analysis, and planning to increase return on budget and managing risk
To ensure the economic health, welfare and security of their citizens, smart governments are working toward….
SENSE AND RESPONDCAPABILITIESEnabling defense and law enforcement organizations to achieve situational awareness, increased speed of command and combat superiority.
GOVERNMENT ACCOUNTABILITYLeveraging business intelligence and planning to improve insight and elevate performance with visibility and control.
CITIZEN-CENTEREDEXPERIENCES
Connecting people to programs based on
individual needs—achieving sustainable
outcomes while reducing operational costs and
maximizing taxpayer value.
GREEN GOVERNMENTFOR A GREENER PLANET
Deploying environmentally responsible operations,
from energy efficiency and conservation to transportation management and the pursuit
of renewable resources.
GOVERNMENT
© 2009 IBM C orp oration
Build ing a smarter planet: Government
Chapter 1. Introduction 5

– Reducing the tax gap by implementing tighter fiscal management controls
– Consolidating and optimizing financial processes to ensure successful compliance and regulatory management practices
� Strengthening national security and public safety by taking these actions:
– Facilitating travel and promoting commerce while maintaining border integrity
– Improving crime prevention by enabling law enforcement to better understand criminal patterns
– Increasing informed decision making by creating interoperability within and among military groups to enable coalition operations
– Increasing the speed of command and success in the field through network-centric operations
� Ensuring a sustainable environment by taking these actions:
– Improving transit experience by reducing traffic congestion and encouraging a modal shift among users
– Generating new sources of revenue to support capital improvements to the transit network
– Understanding how to reduce carbon footprints to help lower operational costs and conserve energy
– Using the correct tools to optimize water consumption, monitor quality, and model past and future behaviors
Operating in silos is an outdated model for 21st century government. The public sector has traditionally relied on a vast system of data collection and management about citizens and businesses, based on the needs of the individual agencies using that data. Over many years this results in a lot of data that resides in many discrete operational systems. This compartmentalization of data is compounded by procurement and budgetary processes that request and generate additional data, creating additional layers of redundant “buckets” of information.
Some of this data is inaccurate, outdated, or incorrectly associated with individuals and organizations. The mass of data can lead to improper allocation of benefits, time wasted on inefficient processes (including redundant requests for information), and long response times to citizen needs. The silos within and between government agencies, and a lack of data sharing among them, reinforce processes that are based on the needs and capabilities of the agencies, rather than on the needs of the citizens. The consequence of all of this is a slowly grinding process of government that frustrates citizens about the bureaucracy and impairs effective and efficient service delivery.
6 Enabling Smarter Government with Analytics to Streamline Social Services

Breaking this pattern requires new thinking in government and assistance from partners outside the public sector, and it is a priority goal (Figure 1-3). Agencies need to adopt new solutions and approaches to obtain better intelligence and more useful, citizen-centric, actionable guidance. Modern data management techniques should be applied at the agency level, to streamline and energize the process of government service and governance. This can be particularly effective in citizen-facing functions such as social services, taxation, and public safety and security.
Figure 1-3 A government goal
The goal is to facilitate increased information awareness and collaboration leading to smarter decision making across governments, agencies, and other constituents. Governments will interconnect these disparate systems to create a seamless and efficient societal structure. A key objective for this integration of information technology is to develop the “single view of the citizen.” The concept of single view of a citizen relies on breaking down the informational silos and connecting buckets of information in an efficient manner to give agencies the capability to manage entities (citizens or businesses) and their relationships in a trusted and secure architecture that meets compliance and legislative guidelines. It gives organizations the ability to construct accurate, trusted identity profiles that can be dynamically enhanced and shared securely to meet changing needs and mandates.
© 2009 IBM Corp oration
Building a smarter planet: Government
The goal? Increased information awareness and collaboration, leading to smarter decision-making across governments, agencies and other constituents
GOVERNMENT
Energy
LaborState
Agriculture
Commerce
Defense
Housing
Justice
Education
Healthcare
Treasury
Transportation
GOVERNMENT
20T H CENTURY GOVERNMENT 21ST CENTURY GOVERNMENT
Non-government Organizations
Universities
Private Sector Communities
Other Countriesand Governments
Chapter 1. Introduction 7

The imperative for government is threefold. Governments around the globe must focus on value by exploiting available opportunities and act with speed, focusing on the outlined actions identified in Figure 1-4.
Figure 1-4 A government imperative
Elected and appointed officials, policy makers, and other leaders will build public trust through effective policies that lead the way to stabilization and growth, and demonstrate accountability in the use of taxpayer funds. The IBM Smarter Planet strategy is based on government priorities and through creative experiences and successes with clients. IBM has implemented key solutions that address a wide range of complex challenges managed by governments around the globe, ranging from social services to public safety to transportation and financial management and more.
1.2 Achieving Smarter Social Services
Social services organizations are striving to become more efficient, effective, and responsive to the clients that they serve and to the tax payers who fund them. There are increasing pressures to do more with less.
Social services organizations are in the frontline of government efforts to deliver better outcomes with limited resources.
© 20 09 IBM C orporation
Build ing a smarter planet: Government
The imperative for government today is threefold
DELIVER VALUE
Focus on systems Strategic Initiatives Business Processes
Do more with less Improve revenue
collection Keep spending and
revenues in balance
Re-align relationships Enable collaboration Revisit existing
business relationships
EXPLOIT OPPORTUNITIES
Build future capabilities Examine governance and
organizational structures Cultivate talent Rethink key infrastructure
services
Transform your economy Initiate bold moves in
key industries Transform and stimulate Position nationally and
globally, where appropriate
ACT WITH SPEED
Manage change Clearly communicate
simple goals Seek and leverage
experience
Leadership Get the information to act Set the agenda
Risk and transparency Business performance
management and analytics Ensure compliance
8 Enabling Smarter Government with Analytics to Streamline Social Services

1.2.1 Business challenges
Social services organizations are wrestling with a common set of business challenges. In this section we give brief descriptions of a number of those challenges.
Costs are increasing while real funding is shrinkingSocial services expenditures represent a significant share of overall government expenditures. Budgets are shrinking while demand is growing for more and better services. For most industrialized societies, funding for social services represents the single largest component of government spending. Increasingly, however, the rising cost of social services and social security is outstripping these societies' abilities to support it, placing further emphasis on reducing the rate of growth of direct program costs (such as pension payments, health care costs, and income support payments) and the cost to administer these programs.
Service delivery is disjointed and uncoordinatedIn response to legislative mandates and funding restrictions, most social services and social security organizations operate in a relative vacuum, focused on addressing a narrow set of issues for their clients without regard for the broader challenges faced by clients and their families, or their involvement with other programs and organizations. This “siloed” approach to service delivery frequently leads to disjointed services, as organizations work in isolation (and sometimes at cross-purposes) to identify and meet the needs of the community and their clients, rather than in a coordinated and holistic manner.
Programs do not yield the outcomes expected of themSocieties establish social and workforce service programs to meet specific social outcomes:
� To protect the vulnerable� To aid those in need � To provide a safety net for those facing a social or economic crisis
Yet too often these programs fall short of these outcomes, disappointing their clients and undermining public support for both the program and the organization that administers it. Certainly, these poor results stem partly from the inherent difficulty of the work, but programs also suffer from a lack of accountability and an unwillingness to measure and take action to improve outcomes.
Chapter 1. Introduction 9

Demand for services and client expectations are increasingMost social services organizations are facing increases in the demand for the services and benefits that they provide and the level of customer service that their clients want. Changing demographics and economic conditions are driving these existing demands, while new services are required to address emerging social needs. Clients also expect social organizations to deliver the same level of customer service as the private sector, tailoring service offerings to meet their specific needs, offering help when and as they need it, and providing services that are culturally appropriate.
Workers make inconsistent decisionsSocial services programs are inherently complicated, requiring workers to apply constantly changing rules and policy guidance, in addition to their best judgment, to clients whose circumstances are often unclear at best and downright misleading at worst. Not surprisingly, workers often make inconsistent or incorrect decisions about program eligibility or service options for different clients in similar circumstances. This inconsistent decision making leads to increased workloads, including these:
� Appeals and reconsiderations for inappropriate decisions
� Lower public confidence in the integrity of programs as clients and constituents believe that decisions are arbitrary
� Poor client outcomes, as clients do not benefit from the best practices developed in the organization
Fraud, abuses, and errorsThrough criminal intent or simple human error, most social services and social security organizations devote a significant amount of resources to providing services to those not eligible to receive them. This is a challenge that is draining social services resources and undermining public support. In addition to the direct costs of these erroneous payments and services, organizations often suffer indirectly when taxpayers and constituents lose confidence in the integrity of the programs and the organizations that administer them.
Staffing models Current staffing models are inflexible, and the most experienced workers are preparing to retire. All organizations must be flexible to adapt to changing circumstances. Frequent staff turnover means organizations often have inexperienced staff that needs extensive support, and shifting business requirements can force organizations to redeploy staff to alternative assignments, where they must develop new skills quickly. Current staffing models and training processes do not support that flexibility.
10 Enabling Smarter Government with Analytics to Streamline Social Services

This challenge will reach a critical state in coming years as large numbers of experienced workers prepare to retire. Social services and social security work can be difficult, requiring skilled workers who understand its complexities. Because the institutional knowledge for these organizations has traditionally resided in its people and not its systems, there is limited support to help retiring staff pass their knowledge on to the remaining workers.
Inflexible applications The applications being used cannot meet current or future business and technical needs. Many of the legacy systems in social organizations are more than 30 years old and are inflexible, making it nearly impossible to quickly implement new programs and services or implement changes to existing programs. These systems are inherently rigid, so supporting evolving business requirements is difficult, time-consuming, and risky. Over time, organizations have built a series of silo applications to meet narrow business needs, using the prevailing technology of the time. Maintaining these disparate applications and the interfaces among them is increasingly hard to do.
1.2.2 The Smarter Social Services
Social services organizations understand that to meet these challenges they must transform the way that they do business by leveraging the information that is locked in siloed systems across a myriad of programs and exploit technology to shift from a program-centric view to a client-centric approach. By putting the client at the center of the delivery system, client needs will drive the way that services are organized and offered. The focus will shift from a program-oriented and transaction-oriented system towards an on-going relationship with a client, in which the focus is on achieving sustainable client outcomes. Client experience with the agency will be enhanced by improving access to information and communication through a multi-channel strategy providing one-stop service delivery. Services will be targeted more effectively, maximizing their value to both clients and taxpayers. The integration of service providers through information sharing and collaboration across the network will drive better and more effective services. With Smarter Social Services the cost of successful outcomes will be reduced by streamlining business processes, automating routine transactions, and focusing workers on higher value activities.
Smarter Social Services will help the agency address these key questions:
� How do we ensure that limited resources are going to those who qualify? � How can we make it easier for our clients to interact with our agency? � How can we achieve better outcomes by optimizing the programs offered? � How can we do a better job detecting and deterring fraudulent activities? � What tools can we use to help case workers prioritize and manage workload?
Chapter 1. Introduction 11

Smarter Social Services adopts a client-centric approach using technology and information to deliver improved social outcomes more efficiently (Figure 1-5).
Figure 1-5 Smarter Social Services
This is a significant challenge, but the time to act is now and the technology is available to support this transformation.
• Information used to target resources and identify improper payments
• Value delivered to Government and society demonstrated
• Effective collaboration across programs and service providers
• Efficient service delivery with integrated back office processes
• Improved client access, with self service providing digital data via multiple channels
• Up to date and comprehensive client information available to case workers
+ +
Smarter Social Services
Instrumented Interconnected Intelligent
12 Enabling Smarter Government with Analytics to Streamline Social Services

1.2.3 The journey to Smarter Social Services
The journey to achieving Smarter Social Services in not a single path but rather a set of building blocks that can be applied depending on the organization and environment (Figure 1-6). This approach takes into account the current competencies of the organization building on what is already in place and adding capabilities while driving value at every step of the way. Organizations can implement some of these steps in parallel, or even in a different sequence.
Figure 1-6 Progression path
Smarter Social Services can be achieved by building a set of core capabilities:
� Improved access to information about programs and resources includes an effective multi-channel strategy with effective use of online access to encourage client self-service. Access is increasingly over the internet, but access strategy will need to provide a range of channels to meet the demands of the entire population, including telephone access and access to personal advice at drop-in centers.
� A single view of the client establishes a trusted and secure information foundation across multiple data sources to create a comprehensive view of the client. Information is collated from many source systems and managed in a way to create a repository of trusted master data that can be used with confidence by multiple applications and agencies.
Clie
nt o
utco
me
impr
ovem
ent Smarter
Social Services
Drive broad government
outcomes that are more efficient and
effective across programs and organizationsProtect
resources and public
support by limiting fraud
abuse and error
Target resources to
the right clients at the
right time through better
strategic decision making
Create a data foundation across data
sources to create a
comprehensive view of the
client
Single View of the Client
Optimize service delivery process through improved
collaboration between clients,
partners and workers
Improve client-centric access
to social service program
information and resources
The Journey to Smarter Social Services
Improved Access to Information
Enterprise Case Management
Maturity
Integrated Approach to Fight Fraud, Abuse and Error
Integrated Approach to drive improved outcomes
Integrated Service Delivery
Chapter 1. Introduction 13
Information is integrated in a way that preserves the ownership of data, integrity, privacy preferences, and security of the data. The resultant 360-degree view of the client is critical to support reporting, analytics, and performance management.
� Enterprise case management optimizes the service delivery process by improving collaboration between clients, partners, and workers. By integrating information (structured and unstructured) and adopting a case management approach, case workers across programs and organizations can work together to deliver improved outcomes. Business processes are standardized and can be automated or consolidated.
� Fight fraud, abuse, and errors to protect resources and public trust by limiting improper payments. Employ analytics and risk management approaches to highlight potential cases of fraud, abuse, and error. Infuse information insights early in the process to identify fraudulent claims, avoiding “pay and chase.”
� An integrated approach for improved outcomes to understand how agency actions influence client behaviors, optimizing the program mix for improved social outcomes. With improved use of analytics, social organizations can gain insights to better target resources to the right clients at the right time through better strategic decision making. Improved analytical techniques include processing of more information from more sources (structured and unstructured), data mining, pattern recognition, predictive analytics, and enhanced reporting.
� Integrated service delivery to drive important government outcomes across programs and organizations. The social organization is agile in responding to changing demands of its stakeholders to drive continuous improvement in client satisfaction, service effectiveness, operational efficiency, and ultimately social outcomes. Achieving integrated service delivery requires building its own information capabilities to gain insight and operate efficiently plus effective collaboration with a network of partners. It also exploits its assets to contribute to the delivery of outcomes across other government departments/agencies.
1.2.4 Summary
Alameda County Social Services has started its own journey to achieving Smarter Social Services. The remainder of this book shares what Alameda County Social Services has accomplished, how they did it, and their futures plans to keep striving to meet the vision of Smarter Social Services.
14 Enabling Smarter Government with Analytics to Streamline Social Services

Chapter 2. The business environment and requirements
In this chapter we provide an overview of the Alameda County business environment and outline the requirements for a new information services solution implementation. The new solution, called Social Services Integrated Reporting System (SSIRS), enables Alameda to streamline social services with a new and enhanced level of information and reports. It includes gathering and integrating the appropriate data across the enterprise for quick and easy access to the data and the creation of new reports containing more in-depth information than is currently available. This new information will improve the efficiency and effectiveness of the social service programs, case workers, and providers.
2
© Copyright IBM Corp. 2012. All rights reserved. 15

2.1 Alameda County
Alameda County's population is 1.6 million people. The Alameda County Social Services Agency (SSA) handles more than 113,100 cases for four major programs. In addition, several clients have multiple cases across these and other programs. SSA is a 2200 employee organization with four primary offices and two outstation offices, which are co-located with other departments and at certain schools.
The agency is composed of four major departments:
� Administration and finance � Adult and aging� Children and family services� Workforce benefits administration (WBA)
The agency's mission, like all social services agencies, is to promote the health and well-being of individuals, families, neighborhoods, and communities. The agency is the safety net for children, the elderly, and the disabled, and helps people become self-sufficient. In doing so, the agency also owes it to the taxpayers to serve their clients in a cost-effective manner.
Multiple benefits and protective services programs are managed within the departments. The SSA also shares common clients with other county departments, such as the Probation and Health Care Services Agency, and partners outside of the county, such as hospitals and clinics. Some the agency controls and some it does not, yet the information needs to be shared for the benefit of the clients.
2.2 Key business drivers
In the SSA environment, there were three very specific business objectives that led to the development of the SSIRS:
� Improve work participation rate (WPR).
Faced with more restrictive regulations requiring better welfare outcomes, the SSA needed to gain a better understanding of individuals, case status, and program performance. The Deficit Reduction Act of 2005 required California, and in turn its counties, to meet WPR targets to maintain full federal funding and avoid penalties. The Act required that the work participation rate for welfare recipients reach 50%, and put the onus on county social services agencies to find a way to make that happen.
16 Enabling Smarter Government with Analytics to Streamline Social Services

State reports showed that Alameda had a WPR of only 12% (at the time last among California's 58 counties), and Alameda's contracted vendor system solution reported a 36% client welfare-to-self sufficiency engagement rate. The information was always three to four months old and wrong. So, Alameda's first requirement was to receive accurate information soon enough to keep their recipients engaged in WPR activities, before they drop out.
� Meet Title IV-E (Child Welfare) Waiver reporting requirements.
The Department of Children and Family Services needed to provide cross-program performance measurements for the Title IV-E waiver program to the federal government as a waiver organization. This program allows the agency to receive funding while keeping children in the home and strengthening the family, when it is safe to do so. The SSA needed to understand changes in cost, performance, and effectiveness of delivering services from multiple programs and partners, including performance metrics on a daily basis to evaluate the effectiveness of the program. This type of information was also needed to satisfy philanthropic organizations, which provide a portion of the county's funding.
� Eliminate reliance on external reporting services.
One of the key goals of SSIRS was to establish a trusted source of information to support the reporting needs of the organization, providing a more flexible, accurate, and timely reporting environment. SSA was reliant on a third-party reporting solution that did not deliver accurate or timely information. This solution was a significant expense to SSA, costing approximately $300,000 per year.
“Though we do a lot of good work it was clear we had some issues that were hampering our efforts. We were unable to tell where clients were in the social services system. We needed to give our caseworkers direct access to information about their cases, at the individual case level. We needed faster, better reporting. We needed to give the worker the right information, on the spot.”
Don EdwardsAssistant Agency DirectorAlameda County Social Service
Chapter 2. The business environment and requirements 17
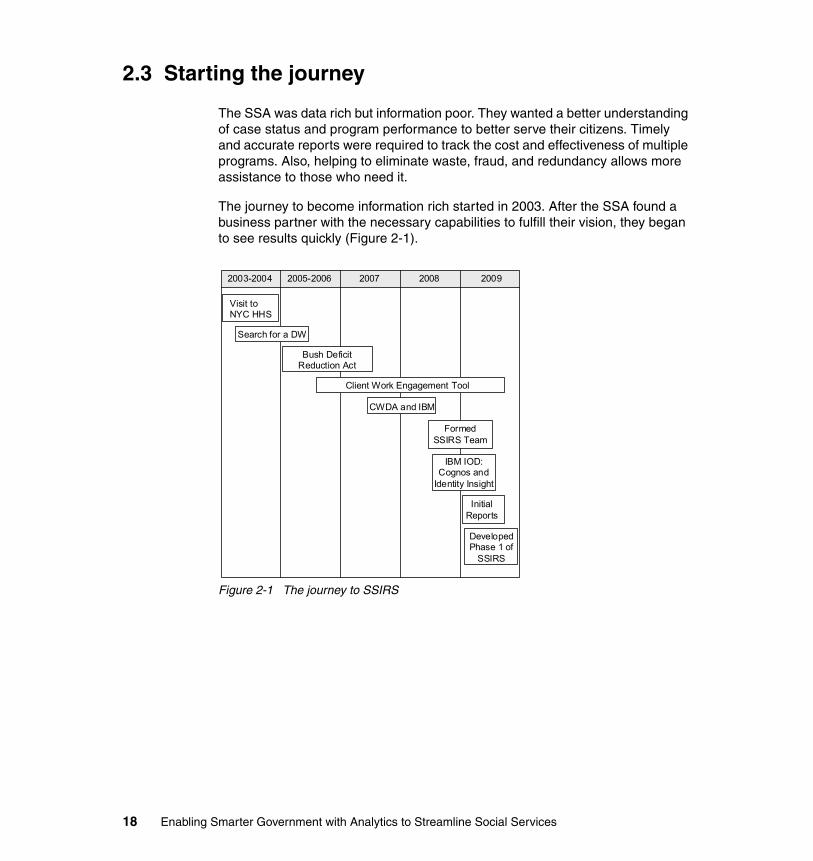
2.3 Starting the journey
The SSA was data rich but information poor. They wanted a better understanding of case status and program performance to better serve their citizens. Timely and accurate reports were required to track the cost and effectiveness of multiple programs. Also, helping to eliminate waste, fraud, and redundancy allows more assistance to those who need it.
The journey to become information rich started in 2003. After the SSA found a business partner with the necessary capabilities to fulfill their vision, they began to see results quickly (Figure 2-1).
Figure 2-1 The journey to SSIRS
2003-2004 2005-2006 2007 2008 2009
Visit to NYC HHS
Search for a DW
Bush Deficit Reduction Act
Client Work Engagement Tool
CWDA and IBM
Formed SSIRS Team
IBM IOD: Cognos and
Identity Insight
Initial Reports
Developed Phase 1 of
SSIRS
18 Enabling Smarter Government with Analytics to Streamline Social Services

Don Edwards, with a background in information technology, knew what was required, but was having difficulty finding the correct tools. Fortunately, he connected with IBM and began a partnership with them to develop SSIRS. These are mileposts along the way to reaching their goals:
� 2003
Don visited New York City Health and Human Services (HHS) and saw what each borough was doing to move people from welfare to self-sufficiency. It was a great example of how to work, but also how to implement a tool to get it done. However, the tool being used seemed cumbersome.
� 2004
Started search for a data warehouse. Everything appeared cumbersome, and too many vendors were involved. Found nothing that seemed to give value to the worker, and all were expensive at $3 million or more.
� 2005
The Bush Deficit Reduction Act (which included reform to help people move from the welfare rolls to self-sufficiency) went into effect. If the thresholds were not met, then there was a penalty in the form of repayments. In the first report, Alameda County was last in California.
� 2006
Restructured the agency and created the Employment Services Department (now a part of WBA). Contracted a consulting group to use a client work engagement tool that they developed. There was a lot of database clean-up needed to get the information about people up to date, which required lots of manual reconciliation.
� 2007
Searching for business intelligence (BI) data warehouses, Don happened past the IBM booth at the County Welfare Directors Association (CWDA) conference. There he saw a demo of a proof of concept (POC) built for San Francisco (SFO) County about emancipated foster youth. He finally found a data warehouse—but not just any data warehouse, a state-of-the-art business intelligence data warehouse.
� 2008
With the knowledge of what was possible in BI data warehousing, Don initiated an open request for price quote (RPQ) seeking those companies who could offer an end-to-end solution (with complete hardware, software, BI, consulting, and knowledge transfer). The objective was to find an experienced data warehouse development company that also owned the entire product line.
Chapter 2. The business environment and requirements 19

Several companies responded. However, most either did not own the complete product set or pointed to the IBM solution as their recommended choice for implementation. The IBM solution won the bid, and contracting directly with IBM was the final decision. The primary products were IBM InfoSphere Entity Analytics Solutions (EAS, now known as IBM InfoSphere Identity Insight) and IBM Cognos Business Intelligence.
From this, the SSIRS project was sized and priorities were set for what would be delivered in the first six months. A cross-functional team was put together with people with a number of skills:
– Web design– Voice response system– SSA finance– Child welfare– SQL database– Project management
� 2009
Equipment was procured and project implementation began. These six data sources that needed to be ingested:
– CalWIN: Eighteen county consortium system– CWS/CMS: Statewide Child Welfare system– CMIPS: Statewide In-Home Supportive Services – SMART: Adoptions– SMART: Employment Services– Versaform: Juvenile Probation (data not controlled by SSA)
And the journey continues.
2.4 Overcoming hurdles
The journey involved overcoming significant hurdles, in particular budgetary and privacy constraints.
2.4.1 Budgetary constraints
The Casey Foundation, a private philanthropic organization with an interest in child welfare, was also interested in a solution to solve a cross-program reporting problem. Therefore, they provided half of the funding to help build SSIRS.
20 Enabling Smarter Government with Analytics to Streamline Social Services
A case could be made that there were better things to do with the money. It was tough times, and budgets everywhere were being cut, but people needed to get back to work. So a business justification was developed to convince the agency director, finance director, and the county administration office with the following rationale:
� Outsourced reporting from the third-party vendor would be obsolete and no longer needed, which would eliminate those annual payments.
� Reports would be current, rather than three to four months old, and would now be accurate.
� Implementation would take less than a year.
� The agency would be able to track clients throughout their lives.
� SSA would finally see all of the services that they provide to their citizens.
2.4.2 Privacy constraints
Initially there were debates in other departments as to whether to exchange data with SSA.
The answer is that the issue is not one-sided. The SSA did not just want data from others, they also have information to share. This is a strategy that builds consensus. The SSA could now help others look at their data and cases in more detail, based on the rights associated with their roles and responsibilities. So, the SSA was providing data access, not just taking data.
For example, the sheriff’s department wanted certainty that detainees are adults and are not underage teens pretending to be adults. Getting young offenders to the services best suited for their needs is not just a safety issue but a behavior health issue too. The ability to help improve outcomes of our clients is a key reason for sharing information. The Health Care Services Agency wants better information about social service clients whose medical insurance is about to expire, while the Social Services Agency wants better and faster information about newborns in their case loads.
Treating privacy and confidentiality rules, such as the Health Insurance Portability and Accountability Act (HIPAA) and the Family Educational Rights and Privacy Act (FERPA), as guidelines for how to share is a paradigm shift in thinking. Look at privacy rules as guidelines for how to exchange data, rather than as barriers. The ability to share is always a challenge. However, there are templates that provide guidance that can be adopted from existing data sharing models.
Chapter 2. The business environment and requirements 21
2.5 Goals and objectives
Alameda County SSA's goal was to create a social services reporting and analysis system to enable a better integrated delivery of service to their clients. These were their objectives:
� To create an internal, central repository for reconciling client data into meaningful information
� To develop the ability to create reports and dashboards rapidly and responsively
� To provide case workers, supervisors, and managers with the ability to easily view their case load and case reports, and run queries on their clients across programs, initiatives, and providers
� To ensure the flexibility to expand and change in future phases
2.6 Business requirements
The following business requirements were identified as related to the objectives above:
� Create an internal, central repository for reconciling client data into meaningful information:
– Increase tracking and outcome accuracy levels.– Ease access to client data by management and users.
� Develop the ability to create reports and dashboards rapidly and responsively:
– Bring reports in-house, reducing SSA’s ongoing reporting administration costs and improve the reporting capacity.
– Create and refine reports and queries, both programmatic and fiscal, without waiting hours or days to receive results.
– Allow SSA's case managers and management to create their own personalized report views simply by dragging and dropping the information wanted and then saving them as future automatically scheduled reports (that is, daily, weekly, or monthly).
22 Enabling Smarter Government with Analytics to Streamline Social Services
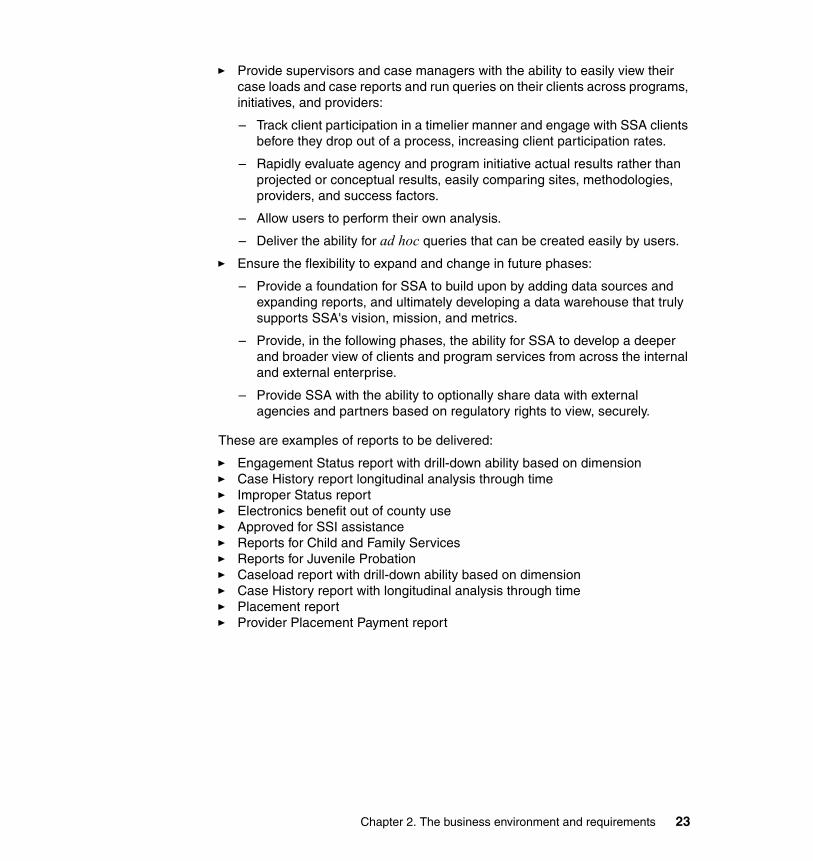
� Provide supervisors and case managers with the ability to easily view their case loads and case reports and run queries on their clients across programs, initiatives, and providers:
– Track client participation in a timelier manner and engage with SSA clients before they drop out of a process, increasing client participation rates.
– Rapidly evaluate agency and program initiative actual results rather than projected or conceptual results, easily comparing sites, methodologies, providers, and success factors.
– Allow users to perform their own analysis.
– Deliver the ability for ad hoc queries that can be created easily by users.
� Ensure the flexibility to expand and change in future phases:
– Provide a foundation for SSA to build upon by adding data sources and expanding reports, and ultimately developing a data warehouse that truly supports SSA's vision, mission, and metrics.
– Provide, in the following phases, the ability for SSA to develop a deeper and broader view of clients and program services from across the internal and external enterprise.
– Provide SSA with the ability to optionally share data with external agencies and partners based on regulatory rights to view, securely.
These are examples of reports to be delivered:
� Engagement Status report with drill-down ability based on dimension� Case History report longitudinal analysis through time� Improper Status report� Electronics benefit out of county use � Approved for SSI assistance� Reports for Child and Family Services� Reports for Juvenile Probation� Caseload report with drill-down ability based on dimension� Case History report with longitudinal analysis through time� Placement report� Provider Placement Payment report
Chapter 2. The business environment and requirements 23

24 Enabling Smarter Government with Analytics to Streamline Social Services

Chapter 3. Developing the solution
In this chapter we discuss the solution for the Social Services Integrated Reporting System (SSIRS). SSIRS is built on a robust architecture to enable both the information that is needed to monitor and manage the activities of the Social Services Agency (SSA), and to enable structured growth as those activities grow and change. Such an architecture is critical for the solution, as it provides the structured base and the components of which it is comprised. In particular, it has a repository of integrated data required to support and empower the social services case workers. It provides the workers with the correct information to monitor and analyze the status of the social services benefit recipients. The idea is to give the case workers a holistic view of each case and be alerted when specific cases are in need of attention.
As such, the architecture provides the tools and a structured approach for SSIRS to extract the required data from the appropriate county benefit system data sources, analyze and cleanse that data for normalization of identification data, and load the cleansed data into the data warehousing environment. From there it is accessed and analyzed to provide a consistent and current view of the services recipients. For example, the information and analytics technology enables county workers to speed up the eligibility process for potential recipients and to identify potential fraud or abuse.
3
© Copyright IBM Corp. 2012. All rights reserved. 25

3.1 Beginning systems environmentIn this section we provide an overview of the systems environment prior to the SSIRS implementation.
When social services began to gather the requirements needed for a Business Intelligence Data Warehouse, the following systems were used for client case management:
� CalWORKs Information Network (CalWIN)
This is an online, real-time computer program that supports the administration of public assistance programs (including Temporary Assistance for Needy Families, CalWORKs, Food Stamps, Medi-Cal, General Assistance, Foster Care, and case management functions for Employment Services), facilitates accounting and management reports, interfaces with the state of California, and satisfies the US federal mandate for a Statewide Automated Welfare System (SAWS).
� Child Welfare Services/Case Management System (CWS/CMS)
This is a statewide tool that supports an effective Child Welfare System of services. The CWS/CMS improves the lives of children and families by giving service workers information to improve case work services and freeing them from repetitive tasks. It provides policy makers with information to design and manage services and to fulfill State and Federal legislative intent. For more information go to this website:
http://www.hwcws.cahwnet.gov/
� Case Management Information and Payroll System (CMIPS)
This tracks case information and processes payments for the California Department of Social Services In-Home Supportive Services Program, enabling nearly 400,000 qualified aged, blind, and disabled individuals in California to remain in their own homes and avoid institutionalization. For more information go to this website:
http://www.cmips2project.ca.gov/
26 Enabling Smarter Government with Analytics to Streamline Social Services

� Service Management Access and Resource Tracking system (SMART)
This is a companion system to CalWIN. It is deployed both as a client/server (SMART) and a web enabled n-tier system (WebSMART). SMART is used to manage case information that is not located in CalWIN, and is in two distinct modules:
– ES holds data on Employment Services that cannot be entered into CalWIN.
– AAA includes data for a number of smaller programs, including Adult and Aging and adoptions. It is used to manage client/provider assignments and billing for In-Home Support Services.
� Placement Tracking Data
This holds details about the placements of probation youth. It also provides information about the minor’s parents and other guardians.
Each of the above systems has its own inherent reporting modules, and each has its own format, frequency of available data, and ease of use of the reports.
There were multiple types of reports for the respective case management systems, and there were also two distinct report user groups:
� The workers themselves � Department management
The type of reporting that was available was utilized more by management, primarily because it was based on reporting extracts of the data that were only available on a monthly basis. The information provided in the reports was aggregated, and so did not provide the detailed case-specific information needed by the eligibility and social workers. CalWIN reports came directly out of an application, and so were more accessible than other case management systems, such as CWS and CMIPS. However, because of the currency level of the information, use of the CalWIN reports by the staff worker level is minimal.
The CalWIN Management Reports (MR) are available in a monthly format via downloadable extracts. Those extracts are provided to a consortium of counties, rather than being customized by county. Therefore, counties can either use a third-party vendor to create custom reports based on the extracts or develop the reports in-house. CMIPS reports are provided by the state monthly. The staff has to log into the front-end application and perform manual calculations to get the information that they need for analysis. There was a variety of methods used to access reports. The CalWIN reports were available in the application, but there was no web-based version of the reports available via the internet. Also, in the case of CMIPS, the entire month's worth of data had to be loaded into the report module each time that someone wanted to use it.
Chapter 3. Developing the solution 27

In addition to the frequency of data availability issue and the need to create reports from extracts, there was still the issue that a report on a client that crosses multiple systems could not be made, nor could aggregate reporting be performed across multiple systems. To handle those tasks there is an Office of Data Management (ODM) and Program Evaluation and Research Unit (PERU). PERU largely handles Children and Family Services (CFS) reporting, often comparing CFS clients with Probation clients, as those systems often have clients in common. The ODM typically handles CalWIN and SMART report requests. To compare data from two sources, the reporting and analytical tools Crystal Reports, IBM SPSS® (IBM SPSS Statistics products), Microsoft Access, and Microsoft SQL were used. Queries had to be created that performed the necessary joins to connect the relevant portions of data. Furthermore, issues such as multiple meanings for similar data elements, data type and format differences, and any inconsistencies in the information received via different case management systems were left for ODM and PERU to resolve. Having to account for these issues and the overall differences found among the multiple data sets at times led to a delay in ODM and PERU meeting their report request deadlines. It was with the understanding of the inherent difficulties experienced in connecting disparate sources that SSIRS was conceptualized.
Report generationIn this section we discuss and describe report generation in the beginning systems environment. This section specifically focuses on obtaining reports from CalWIN, CMIPS, and CWS/CMS.
As previously mentioned, the MR extracts are not reports themselves, but pre-arranged data sets from which reports can be created. Alameda County created some reports using the extracts in-house, but for others contracted with an outside vendor, Exemplar, to create case listing reports for Welfare-to-Work (WTW) clients in the CalWIN system.
28 Enabling Smarter Government with Analytics to Streamline Social Services

CalWIN MR extract examplesFigure 3-1 shows an example of the OnDemand Internet Client, which is the interface used to search for management reporting extracts in CalWIN.
Figure 3-1 Interface for report extracts
Chapter 3. Developing the solution 29

A partial list of the types of case data that was available based on the MR extracts is shown in the example depicted in Figure 3-2. With this list, the case worker can then select and access the desired report.
Figure 3-2 Reports from MR extracts
30 Enabling Smarter Government with Analytics to Streamline Social Services

Figure 3-3 is an example report showing case counts (the number of cases being handled) by program. As indicated by the number of pages returned (1352, pointed to by the arrow on the right side of the figure), it was not easy or fast to find the information of interest. Attention must be given to the currency of the data, as indicated by the extract date (pointed to by the arrow on the left side of the figure) of the monthly extract.
Figure 3-3 Case counts
The extract frequency was one of the issues to be resolved with the design of SSIRS, which was to provide the extracts on a daily basis rather than monthly. The SSIRS reports also can be available in a more timely fashion due to the fact that they are developed from CalWIN sources in-house, meaning that there was no need to wait for the availability of a third-party data set to create the reports.
Chapter 3. Developing the solution 31

CMIPS report examplesNext we provide example reports from the Case Management Information and Payroll System (CMIPS). CMIPS provides ad-hoc reports available monthly that come from a state-developed reporting tool, and online reports that are available via the internet. Figure 3-4 shows the menu for the Ad-Hoc reports.
Figure 3-4 CMIPS main menu
After loading the reporting program the menu screen displays. You can then choose (Chore) Provider or (Service) Recipient screens, which are basically replicas of the screens in the application (Figure 3-5 on page 33). You then fill in the fields for the results that you want to have shown in your report. It is not important to read the contents of the report in the figure, as that is provided simply to show an example of the structure of the report.
32 Enabling Smarter Government with Analytics to Streamline Social Services

Figure 3-5 Selecting the desired results for the report
Chapter 3. Developing the solution 33

Figure 3-6 shows an example listing of the chores that are provided by the In-home workers for their clients. Again, it is not important to read the contents of the report shown in the figure. This is provided as an example of the structure of the report. You simply fill in the areas desired for the report.
Figure 3-6 Example listing of chores provided
34 Enabling Smarter Government with Analytics to Streamline Social Services

Figure 3-7 shows the format and types of data that can be provided with the Supervisor Case List report. We only show headings of the report, as an example and without any data, for informational purposes, as the data would be Confidential.
Figure 3-7 Ad-hoc Supervisor Case List report
As the agency looked at SSIRS as a reporting alternative, the goal was to be able to gather requirements for the most frequently requested reports for In-Home Supportive Services (IHSS) and be able to provide them to workers on a scheduled basis, rather than have the workers go to the ad-hoc and online reporting system when they needed data.
Chapter 3. Developing the solution 35

In the following pages of this section we show examples of other reports available online with CMIPS. Figure 3-8 shows the online screen used to select reports.
Figure 3-8 Online reports selection
36 Enabling Smarter Government with Analytics to Streamline Social Services

CMIPS online reports are pre-configured and do not allow a user to create their own search parameters. Instead they enter what county they are from and the desired date ranges, and then choose from an existing list. Figure 3-9 shows sample result set output from a search for case lists by the district office.
Figure 3-9 Online reports result set
You then select one of the links in the result set to get the appropriate output information.
One of the compelling reasons for creating SSIRS versions of CMIPS reports was to provide the customization allowed in the ad-hoc reports with the convenience of the online access. As a result, rather than choosing from a pre-set list of reports, users could meet with the SSIRS team with their own reporting requirements that could then be emailed to them on a scheduled basis.
Chapter 3. Developing the solution 37

CWS/CMS report examplesNext are example reports from the case management system for Children and Family Services, CWS/CMS. There are two types of reports that are available, those directly from the CWS/CMS application itself and those available from a Now we describe the process to obtain a report from CWS/CMS:
1. Figure 3-10 is an example of the online screen used for report selection. A report type is simply highlighted for selection, and printed by clicking Print.
Figure 3-10 Report menu options
38 Enabling Smarter Government with Analytics to Streamline Social Services

2. Select the case for which you want to view information (highlighted) (Figure 3-11).
Figure 3-11 Case selection
Chapter 3. Developing the solution 39

As a result of the case selection, a listing of the report is presented (Figure 3-12).
Figure 3-12 Selected report output
SafeMeasuresSafeMeasures is a unique and innovative internet-based reporting service from the National Council on Crime and Delinquency (NCCD), a global non-profit research organization. SafeMeasures uses analytics to help social service agencies achieve better outcomes, improve service, and operate more effectively. County child welfare agencies in California use SafeMeasures to obtain detailed reports and other metrics created from nightly analysis of case management data. With SafeMeasures, NCCD leverages its knowledge and expertise in data analysis to help California counties manage more than 172,000 children receiving child protective and foster care services.
SafeMeasures has been used in California since 2000 and has been instrumental in improving agency performance and child outcomes. SafeMeasures is also used statewide in Virginia and New Jersey to better manage their child welfare systems.
40 Enabling Smarter Government with Analytics to Streamline Social Services

Figure 3-13 shows a segment of the SafeMeasures menu for California counties. California counties currently have access to over 300 SafeMeasures reports, with topics ranging from timeliness of referral contacts to the names and addresses of foster children in proximity to active wildfires. While the majority of reports are the same for all counties, some counties might have additional, customized reports or might have the standard reports modified to meet their individual needs.
Figure 3-13 SafeMeasures menu
Courtesy of SafeMeas ures
Chapter 3. Developing the solution 41

Most reports are structured like the example in Figure 3-14.
Figure 3-14 SafeMeasures report
This report shows both longitudinal and point-in-time data for a key federal metric, the CFSR Placement Stability measure. Users can view the data at the county level or filter it down to any level of the agency, including individual caseloads. The report also provides alternate views of the data, such as crosstabs and office, unit, and caseload comparisons. Users can also drill into the charts and tables to view detailed lists of the cases that make up each category. Because data is analyzed nightly, reports provide up-to-date information, enabling managers to ensure that work assignments are completed on time and in accordance with agency standards.
Courtesy of SafeMeasures
42 Enabling Smarter Government with Analytics to Streamline Social Services
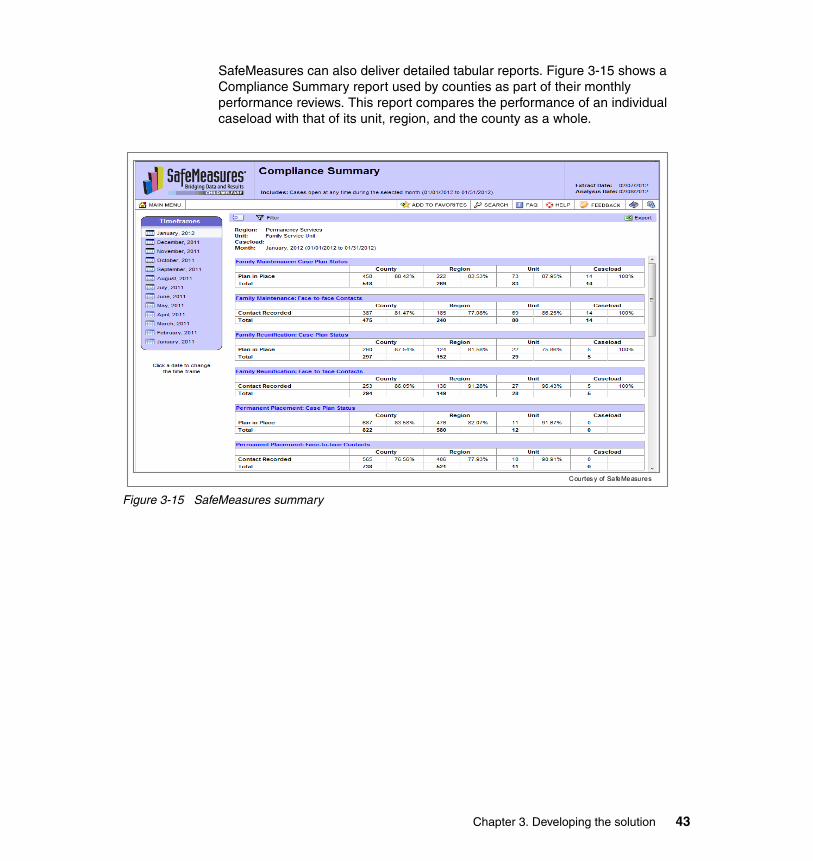
SafeMeasures can also deliver detailed tabular reports. Figure 3-15 shows a Compliance Summary report used by counties as part of their monthly performance reviews. This report compares the performance of an individual caseload with that of its unit, region, and the county as a whole.
Figure 3-15 SafeMeasures summary
Courtes y of SafeMeasures
Chapter 3. Developing the solution 43

For quick access to summary performance data, many counties put a scorecard on their SafeMeasures menu (Figure 3-16). This scorecard gives an at-a-glance view of county performance on a variety of key performance indicators (KPIs). KPIs are expandable to show trend and other details, and each is linked to standard SafeMeasures reports for filtering and generating lists.
Figure 3-16 SafeMeasures Scorecard
Courtesy of SafeMeas ures
44 Enabling Smarter Government with Analytics to Streamline Social Services

The My Upcoming Work list appears on the main menu of any worker with a current caseload. It displays the worker’s current caseload, along with color-coded indicators for upcoming tasks (Figure 3-17).
Figure 3-17 SafeMeasures My Upcoming Work
Users can sort the list by each task to see which cases have an upcoming task due and which tasks are overdue. Detailed information is available by clicking the case name. A comprehensive report for each individual case, including contact and assignment histories, is also available with a single click.
As with all SafeMeasures reports, the compliance tasks, timelines, and indicators are determined in close collaboration with county staff.
For more information about SafeMeasures, contact NCCD at 1-800-306-6223 or email [email protected].
Similar to the case with CMIPS, the goal of CWS/CMS reports from SafeMeasures® and SSIRS is to allow the users to decide what type of reports they want to see, then working with the SafeMeasures or SSIRS teams to customize them as they want.
Courtesy of SafeMeasures
Chapter 3. Developing the solution 45

3.2 Solution environmentIn this section we define the environment required to support SSIRS. In brief, SSIRS has been implemented to provide consistent and accurate information to enable monitoring and management of the Social Services Agency activities.
The functional components that support the SSIRS solution are depicted in Figure 3-18 and listed here:
� Data requirements: The particular administration data sources to be used.
� Data integration: The cleansing and transformation of the data elements and data sources to enable their integration for consistency and accuracy.
� Data preparation: The actions necessary to categorize, standardize and match the data for easier analysis and understanding by the users.
� A data repository: For organizing and storing the integrated data, and enabling fast and easy access by the users.
� Turning data into information: Enabling users to ask for and receive the required information in the form of queries and reports.
Figure 3-18 Solution environment
The functional components of the solution environment are described in more detail in the following section.
Transformation & Resolution Data Analysis
Extracts
Data Sources
Query and Reporting Tools
Tools and Databases Standard and AdHoc Reporting
CalWORKS
CMIMPs
CWS/CMS
Employment
Smart ES & AA
CMIPS
CWS/CMS
CIS
Placement Tracking
Enterprise Data Warehouse
Operational Data Store
Data Marts
Identity Insight Repository
Data Warehouse
Pre
par
ing
the
Dat
a
Match clientsacross data silos
Reporting Server
Enable cross program reporting
Mat
chin
g a
nd
Sta
nda
rdiz
atio
n
To
ols
46 Enabling Smarter Government with Analytics to Streamline Social Services

3.2.1 Data requirementsThe selection of data sources for the first phase of SSIRS was driven by the need to understand how the County of Alameda Social Services Agency serves its clients across widely utilized programs such as CalWORKs, Medi-Cal, CalFresh (Food Stamps), General Assistance, Children and Families, and In-Home Supportive Services, in addition to smaller program systems such as Probation for Minors and Adoptions. Clients and the services that they receive for each of these programs are tracked in separate databases on various platforms making cross-system analysis tedious at best and nearly impossible at times. One of the primary goals of the data warehouse project was to address this problem by bringing the data from disparate sources into one database and thus facilitating analysis of service delivery and efficacy.
� County Information Server (CIS) is a copy of CalWIN, the 18-county Temporary Assistance for Needy Families (TANF) consortium system to determine eligibility and track the delivery of CalWORKs, Medi-Cal, CalFresh, General Assistance benefits, and other related programs. TANF is the Federal version of California Welfare Opportunities for Kids (CalWORKs).
� CWS/CMS is a statewide system used by the Department of Social Services Division for Children and Families to track referrals, placement, and other child-protective services.
� SMART ES is a County SSA system containing Employment Services and smaller programs such as Cal-Learn that cannot be entered into CalWIN.
� SMART AAA includes data for a number of smaller programs including Adult Protective Services and Adoptions.
� CMIPS stands for the Case Management Information and Payroll System. It is a statewide system used to manage client/provider assignments and billing for the In-Home Supportive Services Program.
� Versaform contains juvenile placement tracking data details for the Department of Probation. This source also provides information about the minor's parents and other guardians.
3.2.2 The need for data integrationWhen data from disparate sources is brought into a data warehouse, it is safe to assume that data sources can and will have different data type standards. Values such as social security numbers can be stored in text fields with dashes in one source (for example, 555-44-3333) but as non-formatted integers in another (for example, 555443333). Similarly, numbers can be stored with leading 0's (zeros) in the text files exported from one source (for example, 0123), but appear without leading 0’s in other export files (for example, 123).
Chapter 3. Developing the solution 47

Text values can be entered in uppercase or mixed case, varying even within the same source. For example, a person's first name might appear as Ruby, Reuven, or REUBEN. Also, input data can not have been checked for accuracy, and data relationships might not have been enforced, leaving orphaned data that gets exported to a warehouse.
Data integration refers to the process of standardizing data that is brought together from various sources so that it can be loaded and reported on without the problems that you can encounter if this important step is overlooked or minimized. If time is not spent thinking about how data needs to be integrated, all kinds of problems will surface. As examples, you might experience failed data loads into the warehouse, incorrect query results, and bad data summarization, all leading to inaccurate data analysis and ultimately poor decision making. In this section, we discuss our needs and subsequent choices regarding data integration in SSIRS.
Before we talk about the details of data integration as it relates to SSIRS, note that SSIRS is different from some data warehouse installations where the primary goal is to create a database structure that allows for a pan-source view of clients that is used for all reporting. At SSA, there is a need to be able to see clients across sources, but we also want to view clients from the perspective of each source. For example, if Mary Smith, a CalWIN client, appears as Mary Smith-Jones in SMART, we do not want to have to make a choice as to how to store her name and other details in the warehouse. We want to be able to represent Mary as she is known in each source and also provide entry to the pan-source view of her activity as an SSA client from any and all of her representations in our sources.
To accomplish this, we store data in three databases. The following actions were taken during our Extract, Transform, and Load (ETL) process:
� Data is loaded into separate sets of operational data store (ODS) tables for each source. Because the types of details stored in each source vary greatly, we store source data in tables with the same or similar structures as the originating databases, eliminating the need to force less frequently used data into multi-purpose tables.
� Client-related data is loaded into one set of tables in the IBM InfoSphere Entity Analytics Solutions (EAS) database. EAS assigns entity IDs to clients that persist across sources. These entity IDs are then stored in the client-related tables in the ODS so that client data can be joined across sources.
� Data from the multiple sets of source-centric tables in the ODS is loaded into one set of tables in the data mart to accommodate speedy reporting on pre-joined data.
48 Enabling Smarter Government with Analytics to Streamline Social Services

We had to address different data integration issues for each of these loads. For the ODS, we do not have to worry about things such as how to load SSNs with dashes into a DB2 number type field (assuming that we were integrating data into a table where that was the SSN field type that was decided on). We simply load the SSN with dashes into a CHAR type DB2 column preserving the format of the SSNs as they appear in the source. However, for dates and timestamps, it is not always so simple. Date values that are extracted in formats that DB2 does not recognize need to be reformatted before they are loaded into the ODS tables. We do this using various techniques. For the CWS/CMS data, some reformatting is done using the business objects queries used to extract the data from the source DB2 database. For the SMART data, dates and timestamps are formatted using the Visual Basic subroutine used to extract the data from the SQL Server database that it resides on. Visual Basic is also used to strip leading 0's from CMIPS number values so that they can be loaded into DB2 number columns.
In addition to these data type compatibility issues, another type of integration is performed as data is loaded into the ODS (and EAS). In the probation data, details about mothers, fathers, and other adults are stored in the child client records. This data on these other adults is loaded into separate tables for T_CLIENT_MOTHER, T_CLIENT_FATHER, and T_CLIENT_OTHER in the EAS database so that they can be assigned entity IDs. The separate mother, father and other adult records are then loaded into similar tables in the ODS. These tables do not exist in the source databases. They were created so that the adult details can be stored separately from that for the child they are related to. This is an example of data transformation and data integration used together to store data in a new way so that it can be processed (in this case, assigned an entity ID) and queried more flexibly.
For EAS, the client-related data from all sources goes into one set of tables. This is a quintessential example of data integration in SSIRS. Because EAS is designed to identify people across sources despite data differences, we do not have to be concerned with differences in the spelling of names, address formats, or similar differences when loading data into EAS. One part that does require a bit of extra care is the loading of the EAS data source account values. These values are typically loaded from client IDs in source. The EAS data source account that is used to identify clients is a VARCHAR type field in DB2. Some of the client IDs that get loaded into this EAS field are integers, so they need to be transformed as they are loaded. We talk about this in more detail in 3.3.2, “Data transformation and loading” on page 64.
Chapter 3. Developing the solution 49

The data mart is the area of SSIRS that requires the most thought and planning in the area of data integration. Because the data from all the sources goes into one set of tables, these tables had to be designed to accommodate not only data with varying data types, but data with completely different characteristics also. As with EAS, client IDs in the data mart are an example of a case where data needs to transformed so that it can be integrated. Client IDs are simple integers in some of the source data that is loaded into SSIRS. Others are alphanumeric values. Any time that there is a difference like this with how values are stored in source systems, a VARCHAR DB2 data type is used for the data mart column. DB2 SQL functions are then used to cast integers as text (or perform whatever transformation is needed) when they are loaded into the data mart tables. Another example of a simple task related to data integration is loading values that are called, for example, Services, in one source into a column called Programs in the data mart. These simple transformations are needed to store incoming data with different properties into the same column in a warehouse table. A more complicated transformation occurs when transactions are summarized or otherwise selectively loaded from one system into the data mart so that they have the same granularity as transactions loaded from another system.
Some of these data integration issues were considered during the initial planning phase of the SSIRS database tables and load procedures. The resulting table and process designs accommodated the anticipated data integration. As is typical, though, with developing a system like SSIRS, some problems with data integration were not foreseen during the design phase. They were encountered during testing, resulting in revisions to tables, SQL, and shell scripts. As source systems change and new types of data present in the files loaded into SSIRS, load procedures and database tables will continue to need revisions to ensure good data integration.
3.2.3 Using analytics to find data relationshipsSolutions involving the transformation, movement, and integration of data must include some level of matching of like entities, and many attempt to track relationships between those entities. For instance, if you have a joint credit card with your spouse, you would both be considered entities, financially related. Some banking systems might also note that you are married on your accounts.
Social services systems work much the same way. When a person applies for aid, they often need enough services to care for their entire family, and so these systems require the entire family, or household, to be entered into the system and the relationships explained.
50 Enabling Smarter Government with Analytics to Streamline Social Services

Identity and relationship analytics (IRA), also known as entity resolution, performs matching of entities and tracks known relationships such as these. But its greater purpose is to find relationships the source systems did not know about and inform appropriate personnel when something interesting happens.
SSIRS performs matching of entities and tracks known relationships such as these. SSIRS also finds relationships that the source systems did not know about between programs, household members, providers, and county employees. SSIRS informs appropriate personnel when something interesting happens, such as the birth of a child into a family or potential fraud.
Matching in Social Services environmentsSocial Services environments require more sophisticated matching algorithms than those thought sufficient for traditional data warehousing needs. The names of mothers and their children often change. Dates of birth and social security numbers might initially be unknown, guessed at, borrowed from another, or even purposely changed.
Not only is there a problem of matching across systems, but also of matching within the systems themselves. During initial loads, both clients and cases were found that should have been matched but were not. Many had multiple social security numbers and several even had multiple fingerprint records.
Hidden relationships in Social Services environmentsOne usually associates detecting hidden relationships as an action performed in a back room by a fraud detection department. In a social services environment, it is more about helping the case worker better understand what services have been provided to the family.
Fraud detection is everyone's job. One reason that a case worker misses an obvious attempt at fraud is that they cannot see the possible matches and relationships of the people they are trying to help in the case management system.
Furthermore, many people do not start out to commit fraud, but when they receive extra benefits (simply because the system failed to find a match), they do not always speak up.
What is interesting in a Social Services environmentWhile seeing the full picture of a client across source systems is quite interesting in itself, it is also intended to inform case workers when their clients go out of compliance or are otherwise no longer eligible to receive benefits (for instance, if they go back to work, die, or drop out of school).
Chapter 3. Developing the solution 51
Many compliance checks are performed by the source systems themselves. However, whenever the check involves external data that must be matched to internal data, particularly if the external data needs to be kept secure for privacy reasons, an application is needed for that purpose.
As an example, a compliance requirement for receiving TANF benefits is participation in employment activities, such as job search, and training weekly for a required number of hours. Prior to SSIRS, the mandatory federal and state reports from the county were inaccurate and on average one month delayed. As a result, a large percentage of recipients were non-compliant, some for more than two years. Alameda SSA now receives accurate data as proven by the ability to drill down to the case activity and date fields—the following day, instead of the following month.
3.2.4 The data repositoryIn this section we describe the repository for the data after it has been transformed, integrated, categorized, and standardized. The data repository can be an operational data store (ODS), enterprise data warehouse, federated data warehouse, data marts, or some combination of these.
These are the potential options for a data repository:
� Federated data warehouse or database
This is a virtual, pseudo-database that transparently integrates multiple, usually autonomous, sources into a single federated database. There is something akin to a federated Catalog that, for example, describes the sources and the data objects, details the mode of access to the individual data stores, and depicts authorization rights to the data. Each constituent source remains autonomous and is dependent on the source's processes for its data currency and usage. Ideally, there is a computer network that allows the federated database to communicate to all sources. The sources are usually geographically decentralized.
The advantage with this option is that there are minimal additional storage requirements because the data repository is not required to be landed at the target.
The downside aspects are manifold:
– Dependencies on network contention and speeds– Lack of control of the source data– Stale information– Lack of flexibility for defining new structures and to physicalize the data
The need to constantly recreate virtual tables and potential lack of performance optimization are examples of areas of concern.
52 Enabling Smarter Government with Analytics to Streamline Social Services

� Operational Data Store (ODS)
This repository is designed to integrate data from multiple sources for additional operations on the data. However, when time is not permitted to truly analyze the source data and build a useful and flexible data model, the ODS often becomes just a staging landing zone repository of the source data.
The value of this option is that after negotiations for the sources are completed and after the data is acquired, then modifications to other data formats can be more easily accomplished.
The potential weakness of an ODS is additional disk storage and additional processing cycles to eventually migrate to a good data model. If reporting is executed against a staging, non-modeled ODS, performance can be degraded.
� Enterprise Data Warehouse (EDW)
These are key points of an enterprise data warehouse:
– It is a single version of the truth.– It has multiple, and all, subject areas needed for the business.– Being normalized versus de-normalized is still open for debate.– It becomes mission-critical.– It is scalable to allow for the evolution of the business.
The strength of an EDW is that all required data is available and centralized, and it is usually well-defined with a robust data model. For many industries, including smarter government, this is the optimal environment.
� Data marts
These are focused areas of data constructed for reporting purposes and for query performance gains. A data mart is a focused derivative of the operation data store. For an example, see Figure 3-29 on page 83.
The benefits of this option are usability, speed of report production, and focused extensibility.
The disadvantages of a data mart are that additional disk storage is required, processing cycles are required to periodically update the data marts, and there is a potential lack of data freshness.
Chapter 3. Developing the solution 53

3.3 Solution architecture and descriptionIn this section we describe and discuss the SSIRS solution architecture and the components of which it is comprised. These components can be connected and integrated to take the appropriate inputs, process them, and deliver the required informational outputs to users. The architecture is valuable because it enables components to be added, modified, and replaced or removed without disturbing the other components. There are defined interfaces, inputs, and outputs for the components that enable this flexibility.
As an example, a robust architecture for SSIRS can enable it to receive the data inputs from a multitude of sources and prepare that data to be ingested into an appropriate data repository environment. By preparing the data, we mean to perform all necessary data selection, cleansing, consolidation, integration, standardization, and reformatting to provide users with a repository of data that can be easily accessed and used for informational and decision-making purposes. To support that decision making, there are powerful analysis and reporting tools available. Providing the county workers with these tools helps develop a more efficient, effective, and productive county agency. In addition, the data can be monitored and mined to discover new relationships and trends that could result in the county’s workers providing even better service to their social services recipients.
A robust architecture typically describes the functional capabilities and components that are required for a particular solution environment and the actual products or in-house developed applications, which enable the implementation of the solution. In this case, the architecture supports the delivery of the requirements for a smarter government, which enabled Alameda County to successfully implement a powerful information solution.
As you develop your architecture, it should have the following characteristics:
� Scalable
You must anticipate that with a successful implementation the outcome will demand increasing data volume and data sources.
� Flexible
A building-block architecture should allow for additional plug-and-play components. The building blocks should be robust and extensible for today and for future demands, with a proven track record.
� Expandable
It must accommodate additional interaction. That is, success and productivity typically breed demand and more productivity. The design should provide for expansion, without throw-away components.
54 Enabling Smarter Government with Analytics to Streamline Social Services

In the following sections we provide an overview the SSIRS solution architecture and the products and components of which it is comprised. The architecture describes how SSIRS extracts the required data from numerous state and county data sources, analyzes and cleanses that data for normalization of identification data, and loads the cleansed data into the data repository, which in this case we have implemented as a data warehousing environment.
In this implementation, that data warehousing environment was composed of what is called an Operational Data Store (ODS) and a data mart. The SSIRS architecture specifies an expanded version of the ODS for use in data analysis and to support a reporting data mart that is part of the data warehouse environment. The data mart is the data foundation for the reporting server that enables the data analysis by the Alameda County Social Services Agency’s workers. The output from that analysis is input to web-based reports, which provide the information needed by the County workers to improve their effectiveness and productivity.
In addition, we cannot overstate the requirement for building a strong development team with the skills required, subject matter expert (SME) analysts, and an appropriate working team structure. We provide further details on the knowledge acquisition, training, and skills transfer that enhanced the development effort of the SSIRS project in 3.4, “The team players” on page 94.
Chapter 3. Developing the solution 55

Figure 3-19 is a depiction of the SSIRS architecture that shows the component products used and the conceptual data flow. These components are further described in the following section.
Figure 3-19 SSIRS architecture
3.3.1 Data sourcesIn this section we discuss the particular data requirements for SSIRS, which included a specific set of data sources.
The SSIRS team chose to include client information from the following sources into SSIRS for analysis and reporting:
� CIS is a copy of CalWIN, the 18-county TANF consortium system to determine eligibility and track the delivery of CalWORKs, Medi-Cal, CalFresh, General Assistance benefits, and other related programs.
� CWS/CMS is statewide system used by the Department of Social Services Division for Children and Families to track referrals, placement, and other child-protective services.
Social Services Integrated Reporting System (SSIRS)Conceptual Architecture
SQLITD
Oracle Server
(A)
Emai l
SQL AccessDB
EASS QLware
RPTStaging
-------- +-------- +-------- +-------- +
CRON
C-Shel lBourneKorn
Data Warehouse
DB2
EAS
COGNO S
versa_ods cmips_ods
smart_ods
Relational DB
F
DDD
D DStar
Schema
BI User
DWDash Board
CMIPS
Monthly CD
CalWINOracle
Dai ly FTPMonthly DVD
Fi les
CWSDB2 –Z/OS
DailyPartialFiles
Versaform
Access DBDailyDOS
Smart - ES
SQL Server
Name Std
Address Std
Entity Matching
Data Quali ty
Relationship Matching
LandingZoneFor
Extract files
CALWINDATA
CWS/CMSDATA
VersaformDATA
SmartDATA
CMIPSDATA
CMIPSDATA
DW_IDSYS_ID
CALWIN/CIS
DATA
DW_IDSYS_ID
CWS/CMSDATA
DW_IDSYS_ID
VersaformDATA
DW_IDSYS_ID
SmartDATA
DW_IDSYS_ID
ReportConsumers
Sc ripts:
Clean UpTransformPreparationReorganize
Bui ld Database.Bui ld
TableSpacesBui ld Tables
Bui ld IndexesBu ild Views
Build ObjectsLoad TablesMonitor the Database
Mail3 DVDs
Unzipped into 180 gbof monthly
data10 Reports
Power Users
Power ReportGenerators
WTW WPR (Exemplar)[CalWIN]
SSA SharedDrive
ssadw devadm
ETL Software: TALEND / IBM
IISETL Software: TALEND / IBM
IIS
EASdb
D at a Extract Phase:ETL #0
Data Cleansing
Source Syst em
FTP Daily Delta Log Files“LA Solution”
ssad wdevcog
ETL #1Talend
ETL #3
BI Metri c Studio
Report Studio
CognosCube
ssadwdevadmssadw devadm
ssadwd evad m
.
ssadwd evcog
CognosPackage
CognosDB
BI Transformer
Framework Manager
WTWCaseload[CalWIN]
WTWPerformance
[CalWIN]
GA Caseload[CalWIN]
GA/FSETManagement
[CalWIN]
SSA ClientJOverview
[All systems]
Balderas Eligibilit y[CalWIN]
IHSS ApplicantsSmaart
[CMIPS, Smart
Out of PlacementCalWIN P ayments
[CWS, CalWIN]
Probation acrossCWS/CIS
[CalWIN, CWS, Versaform]
Tra
nsfo
rm in
to L
MF
EA
S In
ges
t
Alamed a Cou nty
Social ServicesAgency
ETL #2 DB2 Load (large Tables)
Ta lend other tables
Non-PII Dat assadwdevadm
UNI_DW_ID
Append Originating
SystemID
And so on
DV D
DV D
Daily FTP to S SABC ORACLE S erverMonthly-Around the 1st 3 DVDs – 180gb refresh (14)Quarterly- FATP on to an ITD Server516 tables in Oracle (us ing 107 tables with 67 v iews)Key 541Tables1 Day Latency for Daily FTP
Load
cis_ods c ws _ods
K ey
ET
L#4
When, Where, Who prepares the data, who receives the data, how much data is there, format of the data, is the data kept, how long and by whom
Framework Manager
Framework Manager
Report
PII Data
56 Enabling Smarter Government with Analytics to Streamline Social Services

� SMART ES is a County SSA system containing Employment Services smaller programs, such as Cal-Learn, that cannot be entered into CalWIN.
� SMART AAA includes data for a number of smaller programs, including Adult Protective Services and Adoptions.
� CMIPS stands for the Case Management Information and Payroll System. It is a statewide system used to manage client/provider assignments and billing for the In-Home Supportive Services Program.
� Versaform contains juvenile placement tracking data details for the Department of Probation. This source also provides information about the parents and other guardians of the minor.
In 3.3.2, “Data transformation and loading” on page 64, we describe the processes that we developed to get data from the source systems into SSIRS (all are batch for these sources). Before the ETL development could begin, though, there were several other things to consider and tasks to complete. We needed to take the following actions:
� Negotiate agreements for access to data that was required from other organizations.
� Find out whether and to what extent we would be able to obtain technical support from the providers of outside source data if and when there were problems with extract files.
� Determine how to extract the data, if we were not already receiving source files on a regular basis.
� Decide how often we want to load data and then determine if that frequency is possible, considering our access to the source and how long the various steps of the ETL process takes.
� Analyze and discuss the source data to see whether we needed to load all of it or just a subset into SSIRS.
� Decide on the entity-related information that would go through entity resolution before being loaded into the SSIRS operational data store (ODS).
� Set up rules for how data should be formatted before it is brought into SSIRS, if it is not formatted consistently in source, and consider whether data that is known or suspected to be inaccurate should be loaded as is or treated another way.
We share our experiences with these tasks next, organizing the material by task rather than by source. Even though you might glean something helpful from specific details about how we accomplished this stage of the project, we are more concerned here with making you aware of things that you should consider and discuss before moving data into your warehouse.
Chapter 3. Developing the solution 57

Negotiating for access to data and supportWe were fortunate, as getting permission to access data for all but one source was a non-issue because the data from CIS (CalWIN), Children’s Welfare System/Case Management System (CWS/CMS), In-Home Support Services case and provider management (CMIPS) and SMART (various agency departmental data) is owned by our agency, Social Services. Probation data comes from another agency and required establishing an agreement with the originating agency, Probation. We worked with Probation and the court to leverage a template from Los Angeles for a Blanket Order, and were granted access to this data for the joint benefit of both agencies’ youth. The judge put the Blanket Order in place to use probation data as, in many cases, the children that Social Services and Probation serve are the same individuals.
For CWS/CMS, it is worth mentioning that another type of agreement was sought, but not secured. Before the SSIRS effort, we were already able to extract CWS/CMS data from a shadow copy of the source database via business object (BO) queries. Our original (and still active) ETL process for this data source involves extracting all the tables that we need via BO. There is no change data capture (CDC) done at extract time, so it is a lengthy process. Also, because the data that we query is a shadow copy and not production data, the BO query results are somewhat dated. We hoped to secure an agreement with the State such that they would provide us with a daily delta of the production data (not the shadow copy) to both reduce latency and shorten the extract time. A new system procurement process precluded this request, and we continue to do a complete extract of the tables that we move into SSIRS each time that we load. (We do this for other sources, too, but as they are smaller, so it is not as much of a consideration.)
Choosing how to extract dataFor some source data, we already received extract files on a regular basis. Other data needs to be extracted from the source production database (or a copy) and then written to a new file format before being landed on the Linux server to complete the journey to the operational data store (ODS). Here are notes on the tools we use to land each source's data on the Linux servers so that it can be loaded into DB2:
� CIS is an Oracle database. It is a copy of CalWIN, the Consortium system used to determine eligibility and track the delivery of CalWORKs, Medi-Cal, CalFresh, and General Assistance services. The CalWIN/CIS vendor (HP) sends us .dat files for both full monthly loads and daily delta updates. Our Oracle DBA lands these files on Linux servers in both our production and development environments. The rest of the CIS ETL begins with the reformatting and loading of the data in these .dat files into DB2 tables using Linux shell scripts and DB2 SQL.
58 Enabling Smarter Government with Analytics to Streamline Social Services

� For CMIPS, the IHSS department of Social Services gets monthly extracts in the form of .dbf files. They copy these files to a folder on an agency Windows server that we (the SSIRS team) can access. Next, a Visual Basic for Applications (VBA) module in an MS Access database that has links to the .dbf files is used to read the data, reformat it, and write it to .csv files. These files are then copied to the SSIRS Linux servers, where they are loaded into DB2 tables for further ETL processing.
� The two sets of SMART data, ES and AAA, reside in separate SQL Server databases that are owned by Social Services. The SMART tables that we bring into SSIRS are linked to an MS Access database with a VBA module that extracts and reformats the data, and writes the results to text files that are then copied to the SSIRS Linux servers and loaded into DB2.
� The CWS shadow database is queried using business objects. Reformatting is done as the query results are written to text files that are later copied to the SSIRS Linux servers.
� Probation data is sent to us by the Probation agency in the form of an MS Access database. The tables in this database are linked to an MS Access database with a VBA module that is used to reformat the data and write it to text files that are later copied to the SSIRS Linux servers.
These data sources, the platforms that they come to us from, and the tools used to extract the data are listed in Table 3-1.
Table 3-1 Data sources, platforms, and extract tools
Data source Platform Extracted using
CIS Oracle N/A. The CIS vendor provides .dat files.
CWS/CMS DB2 Business objects.
SMART ES SQL Server Visual Basic for Applications run from an MS Access database linked to the SQL Server SMART ES database.
SMART AAA SQL Server Visual Basic for Applications run from an MS Access database linked to the SQL Server SMART AAA database.
CMIPS .dbf files downloaded from the State
N/A. Visual Basic for Applications run from an MS Access database linked to the .dbf files is used to rewrite the .dbf files to .csv's.
Placement Tracking Data
MS Access Visual Basic for Applications runs from an MS Access database of probation data provided by the Probation agency.
Chapter 3. Developing the solution 59

Deciding how much data to load and how oftenWhile we worked on coming up with practical ways to extract and reformat data, we also considered the size of the source databases and whether it would be best to load the entire database into SSIRS or a subset of each data source. A decision was made to load only the tables from each source that hold the data needed for the initial report deliverables and a limited number of other tables commonly used for existing reports. Limiting the data brought into SSIRS shortens load times and also makes the ETL development process more manageable.
The frequency of data loads for each source was determined by looking at the size of the files being loaded and the resulting load times. We also had to consider, for sources such as CIS and CWS that are maintained outside of our agency, how often the data is made available. For example, for CIS we decided to do a full monthly load (using CDC for the Entity Analytics Solution (EAS) processing) and also load the daily deltas provided by the CIS vendor. For CWS, because of the length of time that it takes to run the BO queries used to extract the data, we decided to load the data weekly. Table 3-2 shows the data sources, their load frequencies, and why that frequency was chosen.
Table 3-2 Load frequencies
This data source….
is loaded… because…
CIS Monthly and daily
The CIS vendor provides .dat files monthly for a full load monthly and daily for the previous day's delta. The monthly load takes ~24 hours. The daily loads vary between 4 and 12 hours.
CWS/CMS Weekly The business objects queries used to extract the data take several hours to execute, and the EAS processing time for each load is up to 24 hours.
SMART ES Daily The data can be extracted in a manageable window the day before each load. The load itself then takes only 30 - 60 minutes.
SMART AAA Daily The same reasons as for SMART ES.
CMIPS Monthly The extract files are available monthly. The load time is very short, taking less than an hour and including the conversion of the .dbf tables to .csv's.
Placement Tracking Data
Weekly The data is sent to us weekly. The load time, including the VBA extract, is about 30 minutes.
60 Enabling Smarter Government with Analytics to Streamline Social Services

Identifying PII for EASAnother important initial task was deciding on the personal identification information (PII) to send to EAS (now IBM InfoSphere Identity Insight) for entity resolution.
For each source, we performed the following actions:
� Identified the tables for each source that held PII:
– Names– Addresses– Birth dates– SSNs– Phone numbers– Driver's license numbers– State ID numbers– Business license numbers– Business contact names– Relationships
In some sources, this information is stored in multiple related tables for each client.
� Analyzed the data in the identified PII fields to see wether it was consistently entered (or enough was entered) to be useful.
� Chose the source values to use as EAS data source accounts, unique identifiers that get sent with PII to identify the person who the PII belongs to. In some cases, there were no truly unique identifiers in the source and we had to concatenate various field values or add constants (such as ES or AAA for the SMART data) to be able to pass unique data source account values to EAS.
� Decided which source tables should get stamped with the client entity IDs generated by EAS during resolution. The EAS entity IDs are used to join tables across sources so, by default, client tables in the ODS are stamped with entity IDs. We were advised to stamp other tables also, to avoid unnecessary joins to the client tables just to get entity IDs, so we went through this step. However, in the end, we decided to only include entity IDs in the tables that hold PII. For example, for SMART, we included entity IDs in the ODS tables for Client, Client_Address, Person_Biographics, and Person_Demographics.
The information gathered in these steps was used to configure EAS and develop the EAS-related portions of the SSIRS ETL process for each source.
Chapter 3. Developing the solution 61

Analyzing data and setting up rulesBefore developing the ETL processes, we had to decide on data types for the fields in the DB2 tables used as the data flowed from source data to the SSIRS ODS and eventually the SSIRS data warehouse and data marts. This seems to be an easy task of looking at the source data and creating DB2 tables with the same or compatible field types. However, it turned out to be a surprisingly pesky task.
One example of this tedious work involves dates and timestamps. For a few sources, we spent countless hours changing date fields to timestamps and back again. We would decide on a format for the DB2 tables, try to load data, get rejects, revise the field type, get more rejects, and finally make a choice and revise the data formatting routine to make sure that the dates and times got formatted as desired before they were processed by the load SQL.
To avoid taking so much time for this activity, we could have spent more time analyzing the source data to try and determine, at least to a reasonable extent, the variations of data in some of the columns. After identifying variations, you then have to decide on rules for formatting or otherwise representing the data (for example, showing the literal password instead of real values for password fields).
Lessons learnedWe were inexperienced with data warehousing, so we had to rely on the IBM consultants to guide us and train us in every aspect of the data warehouse operations during the initial design and development phases. As we went through the learning process and gained experience, we could identify several things that we could have done differently during the design phase to save development and problem-solving time.
62 Enabling Smarter Government with Analytics to Streamline Social Services

Table 3-3 lists problems experienced during ETL development along with things that could have been done while in the design phase to avoid those troublesome areas.
Table 3-3 Problems and solutions
With this task….
We experienced these problems….
Which could have been avoided by…
Data formatting
Several iterations of table structure changes and data reformatting code revisions were needed.
More careful analysis of source data and better decisions about how to format data before attempting to load it into DB2.
EAS: Choosing data source accounts
Non-unique data source account values caused over-resolution of clients that could not be undone. We had to choose better data source account values for some data sources and reload EAS.
Analyzing the data source account values for each source more thoroughly to make sure that they are truly unique for each client.
SMART: Consolidated data sources
The SMART data from two separate SQL Server databases was loaded into one set of tables in the ODS because the source tables had the same structures. Also, the SMART loads were married unnecessarily in one ETL process. Because primary key values were duplicated across the two databases, using one set of ODS tables necessitated formulating artificial keys. These keys were not set up for optimal database performance.
Treating the two SMART data sources as just that: two separate sources. It would have been better to use two separate sets of tables in the SSIRS ODS for this data to avoid having to create artificial primary keys (PKs). It also would have been better to design separate ETL loads so that one source could be loaded without the other if need be.
Source table choices
Unnecessary tables were loaded. Analyzing the first phase report deliverables more carefully to determine which tables were needed instead of loading all those that might be needed in the future.
Overly ambitious number of sources
A faulty ETL process was designed and developed for the first phase.
Choosing a smaller number of sources for the first phase of the project.
Chapter 3. Developing the solution 63

In 3.3.2, “Data transformation and loading” on page 64, we outline the ETL processes that were developed to get data from the sources that we just described into EAS, the SSIRS ODS, and a data mart.
3.3.2 Data transformation and loadingIn this section, we describe how data travels from the various sources for SSIRS into the data warehouse and what happens along the way. This process is usually referred to as ETL or Extract, Transform, and Load:
� Extracting data is just that. It involves using queries or anther technique to gather selected data from a source system before it is transformed, if needed, and then loaded into the data warehouse.
� Transforming data involves many activities. After data is extracted it might need to be cleaned, validated, reformatted, translated, conformed, aggregated, disaggregated, merged, or otherwise revised before it is loaded into a data warehouse.
� Loading data is the process of getting the extracted and transformed data into the data warehouse.
Careful analysis and planning needs to be done to make sure that each part of the ETL process fits together and can be run in a manageable window that does not impact availability of data warehouse data for users. In this section we give an overview of the ETL process for SSIRS, describe the tools used and why they were chosen, and present obstacles encountered during development and how they were overcome. We also provide a sample wrapper script for the load of one source.
64 Enabling Smarter Government with Analytics to Streamline Social Services

Figure 3-20 illustrates the path that source data travels on its way from source to SSIRS.
Figure 3-20 Source data flow
Most source data is sent directly to the operational data store (ODS). Identifying details about the clients and providers from each data source goes through more complex processing to prepare them for ingestion by Entity Analytics Software, which is the tool that we use to identify clients across our various systems. This data is transformed into Universal Message Format (UMF), which is processed by EAS so that each client or provider can receive an entity ID. The client data is then loaded into the ODS along with the entity IDs assigned by EAS. After source data is landed in the ODS, some of it makes another hop into a data mart and is then used for Cognos reporting. Cognos reporting is discussed further in 3.3.5, “Visualization and reporting” on page 88.
1. Text files extracted from source
Data Mart – source data integrated into
one set of tables
ODSCIS_ODS
CWS_ODS
SMART_ODS
CMIPS_ODS
VERSA_ODS
Staging area 1
Staging area 2
EAS
EAS staging and post-staging tables
UMF written to separate server
10. Data loaded into data mart
2. Text files WinSCP’edto staging area 1
3. Staging area 1 data reformatted and written
to staging area 2
8. Non-client data loaded from text files in staging
area 2 into ODS
4. Client and provider data loaded into EAS
staging tables5. Talend job compares data in EAS staging and post-staging tables, and
generates UMF for new/changed data
6. EAS pipelines ingest UMF from step 5, and
assign entity IDs to clients and providers
7. Data loaded into EAS staging tables (intopost-staging tables for
next load’s comparison)
9. Client data including entity
IDs loaded from EAS into ODS
Chapter 3. Developing the solution 65

Extracting data for SSIRSIn 3.3.1, “Data sources” on page 56, there is information about the tools used to extract data from each of the sources that contribute to SSIRS. There are also details about how often data was extracted from each source and why. This is a summary of what is covered:
� CIS data is not extracted as part of the ETL process. We receive .dat files from the vendor for the monthly and daily loads.
� CWS/CMS data is extracted using business objects queries. Some reformatting and cleaning of data is performed with these queries.
� SMART (AAA and ES) is extracted from SQL Server using Visual Basic called from an MS Access database with links to the SQL Server tables. The data is reformatted during the extract process and written to text files.
� CMIPS data is sent to us as .dbf's. These files are linked to an MS Access database, reformatted, and written to text files with Visual Basic.
� Probation data is received as tables in an MS Access database. These tables are linked to another MS Access database that includes a Visual Basic routine used to reformat the data and write it to text files.
TransformationsThese are common data transformations:
� Reformatting� Translating and standardizing data� Aggregating and disaggregating information� Applying business rules� Generating surrogate keys� Joining or merging data� Creating new data files altogether
For SSIRS, a variety of data transformations were needed. Some were simple ones, such as reformatting dates as timestamps and vice versa. Others were more involved and required more effort, both for deciding on the nature of the transformation and developing any code or even new tables needed for the new data. These are examples of the transformations used for SSIRS:
� Unique keys are created for CMIPS data.
� Special characters are removed from CWS/CMS data.
� Passwords are set to null in SMART data.
� Inconsistently formatted date and timestamp values are standardized.
� New tables are loaded with mother, father, and other adult information for Probation data.
66 Enabling Smarter Government with Analytics to Streamline Social Services

� UMF is generated from client and provider data for EAS processing.
� Unique data source account values are generated when they are not available in the source (for example, for the Probation mothers, fathers, and other adults who are stored in the source as part of the child client records).
� Business rules are applied to data for an ES Summary report, allowing it to be presented in a prioritized fashion.
� Surrogate keys are generated for data mart tables.
� Data codes are translated and loaded as understandable text instead of integers in data mart tables.
How and where do these transformations happen? As mentioned in 3.3.1, “Data sources” on page 56, CWS/CMS data is formatted at extract time using business objects queries. SMART, CMIPS, and Probation data is formatted with Visual Basic. Additional formatting is done for some sources in the Linux shell scripts that are used to write text files to a secondary staging area before they are loaded into EAS (for client data) and the ODS (for non-client data). These reformatting tasks are relatively straightforward, whether they are accomplished using simple programming routines or SQL during data loads. We chose to use in-house developed tools instead of commercially available data cleansing tools in order to have more control over the code, which can make debugging and problem solving simpler.
Our most complex data transformations occur when Talend jobs are used to generate UMF from client and provider data for EAS processing. Talend was chosen because there is an open source version (making it perfect for our budget) that supports the complex conditional coding needed to generate UMF. The advantages of using Talend are that it supports creating reusable custom functions and it reads and writes several data formats. It also allows you to deploy jobs that can be called by a wrapper script, making it easier to automate the ETL jobs. However, there were some DB2 driver issues with the version that we had and complex generated code that was difficult to debug. We also had to deal with Java version issues, which caused problems with using other tools. For future UMF projects, we might consider using Perl and writing the code ourselves, but that decision is still under consideration.
For one project that required generating ad hoc UMF, Visual Basic was used from an MS Access database. A query was used to select the client data needed for UMF tags from SQL Server tables. A Visual Basic routine then wrote UMF from the query results. It was quick and easy, except that the UMF had to be manually landed on the Linux server for processing using WinSCP. For ad hoc projects, this was acceptable, but this would definitely not work for jobs that need to run from start to finish on the Linux servers.
Chapter 3. Developing the solution 67

Loading dataThere are several steps in the SSIRS ETL process that involve loading data from text into DB2 tables. The text data comes from either source data or from exported DB2 tables. The first phase of our data warehouse implementation did not budget for a high-powered ETL tool such as IBM InfoSphere DataStage® (DataStage), so we needed to use in-house developed tools or open source tools such as Talend. Although a choice was made to use Talend to generate UMF for EAS, we did not choose to use Talend for data loads. The biggest reason was the aforementioned problem with DB2 drivers. This turned out to be a blessing in disguise, as we found it quite straightforward to write DB2 LOAD commands and call them from Linux shell scripts. This combination of hand-written SQL and shell scripts also ended up being easy to debug, making it a good solution for us.
The following is an example of how we used LOAD along with other SQL to move data from the EASCEPDB database into the ODS for the Probation data:
1. LOAD the EAS tables for the child clients, mothers, fathers, and other adults from the client text file extracted from source.
2. Run the Talend job that generates UMF for any new and changed child and adult clients. Then run the job that uses EAS pipelines to assign entity IDs to the client data passed into EAS as UMF.
3. In the EAS database, LOAD the EAS post-staging tables for the child clients, mothers, fathers, and other adults from the client text file extracted from the source. (These post-staging tables will be compared to the next set of data loaded into the EAS staging tables so that Talend knows for which new and changed records which it needs to generate UMF.)
4. An update query is used to write entity IDs to the EAS staging tables from the EAS core tables. (Entity IDs are assigned to clients and written to the core tables in the EAS database during EAS pipeline processing.)
5. The data from the staging tables that now includes entity IDs is EXPORTed to text files.
6. These text files are imported (LOADed) into the ODS tables for Probation child clients, mothers, fathers, and other adults.
68 Enabling Smarter Government with Analytics to Streamline Social Services

ETL and pipeline processing for IRADetails such as name, address, DOB, SSN, and phone number for each source's clients and service providers are sent as UMF to IRA via pipeline processing. During pipeline processing, IRA looks at the details for each person (entity) across systems and, using a set of user-defined rules, decides whether each client or provider represents a truly new person or whether they are the same client or provider in the same or another source system. When IRA determines that the record for a client or provider represents the person described in another record (or records), it resolves them into one person and assigns that person a unique entity ID that persists across source system boundaries.
For example, a client could have a CalWIN client identifier of 123456 and a SMART ES identifier of 98765. If Identity Insight determines, using its matching rules, that the client records in these two systems represent the same person, a unique entity ID (for example, 55667) is assigned to the person. The ODS client records for this person in all sources are then stamped with this value, 55667, in a column called Entity ID.
The resulting entity ID that is assigned to each client can be used to join client data across systems, solving to a significant degree the problems experienced trying to analyze data across programs and the separate systems used to track them. The entity ID also facilitates joins within a source, allowing us to identify when a person has more than one client record in the same system. Eventually, additional source data, not just client and provider identifying details, will be sent to Identity Insight for event and alert processing. This allows us to use the data warehouse not just for historical data analysis, but also to be aware of various events and their relationships as they are occurring so that we can alter our business processes as needed for good outcomes.
ETL scripts: The developer who wrote the first round of our ETL scripts chose to use EXPORT and LOAD to load data from the EAS database, EASCEPDB, into the ODS database, BCUDB. Instead of the two-step EXPORT and then LOAD for each table, we could have used a federated LOAD FROM ... OF CURSOR. We did choose to use a federated LOAD FROM ... OF CURSOR when developing the ETL scripts that loaded some the data mart tables with ODS data that resided in a separate database. For more information about an example of a federated load, go to the following URL:
http://publib.boulder.ibm.com/infocenter/db2luw/v9r7/index.jsp?topic=%2Fcom.ibm.db2.luw.admin.cmd.doc%2Fdoc%2Fr0008305.html .
Chapter 3. Developing the solution 69

Guidance (lessons learned)We encountered several frustrating stumbling blocks while developing ETL procedures for SSIRS:
� The Talend DB2 driver problem. It turned out that every time that Talend was loaded, it overwrote the desired DB2 driver. We had to load Talend, re-copy the correct DB2 driver to the necessary folder, and then run or deploy the jobs.
� Data from the two SMART databases should have been treated as two separate sources, but they were combined as one source. Because of this, the data for these sources always has to be loaded together. Another disadvantage is that the loads cannot use REPLACE. They have to use INSERTS to avoid overwriting the first set of data loaded in a step.
� Some EAS data source account values were chosen incorrectly and were based on non-unique values. We had to reinitialize EAS and reload all the client and provider data.
� We experienced times when EAS hung due to overwhelming processing needs. It turns out that our system had developed “furballs” (overly large entities with lots of generic data) that kept collecting more and more data that was impossible to resolve.
� In our one source, CIS, where daily deltas are processed, some records were not being updated due to missing primary keys.
Table 3-4 lists some of these problems and solutions. Also on the positive side, we were able to automate the ETL jobs for several of our sources using wrapper scripts with ssh commands.
Table 3-4 Problems and solutions
With this part of SSIRS….
We experienced these problems….
Which could have avoided by…
Data loading Several iterations of table structure changes and data reformatting code revisions were needed during development.
More careful analysis of source data and better decisions about how to format data before attempting to load it into DB2.
Data validation Not getting updates for some records in the ODS due to missing primary keys.
Checking for updates instead of just comparing row counts to see whether data made it through all the ETL hops successfully.
MQTs for reports Lengthy creation times and cannot be indexed.
Loading real tables with MQT data or using the data mart, after it was available.
70 Enabling Smarter Government with Analytics to Streamline Social Services

Sample load scriptExample 3-1 provides the wrapper script used for loading the Probation data (formerly referred to as Versaform data) into SSIRS. The wrapper script does not include any SQL. It calls other shell scripts that execute the SQL used to load and update tables. The ETL process for the Probation data varies from the load process for the other sources in the following ways:
� The Probation source data files created by the Visual Basic MS Access routine are already formatted with pipes (|). Because of this, they are efficiently loaded from staging area 1 directly into the EAS staging area, whereas with the other sources we need to use a Linux shell script to reformat, add pipes, and land the data in staging area 2 prior to being able to load it into the EAS staging area.
� The mother, father, and other adult information from the Probation client table is loaded into separate tables in the EAS staging tables instead of into one client table. These tables do not exist in the source data.
� The mother, father, and other adult data is also loaded into separate tables in the ODS. As with the tables created in EAS, these tables do not exist in the source data.
Example 3-1 Probation load
#!/bin/sh#### Description: This script has been created to run the versa scripts in## an automated fashion.##
parseDate () {
year="${1:5:2}/${1:8:2}/${1:0:4}"}
startTime=`date`
exeDate=`date +%m%d%y`
SMART extracts Failed loads due to timeouts. Extracting data at a time when it would not overlap with backups (which caused excessive network delays).
Truncating tables Lengthy logging. Using ALTER TABLE… to truncate data.
With this part of SSIRS….
We experienced these problems….
Which could have avoided by…
Chapter 3. Developing the solution 71

scriptDir=/opt/tos/scriptslogDir=/stage/logs/versastgDir = /stage/versaformdb2LoadDir=/stage/db2load/versalog=/opt/tos/scripts/versa_etl/logs/versa_wrapper_prod_${exeDate}.log
userEasAdm=eascepdb@ssadwadmuserEasCog=eascepdb@ssadwcog
echo " " | tee -a $logecho "Starting versa_wrapper_prod.sh on $startTime" | tee -a $logecho " " | tee -a $log
echo "1.) Starting versa_eas_stage_load.sh @ `date '+%Y/%m/%d %r'`" | tee -a $logssh $userEasAdm "cd /opt/tos/scripts; /opt/tos/scripts/versa_eas_stage_load.sh /stage/versaform /stage/logs/versa /opt/tos/scripts"echo "Finished versa_eas_stage_load.sh @ `date '+%Y/%m/%d %r'`" | tee -a $log;./time.sh 10
echo "2.) Starting versa_run_umf_jobs.sh @ `date '+%Y/%m/%d %r'`" | tee -a $logssh $userEasCog "cd /opt/tos/scripts; /opt/tos/scripts/versa_run_umf_jobs.sh /opt/IBM/dwe/appserver_001/easdata/umf/versaform /opt/IBM/dwe/appserver_001/runlog/versa"echo "Disconnected from ssadwcog and finished versa_run_umf_jobs.sh @ `date '+%Y/%m/%d %r'`" | tee -a $log;./time.sh 10
echo "3.) Connecting to ssadwcog and starting run_pipelines.sh @ `date '+%Y/%m/%d %r'`" | tee -a $logssh $userEasCog "cd /opt/IBM/dwe/appserver_001/runlog/versa; ../run_pipelines.sh /opt/IBM/dwe/appserver_001/easdata/umf/versaform 8"echo "Disconnected from ssadwcog and finished run_pipelines.sh @ `date '+%Y/%m/%d %r'`" | tee -a $log;./time.sh 10
echo "4.) Starting versa_eas_load.sh @ `date '+%Y/%m/%d %r'`" | tee -a $logssh $userEasAdm "cd /opt/tos/scripts; /opt/tos/scripts/versa_eas_load.sh /stage/versaform /stage/logs/versa /opt/tos/scripts"echo "Finished versa_eas_load.sh @ `date '+%Y/%m/%d %r'`" | tee -a $log;./time.sh 10
echo "5.) Starting versa_dw_load.sh @ `date '+%Y/%m/%d %r'`" | tee -a $logssh $userEasAdm "cd /opt/tos/scripts; /opt/tos/scripts/versa_dw_load.sh /stage/versaform /stage/logs/versa /opt/tos/scripts"
72 Enabling Smarter Government with Analytics to Streamline Social Services

echo "Finished versa_dw_load.sh @ `date '+%Y/%m/%d %r'`" | tee -a $log; ./time.sh 10
echo "6.) Starting versa_eas_to_dw_load.sh @ `date '+%Y/%m/%d %r'`" | tee -a $logssh $userEasAdm "cd /opt/tos/scripts; /opt/tos/scripts/versa_eas_to_dw_load.sh ${db2LoadDir} ${logDir} ${scriptDir}"echo "Finished versa_eas_to_dw_load.sh @ `date '+%Y/%m/%d %r'`" | tee -a $log; ./time.sh 10
echo " " | tee -a $logecho " Started running script on $startTime" | tee -a $logendTime=`date`echo "Finished running script on $endTime" | tee -a $logecho "Exiting versa_wrapper_prod.sh" | tee -a $log
exit 0
Like the CIS and SMART loads, the Probation data load script runs from the admin server (ssadwadm). The CMIPS and CWS loads are currently done manually.
As you can see from the script in Example 3-1 on page 71, all jobs run on the ssadwadm server, except for the jobs that generate UMF and run EAS pipelines. The latter jobs run on the ssadwcog server. (Note that the EASCEPDB database that is used to generate UMF and is loaded using the pipelines resides on ssadwadm.)
3.3.3 Preparing the dataIn this section we discuss and describe the products and processes used in preparing the source data to be used for analytics and report creation.
What is Identity InsightIdentity Insight is not a data warehouse. Rather, it operates more like an Online Transaction Processing (OLTP) system, matching records as they arrive and generating a message if something is important to know.
Chapter 3. Developing the solution 73

Identity repository and GUIThe Identity Insight repository can then be used at any time to look someone up and explore all of the ways that you know them, in addition to their relationships to others. There is even a Visualizer application that can be used to do just that. Figure 3-21 shows an example of the Visualizer. While it is sometimes used by fraud departments as a rudimentary case management system, it is really just a demo system developed to show how data in Identity Insight is organized. Consider it a model for creating a more focused GUI, say for case workers to look up a particular individual.
Figure 3-21 Identity Insight Visualizer
2 21 Grant St An ytow n, CA 95101
USA
456 F ront St Anytow n, C A 95101
USA
2009-09-22 Childcare Assistance623001-3
Angela Garcia1
Frank Garcia3
Angel Garcia7
Maria Garcia2
700 01
74 Enabling Smarter Government with Analytics to Streamline Social Services

The Identity Insight repository can also be incorporated into a data warehouse environment as the component that performs matching of persons and organizations. It sits alongside the Operational Data Store (ODS). Figure 3-22 shows the component. Data marts are created by extracting data from both the ODS and the Identity Insight repositories.
Figure 3-22 Identity Insight within a data warehouse
Reporting Tools
Standard and AdHoc Reporting
Extracts or real time feeds
Identity Insight in a Data Warehouse Environment
Identity Insight
Repository
Operational Data Store
Data Mart(s)
Tools and Databases
Data Sources Balanced Data Warehouse Analysis
ET
L T
ools
CALWIN
CWS/CMS
Probation
CMIPS
Smart E.S. & Adoptions
Chapter 3. Developing the solution 75

Real-time alerting engineIdentity Insight includes a Complex Event Processor (CEP) engine that allows situations to be detected that can then be used to notify a case worker of actions to be taken. Figure 3-23 shows the Complex Event Processor.
Figure 3-23 Identity Insight - Complex Event Processor
What does Identity Insight need from Social ServicesIdentity Insight needs to know who the people and organizations are and what they are doing. A person or organization is called an ENTITY, and a record of what they are doing is called an EVENT.
As Identity Insight is not a data warehouse. It is not looking for every transaction performed by an ENTITY. But when a transaction helps determine whether the entity is involved in some activity that helps to determine whether they are doing something interesting, it should also be mapped to an EVENT.
76 Enabling Smarter Government with Analytics to Streamline Social Services

Consider the target reporting model (Figure 3-24).
Figure 3-24 Target reporting model
These are brief descriptions of the elements depicted in Figure 3-24:
� ENTITIES
– Clients are people who apply for or are receiving social service benefits. Their family members are children, spouses, and so on.
– Providers are organizations or individuals who provide services to clients.
– Case workers are social service employees who direct what services are provided to what clients.
– Other entities from external sources might include the following:
• New hires from the national new hire registry• Students from school systems• Arrested persons from corrections departments• Juveniles from juvenile detention centers
� EVENTS
– Application received– Benefits approved– Child placed– Investigation result
Clients Programs
Enrollments
Activities
Stages / Statuses
Providers
Case Workers
Training, Search, Interview
Anonymous Tip, Home Visit
Medical Checkup, In-home Svcs
Employment Child Welfare Elder Care
Request Investigation Placement
Trainers, Employers Foster Parents Medical Providers
Social Services – Target Reporting Model
Chapter 3. Developing the solution 77

– Newly employed– Missed class, session, and so forth
� TYPES OF NOTIFICATIONS
– Eligibility• Client was hired• Client is incarcerated• Client missed classes, appointments• Client eligible for SSI
– Warnings• Child in dangerous household
– Fraud• Aid threshold exceeded• Relationship to past fraud client
While it is easy to determine what an entity is in a source system, be careful what you create as events.
3.3.4 Data warehouse environmentAlameda SSA initially developed SSIRS, as its name indicates, as an Integrated Reporting System for Social Services. The intention of this first project was to allow SSIRS to replace an out-of-the-box (OOTB) reporting system for determining the status of Welfare-to-Work clients in the Employment Services Department. This system only provided data once a month, had a difficult-to-navigate interface and did not provide the level of detail needed for each client. The output that replaced the OOTB reporting system resulted in the creation of an operational data store (ODS).
After we replaced the OOTB reporting system for the Employment Services Department we turned our attention toward developing an enterprise data warehouse environment based on the model of client service delivery.
Many have their own interpretations of the term data warehouse. Many call an operational data store (ODS) model a data warehouse. Others say it calls for the creation of an enterprise model that represents all aspects of your business processes. For Social Services it means the delivery of client services. Our clients often come into the system via a Child Protective Services referral or allegation of abuse, and can be in foster care, emancipate into traditional welfare (CalWORKs), and finally enter our In-Home-Supportive-Services program as a senior. SSA needed a data warehouse model that can capture that entire life cycle and all of the associated programs, statuses, and stages involved.
78 Enabling Smarter Government with Analytics to Streamline Social Services
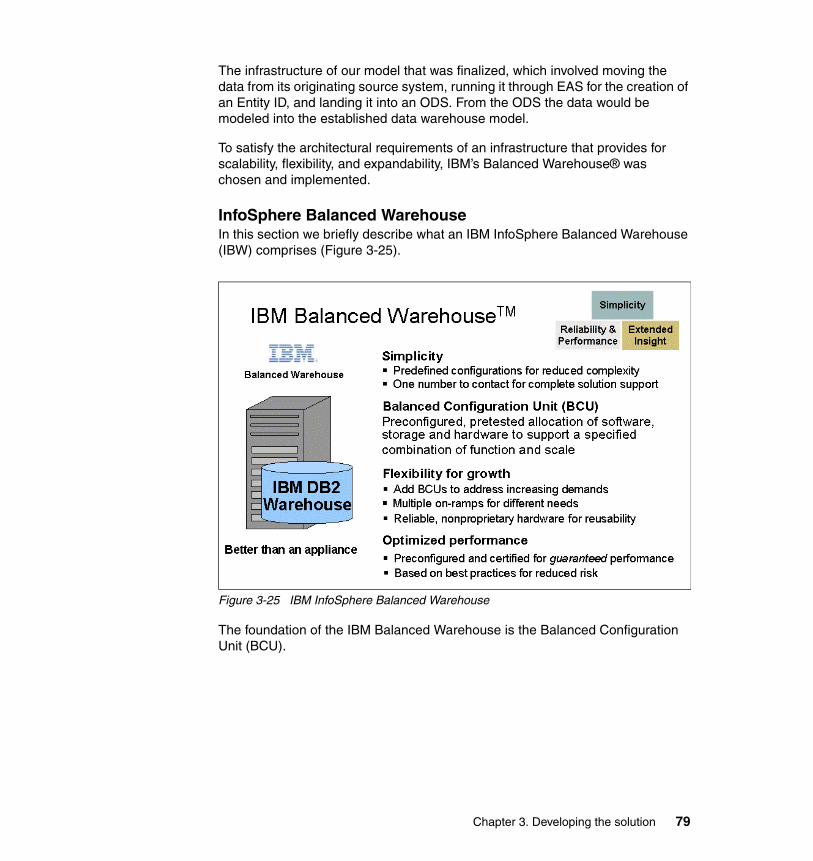
The infrastructure of our model that was finalized, which involved moving the data from its originating source system, running it through EAS for the creation of an Entity ID, and landing it into an ODS. From the ODS the data would be modeled into the established data warehouse model.
To satisfy the architectural requirements of an infrastructure that provides for scalability, flexibility, and expandability, IBM’s Balanced Warehouse® was chosen and implemented.
InfoSphere Balanced WarehouseIn this section we briefly describe what an IBM InfoSphere Balanced Warehouse (IBW) comprises (Figure 3-25).
Figure 3-25 IBM InfoSphere Balanced Warehouse
The foundation of the IBM Balanced Warehouse is the Balanced Configuration Unit (BCU).
Chapter 3. Developing the solution 79

The Balanced Configuration UnitThe Balanced Configuration Unit (BCU) simplifies the deployment of data warehouses by establishing a validated, building-block methodology for constructing data warehouses using open, general-purpose components. Figure 3-26 illustrates the data warehouse spread across multiple BCUs.
Figure 3-26 Data Warehouse Balanced Configuration Units
One of the key driving design points of the BCU is the concept of balance in the performance characteristics of the warehouse's constituent components. The term balance indicates that the components are known to function well together without significant CPU, I/O, or network bottlenecks. System designers and architects often face a substantial challenge when attempting to balance the components in a data warehouse solution. If the proper balance is not maintained, however, the data warehouse might not fully realize the benefits of the massively parallel functionality of DB2.
80 Enabling Smarter Government with Analytics to Streamline Social Services

Another key design point is the use of a single, scalable building block. The name given to this basic building block is the BCU. Systems are configured by linking BCUs together to host a BI system and its data. Because the operation of the individual components is well understood and has been verified by rigorous system and performance testing, it is possible to make recommendations regarding the number of building blocks required to build a data warehouse based on the projected volume of data and workload that the data warehouse is expected to hold. Knowing the capacity of each building block in advance allows business intelligence (BI) architects to reverse engineer the expected requirements of a data warehouse into the BCU building-block model. This improved ability to plan greatly reduces the tendency to overestimate the resources required to implement the data warehouse, which should therefore reduce the total cost of the warehouse.
A third design point of the BCU is certification. Each BCU configuration is evaluated using a BI-focused testing plan that includes three stages:
� Quality� Performance� BI solution testing
A certified BCU solution must comply exactly with a prescribed IBM design. To meet the needs of customers, IBM offers several certified BCU configurations on each of these platforms:
� IBM AIX® � Linux
InfoSphere Balanced Warehouse Linux D5000 SolutionFigure 3-27 shows the IBW D5000 solution that we had employed.
Figure 3-27 Balanced Warehouse Linux D5000
Chapter 3. Developing the solution 81
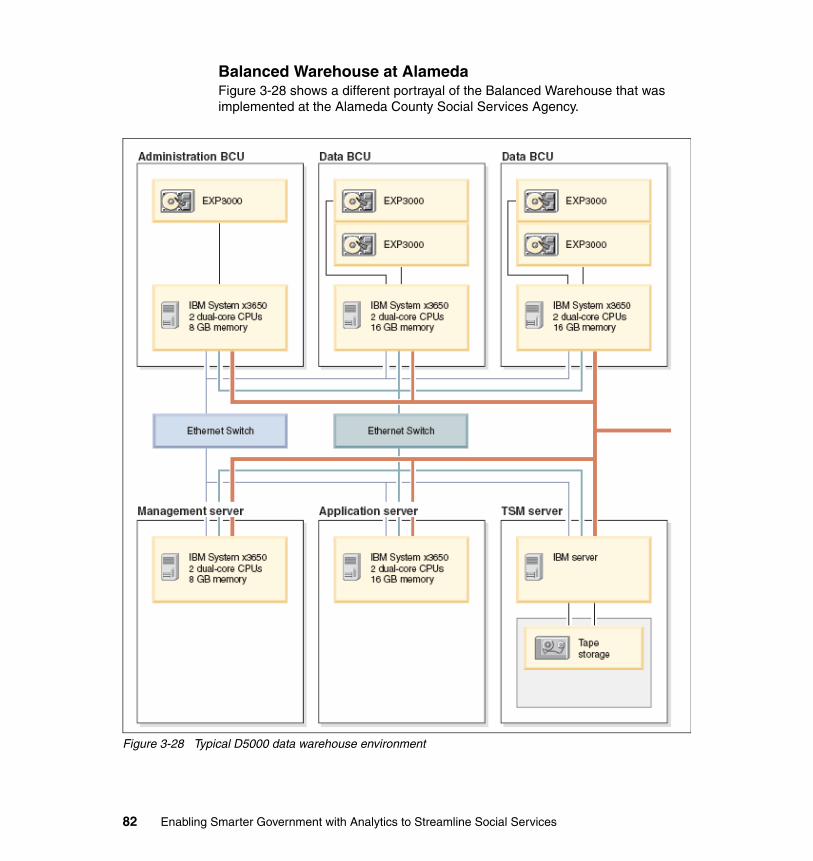
Balanced Warehouse at AlamedaFigure 3-28 shows a different portrayal of the Balanced Warehouse that was implemented at the Alameda County Social Services Agency.
Figure 3-28 Typical D5000 data warehouse environment
82 Enabling Smarter Government with Analytics to Streamline Social Services

To capture or not to capture most dataThe dilemma that the Alameda County had to address was driven by the fact that the source data ownership was outside of their purview. In such cases, the wise decision was to land as much data as required into an Operational Data Store (ODS). Most of the source data models were defined in SSIRS. After the cleansed data was consumed into the ODS, which is the main part of the Data Warehouse, another phase was embarked. This phase’s purpose was to create data marts as needed by the SSA’s agents. The design of a data mart stems from an analysis of user needs from the ODS and is usually a focused derivative of the ODS. The data mart emphasizes and affords ease of use and usability for reporting purposes (Figure 3-29).
Figure 3-29 Operational Data Store and data mart
How to speed up report generationA data mart’s model invariably takes on the form of a star schema. A star schema consists of one or more fact tables, which in the figure is the central table in the data mart, and it is figuratively surrounded by dimension tables. A fact table’s rows contain an instantiation of a detailed fact with measures, and there are links or pointers to related attributes contained in the dimension tables.
Social Services Integrated Reporting SystemDB2 Data Warehouse and Data Marts
Alam eda C ounty
Social ServicesAgency
OperationalData Store
Data Marts(Star Schema)
Staging
-------- +-------- +-------- +-------- +
CRO N
Data WarehouseDB 2
EAS
Relationa l DB
F
DD
D
D DStar Sc hema
CMIPSDATA
__
ssadwdevadm
ssadwdevadm
EASdb
Versaform Data
DW_ID SY S_ID
DW_ID SY S_ID
Smart
DATA
DW_ID SY S_ID
CALWINCIS DATA
DW_ID S YS_ID
CWS/CM SDATA
DW_ID SY S_ID
C-She ll Bourne K orn
Scrip ts CleanUp
Transform Pr epara tion Reorganiz e
Bu ild Database Bui ld
T ables paces Build Tables
B ui ld Indexes Build Views
Bui ld Objec ts Load Tables Mon ito r the
Database, and so on.
Load
sm ar t ODS
versa ODS cm ips ODS
K EYc is_ods cws_ods
ET
L #
4
Chapter 3. Developing the solution 83

Often, due to the size and row counts of a fact table, and the SQL statement complexity in a star schema that a report server can generate, the best solution for report generation execution is to perform in a Balanced Warehouse infrastructure. By using a “divide-and-conquer” approach in such an environment, where each data partition works on just a portion of the immense data, reports can be generated much quicker. This then lets a user review and analyze results in a more expedient manner.
SSIRS data mart examplesThe purpose for creating this data mart is to know which families/parents/relatives of children in Child Welfare Services receive other SSA services, as well as to analyze the cost of Out of Home Placements. It requires working with data from multiple sources:
� CWS� CIS� Probation
The data to build the necessary reports is currently available in the ODS. However, we found that building BI reports from this large number of tables, with millions of records, is cumbersome, and the reports were slower. So, we designed data marts to allow us to now produce integrated high performance reports with intuitive analytical slicing and dicing capabilities and much faster retrieval of data. However, despite the following entity-relationship (ER) diagrams for the data marts, Referential Integrity (RI) definitions are purely informational and RI is not enforced. The reason for informational RI only is that we ensured the integrity of the data by the correct order of tables being populated. Therefore, there was no need to incur the RI checking overhead.
84 Enabling Smarter Government with Analytics to Streamline Social Services

Figure 3-30 illustrates one of the data mart models created within SSIRS. It enables reports that show Families of Child and Family Services' Youth receiving other services.
Figure 3-30 Families receiving other services
Chapter 3. Developing the solution 85

Here the client is a child from the data source CWS. The child could have multiple referrals and multiple placements within a time frame. This child client might have multiple relatives who might or might not be receiving benefits from CIS in different programs based on meeting the eligibility requirements and participation in the various programs. How many payments were made and when are also to be determined by accessing data from a different data source (CIS). Building reports that show client referrals, episode placements, cases, and benefits issuance would involve complex joins of multiple tables from different data sources. This is inefficient and affects the performance of the reports. By using de-normalized data marts that hold only the data that is used for reporting purposes, the performance of the reports was vastly improved. The data in the data marts is already joined and then made available for report building. The transactional data resides with the data facts and the descriptive data associated with those facts resides with the dimensions. The facts and dimensions are connected by the key.
Figure 3-31 on page 87 illustrates another of the data mart models created within SSIRS. It enables reports that show the cost of out-of-home placements for Child and Family Services.
86 Enabling Smarter Government with Analytics to Streamline Social Services

Figure 3-31 Cost of out-of-home placement for Child and Family Services
Chapter 3. Developing the solution 87

3.3.5 Visualization and reporting Alameda County Social Services selected IBM Cognos as the business intelligence reporting tool to ensure seamless integration with the other IBM components of SSIRS. Cognos is accessed through the web and utilizes an active directory for user authentication. Utilization of an active directory reduces password fatigue from having to use a different user name and password combination. It is possible to configure Cognos to have a custom login page to mimic single sign-on to automatically sign the user into Cognos whenever the user signs into her computer station. The Cognos administrative portal allows configuration to assign roles and grant permissions to specific reports to groups and users. Cognos administrators of Alameda County further configured their instance of Cognos so that when a user logs into the system, he is directed to the appropriate landing page based off of user login, department, and staff level.
88 Enabling Smarter Government with Analytics to Streamline Social Services

Accessing CognosFigure 3-32 shows the Cognos Login Screen. The login information portion of the screen has been expanded for readability.
Figure 3-32 Cognos Login Screen
The URL for the Cognos login page is provided on the Alameda County staff webpage.
Chapter 3. Developing the solution 89

Sample reportsIn this section we present a few sample reports that are used to help familiarize you with the types of information being analyzed:
� Engagement Summary
The Employment Services (ES) Engagement Summary Dashboard (Figure 3-33) presents the user with a concise, visual picture of the client base. In the words of the project sponsor, the dashboard answers the question “How am I doing?” A lot of data is needed to make such a high-level assessment, and the intent is to provide it to the user in a presentation that is both complete and appealing. Visually, the intent is to “tone down” the dashboard, so the user would not be overwhelmed by the content. Colors are softer, chosen to complement the SSA logo so that the user can explore the data without the glare of strong color in the background.
Figure 3-33 Engagement Summary dashboard
90 Enabling Smarter Government with Analytics to Streamline Social Services

The summary list in the top left of the dashboard contains a complete breakout of the welfare to work (WTW) status of the case load being reviewed. Filters allow the user to change the selection of which case load is being reviewed. The WTW status for a given client is calculated by a DB2 script, which applies ES business rules to the various activities and dates of those activities in which the client participated. The WTW status is determined daily. The dashboard runs by default for the current date, but the user can change the default via a date filter to review prior dates. The list shows the number of clients and the percentage of the total for each level of aggregation.
A social worker reviewing this list can quickly scrutinize the categories of WTW status in his case load and take further action to know exactly which clients are in a given status. This scrutiny is enabled with the Cognos drill-through functionality on the hyperlinked Engagement Status label (such as Deferred/Good Cause). When the user clicks this engagement status, the Client List report runs with the filters from the dashboard.
The primary key performance indicator (KPI), engagement rate, is a federal requirement for CalWORKs (TANF) program funding. Noncompliance can result in sanctions to the state, and was a primary concern of the management in Employment Services. Alameda County wanted this KPI to be a focus point for its social workers also. Social workers now have quick access to the same metrics that their managers use within 48 hours. The accurate, current reports allow case workers to align their goals to agency goals, and prioritize tasks within their own case load accordingly. The Engagement Rate KPI is the simple, stand-alone formula shown at the top right corner of the dashboard and shaded in green. If the CalWORKs user could look at only one number on the dashboard, it should be the engagement rate.
The dashboard has only one chart so as not to be too busy, but this chart presents a lot of data. The Office Comparison - Engagement Category Percentage presents county-wide data rolled up by location and drills down to the client's engagement activity transactions. Again, colors are toned down.
The width of the bars corresponds to the number of clients in each office (that is, the size of the case load).
The color slices of the bars are ordered bottom to top, from most desirable (qualified activities) to least desirable (unengaged).
The CalWIN Update Aging crosstab was a late addition to the dashboard as we got deeper into the data analysis and determined that one of the problems with the legacy system is that workers did not receive this information in the previous system. Clients that were enrolled in a WTW activity but who had dropped out of the activity and not contacted with their social worker for 30 to 60 days or more (up to more than a two years in some cases) could not be identified as non-compliant.
Chapter 3. Developing the solution 91

This list is very simple and yet very important. It shows how recently SSA has been in touch with the client about their WTW activity. It shows the number of clients by the number of months since their last update in CalWIN, the system of record. As examples, the 0 column shows clients within the last month (0 - 30 days), the 1 column shows the clients in the previous month (31 - 60 days), and so forth, and the 99 column shows clients who have not had contact in over 360 days. The list is drillable.
� Caseload
The purpose of the Caseload report is to allow case workers to view all clients that they are currently responsible for in a searchable and sortable list. The report provides a summarization where the worker can easily view the total number of cases and the number of cases per program status. It also provides client contact information and the latest activity status. Managers can access the same report and have the option to group by office or unit, or to select a particular worker. The report is archived so that a user can select a date and view the report from a specified point in time, as well as to produce trends to track and analyze data over time.
How the report is accessed: After the user logs into Cognos, the Caseload report is accessed from the drill-though of the ES Engagement dashboard.
92 Enabling Smarter Government with Analytics to Streamline Social Services

Figure 3-34 shows an example Caseload report that provides each case worker with a single list of essential information about all of their cases. The Cognos report allows case workers to quickly search for a particular case and obtain information from a single source, instead of requiring opening multiple window sessions to view the same information in the source systems.
Figure 3-34 Example Caseload report
� Action Required
The purpose of the Action Required report is to provide a list of time-sensitive actions that are needed to ensure that clients are participating in qualified activities to remain eligible for benefits.
After the user logs into Cognos, they access the Action Required report from the drill-though of the ES Engagement dashboard.
Chapter 3. Developing the solution 93

The sample Action Required report (Figure 3-35) proactively provides a list of cases that require immediate attention from the case worker. The worker is then able to efficiently work pertinent cases, as opposed to manually reviewing each case on their case load to verify whether any action is required.
Figure 3-35 Action Required report
3.4 The team playersIn this section we discuss the thoughts and considerations used in the selection of the SSIRS team. Having a team with the correct mix of knowledge, skills, and experience is essential on such an application development project. Equally so is the leadership provided by the project manager. The operative word here is team. Even with great skills and experience, if the project members do not act, interrelate, and cooperate as a team the chance of a successful implementation is significantly decreased.
Developing proper teaming and gaining the respect of the project team are of utmost importance on the list of project success criteria. As expected, that task falls upon the project manager. Also as important, it must continue during the ongoing maintenance and operations of the system.
94 Enabling Smarter Government with Analytics to Streamline Social Services

As with most projects, we had multiple staff members holding multiple roles on the team. The team members on our project were chosen for criteria such as these:
� Their background in the source case management systems that we report on� Experience providing reports for the agency in the past� Experience working with databases and database-driven reporting� Hardware and network experience� Most importantly, their out-of-the-box thinking
We knew that we would have to bring people on board who could easily scale their experiences with the end goal of tailoring them to the needs of the project. When deciding on who was appropriate to assign to this effort we had the options of hiring staff who were experienced in Data Warehousing but no experience in Human Service Delivery (HSD) (and the case management systems inherent therein) or staff who had minimal data warehousing experience but were well versed in HSD.
We decided to go with staff who were well versed in the HSD process, as we concluded that it would be extremely difficult for staff to be able to make sense out of a crash course in HSD. Since this effort began we have hosted many an IBM contractor who was very knowledgeable regarding Data Warehouse implementations, but experienced difficulty with the concepts around our Human Service clients, their workers, and the various programs and associated status.
SSIRS teamingCurrently, the SSIRS team consists of 14 individuals with varied backgrounds, and are structured in the following manner:
� Hardware/network: Three Technical Support Analysts (TSA)
� Database administration: One Information Systems Analyst (ISA)
� ETL team: Four ISAs
� Data modeling team: Three TSAs and one ISA
� Identity Insight team: One TSAs and one ISA
� Cognos reporting team:
– Cognos Administration: One TSA
– Cognos Framework Manager Administrator: One ISA
– Cognos Report Writers: One TSA, two ISAs, one Information Systems Coordinator (ISC), one Management Analyst (MA), and an Administrative Specialist.
Chapter 3. Developing the solution 95

Skill setsThe particular skill sets represented by the team are briefly described here:
� TSA specializing in LAN and WAN technology and hardware
� TSA strong in network and hardware, with a good deal of experience in application development
� TSA strong in network (particularly Active Directory) and hardware (particularly OSs)
� ISA strong in MS SQL and an expert in Access DB/application development, and strong in the source case management system for welfare service delivery (CalWIN)
� ISA with a well-rounded background in databases, and strong in source case management system for child welfare (CWS/CMS)
� TSA strong in web application development, with MS SQL Server knowledge
� TSA with a background in web application development and MS SQL Server
� ISA with a well-rounded background in freehand SQL queries, and an expert in CalWIN
� TSA with a background in hardware, network, and web application development, and strong in MS Access application development
� TSA with a well-rounded background in web application development, freehand SQL, and project management
� ISC with a strong background in report writing (MS Access, SPSS), and strong in two source case management systems for welfare service delivery (CalWIN and SMART)
� MA with a strong background in report writing, and a team lead in Office of Data Management, which handled all agency report requests (Pre-SSIRS)
� Administrative specialist with a strong background in report writing, and who handles all state reports that come out of CalWIN
TrainingAlthough we chose individuals with strong IT backgrounds that were Microsoft based, we knew that we would have to supplement our lack of experience around the structural foundation of our IBM D5000 BI Data Warehouse environment. We reduced formalized training needs into the following areas:
� Linux for the OS� DB2 for the database for SSIRS� Cognos for the enterprise reporting included in SSIRS
96 Enabling Smarter Government with Analytics to Streamline Social Services

We assigned the team members to the following training sessions:
� Linux training– Linux Basics and Admin– Linux Sys Admin I: Implementation– Linux Network Admin I: TCP/IP and TCP/IP Services
� DB2 training– DB2 Family Fundamentals– SQL Workshop– DB2 9 for LUW multi-partition DBA Workshop
� Cognos training– Cognos BI Report Studio: Authoring Professional Report Fundamentals– Cognos BI: Report and Analyze Data for Business Authors– Cognos BI Framework Manager: Designing Metadata Models
With the Cognos Report Writing training we wanted to bring in the people in the agency who currently create reports for their respective departments. The idea is that if we can relate all of their source information and compile it in a Cognos Framework Manager package they will be able to use drag-and-drop principles to create the reports that they currently create using Cognos.
Knowledge transfer We brought in IBM contractors to assist us in the creation of the first reports that would come out of SSIRS. As previously mentioned, the challenge here is to adequately and accurately relay the client-based way that we do business here in Alameda County to the contractors, so they would know enough about our business process to replicate it at the data layer. We paired our staff resources with the IBM contractors in the following areas:
� Cognos� Data modeling� EAS knowledge transfer� CWS ETL� SMART/Versa ETL
Chapter 3. Developing the solution 97

98 Enabling Smarter Government with Analytics to Streamline Social Services

Chapter 4. Business outcomes
In this chapter we discuss the business benefits and lessons learned as a result of implementing the Social Services Integrated Reporting System at the Alameda County Social Services Agency.
4
© Copyright IBM Corp. 2012. All rights reserved. 99

4.1 Key business benefits
In the SSA environment, there were three specific business objectives that led to the development of SSIRS:
� Improve the Work Participation Rate (WPR).� Meet Title IV-E (Child Welfare) Waiver reporting requirements.� Eliminate reliance on external reporting services.
SSA achieved these objectives and found that the impact of SSIRS went far beyond the original goals. With the new insights they gained by creating a single view of the client, they were now in a position to reduce improper payments, drive better outcomes, and meet the challenges of growing case workloads. SSIRS enabled a shift from performing low-value activities, such as data gathering, to higher value analysis of cases and more effective delivery of programs and outcomes.
Even early in the implementation phase it became apparent how useful it was to see data as information. For example, simply being able to view a report that showed certain people who were receiving benefits but who were not in compliance was extremely valuable. Being able to find out that one recipient was both a provider and a receiver of services, based on having two social security numbers, was enlightening.
These are other examples of early benefits:
� Person lookup capability
� Engagement Status report, with the ability to drill down to the case transaction level
� Client Overview report, showing not just the children but also their family members
� “What do I need to work on today” screen, giving the case workers the ability to have their activities on a screen instead of keeping lots of paper notes and searching through files
� Linkages to other systems, providing a complete picture of the family
The result is that now SSA has a tool that can do what they want and need it to do.
100 Enabling Smarter Government with Analytics to Streamline Social Services

4.1.1 Business Value Assessment
The development of SSIRS coincided with a dramatic increase in caseloads while at the same time budgets were being cut. In Fiscal YR 09, Alameda County Social Services suffered an $11 million budget cut, and more cuts were anticipated. SSA wanted to better understand how SSIRS could help close this budget gap and asked IBM to conduct a business value assessment (BVA) for SSA to help understand the business impacts of SSIRS, quantify that value of SSIRS, and help prioritize future enhancements to SSIRS to drive incremental value.
The BVA is a consulting engagement based on the IBM Information Agenda methodology, which can help build a business case for investing in information management solutions. A BVA is facilitated by an experienced IBM team dedicated to helping clients better leverage their information assets. The BVA is typically accomplished in three to four weeks. The BVA is a collaborative effort and requires participation of both the IT and business community impacted by the solution.
These were the SSA objectives for the BVA study:
� Increase awareness and understanding of SSIRS capabilities.
� Define, quantify, and document the business impact of SSIRS.
� Identify synergies with Health Care Services Agency (HCSA).
� Focus on the benefits from improved business processes, cost avoidance, revenue enhancement, and fraud detection.
� Identify additional data sources needed to achieve benefits.
� Identify opportunities to leverage the Voice Response Unit (VRU).
The BVA included in-depth interviews and group sessions with senior management, program managers, and case workers from SSA. SSA had excellent participation from all aspects of the organization, including representatives from:
� Adult and Aging � Child and Family Services � Economic Benefit� Employment Services � Evaluations and Research � Finance � Human Resources� Information Technology � Program Integrity Division� Training and Consultation
Chapter 4. Business outcomes 101
4.1.2 Business Value Assessment results
As a consequence of the Business Value Assessment, approximately $20 million dollars in annual savings were identified. The savings realized were a result of cost reductions, revenue enhancement, and cost avoidance:
� Cost reduction
Over 80% of the savings were derived from reducing costs. Cost reductions came from a number of areas, including improving eligibility determination, reducing fraudulent activities, and reducing appeals.
– Improve eligibility determination.
One of the key conclusions of the study was that in many cases information was not available to ensure that those receiving the benefits were eligible for that benefit. With SSIRS the case workers were able to determine whether the client qualified for the benefit much earlier in the process. This reduced the number of months that benefits were paid erroneously.
By having the correct information at the case worker’s fingertips and helping prioritize case work, SSIRS helps reduce the gap of action required versus action taken by case workers during the eligibility and case management process. This resulted in 5.5 million dollars of savings to the county, drove improvements in WPR, and reduced the case backlogs.
– Fraudulent activity reduction
SSIRS is an effective tool to enforce program integrity. SSIRS is enabling the Program Integrity Division (PID) to more efficiently manage the investigation process, giving them tools to prioritize cases and investigate common fraud and abuse issues. For example, with identity and relationship resolution capabilities they can identify clients that are sharing addresses or using fraudulent addresses.
SSIRS supports not only fighting fraud abuse and errors through traditional methods, but also provides the capabilities to avoid making improper payments up front in the eligibility process. This focus on prevention is critical to avoiding the “pay and chase” approach that is expensive to administer, and the level of dollars recouped is about x%.
The study identified approximately 9 million dollars in potential cost savings related to fraud prevention and by PID to more effectively investigate fraud, abuse, and errors.
102 Enabling Smarter Government with Analytics to Streamline Social Services

– Appeals reduction
The number of appeals is a growing issue for SSA. At the time of the study, SSA was handling approximately 1000 appeals per year at a cost of roughly ten thousand dollars per appeal. By better understanding the type of issues filed for appeal and their dispositions, SSA gains insight to improve processes and training.
The study identified approximately $2 million in cost savings by reducing the number of appeals through improved business processes.
� Revenue enhancement
In this category we included activities for reducing costs as complementary to enhancing revenue:
– Reducing general assistance (GA) costs (revenue enhancement)
In addition to providing the information to make better decisions about eligibility, SSIRS is able to provide insight to make sure that clients were taking advantage of the correct federal, state, and local programs. This not only supports the client, but also ensures that dollars from the county's General Assistance fund are optimized and not used when other programs should be providing the service. This is critical given the continuing budget pressures.
For example, indigent adult health care costs funded from Direct County funds can be reduced by identifying individuals who are qualified at the point of care for the federal Medicaid program. This was an unnecessary burden on the GA fund and with the correct information from SSIRS can be avoided.
– Optimizing use of Medicaid
A few more examples are the reduction of costs through identifying where multiple individuals are using the same Medicaid card at clinics or hospitals, or claiming to be homeless and receiving payments while associated with a household.
� Cost avoidance
SSIRS is helping SSA improve the management of welfare to work cases by giving case workers the information that they need to better manage the case backlog and identify clients who are not completing mandatory work activities. This helps the county avoid non-compliance sanctions by the federal government.
In addition to the quantified benefits, a number of qualitative benefits were identified also:
– Better able to focus limited resources on those who need it most
– Improving the WPR, which leads to more recipients becoming self-sufficient
Chapter 4. Business outcomes 103

– Better able to measure and track the impact of specific actions and programs
– Providing caseworkers with information that supports and empowers them to make better decisions and relieve the stress of high caseloads
– Improving employee morale
– Improving productivity
– Delivering holistic client- centered services
– Better able to protect the safety and welfare of children and the elderly
4.2 Lessons learned
As important as technology is to a successful implementation, how that technology is employed by people and processes is even more important to the project's ultimate impact. The purpose of this section is to share key learning from the SSIRS implementation and give the reader ideas in terms of how to deal with common challenges as they pursue similar projects.
4.2.1 Selling the concept
There are many challenges, activities, ideas, and actions that can influence your success in gaining acceptance for a project:
� A receptive audience helps.
A perfect storm was brewing in Alameda. A confluence of events helped drive a sense of urgency on the part of Alameda County. First, federal regulations requiring better welfare outcomes became law and Alameda was dead last based on initial rankings. Second, Alameda's Department of Children and Family Services, along with the Department of Probations, needed to provide better performance measurements of the Title IV-E waiver program. Third, Alameda was under escalating pressures to do more with less.
As a result, the county came to the realization that a business-as-usual approach was not going to solve the issues they faced. They needed to act to meet the mounting challenges.
� A strong executive sponsor.
The executive sponsor needs to create the vision, communicate it well, and generate enthusiasm for the project and the possibilities that it can open up. They need to be able to navigate the politics and obstacles as they are encountered.
104 Enabling Smarter Government with Analytics to Streamline Social Services

The executive sponsor for SSIRS, Don Edwards, is a great example of the impact that the right executive sponsorship can have on the success of a project. In the early days of defining SSIRS, Don created the vision and described that vision in terms of the business impact rather that the technology. To get agreement from the agency administrators, he focused on business productivity and the welfare of the clients. At every stage of the project he has been a champion of SSIRS and gave his team the support that they needed to succeed.
Don not only built support for SSIRS internally, but he reached out to a local philanthropic organization that was also working to protect children. This collaboration resulted in securing a major source of funding to build SSIRS.
Don recognized the importance of sizing the project to ensure success, and putting the tool into the hands of management as quickly as possible. This approach resulted in making his manager, the director a, “raving fan.” The director then promoted the benefits of SSIRS, and the need to expand SSIRS with additional programs to better serve their citizens, to county executives.
� Do not ignore the naysayers.
There are always going to be people who are reticent to change and who want to keep doing things the way that they have been done in the past. Understand that you will have naysayers. Do not ignore them. Instead, listen to them, understand their concerns, and find ways to address those concerns. You can learn from the naysayers and potentially avoid repeating any mistakes.
For example, county management doubted that the WPR system could be replaced in six months from the SSIRS hardware arrival. By paying attention to their concerns and then reviewing the State WPR differences for Alameda, Don's team and IBM delivered and tested the WPR report, which could be drilled down to the actual case transaction in June 2009.
As described previously, one of the business drivers for SSIRS was to eliminate a third-party reporting service that was costing the county over one half million dollars per year and not delivering timely information. One of the key reports from the service was the engagement report.
Early on, the executive that depended on the engagement report was skeptical that SSIRS would be ready in time to cancel the third-party reporting service. Don listened to the concerns, explained in detail what information SSIRS would provide, and emphasized the fact that the information from SSIRS would be more timely and accurate than the current report. The end of the fiscal year was coming and the county was about to commit to extending the contract for another year, which could end up costing the agency an additional three hundred thousand dollars.
Chapter 4. Business outcomes 105

Finally, the executive was convinced. He pulled Don aside and told him that the contract was cancelled. This was a big boost for SSIRS. The team delivered the new report on time, and after Employment Services starting using the SSIRS report they were thrilled. Don had turned a naysayer into a champion of SSIRS.
4.2.2 Sharing information across organizations
One of the major obstacles often cited to achieving the outcomes desired by Social Services agencies is the inability to share information due to privacy laws. Alameda County realized that information sharing across the programs and with other agencies was critical to success:
� Leverage precedence.
It came to the attention of the executive sponsor that a judge in LA County had issued a bench order specifically addressing information sharing between Child Welfare and Probation. That provided the information needed to propose to the executives in charge of the Probation Department and the Department of Children and Family Services at Alameda that they do the same thing. They agreed, and the Probation executive volunteered to take the order to the presiding judge in Alameda County to request a similar order.
� Get your first win.
After you start to break down the barriers it gets easier to convince the next person that it is possible to overcome the barriers to sharing information.
� Create a win-win.
Do not just ask for data. Tell them how you can give them better information as a result of sharing.
One example of this was the partnership that developed between SSA and Alameda's Health Care Services Agency (HCSA). The business value assessment highlighted that SSIRS could be instrumental in helping SSA stop erroneous payments, saving the county significant dollars. Birth and death records were one of the key pieces of information needed to help stop erroneous payments. If SSA was notified immediately when a death occurred, then benefits could be stopped sooner. If they were notified of births, then the child could be enrolled in Medicaid coverage much quicker. The custodian of those records is HCSA. Don gave a private demo to the Director of HCSA and sold him on the concept of sharing information to help both SSA and HCSA. That meeting was the start of a very successful and ongoing collaboration between the two agencies to enhance and leverage the capabilities of SSIRS to benefit both organizations.
106 Enabling Smarter Government with Analytics to Streamline Social Services

4.2.3 Building the right team
For Alameda the issues of building a team for the delivery and support of the solution where challenging. SSA had hoped that the County IT department would support SSIRS and be able to leverage the IT staff. That did not happen, so SSA had to build and train a new team. They had to take these actions:
� Hire the correct people.
Look for people with strong technical skills, a willingness to learn, and who exhibit flexibility.
� Plan for training.
Make sure that your budget includes the necessary technical training for the implementation and support team. The SSA team had a very steep learning curve. To help mitigate this, SSA purchased a comprehensive training package for the key solution components, including Linux, DB2, and Cognos.
� Build knowledge transfer into the plan.
SSA built knowledge transfer into the process with the IBM services delivery team, but that knowledge transfer all had to occur during the initial phase of the implementation. This created a difficult balancing act because the service provider was under pressure to meet the budget and delivery dates, and the knowledge transfer activities took precious time away from those objectives. From SSA's perspective, the team found it difficult to keep up with the services delivery team because they were still learning the basics about the tools and techniques.
Don describes this scenario as a race car (Figure 4-1) with his team going 50 mph in a car that can go 250 mph.
Figure 4-1 Race car
Chapter 4. Business outcomes 107

Ideally, knowledge transfer is most effective if it is accomplished over multiple phases of a project. If possible, plan to have your team participate in the initial implementation as an observer. At the same time they can get the education needed under their belt. In the next phase they are ready to work side-by-side with the vendor. By the third phase they are ready to take a leadership role with guidance from the vendor. Whatever approach you take, have your team start doing the routine tasks as soon as possible and use the vendor for the unique tasks.
� Be aware of the impact on personnel
SSA's implementation team worked relentlessly to get the project done on time while embracing a steep learning curve. This commitment puts a strain on personal lives.
The executive sponsor realized that they had reached a point that the team needed a break, and although they had important training to complete, he postponed it to give the team a much-needed break from the pressures of the project. That allowed them to come back refreshed and ready to tackle the next set of challenges.
The delivery of SSIRS was the beginning of the journey for Don's vision to provide the citizens in need of help with the full spectrum of services to deliver the relevant services when they are needed.
Alameda SSA is typically approached when an individual or family is in crisis and need critical help at that point in time, not weeks later when the moment for SSA to intervene and stabilize their clients has passed. Weeks, and sometimes days, later can be too late for a family facing eviction or a sick child in need of Medicaid. Several more data sources have been added or interact with SSIRS from other agencies, and SSIRS provides a foundation to be built upon.
4.2.4 Starting small and planning for continued growth
The initial scope for SSIRS was very specific. The SSA team was laser focused on delivering the employment services report for the first release. The team delivered on time and exceeded expectations, delivering value at each step of the way.
Tip: Bad things will happen. Use them as a training opportunity.
Tip: It is a marathon, not a sprint. Plan accordingly.
108 Enabling Smarter Government with Analytics to Streamline Social Services

For additional information about future growth of SSIRS, see 4.3, “The journey continues” on page 110.
4.2.5 User acceptance
Gaining user acceptance quickly is critical, particularly those users who are the leaders in the organizations:
� Leaders must set an example.
After SSIRS was operational, Don quickly put it on the director of SSA's desktop so she could begin to see the type of insights provided by SSIRS. This not only got the director engaged, but set the tone for the organization. In addition, the director of Employment Services embraced the new reports, so his team got the message very early that SSIRS was the future direction of the organization.
� Get feedback from the users.
Not long after the initial release of SSIRS, the executive sponsor held a meeting with the users to find out what was going well and what improvements were needed. That meeting uncovered very strong supporters of SSIRS, and those evangelists have been leveraged to help promote the use of SSIRS.
Here is a quote from a caseload worker: “I just love it! SSIRS shows me exactly what I have to work on right away. It eliminates the need for me to deal with searching for what is going on in my case load.”
� Realize that new information will change processes.
It did not take long before SSIRS gave insights to the gaps in actions required by workers yet no action taken. Sometimes these gaps of no action taken were numbered in days, weeks, and sometimes never acted upon. It was an obvious indicator of a business process in need of retooling.
The adoption barriers that organizations face tend to be management and cultural rather that data and technology. Workers and managers alike find it easier to do things the way that they have always been done. It is like that old worn blanket that still seems warm and comfortable yet it is thread bare and falling apart. Changing cultural paradigms is a difficult task. For further reading on this subject, see the book User Adoption Strategies: Shifting Second Wave People to New Collaboration Technology (2010) by Sampson.
Chapter 4. Business outcomes 109

4.3 The journey continues
SSIRS has established itself with the agency's largest department, the Workforce and Benefits Administration (WBA), as an integral component of its business operations. Its welfare benefits eligibility workers use SSIRS to manage their five-to-six hundred client case load. Supervisors use SSIRS to manage their units, division directors use SSIRS to manage their departments, and executives use SSIRS to help manage the WBA program.
The dashboards created for the workers allow them to see immediately what actions are pending in their caseload. These actions might be based on an event, such as a baby being born, or a particular age defining events such as clients who will be turning 18, 25, or 65 years of age in the current month, requiring a particular follow-up action to be taken. So instead of trying to manage 500 - 600 cases, with the help of SSIRS WBA eligibility workers only have to respond to a fraction of that number.
The dashboards for supervisors allow them to manage their units far more effectively than ever before. At a glance, they can see how well the unit is doing as a whole, which areas are in need of improvement, and which worker is in need of help. The directors have an even broader view, as they can see how well their entire department is doing and can spot systemic problems right away.
Perhaps the most exciting new development in the SSIRS journey has been the implementation of the interoperability link to the inter-active voice response system (IVR). SSIRS informs IVR of clients who have yet to turn in their required quarterly verification report. IVR in turn automatically calls the client to remind the client to turn in their paperwork, or if needed allows the client to request a reissue of the needed forms. IVR also tells SSIRS if a client wants do take any of these actions:
� No longer wants to receive benefits� Intends to turn in, or has already turned in, his paperwork� Is no longer at that address
The early result of this first step towards a more automated social services system is a 30% increase in the return rate for the quarterly reports.
Continuing with the interoperability efforts, the Alameda County GIS system is being integrated with SSIRS to enhance the dashboard and reporting capability with spatial information about clients. GIS will help the agency chart the longitudinal movement of clients as they seek services across the entire county.
110 Enabling Smarter Government with Analytics to Streamline Social Services

Next are significant report and dashboard capabilities for the Children and Family Services Division. First is the linkages data mart and reporting system that will help the Child Welfare Department and WBA department work more closely together in an effort ensure that foster youth can remain safely in their homes. This report and dashboard informs workers of both organizations of the status and services provided for parents wanting to re-unify with their children. Providing this information in a single view of our foster youth family helps close the communications gap that often results in one department operating without full knowledge of all the services being provided.
There is much more to come in the near future, including dashboards and reporting systems for the Adult and Aging Services department, Fraud Department, and Health Care Services Administration.
SSA has been asked for, and will provide, real-time access to the Health Care Services Agency (HCSA) from clinical points of access, as a web service. This opportunity to improve services and reduce county costs also creates a risk factor that SSA and HCSA are addressing.
The following is a list of the data sources that have been added to SSIRS since its beginning:
� Two child care databases� Oakland Housing Authority� Health Care Administration Services' online Medicaid Application system� Alameda County School District data
The following is a list of more data sources soon to be added:
� Vital statistics for birth records and death records� Adult probation� Sheriff database� Agency employee database� Child Support Services data source
Chapter 4. Business outcomes 111

112 Enabling Smarter Government with Analytics to Streamline Social Services

Chapter 5. Government Industry Framework
In this chapter we introduce the technical underpinnings of the solution called the IBM Government Industry Framework. The IBM Industry Framework for Government is designed to provide a platform for implementing government solutions and projects. Consisting of IBM software technologies and industry extensions that support an ecosystem of independent software vendors (ISVs), the frameworks give clients the benefit of repeatable technology, faster and lower-risk implementations in their current environment, and collaboration across different government agencies and countries.
The IBM Government Industry Framework is a strategic software platform for implementing smarter government solutions focused on improving citizen services, increasing transparency, enhancing civilian safety and security, and helping achieve a green and sustainable environment.
One particular aspect of the Government Industry Framework that is used by Alameda County is the component known as single view of a citizen (SVoC). SVoC is a data integration strategy that maintains an authoritative source of citizen data. It enables a 360° view of a citizen and manages the access and distribution of the data in a standardized way that can meet legislative and privacy requirements.
5
© Copyright IBM Corp. 2012. All rights reserved. 113

5.1 IBM Government Industry Framework overviewIBM is at the forefront of implementing advanced business applications that leverage industry-specific solution frameworks supported by a service-oriented architecture (SOA). IBM is using their experience in SOA coupled with their industry expertise to create Industry Frameworks, which are industry-specific platforms based on best practices and service orientation. The frameworks bridge the gap between general-purpose middleware and industry-specific business applications to help customers solve challenging business problems. The frameworks also include business partner content built on a common SOA foundation made up of industry-specific domain models and defined product capabilities. The IBM Industry Frameworks provide customers with improved business performance and increased efficiencies through enabling these:
� A flexible industry-specific and domain-specific software platform that can be built upon over time in a phased or spiral implementation approach
� Accelerated time to benefit through pre-integration, testing, and support of key open industry standards
� Cost and risk reduction with improved deployability of IBM and partner offerings
� Multiple entry points, enabling companies to address the immediate business drivers with flexibility to incrementally implement the framework
114 Enabling Smarter Government with Analytics to Streamline Social Services

The Government Industry Framework (F)igure 5-1 is a software platform with government-specific software, solution accelerators, and best practices designed to reduce risk and accelerate the deployment of solutions that help to improve citizen services, increase transparency, enhance public safety, and achieve a sustainable environment. The framework enables customers to choose from a variety of industry solutions that are pre-integrated on common middleware and industry-specific extensions.
Figure 5-1 Government Industry Framework
The IBM Government Industry Framework delivers:
� Speed
It incorporates a proven software foundation, government industry-specific extensions, pre-built solution accelerators, and implementation patterns for faster deployment at lower risk.
� Flexibility
It provides a roadmap that enables customers to build capabilities over time on their existing environment.
IT Hardware and Operations InfrastructureIT Hardware and Operations Infrastructure
Industry Standards,
Data & Process Models
Interfaces and
AdaptersTools
Templates and
Portlets
Reference Architectures
Delivery Guides & Partner
Enablement Centers
IBM Government Industry Framework
Government IndustryGovernment Industry--Specific ExtensionsSpecific Extensions
Tax and Revenue
Management
Safety and Security
Social Services &
Social Security
Integrated Urban
Infrastructure
Metropolitan Transportation
& Roads
IBM Industry Solutions and Business Partner SolutionsIBM Industry Solutions and Business Partner Solutions
Single View• Enterprise view of an entity• Identity and relationship resolution• Analytics for Structured and Unstructured Data• Content Management• Reporting and Visualization
SOA Foundation - Triton • Enterprise service management• Collaboration• Process orchestration• Connectivity• Security
Chapter 5. Government Industry Framework 115

� Choice
It leverages an ecosystem of industry ISVs and IBM solutions that are built on industry standards and pre-integrated into the framework.
� Interoperability
It increases transparency across government entities for more efficient information sharing, service coordination, and record keeping.
The Government Industry Framework provides the technology and capabilities to support projects within five government domains:
� Tax and Revenue Management
Promote better insight, performance, visibility, and control through business intelligence.
� Safety and Security
Advance border security, public safety, and emergency response through intelligence and collaboration.
� Social Services and Social Security
Optimize citizen-centered experiences, reduce waste, and connect people to programs based on individual needs.
� Integrated Urban Infrastructure
Create smarter cities that are operationally efficient and sustainable with effective management of resources.
� Metropolitan Transportation and Roads
Help build multi-modal transportation systems to collectively optimize capacity, reduce congestion, and improve convenience.
As seen in Figure 5-1 on page 115, the Government Industry Framework contains a set of single-view capabilities, which include content management, analytics, and the enterprise view of an entity. Within any government institution, it is not uncommon for structured and unstructured data about people and organizations to be contained in heterogeneous data sources across an agency, department, or enterprise. Business systems can add and update citizen information as part of a business process, but each system maintains its own view about people and organizations relevant to the business processes and supporting business rules. This creates a situation where redundant data about people and organizations exist across the various IT systems. It is typically inconsistent and creates potential data quality issues, not only for the source system applications but also when using this data for analytics.
116 Enabling Smarter Government with Analytics to Streamline Social Services

Master data is defined as the facts describing the core business entities such as people, organizations, and services that is used repeatedly across many business processes and must be decisive. Master data needs to be current, consistent, and accurate to support business processes and analysis. IT organizations have been trying to resolve data quality and consistency issues by developing point-to-point interfaces between applications. Batch processing has been used as one approach to integrate new and updated master data between systems and messaging is another approach. Neither of these approaches provides the ability to effectively manage master data information or provide the ability to easily obtain a enterprise view and entity.
To achieve a trusted view of a citizen or organization, the Government Industry Framework includes a core building block that supports business process optimization and the delivery of trusted data for use in analytics.
Chapter 5. Government Industry Framework 117

Characteristics of this building block (Figure 5-2) are described here:
� Single view of a citizen building block provides a service-oriented approach to deliver accurate, high-quality master data to enhance an existing business process or for use in analytics. It provides the services to manage an authoritative source of master data about people and organizations across all channels.
� Identity analytics can be leveraged to discover relationships and detect potential threat, fraud, and risk. It can be used to link content such as documents with structured data about a person to enable a federated query.
� Master data can be enhanced from insight derived from analytics.
Figure 5-2 Single view of a citizen concepts
The single view of a citizen core building block provides a middleware approach to facilitate the secure access of trusted data and content about a person or organization and can be implemented incrementally based on a customer’s set of requirements and implementation roadmap.
Management of Authoritative Source of Master Information across all channels
Business Process Optimization - Unified Tax Services, Account Opening, Benefits Eligibility, …..
Identity resolution and relationship discovery
Threat, Risk and Fraud Detection
Links unstructured content with structured data for a party
Deliver trusted data for use in analytics and enhance party data with insight from analytics
…… Manages structured master data about people and organizations and leverages Identity and name analytics to deliver trusted data and content about a party
....... Middleware approach to facilitate the collaboration and the secure sharing of trusted data within and external to an organization
…… Ability to implement incrementally as part of a phased implementation strategy
Data Standardization
Identities and Relationships
Individuals and Organizations Data
118 Enabling Smarter Government with Analytics to Streamline Social Services

5.2 Single view of a citizenA critical challenge faced by many government customers is the ability to gain a trusted view of accurate, consistent information about a person, whether the party be a person or an organization. IBM customers have been using a combination of IBM software to implement business solutions that combine the benefits of master data management, information integration, and identity analytics to create a trusted view about a citizen, client, litigant, and so on.
To address this challenge, IBM has created the single view of a citizen architecture building block (SVoC ABB) that supports the delivery of trusted data and content for use in analytics and business process optimization.
There is a set of core architecture principles that are fundamental for the design and implementation of single view of a citizen within an enterprise to support a line of business or support an enterprise-wide solution. Adopting these core architecture principles influences architectural decisions, including integration techniques, master data implementation styles, and requirements. The associated motivation and implications for each principle can vary based upon the business initiatives driving the need to implement single view of a citizen and the IT strategy for a specific organization. That strategy should do this:
� Provide the ability to decouple information from applications and processes to make it available as a strategic asset for use by the enterprise.
� Provide an authoritative source of master data that manages information integrity and controls the distribution of master data across the enterprise in a standardized way that enables reuse.
� Be based upon an architectural framework and reusable services that can leverage existing technologies within the enterprise.
� Be based upon industry-accepted open computing standards to support the use of multiple technologies and techniques for interoperability with external systems and systems within the enterprise.
� Be designed with the highest regard to preserve the ownership of data, integrity, privacy preferences, and security of the data from the time it is entered into the system until retention of the data is no longer required.
� Be designed to implement key capabilities in a phased implementation, which provides multiple entry points to incrementally deliver business value.
Chapter 5. Government Industry Framework 119

These architecture principles identify the motivation to include a trusted information building block, the SVoC ABB, as a core component to deliver trusted, accurate, concise master information about a party as part of a enterprise information management architecture strategy. It can provide services to manage an authoritative source of master data about a party such as citizens and organization, enable the 360 degree view of a party, and manage the access and distribution of the data in a standardized way that can meet legislative requirements. Figure 5-3 provides an overview of the types of services that the SVoC ABB can provide within an enterprise.
Figure 5-3 Single view of a citizen architecture building block overview
The SVoC ABB acts as a trusted information hub to integrate operationally with a line of business systems and with analytical systems. It can be implemented within an existing IT environment to eliminate silos of data and optimize business processes and analytics or support a modernization effort, providing an authoritative source of master data information as part of a transition strategy. It is a key architecture building block that provides this:
� A middleware approach to facilitate the collaboration and the secure sharing of trusted data and content within and external to an organization
� The ability to manage and maintain master data as an authoritative source of master data for the enterprise, perform as a system of reference for the delivery of trusted data, or perform as both a system of record and a system of reference (hybrid model)
Single View is a customer data integration solution that maintains an authoritative source of citizen data, enables the 3600 view of a citizen and manages the access and distribution of the data in a standardized way that can meet legislative and privacy requirements.
Flexibility to perform as a System of Reference or System of Record
Provides the management and governance for master data
Provides a trusted, 360 degree view of a citizen (person and organization)
A middleware solution that enhances current application environments to run more efficiently, reducing the need to require agencies to replace or re-write their current applications.
Provides authorized access to citizen master data as a service.
Provides data quality management to establish a “enterprise” record for a party
Performs as a synchronization point to control the distribution of citizen master data in a standardized way
Provides analysis and discovery services to resolve identities and discover relationships
Connectivity Layer
Service Consumer B
Service Consumer A
Hierarchies & Groupings
Lifecycle Management
Enables 3600 View
Identity & Relationship Analytics
Event Management
Multicultural Name Support
Security and Privacy
Suspect Duplicate Processing
Data Quality Management
Single View
120 Enabling Smarter Government with Analytics to Streamline Social Services
� An adaptive, extensible framework to grow with the needs of the organization and use new emerging technologies
� Additional analysis and insight capabilities for identity relationship resolution, rule execution, and alert generation
� The ability to develop and deliver reusable Information Integration Services
Implementation of the SVoC ABB varies by industry domain and across multiple sectors within a specific industry domain. Variations include the master information data model, use of matching algorithms determined by the quality and trust of personal identity information, conflict detection rules for alert generation, and defined business events. The SVoC ABB supports various application-to-application and data integration techniques to support business process optimization and deliver trusted data for use in analytics.
An enterprise consists of business applications that support the automation of business processes for one or more business units within the enterprise and analytics capabilities such as those provided through the use of a data warehouse and OLAP technologies. Business applications can be a combination of custom-developed, legacy, and packaged applications such as those that provide enterprise resource planning, customer relationship management, and case management functionality. Furthermore, these applications are typically implemented throughout the enterprise on heterogeneous platforms with redundant master data and multiple types of data stores containing structured and possibly unstructured data.
Chapter 5. Government Industry Framework 121

Figure 5-4 identifies key architectural concepts of the SVoC ABB within the context of an enterprise architecture.
Figure 5-4 Single view of a citizen architecture overview
Dependent upon the organization, various types of front-office and back-office users such as customer services representatives, case workers, analysts, border control officers, law enforcement officers, and so forth, access their business applications through presentation integration services provided by the business system or possibly through an enterprise portal. While these users access their respective business applications to perform their work, those applications might maintain master data either directly within the application database or consume master data services directly to access managed master data. Asynchronous integration techniques can also be used to send source system updates to the managed master data.
Connectivity & Interoperability(Synchronous and Asynchronous)
Identity Analytics
Entity ResolutionEntity Resolution
Relationship AwarenessRelationship Awareness
AlertsAlerts
Analytics DataAnalytics Data
Hot Lists
Alerts
MDM Services
Business Process Business Process IntegrationIntegration
Master Data IndexMaster Data Index
Lifecycle ManagementLifecycle Management
Privacy and SecurityPrivacy and Security
MasterMaster DataData
Information Integration Services
Data CleansingData Cleansing
Data StandardizationData Standardization
Address verificationAddress verification
Probabilistic MatchingProbabilistic Matching
Federated QueryFederated Query
Entity
Enterprise Content Mgmt. Services
ContentContent--Centric BPMCentric BPM
Document Document ManagementManagement
Compliance, DiscoveryCompliance, Discovery
& Search& Search
ImagingImaging
Version ControlVersion Control
ContentContent
DigitalContentServiceAccount
Profile
CaseProf ile
Location
Master Information
Party Product
Staging AreaStaging Area
TransientData
BusinessApplications
Interaction Services
(Telephony, Portal, Kiosk, Presentation
Services)
ExternalData Sources
(Watch Lists, Axciom, Experian, Lexis Nexis,
D&B, ….)
ContentManagementSystems and Applications
Business Optimization
& Performance
Services
FraudIndicators
Documents
122 Enabling Smarter Government with Analytics to Streamline Social Services

As more data is collected from multiple source systems about a master data party entity, master data management (MDM) services can be configured to manage a golden record for a party utilizing data quality management services and matching services to create the master party record consolidated from multiple source system records. Survivorship rules can be defined to use the most recent information about a party to create the master party record. Matching and consolidating master data records for a party with data from multiple systems does not necessarily uncover the trusted identity for a party that might be trying to hide their identity, but does manage high-quality master data and provide the ability to create a 360 degree view for a party.
External data sources can include third-party data service providers such as Dun and Bradstreet, ACXIOM, and Lexis Nexis that can be accessed to support the enrichment of data about organizations and demographic information about people. To comply with government regulations, the U.S. Government also provides information from offices such as the Office of Foreign Assets Control that can be cross-referenced as part of a business process for screening applicants for financial services, and a list of excluded individuals and entities that can be used for Medicaid and Medicare payment screening.
The connectivity and interoperability layer provides integration services for systems internal and external to the enterprise. This layer could encompass a variety of techniques, such as batch processing, FTP, and messaging, or in the case of a service-oriented architecture be an enterprise service bus that can support various styles of integration, such as the use of web services and Enterprise Java Beans. Representation of this layer in the architecture does not preclude the ability for a business application to directly invoke a master data service, information integration service, analysis and discovery service or content manage service.
The SVoC ABB consists of the following types of business and information services (Figure 5-4 on page 122), which are capable of managing multiple master data domains:
� Master data management services and a master data repository that contains instance master data from data domains such as citizen, account, case, supplier, product, service, and location. Master data management services provide data quality management, life-cycle management, event management, and hierarchy and relationship management services to maintain master data as the authoritative source of master data. MDM services are consumed to manage the master data repository as a system of record or as a system of reference for master data entities.
Chapter 5. Government Industry Framework 123

� Information integration services provide information services to support real-time interaction with MDM services and support the initial and incremental load of source system data to target systems such as an Enterprise Data Warehouse, the master data management data repository, and the identity analytics data repository.
� Identity analytics services provide Identity Analytics functionality to support the resolution of a person's true identity and relationship resolution services to discover both obvious and non-obvious relationships between people, organizations, and people with organizations.
Because MDM services provide key capabilities for managing the authoritative source of master data, these services must be capable of supporting multiple master data management implementation styles. Some of the most common styles are described here:
� The consolidation implementation style brings together master data from a variety of existing business applications into a single managed MDM database. Along the way, the data is transformed, cleansed, matched, and integrated to provide a complete golden record for one or more master data domains. This golden record serves as a trusted source to downstream systems for reporting and analytics, or as a system of reference to other operational applications.
� The registry implementation style is used to provide a read-only source of master data as a reference to downstream systems with a minimum of data redundancy. The MDM System holds the minimum amount of information required to uniquely match a master data entity, and provides cross-references to additional detailed information that is managed within other systems and databases. Queries against a registry style MDM System dynamically assemble the queried information in two steps:
a. The identifying information is looked up within the MDM System.
b. Using that identity and the cross-reference information, relevant pieces of information are retrieved from other source systems.
� The coexistence implementation style involves the management of master data that might be authored and stored in multiple business applications. The MDM system maintains a physical or virtual master “golden record” for a master data entity. A virtual master data record is dynamically created from source system records maintained in the MDM system from source system updates. The golden record is constructed in the same manner as the consolidation style, typically through asynchronous integration between the source systems and the MDM system. Updates to the master data can be fed back to source systems and published to downstream systems. An MDM System implemented in the coexistence style is not a system of record, because it is not the single place where master data is authored and updated.
124 Enabling Smarter Government with Analytics to Streamline Social Services
� A transactional implementation style manages a centralized set of master data where master data services are consumed by a source system while processing a transaction that adds or updates a master data entity. As a system of record, updates to master data happen directly to this system using the MDM services provided by the SVoC ABB. As update transactions take place, the master data is cleansed, matched, and augmented to maintain the quality of the master data. After updates are accepted, the system distributes these changes to interested applications and users. Changes can be distributed as they happen via messaging, or the changes can be aggregated and distributed as a batch process.
Implementing the SVoC ABB as a building block within an enterprise provides the enterprise with a library of reusable common services consisting of both coarse-grained and fine-grained services to support the management of master data. The SVoC ABB provides the enterprise with centralized control and maintenance for these information services, which delivers consistent packaging of the data and applies consistent business rules to the data. This ensures information quality and consistency for the usage of master data in the right context at the right time for systems across the enterprise and the extended enterprise. For more information about SVoC ABB services, refer to Appendix A, “SVoC ABB services” on page 139.
5.3 Government Industry Framework use casesThis section contains a series of use case scenarios that demonstrate common deployment patterns for how to implement a single view of a citizen. Each use case scenario describes the business context for the scenario and then includes a walk-through to show how the SVoC ABB can provide capabilities to deliver business value for the scenario. This helps demonstrate the viability of the selected technologies for delivering SVoC ABB core capabilities.
Deployment scenarios represent various patterns for integrating line-of-business systems such as a case management system with the SVOC ABB. They are representative of customer implementations and based on best practices. They provide a further means of communicating the operational aspects of the single view of a person/citizen solution architecture.
Chapter 5. Government Industry Framework 125

5.3.1 Safety and securityGovernment agencies charged with both administering and securing borders must collect and process huge amounts of data that comes through a variety of channels and is stored in many different places. This data must be combined, transformed into useful information, and disseminated to the right agency at the right time so that the right action can be taken. New threats must constantly be identified, and scattered agencies must collaborate to take these actions:
� Identify high-risk passengers and cargos, coordinating the effort across several ports of entry.
� Facilitate legitimate commerce and travel while managing time-intensive, paper-based processes.
� Identify critical events, sharing information between agencies, and collaborating to obtain a single view.
� Demonstrate accountability and visibility to the public.
� Access historical information about persons and activities.
� Set watch list parameters to enable timely future interventions.
Note: Implementation of the SVoC ABB can vary based upon the set of requirements for a specific client implementation and entry point for starting the single-view implementation. The core SVoC ABB technologies can consist of a combination of the following IBM technologies based upon business and technical requirements:
� IBM InfoSphere DataStage and IBM InfoSphere QualityStage® (QualityStage) to support ETL processing and data quality management
� IBM InfoSphere MDM Server or IBM Initiate® master data services for managing master data based upon functional and nonfunctional requirements for business process optimization and management of a golden record
� IBM InfoSphere Global Name Recognition for multicultural name search
� IBM Entity Analytic Solutions now known as IBM InfoSphere Identity Insight for discovering relationships and detecting potential threat, fraud, and risk
126 Enabling Smarter Government with Analytics to Streamline Social Services

The high-level objective of this use case is to show how the SVoC ABB can provide services to optimize business process activities that can support the enrollment, screening, and adjudication of an application for a visa product during the application process. A country provides immigration services to enforce the laws and regulations for the admission of a foreign-born person to enter a country either temporarily, such as for a vacation, or to be accepted for permanent residency status. A person can enroll in multiple visa application types for a country over her lifetime. For example, a person can apply for a one-year business visa, multi-year business visa, or workers permit over her lifetime. Figure 5-5 provides a view of a representative process for a client to apply for an immigration visa.
Figure 5-5 Application for an immigration visa
During any period of time when an application has been approved as a legal document for entry or when submitting a new application, a subset of the applicant's personal identity information might have changed. This can be as simple as a home address or it can be a name change due to marriage or for other reasons. An applicant can also attempt to disambiguate their identity for various reasons, such as to avoid detention and illegally enter a country, avoid detection on a watch list, or if they were previously denied for a visa request.
The SVoC ABB provides the ability to deliver a trusted 360 degree view of the client applying for the visa, understand his potential relationships with other applicants, and support conducting a risk assessment. For example, the SVoC ABB can be used to detect conditions requiring further analysis such as these:
� If a person had already been approved for a visa and he later appears on a watch list, such as for do not fly, wants and warrants, anti-money laundering, and so forth, the SVoC ABB can be configured to detect a watch list hit and trigger a notification for action. Immigration services can then take proper action based upon whether the person is in or out of the country.
� Discover potential relationships between the applicant with someone on a watch list through multiple degrees of separation that requires further investigation, and relationships to other applicants who might have already received a visa or are waiting for approval.
Application for a Visa (Immigration Services)Process Flow
Enroll(Provide
Documents; Biometrics, ….)
Adjudication(Approve or
Reject)
Screening(Watch Lists,Background
Investigation, ….
Pre-enroll andSchedule
Appointment
Issue the Visa
If Approved
Chapter 5. Government Industry Framework 127

� If an applicant is already on a watch list, the client's application can be denied as part of the screening process for final adjudication.
� Determine whether an applicant has previously applied for a visa and might now be trying to disambiguate their identity.
� Discover relationships between clients and clients with government employees who process visa applications.
� Provide name search capability for multicultural names and name variants to review application history for multiple types of visas.
Figure 5-6 shows how the core SVoC ABB technologies can work together to manage master data about a client and detect any potential alertable conditions that might require further action by a user.
Figure 5-6 Safety and security
Figure 5-6 shows multiple immigration systems because it is possible for a user to apply for a visa through multiple channels, such as over the internet or face-to-face at a country's embassy or consulate. IBM InfoSphere MDM Server manages the client master data as new client data is added or updated within the immigration systems.
Immigration System(s)
IBMInfoSphere
MDM Server
Standardize Information
1
2
3
IBM InfoSphere QualityStage
Master Data,
Party, Visa Product, ….)
4
IBM InfoSphere
Identity Insight
5
Alert Detected?
Party Data
On-Going
Public information
Extended EnterpriseN
am
e Data
IBM InfoSphereGlobal Name Recognition
4a
Adjudication
Master
Data
Other Government Agencies
Watch Lists
6
New Visa Application
128 Enabling Smarter Government with Analytics to Streamline Social Services

Assume that the system has already been primed with watch list data loaded from government agencies and the appropriate conflict rules configured in IBM InfoSphere Identity Insight. Data about people from public data sources can also be loaded into Identity Insight to assist with identity analytics and for discovering relationships.
This list provides a technical walkthrough for the flow of information. The term party is used to include information for both an individual and an organization:
1. A person starts the application process by completing all the required fields for a visa application.
2. The immigration system sends the party master data, such as name, address, date of birth, nationality, citizenship, and gender, to IBM InfoSphere MDM Server. This data can be sent as part of a global transaction when the data is captured by the immigration system, or it could be sent after completion of the transaction in the immigration system using techniques such as messaging, batch processing, or change data capture.
3. IBM InfoSphere MDM Server can be configured to call IBM InfoSphere QualityStage for data standardization, address validation, and probabilistic matching if the person is not already in the MDM database.
4. After IBM InfoSphere MDM Server adds or updates party information in the MDM database, it sends the party information to IBM InfoSphere Identity Insight via messaging over IBM MQSeries®. Steps 4a and 5 in Figure 5-6 on page 128 represent capabilities provided by available software accelerators. In step 4a a software accelerator can be implemented to synchronize party name information in IBM InfoSphere Global Name Recognition software. This enables the ability to perform enhanced name searches within IBM InfoSphere MDM Server by including first and surname multicultural name variants as part of the name search criteria.
5. This step also represents usage of another software accelerator that can be configured to route alerts detected in IBM InfoSphere Identity Insight for processing by MDM Server capabilities. Identity Insight conflict rules can be configured to detect conditions such as those described earlier in this section. The MDM Server provides a notification mechanism that can be used to generate a notification when receiving an alert for processing.
6. The routed alerts can be reviewed and acted upon by a user so that alerts can be persisted as part of the party history information or a discovered relationship can be created based upon privacy rules.
Chapter 5. Government Industry Framework 129

This scenario completes a simple walkthrough of how the SVoC ABB can manage client application master data so that party data is accurately maintained and analytics can be used to support a screening and adjudication process. It is a simple scenario that can represent a number of enrollment and application processes such as for employee credentialing, benefits screening, and so on. Because MDM can be integrated into a business process, the SvoC ABB and use of the accelerators can now be used to incorporate analytics earlier into a business process.
5.3.2 Optimizing citizen-centric servicesSocial Services and Social Security organizations are facing increasing demand for services, while at the same time funding sources are declining. These organizations want to make sure that the clients who most need the services are getting them. At the same time, case workers are stretched to the limit while serving potentially hundreds of clients at one time and doing their best to navigate a maze of overlapping social programs and regulations to deliver the right mix of services to their clients. Due to heavy workloads, required communications and verifications with recipients might be skipped or not documented, leading to more hearings and appeals. In some cases recipients are being paid benefits to which they are not entitled. Fraud, abuse, and error waste limited resources and undermine public confidence. Investigators need to better understand household composition and other relationships of recipients.
Information about a citizen or case can reside in many different operational systems. Provision of benefits, procurement, and budgetary processes in government have often led to redundant files of information due to lack of collaboration between intra-departmental projects and funding models. To optimize citizen-centric services, the organizations need to take these actions:
� Easily obtain a holistic view of the client across programs.
� Access integrated information from state, federal, and county agencies.
� Integrate information to improve eligibility determination.
� Receive actionable alerts to reduce time before needed action is taken and preempt losses and safety risks.
� Meet state and federal requirements for compliance and accountability processes such as IV-E Waiver and Work Participation Rates.
� Enable a flexible, robust reporting environment, including ad hoc and exception reporting.
130 Enabling Smarter Government with Analytics to Streamline Social Services

The goal is to break through the silos of information and optimize citizen-centric services to achieve better outcomes, monitor performance, and reduce cost and risk. The SvoC ABB can be used to aggregate client data across programs, departments, and agencies. It incorporates identity analytics for fraud and waste analysis. It can help improve the efficiency and effectiveness of eligibility determination, case management, and risk management.
It is not uncommon for a citizen to be asked to provide documentation as part of a benefits application process. Some of the documents might be to validate personal identification, income, residency, or dependents in addition to documents specific to the program eligibility requirements. If a citizen is applying for benefits to be received from multiple programs, they often have to submit the same personal information and documentation for each program for which they are requesting assistance. This makes it cumbersome for the citizen, and increases the costs for the government for handling redundant paperwork.
The use case scenario presented in Figure 5-7 shows how the SVoC ABB can be used to support trusted access to data and content about a person. This data could be federated across multiple data sources that might be internal to a department or external to the department.
Figure 5-7 SVoP ABB support for delivery of trusted content
ExternalAgency A
External Agency B
LocalSystem X
LocalSystem Y
ECM Party ID A111 / Birth CertificateECM Party ID A111 / Marriage CertificateECM Party ID B222 / Marriage License……………….
Party ID 123 ECM Party ID A111Party ID 234 ECM Party ID B222.................
Federated Content IndexFederated Content Index
SVoCSVoC ABB MDM DatabaseABB MDM Database
Name Search to retrieve Name Search to retrieve
ECM Party ID Key ECM Party ID Key
1
Workers PortalContent and Data Federation Layer
IBM IBM InfoSphere InfoSphere MDM ServerMDM Server
IBM IBM FileNetFileNetP8 ContentP8 Content
EngineEngine
Search for available Content
associated with a Party
Name
SSNDOB, …….
Chapter 5. Government Industry Framework 131

The following conditions set the context for the scenario walk-thru:
� Assume that one or more of the external agency or local systems have documents that are stored in a document management system and have been submitted by citizens to support their eligibility determination.
� Assume that the necessary end-to-end infrastructure is in place to support security requirements for permitting authorized access to document objects.
� Assume that a federation layer has been implemented to support the access and display of federated documents that might be contained within the agency infrastructure and for access to documents within external agencies.
� Assume that all documents of understanding or service level agreements have been established to support requirements for cross-agency access to data or content.
� IBM FileNet® Content Manager Federation Services puts metadata from disparate content repositories into the IBM FileNet P8 Content Engine's master catalog. This catalog maintains metadata about document objects that are in federated document repositories.
� IBM InfoSphere Master Content Server for IBM InfoSphere MDM Server can be used to link federated content referenced in the IBM FileNet P8 Federated Catalog to a master party record in MDM Server. As documents are added or updated in ECM systems throughout the day, linkage is maintained to a master party record in the SvoC ABB.
� IBM InfoSphere MDM Server is managing a master party record for each unique citizen in the system and maintains a reference to unstructured content about a citizen.
The scenario flow starts with a case worker using a worker’s portal to locate available documentation about a person. The citizen might be applying for benefits at the time and in a face-to-face meeting with the case worker or the case worker might be doing research to support eligibility requirements:
1. The case workers queries for existing documents within the various ECM systems with a combination of citizen name, social security number, date of birth, and so on (essentially, the same personal identity information that a citizen provides to uniquely identify them as a citizen).
2. The portal requests a SVoC ABB MDM service to retrieve the ECM party ID for the citizen information just entered. MDM Server performs the search and returns the query result set to the user. The user can then confirm that this is the person who they are processing at the time because the system can return additional information about the person for verification.
132 Enabling Smarter Government with Analytics to Streamline Social Services

3. After the user verifies the information, the portal uses the ECM party number to query the FileNet federated catalog. FileNet returns metadata about each document object available for online access. Authorization access privileges should be implemented either within the federation layer or the portal so that a user only sees a list of documents that she is authorized to view. Figure 5-8 shows that there are several online documents on file for this citizen that the user is authorized to access and view, such as a marriage license certificate and birth certificate.
Figure 5-8 SVoP ABB federated query support
4. The user now selects which document to access and view based on the returned document object metadata being displayed.
5. The portal submits the query request for the document object to the federation layer that retrieves and displays the document object through the portal for the user.
6. The user can validate the document content and use it appropriately to support eligibility processing.
ExternalAgency A
External Agency B
LocalSystem X
LocalSystem Y
ECM Party ID A111 / Birth CertificateECM Party ID A111 / Marriage CertificateECM Party ID B222 / Marriage License……………….
Party ID 123 ECM Party ID A111Party ID 234 ECM Party ID B222.......... .......
Federated Content IndexFederated Content Index
SVoCSVoC ABB MDM DatabaseABB MDM Database
Name Search to retrieve Name Search to retrieve
ECM Party ID Key ECM Party ID Key
Return Content Metadata Return Content Metadata
1
2
Available content
displayed for user to select for
review
Select Content to Retrieve/View
Workers PortalContent and Data Federation Layer
IBM IBM InfoSphere InfoSphere MDM ServerMDM Server
IBM IBM FileNetFileNetP8 ContentP8 Content
EngineEngineMarriage License
Birth Certificate
Chapter 5. Government Industry Framework 133

Online access to available citizen documents that do not exist in the caseworker's system, but that can be viewed with proper authorization, can reduce the processing time and the amount of paperwork for both the caseworker and the citizen.
5.3.3 Tax and revenue management Tax and revenue collection agencies are under pressure to collect more revenue, enforce legislative compliance, and improve inefficient clams processing. As is the case for many government agencies, information about a citizen and his tax obligations for multiple tax types might reside in many operational systems. The management and collection of revenues for various tax types occurring at various levels of government, such as regional and federal, further complicates the ability to obtain a unified view of a taxpayer across all tax types.
Procurement and budgetary processes in government have often led to redundant information due to lack of collaboration between intra-departmental projects and funding models. Agency systems that support declaration management, tax compliance, auditing, and analytics, even for the same tax type, such as income tax, might have an inconsistent view of taxpayer information. Tax systems might need to support multiple entry channels for the declaration of taxes that include the electronic filing of taxes from an individual or third-party filers, paper-based filing from individuals, and third-party filers and use of tax software to prepare tax payer returns.
During the time that a tax declaration is submitted until acceptance for final processing, validation processing might detect errors that require correction and resubmittion by the taxpayer to complete the declaration process. The ability to process large volumes of content to support the submission of evidence in addition to paper declaration forms also requires the need to manage high volumes of content in addition to the tax declaration data. This creates the need for information life-cycle management with reliable version control to maintain the accurate submission of both structured data and unstructured content for a taxpayer declaration. IT departments typically implement point-to-point interfaces to keep citizen and tax data current across multiple systems. This increases the overall costs to manage and implement changes across the systems.
134 Enabling Smarter Government with Analytics to Streamline Social Services

The SVoC ABB provides the ability to manage trusted data and content about a citizen to support the filing of tax declarations and provide a unified view of taxpayer information across multiple systems for declaration management, analytics, auditing, and compliance. The SvoC ABB can provide access to current, consistent, and accurate taxpayer data and content such as evidence and paper-submitted declarations. It also enables a single window concept for the registering and electronic filing of taxpayer data, managing master data for use in declaration management, and delivering trusted data for use in analytics.
The use case scenario in Figure 5-9 represents how the SvoC ABB can support the online registration of individuals for the electronic filing of taxes such as income tax. The SvoC ABB will be used to manage the citizen registration data and to perform early compliance checks for taxpayer-submitted personal information. The registration process ultimately ends with the taxpayer receiving security credentials for use in the filing of a tax declaration after the registration process completes successfully. Assume that other government agencies are providing input such as anti-money laundering lists, drug cartel lists, and vital statistics that can be used in combination with publicly available data for screening registrants' information.
Figure 5-9 Online taxpayer registration scenario
Tax Portal
IBMInfoSphere
MDM Server
Standardize Information
1
2
3
IBM InfoSphere Quality Stage
6
Master Data,Name, Tax payer ID,
dependents, ….)
4
IBM InfoSphere
Identity Insight
5
Alert Detected?
Party Data
On
-Go
ing
Public information
Extended Enterprise
Nam
e Data
IBM InfoSphereGlobal Name Recognition
4a
PortalPortal
Self ServiceRegistration
Ale
rt?
SecurityAuthentication
System
7
8
Confirmation orNotification
7
Case ManagementSystem
Master
Data
Other Government Agencies
Portal
Chapter 5. Government Industry Framework 135

The use case scenario starts with an individual accessing a government portal that provides online registration capability for the electronic filing of tax declarations:
1. The citizen enters information that is required to complete the registration process such as name, date of birth, home address, contact telephone number, taxpayer identification number, and for income taxes, information about dependents to be claimed for income tax declaration.
2. The portal sends this information to IBM InfoSphere MDM Server. This data can be sent as part of a global transaction when the data is captured by the registration portal or it can be sent after completion of the transaction in the portal registration using techniques such as messaging, batch processing, or change data capture.
3. IBM InfoSphere MDM Server can be configured to call IBM InfoSphere QualityStage for data standardization, address validation, and probabilistic matching if the person is not already in the MDM database. If the registration process is being used to update an address for a taxpayer, QualityStage could be called to standardize and validate the updated address.
4. After IBM InfoSphere MDM Server adds or updates party information in the MDM database, it sends the party information to IBM InfoSphere Identity Insight via messaging over IBM MQSeries. Steps 4a and 5 in Figure 5-9 represent capabilities provided by available software accelerators. In step 4a a software accelerator can be implemented to synchronize party name information in IBM InfoSphere Global Name Recognition software. This enables the ability to perform enhanced name searches within IBM InfoSphere MDM Server by including first and surname multicultural name variants as part of the name search criteria.
5. This step also represents usage of another software accelerator that can be configured to route alerts detected in IBM InfoSphere Identity Insight for processing by MDM Server capabilities. Identity Insight conflict rules can be configured to detect conditions such as the registration of a dependent that does not exist and registration of a taxpayer known to be involved in anti-money laundering activities.
6. If an alert is detected, MDM Server provides a notification mechanism that can be used to generate a notification to a business user. The business user investigates the alert while using a case management system to track and record correspondence with the taxpayer for corrective action and the investigation of any potential fraudulent information.
136 Enabling Smarter Government with Analytics to Streamline Social Services

7. If there are no compliance concerns and the taxpayer has no existing security credential, the MDM system can interact with a security system to generate a new credential and deliver it directly to the citizen via a secure channel
8. Upon completion of the process, MDM Server can provide a confirmation notification to the taxpayer. This confirmation notice can also contain the security credential.
A unified view of the taxpayer can be developed as data is submitted from employers and revenue collection systems that feed tax agency systems. This more complete view of the taxpayer can provide benefits for the electronic filing and screening of taxpayer tax declarations. Online forms can be pre-filled with taxpayer data that is already known about the tax filer, such as earned income and additional compliance, and audit checking can be performed earlier in the declaration process. It is less expensive to the government to avoid the issuance of a refund than it is to try to collect the refund after it has already been issued to the tax filer. In summary, the SVoC ABB can be implemented to take these actions:
� Improve revenue collection by providing a unified tax service.� ViewSupport a Single Window for e-Filing and Registration support.� Provide up-front screening for fraud identification.
Chapter 5. Government Industry Framework 137

138 Enabling Smarter Government with Analytics to Streamline Social Services

Appendix A. SVoC ABB services
A critical challenge faced by many businesses and government departments is the ability to gain a trusted view of accurate, consistent information about a person, whether that person is an actual person or an organization. IBM clients have been using a combination of IBM software to implement business solutions that combine the benefits of master data management and information integration and identity analytics to create a trusted view of a person, such as a citizen, client, litigant, and so forth.
To address this challenge for government departments, IBM has created a Single View of a Citizen (SVoC) reference architecture (shown in Chapter 5, “Government Industry Framework” on page 113), which contains a trusted information building block that supports the delivery of trusted data and content for use in analytics and business process optimization. This building block will be referred to as the SVoC Architecture Building Block (ABB). IBM government clients can leverage the reference architecture as input for implementing their single view of a citizen based upon their business priorities and requirements. A client can choose to start with:
� IBM InfoSphere MDM Server or IBM Initiate Master Data Services to provide master data management services for a line of business systems
� IBM InfoSphere Identity Insight to identity potential threat, risk, and fraud
� IBM FileNet for enterprise content management
� IBM Content Analytics for unstructured content analytics
A
© Copyright IBM Corp. 2012. All rights reserved. 139

� IBM Cognos for operational intelligence and visualization
� IBM SPSS for predictive analytics
Implementing the architecture-based solutionFigure 5-4 on page 122 presented an architecture overview of a single view of a citizen. In the following sections of this appendix, we discuss the various IBM component products and services that are available to implement the SVoC solution defined by that architecture. We do that with a building block approach, which we have defined as the SVoC ABB reference architecture. Specifically, in this case, we start with a component view of that reference architecture.
SVoC ABB component view
The focus of Figure A-1, the single view of a citizen ABB component view is to communicate the functional responsibilities of the SVoC ABB and show how it can integrate with business systems within a line of business, across the enterprise, or with the extended enterprise. The master data management services, Identity Analytics services, and Information Integration Services Architecture components are fundamental to constructing a SVoC ABB hub.
Figure A-1 Single view of a citizen architecture ABB component view
Connectivity & Interoperability
Ale
rts
Get
His
tory
Ad
d S
ou
rce
S
yst
em k
ey
Se
arc
h
Ide
nti
tyR
esol
uti
on
Per
sis
ten
t Q
uery
Rel
ati
on
sh
ipR
eso
luti
on
Na
me
Sta
nd
ard
iza
tio
n
Fed
era
ted
Q
uer
y
......
Ad
dre
ss
S
tan
da
rdiz
atio
n&
Va
lida
tio
n
Ad
d /
Up
da
te
Pa
rty
Add
/ U
pd
ate
R
ela
tio
ns
hip
s
Mat
chi
ng
&S
urv
ivor
sh
ip
Ad
d /
Up
da
te
Ac
cou
nt
Da
ta
No
tify
Ad
d/R
eg
iste
rD
ele
te/U
pd
ate
Se
arc
h/R
etr
ieve
Ver
sio
n C
on
tro
l
Init
iate
/man
age
Pro
ces
s
ServiceInvocationRouting
Message Mediation
PublishSubscribe
Transport Quality ofService FTP
SVoC ABB
BusinessApplications
Interaction Services
(Telephony, Portal, Kiosk, Presentation
Services)
ExternalData Sources
(Watch Lists, Axciom, Experian, Lexis Nexis,
D&B, ….)
ContentManagementSystems and Applications
Re
solu
tion
E
ng
ine
Analytical Data
Vis
ua
liza
tion
An
on
ym
ou
sR
es
olu
tio
n
Eve
nt D
etec
tio
n
Identity Analytics Services
Hie
rarc
hie
s &
R
ela
tion
ship
s
Se
curi
ty &
P
riva
cy
Ev
en
t Det
ec
tio
n
Au
dit
an
d H
isto
ry
Du
pli
cat
e S
usp
ect
Pro
ces
sin
g
Da
ta Q
ua
lity
Ma
nag
em
ent
Da
ta G
ove
rna
nce
MDM Services
Authoritative Source
Dat
a S
tan
da
rdiz
ati
on
Da
ta C
lean
sin
g
Pro
ba
bil
isti
c M
atc
hin
g
ET
L
En
terp
ris
e In
form
atio
n
Inte
gra
tio
n
Information Integration
Co
nte
nt
ing
est
/
Dig
itiza
tio
n o
f pap
er
Co
nte
nt I
nte
gra
tio
n
Co
nte
nt
ba
sed
wo
rkflo
w
Co
mp
lia
nc
e a
nd
Dis
co
ver
y
Content Management
Business Optimization & Performance
Services
140 Enabling Smarter Government with Analytics to Streamline Social Services

External and internal users can access master data in the SVoC ABB through multiple delivery channels. For example, citizens and organizations such as service providers might access and update their personal master data through business systems that provide self-service capabilities to apply for government services, file taxes, and check benefit status. Government agencies require the need to securely share information with other government agencies about people and organizations. Business applications typically interact with SVoC Hub services asynchronously after a business transaction has completed or invoke a SVoC ABB service as part of a global transaction.
Third-party data service providers such as Dun and Bradstreet, Acxiom, and Lexis Nexis could be accessed for additional information about a person or organization to enrich master data maintained in the MDM database. Data from these organizations can be used to support the initial loading of master data into the MDM database, periodic updates can be scheduled for updating the MDM database, or SVoC ABB services can access third-party data service providers on a transactional basis based on business requirements. Government agencies can provide watch lists required to support regulatory compliance and for the war against terror and anti-money laundering. This “watch list information” could be loaded into the SVoC ABB on a regular basis, and as new party information is added to the SVoC ABB, Identity Analytics services can be configured to detect potential threats and fraud in support of a business process.
The connectivity and interoperability layer facilitates business-to-business communications between government agency system-to-system communications within a line of business across the enterprise and communications with external data providers. The Connectivity and interoperability layer represents the enterprise service bus architectural construct, or it can simply be thought of as a layer of components that provides choreography capability and synchronous and asynchronous integration capabilities through the use of messaging, web services, and FTP. The SVoC ABB consists of a set of information and business services that can be requested directly from any business system based on the choice of application or data integration technique.
MDM services provide key capabilities for a service-oriented architecture such as common business services that provide the ability to implement consistent information-centric procedures across all applications, in addition to maintaining a common authoritative source of critical, accurate, consistent master data. MDM services provides a set of services to create, control, and manage a single view of a citizen across multiple systems. As part of the process for creating that single view of a party, Identity Analytics services can be consumed to resolve a party's identity and discover relationships from master data information and data collected from additional data sources about people and organizations. These services can be configured to detect possible threat and fraud.
Appendix A. SVoC ABB services 141

A key requirement for implementing the SVoC ABB is the ability to access, collect, and aggregate information from multiple systems that contain party information, and to keep all of the data available up-to-date. Information Integration Services facilitate the integration of data and consist of services that support information integrity, ETL, and Enterprise Information Integration (EII) services. Cleansing and standardization services can be consumed to cleanse and standardize data as part of an online transaction or to support the matching of data from multiple data sources to effectively aggregate data. EII services provide the ability to submit a query to access both structured and unstructured data across heterogeneous systems and return the aggregated result set.
The following subsections provide further details about the SVoC ABB Services.
Master data management services
Master data management (MDM) services provide a set of business and information services that manage an authoritative source of master data with the ability to add and capture changes to master data, aggregating and linking electronic records consisting of structured and unstructured data for that party. MDM services leverage Information Integration Services to enforce consistent data cleansing, data validation, and standardization logic to maintain high-quality master data within the SVoC ABB. These are typical MDM services:
� Lifecycle management services manage the life cycle of master data, provide CRUD (create, read, update and delete) support for master data, and can apply business logic based on the context of that data. MDM services are usually invoked by a business system or as part of an enterprise business process that includes interactions with one or more business systems and users. These services can also support the enrichment of master data by maintaining data received from external data sources, customer privacy preferences, and cross-channel interaction history that provides additional knowledge about a master data entity.
� Security and privacy services are services available to implement policies for role-based access to MDM services and data. Authorization services implement both user-level and group-level access controls to authorize access to MDM services and master data information. This implies that inbound requests for MDM services should contain both a user name and a role of that user or identify a proxy service that requests MDM services on behalf of users. Data-level entitlements control access privileges to master data records and data attributes.
142 Enabling Smarter Government with Analytics to Streamline Social Services

� Audit and history services provide audit logging capability for transaction logging and maintain a history of changes to master data. Audit logging services record transaction history, event history, and the actual changes that have been made to master data at that point in time. History logging services log the actual master data values that have been added or updated as part of an MDM service at that point-in-time for a transaction.
� Event detection services generate notifications and trigger operations based on events detected within the data. Event detection services can be configured to run pre or post invocation of a MDM service to detect an actionable event. Events can be defined to support data governance policies, based on business rules or time and date scheduled. For example, business rules can be defined to trigger notifications for life-changing events such as a birth of a new baby or marriage. Date-driven events can be triggered to initiate a business process, such as when a dependent reaches the age of 18 and is no longer considered eligible for benefits.
� Hierarchy and relationship management services manage master data hierarchies, groupings, and relationships that have been defined for parties (people and organizations). Hierarchies consist of master data entities that can logically be structured into parent-child relationships. These services can also request Identity Analytics services to discover relationships such as those between people that are not obvious and then store that information in the MDM System. Relationships are typically defined between master data entities within the same data domain. For example, MDM party A is the spouse of MDM party B. MDM party C is the case worker for MDM party D.
� Data governance services provide the ability to split or collapse master data records that have been linked or consolidated as one entity. A split can occur in the event that a single master client (Golden) record needs to be split into multiple master party records or collapsed into one single master party record.
� Duplicate suspect processing services are used to provide record-matching capabilities to support the aggregation and consolidation or linking of multiple source system records as a single master data entity. The single master data entity can be represented physically as a single master party record or virtually as a dynamically generated master party record by storing source system records within the MDM system.
� Data quality management services validate and enforce data quality rules and perform data standardization for both data values and structures. These services can request data standardization and cleansing services provided by the Information Integration component. Data validation and cleansing services provides services to define and enforce data validation, data standardization, and data cleansing rules for master data. These rules determine whether data is acceptable to the MDM System, such as date formats, range validation, maximum and minimum values and checksum on a data element or on multiple data elements.
Appendix A. SVoC ABB services 143

Information Integration Services
Information Integration Services provide Information Integrity Services, ETL services, and EII services for federated query access to structured and unstructured data distributed over disparate data sources. Information Integrity Services include data profiling, analysis, cleansing, data standardization, and probabilistic matching services. Data profiling and analysis services are critical for understanding the quality of master data across enterprise systems, and for defining data validation, data cleansing, matching, and standardization logic required to improve master data quality and consistency.
MDM services can request data cleansing, standardization, and probabilistic matching services to cleanse, standardize, and match master data updates received by business systems. Data cleansing, standardization, and probabilistic matching services should be available as information services for real-time business transactions and to support batch processing for the loading and matching of records from multiple data sources into a target system. Address Standardization and Validation services are examples of information integrity services that standardize address information and validate that address against a published list of valid addresses for that region. Data cleansing services provide functionality to scrub data such as:
� The ability to validate fields based upon simple validation rules such as known dimensions for a product or valid reference table codes
� Comparing data values against a range of values
� Populating missing required data fields with default values
� Accessing an external data source for information to look up for validation of a data field or to populate data fields
Matching services provide probabilistic matching capability to match and merge data records based upon survivorship rules and are used to eliminate the duplicate entry of master data entities such as clients or providers into the MDM database. Matching services are based on configurable matching logic to match duplicate records and implement survivorship capability that determines how to remove duplicate entries and merge content from those duplicate records into a single consolidated record.
ETL services support the initial and incremental ETL of data from one or more source systems to meet the needs of one or more targets, such as a data warehouse or the MDM database. Asynchronous and synchronous communication techniques to support the transporting of low volumes of changed data could occur within the connectivity and interoperability layer.
144 Enabling Smarter Government with Analytics to Streamline Social Services

EII services provide information services to access structured and unstructured content contained in disparate data sources. These services create integrated views of the data, making it possible to use standard SQL or standard application programming interfaces (APIs) to access data sources and content. Federation services provide the services that manage transaction consistency to maintain the integrity of a query or update transaction being coordinated across multiple database systems.
Identity Analytics services
Identity Analytics services provide resolution services that can discover non-obvious relationships between parties and assist in resolving the true identity of a person who might be trying to hide his identity or simply assist in understanding who someone is. These services can be requested by business systems and by MDM services to determine a person's identity, discover whether someone is on a watch list, and discover non-obvious and obvious relationships between master data entities and with watch list entities. Identity and relationship resolution services can be requested as a persistent query so that if a resolution request is submitted and there are no immediate results, the Resolution Engine will continue to process the query as new data is received and watch list entries updated until results can be returned for that query or the query becomes inactive.
The resolution engine uniquely resolves a person's identity and relationships through configurable resolution services as new data is loaded. The analytical database contains all the data about a person or organization that has been collected over time. This is done because data that has been collected in the past might become relevant in the future to determine a person's identity or discover relationships. These services provide full attribution capabilities so that if multiple records exist about a person in the analytics database, they will all be used as part of the on-going analysis to discover relationships and identities. The result of finalizing a match of multiple person records generates a unique entity ID for that person's known identity at that point-in-time.
Relationship Resolution services can also be used to resolve non-obvious relationships between people such as those who are part of the same household but have different last names and between people and organizations. Relationship Resolution services determine relationships about people and organizations based on rules that are defined to identify what is meant by a relationship.
Appendix A. SVoC ABB services 145

For example, obvious relationships are defined by rules that can automatically associate people through marriage or by living at the same address. Non-obvious relationships are defined by rules that discover relationships through various degrees of separation about people and organizations that might not be obvious, but that are inferred by common pieces of information such as bank account numbers, credit card numbers, and point-in-time information such as an address. These common pieces of information are used to establish a network of related people and organizations that are associated through a common piece of information that links them all together.
Anonymous Resolution services play a critical role for solutions that must comply with government privacy legislation. Anonymous Resolution services protect the privacy of personal information by not storing or displaying data in clear text and by implementing matching logic anonymously. A mechanism such as hashing can be used to hide the data but maintain the capability to match the information about a person such as social security number, name, and passport number against personal identity information about people already contained in the analytics database. A match alert can be generated, sending a pointer to the original data instead of the data itself for further investigation.
Visualization services are requested by a user interface or client application to view identity information and a graphical view of entity relationships. When viewing the various degrees of separation between entities in a network, visualization services can be requested to support further analysis about the information that is used to link these entities.
Event Detection services provide another means to look for individuals whose activities might require further investigation. Complex events can be defined to evaluate all transactions of an entity and optionally to include all transactions for all associated entities. Alerts are typically defined, not based upon the occurrence of a single event, but by a composition of events that might occur at different times. An example is for an individual to try to hide a single transaction of withdrawing over $10,000 from a single bank account by spreading the withdraw amounts over multiple accounts at different locations within a 24-hour duration to avoid reporting requirements.
146 Enabling Smarter Government with Analytics to Streamline Social Services

SVoC operational perspective
Implementation of the SVoC ABB can vary based on the set of requirements for a specific client implementation and the entry point for starting the single-view implementation. The core SVoC ABB technologies can consist of a combination of the following IBM technologies, which are overlaid onto the SVoC ABB component view (Figure A-2) based on business and technical requirements:
� IBM InfoSphere DataStage and IBM QualityStage to support ETL processing and data quality management
� IBM InfoSphere MDM Server or IBM Initiate Master Data Services for managing master data based on functional and nonfunctional requirements for business process optimization and management of a golden record
� IBM InfoSphere Global Name Recognition for multicultural name search
� IBM Entity Analytic Solutions now known as IBM InfoSphere Identity Insight for discovering relationships and detecting potential threat, fraud, and risk
Figure A-2 SVoC ABB product view
Connectivity & Interoperability
Ale
rts
Get
His
tory
Ad
d S
our
ce
Sy
ste
m k
ey
Se
arch
Iden
tity
Re
solu
tio
n
Per
sist
en
t Q
uery
Rel
ati
on
ship
Re
solu
tio
n
Na
me
Sta
nda
rdiz
ati
on
Fed
erat
ed
Qu
ery
......
Ad
dres
s
Sta
nd
ard
iza
tion
& V
alid
atio
n
Ad
d /
Up
da
te
Pa
rty
Add
/ U
pda
te
Re
lati
ons
hip
s
Mat
ch
ing
&S
urvi
vors
hip
Ad
d /
Up
da
te
Ac
cou
nt D
ata
No
tify
Business Optimization &
PerformanceServices
Ad
d/R
egis
ter
De
lete
/Up
da
te
Sea
rch
/Ret
riev
e
Ver
sio
n C
on
tro
l
Init
iate
/man
age
P
roce
ss
ServiceInvocationRouting
Message Mediation
PublishSubscribe
Transport Quality ofService FTP
SVoC ABB
IBM InfoSphereInformation
Server &Global NameRecognition
IBM InfoSphereMaster Data Management
Server or
IBM Initiate MasterData Services
IBM ECM
( IBM InfoSphere forMaster Content For InfoSphere MDM Server )
IBM InfoSphere Identity Insight
(previously known As IBM EAS)
BusinessApplications
Interaction Services
(Telephony, Portal, Kiosk, Presentation
Services)
ExternalData Sources
(Watch Lists, Axciom, Experian, Lexis Nexis,
D&B, ….)
ContentManagementSystems and Applications
IBM Cognos&
IBM SPSS
Appendix A. SVoC ABB services 147

To deliver an overall end-to-end single-view solution, the SVoC ABB must be integrated with additional software technologies within a line of business or enterprise such as presentation services, security services, business process integration services, enterprise integration services, content management services, and analytics services. The SVoC ABB can be integrated into a business process through a business system requesting IBM InfoSphere MDM Services or through a portal. Integration to MDM Server can occur using application-to-application asynchronous and synchronous integration techniques such as SOA and messaging. As party data is added, updated, split, or collapsed in MDM Server, MDM Server can be configured to let the party updates flow to EAS to detect role-based alerts. IBM Information Server can be used to perform data delivery and synchronization functions connecting to and from the MDM hub and data quality management services for MDM Server. Data can be piped directly into EAS through use of web services or through batch processing, and web services can be used to query EAS directly about entities from any authorized system.
The IBM InfoSphere portfolio is designed for each component to serve a distinct function supporting the management and delivery of trusted information. The SVoC ABB leverages each product’s core capabilities, extensibility, and out-of-the-box integration between products. IBM MDM technologies provide the following key capabilities within the SVoC ABB for managing master data:
� Supports multiple MDM implementation styles to manage a master data repository as either a system of reference or system of record
� Provides master data life-cycle management to manage changes that occur to master data over time
� Maintains references to master data information contained in source systems about a party
� Supports either the management of a physical master party record created through matching and survivorship logic to maintain a “golden record” or a virtual master party record, which can be dynamically created from source system records persisted within the MDM data repository
� Supports the creation and storing of new master data elements
� Provides data stewardship capabilities for the management and governance of master data
� Provides data security and privacy capabilities to support legislative compliance
� Can perform event detection for both scheduled and transactional events and generate notifications for business process integration
148 Enabling Smarter Government with Analytics to Streamline Social Services

� Sends add, update, split, and collapse party information to IBM InfoSphere Entity Analytics Solutions (EAS) over an IBM Message Queue (MQ) in the EAS Universal Message Format (UMF) format
� Can utilize external resources for data cleansing, standardization, and matching services.
The following list provides an overview of the functional capabilities that IBM Entity Analytics Relationship Resolution, now known as IBM InfoSphere Identity Insight, provides for the SVoC ABB:
� Provides identity resolution capabilities to resolve identities based on personal identity information
� Performs relationship resolution to discover non-obvious relationships through multiple degrees of separation
� Provides a full attribution data model for resolved identities so that when an attribute changes, all identities and relationships are analyzed
� Generates alerts based on execution criteria for conflict rule detection and complex event detection
� Provides a Visualizer graphical user interface to navigate through identity and relationship data
� Provides persistent query support to allow a query to remain active to find the data when the results become available at a future date
� Receives input data such as watch lists, wants and warrants, OFAC, and so forth, from additional data sources not providing party information through the MDM Server front end for use cases that support threat and fraud detection checks against watch lists
IBM InfoSphere Information Server combines the technologies within the IBM Information Integration Solutions portfolio (Information Analyzer, QualityStage, DataStage, Information Services Director, Federation Server/Classic Federation Server, and Change Data Capture) into a single platform that enables companies to understand, cleanse, transform, and deliver trustworthy and context-rich information. The following summarizes the fundamental functional capabilities that IBM InfoSphere Information Server provides in the SVoC ABB for batch loading and the runtime environment:
� IBM Information Analyzer should be used for the data profiling and understanding of source data for populating into MDM Server and EAS.
� IBM InfoSphere DataStage provides ETL support for loading the MDM database and can be used to feed EAS Pipeline processing.
Appendix A. SVoC ABB services 149
� IBM InfoSphere QualityStage can be used by IBM InfoSphere MDM Server for data cleansing and data standardization. It also can provide probabilistic matching services for MDM Server when configured to enhance deterministic matching within MDM Server.
� Federation Server can be used to provide federated query services to access structure and unstructured data across multiple data sources and aggregates the returned results.
The following list provides a summary of the fundamental functional capabilities that IBM InfoSphere Global Name Recognition software can provide in the SVoC ABB:
� Name regularization support for parsing a multicultural name into the proper root name order
� Name analytics to enrich name data with gender, culture, and name variations when persisting in the MDM database or in a analytical database
� Support loading of watch list names into a standardized format for precise name matching
� Precise name-centric query support either called directly or via an MDM Search service
� Supports orthographic variations such as John/Jhon, Bill/Boll and based upon country of association given variations (Bill, William, Billy) and surname variations (Smyth, Smith)
The combination of these InfoSphere technologies works together to provide the capabilities of the SvoC ABB. Because the software products support a service-oriented architecture, source systems such as a business application, workflow engine, rules engine, or portal can consume services exposed by any of the products.
150 Enabling Smarter Government with Analytics to Streamline Social Services

Glossary
Access Control List (ACL). The list of principals that have explicit permission (to publish, to subscribe to, and to request persistent delivery of a publication message) against a topic in the topic tree. The ACLs define the implementation of topic-based security.
Aggregate. Pre-calculated and pre-stored summaries, kept in the data warehouse to improve query performance.
Aggregation. An attribute-level transformation that reduces the level of detail of available data (for example, having a total quantity by category of items rather than the individual quantity of each item in the category).
Analytic. An application or capability that performs analysis on a set of data.
Application Programming Interface. An interface provided by a software product that enables programs to request services.
Asynchronous messaging. A method of communication between programs in which a program places a message on a message queue, then proceeds with its own processing without waiting for a reply to its message.
Attribute. A field in a dimension table.
BLOB. Binary Large Object, a block of bytes of data (for example, the body of a message) that has no discernible meaning, but is treated as one solid entity that cannot be interpreted.
Commit. An operation that applies all the changes made during the current unit of recovery or unit of work. After the operation is complete, a new unit of recovery or unit of work begins.
© Copyright IBM Corp. 2012. All rights reserved.
Compensation. The ability of DB2 to process SQL that is not supported by a data source on the data from that data source.
Composite key. A key in a fact table that is the concatenation of the foreign keys in the dimension tables.
Computer. A device that accepts information (in the form of digitalized data) and manipulates it for a result based on a program or sequence of instructions on how the data is to be processed.
Configuration. The collection of brokers, their execution groups, the message flows and sets that are assigned to them, and the topics and associated access control specifications.
Connector. See Message processing node connector.
DDL (Data Definition Language). An SQL statement that creates or modifies the structure of a table or database (for example, CREATE TABLE, DROP TABLE, ALTER TABLE, CREATE DATABASE).
DML (Data Manipulation Language). An INSERT, UPDATE, DELETE, or SELECT SQL statement.
Data append. A data-loading technique in which new data is added to the database, leaving the existing data unaltered.
Data cleansing. A process of data manipulation and transformation to eliminate variations and inconsistencies in data content. This is typically to improve the quality, consistency, and usability of the data.
151

Data federation. The process of enabling data from multiple heterogeneous data sources to appear as though it is contained in a single relational database. This can also be referred to distributed access.
Data mart. An implementation of a data warehouse, typically with a smaller and more tightly restricted scope, such as for a department, workgroup, or subject area. This can be independent or derived from another data warehouse environment (dependent).
Data mart - Dependent. A data mart that is consistent with, and extracts its data from, a data warehouse.
Data mart - Independent. A data mart that is standalone and does not conform with any other data mart or data warehouse.
Data mining. A mode of data analysis that has a focus on the discovery of new information, such as unknown facts, data relationships, or data patterns.
Data partition. A segment of a database that can be accessed and operated on independently even though it is part of a larger data structure.
Data refresh. A data-loading technique in which all the data in a database is completely replaced with a new set of data.
Data silo. A standalone set of data in a particular department or organization used for analysis, but typically not shared with other departments or organizations in the enterprise.
Data Warehouse. A specialized data environment developed, structured, shared, and used specifically for decision support and informational (analytic) applications. It is subject-oriented rather than application-oriented, and is integrated, non-volatile, and time variant.
Database instance. A specific independent implementation of a DBMS in a specific environment. For example, there might be an independent DB2 DBMS implementation on a Linux server in Boston supporting the eastern offices, and another separate and independent DB2 DBMS on the same Linux server supporting the western offices. They would represent two instances of DB2.
Database partition. Part of a database that consists of its own data, indexes, configuration files, and transaction logs.
DB connect. Enables connection to several relational database systems and the transfer of data from these database systems into the SAP Business Information Warehouse.
Debugger. A facility on the message flows view in the control center that enables message flows to be visually debugged.
Deploy. Make operational the configuration and topology of the broker domain.
Dimension. Data that further qualifies or describes a measure, such as amounts or durations.
Distributed application In message queuing, a set of application programs that can each be connected to a another queue manager, but that collectively constitute a single application.
Drill-down. Iterative analysis, exploring facts at more detailed levels of the dimension hierarchies.
Dynamic SQL. SQL that is interpreted during execution of the statement.
Engine. A program that performs a core or essential function for other programs. A database engine performs database functions on behalf of the database user programs.
Enrichment. The creation of derived data. An attribute-level transformation performed by some type of algorithm to create one or more new (derived) attributes.
152 Enabling Smarter Government with Analytics to Streamline Social Services

Extenders. These are program modules that provide extended capabilities for DB2 and are tightly integrated with DB2.
FACTS. A collection of measures and the information to interpret those measures in a given context.
Federated data. A set of physically separate data structures that are logically linked together by a mechanism, for analysis, but that remain physically in place.
Federated server. Any DB2 server where the IBM WebSphere® Information Integrator is installed.
Federation. Providing a unified interface to diverse data.
Gateway. A means to access a heterogeneous data source. It can use native access or ODBC technology.
Grain. The fundamental lowest level of data represented in a dimensional fact table.
Instance. A particular realization of a computer process. Relative to database, the realization of a complete database environment.
Java Database Connectivity. An application programming interface that has the same characteristics as ODBC but that is specifically designed for use by Java database applications.
Java Development Kit. Software package used to write, compile, debug, and run Java applets and applications.
Java Message Service. An application programming interface that provides Java language functions for handling messages.
Java Runtime Environment. A subset of the Java Development Kit that allows you to run Java applets and applications.
Materialized query table. A table where the results of a query are stored for later reuse.
Measure. A data item that measures the performance or behavior of business processes.
Message domain. The value that determines how the message is interpreted (parsed).
Message flow. A directed graph that represents the set of activities performed on a message or event as it passes through a broker. A message flow consists of a set of message processing nodes and message processing connectors.
Message parser. A program that interprets the bit stream of an incoming message and creates an internal representation of the message in a tree structure. A parser is also responsible for generatting a bit stream for an outgoing message from the internal representation.
Meta data. Typically called data (or information) about data. It describes or defines data elements.
MOLAP. Multi-dimensional OLAP. Can be called MD-OLAP. It is OLAP that uses a multi-dimensional database as the underlying data structure.
Multi-dimensional analysis. Analysis of data along several dimensions. For example, analyzing revenue by product, store, and date.
Multi-tasking. Operating system capability that allows multiple tasks to run concurrently, taking turns using the resources of the computer.
Multi-threading. Operating system capability that enables multiple concurrent users to use the same program. This saves the overhead of initiating the program multiple times.
Nickname. An identifier that is used to reference the object located at the data source that you want to access.
Node group. Group of one or more database partitions.
ODS. Operational data store. A relational table for holding clean data to load into InfoCubes. This can support some query activity.
Glossary 153

OLAP. Online Analytical Processing. Multi-dimensional data analysis, performed in real-time. Not dependent on underlying data schema.
Open Database Connectivity. A standard application programming interface for accessing data in both relational and non-relational database management systems. Using this API, database applications can access data stored in database management systems on a variety of computers even if each database management system uses a different data storage format and programming interface. ODBC is based on the call level interface (CLI) specification of the X/Open SQL Access Group.
Optimization. The capability to enable a process to execute and perform in such a way as to maximize performance, minimize resource utilization, and minimize the process execution response time delivered to the user.
Partition. Part of a database that consists of its own data, indexes, configuration files, and transaction logs.
Pass-through. The act of passing the SQL for an operation directly to the data source without being changed by the federation server.
Pivoting. Analysis operation in which the user takes a different viewpoint of the results, for example, by changing the way that the dimensions are arranged.
Primary key. The field in a table that is uniquely different for each record in the table.
Process. An instance of a program running in a computer.
Program. A specific set of ordered operations for a computer to perform.
Pushdown. The act of optimizing a data operation by pushing the SQL down to the lowest point in the federated architecture where that operation can be executed. More simply, a pushdown operation is one that is executed at a remote server.
ROLAP. Relational OLAP. Multi-dimensional analysis using a multi-dimensional view of relational data. A relational database is used as the underlying data structure.
Roll-up. Iterative analysis, exploring facts at a higher level of summarization.
Server. A computer program that provides services to other computer programs (and their users) on the same or other computers. However, the computer that a server program runs in is also frequently referred to as a server.
Shared nothing. A data management architecture where nothing is shared between processes. Each process has its own processor, memory, and disk space.
Spreadmart. A standalone, non-conforming, non-integrated set of data, such as a spreadsheet, used for analysis by a particular person, department, or organization.
Static SQL. SQL that has been compiled prior to execution. Typically provides best performance.
Subject area. A logical grouping of data by categories, such as customers or items.
Synchronous messaging. A method of communication between programs in which a program places a message on a message queue and then waits for a reply before resuming its own processing.
Task. The basic unit of programming that an operating system controls. Also see Multi-Tasking.
Thread. The placeholder information associated with a single use of a program that can handle multiple concurrent users. Also see Multi-Threading.
154 Enabling Smarter Government with Analytics to Streamline Social Services

Type mapping. The mapping of a specific data source type to a DB2 UDB data type.
Unit of work. A recoverable sequence of operations performed by an application between two points of consistency.
User mapping. An association made between the federated server user ID and password and the data source (to be accessed) user ID and password.
Virtual database. A federation of multiple heterogeneous relational databases.
Warehouse catalog. A subsystem that stores and manages all the system metadata.
Wrapper. The means by which a data federation engine interacts with heterogeneous sources of data. Wrappers take the SQL that the federation engine uses and maps it to the API of the data source to be accessed. For example, they take DB2 SQL and transform it to the language understood by the data source to be accessed.
xtree. A query-tree tool that allows you to monitor the query plan execution of individual queries in a graphical environment.
Glossary 155

156 Enabling Smarter Government with Analytics to Streamline Social Services

acronyms
ACS Access control system
ADK Archive Development Kit
AIX Advanced Interactive eXecutive from IBM
API Application Programming Interface
AQR Automatic query rewrite
AR Access register
ARM Automatic restart manager
ART Access register translation
ASCII American Standard Code for Information Interchange
AST Application summary table
BLOB Binary large object
CalWIN CalWORKs Information Network
CalWorks California Welfare Opportunities for Kids
CCMS Computing Center Management System
CFG Configuration
CFS Children and Family Services
CIS County Information Server
CLI Call Level Interface
CLOB Character large object
CLP Command-line processor
CPU Central processing unit
CS Cursor stability
DAS DB2 Administration Server
DB Database
DB2 Database 2
DB2 UDB IBM DB2 Universal Database™
DBA Database administrator
Abbreviations and
© Copyright IBM Corp. 2012. All rights reserved.
DBM Database manager
DBMS DataBase Management System
DCE Distributed Computing Environment
DCM Dynamic Coserver Management
DCOM Distributed Component Object Model
DDL Data Definition Language, a SQL statement that creates or modifies the structure of a table or database (for example, CREATE TABLE, DROP TABLE)
DES Data Encryption Standard
DIMID Dimension Identifier
DLL Dynamically Linked Library
DML Data Manipulation Language, an INSERT, UPDATE, DELETE, or SELECT SQL statement
DMS Database Managed Space
DPF Data Partitioning Facility
DSN Data source name
DSS Decision Support System
EAI Enterprise Application Integration
EBCDIC Extended Binary Coded Decimal Interchange Code
EDA Enterprise Data Architecture
EDU Engine dispatchable unit
EDW Enterprise Data Warehouse
EGM Enterprise Gateway Manager
EJB Enterprise Java Beans
157

ER Enterprise Replication
ERP Enterprise Resource Planning
ESE Enterprise Server Edition
ETL Extract, Transform, and Load
ETTL Extract, Transform/Transport, and Load
FP Fix pack
FTP File Transfer Protocol
Gb Giga bits
GB Giga bytes
GUI Graphical user interface
HADR High Availability Disaster Recovery
HDR High availability data replication
HPL High Performance Loader
I/O Input/output
IBM International Business Machines Corporation
IBM DRDA® IBM Distributed Relational Database Architecture™
ID Identifier
IDE Integrated Development Environment
II Information Integrator
ISAM Indexed Sequential Access Method
ISV Independent software vendor
IT Information Technology
ITR Internal throughput rate
ITSO International Technical Support Organization
IX Index
J2EE Java 2 Platform Enterprise Edition
JAR Java Archive
JDBC Java DataBase Connectivity
JDK Java Development Kit
JE Java Edition
JMS Java Message Service
JRE Java Runtime Environment
JVM Java Virtual Machine
KB Kilobyte (1024 bytes)
LDAP Lightweight Directory Access Protocol
LPAR Logical partition
LV Logical volume
Mb Mega bits
MB Mega bytes
MDC Multidimensional clustering
MPP Massively parallel processing
MQI Message queuing interface
MQT Materialized query table
MR Management reporting
MRM Message Repository Manager
NPI Non-Partitioning Index
O/S Operating system
ODBC Open Database Connectivity
ODS Operational data store
OLAP OnLine Analytical Processing
OLE Object linking and embedding
OLTP Online transaction processing
ORDBMS Object Relational DataBase Management System
OS Operating system
PDS Partitioned data set
POC Proof of concept
PSA Persistent staging area
RBA Relative byte address
RDBMS Relational Database Management System
RID Record identifier
RR Repeatable read
RS Read stability
158 Enabling Smarter Government with Analytics to Streamline Social Services

SCB Session control block
SDK Software Developers Kit
SID Surrogage Identifier
SMIT Systems Management Interface Tool
SMP Symmetric MultiProcessing
SMS System Managed Space
SOA Service-oriented architecture
SOAP Simple Object Access Protocol
SPL Stored Procedure Language
SQL Structured query
SSA Social Services Agency
SSIRS Social Services Integrated Reporting System
TANF Temporary Assistance for Needy Families (the Federal version of CalWorks)
TCB Thread control block
TMU Table Management Utility
TS Tablespace
UDF User-defined function
UDR User-defined routine
URL Uniform Resource Locator
VG Volume group (Raid disk terminology)
VLDB Very large database
VP Virtual processor
VSAM Virtual Sequential Access Method
VTI Virtual Table Interface
WSDL Web Services Definition Language
WWW World wide web
XBSA X-Open Backup and Restore APIs
XML EXtensible Markup Language
Abbreviations and acronyms 159

160 Enabling Smarter Government with Analytics to Streamline Social Services
Related publications
The publications listed in this section are considered particularly suitable for a more detailed discussion of the topics covered in thisbook.
IBM Redbooks
For information about ordering these publications, see “How to get Redbooks” on page 162. Note that some of the documents referenced here may be available in softcopy only.
� Enterprise Data Warehousing with DB2 9 for z/OS, SG24-7637
� InfoSphere Warehouse: A Robust Infrastructure for Business Intelligence, SG24-7813
� IBM Cognos Business Intelligence V10.1: Intelligence Unleashed, REDP-4693
Other publications
This publication is also relevant as a further information source:
� Sampson, User Adoption Strategies: Shifting Second Wave People to New Collaboration Technology (2010), The Michael Sampson Company, 2010, ISBN 047316907X
Online resources
These websites are also relevant as further information sources:
� Alameda County Social Services Agency recognized in the Computerworld Honors Program:
http://cwhonors.org/viewCaseStudy2010.asp?NominationID=249&Username=acssassirs
� IBM InfoSphere Change Data Capture Management Console, Version 6.5 - Administration Guide:
http://http://publib.boulder.ibm.com/infocenter/cdc/v6r5m1/index.jsp
© Copyright IBM Corp. 2012. All rights reserved. 161

How to get Redbooks
You can search for, view, or download Redbooks, Redpapers, Technotes, draft publications and Additional materials, as well as order hardcopy Redbooks publications, at this Web site:
ibm.com/redbooks
Help from IBM
IBM Support and downloads
ibm.com/support
IBM Global Services
ibm.com/services
162 Enabling Smarter Government with Analytics to Streamline Social Services
Index
Aaddress validation 129, 136architecture, solution 54
BBalanced Configuration Unit (BCU) 80Bush Deficit Reduction Act 19business intelligence viiiBusiness Value Assessment (BVA) 101
CCalWIN Management Reports (MR) 27Case Management Information and Payroll System (CMIPS) 32Case Management System
integrating 125Casey Foundation 20Chores 34client IDs 50Cognos 88–89, 97compliance checks 52Connectivity and Interoperability Layer 123County Welfare Directors Association (CWDA) 19CWS/CMS reports 38
Ddata
analyzing 62cleansing 25extracting 31, 49, 58, 64, 66from disparate sources 47integration 46, 48loading 64, 68loads, frequency 60mart 53platforms 59preparation 46preparing 54relationships 50repository 46, 52requirements 46sources 56, 59
© Copyright IBM Corp. 2012. All rights reserved.
standardization 129, 136transformation 49transforming 64, 66–67warehousing 55
data extraction tools 59data integration issues 49data mart 53data repository 46, 52data store (ODS) tables 48data type compatibility issues 49data warehousing viiidates and timestamps 62DB2 LOAD commands 68Deficit Reduction Act of 2005 16
EEAS
data source account values 49database 48–49, 68entity IDs 61, 65pipelines 68processing 67staging area 71staging tables 68, 71
EAS data source accounts 61EAS database 48Enterprise Data Warehouse (EDW) 53Entity Analytics Solution (EAS) 60–61, 65, 67Extract, Transform and Load (ETL) 64, 69extracting SSIRS datadata 66
FFamily Educational Rights and Privacy Act (FERPA) 21fraud detection 51, 102frequency of data loads 60
GGlobal Name Recognition 126, 129
HHealth Care Services Agency (HCSA) 101
163
Health Insurance Portability and Accountability Act (HIPAA) 21hidden relationships 51
IIBM FileNet P8 Federated Catalog 132IBM FileNet® Content Manager Federation Services 132IBM Government Industry Framework 115IBM InfoSphere Balanced Warehouse (IBW) 79IBM InfoSphere Entity Analytics Solutions (EAS) da-tabase 48IBM InfoSphere Global Name Recognition 129, 136IBM InfoSphere Identity Insight 20, 129, 136IBM InfoSphere Master Content Server for IBM Info-Sphere MDM Server 132IBM InfoSphere MDM Server 129, 132IBM InfoSphere QualityStage 129, 136Identity Analytics Services 124Identity and relationship analytics (IRA) 51Identity Insight 73, 75–76IHSS (In-Home Supportive Services) reports 35Information Integration Services 124
LLOAD commands 68
MMaster Data Management (MDM) Services 123Master Data Management, implementation styles 124Master Data Repository 123
Nnational security 127
OOnline Transaction Processing (OLTP) 73Operational Data Store (ODS) 53, 55, 75, 78, 83
PPII (personal identification information) 61probabilistic matching 129, 136Program Integrity Division (PID) 102Proof of Concept (POC) 19
RRedbooks Web site 162Redbooks website
Contact us xiirelationships, hidden 51reports
CalWIN Management Reports (MR) 27Case Management Information and Payroll Sys-tem (CMIPS) 32case management systems 27Chores 34creating from extracts 28CWS/CMS 38generating 28, 83IHSS (In-Home Supportive Services) 35samples 90, 92–93Supervisor Case List 35
Ssecurity, national 127service-oriented architecture (SOA) 114Single View of a Citizen 7, 113, 118–119Single View of a Citizen Architecture Building Block (SVoC ABB) 119–121Smarter Planet 1, 8solution architecture 54staging area, EAS 71staging tables, EAS 71Supervisor Case List report 35SVoC ABB
core technologies 128integrating a Case Management System 125manage taxpayer data 135MDM service 132national security 127trusted access to data 131visa application process 127
TTalend 67–68, 70taxes, electronic filing of 135taxpayer data 135timestamps and dates 62Title IV-E (Child Welfare) Waiver 17, 100, 104transforming data 64
164 Enabling Smarter Government with Analytics to Streamline Social Services

UUniversal Message Format (UMF) 65
Vvisa application process, implementing 127Visual Basic subroutine for data extraction 49Voice Response Unit (VRU) 101
WWork Participation Rate (WPR) 100
improving 16
Index 165

166 Enabling Smarter Government with Analytics to Streamline Social Services

Enabling Smarter Governm
ent with Analytics to Stream
line
Enabling Smarter Governm
ent w
ith Analytics to Streamline
Enabling Smarter Governm
ent w
ith Analytics to Streamline
Social Services
Enabling Smarter Governm
ent with Analytics to Stream
line Social Services

Enabling Smarter
Government w
ith Analytics to Stream
line
Enabling Smarter
Government w
ith Analytics to Stream
line

®
SG24-7903-00 ISBN 0738436496
INTERNATIONAL TECHNICALSUPPORTORGANIZATION
BUILDING TECHNICALINFORMATION BASED ONPRACTICAL EXPERIENCE
IBM Redbooks are developed by the IBM International Technical Support Organization. Experts from IBM, Customers and Partners from around the world create timely technical information based on realistic scenarios. Specific recommendations are provided to help you implement IT solutions more effectively in your environment.
For more information:ibm.com/redbooks
®
Enabling Smarter Government with Analytics to Streamline Social Services
Building a flexible infrastructure for growth
Integrating social services data sources
Tracking effectiveness of programs
In this IBM Redbooks publication we describe a centralized reporting and alerting system for governmental social service organizations. We include information about how to integrate key IBM building blocks to bring social services data sources together into an effective structure that allows for reporting on key metrics required by higher levels of government to help secure funding for reporting on the effectiveness of the various social service programs, and to give case workers and care providers quick and easy access to all the services ever provided to a person and their family, which can aid in the reduction of duplicate persons, and therefore, payments, in addition to reducing fraud and abuse of social services funds.
The target customers for this solution are state or county social service organizations responsible for services, such as these:
� Caring for the welfare of children � Caring for the adult and aging� Getting people back to work who have fallen on hard times
The intent of this book is to provide information to help with building your own similar system. We have also included an appendix containing information about the IBM Government Industry Framework and services for additional guidance and use.
Back cover