enabling indoor location-based services using ultrasound
TRANSCRIPT

Enabling Indoor Location-based Services Using
Ultrasound
by
Tayyab Javed
A thesis submitted to the
School of Computing
in conformity with the requirements for
the degree of Master of Science
Queen’s University
Kingston, Ontario, Canada
January 2013
Copyright c© Tayyab Javed, 2013

Abstract
In the context of location, large amounts of information are available on the Internet
to be accessed by people via different devices. However, at times people have to
manually search and access it. If the space where location-based services are available
can be identified by hand-held devices, people can be prompted with services available
around them. This thesis explores the use of ultrasound as a communication medium
to tag such spaces and access location-based services with the related information; and
demonstrates the indoor implementation of the prototype of a location-based services
enabling system for hand-held devices. This system allows users to search and access
the available services in their surroundings through their hand-held devices. A beacon
generator placed in the service location broadcasts a service code mappable to the
services particular to that location encoded in an ultrasound signal. The hand-held
device can identify this signal and prompt the user with available services. System
design and architecture is demonstrated and the viability of the system is tested
through a variety of environments and scenarios showing that potentially this has
both a wide range of applications and can enhance the way people access location-
based services.
i
Acknowledgments
I would like to thank my supervisor, Dr. Hossam Hassanien for his expert guidance,
understanding, patience and support through out my graduate program. I would also
like to thank him for being open minded and encouraging me to shape my ideas.
I would like to thank Dr. Kashif Ali for his invaluable suggestions and ideas along
the road. Without his assistance this study would not have been successful.
I would also like to thank my defense committee Dr. Aboelmagd Noureldin, Dr.
Bob Crawford, Professor and Dr. James Stewart for their valuable input.
I also want to thank Queens Telecommunications Research Lab’s Research Coor-
dinator, Basia Palmer for her support and never ending encouragement.
I would like to thank my family, especially my mother and father for always
believing in me, for their continuous love and their supports.
My greatest appreciation and friendship goes to my friend, Ali Ejaz, who was
always a great support in all my struggles and frustrations in my new life and studies
in this country
ii

List of Acronyms
ABG Audio Beacon GeneratorAPI Application Programming InterfaceARM Advanced RISC MachineASK Amplitude-Shift KeyingFSK Frequency-Shift KeyingGPS Global Positioning SystemGUI Graphical User InterfaceHTML HyperText Markup LanguageIP Internet ProtocolIR InfraredLAN Local Area NetworkLBS Location-based ServiceLED Light-emitting diodeMAC Media Access ControlLBS-ES Location-Based Service Enabling SystemNFC Near field communicationQR Code Quick Response CodeRAM Random-access memoryRFID Radio-frequency identificationRSS Received Signal StrengthRSSI Received signal strength indicationSQL Structured Query LanguageTCP Transmission Control ProtocolTOA Time of ArrivalURL Uniform Resource LocatorWLAN Wireless LAN
iii

Contents
Abstract i
Acknowledgments ii
List of Acronyms iii
Contents iv
List of Tables vi
List of Figures vii
Chapter 1: Introduction 11.1 Motivation . . . . . . . . . . . . . . . . . . . . . . . . . . . . . . . . . 21.2 Objective . . . . . . . . . . . . . . . . . . . . . . . . . . . . . . . . . 21.3 Organization of Thesis . . . . . . . . . . . . . . . . . . . . . . . . . . 3
Chapter 2: Background and Related Work 42.1 Location-based service (LBS) . . . . . . . . . . . . . . . . . . . . . . 52.2 Localization . . . . . . . . . . . . . . . . . . . . . . . . . . . . . . . . 6
2.2.1 Wi-Fi (IEEE 802.11) . . . . . . . . . . . . . . . . . . . . . . . 72.2.2 RFID . . . . . . . . . . . . . . . . . . . . . . . . . . . . . . . 92.2.3 Bluetooth . . . . . . . . . . . . . . . . . . . . . . . . . . . . . 102.2.4 Ultrasound . . . . . . . . . . . . . . . . . . . . . . . . . . . . 10
2.3 Applications of LBS . . . . . . . . . . . . . . . . . . . . . . . . . . . 142.3.1 Outdoor LBS . . . . . . . . . . . . . . . . . . . . . . . . . . . 142.3.2 Indoor LBS . . . . . . . . . . . . . . . . . . . . . . . . . . . . 16
Chapter 3: LBS-ES: Location-Based Service Enabling System 203.1 Introduction . . . . . . . . . . . . . . . . . . . . . . . . . . . . . . . . 203.2 Motivation, Problem and Objective . . . . . . . . . . . . . . . . . . . 213.3 System Architecture . . . . . . . . . . . . . . . . . . . . . . . . . . . 23
iv

3.4 Ultrasound Communication Algorithm . . . . . . . . . . . . . . . . . 253.4.1 Sound in closed space . . . . . . . . . . . . . . . . . . . . . . . 263.4.2 Encoding Algorithm . . . . . . . . . . . . . . . . . . . . . . . 273.4.3 Decoding Algorithm . . . . . . . . . . . . . . . . . . . . . . . 34
3.5 System Components . . . . . . . . . . . . . . . . . . . . . . . . . . . 353.5.1 Audio Beacon Generator . . . . . . . . . . . . . . . . . . . . . 353.5.2 Mobile device . . . . . . . . . . . . . . . . . . . . . . . . . . . 423.5.3 Back-end server . . . . . . . . . . . . . . . . . . . . . . . . . . 443.5.4 ABG Configuration Console . . . . . . . . . . . . . . . . . . . 45
3.6 System Execution Process . . . . . . . . . . . . . . . . . . . . . . . . 463.7 Potential Applications . . . . . . . . . . . . . . . . . . . . . . . . . . 48
Chapter 4: Implementation and Evaluation 504.1 Implementation details . . . . . . . . . . . . . . . . . . . . . . . . . . 50
4.1.1 Audio Beacon Generator (ABG) . . . . . . . . . . . . . . . . . 504.1.2 Mobile Client Application . . . . . . . . . . . . . . . . . . . . 524.1.3 Server . . . . . . . . . . . . . . . . . . . . . . . . . . . . . . . 534.1.4 ABG Configuration Console . . . . . . . . . . . . . . . . . . . 53
4.2 Evaluation Scenarios . . . . . . . . . . . . . . . . . . . . . . . . . . . 534.2.1 Single ABG . . . . . . . . . . . . . . . . . . . . . . . . . . . . 544.2.2 Multiple ABGs . . . . . . . . . . . . . . . . . . . . . . . . . . 55
4.3 Performance Metrics . . . . . . . . . . . . . . . . . . . . . . . . . . . 574.4 System Evaluation Results . . . . . . . . . . . . . . . . . . . . . . . . 60
4.4.1 Single ABG . . . . . . . . . . . . . . . . . . . . . . . . . . . . 614.4.2 Multiple ABGs . . . . . . . . . . . . . . . . . . . . . . . . . . 644.4.3 Algorithmic Configuration . . . . . . . . . . . . . . . . . . . . 68
Chapter 5: Summary and Conclusions 725.1 Summary . . . . . . . . . . . . . . . . . . . . . . . . . . . . . . . . . 725.2 System Limitations and Future Work . . . . . . . . . . . . . . . . . . 735.3 Concluding Remarks . . . . . . . . . . . . . . . . . . . . . . . . . . . 74
Bibliography 76
v
List of Tables
2.1 Hearing Range(Recreated from [1]) . . . . . . . . . . . . . . . . . . . 11
3.1 Frequency usage . . . . . . . . . . . . . . . . . . . . . . . . . . . . . . 30
4.1 Communication errors (in percentage) for the single ABG Case 1 . . 61
4.2 Average discovery time for the single ABG Case 1 . . . . . . . . . . . 62
4.3 Communication errors (in percentage) for the single ABG Case 2 . . 62
4.4 Average discovery time for the single ABG Case 2 . . . . . . . . . . . 63
4.5 Average discovery time for the single ABG Case 3 . . . . . . . . . . . 63
4.6 Communication errors (in percentage) for the single ABG Case 3 . . 64
4.7 Communication errors (in percentage) for the multiple ABGs Case 1 . 65
4.8 Average discovery time for the multiple ABGs Case 1 . . . . . . . . . 65
4.9 Communication errors (in percentage) for the multiple ABGs Case 2 . 66
4.10 Average discovery time for the multiple ABGs Case 2 . . . . . . . . . 67
4.11 Average discovery time for the multiple ABGs Case 3 . . . . . . . . . 67
4.12 Communication errors (in percentage) for the multiple ABGs Case 3 . 68
vi
List of Figures
2.1 Android LBS Apps by Category (reproduced from [2]) . . . . . . . . 7
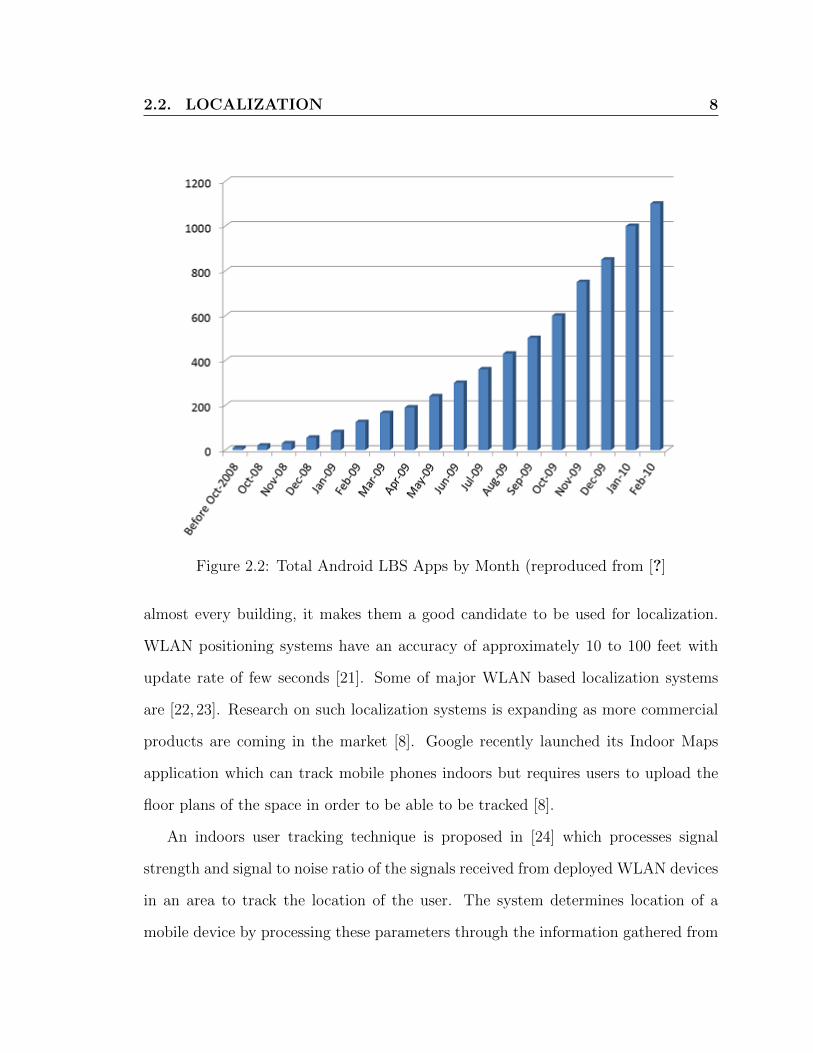
2.2 Total Android LBS Apps by Month (reproduced from [?] . . . . . . . 8
3.1 System Architecture . . . . . . . . . . . . . . . . . . . . . . . . . . . 24
3.2 System Architecture and Communication . . . . . . . . . . . . . . . . 26
3.3 Sample Audio Data Packet Waveform Carrying Bits ”11” . . . . . . . 29
3.4 High frequency spectrum of Samsung Galaxy S II . . . . . . . . . . . 30
3.5 Frequency response of Samsung Galaxy S II for 20 kHz . . . . . . . . 31
3.6 Acoustic spectrograph of Samsung Galaxy S II during service scan . . 32
3.7 Audio Beacon Generator . . . . . . . . . . . . . . . . . . . . . . . . . 38
3.8 Message Passing and Operation Flow in Individual Mode . . . . . . . 40
3.9 Message Passing in Group Mode . . . . . . . . . . . . . . . . . . . . . 41
3.10 Speaker . . . . . . . . . . . . . . . . . . . . . . . . . . . . . . . . . . 42
3.11 Client Application Interface . . . . . . . . . . . . . . . . . . . . . . . 43
3.12 ABG Configuration Console GUI . . . . . . . . . . . . . . . . . . . . 45
3.13 ABG Configuration Console GUI with 1st Person View Mode . . . . 46
4.1 Message Passing and Operation Flow During Configuration . . . . . . 52
4.2 Map of the area showing measured spots for multiple ABGs case 1 . . 56
4.3 Map of the area showing measured spots for multiple ABGs case 2 . . 57
vii

4.4 Map of the area showing measured spots for multiple ABGs case 3 . . 58
4.5 Communication Error for the room scenario for algorithm test cases . 69
4.6 Average Time of Discovery for the room scenario for algorithm test cases 69
4.7 Communication Error for the hallway scenario for algorithm test cases 70
4.8 Average Time of Discovery for the hallway scenario for algorithm test
cases . . . . . . . . . . . . . . . . . . . . . . . . . . . . . . . . . . . . 71
viii

1
Chapter 1
Introduction
Advancements in mobile computing and telecommunications have led to a wide range
of services and functions pervasively available to mobile users. The use of outdoor
location-based services associated with GPS has become phenomenal. However, in-
door location-based services are limited, yet they have great potential for many useful
applications. Imagine a device with the ability to sense the presence of users in its
surroundings and that can trigger multiple events based on users’ choices and needs.
These triggered events will present the user new possibilities of accessing the infor-
mation related to their location via their mobile device. For example, as a user enters
a building, at the entrance a device senses his presence and sends information about
the building to his mobile device. In the same way as a user enters his home, a mobile
phone can identify the location and forward this information to a server, which in
turn can control the music, start up the computer, update his location status on social
networks, start warming up the coffee and so forth. This thesis explores the imple-
mentation and prototyping of technology that enables such an indoor location-based
service, using ultrasound.

1.1. MOTIVATION 2
1.1 Motivation
Mobile phones are seamlessly integrated into our daily routine [3]. There are a huge
number of functions and services that can be accessible through mobile phones. Fur-
thermore, a user-friendly interface can allow access to the digital information via
mobile phones making it an informative hub of daily life activities. Whether text
messaging, checking emails, getting updated about events, using social networks,
playing games, listening to music and radio channels, making important notes and
scheduling activities, navigating to different locations, looking for coffee shops, etc.
Although technologies such as QR Code, NFC and Wi-Fi are contributing to the
ease of interaction between the user and his environment, there are some limitations
which are discussed in 2.2. This research targets these limitations to ease the pro-
cess of service discovery for users carrying mobile devices in indoor environments. It
aims to achieve device or person tracking as well as facilitating users in buildings in
searching and using digital services around them. In the system presented in this
research, ultrasound waves are used to broadcast information that when received by
a mobile device can be mapped to a location, enabling a variety of services, taking a
step towards realization of Ambient Intelligence [4].
1.2 Objective
The interaction of the user and his environment can be enhanced by using devices
and technologies that are easily accessible. This thesis proposes the design and im-
plementation of a system named Location-Based Service Enabling System (LBS-ES),
that enables the use of mobile devices to discover and interact with indoor-location-
based services pervasively. It explores the viability of defining and identifying indoor

1.3. ORGANIZATION OF THESIS 3
boundaries using ultrasound and hand-held devices.
1.3 Organization of Thesis
The remainder of the thesis is organized as follows. Chapter two reviews the need for
an indoor location-based service enabling system and discusses the work done in the
related fields, as well as weaknesses of current generation location-based applications.
Chapter three presents the practical design of the system and potential applications
of the system are discussed. Implementation details along with test cases and results
appear in Chapter four. Chapter five summarizes the thesis, outlines the system
limitations and future work.
4
Chapter 2
Background and Related Work
“The most profound technologies are those that disappear. They weave themselves
into the fabric of everyday life until they are indistinguishable from it.” [5] are the
starting lines of the paper in which Mark Weiser introduced the term ”Ubiquitous
computing”. Ubiquitous computing is a concept of integrating objects in our daily
routine with computing so thoroughly that the computers seem to be hidden and ab-
sent. This concept has been partially realized with the emergence of mobile computing
and the variety of small sized devices with embedded computers which streamline our
interaction with our surroundings.
It is of primary importance to know the whereabouts of users in the context of
location-based services. This can be achieved by identifying the space user is currently
present in. For outdoor environments, Global Positioning System (GPS) can provide
the location information anywhere around the globe, but for indoor environments
GPS is not reliable as the signals from the satellites scatter off the building walls
and do not penetrate through them. Indoor space identification can benefit users by
automatically connecting their mobile phones to the services around them as well as
helping service providers to promote and broadcast their services in more accessible

2.1. LOCATION-BASED SERVICE (LBS) 5
ways.
The importance and application of a system that allows location tracking of mobile
devices in indoor environments is increasing as our mobile devices are becoming more
user-friendly and support an ever growing set of features. Mobile phones are taking
over the computing platform worldwide [6] as the majority of Internet users choose
mobile phones to access different services. This makes research in this field more
significant. Though there have been many techniques and solutions developed for
indoor mobile localization, most are not commonly accessible.
2.1 Location-based service (LBS)
Location-based service (LBS) can be defined as, “LBSs are information services ac-
cessible with mobile devices through the mobile network and utilizing the ability to
make use of the location of the mobile device.” (Virrantaus et al. 2001)
The sense of location of the user adds a new dimension to the interaction of
users and services, creating a new paradigm for a wide variety of applications and
potentially enhancing every other mobile or Internet service. Applications of such
services have found their way in a wide variety of areas ranging across navigation from
one place to another [7, 8], check-in services and social applications [7, 9], games [10,
11] in which game logic and objectives are affected by the location of the player,
emergency services [12], hospitals [13] and museums [14].
There are four basic components of a location-based service [15]:
Mobile Device A hand-held wireless device that enables the users to interface with
the service.

2.2. LOCALIZATION 6
Communication Medium A communication channel that can be used to transfer
the requested information to the user from the service provider’s data collection.
Positioning Component A component that can determine location.
Content Provider An accessible collection of information that the service provider
provides as required via the communication medium.
Mobile devices have now become ubiquitous. Mobile phones carry computational
power and variety of in-built sensors for different functionalities that enhance the vir-
tual connection between the user and his surroundings [16]. This opens new gateways
for location-based services. There are over 1,000 location-based applications available
on Google Play Store and over 6,400 applications on IPhone App Store [2]. Figure 2.1
of LBS on Android based categories shows how versatile the location-based services
are. Figure 2.2 shows the growth of LBS applications on the Android operating sys-
tem. Swedish analysts from Berg Insight forecast a growth of the LBSs revenues in
Europe from 220 million in 2009 at a compound annual growth rate of 12% to reach
420 million in 2015 [17].
2.2 Localization
Localization is a mechanism of determining the location of a device. Outdoors lo-
calization is achieved using GPS. However, no solid technology is readily available
for indoor localization. Significant research has been done in the last two decades in
indoor localization of portable devices to provide location aware applications. Many
of the solutions and techniques developed for mobile localization resolve the issue in
different ways, targeting different applications, see reference [18].

2.2. LOCALIZATION 7
Figure 2.1: Android LBS Apps by Category (reproduced from [2])
Many of the current generation of indoor localization applications use nearby Wi-
Fi devices as reference nodes and use their information in methods like triangulation
to detect a device’s location. These techniques can achieve an accuracy to within
a meter( [19]. Such indoor localization techniques rely on site surveys which can
be time consuming and labor intensive [16]. The extensive feature set of current
generation mobile phones provides even more ways to perform localization [20]. The
most common indoor mobile localization techniques are reviewed below.
2.2.1 Wi-Fi (IEEE 802.11)
Wireless LAN has become a very popular wireless local networking solution in public
areas, offices, hospitals, universities, etc. [21]. As WLAN modems can be found in
2.2. LOCALIZATION 8
Figure 2.2: Total Android LBS Apps by Month (reproduced from [?]
almost every building, it makes them a good candidate to be used for localization.
WLAN positioning systems have an accuracy of approximately 10 to 100 feet with
update rate of few seconds [21]. Some of major WLAN based localization systems
are [22, 23]. Research on such localization systems is expanding as more commercial
products are coming in the market [8]. Google recently launched its Indoor Maps
application which can track mobile phones indoors but requires users to upload the
floor plans of the space in order to be able to be tracked [8].
An indoors user tracking technique is proposed in [24] which processes signal
strength and signal to noise ratio of the signals received from deployed WLAN devices
in an area to track the location of the user. The system determines location of a
mobile device by processing these parameters through the information gathered from

2.2. LOCALIZATION 9
the offline phase. In offline phase, a reference data is prepared by recording the
information of received signals in the operating area. In an experimental scenario,
three base stations were placed on a floor of an area 10548 square feet containing
more than 50 rooms and the location of a laptop was tracked. The median error
distance of the system recorded was 6.5 to 10 feet.
A WiFi based system is easy to deploy and setup because it can use already de-
ployed WLAN devices and requires few access points to calculate location however,
fingerprinting is required before operating the system. There is a private issue be-
cause the location of the user is determined on the base station, which may use that
information without permission of the user.
2.2.2 RFID
Significant research has been conducted to use RFID for indoor localization [25–28].
Reference [27] provides a prototype system for indoor location sensing using RFID
technology in which the object or the person to be tracked carries an active RFID
tag with unique 7-character ID. RFID readers are carefully installed in the tracked
area, at known locations as they detect the signals from the RFID tags in their range.
That information is then processed on a server to calculate the location of the tags.
Each reader can detect up to 500 tags in 7.5 seconds. In some experiments [27] 4
RFID readers were installed in a lab with 16 reference tags 8 tags to be tracked. The
results show error distance of around 1 meter with maximum error distances less than
6.5 feet. However, in this system, the users have to use RFID tags.

2.2. LOCALIZATION 10
2.2.3 Bluetooth
Bluetooth enables communication between supported devices with a range of 328
feet. Many mobile devices have in-built Bluetooth technology [1]. Several Bluetooth
based indoor localization techniques have been researched [29–32]. Authors in [33]
provide an indoor localization system using Bluetooth technology. The system has
an average accuracy of 6.5 to 10 feet with more than 95% reliability, the time delay
to calculate the location is from 15 to 30 seconds. The system is compatible with
any device with built-in Bluetooth chipset. Overall the system is accurate enough for
room level proximity detection but the time required to detect the location is more
than what most applications would require.
2.2.4 Ultrasound
Ultrasound can be used to identify the location of a user in a room. As the human
ear does not respond to ultra-sound frequencies (frequencies higher than 20kHz), the
signals will be inaudible. The hearing range of a young person is 20 Hz to 20 kHz [34].
The range of a middle-aged adult is 12 Hz to 14 kHz as the hearing range gradually
decreases with age. Audible range of some of the animals is shown in the table 2.1.
Advantages of using sound to identify the location of the user
Sound can be used to locate a user within a room level context.
• It can provide more control over the range of transmission.
• Transmission is confined by walls limiting the signals in a an enclosed area.

2.2. LOCALIZATION 11
Table 2.1: Hearing Range(Recreated from [1])
Species Low Frequency (Hz) High Frequency (Hz)Cats 100 32,000Humans 20 20,000Dogs 40 46,000Elephants 16 12,000Bats 1,000 150,000Grasshoppers 100 50,000Rodents 1,000 100,000Whales 70 200,000
• No extra hardware is required as almost every hand-held device has integrated
speakers and microphones.
• Beacons can be manufactured to produce ultra-sound signals at little cost.
• The behavior of sound is much more predictable than IR and radio waves. IR
needs direct line of sight and does not work in sunlight and under bright lights
Radio waves on the other hand can be adversely affected by interferences and
cannot pass through metal objects [1].
Disadvantages of using sound to identify the location of the user
Sound also has some disadvantages when used for detection of short pulses. Speed
of sound is 984 feet/second in air which is relatively slow and it bounces off the solid
objects. The original signal is scattered in the environment due to reflections of the
pulses. This causes multiple copies of the same signal to reach the target with different
delays, making it difficult to identify the original signal. An environment which
enhances such reflections can cause the effect of reverberation, making the signal stay
in the environment for a relatively longer time which might cause interference with

2.2. LOCALIZATION 12
other signals. To solve this problem longer pulses are generated to have successful
communications.
Medical concerns of ultrasound
Ultrasound signals from 20,000 Hz to 50,000 Hz are not harmful to humans if trans-
mitted at low levels. In normal office environments, most noises lie between 20 kHz
and 22 kHz region of audio spectrum.
Ultrasound is suitable for indoor localization since the signals cannot penetrate
through walls. Many indoor localization systems are based on ultrasound [35–37]. A
localization system Active Bat [35], provides 3-D position and orientation information
of tracked tags. Tags periodically broadcast ultrasound signals which are detected
by sensor grid installed in the ceiling of the tracked area. The sensor grid forwards
the information of the signals to a centralized server which calculates the location of
the tag using multilateration techniques. It can track a tag with accuracy up to 9
cm. However, such a system is not scalable or easy to deploy because of the dense
sensor grid required to be installed on the ceiling. Also users have to wear a tag
to be traceable. The position of the user is calculated on a centralized server which
might cause privacy issues and there is no direct way of sending any data to the tag
if further information is required. Such a system can only be used to track a group
of people inside a building and the types of services compatible with such a system
are limited.
A system is described in [36] that tracks users in a building and enables applica-
tions based on their location. Each person carries a small sensor tag which identifies
2.2. LOCALIZATION 13
their location in the system. The location is calculated using multilateration algo-
rithm from information gathered from signals that are broadcasted by the tag and
received by the ultra-sound receiver, installed in the ceiling at known locations. In an
application, desktop session of the users machine is transfer to the nearest machine
as he moves in the building. In another application, the system covers an area of
1000 sq.m on three floors with 720 receivers and positions of up to 75 objects can be
determined each second with accuracy of 3 centimeters in 3D.
In another ultrasound based system [38] a scheme of audio networking for context
aware computing [39] is described. The scheme uses ultrasound signals to enable
variety of devices to communicate and share URLs, IP addresses, notes, etc. to
enable different types of applications. In a test performed in an office, accuracy of
95% was recorded while two devices (11 feet apart) shared 172 16-bit identifiers with
transfer rate of 8 bits/s in normal office conditions and background noise. One laptop
and a desktop computer were used to process the audio communication. In our system
we attempt to achieve higher transfer rates and allow hand-held devices to be able to
use ultrasound as an incoming communication channel as well. Data transfer rate of
our system using ultrasound is 24 bits/s under typical background noise.
In another application with the same system [38], a laptop automatically config-
ures itself to use the nearest printer in a room as it moves in a building. A beacon
placed in each room broadcasts a unique room identifier in every 15 seconds. Each
identifier takes 3.5 seconds to be broadcasted. The performance of such a system can
be very helpful but it can be modified to work better for quicker location identifica-
tion. In our system a smartphone takes average of 2 seconds to identify the room.
2.3. APPLICATIONS OF LBS 14
Research in [40] describes some experiments to achieve wireless device communica-
tion with audible sound. The research explores the possibilities making audible data
signals pleasant and rhythmic. The experiments show data rate of range 100 to 1000
bits/second using variations of B-ASK and M-FSK modulations. Our system is de-
signed to use ultrasound for communication, constraining us to a small bandwidth of
20 kHz to 22 kHz. This limits us to use a smaller amount of coding frequencies. The
amount of signal processing is also important to be considered for mobile computing.
2.3 Applications of LBS
Location-based services can be mainly categorized into outdoor and indoor services.
In the next section we discuss the major applications of outdoor and indoor LBS
of current generations. These applications determine the location of the user via a
variety of means depending on the type of service.
2.3.1 Outdoor LBS
For outdoor services, the location of the user is commonly determined by technologies
like GPS, Enhanced 911 (E911) and service provider’s network.
Applications of Outdoors LBS
Navigation waze [17] is a LBS focused on community based traffic navigation avail-
able on mobile devices. It connects nearby drivers in a unique way to provide them
with the information about the road conditions and aids them in navigation. Every
driver can report traffic conditions and accidents to the community via a mobile ap-
plication. This aids neighbour drivers to avoid the road blocks and drive through the

2.3. APPLICATIONS OF LBS 15
fastest route. It also supports features like searching for the cheapest gas station on
the route. The service uses GPS of the mobile phone to locate and navigate users.
Social Networking Foursquare [7] is a social location-based service that allows
users to check-in and share their location with their friends on social networks. It
uses GPS to determine the location of the user and also features auto check-in features.
Since GPS is not very accurate and does not work properly in buildings, it can not
correctly identify users location to automatically check-in. In such scenarios users
have to manually check-in to the venues. The service uses GPS in the background to
track the user’s location, it can quickly drain the battery of the mobile phones.
Shopping Sprooki [41] is shopping based LBS that enables shoppers to find latest
deals near them via a mobile application. Malls and retailers send the location tar-
geted messages to the shoppers outside the mall via the service to provoke sales. As
the service is targeted for outdoor services, it determines users location via mobile
phones’s GPS. Customers can also purchase products directly and securely through
mobile phones. Similar to the social application, continuous use of GPS in the back-
ground can quickly drain mobile phone’s battery.
Google Shopper [42] and Goodzer [43] are similar local shopping services that allow
users to search for products in the nearby local stores. Groupon [44], LivingSocial [45]
and Google Offers [46] are similar services which offer daily deals to the user depending
on their location.
News and Weather There are various applications [47, 48] of location-based ser-
vices for news and weather information. These applications use GPS or information
2.3. APPLICATIONS OF LBS 16
from the network service provider to estimate the location of the users and provide
them with their local weather forecast and news updates.
Fitness Endomondo [49] is a community based outdoor sports tracking application
for mobile phones. It uses GPS to track its users as they perform outdoor activities
so that it can be analyzed. It also features newsfeed from recent activities done by
the user and his friends and allows them to compete with each other.
Emergency and Safety A public safety service Enhanced 911 [50] allows its cus-
tomers to report an emergency via phones. It enhances efficiency of the emergency
services by being able to determine the location of the dialer. It can determine the
location via variety of technologies like triangulation and assisted GPS.
Games There are variety of video games with location-based features challenging
players with location oriented tasks. SCVNGR [17] is a location-based game on mobile
phones that allows its user to go to different locations and do variety of challenges to
earn points as well as real-world awards. It uses mobile phone’s GPS to determine
players location.
2.3.2 Indoor LBS
For indoors services the location of the user is determined by the use of technologies
like Wireless LAN Modems, RFID tags, Bluetooth, ultrasound and infrared as GPS
cannot operate in such environments.

2.3. APPLICATIONS OF LBS 17
Applications of Indoors LBS
Navigation Google Indoor Maps [8] provides indoor maps and navigation for indoor
environments. It uses information gathered from nearby wireless LAN modems (signal
strength triangulation) in the area and the GPS of the mobile device to estimate the
location of the user. The service also features an option to upload a floor plan for
more accurate localization. The accuracy of such systems is about 16 to 33 feet. This
technology will not work very well in environments with small amount of available
WLANs.
FastMall [51] is a location-based service for shopping which offers deals, indoor
and outdoor navigation. The application also records where the user parked the car
and navigates him to it. It provides users with turn-by-turn guidance inside malls
without the use of GPS or any localization technique. A mobile application enables a
user to download a map of the mall and on providing the application with the user’s
current location the application gives him turn-by-turn guidance to his destination.
Social Networking As previously discussed, Foursquare [7] and Facebook [9] also
serve as an indoor LBS as it allows users who checked-in inside a same or nearby
building connect each other.
Shopping Shopkick [52] is a indoor LBS that offers users points and exclusive deals
by walking into partner stores. A mobile application interfaces with the user to detect
the store by detecting ultrasound signals generated from a device installed in the store.
As sound waves cannot penetrate store walls, users mobile phone will not be able to
detect the the signals and thus any user outside the building will not be able to get
the deals.
2.3. APPLICATIONS OF LBS 18
Travel IWAY [53] is an indoor positioning system that can be used in places like
museums, airports, offices and stores for navigation and audio visual information. It
determines the user’s location by fingerprinting techniques using available Wifi, GSM
and 3G/4G radio signals inside the building.
Medical Authors of [13] provides an indoor proximity detection system for nursing
context awareness in clinics which tracks location and proximity of nurses, patients,
medical equipment and provides information about them via processing RSSI of differ-
ent Bluetooth devices. The proximity information can be exchanged between nearby
devices at a rate of more than 1 Hz on average within the range of 16 feet.
Emergency and Safety A system described in [12] uses pre-setup WLANs in the
University of Cincinnati to track mobile devices to make the campus call center more
responsive and efficient. The users need to register their phones MAC addresses into
the database for location functionality so not everyone can benefit from the service.
Utilities The system proposed in [38] demonstrates multiple applications where
ultrasound is used to share notes, URL and IP addresses between different devices in
close range. In another application called Pick-and-Drop User Interface allows users
to carry files and documents from one device to another. In another application the
laptop after locating itself automatically uses nearest printer when required.
A platform proposed in [36] describes a platform for context-aware computing
that enables applications to follow users as they move around in a building. A small
sensor tag identifies each person to the system, locates them in three dimensions and
the system transfers the users desktop to the nearest machine.

2.3. APPLICATIONS OF LBS 19
GeoLife [20] is a mobile based system that uses ambient fingerprinting to determine
the logical location of the user. It processes information about Wi-Fi, light, color,
sound and accelerometer taken from sensors of smartphones for localization.
Games Escape! [54] is an indoor location-based horror game played through a hand-
held instrument with compass gauges and LEDs where the player battles invisible
monster’s attacks and tries to get to the escape zone as fast as he can.

20
Chapter 3
LBS-ES: Location-Based Service Enabling System
3.1 Introduction
The focus of our work is to propose and evaluate an efficient and ubiquitous location-
based service enabling system for mobile devices. Efficiency is defined in terms of
time taken in service discovery with minimal system resources. The objective is to
enable smart spaces and associated services for all existing and potentially futuristic
mobile devices with minimal functional or operational interference ubiquitously. Our
novel proposed system namely Location-Based Service Enabling System (LBS-ES)
is an acoustic based location identification system which utilizes the ultrasound to
create a new channel of communication between the service providers and the clients.
It has four major components; Audio Beacon Generator (ABG), mobile device, back-
end server and the controller. The communication between mobile devices and ABGs
takes place via customized Four Frequency Shift Keying (4-FSK). The controller
synchronizes the ABG’s broadcast time to minimize the interference amongst beacons.
Furthermore, the system can be potentially implemented on any mobile operating
system.
3.2. MOTIVATION, PROBLEM AND OBJECTIVE 21
3.2 Motivation, Problem and Objective
Smart spaces are geographical locations that have the ability to sense and react to
people and devices present in them. A variety of sensing devices can work together
to collect information about each other and web-based services available in the sur-
roundings to provide new kinds of interfaces for the services to the users. Significant
amounts of information are available around us via different services and devices.
However, most of the time it is difficult to have ways to access them. Such services
can be made more accessible by having different devices in a location communicate
with each other. For example, while driving towards home a user can send a message
to his home computer to initiate coffee brewing. The computer will communicate
with the coffee maker to start boiling up the water. Realization of such a concept
was not possible before due to lack of common communication mechanisms between
different devices however, now most devices have the capability to share information
with other devices.
To enable clients to discover a service, service providers must have some means
to communicate with clients. To make sure every client can easily access the ser-
vice, it is advantageous for service providers to use the communication technologies
that are highly accessible to the masses. Most mobile phones nowadays have built-in
microphones. If a mobile phone’s microphone can be used to receive certain infor-
mation sent for the clients by the service provider, we have our highly accessible
communication channel.
The communication should be inaudible to humans and only mobile phones shall
be able to identify it. To achieve this, a beacon device can be used to produce sound
waves inaudible to humans but detectable by the mobile phones via their microphones.
3.2. MOTIVATION, PROBLEM AND OBJECTIVE 22
This is how our system enables its clients to identify services in their surroundings. A
beacon device broadcasts a service code encoded in ultrasound signals particular to
a location-based service, which a mobile phone identifies via its microphone, decodes
the signals through signal processing and maps it to a service using a service mapping
algorithm. Once this process is done the mobile phone prompts the user with the
list of available services. A user can either proceed to access or ignore the identified
services. For this system, for every area where a service provider wants to provide its
services, a unique service code is generated. The service area is then recognized by
the client application through that service code.
The reason acoustic waves are chosen as the communication channel is that to
detect and identify sound waves no extra hardware is required on the client side,
as hand-held devices already have built-in microphone. Also, sound waves do not
penetrate through solid walls and are contained in a closed area making them a
good candidate to be used as a location identifier. There are some disadvantages of
using sound as a communication channel as well and hence this research also targets
judgment of feasibility of such a system.
Problems:
Sound is an error prone communication channel. Reverberation and echo make it
difficult to identify one signal from another due to slow damping in closed areas. Time
of discovery is an important parameter for such systems therefore one must develop
algorithms that can quickly transfer digital data with minimum amount of errors.
An appropriate balance between transfer rate and error rate of the communication is
required so that the process service discovery can be as fast as possible. It has to be

3.3. SYSTEM ARCHITECTURE 23
designed to operate in the inaudible audio spectrum (frequency >20 kHz) which is
supported by all major mobile phones. As most of the mobile and hand-held devices
have built-in microphones and support processing of audio with sampling frequency
of at least 44kHz, ultrasound frequencies can be detected. We aim to design a system
that also supports multiple services/ABGs for one area divided into smaller sub-
sections. The system supports most of the mobile and hand-held devices for the
realization of ubiquitous computing.
Design Goals:
The main objectives of our indoor location-based service enabling system are as fol-
lows:
• The system should realize the concepts of ubiquitous computing and should
be easy to install. System should interface with mobile phones and integrate
the information of the surrounding environment with the mobile interface in a
seamless fashion.
• System should incorporate a service discovery system that provides the user
with the available services in real-time. It should be able to use already setup
user interfaces so that service providers do not have to follow new protocols.
• System should use minimum resources of the client device to operate.
• System should be able to differentiate amongst different spaces efficiently.
3.3 System Architecture
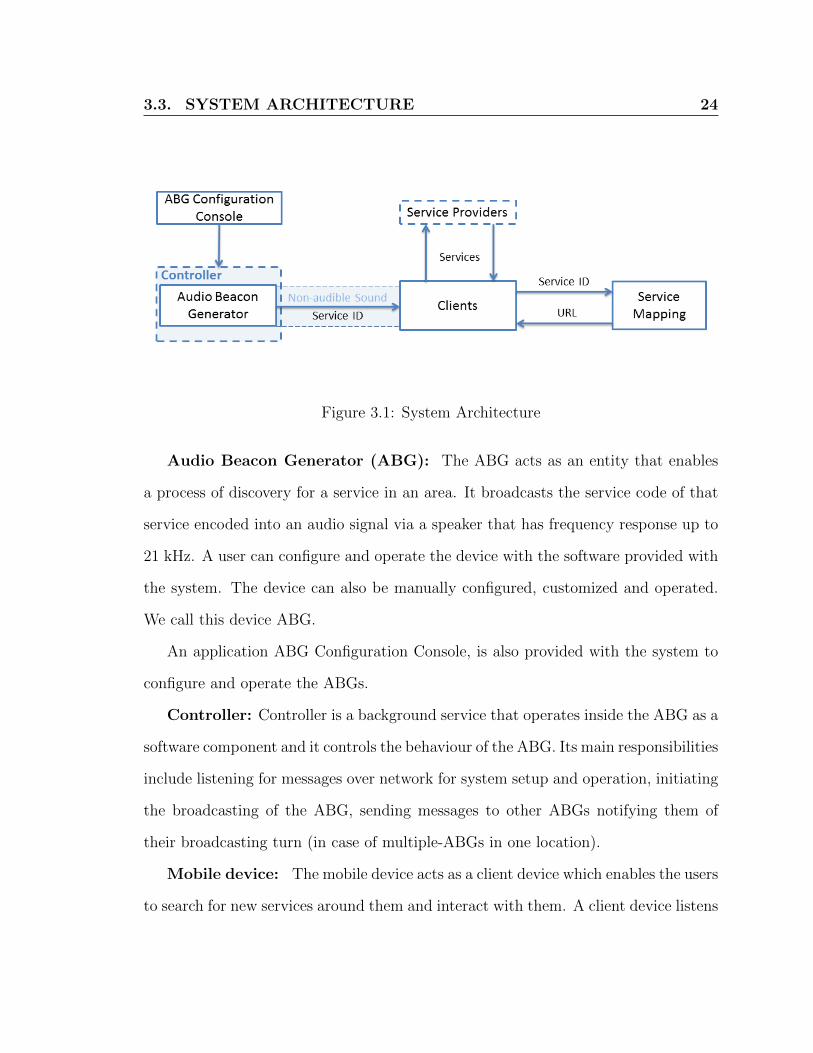
There are four main components of our system as shown in Figure 3.1.
3.3. SYSTEM ARCHITECTURE 24
Figure 3.1: System Architecture
Audio Beacon Generator (ABG): The ABG acts as an entity that enables
a process of discovery for a service in an area. It broadcasts the service code of that
service encoded into an audio signal via a speaker that has frequency response up to
21 kHz. A user can configure and operate the device with the software provided with
the system. The device can also be manually configured, customized and operated.
We call this device ABG.
An application ABG Configuration Console, is also provided with the system to
configure and operate the ABGs.
Controller: Controller is a background service that operates inside the ABG as a
software component and it controls the behaviour of the ABG. Its main responsibilities
include listening for messages over network for system setup and operation, initiating
the broadcasting of the ABG, sending messages to other ABGs notifying them of
their broadcasting turn (in case of multiple-ABGs in one location).
Mobile device: The mobile device acts as a client device which enables the users
to search for new services around them and interact with them. A client device listens

3.4. ULTRASOUND COMMUNICATION ALGORITHM 25
to the broadcasted audio signals in its surroundings via its integrated microphone,
decodes the audio signal into the service code and allows the user to access the services
via the Internet. It can be a mobile phone, laptop or another device provided that
it has a compatible microphone. We have implemented our client side on Android
operating system for now.
Service providers:
Service provider in our system is basically a web-server that provides some location-
based services to its users. The URL of this website is encoded inside the acoustic
signals broadcasted by the ABG. These acoustic signals are then broadcasted by the
ABG so that any client devices in the surrounding area can decode it and access the
encoded web-service as shown in Figure 3.2.
As the transfer rate of digital data using acoustic signals is very slow, making
it unpractical to send a whole URL of a website or a service as it would take too
much time. Thus, a URL has to be compressed to make it faster to be broadcasted,
resulting in quicker service discovery. Hashing can also be one of the solutions to
shorten the size of the broadcast string but to simplify the implementation we are
using TinyURL [55] which is a URL shortening service. It can convert any URL into
very small strings.
3.4 Ultrasound Communication Algorithm
In this section, we explain the various design decisions, encoding and decoding algo-
rithms, of the proposed system.

3.4. ULTRASOUND COMMUNICATION ALGORITHM 26
Figure 3.2: System Architecture and Communication
3.4.1 Sound in closed space
Sound waves exhibits behaviours like reflection, absorption, refraction, diffusion and
diffraction. In a closed space, these collectively cause a phenomenon commonly known
as reverberation. In reverberation, the sound waves remain persistent in an indoor
environment for some time. This depends on the environmental composition and time
it takes for sound waves energy to become negligible.
Reverberation can adversely affect an audio-based communication system targeted
for indoor environments. For instance, a data packet carrying particular frequencies
might get interfered by data packets carrying frequencies adjacent to the original
3.4. ULTRASOUND COMMUNICATION ALGORITHM 27
frequencies in the spectrum if the time gap between the packets is less than the
reverberation time in a particular environment. As a result, the client device will not
be able to distinguish and correctly identify the correct data frequency of the audio
data packet, therefore resulting in communication delays. As the reverberation time
increases, the errors and ability of our system to perform correctly decreases.
To solve these issues we adopt a customizable acoustic communication algorithm
to perform well in such conditions. In such environment, length of the audio packet
can be increased by introducing more lengthy silent gaps between the important
frequencies. This way enough of the components of the previous signal are damped
so that they will not affect the next signal.
3.4.2 Encoding Algorithm
Encoding of the service code in the ultra-sound audio signal is achieved by a cus-
tomized version of Four Frequency Shift Keying (4-FSK) after applying a Base64
compression to the string. The whole encoding process has two steps.
Base64 Compression
Base64 is an encoding scheme in which each character is represented by 6 bits instead
of 8-bits. As in our case the string to be encoded is always textual data as TinyURL
service always shortens a URL to a sequence of textual strings, Base64 compression
is viable. This allows us to compress the original string by 25 percent. The Base64
compression algorithm also converts the compressed string into a stream of bits so
that they can be passed to the 4-FSK encoding algorithm for conversion into acoustic
signals.

3.4. ULTRASOUND COMMUNICATION ALGORITHM 28
4-FSK Encoding
We are using a customized version of a four frequency shift keying encoding scheme
with two synchronizing frequencies. In this encoding scheme four unique frequencies
carry the actual data while two other frequencies are used to indicate the start and/or
end of the data. The algorithm reads a pack of two bits, turn by turn, from the bit
stream provided by the Base64 compressor and generates an audio file with packets
of sinusoidal waves individually comprising of different frequencies depending on the
data encoded. The audio file generated has a bit depth of 16 bits and has a sampling
rate of 48 kHz.
The generated audio file has the encoded data in form of audio packets, each
carrying information of two bits of the original data. A data packet is comprised
of three different frequencies; synchronization frequency, silence frequency, and data
frequency and is divided into four sections as shown in Figure 3.3. The synchroniza-
tion frequency in the audio packet signifies that a new packet has begun and that
the upcoming acoustic signals will be a part of it until the other synchronization fre-
quency is received. The silence frequency is introduced in between synchronization
frequencies and data frequencies to make it possible to distinguish them separately;
the reason being the sound waves reflection off solid objects causes a reverberation
effect. In a small room the reverberation is of no consequence but in large rooms and
halls it can result in slow damping of the acoustic signals. This causes the synchro-
nization frequencies and the data frequencies to bleed into each other with modified
amplitudes resulting in incorrect detection of the broadcasted signals. There are four
data frequencies in 4-FSK encoding scheme. The frequencies used in this system are
shown in Table 3.1 each of which carries two bits of information. After the data

3.4. ULTRASOUND COMMUNICATION ALGORITHM 29
Figure 3.3: Sample Audio Data Packet Waveform Carrying Bits ”11”
frequency a silence frequency is generated so that in reverberating environments two
audio packets do not bleed into each other. The data packet is arranged in a sequence
of synchronization frequency, silence frequency, data frequency, and finally silence fre-
quency. The waveform of a data packet is shown in Figure 3.3. As shown in the figure,
total time for one audio packet = T1 + T2 + T3 + T4, which is 0.86 seconds in our
system. The pseudocode of the encoding algorithm is shown in the Algorithm 1. To
optimize length of the audio signal and resolve errors in the communication, lengths
of each of the parts of the packets can be modified as they greatly affect the operation
of the algorithm.
Frequency response of Android phones (LG Shine Plus, Google Nexus S, and
Samsung Galaxy SII) is not uniform on the whole spectrum, in fact it never is for
any smartphone microphone. For instance, the spectrograph in Figure 3.4 shows the
frequency response of the microphone of a Samsung Galaxy S II phone. The figure

3.4. ULTRASOUND COMMUNICATION ALGORITHM 30
Frequency Usage(in kHz)
20.00 Sync-120.10 Sync-220.30 0020.40 0120.50 1020.60 11
Table 3.1: Frequency usage
Figure 3.4: High frequency spectrum of Samsung Galaxy S II
shows that the frequency response of the phone is uneven and starts declining towards
the high frequencies. The decline is prominent after 20.6 kHz. Same is the case with
LG Shine Plus and Google Nexus.
So we can conclude that the frequency response in the range of 20 kHz to 20.6
kHz is almost flat and can be used for data communication with frequency shift
keying. However, it is possible that some mobile phones may have varying frequency
response or may not respond to the frequencies in this range. For such mobile phones

3.4. ULTRASOUND COMMUNICATION ALGORITHM 31
Figure 3.5: Frequency response of Samsung Galaxy S II for 20 kHz
the system will not work properly. We have introduced a gap of 100 Hz in between
each of the coding frequencies so that aliasing is minimized as it depends on the
quality of the speaker broadcasting the signal and the quality of the microphone how
accurately frequencies are produced and recorded. Figure 3.5 shows the frequency
response of a 20 kHz sinusoidal signal. As we can see, received frequency bleeds into
the neighbour frequencies and distorts them as well.
Therefore to stay in the most efficient operating spectrum of 600 Hz and have as
much distance between frequencies as possible, we introduced a 100 Hz gap in the
data frequencies. A gap of 200 Hz is introduced between the two synchronization
frequencies and the data frequencies. The reason for the bigger gap is that the
synchronization frequencies carry the most important information about the audio
data packet and they shall be affected as little as possible by the effects of the quality
of the speaker, microphone of the cell phone and the behavior of the sound due to its

3.4. ULTRASOUND COMMUNICATION ALGORITHM 32
Figure 3.6: Acoustic spectrograph of Samsung Galaxy S II during service scan
surroundings. Figure 3.6 shows the spectrograph of the acoustic signals monitored
during a broadcast and it shows the separation between the operating frequencies
of the system and background noise and music frequencies, taken from an Android
application Audalyzer [56].
The synchronization frequencies are chosen as the best available frequencies, 20
kHz and 20.1 kHz, as the frequency response is more accurate in this range than in
higher frequencies. These frequencies alternate at the start of the next bit packet so
that in environments with high reverberation values, our system is able to recognize
the start of a new audio packet by looking for alternating frequencies. This way
the client side knows that the first audio packet will start with F1Sync, second with
3.4. ULTRASOUND COMMUNICATION ALGORITHM 33
F2Sync, third with F1Sync and so forth.
The time for which each of these frequencies is generated is very important. The
length of each signal controls the transfer rate of the communication and at the same
time amount of error bits received on the client side. The reason for choosing four
frequencies shift keying is because data communication with sound is slow and much
more error prone. Hence we need to use more of the spectrum to speed up the
transfer rate. At the same time we have to consider the fact that coding data in more
frequencies will make more resource intensive decoding, drain the battery of the client
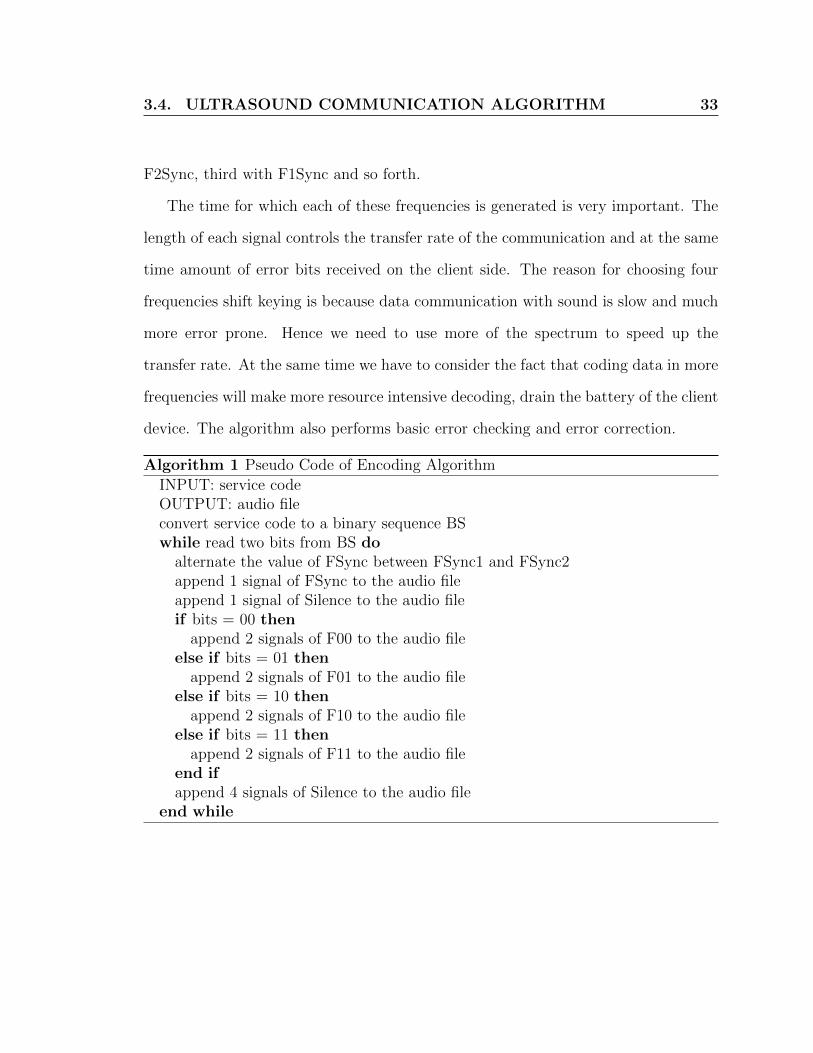
device. The algorithm also performs basic error checking and error correction.
Algorithm 1 Pseudo Code of Encoding Algorithm
INPUT: service codeOUTPUT: audio fileconvert service code to a binary sequence BSwhile read two bits from BS do
alternate the value of FSync between FSync1 and FSync2append 1 signal of FSync to the audio fileappend 1 signal of Silence to the audio fileif bits = 00 then
append 2 signals of F00 to the audio fileelse if bits = 01 then
append 2 signals of F01 to the audio fileelse if bits = 10 then
append 2 signals of F10 to the audio fileelse if bits = 11 then
append 2 signals of F11 to the audio fileend ifappend 4 signals of Silence to the audio file
end while

3.4. ULTRASOUND COMMUNICATION ALGORITHM 34
Other Encoding Schemes
The amplitude shift keying encoding scheme because the amplitude of different fre-
quencies can vary differently due to reflections, intersection of reflected and original
waves and diffraction of sound waves. Furthermore, the distance of the client from the
ABG will affect the amplitudes of the data signal, which makes it harder to decode
the signal correctly.
The phase shift keying encoding scheme was not chosen because of the fact that
after each reflection of sound waves, the phase of the wave is shifted. In this condition,
the client might receive the signal many times with shifted phase, making it hard to
correctly identify the originally sent signal. We also implemented 2-FSK however,
from our initial experimental analysis the data transfer rate was low. The 8-FSK
scheme was not implemented as the available reliable operating spectrum does no
suffice for such encoding.
3.4.3 Decoding Algorithm
The decoding algorithm receives a stream of audio buffers equivalent one signal which
is 441 audio samples. Signals are converted into audio data packets and audio data
packets to a stream of bits by the decoding algorithm. It decodes each buffer, by
processing the values of amplitudes of the received coding frequencies using a Fourier
transform. If a synchronization frequency is received, the decoding algorithm starts
forming a new audio data packet. All the data frequencies received after that are
accumulated separately until another synchronization frequency is received. As it
receives the buffer with the traces of the other synchronization frequency, it completes
the current audio packet. The data frequency with the biggest sum of the amplitudes
3.5. SYSTEM COMPONENTS 35
is considered to be the data frequency for the current packet and it’s corresponding
bits set is added to the decoded stream of bits. The pseudocode of the decoding
algorithm, divided into different sections based on the task, is shown in Algorithms 2
and 3
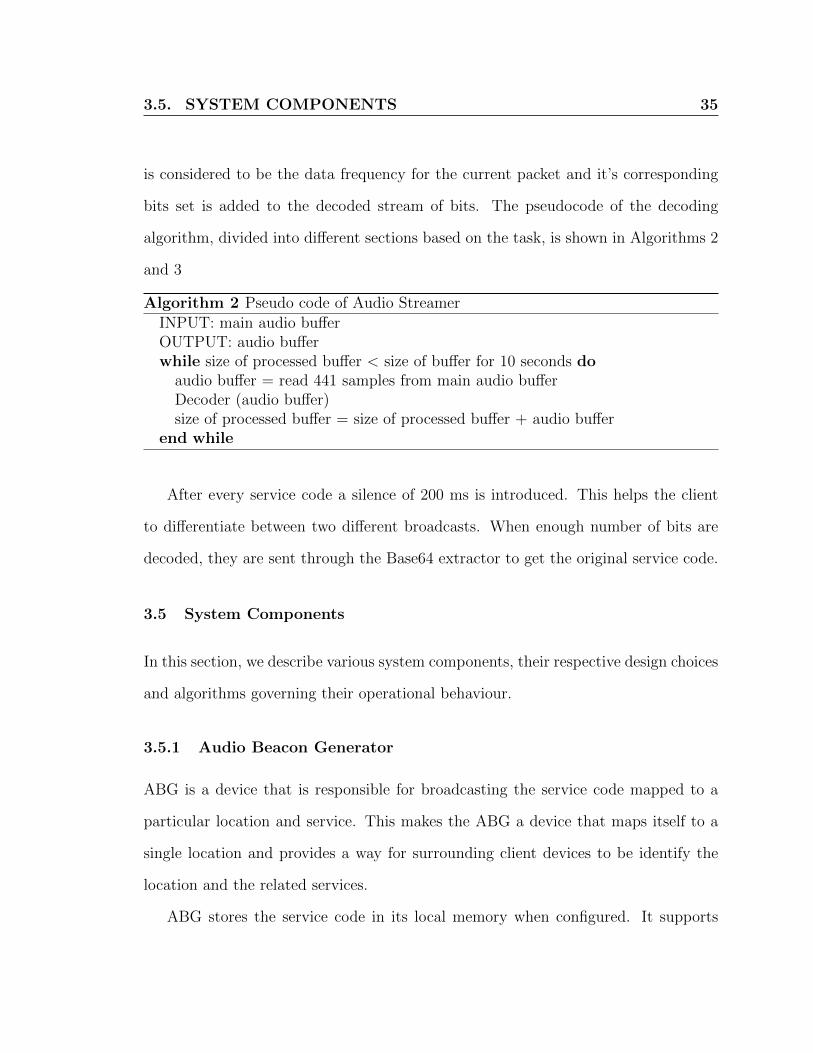
Algorithm 2 Pseudo code of Audio Streamer
INPUT: main audio bufferOUTPUT: audio bufferwhile size of processed buffer < size of buffer for 10 seconds do
audio buffer = read 441 samples from main audio bufferDecoder (audio buffer)size of processed buffer = size of processed buffer + audio buffer
end while
After every service code a silence of 200 ms is introduced. This helps the client
to differentiate between two different broadcasts. When enough number of bits are
decoded, they are sent through the Base64 extractor to get the original service code.
3.5 System Components
In this section, we describe various system components, their respective design choices
and algorithms governing their operational behaviour.
3.5.1 Audio Beacon Generator
ABG is a device that is responsible for broadcasting the service code mapped to a
particular location and service. This makes the ABG a device that maps itself to a
single location and provides a way for surrounding client devices to be identify the
location and the related services.
ABG stores the service code in its local memory when configured. It supports

3.5. SYSTEM COMPONENTS 36
Algorithm 3 Pseudo code of Decoder
INPUT: audio bufferOUTPUT: bit streamamplitude of F00 = get amplitude of F00 from audio bufferamplitude of F01 = get amplitude of F01 from audio bufferamplitude of F10 = get amplitude of F10 from audio bufferamplitude of F11 = get amplitude of F11 from audio bufferamplitude of FS1 = get amplitude of FS1 from audio bufferamplitude of FS2 = get amplitude of FS2 from audio bufferSync = amplitude of FS1if insideAudioPacket = false then
if Sync > threshold theninsideAudioPacket = trueSync = alternate between amplitude of FS1 and amplitude of FS2if FSync = FS then
FSync = FS2else
FSync = FS2end if
end ifelse
if Sync > Threshold AND All other frequencies < FSync thengreatest value = find greatest value (sumF00, sumF01, sumF10, sumF11)if greatest value = sumF00 then
decodedbitData += 00end ifif greatest value = sumF01 then
decodedbitData+=01end ifif greatest value = sumF10 then
decodedbitData+=10end ifif greatest value = sumF11 then
decodedbitData+=11end ifinsideAudioPacket = false
elsesumF00 + = amplitude of F00sumF01 + = amplitude of F01sumF10 + = amplitude of F10sumF11 + = amplitude of F11
end ifend if

3.5. SYSTEM COMPONENTS 37
playback of an audio file with sampling rate high enough to produce frequencies upto
22 kHz. To make the broadcasting of the service code inaudible, audio signals must
carry frequencies higher than 20 kHz. An audio music player can be used as an ABG
however, it will work for only one audio tag in one location. Furthermore, to update
the service code of the ABG, it will be required to connect the device to a terminal
to generate and overwrite the audio file with encoded service code.
Instead, a single-board computer is used inside an ABG. The computer has enough
computing power to playback an audio file with sampling rate high enough to produce
frequencies higher upto 22 kHz and a wireless channel to configure the ABG remotely.
Such an ABG can encode the service code on its own board without the need of
external CPU processing.
To be able to produce frequencies up to 21 kHz we need to generate our audio
signals with 44.1 kHz of sampling rate. Sampling rate is the number of audio samples
carried by an audio signal in one second. This parameter of an audio signal determines
the range of frequencies that the signal can produce. According to NyquistShannon
sampling theorem if sampling rate is at least 44.1 kHz, frequencies up to 22 kHz
can be produced. We need a high sampling rate because we need more samples to
describe higher frequencies. Higher the sampling rate, the better the description and
more accurate reproduction of higher frequencies.
With low sampling rates, aliasing occurs which makes it difficult to identify differ-
ent signals from each other. Methods like oversampling can be applied on the client
side to reduce noise and correctly distinguish high frequencies however, will require
significantly more processing power.
The ABG is designed so that it can be configured and operated remotely. To

3.5. SYSTEM COMPONENTS 38
Figure 3.7: Audio Beacon Generator
this end we have integrated Wi-Fi with the ABG so that users can configure the
ABGs wirelessly. A Wi-Fi compatible device can connect to the ABG via an Ad-Hoc
network to modify the operational settings. Figure 3.7 shows the setup of the ABG
for our system.
Different ABGs must synchronize their broadcasts so that audio signals from ABG
do not interfere with the audio signals of the neighbor ABGs. To achieve this, we
designed the ABGs to operate in a network to allow them to communicate with each
other and broadcast in iteration. The ABGs are designed to work in two modes,
namely stand-alone and collaborative.
Stand-alone mode is designed for scenarios where the service provider desires to
tag only one location in an area for a particular service. In this mode, only one ABG
is placed in the service area where the service providers want its clients to discover
and use the service. The ABG is setup to broadcast the service code of that particular

3.5. SYSTEM COMPONENTS 39
service and it continuously broadcasts its service code in its surroundings. When a
user inside that service area scans for services via our client application on the client
device, the application uses its microphone to identify particular audio frequencies
and decodes the received audio signal to a service code, maps the service code to
the URL of the service and shows the name of the service on the screen of the client
device to be interacted with. Figure 3.8 shows the message passing and operation
flow of the ABG setup in individual mode.
The collaborative mode is designed for conditions where multiple locations in one
closed area are to be tagged to provide the clients with several services depending on
their location. In this mode, the service areas of the ABGs are expected to overlap
with one another. This can cause interference between broadcasts of the ABGs close
to each other as all the ABGs operate with same set of frequencies, rendering the
client application unable to distinguish between different service codes and being
unable to discover any of the services.
To solve this issue, the ABGs work collectively and broadcast their service codes
one at a time in a synchronized manner. This way ABGs avoid interfering with each
other’s broadcasts but it results in taking more time to discover the services on the
client side. When one of the ABGs finishes its broadcast, it sends a message to the
next ABG as configured by the operator to start its broadcast and then that ABG
after its broadcast sends the message over the existing network to the ABG next to
it. The messages are sent over a network and Wi-Fi can be used through an ad-Hoc
network to achieve that. The Figure 3.9 shows the message passing and operation
flow of the ABG setup in collaborative mode.
The speaker as shown in Figure 3.10 inside the ABG is a small sized speaker
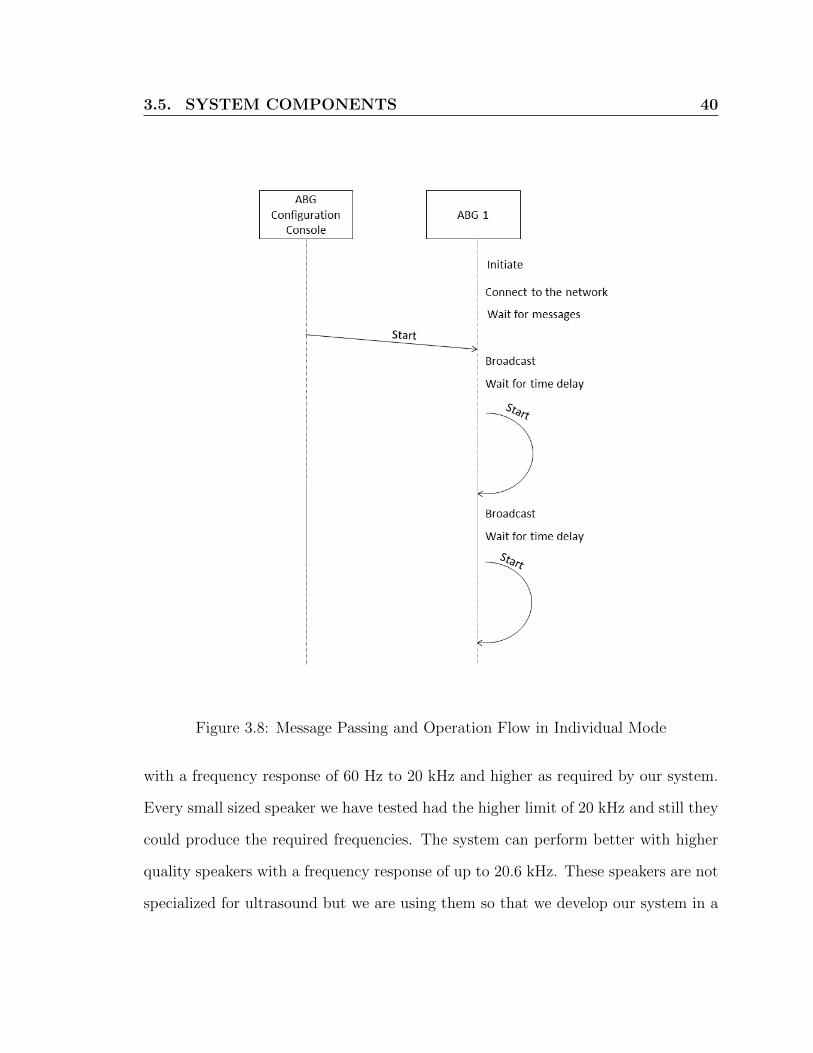
3.5. SYSTEM COMPONENTS 40
Figure 3.8: Message Passing and Operation Flow in Individual Mode
with a frequency response of 60 Hz to 20 kHz and higher as required by our system.
Every small sized speaker we have tested had the higher limit of 20 kHz and still they
could produce the required frequencies. The system can perform better with higher
quality speakers with a frequency response of up to 20.6 kHz. These speakers are not
specialized for ultrasound but we are using them so that we develop our system in a

3.5. SYSTEM COMPONENTS 41
Figure 3.9: Message Passing in Group Mode
way that any kind of speakers can be used with the ABG. The disadvantage of using
such speakers is that the clarity of producing higher frequencies is lost. When a high
frequency signal is produced some portion of higher and lower frequencies than the
generated frequency are also produced causing generation of some audible frequencies
and noticeable click sounds.

3.5. SYSTEM COMPONENTS 42
Figure 3.10: Speaker
3.5.2 Mobile device
The mobile device is used to identify messages broadcasted from ABGs and access
the relative services. Currently we have implemented our prototype client application
on Android operating system. The application allows a user to search services in its
surroundings. For that a GUI is provided with the client application that shows a
list of searched services.
When the user clicks the scan button, the client starts listening to particular
frequencies via its microphone. When the device gets some identifiable signals, it
decodes them into a service code particular to each ABG and shows the service
name to the user. The device running our client application must be able to record
frequencies in the range 20 kHz to 20.6 kHz. We have tested our system on the LG
Shine Plus, Google Nexus S, and Samsung Galaxy S II which support such frequencies
and are compatible with our system. The application only listens for broadcasted
services for 10 seconds. The application can continuously search for services however,
that can drain the battery faster.
In our client application we have used a sampling rate of 44.1 kHz which is the
minimum specifications of the sampling rate of most of the audio supporting devices.

3.5. SYSTEM COMPONENTS 43
Figure 3.11: Client Application Interface
Communication via sound will work better with 48 kHz as it is supported on most of
the phones and our system makes use of it when available.
As the client application on the user’s hand-held device receives the broadcasts
of ABGs, it sorts them according to the signal strength, showing the service received
with most power to the least power in descending order, see example in Figure 3.11.
For example, suppose there is a shopping mall with three sections. The owner of the
mall wants the customers to easily discover the products around them via the client
application and wants to help them make their way around the mall and at same
time have customers quickly see which products on sale or the products clients are
interested in. For this situation, three ABGs can be placed in each section, each with
a different service code mapped to each of the sections. A web-service with three
different sections will be setup that can interface with the customers. The URL of
those sections will be mapped to unique service codes. The ABGs will broadcast
those service codes one by one. When a customer in one of the sections uses the
client application to discover the services, he will be prompted with a list of services

3.5. SYSTEM COMPONENTS 44
pertaining to all three sections but the section the user is currently in will be listed
first and highlighted.
3.5.3 Back-end server
As different types of services have different interfaces, it is important to let the ser-
vice providers be in the control of how the user interacts with the services. In our
system the service provider enables the user to interface with the services via HTML
documents running on a web-server. Since all the modern mobile phones are able to
browse HTML documents, users can directly interface with the service provider via
mobile phones when the URL of that website is communicated to the mobile. The
service provider can design the interface in any way they want with an option to de-
sign mobile based web interface to provide easy interfaces. The URL of this website
is shortened using TinyURL which converts it into a short string of approximately
seven characters. This string is encoded to an audio signal by the ABG as configured
by the ABG Configuration Console. The client application on decoding the URL
launches the service website.
Our backend server includes features like Service Address, Location Message and
Facebook Check-in. Location message is a message for the place where the ABG is
placed. Users can also post messages for each other on that particular location via the
webiste. The messages are stored in a SQL database. A very simple PHP interface
was also developed to blend the service interface with the mobile operating system
instead of just websites but due to extensive work this feature is left for future work.

3.5. SYSTEM COMPONENTS 45
Figure 3.12: ABG Configuration Console GUI
3.5.4 ABG Configuration Console
An application is designed to create 3D maps where ABGs can be deployed, operated
and configured via a GUI interface. User can create rooms with specified measure-
ments as 3D maps which can be saved and loaded from files. There are two viewing
modes in the application, Fly Camera as shown in 3.12and 1st Person View as show
in Figure 3.13. Fly Camera helps the user in rotating the map around and zooming
in and out of the viewport. The 1st Person View helps the user in deploying and
configuration of the ABGs. The operator has to connect to the network of the ABG
to configure and operate it. The application communicates to the ABGs via TCP
connection over Wi-Fi or wired connection. This makes it easy to configure the ABGs
without moving them from their deployed location.

3.6. SYSTEM EXECUTION PROCESS 46
Figure 3.13: ABG Configuration Console GUI with 1st Person View Mode
3.6 System Execution Process
This section explains the setup and execution process of the system.
Setup: In the first phase ABGs are placed in the desired locations depending
on the requirements of the service provider. If a room contains one service only,
then one ABG is required. If the room is divided into sections, one ABG is placed
in each section of the room. When ABGs are powered up they start listening for
messages over TCP connections. An operator can configure them via interfacing with
the ABG Configuration Console. A user can connect to the network of the ABGs
through his local machine. Then via ABG Configuration Console a user can create
a 3D model of the room and place the ABGs in that model as in the actual room.
It is not mandatory to recreate exact map and deployment locations of the ABGs as

3.6. SYSTEM EXECUTION PROCESS 47
the real room. The 3D map is generated to help the user to correctly identify and
configure the ABGs. After recreating the room and placing the ABGs in the map
user can configure each ABG’s service code, time delay after each broadcast and the
IP address of the next ABG. None of the settings are passed to the ABGs unless the
user sends the update settings messages via the update settings button in each ABG’s
settings menu. When the user clicks the update setting button, the ABG Configura-
tion Console sends the new settings to the ABG via TCP packets. On receiving these
settings all the ABGs execute the encoding algorithm and update other operating
parameters. At this point the ABGs are in listening phase, configured and ready to
start broadcasting the service code.
Broadcasting: When all the ABGs in the room are in the listening phase, an oper-
ator can connect to the network of the ABGs through his local machine and send the
start message to any of the ABGs via the ABG Configuration Console application.
This will command the ABG to broadcast its service code once and send a start
message to the next ABG as setup by the operator. If there is only one ABG in the
area it will keep broadcasting its service code in a loop. This process will continue
itself until the operator sends a stop message to the ABGs.
Reconfiguration: If the service provider wants to update the service code, the
ABG Configuration Console can be launched to load the map file of the room. Then
the operator can click on the ABG desired to be reconfigured and update the oper-
ating parameters. Then the operator can send the update settings message to the
ABG so that the ABG can update its settings. It is not required for a ABG to be
first reset and then configured. This can be done while the ABGs is in the process of
broadcasting.

3.7. POTENTIAL APPLICATIONS 48
3.7 Potential Applications
There are a variety of useful applications of this system. It is not designed to replace
the current technologies of indoor localization but to facilitate the implementation,
localization and access to the desired information. The ease of the setup process
makes the implementation of the system quick. This makes it very attractive for lo-
cal as well as commercial businesses. Following are some of the possible applications
of the proposed system.
Social Networks Check-in: This system can allow users to check-in to different
locations easily. A service provider who wants to allow the users to check-in to their
locations, just has to setup the ABG in the desired area. Users present in that area
can use their mobile phones to scan for the check-in services and use service provider’s
web-server to check-in.
Web-service: A service provider can simply encode any of its services or a combi-
nation of its services into the ABG so that on receiving the service code a user can
easily gain an access to the URL particular to a location.
Indoor navigation: This system can also be implemented for indoor localization
and indoor navigation. Each turn and important spots can be installed with ABGs.
Users present in the area can use the client application to detect their current location
and can be provided with a web-based map of their target location.
Location Message: The system can also be used to allow users to leave a message
for the service provider on a particular location or for another user that can receive
the message when he reaches the same location or independent of his location as
chosen by the messenger.
Booth Person Counter: The system can be used as a booth visitors counter in an
3.7. POTENTIAL APPLICATIONS 49
exhibition. It can provide an easy information sharing platform between the booth
owner and the people visiting that particular booth. Booths be setup with ABGs so
that any user near their booths can scan for the services and get connected to the
booth owners via web-services like professional social networks.
Target Advertisement: The system can be used for advertisement. For example,
ABGs can be placed at traffic stops, bus stops and train stations to broadcast the
service codes for the web-site containing the advertisement. On receiving the service
code client on the user’s hand-held device can show users all the advertisement on
the screen.
Shopping Malls: The system can be used by shops inside a mall to advertise and
attract customers. A beacon can be placed outside the shop which will broadcast the
shop’s service code in its close surroundings. Through a single search clients can be
provided with the list of available shops around them. A network of such beacons
setup for all the shop in a mall can also be used for indoor navigation.
Public Announcement: Public announcements can also be made as well. The
announcer can place one ABG in an area where the announcement is important and
update the announcement message on its web-server. On scanning for services, a user
can read the announcement on the hand-held device through the URL.

50
Chapter 4
Implementation and Evaluation
In this chapter, we present the implementation details of LBS-ES, performance met-
rics, experimental use cases and results. To evaluate the performance we consider
variety of test scenarios.
4.1 Implementation details
In this section we present the implementation details of the proposed system, LBS-ES.
4.1.1 Audio Beacon Generator (ABG)
ABG is implemented with a low-power open source hardware single-board computer
BealgeBoard [57] connected to a Speaker and a Wi-Fi Dongle. In this prototype of
the system Beagleboard-xM C3 was used which carries 1 GHz ARM Cortex-A8 core
processor and 512 MB RAM. The BealgeBoard runs a custom Ubuntu 11.4 operating
system designed for the BealgeBoard. The system applications running in Ubuntu
are programmed in C. X-Mini 2 Portable speakers with a frequency response up to 20
kHz were used for the audio playback. Belkin’s WLAN dongle is used in the ABGs
as the WLAN interface. Our server application that controls the behaviour of the

4.1. IMPLEMENTATION DETAILS 51
ABG listens for TCP connections via wireless ad-Hoc network for configuration and
operational messages on port 9931. Each ABG’s IP address is manually configured
so that they operate in the same subnet. This allows multiple ABGs to communicate
with each other and the user interfacing with the ABG Configuration Console on a
computer.
When a ABG is powered it boots up and logs into Ubuntu automatically and
then starts the server application that listens for TCP connections for messages and
commands. ABGs can respond to following messages:
Stop: to stop the broadcasting of the audio signal.
Start: to start the broadcasting the audio signal.
Update: to update the message string to be broadcast and configure the operating
parameters of the ABG.
The ABG starts broadcasting the service code upon receiving the message start
over the TCP connection. To broadcast the audio signal, it executes a program that
plays the audio file which contains the encoded audio signal, via speakers. Then the
program waits for a pre-configured time delay value and then sends the message Start
to the next ABG. The values for time delay and IP address of the next ABG are
programmed with the ABG Configuration Console. On receiving the message Stop,
the server application stops broadcasting the audio signal and keeps listening for new
messages.
The message Update can only be sent by the ABG Configuration Console and
contains the updated values for the service code and other operating parameters. On
receiving this message, the ABG executes the encoding algorithm and encodes the
new service code into the audio file and sets the values of time delay and IP address

4.1. IMPLEMENTATION DETAILS 52
of the next ABG. Figure 4.1 shows the message passing and operation flow during
configuration.
Figure 4.1: Message Passing and Operation Flow During Configuration
4.1.2 Mobile Client Application
Mobile client application is written for Android mobile phones for the system pro-
totype. The application required minimum of Android SDK API level 8 for the
operation. The application provides the user with a interface that allows him to
scan for location-based services and on success shows him a list of scanned services.

4.2. EVALUATION SCENARIOS 53
The application scans the services by listening to acoustic signals from the mobile
microphone for 10 seconds and decoding the identifiable signals via real-time signal
processing. The application has multiple threads for recording and processing of the
audio signals to improve the performance of the application.
On selecting one of the scanned services, the application launches a web browser
that opens up the web site of the location-based service. On demand, it records and
processes the audio data for 10 seconds.
4.1.3 Server
The service providing server is implemented as a website which interfaces with the
users and offers them a variety of services. The web content of the server was designed
in HTML and PHP.
4.1.4 ABG Configuration Console
The application for configuration of the ABG is developed in Unity engine. The Unity
engine makes it easy to port the application to a variety of operating system. For
now the application was designed to run in Windows O/S. Also while the application
is designed as a fully integrated development engine for the creation of interactive
3D content, it is promising to enhance the configuration console in the future to add
features like acoustic simulations and operation of the ABGs for better performance.
4.2 Evaluation Scenarios
To evaluate the performance of the system a variety of test cases were designed
and considered. Our evaluation cases cover all the important operational aspects
4.2. EVALUATION SCENARIOS 54
(time of discovery and acoustic communication errors in small rooms, big rooms and
hallways) of the system. The test were carried out in our Queen’s Telecommunication
Research Lab. Different areas of the room were chosen in the room to scan the services
and different metrics were noted with debugging functions integrated with the client
application. Each measurement was recorded 10 times and average of those value
is shown in the results. The test areas include a room of dimensions 10-by-10 feet
referred to as “small room” in the tests, one room of dimensions 20-by-20 feet referred
to as “large room”, and one long hallway of dimensions 5-by-120 feet referred to as
“hallway”.
4.2.1 Single ABG
As there are two modes of operation for the ABGs, we evaluate both of them sepa-
rately. For the stand alone operation mode of the ABG, we use three different room
sizes. The system is evaluated in different environments because the surroundings of
mobile client affects the acoustic communication.
Case 1: Single ABG in One Room To evaluate the system in a normal sized
office room single ABG is placed in one end of a small office and the mobile client
scanned the services and measured the metrics after every 5 feet till mobile reaches
the other end of the room. The maximum distance between two opposite wall was 10
feet so we measure the metrics for 3 spots in the room.
Case 2: Single ABG in a Large Room To evaluate the system in a big office
a single ABG is placed at one side and the service scans are run at increment of 5
feet away from the ABG to the other end of the room. The debugging functions in

4.2. EVALUATION SCENARIOS 55
the client application measured the metrics over the time the scan was run.
Case 3: Single ABG in a Hallway As discussed earlier, effects of echo and
reverberation are common in large halls, hallways, and large rooms. To evaluate the
systems performance in such an environment, a test is carried out in a 120 feet long
hallway. One ABG was placed at one end of the hallway and metrics were measured
at increments of 15 feet from the ABG till the mobile client reaches the other end of
the ABG.
4.2.2 Multiple ABGs
In these tests multiple ABGs are placed in a variety of environments and config-
urations to evaluate the system performance in environments with more than one
service.
Case 1: Three ABGs in Three Different Rooms This scenario evaluates
the system in an environment where there are multiple isolated rooms. We consider
three connected rooms, each with its own dedicated ABG configured to broadcast the
service code of the service available in its room. The ABGs are configured to operate
in individual mode. Values of different parameters are recorded on selected locations
in the floor as marked (by numbers) in Figure 4.2.
Case 2: Three ABGs in One Large Room We can easily isolate rooms and
their respective services by installing one ABG in each room, but it is important
to evaluate if the system can still work in a large room with different cubicles and
section separated by small wooden walls or open spaces. As the sound waves reflect
and diffract with the environment they can reach almost everywhere if there is a small

4.2. EVALUATION SCENARIOS 56
Beacon 1
Beacon 2
Beacon 3
1
Hallway
Lab 1 Lab 2
2
3 4
5 6 7
8
9
Figure 4.2: Map of the area showing measured spots for multiple ABGs case 1
gap to let the sound waves traverse through. For the system to work properly, it is
important that the amplitude of the received signal on the client side is at least higher
than a threshold value in the operating zone.
To carry out the test, three ABGs were placed in our lab which has three sections
separated by two half high plastic and metal walls. Fourteen spots were chosen in
the room to evaluate the metrics as shown in the Figure 4.3. The ABGs are being
operated in group mode.
Case 3: Two ABGs in One Large Room As for an area supporting multiple
connected sub-areas, the correct detection of the nearest ABG is made based on the
strength signals, which can make it difficult for the client device to detect the correct
ABG. Properties of ultra-sound waves can cause wild variations in the strength of

4.3. PERFORMANCE METRICS 57
Beacon 1
Beacon 2
Beacon 3
1
C1
2 3 4
9 8 7 6
14 13 12 11
C2
C3
C4
C5
C6
C7
Lab 1
Separations
Figure 4.3: Map of the area showing measured spots for multiple ABGs case 2
the signals. This makes it important to evaluate the correctness of the identification
algorithm in such conditions. Two ABGs are placed in the lab, facing each other and
are configured to broadcast service codes simultaneously in the same operating area
divided by virtual sub-area as shown in Figure 4.4. Then the metrics are evaluated
at every five from ABG 2 as shown in the diagram. The client device moves from
ABG 2 towards ABG 1.
4.3 Performance Metrics
Following are the performance metrics used to evaluate the performance of the sys-
tem.
Time of discovery: For a location-based service discovery system, the amount of

4.3. PERFORMANCE METRICS 58
Beacon 2
Beacon 1 36 32 28 24 20 16 12 8 4 0
Lab 1
Figure 4.4: Map of the area showing measured spots for multiple ABGs case 3
time it takes to discover the service is an important metric. We measure this metric
by measuring the time the mobile client application takes from the moment of re-
quest for scan from the user to the moment where at least one service is successfully
identified and shown to the user. This includes all the overheads of the process viz
network communication delays.
Error Percentage: As our system is based on an acoustic medium for digital data
communication, it is error prone. If the service code broadcasted by the ABG is not
identified in the first round, the application has to wait for the next broadcast, taking
more time in the discovery process. This makes error percentage an important metric

4.3. PERFORMANCE METRICS 59
for our system. We measure this by counting the number of correctly identifiable
broadcast messages received on the client side as a function of distance.
Algorithmic Configurations: These test cases were carried out to evaluate the
audio communication algorithm. The length of each of the signals in the audio data
packet greatly affects the performance of audio communication. As discussed in Sec-
tion 3.2 audio signals can stay in the environment for some time after their broadcast
due to reflections from solid objects causing interferences in previous and new signals.
To avoid such interference the length of each signal and delay between each broadcast
is optimized.
The performance of this metric depends on the surrounding environment, client
side hardware and ABG’s speaker. It is noticed that sounds produced from opening
and closing of heavy doors, jangling of keys, sliding of papers, trucks and buses etc.
adversely affect the performance of the system. Also, the quality of speakers used
with the ABG directly influences these parameters. As discussed earlier speakers with
frequency response up to 20.6 kHz should perform better.
As discussed in Section 3, one audio data packet is divided into four sections (syn-
chronization part, silent part 1, data part and silent part 2) and it carries information
of two bits. The length of these individual signals directly affects the performance
of the algorithm. We can represent one audio data packet as a-b-c-d where a is the
length of synchronization signal, b is the length of silent signal 1, c in the length of
data signal and represents the length of the silent signal 2. Considering this, we select
the following audio data packet configurations to be evaluated.
1-1-1-1: For this configuration length of each signal is equal to one signal which is
0.01 seconds for our algorithm. Considering the service code has a length of 7 6-bit
4.4. SYSTEM EVALUATION RESULTS 60
characters, with this configuration the encoding algorithm generates the audio sample
of of length of 0.84 seconds. This configuration supports faster time of discovery as
it takes less time to record and decode a short acoustic signal but at the same time
it is error prone in reverberating environments.
1-1-2-4: In this configuration the data part is comprised of two signals which is equal
to 0.02 seconds. The silent part 2 is comprised of four signals which is equal to 0.04
seconds. With this configuration the generated audio sample has length of 1.68 sec-
onds. The extended data and silent 2 parts enhance the chances of the audio packet
being detected correctly by the client application.
2-2-2-2: In this configuration all the sections of the audio packet are two signals which
is equal to 0.02 seconds each. With this configuration the generated audio sample
has length of 1.68 seconds.
3-3-3-3: In this configuration all the sections of the audio packet have lengths equal
to three signals which is equal to 0.03 seconds each. With this configuration the
generated the encoded service code has length of 2.52 seconds.
4.4 System Evaluation Results
To evaluate the system, different scenarios and environments are considered so that
the important parameters of the system can be evaluated. The tests are carried out
using Samsung Galaxy S II running Android 3.4.4 as the client mobile device. We
use 1-1-2-4 as our default data packet configuration.

4.4. SYSTEM EVALUATION RESULTS 61
Distance Communication Errors(in feet) (in percentage)
0 05 010 0
Table 4.1: Communication errors (in percentage) for the single ABG Case 1
4.4.1 Single ABG
Case 1: Single ABG in One Room
The results of communication error metric as illustrated in Table 4.1 show that the
client application received all the broadcasted messages correctly. The reason there
was no error in the communication is that small rooms do not have reverberation.
With no reverberation the client application can correctly identify short pulses of
particular frequencies.
The average time of discovery metric results in Table 4.2 show that the overall
average time of discovery noted was 3.26 seconds ranging from a minimum of 2.141 to
a maximum of 4.406 seconds. This variation is due to the reason that communication
from the ABG to the client device is a one way broadcast as discussed in Section 3.5.1
and it is possible that user initiates the service scan in the start, middle or end of a
broadcast resulting in the information received from that particular broadcast being
ignored as it does not carry the complete service code. Furthermore, at rare occasions
the BeagleBoard delays the broadcast due the operating system’s internal processing.
If the client device receives an erroneous broadcast, the information received from
that broadcast is neglected and the client application waits for and decodes the next
broadcast.
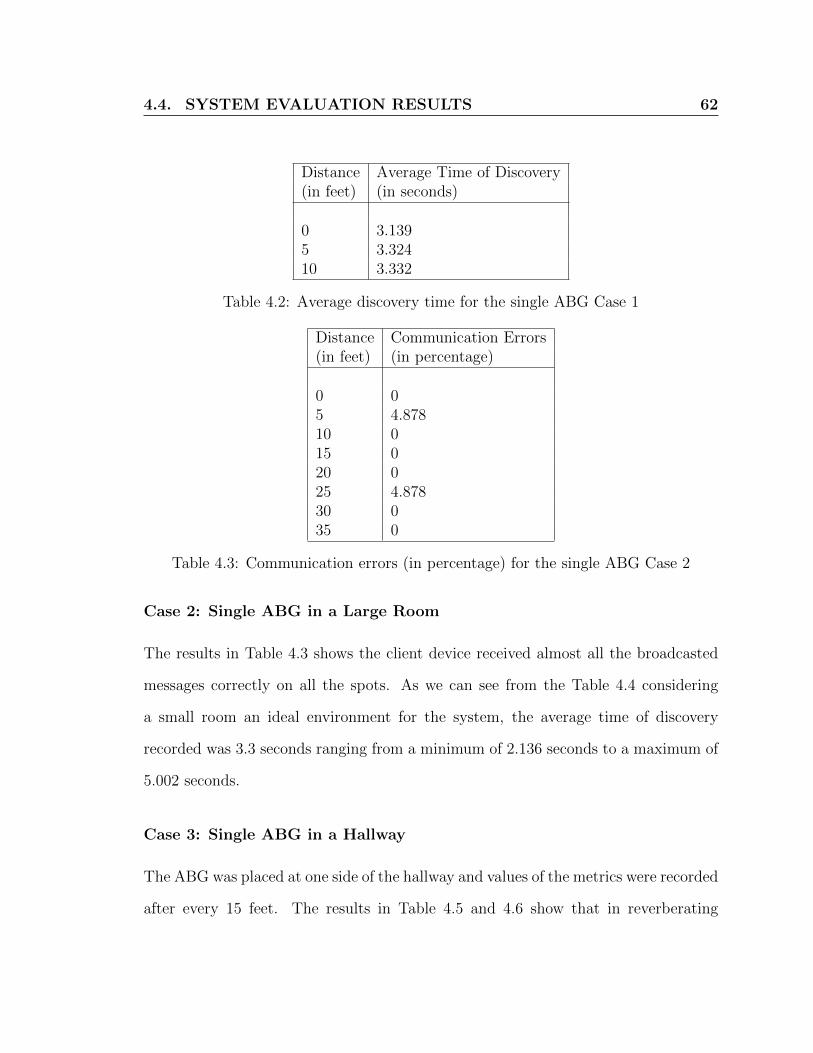
4.4. SYSTEM EVALUATION RESULTS 62
Distance Average Time of Discovery(in feet) (in seconds)
0 3.1395 3.32410 3.332
Table 4.2: Average discovery time for the single ABG Case 1
Distance Communication Errors(in feet) (in percentage)
0 05 4.87810 015 020 025 4.87830 035 0
Table 4.3: Communication errors (in percentage) for the single ABG Case 2
Case 2: Single ABG in a Large Room
The results in Table 4.3 shows the client device received almost all the broadcasted
messages correctly on all the spots. As we can see from the Table 4.4 considering
a small room an ideal environment for the system, the average time of discovery
recorded was 3.3 seconds ranging from a minimum of 2.136 seconds to a maximum of
5.002 seconds.
Case 3: Single ABG in a Hallway
The ABG was placed at one side of the hallway and values of the metrics were recorded
after every 15 feet. The results in Table 4.5 and 4.6 show that in reverberating

4.4. SYSTEM EVALUATION RESULTS 63
Distance Average Time of Discovery(in feet) (in seconds)
0 3.1405 3.32410 3.33215 3.24020 2.93825 3.52730 3.34735 3.686
Table 4.4: Average discovery time for the single ABG Case 2
Distance Average Time of Discovery(in feet) (in seconds)
0 3.13615 3.62130 3.30945 2.95860 3.03175 3.93890 3.643105 4.063
Table 4.5: Average discovery time for the single ABG Case 3
environments the system works up to a certain distance. As the user goes further
away the number of errors and time of discovery increase. However, we have noticed
that if the user aims the microphone towards the ABG, numbers of errors are greatly
reduced. Time of discovery varied from 2.16 to 5.9 seconds with average of 3.46 for
the same reason as mentioned in Section 4.4.1.

4.4. SYSTEM EVALUATION RESULTS 64
Distance Communication Errors(in feet) (in percentage)
0 2.515 530 045 060 075 17.94990 14.634105 25.641
Table 4.6: Communication errors (in percentage) for the single ABG Case 3
4.4.2 Multiple ABGs
Case 1: Three ABGs in Three Different Rooms
The results of communication errors metric in Table 4.7 show that for most of the
cases there was no error. The client device discovered and identified the correct ABG
every time as the rooms were isolated from each other by concrete walls. This implies
that the ultrasound signals can be used to isolate and identify different enclosed areas.
The measured average time of discovery as shown in the Table 4.8 has a minimum of
2.14 seconds to a maximum of 4.94 seconds.
Case 2: Three ABGs in One Large Room
The results of communication errors metric in Table 4.9 shows that all the messages
are received correctly by the client device from all the spots. The reason is the
time division multiplexing nature of the broadcasting. Average time of discovery as
measured in Table 4.10 varies between 2 seconds to 9 seconds with an average of 5.3
seconds. The reason for this wide range is that each ABG broadcasts its service code

4.4. SYSTEM EVALUATION RESULTS 65
Marks Communication Errors(in percentage)
1 02 03 04 05 06 07 6.258 09 0
Table 4.7: Communication errors (in percentage) for the multiple ABGs Case 1
Marks Average Time of Discovery(in seconds)
1 3.3132 3.6053 3.1684 3.5585 3.7446 3.3967 3.1768 3.5219 3.059
Table 4.8: Average discovery time for the multiple ABGs Case 1
one after the other and client has to wait till the ABG mapped to his location gets
its turn to broadcast the service code. In our tests, each broadcast takes 1.68 seconds
and the time delay after every broadcast is 200 milliseconds, then three different
broadcasts take an average of (1.68 + 0.2) * 3 = 5.64 seconds (ignoring the TCP
communication delay).
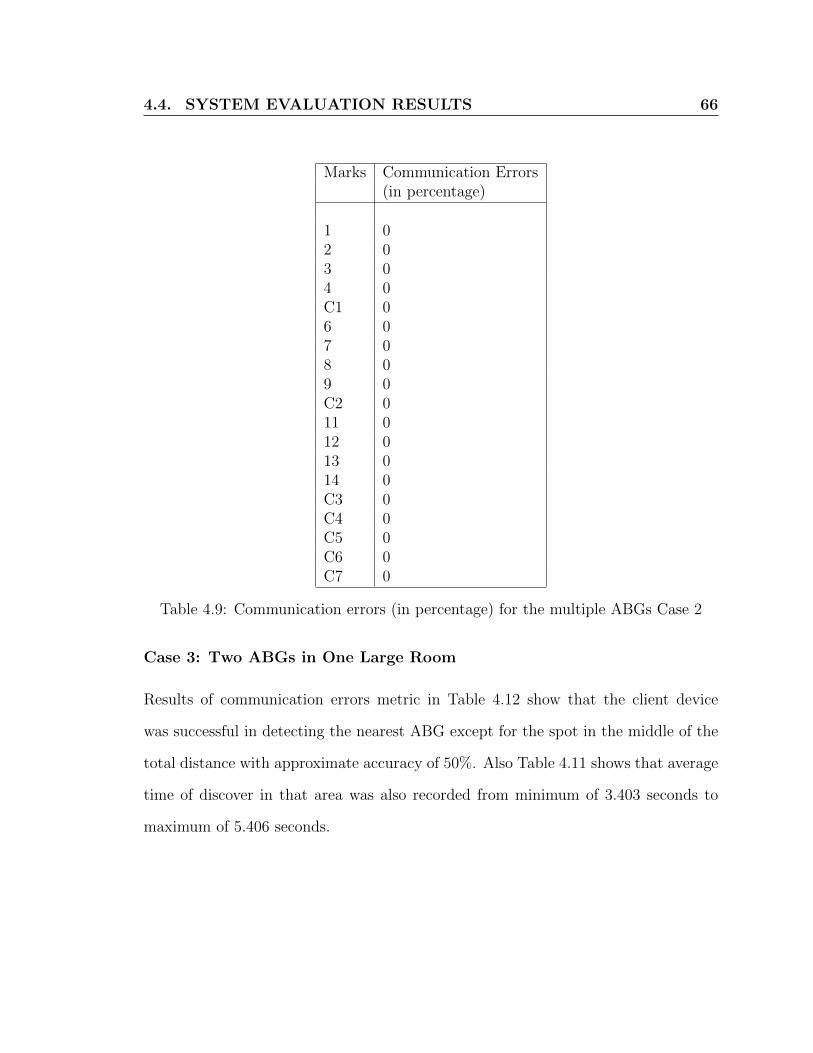
4.4. SYSTEM EVALUATION RESULTS 66
Marks Communication Errors(in percentage)
1 02 03 04 0C1 06 07 08 09 0C2 011 012 013 014 0C3 0C4 0C5 0C6 0C7 0
Table 4.9: Communication errors (in percentage) for the multiple ABGs Case 2
Case 3: Two ABGs in One Large Room
Results of communication errors metric in Table 4.12 show that the client device
was successful in detecting the nearest ABG except for the spot in the middle of the
total distance with approximate accuracy of 50%. Also Table 4.11 shows that average
time of discover in that area was also recorded from minimum of 3.403 seconds to
maximum of 5.406 seconds.

4.4. SYSTEM EVALUATION RESULTS 67
Marks Average Time of Discovery(in seconds)
1 4.6322 5.553 5.5854 6.316C1 6.2456 5.4607 5.7118 5.6259 5.673C2 5.03311 5.68612 5.80813 4.54714 4.612C3 4.070C4 4.944C5 5.769C6 5.532C7 3.776
Table 4.10: Average discovery time for the multiple ABGs Case 2
Distance Average Time of Discovery(in feet) (in seconds)
0 4.1564 4.2588 4.38012 4.79116 5.40620 4.66124 3.79928 3.40332 3.79436 4.425
Table 4.11: Average discovery time for the multiple ABGs Case 3
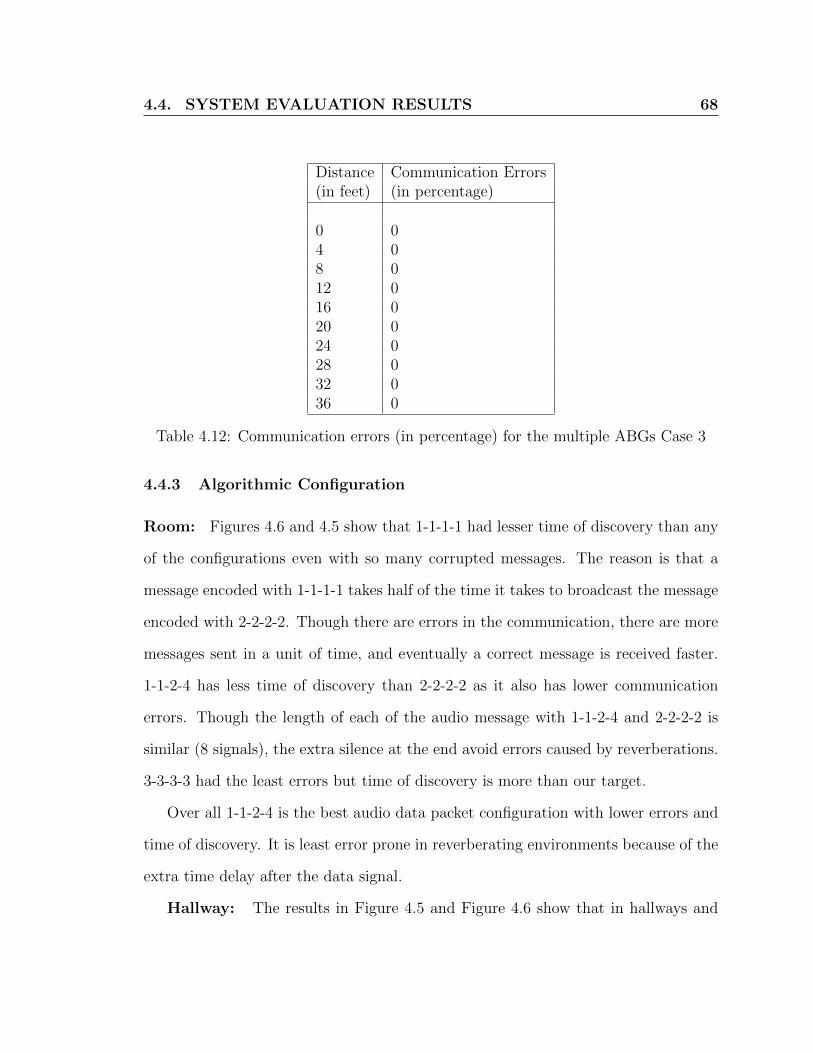
4.4. SYSTEM EVALUATION RESULTS 68
Distance Communication Errors(in feet) (in percentage)
0 04 08 012 016 020 024 028 032 036 0
Table 4.12: Communication errors (in percentage) for the multiple ABGs Case 3
4.4.3 Algorithmic Configuration
Room: Figures 4.6 and 4.5 show that 1-1-1-1 had lesser time of discovery than any
of the configurations even with so many corrupted messages. The reason is that a
message encoded with 1-1-1-1 takes half of the time it takes to broadcast the message
encoded with 2-2-2-2. Though there are errors in the communication, there are more
messages sent in a unit of time, and eventually a correct message is received faster.
1-1-2-4 has less time of discovery than 2-2-2-2 as it also has lower communication
errors. Though the length of each of the audio message with 1-1-2-4 and 2-2-2-2 is
similar (8 signals), the extra silence at the end avoid errors caused by reverberations.
3-3-3-3 had the least errors but time of discovery is more than our target.
Over all 1-1-2-4 is the best audio data packet configuration with lower errors and
time of discovery. It is least error prone in reverberating environments because of the
extra time delay after the data signal.
Hallway: The results in Figure 4.5 and Figure 4.6 show that in hallways and

4.4. SYSTEM EVALUATION RESULTS 69
0
10
20
30
40
50
60
70
80
90
100
0 10 20 30 40
E
r
r
o
r
P
e
r
c
e
n
t
a
g
e
Distance (feet)
1-1-1-1
1-1-2-4
2-2-2-2
3-3-3-3
Figure 4.5: Communication Error for the room scenario for algorithm test cases
0
1
2
3
4
5
6
0 10 20 30 40
T
i
m
e
(
s)
Distance (feet)
1-1-1-1
1-1-2-4
2-2-2-2
3-3-3-3
Figure 4.6: Average Time of Discovery for the room scenario for algorithm test cases
large rooms with much reverberation, 1-1-2-4 is the best audio data packet configura-
tion as it has them shortest times of discovery with average of 3.136 seconds. 1-1-1-1
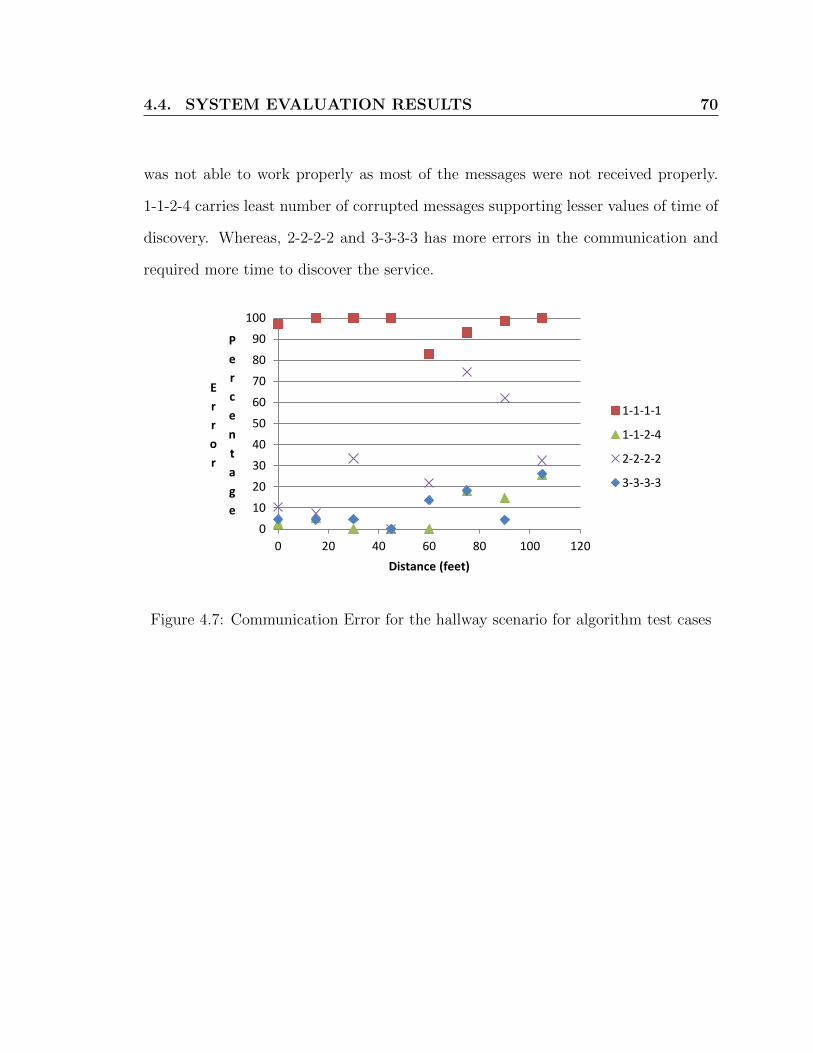
4.4. SYSTEM EVALUATION RESULTS 70
was not able to work properly as most of the messages were not received properly.
1-1-2-4 carries least number of corrupted messages supporting lesser values of time of
discovery. Whereas, 2-2-2-2 and 3-3-3-3 has more errors in the communication and
required more time to discover the service.
0
10
20
30
40
50
60
70
80
90
100
0 20 40 60 80 100 120
E
r
r
o
r
P
e
r
c
e
n
t
a
g
e
Distance (feet)
1-1-1-1
1-1-2-4
2-2-2-2
3-3-3-3
Figure 4.7: Communication Error for the hallway scenario for algorithm test cases
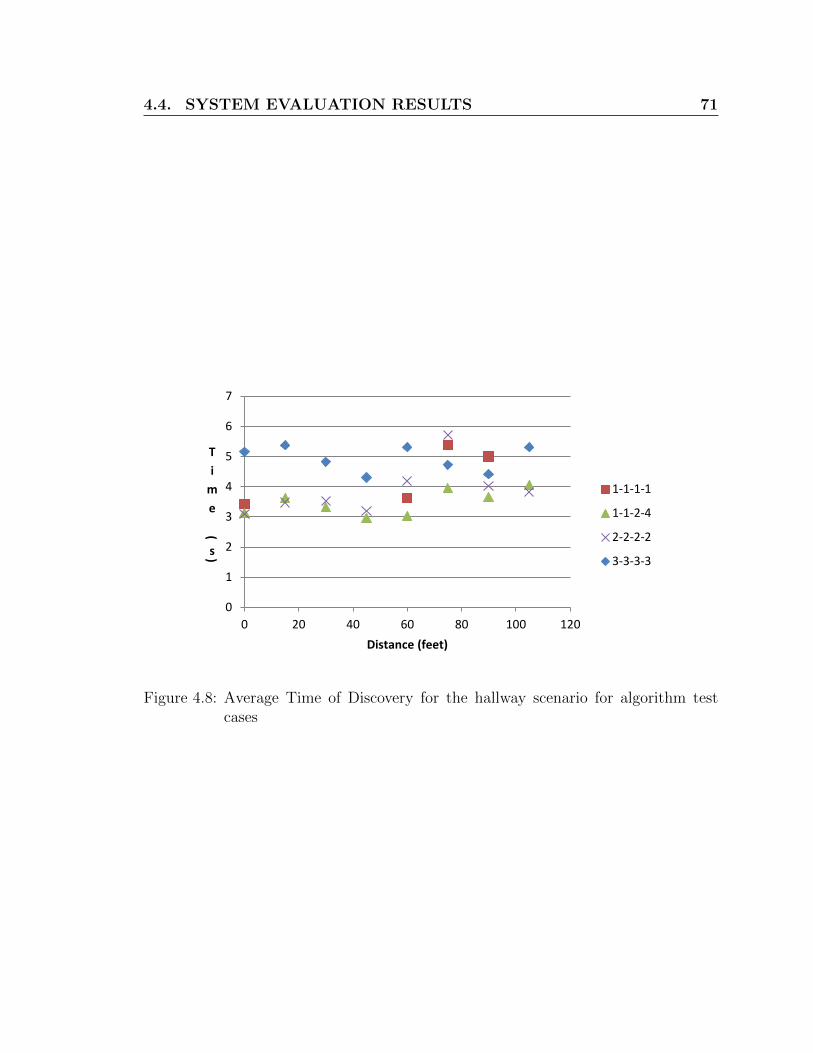
4.4. SYSTEM EVALUATION RESULTS 71
0
1
2
3
4
5
6
7
0 20 40 60 80 100 120
T
i
m
e
(
s)
Distance (feet)
1-1-1-1
1-1-2-4
2-2-2-2
3-3-3-3
Figure 4.8: Average Time of Discovery for the hallway scenario for algorithm testcases

72
Chapter 5
Summary and Conclusions
5.1 Summary
This thesis explores the use of ultrasound to create an environment that assists users
in searching and discovering location-based services in their environments. A working
prototype of such a system was demonstrated and implemented. Different operational
modes of the system were considered to support multiple services in multiple sub-areas
in a single service area. A hardware module for the system named ABG is designed to
encode and broadcast digital data in the form of ultrasound signals. These modules
were designed to be configurable via network. The hardware and algorithms were
thoroughly tested to prove the viability of the system design. A client application
was designed for the Android operating system and was tested on multiple devices to
assess the system’s compatibility. Typical hand-held devices are normally compatible
with the system provided that they have a microphone, which can record frequencies
up to 20.6 kHz. The client application receives digital data via ultrasound through it’s
microphone. A 3D map builder and configuration application was developed for the
system. Multiple test scenarios were discussed and test results show that the system

5.2. SYSTEM LIMITATIONS AND FUTURE WORK 73
can be used for service discovery and accessing location-based services efficiently.
5.2 System Limitations and Future Work
As a prototype of the system was developed a few issues came to the forefront.
• Battery Consumption
Battery consumption of the client due to audio signal processing is not considered in
this thesis. The current system only processes audio for 10 seconds when demanded.
A lightweight signal processing algorithm can be designed that will be active as long
as the cell phone is turned on and will only process the audio when a particular
frequency is received.
• Removing audible clicks
The audible click sounds can be eliminated by applying an amplitude envelope as
explained in [38] but this may slow down the transfer rate.
• Better ABG Design
The ABG can be redesigned so that it consumes lower power. To achieve that all
the unnecessary components of the operating system can be removed and modified
to support only the features required for audio playback, networking and encoding of
the data signal. This will also result in lower CPU power requirements.
• Better Speakers
Custom speakers can be manufactured to produce high frequencies more accurately
and with more strength so that operating range of a single ABG can be increased
which will result in lesser errors during identification.
5.3. CONCLUDING REMARKS 74
• Better audio processing
Audio processing on the client application can be optimized to filter the noise and
correctly identify the frequencies in environments where reverberation causes com-
munication errors.
• Better encoding schemes with secured data communication
The encoding algorithm does not consider security issues. Better coding algorithms
can be designed to encrypt the data in the audio signal. Furthermore, the algorithms
can be optimized to perform better in reverberating environments.
• Implementation of client on other platforms
In this thesis, client side is only implemented on Android operating system but it can
also be implemented on other types of hand-held devices.
• Better configuration application with more detailed map builder
ABG configuration application can be enhanced by allowing users to build more
detailed and accurate maps. Features that simulate behaviour of the sound can also
be implemented to analyze the performance of the system on a particular area before
it is installed.
5.3 Concluding Remarks
In conclusion, using ultrasound for space identification can be beneficial in optimizing
and easing the access of location-based services via hand-held devices. A wide variety
of new location-based services can be implemented with such a technology and others

5.3. CONCLUDING REMARKS 75
can be improved upon. The hardware in current generation mobile phones is powerful
enough to support signal processing, opening doors to more CPU extensive applica-
tions to be implemented. The proposed system performs extremely well within 40
feet and requires about 3 seconds to identify the space (depending on the construction
of the environment). For longer distances, a direct line of sight between the client
device and beacon generator results in better and quicker space identification. It also
features multiple tags in one closed space. The beacon generator is configurable via
network using the AGB configuration console.
BIBLIOGRAPHY 76
Bibliography
[1] V. Gerasimov. Things that talk. Master’s thesis, Massachusetts Institute ofTechnology, 1996.
[2] Lba counts in in apple store and google play. http://www.skyhookwireless.
com/locationapps/, 2010.
[3] Yanying Gu, Anthony Lo, and Ignas G. Niemegeers. A survey of indoor posi-tioning systems for wireless personal networks. IEEE Communications Surveysand Tutorials, pages –1–1, 2009.
[4] Juan Carlos Augusto. Past, present and future of ambient intelligence and smartenvironments. In ICAART, pages 11–18. INSTICC Press, 2009.
[5] Mark Weiser. Human-computer interaction. chapter The computer for the 21stcentury, pages 933–940. 1995.
[6] Measuring the information society. http://www.itu.int/net/pressoffice/
backgrounders/general/pdf/5.pdf, 2011.
[7] About foursquare. http://foursquare.com/about, 2012.
[8] Google indoor maps. http://support.google.com/gmm/bin/topic.py?hl=
en&topic=1685871&parent=1616955&ctx=topic, 2013.
[9] Share where you are. https://www.facebook.com/about/location, 2012.
[10] Keith Mitchell, Duncan McCaffery, George Metaxas, Joe Finney, Stefan Schmid,and Andrew Scott. Six in the city: introducing real tournament - a mobileipv6 based context-aware multiplayer game. In Proceedings of the 2nd workshopon Network and system support for games, NetGames ’03, pages 91–100. ACM,2003.
[11] Parallel kingdom. http://www.parallelkingdom.com/, 2012.
[12] Peter Thornycroft. Location-based Services for Cellular Phones using Wi-Fi:University of Cincinnatis System for Emergency Call Location. 2010.
BIBLIOGRAPHY 77
[13] Futoshi Naya, Haruo Noma, Ren Ohmura, and Kiyoshi Kogure. Bluetooth-based indoor proximity sensing for nursing context awareness. In Proceedings ofthe Ninth IEEE International Symposium on Wearable Computers, ISWC ’05,pages 212–213, 2005.
[14] Anastasios Zafeiropoulos, Emmanuel Solidakis, Stavroula Zoi, Nikolaos Kon-stantinou, Panagiotis Stathopoulos, and Nikolas Mitrou. Location based guid-ance services in a museum environment: Deployment issues and a proposedarchitectural approach. In WINSYS’07, pages 217–224, 2007.
[15] Stefan Steiniger, Moritz Neun, and Alistair Edwardes. Foundations of locationbased services lesson 1 cartouche 1- lecture notes on lbs, v. 1.0, 2006.
[16] Zheng Yang, Chenshu Wu, and Yunhao Liu. Locating in fingerprint space: wire-less indoor localization with little human intervention. In Proceedings of the 18thannual international conference on Mobile computing and networking, Mobicom’12, pages 269–280. ACM, 2012.
[17] Elena-Simona Lohan, Alexandru Rusu-Casandra, Oana Cramariuc, Ion Margh-escu, and Bogdan Cramariuc. End-user attitudes towards location-based ser-vices and future mobile wireless devices: The students perspective. Information,2(3):426–454, 2011.
[18] Jeffrey Hightower and Gaetano Borriello. Location systems for ubiquitous com-puting. Computer, 34:57–66, 2001.
[19] Vladimir Stantchev, Trung Dang Hoang, Tino Schulz, and Ilja Ratchinski. Opti-mizing clinical processes with position-sensing. IT Professional, 10:31–37, 2008.
[20] Martin Azizyan, Ionut Constandache, and Romit Roy Choudhury. Surroundense:mobile phone localization via ambience fingerprinting. In Proceedings of the 15thannual international conference on Mobile computing and networking, MobiCom’09, pages 261–272. ACM, 2009.
[21] H. Liu, Houshang Darabi, P. Banerjee, and Jing Liu. Survey of wireless indoorpositioning techniques and systems. IEEE Transactions on Systems, Man, andCybernetics, Part C, pages 1067–1080, 2007.
[22] Ekahau. http://www.ekahau.com/, 2012.
[23] Thomas King, Stephan Kopf, Thomas Haenselmann, Christian Lubberger, andWolfgang Effelsberg. Compass: A probabilistic indoor positioning system based
BIBLIOGRAPHY 78
on 802.11 and digital compasses. In Proceedings of the 1st international work-shop on Wireless network testbeds, experimental evaluation & characterization,WiNTECH ’06, pages 34–40, New York, NY, USA, 2006. ACM.
[24] Paramvir Bahl and Venkata N. Padmanabhan. Radar: An in-building rf-baseduser location and tracking system. In INFOCOM’00, pages 775–784, 2000.
[25] Muhammad Atif Mehmood, Lars Kulik, and Egemen Tanin. Autonomous navi-gation of mobile agents using rfid-enabled space partitions. In Proceedings of the16th ACM SIGSPATIAL, GIS ’08, pages 21:1–21:10. ACM, 2008.
[26] Vikram P. Munishwar, Shailendra Singh, Xiaoshuang Wang, ChristopherMitchell, Kartik Gopalan, and Nael B. Abu-Ghazaleh. On the accuracy of rfid-based localization in a mobile wireless network testbed. In Proceedings of the2009 IEEE International Conference on Pervasive Computing and Communica-tions, PERCOM ’09, pages 1–6. IEEE Computer Society, 2009.
[27] Lionel M. Ni, Yunhao Liu, Yiu Cho Lau, and Abhishek P. Patil. Landmarc:indoor location sensing using active rfid. Wirel. Netw., 10(6):701–710, November2004.
[28] Jeffrey Hightower, Roy Want, and Gaetano Borriello. SpotON: An indoor 3dlocation sensing technology based on RF signal strength, 2000.
[29] S. Kawakubo, A. Chansavang, S. Tanaka, T. Iwasaki, K. Sasaki, T. Hirota,H. Hosaka, and H. Ando. Wireless Network System for Indoor Human Position-ing. pages 1–6, 2006.
[30] Miguel Rodriguez, Juan P. Pece, and Carlos J. Escudero. In-building locationusing bluetooth. In in In Proceedings of the International Workshop on WirelessAd Hoc Networks, 2005.
[31] Saowanee Thongthammachart and Henning Olesen. Bluetooth enables in-doormobile location services, pages 2023–2027. IEEE, 2003.
[32] Raffaele Bruno and Franca Delmastro. Design and analysis of a bluetooth-basedindoor localization system. In Personal Wireless Communications, IFIP-TC68th International Conference, PWC 2003, Venice, Italy, September 23-25, 2003,Proceedings, pages 711–725, 2003.
[33] Topaz. http://www.tadlys.co.il/Pages/Product_content.asp?iGlobalId=2, 2004.
[34] John D. Cutnell and Kenneth W. Johnson. Physics. IEEE, 1998.
BIBLIOGRAPHY 79
[35] The bat ultrasonic location system. http://www.cl.cam.ac.uk/research/dtg/attarchive/bat/, 2002.
[36] Andy Harter, Andy Hopper, Pete Steggles, Andy Ward, and Paul Webster. Theanatomy of a context-aware application. WIRELESS NETWORKS, VOL, 8:187–197, 1999.
[37] Nissanka Bodhi Priyantha. The cricket indoor location system. PhD thesis,Massachusetts Institute of Technology, 2005.
[38] Anil Madhavapeddy, David Scott, and Richard Sharp. Context-aware computingwith sound. In In Proceedings Of The 5th International Conference On Ubiqui-tous Computing, pages 315–332, 2003.
[39] B. Schilit, N. Adams, and R. Want. Context-aware computing applications.In Proceedings of the 1994 First Workshop on Mobile Computing Systems andApplications, WMCSA ’94, pages 85–90, Washington, DC, USA, 1994. IEEEComputer Society.
[40] Cristina V. Lopes and Pedro M. Q. Aguiar. Aerial acoustic communications. InIEEE Workshop on the Applications of Signal Processing to Audio and Acoustics,2001.
[41] sprooki. http://www.sprooki.com/index.php?option=com_content&view=
article&id=2&Itemid=102, 2012.
[42] Google shopper. https://www.google.com/mobile/shopper/, 2011.
[43] Goodzer. http://goodzer.com/about/, 2011.
[44] Groupon. http://www.groupon.ca/, 2008.
[45] Livingsocial. http://corporate.livingsocial.com/home, 2012.
[46] Google offers. https://www.google.com/mobile/offers/, 2012.
[47] Accuweather. http://www.accuweather.com/, 2012.
[48] Local news, weather and more. http://itunes.apple.com/us/app/
local-news-weather-and-more/id316760739?mt=8, 2012.
[49] Endomondo. http://www.endomondo.com/login, 2012.
[50] 9-1-1 service. http://transition.fcc.gov/pshs/services/911-services/,2011.
BIBLIOGRAPHY 80
[51] Fastmall. http://www.fastmall.com/about.html, 2012.
[52] shopkick. http://www.shopkick.com/, 2011.
[53] Iway indoor positioning. http://www.iway.nl/index.php/en/
indoorpositioning-en.
[54] Seungwoo; Heo Seongkook; Park Kyoung Shin; Hahn Minsoo Lee, Seung-soon; Lee. Escape!: An indoor location-based horror game using indirect ambientcues. UCS, 2007.
[55] Tinyurl. http://tinyurl.com/, 2002.
[56] Audalyzer. http://code.google.com/p/moonblink/downloads/detail?
name=Audalyzer-1.15.apk, 2011.
[57] Beagleboard-xm rev c. http://beagleboard.org/static/BB-xM_REV_
C-2011-05-23.zip, 2011.