enabling global transportation - quantum
TRANSCRIPT

Quantum Intelligence
Enabling Global Transportation

GOOD TO GREAT
The Qi-CTM System
A Business Intelligence system forPorts & Terminals

IS THIS THE FIRST SCREEN YOU SHOULD SEE IN THE MORNING?

STRATEGICALLY ENHANCING BUSINESS
Thin operat ing margins requires except ional
sensi t iv i ty in react ing to business changes
Management of costs and best use of assets
is v i ta l to achieve posi t ive resul ts
Predict ing change is the di f ferent iators between
success and fa i lure
YIELD MANAGEMENT
OPTIMIZE OPERATIONS
MAXIMISE RESULTS

CONVERTING DATA TO PROFIT

Advanced analytical modelsPredictive and prescriptive analyticsMultiple dashboardPerformance ratio’sKey performance indicatorsBalanced scorecardSituation reportsCash flow forecastingYield management and resultsException management and alerts
YOUR ENTIRE BUSINESS, ANALYSED & REPORTED
REAL TIME; ALWAYS ON
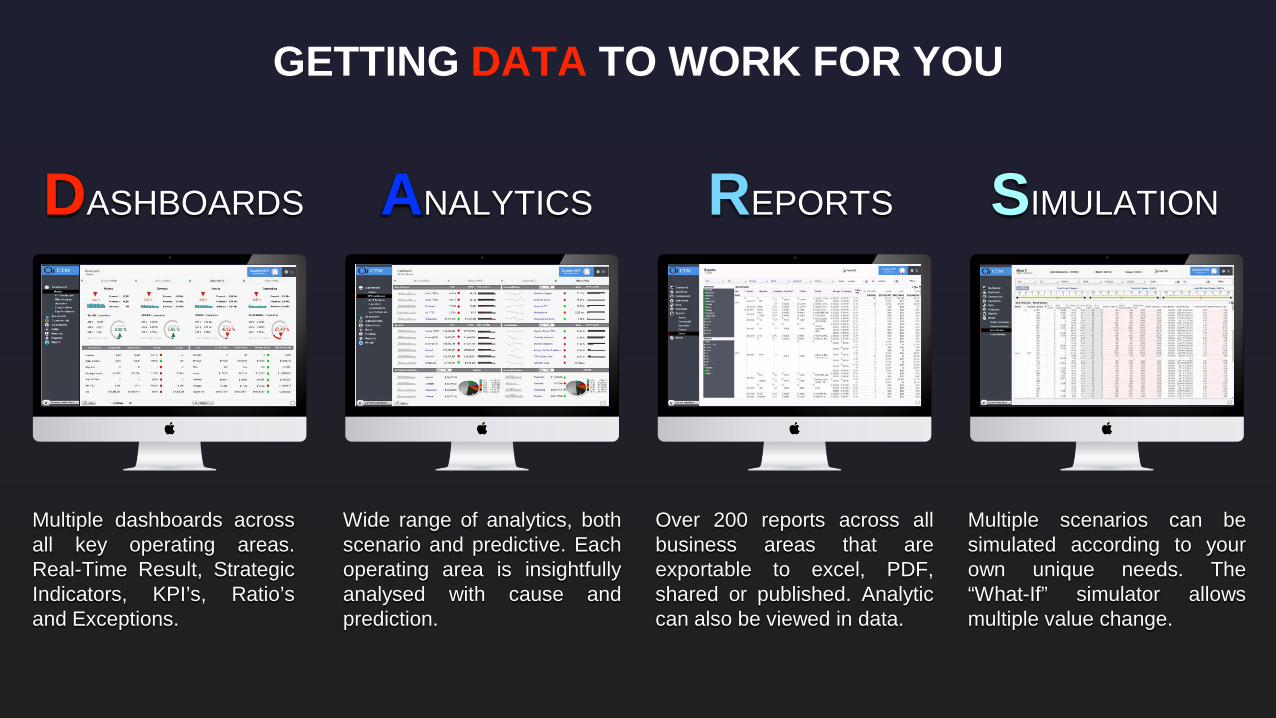
DASHBOARDS SIMULATIONREPORTSANALYTICS
Multiple dashboards acrossall key operating areas.Real-Time Result, StrategicIndicators, KPI’s, Ratio’sand Exceptions.
Wide range of analytics, bothscenario and predictive. Eachoperating area is insightfullyanalysed with cause andprediction.
Over 200 reports across allbusiness areas that areexportable to excel, PDF,shared or published. Analyticcan also be viewed in data.
Multiple scenarios can besimulated according to yourown unique needs. The“What-If” simulator allowsmultiple value change.
GETTING DATA TO WORK FOR YOU

STRATEGIC VALUE TO MANAGEMENT
• Management Information
• Automated and real-time results• Multiple dashboards and scorecards• Top and bottom performers• Deviation against targets and impact
• Performance Measurement
• Real time visibility of all key areas• Trending of best practice, peaks and troughs• Income, profitability, cost, budget• Customer and performance management
• Planning and Optimisation
• Simulate key business parameters• Retaining and identification of customer• Insights of organizational performance• Variance to budget and financial targets

• System Concept & Design
• Pre Configured and out of a box• Paradigm shift for analytics engagement• Paradigm shift in time and cost of product• Standard version commissioned in 6 weeks
• Feature Richness
• A macro view of all business parameters • Mature product whetted by global clients• Dynamic feature enhancement strategy• Rapid commissioning, no slippage, cost creep
• Architecture
• Integration with any and multiple databases• Unique in-memory analytics, high performance• Eliminates the need for data warehouse• Advanced access rights by role and feature
WHY Qi-CTM OVER OTHER BI SYSTEMS?

• Dashboards & Scorecards
• Multiple dashboard for each department• Scorecards allow performance fine tuning• Rapid induction of industry best practices• Models identify change drivers in analysed data
• Extensive Analytics
• Covers all areas – Bookings to Results• Analytics with graphics with data granularity• Each analytic is a completely configurable report• Movement of drivers projects change and impact
• Simulations
• Designed for multi-parameter simulation• Operational scenario’s for all ship, vol, cranes• Planning tool to maximise terminal assets• Predict financial gain/loss with changes
KEY FEATURES OF THE Qi-CTM

• Terminal Performance and Planning
• Predictive system driven vessel planning• Auto management of performance to actual• Alerts and notifications for step-in• Simulate effect of asset addition / removal
• See it as it happens
• System refreshes with very short interval• Loads selective data at preset intervals• Graphs, ticker charts etc show actuals• React to a customer’s action instantly
• Real Time Vs Near Real Time Analytics
• The Qi-CTM is a Near Real Time system• Data refresh is subject to system specifications• High server load means large server & cost• Bridges the gap with transparent and factual data
REAL-TIME ANALYTICS & DASHBOARDS

• General Area of Operations Analytics• Crane Performance• Yard operations• Prime Mover & Customer Truck Analysis• Quay Side Analytics
• Crane Performance• GBP, NBP, CI, CR and other factors• Operating patterns per call• Vessel Stowage Factor and impact• Crane delays, hang-time, etc
• Yard Operations
• Yard utilisation and vessel call impact• Housekeeping, dwell time, cause and impact• Commercial to non-commercial ratios• Precise management of plan & variance
OPERATIONS ANALYTICS

• Analytics for Vessels
• By Period, Service, Operator and Vessel Voyage• By cargo; container (Full/Empty), Reefer, IMDG• By Process – Export / Import / Transshipment• Crane Rates - Load / Discharge, Full / Empty
• Vessel Delays
• Schedule deviation and in/out delays• Commencement of cargo, shift change etc• Non-productive move analysis• Financial impact of dispatch or delay
• Crane Productivity
• No of Cranes and long crane analysis• Total moves and moves per crane,• KPIs such as CI, CR, and Crane Density• Crane idle time, delays and stoppage analysis
QUAYSIDE OPERATIONS

• Entry and Exit gate
• Peak hour analysis of Entry and Exit gate• Congestion or wait time at Entry / Exit gate• Container movement analysis by gate and lanes• Increased efficiency in truck allocation & delivery
• Gate Throughput
• Gate volume analysis by Import / Export• Container analysis by Empty / Laden status• Container In/out movement by truck company• Analysis of Gate to Yard and Yard to Gate
• Truck Turnaround
• Turnaround analysis for internal & external trucks
• Truck delay analysis on entry and exit• Truck move analysis at yard• Fuel consumption analysis for internal trucks etc
GATE OPERATIONS

• Revenue and Volume
• Periodical analysis of Revenue and Volume• Comparative Year-on-Year Analysis• Analysis on Local & Transshipment, Empty/Laden• Insights of cargo flow into terminal
• Customer
• Customer behaviour and pattern analysis• Trends and top performers analysis• Seasonal Analytics and Forecasting• Retaining and identification of customer
• Service and Competitor
• Analyse each service and port pair• Comparison of volume with competitor• Performance of terminal operations• Insights into services and competitors
COMMERCIAL KPI's
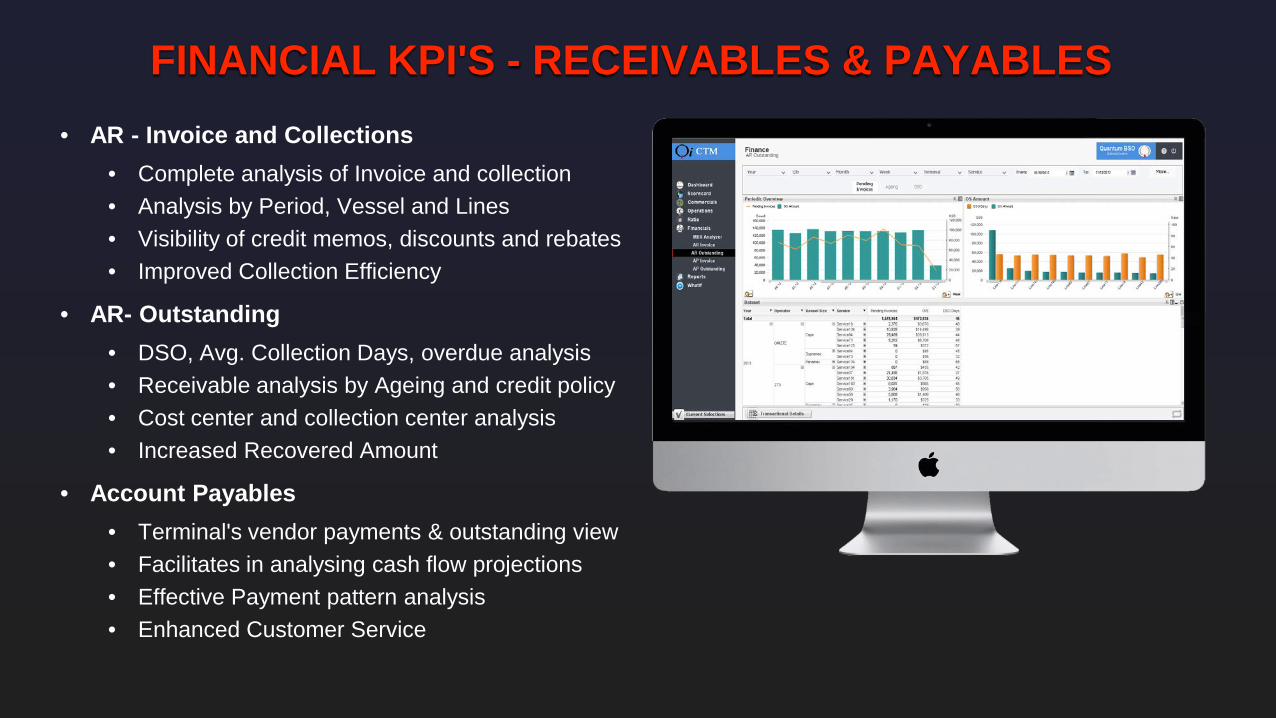
• AR - Invoice and Collections
• Complete analysis of Invoice and collection• Analysis by Period, Vessel and Lines• Visibility of credit memos, discounts and rebates• Improved Collection Efficiency
• AR- Outstanding
• DSO, Avg. Collection Days, overdue analysis• Receivable analysis by Ageing and credit policy• Cost center and collection center analysis• Increased Recovered Amount
• Account Payables
• Terminal's vendor payments & outstanding view• Facilitates in analysing cash flow projections• Effective Payment pattern analysis• Enhanced Customer Service
FINANCIAL KPI'S - RECEIVABLES & PAYABLES
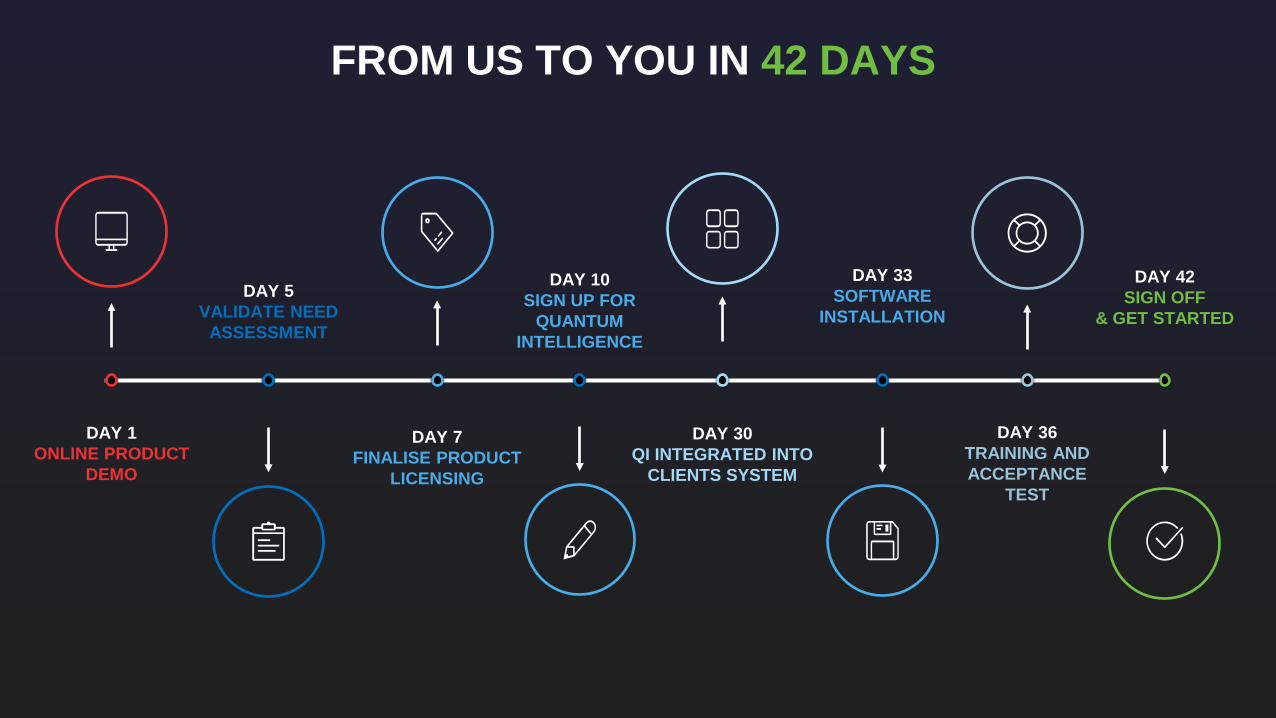
FROM US TO YOU IN 42 DAYS
DAY 42SIGN OFF
& GET STARTED
DAY 33SOFTWARE
INSTALLATION
DAY 10SIGN UP FOR
QUANTUM INTELLIGENCE
DAY 1ONLINE PRODUCT
DEMO
DAY 5VALIDATE NEED
ASSESSMENT
DAY 7FINALISE PRODUCT
LICENSING
DAY 30QI INTEGRATED INTO
CLIENTS SYSTEM
DAY 36TRAINING AND ACCEPTANCE
TEST

LINERSHIPPING
PORTAGENCY CRM
FEEDER & SHORT SEA
NVOCCMULTI-PURPOSE
PROJECTSFREIGHT & LOGISTICS
CONTRIBUTION & YIELD
MODELVOYAGE
PORTS & TERMINAL
DRY BULK CHARTERING
FINANCIAL ANALYTICS
Qi PRODUCT PORTFOLIO

WHAT IS QLIK?
Top 2
Top 3
Top 5
Leaders
Challengers
Visionaries
2009 2012 2013 2014 2015 2016
Abi
lity
To
Exe
cute
Completeness Of Vision
Challengers
VisionariesNiche Players
Leaders
Qlik
Tableau
Microsoft
SAP
IBM
SalesforceAlteryxBirst
YellowfinMicroStrategy
TIBCO Software
• An undisputed leader in Business Intelligence
• In-memory analytics - intuitive, fast and simple
• Can process terabytes of information
• Low on hardware and set-up costs
• Highest approval rating from user experience
• Gartner’s poster boy - universal favourite
• Quantum is an OEM partner of Qlik
• Has exceptional processing capabilities
• Compresses data with unique design
• Qlikview engine is embedded as part of Qi
• Allows rapid ETL; dispenses data warehouse
• Projects can be executed in under 6 weeks

THE QUANTUM STORY?
Office Location HQ in Bangalore, add value globally
Year of Incorporation
What took us from corporate to software
Our key leverage point
Differentiator and strength
Product portfolio
Our team size
2003
The need for innovation; build products;dramatically changed the way people work;integrate and automate; leverage newtechnology; be radical; be evangelists.
Knowledge of transport and logistics
Delivery, On time, On spec, On cost
6 ERP systems, 12 Business Intelligence
Close to 60 professionals

Seeing is believing!!!