enabling environment and policy principles for replicable
TRANSCRIPT

1
Enabling environment and policy principles for replicable technology transfer: Lessons from wind energy in India
Emi MizunoClimate StrategiesCambridge, United Kingdom
Abstract
This article examines cross-border technology transfer between Indian and Danish/German firms in the wind energy industry between 1990 and 2005. The analysis shows the increasing technology gaps between the two sides during this time period, the fragmented and non-performance-oriented market mechanism, the small market size, the policy inconsistency, the institutional inadequacy caused by the power sector restructuring process, the persistent infrastructure deficiency, and the lack of proper oversights, which all contributed to the slowdown of technology transfer after the initial strong transfer trends. The weak demand-pull and supply-push domestic forces in India prevented replicable technology transfer from happening, as technology providers and collaborators looked elsewhere for more reliable market investment opportunities and suppliers.
The research shows the centrality of policy and capacity building to support continuous and replicable technology transfer. Such a policy and capacity-building framework would consist of the following: the creation of sizable and performance-oriented domestic
markets using policy incentives specifically designed for the particular technology; robust project/technology quality requirements to deter incentive abuse; support for physical infrastructure development to accelerate the flow of necessary products, components and services; and financial and technical support for supply-chain and technology-specific capacity building at firm and industry levels. The spectrum of the last, e.g. support for capacity building from manufacturing via project execution to operation, depends on each country’s and/or firm’s choices on ‘what to make’ at home and ‘what to buy’ from outside. Policy decisions in this area require strong communications with industry players and other experts.
Financial and political policy sustainability and, overall long-term consistency of policy frameworks with sound adjustments are essential. Building strong monitoring and evaluation capacity, public-private partnerships, communication pathways, and technology- and industry-specific strategic thinking are requisite for both business and policy communities. Capacity building support from the international community also needs to focus on this area.
2
Introduction
This article examines private-sector wind energy technology transfers from Denmark and Germany to India between 1990 and 2005. The topic was chosen because the sector has a record of international private-sector partnerships between European and Indian companies. Special attention was paid to: 1) the roles and effects of government policy and institutional settings; and 2) enabling environment for technology transfer in order to learn lessons for how developing countries can build favorable environments for replicable technology transfer involving climate change mitigation technologies and catch-up industries.
The article is structured as follows. After this introduction, section 2 describes Indian policy on wind energy development. Section 3 examines the technologies that have been transferred to India from the technology frontier of Denmark/Germany. Section 4 investigates the causal factors which created the technology transfer results. Lastly, Section 5 summarises the lessons learned from these experiences and makes policy recommendations.
Indian Wind Energy Policy and Programs
India began to be serious about wind energy development during the 1980s in order to establish an indigenous industry and exploit further its wind energy potential. Its efforts in the 1980s were mainly technology-push (development of indigenous turbine prototypes; demonstration programs from 1985) and wind data collection (wind resource assessment program from 1983) at the federal level.
The situation changed significantly in the early 1990s. By the beginning of that decade, India had amassed an unsustainable level of public debt and was facing an unprecedented level of economic crisis. This led the country to embark on a massive economic reform
program in 1991. This Economic Reform of 19911 changed the wind energy policy picture greatly; as in other sectors, the federal Government of India (GOI) shifted the focus of wind energy policy to stronger private-sector involvement, extended public finance to private-sector wind-power projects and provided fiscal and financial incentives to encourage private investments. Investment assistance with soft loans and tax benefits for wind project investments started in 1992 at the federal level, although these tax benefits (rates and types of various taxes, tax holidays, rates of depreciation, etc.; see Annex 1) and the interest rates on soft loans changed quite frequently over the years.2
The direction of technology-push measures also changed from initial government-led demonstration projects and indigenous turbine development to the more market-driven approach adopted in 1992 focusing on technology commercialization. From 1997, wind energy R&D efforts concentrated more on government–industry collaboration. The R&D Unit in the Center for Wind Energy technology (C-WET) was established in 1999 to provide generic information and knowledge to innovate wind turbine components
1 As a result of industrial policy with heavy regulations and restrictions controlled by bureaucrats since Independence in 1947, Indian business had suffered from the lack of transparency in the business environment, stagnant private and foreign investments, heavy government spending on inefficient public enterprises and the lack of technological progress. The country suffered from inflation, high budgetary deficits and foreign debt, increasing government duties and taxes, and low GDP per capita. The limited attempts at liberalization made in the 1980s were insufficient to overcome these economic problems. The fiscal imbalance diverted household savings to public consumption and reduced the resources available for private investment. Due to the restrictions on foreign investment and trade, India faced a balance of payments crisis in early 1991, its foreign exchange reserves reaching an all-time low. The GOI attempted a series of short-term policies to finance imports and meet its immediate debt service obligations, which included using its gold reserves to obtain foreign exchange, use the IMF’s special drawing facilities and obtaining emergency assistance from Germany and Japan. Eventually, however, the GOI had no choice but to embark on a program of more fundamental economic reforms and reduce the role of the government in economic development (Bajpai 2002; Bath 1998).
2 For example, the IRENA soft loans for wind power projects changed every year between 9.5% and 21% (Gupta 1995; IREDA 2002b and 2006; Jagadeesh 2000; Sasi and Basu 2002; Wind Power Monthly 1997a; Wind Power Monthly 1997c; Wind Power Monthly 2000; Wind Power Monthly 2004).
3
and subsystems suited for Indian-specific conditions. Meanwhile, the National Wind Resource Assessment Program continued, constantly updating data and wind development potential by considering technical upgrades.
As for power generation project procedural regulations, the GOI abolished the clearance requirements of the Central Energy Authority (CEA) for any renewable energy projects from 1991 (Eased Industrial Clearance). In 1994 the MNES and Indian Renewable Energy Development Agency (IREDA) established joint-sector companies called ‘Wind Energy Estates,’ which set up wind farms in windy areas to provide fully developed plots for the installation of wind turbines by individual investors.3 The first technology quality standards and certificates and project procedure guidelines were introduced in 1995 only after a large number of abuses of these incentives had been reported between 1992 and 1995.
Additionally, the GOI implemented many federal-level wind industry-related policy measures and regulations. The door to foreign investments was substantially widened in 1991, when the GOI began permitting financial collaboration, joint ventures and technical collaboration with foreign entities in many sectors, including wind. Another important policy change after 1991 was a new trade policy, in particular a change in custom duties. Between 1991 and 1994, the GOI trimmed tariff rates on imported power equipment, including wind turbine sets, from 400% to 20%, and custom duties on capital equipment fell to 25% (Bath 1998). Subsequently, however, the import duty rates for wind turbines and components changed quite frequently (see Annex 2). Import application procedures also remained complex until the 2000-01 fiscal year,4 when Duty Exemption Certification (waiving the need to declare critical components) was extended to wind turbine erection and spare parts.
3 The joint sector companies acquire and lease the land, develop infrastructure and grid facilities, obtain the necessary clearances, and install, operate and maintain the wind turbines on behalf of the investors.
4 An Indian fiscal year starts in April of the same calendar year and ends in March of the next calendar year.
Besides import duties, the 1993 tax rule made wind turbines exempt from excise duty and sales tax. The rule changed in 1998: while the first parts of wind turbines and rotor blades had no excise duty, both taxes were placed on spare parts in order to encourage high-quality manufacturing and assembly of the parts in the first place and avoid replacements (IWTMA 2002).
In addition to these federal policy incentives, various states began implementing wind policy incentives from 1992. Due to the federal structure of the Indian power sector, each state dictated the rates of power production incentives (feed-in tariffs) and the conditions for third party sales, banking and wheeling benefits. Many states also implemented state-level capital investment incentives. However, these incentives greatly differed among states. In September 1993, the Ministry of Non-conventional Energy Sources (MNES) issued the first federal guidelines for state-level promotional and fiscal incentives for wind project development to all states. Representative states implementing wind policy measures were Tamil Nadu, Gujarat, Maharashtra, Andhra Pradesh, Karnataka and Rajasthan (see Annex 3 for the diversity of states’ policy measures).
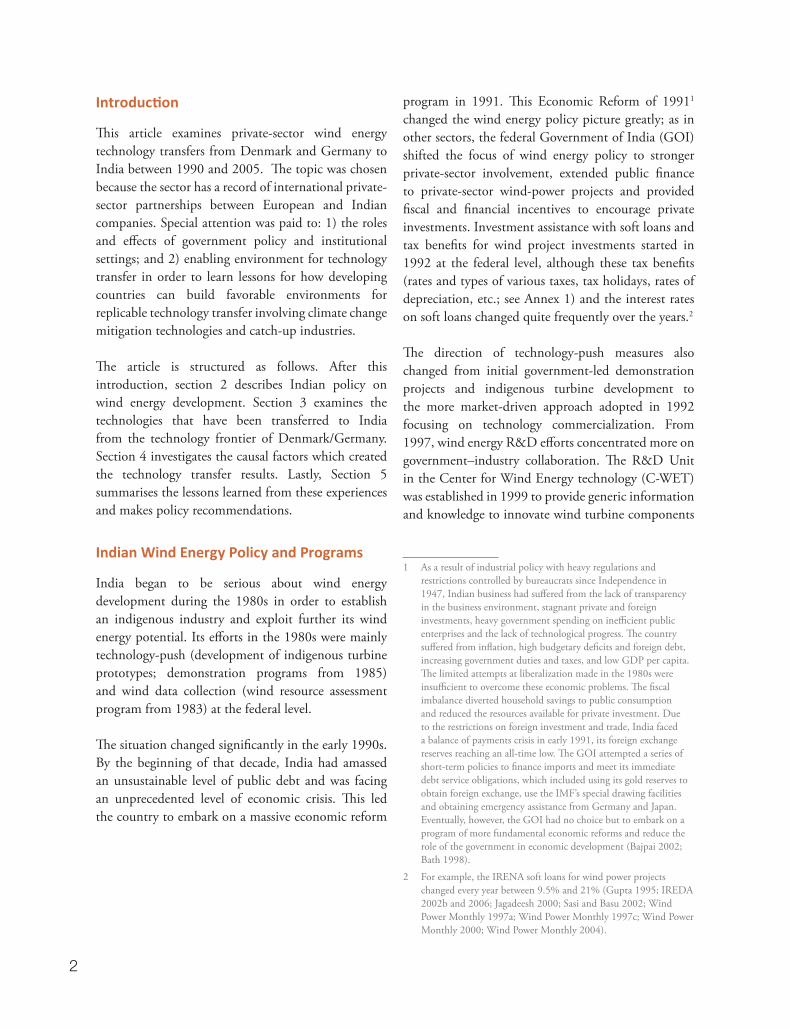
Figure 1 summaries the policy instruments used to promote wind energy in India from 1990 to 2005.
Technology Transfer Results between Denmark/Germany and India
As a result of the above policy implementations, India experienced strong wind energy sector development and technological changes. This section examines the results in terms of private-sector technology transfers, which significantly contributed to the technological changes occurring in product introduction and manufacturing, project execution and innovation capabilities.
Product: Turbine Capacity, Technological Features and Turbine Efficiency
Table 1 shows the wind turbines introduced by Danish and German manufacturers to India between 1993 and 2005 (data extrapolated from Consolidated

4
Figu
re 1
: Win
d E
nerg
y Po
licy
in I
ndia
up
to 2
005
* R
&D
foc
uses
mor
e on
pro
vidi
ng g
ener
ic i
nfor
mat
ion
and
know
ledg
e to
inn
ovat
e co
mpo
nent
s an
d su
b-sy
stem
s su
itab
le f
or I
ndia
n-sp
ecifi
c co
ndit
ions
, in
volv
ing
the
indu
stry
, res
earc
h in
stit
utio
ns a
nd la
bora
tori
es, a
cade
mic
inst
itut
ions
and
end
-use
rs.
**
Five
gen
eric
are
as a
re:
indi
geno
us d
esig
n an
d m
anuf
actu
re o
f al
l ty
pes
of t
urbi
nes
by 2
012;
tec
hnol
ogy
supp
ort
to b
ecom
e ne
t fo
reig
n ex
chan
ge e
arne
r by
20
12;
perf
orm
ance
im
prov
emen
t of
exi
stin
g tu
rbin
es (
Cap
acit
y U
tiliz
atio
n fa
ctor
(C
UF)
fro
m 1
7% t
o 25
% b
y 20
12);
hum
an r
esou
rce
deve
lopm
ent;
and
, re
sear
ch s
uppo
rt f
or w
ind
reso
urce
ass
essm
ent
and
mic
ro-s
itin
g.
***
The
Tec
hnol
ogy
Upg
rada
tion
Fun
d (T
UF)
of
the
Min
istr
y of
Tex
tile
s of
fere
d a
5% r
eim
burs
emen
t on
the
int
eres
t ac
tual
ly c
harg
ed b
y fin
anci
al i
nsti
tuti
ons
on s
anct
ione
d te
xtile
pro
ject
s th
at in
clud
e w
ind
ener
gy e
quip
men
t fo
r ca
ptiv
e po
wer
gen
erat
ion
by t
exti
le b
usin
ess
enti
ties
. The
sch
eme
was
ava
ilabl
e fr
om
Apr
il 1,
199
9 to
Feb
ruar
y 22
, 200
5
Sou
rces
: (M
NE
S 19
95a;
MN
ES
19
95b
; M
NE
S 19
96
b;
MN
ES
19
97a
; M
NE
S 19
97b
; M
NE
S 19
99
b;
19
99
; M
NE
S 2
00
0b
MN
ES
20
01b
; M
NE
S
20
02
b;
MN
ES
20
02
/20
04
/20
06
; M
NE
S 2
00
4,
20
05)
(Gu
pta
19
95;
TE
RI
20
01)
; :(
IRE
DA
20
02
a; I
RE
DA
20
02
b a
nd
20
06
; IR
ED
A 2
00
2c;
Jaga
dee
sh 2
00
0;
(Co
nso
lid
ated
En
ergy
Co
nsu
ltan
ts L
td.
20
05
; R
ajse
khar
, V
an H
ull
e, a
nd
Jan
sen
19
99);
(IW
TM
A 2
00
2;
Khan
na
19
98
; W
ind
Po
wer
Mo
nth
ly 1
99
6a;
Win
d P
ow
er M
on
thly
19
97b
; W
ind
Po
wer
Mo
nth
ly 2
00
3a;
Sas
i an
d B
asu
20
02
; W
ind
Po
wer
Mo
nth
ly 1
99
7a;
Win
d
Po
wer
Mo
nth
ly 1
99
7c;
Win
d P
ow
er M
on
thly
20
00
; W
ind
Po
wer
Mo
nth
ly 2
00
4);
(Jag
an 1
995
).
19
90
1991
19
92
1993
19
94
1995
19
96
1997
19
98
1999
20
00
2001
20
02
2003
20
04
2005
TE
CHN
OLO
GY
DEV
ELO
PMEN
T
Win
d Re
sour
ce A
sses
smen
t Si
nce
1983
D
emon
stra
tion
Si
nce
1985
G
over
nmen
t RD
&D
Si
nce
1980
s m
ore
com
mer
cial
izat
ion
focu
s fr
om 1
992
Indu
stry
Col
labo
rati
on R
&D
*
Fi
ve G
ener
ic A
reas
of R
&D
**
POW
ER G
ENER
ATI
ON
PRO
JECT
PRO
CED
URA
L /
ENV
IRO
NM
ENTA
L R
EGU
LATI
ON
S
Turb
ine
Type
App
rova
l / C
erti
ficat
e
G
rid
Conn
ecti
on O
blig
atio
n
Pr
ojec
t G
uide
lines
Ea
sed
Indu
stri
al C
lear
ance
W
ind
Esta
tes
DO
MES
TIC
MA
RKE
T D
EVEL
OPM
ENT
NA
TIO
NA
L IR
EDA
Pro
ject
Loa
n
Tax
Hol
iday
A
ccel
erat
ed D
epre
ciat
ion
Ze
ro-T
ax
Min
imum
Alt
erna
te T
ax
Tech
nolo
gy U
pgra
dati
on F
und
(TU
F)**
*
IRED
A E
quip
men
t Lo
an
Stat
e Po
licy
Gui
delin
es
STA
TE
Feed
-In T
ariff
s (F
ixed
)
Ta
riff
rat
es v
arie
d gr
eatly
am
ong
the
stat
es
Thir
d-Pa
rty
Sale
s
Th
e co
nditi
ons
of th
ird-
part
y sa
les
vari
ed g
reat
ly a
mon
g th
e st
ates
Pow
er W
heel
ing
The
cond
ition
s of
whe
elin
g va
ried
gre
atly
am
ong
the
stat
es
Pow
er B
anki
ng
The
cond
ition
s of
ban
king
var
ied
grea
tly a
mon
g th
e st
ates
IN
DU
STRY
REL
ATE
D P
OLI
CY &
REG
ULA
TIO
NS
Corp
orat
e Ta
x Re
duct
ion
Prom
otio
n of
For
eign
Inve
stm
ent
Impo
rt D
uty
Mea
sure
s
Ex
erci
se &
Sal
es D
uty
Exem
ptio
n
Ex
erci
se &
Sal
es D
uty
on S
pare
Par
ts
Exer
cise
Dut
y on
Hig
h V
alue
-Add
ed
Act
ivit
ies

5
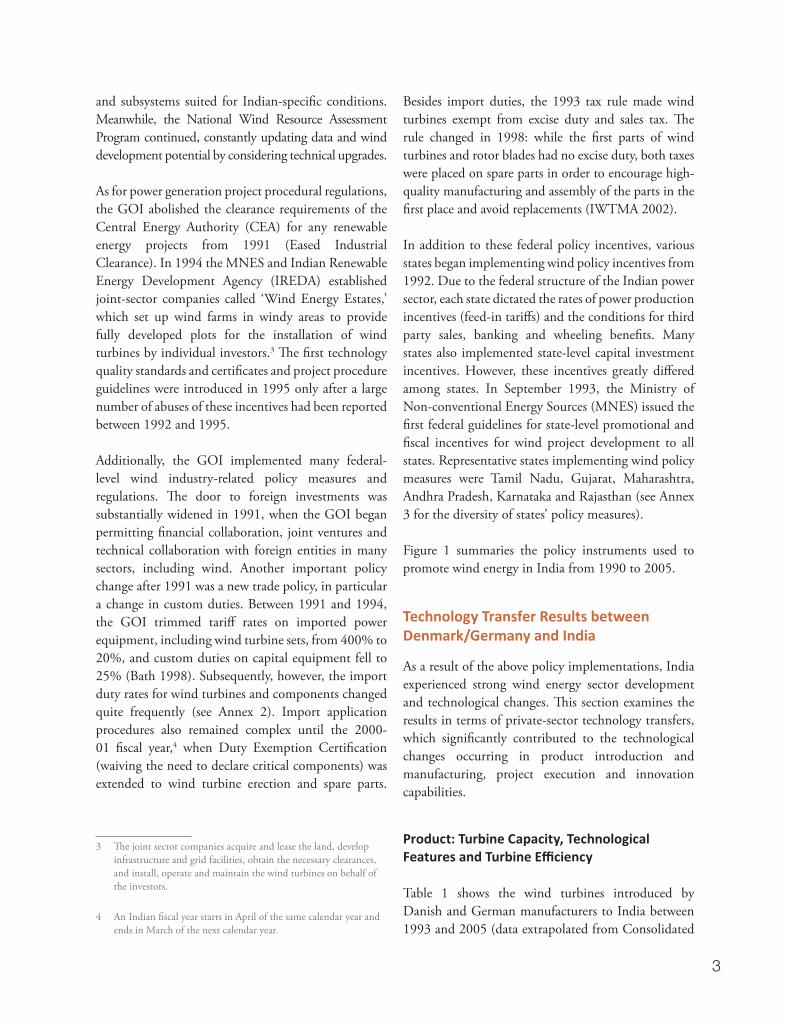
Energy Consultants Ltd. 2005). In terms of turbine capacity, turbines of between 400kW and 600kW capacity had been introduced to the Indian market by the mid-1990s without much of the delay of their European market launch. However, these medium-capacity turbines never became mainstream in India. In addition, a number of turbines between 600kW and 999kW launched on the technology frontier market of Denmark and Germany between 1995 and 2005 were never introduced to India. By 2001, when the Indian manufacturer Suzlon introduced the first 1MW turbines to the Indian market, the major Danish and German manufacturers had already launched several MW-class turbines in the frontier market. By the end of 2005, when a 5MW capacity model had already been launched in the frontier market, India had introduced only four MW-class turbines (up to 2MW). Although not all the turbines launched in Denmark and Germany were necessarily suitable for the Indian market, the number of non-introduced turbines simply cannot be ignored. The Danish and German market also had much higher technology depreciation rates than the Indian market over the years: many wind turbine models which were no longer available in the frontier market were still installed in India in 2005. The average installed turbine capacity of Denmark and Germany compared with India’s clearly illustrates the increasing gaps between 1995 and 2005 (Figure 2).
As for technological features, all wind turbines installed from 1993 to 1997 in India were stall-regulated, fixed-speed turbines, also the mainstream technology at the frontier at the time. Two fixed-speed turbines with dual winding technology were introduced to the Indian market by various manufacturers. However, the gaps in technological features began increasing during the mid-1990s; many important innovations at the frontier either did not arrive in India at all or were introduced with significant time delays, as the number of new turbines introduced decreased. While the increasing number of turbines introduced and installed in India after 1999 up to 2005 had pitch regulation (7 out of 18 introduced turbine models were pitch), fixed-speed turbines were still the majority (11 out of 18 were fixed-speed). Limited-range variable-speed turbines (shown as turbines with DFIG in Table 1), which occupied a large fraction of the market share
Figu
re 1
: Win
d E
nerg
y Po
licy
in I
ndia
up
to 2
005
* R
&D
foc
uses
mor
e on
pro
vidi
ng g
ener
ic i
nfor
mat
ion
and
know
ledg
e to
inn
ovat
e co
mpo
nent
s an
d su
b-sy
stem
s su
itab
le f
or I
ndia
n-sp
ecifi
c co
ndit
ions
, in
volv
ing
the
indu
stry
, res
earc
h in
stit
utio
ns a
nd la
bora
tori
es, a
cade
mic
inst
itut
ions
and
end
-use
rs.
**
Five
gen
eric
are
as a
re:
indi
geno
us d
esig
n an
d m
anuf
actu
re o
f al
l ty
pes
of t
urbi
nes
by 2
012;
tec
hnol
ogy
supp
ort
to b
ecom
e ne
t fo
reig
n ex
chan
ge e
arne
r by
20
12;
perf
orm
ance
im
prov
emen
t of
exi
stin
g tu
rbin
es (
Cap
acit
y U
tiliz
atio
n fa
ctor
(C
UF)
fro
m 1
7% t
o 25
% b
y 20
12);
hum
an r
esou
rce
deve
lopm
ent;
and
, re
sear
ch s
uppo
rt f
or w
ind
reso
urce
ass
essm
ent
and
mic
ro-s
itin
g.
***
The
Tec
hnol
ogy
Upg
rada
tion
Fun
d (T
UF)
of
the
Min
istr
y of
Tex
tile
s of
fere
d a
5% r
eim
burs
emen
t on
the
int
eres
t ac
tual
ly c
harg
ed b
y fin
anci
al i
nsti
tuti
ons
on s
anct
ione
d te
xtile
pro
ject
s th
at in
clud
e w
ind
ener
gy e
quip
men
t fo
r ca
ptiv
e po
wer
gen
erat
ion
by t
exti
le b
usin
ess
enti
ties
. The
sch
eme
was
ava
ilabl
e fr
om
Apr
il 1,
199
9 to
Feb
ruar
y 22
, 200
5
Sou
rces
: (M
NE
S 19
95a;
MN
ES
19
95b
; M
NE
S 19
96
b;
MN
ES
19
97a
; M
NE
S 19
97b
; M
NE
S 19
99
b;
19
99
; M
NE
S 2
00
0b
MN
ES
20
01b
; M
NE
S
20
02
b;
MN
ES
20
02
/20
04
/20
06
; M
NE
S 2
00
4,
20
05)
(Gu
pta
19
95;
TE
RI
20
01)
; :(
IRE
DA
20
02
a; I
RE
DA
20
02
b a
nd
20
06
; IR
ED
A 2
00
2c;
Jaga
dee
sh 2
00
0;
(Co
nso
lid
ated
En
ergy
Co
nsu
ltan
ts L
td.
20
05
; R
ajse
khar
, V
an H
ull
e, a
nd
Jan
sen
19
99);
(IW
TM
A 2
00
2;
Khan
na
19
98
; W
ind
Po
wer
Mo
nth
ly 1
99
6a;
Win
d P
ow
er M
on
thly
19
97b
; W
ind
Po
wer
Mo
nth
ly 2
00
3a;
Sas
i an
d B
asu
20
02
; W
ind
Po
wer
Mo
nth
ly 1
99
7a;
Win
d
Po
wer
Mo
nth
ly 1
99
7c;
Win
d P
ow
er M
on
thly
20
00
; W
ind
Po
wer
Mo
nth
ly 2
00
4);
(Jag
an 1
995
).

6
Table 1: Wind Turbines introduced by Danish Manufacturers 1993-2005
Source: extrapolated from Consolidated Energy Consultants Ltd. 2005
Manufacturer Capacity RD (m)
Power Control
Rotor Speed
Generator Installation in
India European
Launch
AMTL - Wind World
220kW* 250kW
500kW*
N/A 25 37
Stall
N/A 2-fixed 1-fixed
WRIG
1993 1994-1999
1996
N/A** 1991 1992
BHEL- Nordex 200kW 250kW
N/A 29.7
Stall N/A
1-fixed WRIG
1994-1996 1995-1999
N/A** 1994
C-WEL - DeWind 600kW* 46 Pitch Variable DFIG/CV 2001-2002 1997
Enercon India
230kW 330kW 600kW 800kW
30 33.4 44 48
Pitch Variable WRSG/ DD/CV
1995- 2005- 2001- 2005-
1995 2005 2001 2005
Enron/GE Wind (USA-Germany,
subsidiary)
600kWa* 750kWi* 1.5MWs*
46 50
70.5
Active S Pitch Pitch
2-fixed Variable Variable
IG DFIG/CV DFIG/CV
2002 2002 2004-
1998 2001 1999
Flovel Tacke 250-80kW*
600kW* 26 43
Stall Stall
2-fixed Fixed
IG N/A
1996 1995
1990 1994
Grematch - Pegasus
250kW* N/A N/A N/A N/A 1995 N/A
NEG Micon (Subsidiary)
750kW 950-200kW
1.65MW
48.2 54.5 82
Stall Active S Active S
2-fixed 2-fixed 1-fixed
WRIG 1999- 2002- 2004-
1998 2001 2003
NEPC Micon
225-40kW 250kW
400-100kW 600kW*
29.8 29 31 42
Stall
2-fixed 1-fixed 2-fixed 2-fixed
WRIG
1993-1998 (1989), 1993-1998
1994-1998 1995
N/A** N/A** 1992 1994
NEPC - Norwin 750-180kW* 47 Active S 2-fixed WRIG 2005-present 1998
Pioneer- Wincon 250kW
750kW* 29 48
Stall Semi- Pitch
1-fixed 2-fixed
WRIG 1995- 2002
1995 1998
REPL - Bonus 320kW 33 Stall 1-fixed WRIG 1995 -1997 N/A**
Suzlon - Südwind
270kW* 350-100kW
N/A 33.4
Stall N/A
2-fixed WRIG
1996 1996 - 1997
1993 1996
Textool -Nordtank
300kW 550kW*
31 37
Stall 1-fixed WRIG (1991) 1996
1996 1985 1992
Vestas RRB 225-50kW
500kW 27
42/47 Pitch
2-fixed 1-fixed
WRIG 1993 – 1995 -
1988 1993
TTG - HSW 250-80kW 28.5 Stall 2-fixed PEIG 1994- 1990
* The total installation number of these turbines was less than ten. ** No European record available for these makes. The numbers in parentheses indicate the year introduced by demonstration projects before 1993 in India. Keys: DFIG = Doubly Fed Induction Generator, WRIG = Wound Rotor Induction Generator, DD = Direct Drive, WRSG = Wound Rotor Synchronous Generator, PEIG = Permanently Excited Induction Generator, CV = Converter, IGBT= Insulated Gate Bipolar Transistor

7
at the frontier, had had a very limited number of installations in India by 2005.
The gaps in both turbine capacity and technological features created the large power generation efficiency gaps between the frontier and India due to the differences in aerodynamic efficiency and energy capture. Figure 2 illustrates the gaps by comparing turbine efficiency (turbine power generation efficiency), calculated by dividing yearly-generated wind electricity by the cumulative number of turbines.5
5 Turbine efficiency is usually calculated by yearly generated electricity divided by total rotor-swept area. However, this method of calculation has not been adopted here because the data regarding total rotor-swept areas of Germany and India over the years was not available. Yearly differences in wind and weather conditions have also not been normalized due to a lack of data.
It shows the staggering increase in the gaps in power generation efficiency between Denmark/Germany and India over the years, even taking weather and climate differences between the two areas and year-to-year weather variations into account. Between 1992 and 2003, turbine efficiency in Denmark and Germany increased 3.9-fold and 6.4-fold respectively, while efficiency growth in India remained only 1.6-fold. The turbine efficiency and capacity trends in the three countries show the similar gaps. The influences of the gaps in turbine capacity and variable speed operations on turbine efficiency were evident, as the turbines installed in Germany show the highest efficiency increase over the years.
0
500
1000
1500
2000
2500
0
200
400
600
800
1000
1200
1400
1992 1993 1994 1995 1996 1997 1998 1999 2000 2001 2002 2003 2004
Ave
rage
Inst
alle
d Tu
rbin
e Ca
paci
ty (M
W)
Ave
rage
Tur
bine
Eff
icie
ncy
(MW
h /U
nit)
YearCapacity India Capacity Denmark Capacity Germany
Efficiency India Efficiency Denmark Efficiency Germany
0
500
1000
1500
2000
2500
MW
Fiscal Year (April to March)
Andra Pradesh Gujarat Karnataka Maharashtra
Rajasthan Tamil Nadu Others Total
Figure 2: Average Turbine Capacity and Efficiency by Country
Note: Due to the differences in statistical years between Denmark/Germany and India, the Danish/German calendar year (January to December) is compared to the Indian fiscal year (April of the same calendar year to March of the next calendar year). For example, data for the Danish/German 1992 year is compared to the Indian 1992-1993 fiscal year. The comparison, however, is considered approximate enough.
Sources: Danish Wind Industry Association 2006; DEWI and ISET in BWE 2005; Consolidated Energy Consultants Ltd. 2005: DWIA, DEWI, BTM Consult ApS 2005b

8
Capability: Manufacturing, Project Execution and Innovation
The Indian wind industry indigenized small-capacity foreign-designed turbine-manufacturing technology at high level early on. By the end of March 1995, MNES estimated the indigenization of manufacturing technology for up to 250kW capacity wind turbines as nearly 70% in terms of the number of components, while blades, special bearings, etc. were still being imported (MNES 1995a). By 1997 the industry-wide rate grew nearly 80% (MNES 1997a). However, the indigenization level of high-value and high-tech component manufacturing and their quality remained low. The dependence of high-tech power electronics and controllers on imports was never reduced, and med-tech mechanical engineering components made in India were still prone to failures. Many components of large-capacity turbines commercialized at the frontier since the mid-1990s were not introduced in India, with the exception of direct-drive WRSG with IGBT converter by Enercon, slip-ring generator application by Suzlon, and Glass Fiber Reinforced Epoxy (GFRE) blades and individual pitch mechanism by both firms. As for blade manufacturing capability, resin vacuum infusion and automation technologies related to vacuum infusion were indigenized in India through the manufacturing activities of LM Glasfiber India, Enercon India, and Suzlon. Manufacturing of 34m-length blades for 1.5MW turbines and 40m-length blades for 1.65MW turbines started in India in 2004 (MNES 2005), but manufacturing of other large blades for many multi-MW class turbines commercialized at the frontier were not introduced. In addition, the quality issues of components manufactured in India still persisted. Despite the approximately fifteen years of experience, still 20% of gearbox failures and breaking of blade tips were being recorded in 2003 (Wind Power Monthly 2003b). Overall, many of the gaps in mid-tech manufacturing capability between Denmark/German and India were not reduced, and the gaps in high-tech and complex component manufacturing capability for large-capacity turbines greatly increased.
In terms of wind power project execution, skills and know-how of project planning, site assessment, site development and micro-siting in India were low at
the beginning and caused many project failures in the early and mid-1990s. However, these project execution capabilities advanced greatly since the mid-1990s through joint venture and license agreement collaborations. Progress in and the transfer of remote monitoring SCADA (Supervisory Control and Data Acquisition) products, as well as project development software tools such as WAsP and WindPRO for local wind-resource mapping, optimization, and micro-siting, also helped the Indian industry to enhance these capabilities.
As for innovation capacity building, in general this had been slow. Government–industry R&D collaboration schemes developed by MNES in 1997 were seen as passive and limited by industry insiders, as they were not utilized widely (Shekhar, Kumar, and Shar 2001). In terms of in-house innovation capacity building by manufacturers, Enercon India and Suzlon built the R&D facilities in India, but their main R&D activities still remained in Europe. While innovation capability greatly advanced at the frontier with various high-technology developments since 1990, none of the significant innovations were carried out in India. The innovation capability gaps grew greatly between 1990 and 2005.
Overall, the increasing gaps between the frontier and India were seen in all of product technology, the manufacturing capability of med-tech/high-tech components, and innovation capability.
Causal Factors of the Increased Technology Gap
This section examines the causal factors of the increasing technology gaps illustrated in the previous section from the perspectives of the market, industry and infrastructure, and their relationships with policy.
Market-related Factors
At the end of March 1989, India had only 10MW of total installed wind capacity, all in the form of government demonstration projects. With the introduction of market development policy measures in 1992, however, India began experiencing strong

9
wind market growth. By the end of the 1995-96 fiscal year, installation grew very rapidly. The market slowed down dramatically from 1996-97 and the recovery was slow; annually installed capacity exceeded the 1994-95 level only in 2001-02. 2003-04 and 2004-05 saw the strongest installation, in record numbers (Figure 3).
The market fluctuation was seen not only at the national level but also at the state level. There was a strong disparity in wind energy development among the states too. Only a handful of states implemented state policy measures contributed to wind energy development. The first wave of development was concentrated mainly in Tamil Nadu and Gujarat between 1992-93 and 1995-96. Maharashtra was the main market between 1998-99 and 2001-02 when other state markets stagnated. The picture changed again from 2002-03, when Tamil Nadu, Rajasthan and Karnataka became the main wind development locations. The differences and fluctuations in growth patterns by state illustrate the strong market segmentation within India. Overall,
Indian market demand in terms of size, location, and stability was highly uncertain.
As for investor profiles, more than 98% of total installed capacity from 1992 to March 2005 was developed by industrial firms. According to MNES, 80% of wind power fed into the grid was used as captive consumption, being consumed by these investor-developers (industrial firms) themselves at a distance via wheeling, and 78% of wind-power buyers were energy-intensive manufacturing firms (Winrock International India 2003).
The fluctuations in the Indian market were mostly caused by the unstable policy and institutional environments. The first boom years occurred from 1992 to 1996 due to the combination of the generous 1993 tax rule incentives (the first-year 100% depreciation of capital equipment and zero-tax planning) and the IREDA soft loans for wind projects. Foreign Direct Investment (FDI) stimulation from 1991 and the
Figure 3: Annually Installed Capacity in MW by State in India
Source: MNES cited in (Consolidated Energy Consultants Ltd. 2005)
0
500
1000
1500
2000
2500
0
200
400
600
800
1000
1200
1400
1992 1993 1994 1995 1996 1997 1998 1999 2000 2001 2002 2003 2004
Ave
rage
Inst
alle
d Tu
rbin
e Ca
paci
ty (M
W)
Ave
rage
Tur
bine
Eff
icie
ncy
(MW
h /U
nit)
YearCapacity India Capacity Denmark Capacity Germany
Efficiency India Efficiency Denmark Efficiency Germany
0
500
1000
1500
2000
2500
MW
Fiscal Year (April to March)
Andra Pradesh Gujarat Karnataka Maharashtra
Rajasthan Tamil Nadu Others Total

10
import duty reduction from 1993 supported the boom by bringing the required technologies from abroad. However, a peculiar aspect of the Indian wind market was the total irrelevance of wind power production incentives (feed-in-tariffs). This situation was created because the power-usage charges imposed on industrial customers by the State Electricity Boards (SEBs) was higher than the feed-in tariff payments. Traditionally the Indian SEBs used cross-subsidies which imposed far more expensive power-usage charges on industrial customers than on residential and agricultural customers, and this mechanism made industrial investors simply use wind power plants as their captive power consumption plants to avoid expensive power-usage charges, in addition to getting one-time tax benefits. Thus, the wind-power feed-in tariff incentives were totally irrelevant regarding the control of market development; Indian investment in wind energy simply gave industrial firms some short-term tax-planning and management tools.
The tax-saving practices without any project quality-assurance measures by the government also stimulated the questionable practice of gold-plating6 by many investors. The first boom years were ended by the sudden policy changes of late 1995; the large reduction in tax benefits, the increased interest rates for IREDA loans, the higher import duties for wind turbine components from 1997, the extremely low performance level of wind energy plants during the first boom years and the great uncertainty involving the financial conditions of the SEBs, which started implementing unfavorable state wind-energy policies, all deterred investments, although the new federal project quality policy measures successfully eliminated the fraudulent investors. The market began experiencing strong growth again after the enactment of the 2003 Electricity Act, which
6 Gold-plating practices put far more expensive price tags on the turbines used in wind power projects than fair market prices, in order to inflate the project capital costs and receive more tax benefits and loans from governments.
streamlined and resolved many power sector issues.7 The success of the gradual transfer of the decision-making power from the SEBs to the State Electricity Regulatory Commissions (SERCs) as the result of the 1998 Reform Act,8 the steady reduction of IREDA loan interest rates, Technology Upgradation Funds (TUF) and the gradual increase in turbine capacity and improvement to project execution technology also contributed to market recovery after 2000. These market conditions, created by the complicated policy and institutional landscapes, greatly influenced technology transfer and development activities in India. Overall, the effects of market demands on project economic efficiency improvement, cost reductions and
7 This Act changed some fundamental aspects of the electricity sector of India, including the following: 1) completely de-licensing power generation, except for interstate hydro projects, and allowing free entry to power generation for businesses; 2) freely permitting captive generation by removing all licensing and permissions; 3) providing all power generation plants with open access to the transmission grid, as well as rights to build transmission lines for a fee in order to wheel power for self-usage or for third-party sales; 4) obliging all state governments to separate transmission activity from SEBs and to establish state-owned State Transmission Utilities as well as SERCs, while providing state governments with the freedom to decide the sequences and phases of restructuring; 5) ordering SERCs to determine tariffs based on commercial principles and gradually eliminating cross-subsides; 6) permitting consumers to enter direct commercial relationships freely with generating companies or traders after open access is allowed; 7) introducing power trading; and 8) obliging GOI to formulate a National Electricity Plan and CEA to prepare the National Electricity Plan (Prayas 2003). As for renewable energy, the 2003 Act limits the role of state governments to formulating policies related to: 1) providing government lands at nominal cost for renewable energy projects; 2) providing subsidy for the cost of infrastructural development; and 3) providing the cost of electricity purchase by licensees from renewable energy plants. Tariffs and charges are now decided not by state governments or SEBs but by SERCs. The predominant roles of SERCs are: 1) to determine tariffs for the generation, supply, transmission and wheeling of electricity within the state, as well as surcharges for open access to consuming power from a source other than a licensee; 2) to regulate electricity purchase and procurement distribution processes; 3) to facilitate the wheeling of electricity within the state; and 4) to promote electricity generation from renewable energy sources by providing suitable measures for grid connection and power sales to any person, as well as measures that specify a percentage of total consumption of electricity in the area of distribution licensees for the purchase of electricity from such sources (Consolidated Energy Consultants Ltd. 2005).
8 This 1998 Act was replaced by the 2003 Electricity Act.

11
the introduction of low-wind-specific technology were fairly weak in India as a result of the greatly fluctuating market conditions. Despite the similarity of these demand characteristics with Denmark and Germany, they did not induce technological change through technology transfer after the mid-1990s.
The main cause for this was the small market size. In Europe, the regional market, especially the huge German market, strongly pulled technology development by the Danish and German manufacturers into the directions the market demanded. Conversely, with the recession from 1996-97 the Indian market simply lost such pulling-power to attract the introduction of newer and larger turbine models, which required larger investments as they cost more to manufacture and install. The prospect for economies of scale was also very limited in the small Indian market. Thus, a large market size and market certainty and continuity were lacking in India: even though many market demand characteristics were similar to those in the frontier market, without a sizable market and its own pulling power, technology upgrading through replicable technology transfer did not happen. The small market made all demands for technological improvement insignificant.
In addition, as described previously, Indian investment in wind was supported only by the industry’s investor-developers, whose primary drive was not to make viable wind projects but to manage taxes and escape from the unreasonably high power-usage charges imposed on them. This contributed to the consistently low Internal Rate of Returns (IRRs) and the weak demands for IRR improvements. Thus, the market was not oriented towards economic performance. Although the IREDA revolving fund and soft loans, the encouragement of FDI and the reduction in import duties greatly helped the creation of market, without any proper mechanisms to prevent the abuse of government incentives, the market’s and investors’ lack of interest in the performance of wind turbines which could greatly improve the IRR created extremely weak demand for technological improvement.
The abrupt policy changes during the mid-1990s added great political uncertainty to the already
problematic market mechanism. The low economic performance of the wind projects built during the first boom years, the rising interest rates and the soured relationship between investors and SEBs caused by the SEBs’ problematic finance and pricing strategies all contributed to deterring many further investments. The confusing process of India’s power sector reform and restructuring, which allowed some privatization to take place in private-sector power generation while leaving cross-subsidies in power-usage charges intact among various sectors because of the incomplete commercialization and not targeting the recovery of capital, operational and maintenance costs, created the self-contradictory mechanisms of the SEB policy, and affecting wind energy market growth negatively in the process. Market adjustment was therefore slow, and market continuity and certainty were well beyond reach.
The three-year market setback since 1996 was devastating for India’s wind energy technology upgrading through technology transfer, because there was simply no attractive market to pull the extensive technological progress made at the frontier during this period. Regional Asian market demands were also weak, doing nothing to help utilize or augment Indian manufacturing capacity by producing export orders. Even after 2000, when the market began improving, India was not considered a primary investment spot for technology upgrading, as the market was far smaller compared to the combined regional European markets. The enactment of the Electricity Act in June 2003, the continuous restructuring of the SEBs and the establishment of the SERCs had positive effects on the market recovery. However, insufficient demand-pull after 1996 created persistent and damaging effects on India’s technology development and diffusion, as could still be seen in 2005.
Industry-related Factors
The economic reforms since 1991 and the new wind energy policy triggered the strong expansion of the wind industry too. The Indian wind turbine industry was largely formed through business diversification of local firms through technical collaboration agreements (joint venture or license agreement) with the

12
manufacturers on the technology frontier. The main trigger for these collaborations was the encouragement of FDI in 1991.
Table 2 shows the entry and exit of turbine manufacturer businesses in India, which clearly demonstrates that most of them had foreign technology collaborators. However, it also shows that the majority of these firms exited from the Indian market between 1996 and 1999, which corresponds to the severe three-year market slowdown. Only four technology collaborations established before 19969 still survived in 2005. The new entries after 1997 include two subsidiaries, which were 100%-owned by foreign manufacturers (NEG Micon and GE Wind), and three independent firms, two of which (Suzlon and NEPC India) became independent after the dissolution of their original partnerships with the European technology providers and collaborators. NEG Micon India (subsidiary of NEG Micon) and Vestas RRB were both still in business separately in India as of the end of 2005, though their Danish partners merged into one firm (Vestas) at the end of 2004.
These industry transformations influenced the technology transfer results greatly. Technology transfer was active in the early to mid-1990s through technology collaborations. By 1998, however, many technology providers and collaborators had pulled out of the Indian market. The reasons varied from the market slowdown and financial, technical or ethical problems with Indian partners, to their own business exits at the frontier. The number of technology introductions consequently declined because of the reduction of technology providers and collaborators.
The slowdown in the introduction of updated technology was also seen in the surviving technology collaborations, and it was more problematic. The resistance to passing manufacturing and production licenses to Indian partners became obvious from the turbines above 500kW capacity after the mid 1990s. This tendency was stronger in divided ownership
9 This excludes TTG Industries, whose existence was unknown as of 2005.
firms (joint ventures and license agreements) than in undivided ownership firms (100% foreign subsidiaries and an independent Indian ownership firm) (see Table 3). The increasingly tighter technology and cost management and controls due to the growing competition at the frontier and the Indian market slowdown reduced the strategic advantages of joint ventures and license agreements with Indian partners. In addition, persistent low-quality production in India offset the cost advantages derived from low cost labor for export; the Indian firms could not meet the demands for higher-quality high-tech export products. This further limited the opportunities to improve the quality of manufacturing in India and affected the chances of being part of global value chain and sourcing networks, thus creating a negative feedback loop.
Technology components innovated at the frontier also increasingly became difficult to introduce on an individual basis, as their system integration needs became higher and higher. Acquiring high-level technology requires high-level capability as well as cumulative experiences, but the technological capacity to attract more updated technology was weak in India. Thus, supply-push technology transfer was weak, as the Indian side did not build sufficient capacity to support the progressively more competitive global technology and cost management needs.
In terms of the role and effects of policy on supply-push technology transfer, various industry-related policy measures without proper supervision of firm operations and technology or project quality control contributed to the limited formation of manufacturing capacity, allowing many low-quality projects and technologies to prevail, and only a handful collaborations actually built manufacturing facilities with serious in-house quality control.
There was also a lack of more direct and specific technology-push policy to support manufacturers in building the higher capacity needed to become the export base, due to the limitations of government interventions to individual joint venture and license agreements. Most technological decisions were left to the mercy of foreign technology providers

13
Entry Year
Indian Firm Foreign Collaborator Exit Year
1985 BHEL ----
1986 Vestas RRB Vestas (Denmark)
1987 NEPC Micon Micon (Denmark) 1999*
1993 AMTL Wind World (Denmark) *
1994
BHEL Nordex (Denmark) 1999**
Elecon HMZ (Belgium) 1998
TTG Industries Husumer Schiffswerft (Germany) *
1995
ABAN Loyd Kenetech (USA) 1997
Das Lagerwey Lagerwey (The Netherlands) 2000
Enercon India Enercon (Germany)
Flovel Tacke (Germany) 1997*
Grematch CNC Pegasus (Germany) 1995
Himalaya ---- 1996
Windia Nedwind (The Netherlands) 1998
Pioneer Wincon Wincon West Wind (Denmark)
REPL Bonus (Denmark) 1997
Sangeeth Carter (USA) 1997
1996
JMP Ecotecnia (Spain) 1996
Rayalseema Mitsubishi (Japan) 1996
RES AWT (USA) *
Suzlon Südwind (Germany) 1996
Textool Nordtank (Denmark) 1996
1997 Kirloskar WEG (UK) 1998
Suzlon -----
1998 NEPC India -----
1999 NEG Micon (subsidiary) NEG Micon (Denmark)
2000 C-WEL -----
2001 C-WEL DeWind (Germany) 2002
2002 Elecon Turbowind (Belgium)
GE Wind Energy (subsidiary) GE Wind Energy (USA)
2005 Pioneer Asia Gamesa (Spain)
Bold letters show firms active as of March 2005. Entry year is defined as the year that the firm installed its first turbine, exit year as when the firm installed its last turbine in this table. Although the original source shows some other manufacturers on the list, this table only included those that installed turbines, locations and dates of which were verified by the data in the source. * These collaborations already ended in the late 1990s or before the specified exit years. However, the
turbines originally provided by the providers were continuously manufactured and offered in India independently by the Indian firms after their partnerships ended. Flovel ceased the installation of turbines altogether in 2001.
** Nordex and BHEL ended its first licensing agreement in 2002, but a new agreement was in place by 2003. However, no installation was made between 1999 and March 2005.
Table 2: Turbine Manufacturer Entry and Exit in India
Source: extrapolated from Consolidated Energy Consultants Ltd. 2005.

14
Table 3: Firm and Technology Ownership and Introduced Turbine Capacity by Surviving and New Manufacturers in India
Source: extrapolated from (Consolidated Energy Consultants Ltd. 2005).
Divided Firm/Technology Ownership (Joint venture/license agreement)
100% Firm/Technology Ownership (100% subsidiary/independent Indian firm)
Turbine Make and Capacity Introduction
Turbine Make and Capacity Introduction
India Europe India Europe Small-Capacity (less than 500kW)
Vestas RRB 225-50kW (JV) 1993 1988 C-WEL 250kW (I) 2000 Pioneer Wincon 250kW (JV) 1995 1995
Enercon India 230kW (JV) 1995 1996 Enercon India 300kW (JV) 2005 2005 BHEL-Nordex 200kW (LA) 1994 N/A BHEL-Nordex 250kW (LA) 1995 1994
Medium-Capacity (between 500kW and 1MW) Vestas RRB 500kW (JV) 1995 1993 NEG Micon 750kW (S) 1999 1998
Pioneer Wincon 755kW (JV) 2002 1998 GE Wind 600kWa (S) 2002 1998 Enercon India 600kW (JV) 2001 2001 GE Wind 750kW (S) 2002 2001 Enercon India 800kW (JV) 2005 2005 Pioneer Asia 850kW (JV) 2005 2004
NEPC-Norwin 750-180kW (LA) 2005 1998 C-WEL-DeWind 600kW (N/A) 2001 1997
Elecon-Turbowind 600kW (N/A) 2002 N/A Large-Capacity (larger than 1MW)
NEG Micon 950-200kW (S) 2002 2001 NEG Micon 1.65MW (S) 2004 2003 GE Wind 1.5MW (S) 2004 1999 Suzlon 1MW-250kW (I) 2001 2003 Suzlon 1.25MW-250kW (I) 2002 2003 Suzlon 2MW-250kW (I) 2005 2004
JV = Joint Venture, LA = License Agreement, S = Subsidiary, I = Independent
and collaborators, which strictly controlled which technologies should be introduced to and how they should be handled in India through restricted business practices and technology transfer agreements. Because such practices usually prohibited any Indian R&D and adjustments to technologies from the frontier, the government–industry R&D collaboration schemes drawn up by MNES for developing technologies to meet Indian-specific needs were simply unrealistic.
As for technological capacity building, the contradictory use of import duties aimed at simultaneous cost reductions and indigenous technology development ended up deterring both market investments and technology introduction by
confusing both investors and manufacturers.10 The conflicting use of manufacturing incentives was also evident in the use of exercise duty: imposing a high exercise duty on high-valued activities had negative impacts on the improvement of technological capacity building, though the duty differentiation between the first and second components did contribute to
10 Low duties targeted the easy import of components and cost reductions to encourage the market investment. Meanwhile, high duties were aimed at import restrictions on components which were desired to manufacture in India to increase domestic technological capability. Indian policy was very confusing because these opposed measures often targeted the same components. The duties were frequently changed, as the GOI itself was confused.

15
the improvement of manufacturing and assembly activities.11 The lack of consistency in these import and manufacturing incentives confused the industry and ended up hindering both product introduction and the manufacturing capability building of higher-valued components.
Infrastructure-related Factors
Some general infrastructure issues also influenced wind energy technology development and diffusion in India. One problem was its weak grid, which was especially connected with reactive power consumption. 12 The other issue was the general road and port infrastructure problems in the country, which hindered the transport and construction efforts required for wind turbine manufacturing and power project construction. These two issues were closely intertwined.
In general, wind energy technologies and technical solutions developed at the frontier show sufficient adequacy to control the negative effects of the low wind and weak grids in India. This was particularly true of pitch-controlled, variable speed turbines. However, the technology transfer results show that these technologies were of minor importance in India up to 2005. One of the important reasons hindering the introduction of these technologies was deficiencies in road and port infrastructure, which greatly limited the size of the turbines that can be transported and installed in India. As the insufficient infrastructure hindered the introduction of large-capacity high-tech turbines, the technologies that can address the problems related to the weak grids and low wind conditions were not brought to or diffused in India because they were parts of large-capacity turbine technologies. Regardless of the privatization of the transport and logistical sectors since 1991, improvements were slow. Although
11 Putting more duties on replacement components encouraged manufacturers and developers to avoid costly replacements and to manufacture and assemble the first components correctly.
12 Reactive power is the consumption of power from the grid to create a magnetic field inside a Wound Rotor Induction Generator (WRIG) in order to start it. The problem is specific to wind power generation using WRIG at a low loading stage. Reactive power reduces transmission efficiency.
the wind manufacturer-developers assumed the responsibility for developing the road infrastructure to reach the project sites and fortify power evacuation facilities wherever necessary,13 the efforts of individual manufacturers had their limitations. MNES could not offer any significant support for logistical improvements (Twele 2005). The lack of support from MNES for improvements to the deficiencies in the transport infrastructure was not a surprise, given that the issues cannot be solved by one ministry and/or one industry alone. As for the Transmission and Distribution (T&D) deficiency, despite the principle that the SEBs should be responsible for upgrading facilities and fortifying weak grids, this was not done because of their severe financial difficulties. This issue also involves many other energy-related ministries and industries.
Policy supports necessary to systematically solve infrastructure deficiency problems require better coordination among various ministries and larger and continuous investments. These did not exist in India, affecting technology transfer greatly.
Policy Recommendations to Create an Enabling Environment for Replicable Technology Transfer
India’s experiences with wind technology have some important lessons for how to encourage private-sector replicable technology transfers from developed to developing countries. The small market size, the non-performance-oriented market mechanism, the policy inconsistency, the institutional problems of the power sector, the lack of technological capabilities to meet the increasingly higher quality requirements of wind energy technology and the persistent infrastructure deficiencies in India, along with tighter technology
13 Actually the difference in marketing and development approach created discrepancies in installed turbine sizes among manufacturers. For example, one of the reasons that Suzlon led the pack in terms of turbine size was that the firm began the so-called ‘Wind Park’ approach (the firm develops a large tract of lands and infrastructure altogether and then sells a patch of the development and services to investors), thus solving many infrastructure-related problems and creating economies of scale.

16
controls by technology providers and collaborators, all contributed to the increasing technology gaps in both product and capabilities with the frontier after the mid-1990s.
Enabling Environment for Replicable Technology Transfer
In addition to the domestic factors mentioned above, external factors such as the rapidly increasing high-tech characteristics of wind energy technology systems and the fast structural transformations of the industry at the frontier made it difficult for India to cope with the various changes. Nonetheless, domestic factors were the more serious causes of the increasing technology gaps and the lack of replicable technology transfer, preventing economic efficiency and technological improvements. The lack of positive feedback from India to the frontier during the constant industry and technology transformation deterred replicable transfer when the Indian market slowed down, demonstrating that the process or history greatly influence whether technology transfer is replicated or not. FDI and the formation of technology partnerships alone do not automatically guarantee continuous technology upgrading and replicable technology transfer. Replicable technology transfer is process-oriented, demanding simultaneous and continuous demand-pull created by sizeable and performance-oriented markets and technology-push connected to technology-specific learning mechanisms and market trials. Policy is central to materializing these two forces.
Financial and policy sustainability, as well as overall and long-term consistency of policy frameworks with sound adjustments and sequencing, are essential to support such process-oriented technology transfers. In addition to the creation of general enabling environments such as macroeconomic policy frameworks, technology- or industry-specific policies and enabling environments are equally important because economics and industry characteristics and their transformations are strongly technology-specific. Strong monitoring and evaluation capacities by policy makers and good public-private partnerships and communications are critical to create in creating such an enabling environment.
The article recommends the following rather simple frameworks for creating a virtuous cycle of replicable technology transfers involving distributed energy technologies and devices such as wind.
Policy for Sizable Market and Performance-oriented Demands
In order to stimulate more efficient and updated technologies repeatedly through private-sector technology transfer activities, the sizeable and performance-oriented market demands which continuously pull such technologies are fundamental; the market demand characteristics are a necessary but not sufficient condition for inducing technological change, which also requires a strong market pull. The performance-oriented market cares about economic efficiencies, resulting in constant demands for higher quality technologies. Consistent but flexible policy measures tailored to each technology status and characteristics are central to the creation of such a market.
• Capital investment, fiscal and financial, and power production incentives can be all used wisely to create performance-oriented demands. Market growth should be controlled by these sector-specific policy measures, in order not to repeat the Indian wind economics situation, which was affected by a factor external to the wind industry, namely the high power-usage charges imposed on industrial consumers. Engaging in sunset clauses of capital investment and short-term fiscal measures is also important to make the market more performance-oriented.
• Market segmentation is strongly opposed to the creation of strong market pull. National, regional and international policy collaborations can be helpful in creating a sizable market, and this can be done without the geographical proximity of each market.
• Implementation of incentive abuse prevention measures from the beginning of market and industry creation is critical for the orderly, certain and continuous growth of both. Quality assurance measures such as technology

17
certifications and standards and project guidelines contribute to technological capacity building and the industry’s structural adjustment by eliminating low-quality firms too.
• A revolving fund such as the one used for the IREDA soft loans can be a cost-effective way of utilizing international public lending to support private-sector development.
• Hasty and disorderly procedure and methods in respect of power sector reform and restructuring can pose larger costs later by creating self-contradictory mechanisms and political uncertainty, this negatively affecting private-sector investments.
Supply-push Policy: Choice of ‘What to Make’ and ‘What to Buy’
Technological capacity building and its relationship to technological characteristics are very important in managing supply-push technology transfers. However, national-level policy formulation in this area is delicate, as it requires flexible adjustment and the coordination of policy measures with the business strategies of domestic firms in light of the rapid transformations to the global industry and technology, while not distorting competition and free business activities, including technology agreements between technology providers/collaborators and receivers. Although supply-push policy measures are often considered limited to generic RD&D supports, FDI policy, trade policy, corporate tax policy and manufacturing tax incentives can be used to support national technology and industry building. As seen in the Indian wind case, however, they do not guarantee replicable technology transfers and can even create contradictory effects.
One important key for such policy formation are decisions regarding ‘what to make (provide domestically or internally)’ and ‘what to buy (procure from outside).’ Such strategic decisions are made by business firms on daily basis in respect of the management of innovation, manufacturing, project execution, and service provision, etc. What national-level strategies on ‘what-to-make’ and ‘what-to-buy’ can
do is help firm-level decision-making and encourage replicable technology transfers without intruding on firm-level business activities by providing generic and technology-specific training and policy and financial supports and incentives for chosen supply-chain activities and technological capacity building, thus creating technical and cost advantages which stimulate firm-level technology transfer and export activities. Although this is not an easy task, the potential benefits in many aspects of national capacity building are large. The policy-making procedures of such national strategies can help both firms and policy-makers develop the capability to pursue more tactical strategies and build comparative and competitive advantages through practical and mutual learning. They can also help distinct the role of the public and private sectors in each technology sector in a given timeframe clear. Coordination and frequent communications between industry players and policy-makers become essential. Early creations of industry associations can support such a process too. Technology- and industry-specific strategic decision-making is critical today for any public- and private-sector activities from the perspectives of resource allocations and the creation of comparative and competitive advantage. Capacity building supports from the international community need to focus on this area too.
Physical Infrastructure Deficiency
This article has also highlighted the importance of ‘physical infrastructure’ in accelerating the flow of the necessary products, components and services to encourage technology development and diffusion. Although the soft dimensions of enabling environments are more often discussed (IPCC 2000), the hard dimensions should be recognized too, as they can greatly influence the outcomes of technology transfers and business activities. While the development in physical infrastructure are considered generic, the certain requirements are often quite technology-specific (e.g. grid stability, transport/logistical and construction requirements). Therefore, the political coordination and prioritization which balances these generic and technology-specific needs are very important.

18
About the Author
Dr. Emi Mizuno specializes in clean energy technology policy. She holds a PhD degree in Technology and Public Policy (International Development Program) from the Massachusetts Institute of Technology. She later worked for the Energy Technology Policy Division at the International Energy Agency in Paris, and is currently a project manager at the Climate Strategies (Cambridge, UK). Contact: [email protected]
References
Bajpai, N. 2002. A Decade of Economic Reforms in India: the Unfinished Agenda. CID Working Paper No. 89, Center for International Development, John. F. Kennedy School of Government, Harvard University, http://www.hks.harvard.edu/centers/cid/publications/faculty-working-papers/cid-working-paper-no.-89 (accessed June 2002).
Bath, D. S. 1998. India Power Projects: Regulation, Policy and Finance. Vol. I and II. Asia Law EK Practice Publishing Ltd., Hong Kong.
BTM Consult ApS. 2005. Ten Year Review of the International Wind Power Industry 1995-2004. BTM Consult ApS, Ringkøbing, Denmark.
BWE (Bundersverband WindEnergie e.V). 2005. Windenergie Marktubersicht 2005. Overhead presentation about wind energy and renewable energies, Osnabruck, Germany.
Consolidated Energy Consultants Ltd. 2005. Directory Indian Wind Power 2005, Bhopal, India.
Danish Wind Industry Association. 2006. Wind Figures 2006. http://www.windpower.org/en/stats.htm (accessed October 2006)
Gupta, A. K. 1995. Renewable electricity in India: progress, promotion, and policy, In: P. V. Ramana and K. Kozloff (Eds.), Renewable Energy Development in India: Analysis of US Policy Experience, Tata Energy Research Institute and World Resources Institute, India.
IPCC Working Group III. 2000. Methodological and Technological Issues in Technology Transfer. Cambridge University Press, Cambridge, United Kingdom.
IREDA (Indian Renewable Energy Development Agency). 2002a. Renewable Energy/Energy Efficiency Financing Guidelines, 2002-03. New Delhi, India.
IREDA. 2002b. Wind Power Development Programme Guidelines for Loan Assistance. New Delhi.
IREDA. 2002c. Market Development Assistance Guidelines for Loan Assistance. New Delhi.
IREDA. 2006. Wind Power Development Programme Guidelines for Loan Assistance. New Delhi.
IWTMA (Indian Wind Turbine Manufacturers Association, V.V.Shantra Raman). 2002. Personal communication. Chennai. India.
Jagadeesh, A. 2000. Wind Energy development in Tamil Nadu and Andhra Pradesh, India Institutional dynamics and barriers -A case study. Energy Policy, 28, 157-168.
Jagan, B R. 1995. Exploitation of renewable energy sources: incentives for private entrepreneurs in the State of Karnataka. In: P. V. Ramana and K. Kozloff (Eds.), Renewable Energy Development in India: Analysis of US Policy Experience, Tata Energy Research Institute and World Resources Institute, New Delhi.
Khanna, S. 1998. Alternative Energy-Solar & Wind: India. Tradeport, U.S. Foreign Commercial Service and U.S. Department of State, Washington DC.
MEDA (Maharashtra Energy Development Agency). 2001a. Annual Report 2000-2001. Pune, India.
MEDA. 2001b. Guidelines for Establishing Wind Electric Power Projects by Private Sector in Maharashtra, Pune, India.
MEDA (G. M. Pillai). 2002. Personal Communications, Pune, India.
MNES (Ministry of Non-conventional Energy Sources). 1995a. Annual Report 1994-95. New Delhi.
MNES. 1995b. Guidelines for Wind Power Projects, New Delhi.
MNES. 1996a. Annual Report 1995-96, New Delhi.
MNES. 1996b. Revised Guidelines for Wind Power Projects, New Delhi.
MNES. 1997a. Annual Report 1996-97, New Delhi.
MNES. 1997b. Revised Guidelines for Wind Power Projects, New Delhi.
MNES. 1998. Annual Report 1997-98, New Delhi.
MNES. 1999a. Annual Report 1998-99, New Delhi.
MNES. 1999b. Modification to Revised Guidelines for Wind Power Projects, New Delhi.
MNES. 2000a. Annual Report 1999-2000, New Delhi.
MNES. 2000b. Revised Guidelines for Wind Power Projects, New Delhi.
MNES. 2001a. Annual Report 2000-01, New Delhi.
MNES. 2001b. Renewable Energy in India: Business Opportunities, New Delhi.
MNES. 2002a. Annual Report 2001-02, New Delhi.
MNES (B.M.L. Garg, Dilip Nigam, Ajit K.Gupta). 2002b. Personal communications, New Delhi, India.
MNES. 2003. Annual Report 2002-03, New Delhi.
MNES. 2004. Annual Report 2003-04, New Delhi.
MNES. 2005. Annual Report 2004-05, New Delhi.

19
MNES. 2002/2004/2006. Wind Energy Programme, http://mnes.nic.in/rdtech2.htm (accessed June, 2002, February 2004, and January 2006).
Prayas. 2003. Electricity Act 2003, www.prayaspune.org/Eact/Index.htm (accessed March, 2003)
Rajsekhar, B. F., F. Van Hulle, and J.C. Jansen. 1999. Indian Wind Energy Programme: Performance and Future Directions. Energy Policy, 27, 669-678.
Sasi, K.K, and Sujay B. 2002. Windfarming in India - the desired policy recast. Energy, 27, 241-253.
Shekhar, S., A. Kumar, and C. Shar. 2001. Promotion and Financing of Clean Energy Options in India. Paper read at 9th Greening Industry Network (GIN) Conference, January, 24, 2001, Bangkok.
TERI (Tata Energy Research Institute). 2001. Overview of Renewable Energy Sector. New Delhi: Tata Energy Research Institute, New Delhi.
Twele, J. 2005. Personal communication. Berlin, Germany.
Wind Power Monthly. 1996a. BLADE MANUFACTURERS OUT OF PATIENCE, More expensive in India. Wind Power Monthly, March, 26.
Wind Power Monthly. 1997a. Dialogue in Asia on sustainable GROWTH, although the long term prospects for wind in India
remain as optimistic as ever, an end to the country’s lack of ready cash for buying wind turbines is not yet. Wind Power Monthly, March, 42.
Wind Power Monthly. 1997b. Duty again on small turbines, Wind Power Monthly, May, 24.
Wind Power Monthly. 1997c. India injects life into crippled market, new IREDA loan packaging, Wind Power Monthly, July, 19.
Wind Power Monthly. 2000. Maharashtra slows after good start. Wind Power Monthly. October.
Wind Power Monthly. 2003a. Local manufacturers welcome rise in import duty on components. Wind Power Monthly, April, 22.
Wind Power Monthly. 2003b. India gears up to new realities, Wind Power Monthly, November, 39.
Wind Power Monthly. 2004. New Law drives return to market growth - India on fast forward. Wind Power Monthly. March.
Winrock International India. 2003. India Renewable Resources Development Project: Lessons and Emerging Good Practices, prepared for Asia Alternative Energy Program and South Asia Energy and Infrastructure Unit, the World Bank. Washington DC.
Annex 1: Fiscal Policy and Incentives for Wind Energy in India
Sources: Consolidated Energy Consultants Ltd. 2005; MNES 1995a; Rajsekhar, Van Hulle, and Jansen 1999
Schemes Contents
1989 Tax Scheme on Wind Power Project
Tax breaks to deduct the entire cost of equipment in the first year from pre-tax profits
1993 Income Tax Rules
Five-year 100% tax holiday on income from sales of wind electricity 100% depreciation on investment in capital equipment related to wind power plants in the first year Zero-Tax planning (possible to avoid paying corporate tax on incomes of their registered companies and corporations) by combining various tax rebates and exemption and 100% accelerated depreciation
1997 Tax Rules
Introduction of Minimum Alternate Tax (MAT) on wind projects 12.9% MAT on book-value profits (return on equity) imposed on the
companies that chose the ‘zero-tax’ planning, while 100% first-year depreciation continued.
Lowering tax rate for the companies with higher book-value profits than investments on wind power projects Reduced marginal corporate tax rate (from 46% to 35% in April 1997, further
to 30% in 1998) April 1999 Tax Rules 11.4% MAT Rate April 2000 Tax Rules 8.4% MAT Rate April 2001 Tax Rules Ten-year tax holiday on income from sales of wind electricity
2003 Tax Revision 80% of first year depreciation on and after 4/1/2003
Items
Import Duty Rates
1993- 3/1997
4/1997-3/1998**
*
4/1998-3/2002
4/2002-3/2003
4/2003-6/2004
7/2004-Present
Generators up to 30kW 25% 37.86% 29%
5%
5%
5%
Wind Turbine Parts/ Components*
Special bearing Gearbox Yaw components Turbine controllers Sensors Brake hydraulics Flexible coupling Brake calipers
0%** 22% 9%
25%
Rotor blades* 12% 9%
5% Rotor blade parts* 0% 9% Raw materials for rotor blades
80% 0% N/A
Duties are total effective duties that combine basic duty and special duty. * For both manufacturing and maintenance purposes ** Import duty exemption was up to ten components *** A prerequisite for clearing imports will be a requirement for the importer to furnish a certificate
to the customs authorities from an officer of the rank of deputy secretary and above at MNES. Since MNES clearance is required for each and every shipment, the whole procedure could be time-consuming and arduous.

20
Annex 2: Import duties on Wind Turbine Sets and Components in India
Sources: IWTMA 2002; Khanna 1998; MNES 2002/2004/2006; Wind Power Monthly 1996a; Wind Power Monthly 1997b; Wind Power Monthly 2003a
Annex 3: State Policy
Tamil Nadu
Tamil Nadu was the first state to draw up a support policy for wind energy, long before the MNES 1993 guidelines was issued. Tamil Nadu strongly promoted demonstration projects from the 1980s, and the accumulated experiences were reflected in their early state policy (Annex 2-a).
Gujarat
Gujarat was another state that started the demonstration projects in the 1980s that helped to formulate its state support policy. Gujarat completely withdrew the state policy in March 1998, following a slight policy modification in 1997. In June 2002, the state announced a new policy (Annex 2-b).
Maharashtra
Maharashtra first drew up its support policy in 1995. The state began implementing a new policy with the strong fiscal and financial incentives in December 1999, which ended in March 2002. The newest policy began in November 2003 (Annex 2-c).
Schemes Contents
1989 Tax Scheme on Wind Power Project
Tax breaks to deduct the entire cost of equipment in the first year from pre-tax profits
1993 Income Tax Rules
Five-year 100% tax holiday on income from sales of wind electricity 100% depreciation on investment in capital equipment related to wind power plants in the first year Zero-Tax planning (possible to avoid paying corporate tax on incomes of their registered companies and corporations) by combining various tax rebates and exemption and 100% accelerated depreciation
1997 Tax Rules
Introduction of Minimum Alternate Tax (MAT) on wind projects 12.9% MAT on book-value profits (return on equity) imposed on the
companies that chose the ‘zero-tax’ planning, while 100% first-year depreciation continued.
Lowering tax rate for the companies with higher book-value profits than investments on wind power projects Reduced marginal corporate tax rate (from 46% to 35% in April 1997, further
to 30% in 1998) April 1999 Tax Rules 11.4% MAT Rate April 2000 Tax Rules 8.4% MAT Rate April 2001 Tax Rules Ten-year tax holiday on income from sales of wind electricity
2003 Tax Revision 80% of first year depreciation on and after 4/1/2003
Items
Import Duty Rates
1993- 3/1997
4/1997-3/1998**
*
4/1998-3/2002
4/2002-3/2003
4/2003-6/2004
7/2004-Present
Generators up to 30kW 25% 37.86% 29%
5%
5%
5%
Wind Turbine Parts/ Components*
Special bearing Gearbox Yaw components Turbine controllers Sensors Brake hydraulics Flexible coupling Brake calipers
0%** 22% 9%
25%
Rotor blades* 12% 9%
5% Rotor blade parts* 0% 9% Raw materials for rotor blades
80% 0% N/A
Duties are total effective duties that combine basic duty and special duty. * For both manufacturing and maintenance purposes ** Import duty exemption was up to ten components *** A prerequisite for clearing imports will be a requirement for the importer to furnish a certificate
to the customs authorities from an officer of the rank of deputy secretary and above at MNES. Since MNES clearance is required for each and every shipment, the whole procedure could be time-consuming and arduous.

21
Andhra Pradesh, Karnataka and Rajasthan
The states of Andhra Pradesh, Karnataka and Rajasthan have offered the following policy (Annex 2-d).
Annex 3-a: Support Policy in Tamil Nadu
Sources: Consolidated Energy Consultants Ltd. 2005; MNES 1995a; MNES 1996a; MNES 1997a; MNES 1998; MNES 1999a; MNES 2000a; MNES 2001a; MNES 2002a; MNES 2003; MNES 2004; MNES 2005; Winrock International India 2003
Annex 3-b: Support Policy in Gujarat
Sources: Consolidated Energy Consultants Ltd. 2005; MNES 1995a; MNES 1996a; MNES 1997a; MNES 1998; MNES 1999a; MNES 2000a; MNES 2001a; MNES 2002a; MNES 2003; MNES 2004; MNES 2005
Time Period
Wheeling Charge
Banking Feed-in Tariffs Third-Party Sales
Pre 1993 – 3/1996*
2% of power generated
One year 2% charge
INR 2.00/kWh in 1994-95 INR 2.75/kWh in 1995-96
Allowed with 15% wheeling charge
(1994-95)
4/1996 – 3/2001*
One Month 2% charge
INR 2.25/kWh in 1996-97 5% annual escalation based
on 1996-96 tariff *** Not allowed 4/2001 –
Present ** 5% of power
generated One financial year
5% charge INR 2.70/kWh***
No escalation for five year * In addition, a capital subsidy of 10% of project cost with a ceiling of INR 15 lakhs was available until the
1996-97 fiscal year. Exemption of generation tax was available until the 2000-01 fiscal year. Penalties for reactive power charge of INR 0.1/KVARH (quantum of reactive power) started from June 1995. The charge was increased to INR 0.30/KVARH in June 1999, and again to INR 1/KVARH in April 2000.
** Infrastructure charges of INR 28.75/MW and application/processing fee of INR 11,000/application apply. In addition, from May 2002, reactive power charge of INR 0.30/KVARH if the ratio of reactive power drawn to kWh exported is 10% or less and INR 1/KVARH for more than 10%.
*** TNEB has been too financially strapped to keep the 5% annual increase between 1996 and March 2001 and the tariff of INR. 2.70/kWh after April 2001. Only INR 2.25/kWh has been paid in reality. TNEB claims the balance will be paid as and when the utility's financial health improves.
Time Period
Wheeling Charge
Banking Feed-in Tariffs Third-Party
Sales 1994 – 1997* 2% of power
generated
6 months
INR1.75/kWh No escalation
Not allowed
1997 – 3/1998**
6/2002 – Present***
4% of power generated
INR 2.60/kWh INR 0.05 annual escalation based
on 2002-03 tariff for ten years
* Land was leased on a 15-year term, and sales tax and electricity duty were waived. ** Sales tax exemption and deferral were available up to 50% of investment. *** Reactive power charge INR 0.1 per consumed power and application/processing fee of INR
50,000/MW are applied. Electricity duty exemption and exemption from power cut are available up to 30%.
Time Period
Wheeling Charge
Banking Feed-in Tariffs Third-Party Sales
Pre 1993 – 3/1996*
2% of power generated
One year 2% charge
INR 2.00/kWh in 1994-95 INR 2.75/kWh in 1995-96
Allowed with 15% wheeling charge
(1994-95)
4/1996 – 3/2001*
One Month 2% charge
INR 2.25/kWh in 1996-97 5% annual escalation based
on 1996-96 tariff *** Not allowed 4/2001 –
Present ** 5% of power
generated One financial year
5% charge INR 2.70/kWh***
No escalation for five year * In addition, a capital subsidy of 10% of project cost with a ceiling of INR 15 lakhs was available until the
1996-97 fiscal year. Exemption of generation tax was available until the 2000-01 fiscal year. Penalties for reactive power charge of INR 0.1/KVARH (quantum of reactive power) started from June 1995. The charge was increased to INR 0.30/KVARH in June 1999, and again to INR 1/KVARH in April 2000.
** Infrastructure charges of INR 28.75/MW and application/processing fee of INR 11,000/application apply. In addition, from May 2002, reactive power charge of INR 0.30/KVARH if the ratio of reactive power drawn to kWh exported is 10% or less and INR 1/KVARH for more than 10%.
*** TNEB has been too financially strapped to keep the 5% annual increase between 1996 and March 2001 and the tariff of INR. 2.70/kWh after April 2001. Only INR 2.25/kWh has been paid in reality. TNEB claims the balance will be paid as and when the utility's financial health improves.
Time Period
Wheeling Charge
Banking Feed-in Tariffs Third-Party
Sales 1994 – 1997* 2% of power
generated
6 months
INR1.75/kWh No escalation
Not allowed
1997 – 3/1998**
6/2002 – Present***
4% of power generated
INR 2.60/kWh INR 0.05 annual escalation based
on 2002-03 tariff for ten years
* Land was leased on a 15-year term, and sales tax and electricity duty were waived. ** Sales tax exemption and deferral were available up to 50% of investment. *** Reactive power charge INR 0.1 per consumed power and application/processing fee of INR
50,000/MW are applied. Electricity duty exemption and exemption from power cut are available up to 30%.

22
Annex 3-c: Support Policy in Maharashtra
Sources: Consolidated Energy Consultants Ltd. 2005; MEDA 2001a; MEDA 2001b; MEDA 2002; MNES 1995a; MNES 1996a; MNES 1997a; MNES 1998; MNES 1999a; MNES 2000a; MNES 2001a; MNES 2002a; MNES 2003; MNES 2004; MNES 2005
Time Period
Wheeling Charge
Banking Feed-in Tariffs Third-Party
Sales
1995 – 12/1999
Allowed Allowed* up to 20% of energy
generated
INR 2.25/Kwh 5% annual escalation based on 1994-95
tariff
Allowed
12/1999** - 3/2002
2% of power generated
One Year INR 2.25.KWh
5% annual escalation based on 1997-98 tariff
11/2003- Present
***
2% of power generated for wheeling plus
5% for T&D loss
One Year
INR 2.25.KWh 5% annual escalation based on 1994-95
tariff for Group1 and 2**** INR 3.50/kWh with INR 0.15/kWh annual increase for Group 3*****
* Banking was for three months in 1996-97 fiscal year and became one year after 1997. ** Although this policy itself was created in 1998, the state did not implement it until December 1999 when
the new administration took office in the state. In addition to the above, a capital subsidy of 30% of project cost subject to maximum INR 20 lakh, and sale tax exemption up to 100% of investment were available.
*** Reactive power charge INR 0.25 per consumed power and application/processing fee of INR 50,000/MW. No electricity duty for five years for captive use and a green energy fund are available for 100% of cost of approach road and for 50% of power evacuation arrangement cost as subsidy. No interest loan is available for 50% of power evacuation arrangement cost.
**** 5% tariff escalation is set differently for the following three groups: Group 1 (projects commissioned before 12/27/1999): annual increase of compound basis for the first ten years, no increase for the next three years, and then 5% increase for the next seven years. Group 2 (project commissioned between 12/27/1999 and 3/31/2003): annual increase of for eight years. Then the producer needs to sell power in the open market. Increase to be simple rate.
*****Group 3 (project commissioned between 4/1/2003 and 3/31/2007): INR 3.50/kWh for the first year with INR 0.15/kWh annual increase for a period of 13 years.

23
Annex 3-d: Support Policy in Andhra Pradesh, Karnataka and Rajasthan
Sources: Consolidated Energy Consultants Ltd. 2005; MNES 1995a; MNES 1996a; MNES 1997a; MNES 1998; MNES 1999a; MNES 2000a; MNES 2001a; MNES 2002a; MNES 2003; MNES 2004; MNES 2005
State Time
Period Wheeling
Charge Banking Feed-in Tariffs
Third-Party Sales
Andhra Pradesh
1994 – 3/1997*
2% of power generated
One Year 2% charge*
INR 2.25/Kwh Allowed
4/1997 – 3/2000**
One Year
INR 2.25/Kwh 5% annual escalation based
on 1997-98 tariffs (until 3/2000) and 1994-95 tariffs
(from 4/2000) INR 3.48/kWh in 2003-04
4/2000 - 3/2004***
Not allowed
4/2004 – Present
****
Vary between INR 46/kWh and 60/kWh
N/A INR 3.37/kWh No escalation
* 8 months banking was allowed from August to March. Capital subsidy of 20% of project cost subject to max. INR 25 lakh and 20-year long land lease with free rent for the first five years.
** Capital subsidy of 20% of project cost subject to maximum INR 25 lakh. *** Reactive power charge of INR 0.1 per consumed power. ****Reactive power charge of INR 0.1 per consumed power, infrastructure development charge of INR 10
lakh/MW, and application/processing fee of INR 5,000/MW are applied.
Karnataka
1994 – 3/1997* 2% of power
generated
One year (July – June)*
INR 1.75/kWh in 1994-95
Allowed
INR 2.25/kWh 5% annual escalation base on
1994-95 tariffs
4/1997 – 3/2000**
One year
4/2000 – 12/2004***
20% of power generated
2% per month for one year
1/2005 – Present****
5% of power generated
2% charge INR 3.40/kWh
No escalation for ten years
* Banking had one month grace period. Land-lease for a period of 50 years, capital subsidy same as for other industries, and exemption of electricity duty for five years were available.
** Exemption of electricity duty for five years was available. *** Capital subsidy of max INR 25 lakh, electricity duty exemption for five years, and reactive power charge
of INR. 0.4 per consumed power were applicable. Feed-in-tariffs were INR 3.25/kWh and INR 3.10/kWh for projects commissioned before 8/31/2003 and from 9/1/2003 to 12/31/2004, respectively.
**** Application/processing fee of INR. 30,000/MW and electricity duty exemption for five years.
Rajasthan
4/1999 – 10/2004*
2% of power generated
One year
INR 2.75/kWh in 1999-01 INR 2.89/kWh in 2001-04
5% annual escalation base on 1999-00 tariffs
Allowed
10/2004 – Present**
10% of power
generated
One calendar year
INR 2.91/kWh for the first year, then INR 0.05/kWh annual escalation until 10th year, then INR. 3.36/ kWh until 20th year
* Exemption of electricity duty for five years was available. ** 50% exemption of electricity duty for seven years is available. Reactive power charge of INR 0.25 per
consumed power and application/processing fee of INR. 50,000/MW are applied.

Design and production: Magnum Custom PublishingNew Delhi, [email protected]