employment situation united states vs. · pdf filecolorado business review 3 source: bureau of...
TRANSCRIPT
Colorado Business Review 3
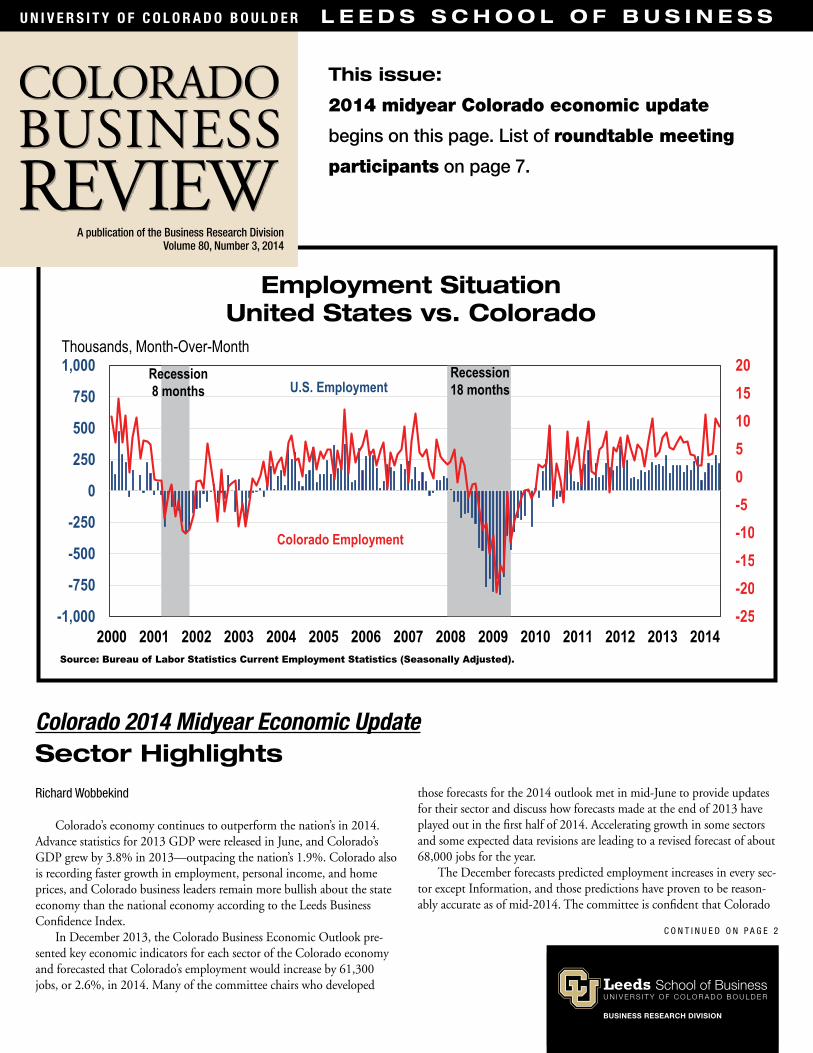
Source: Bureau of Labor Statistics Current Employment Statistics (Seasonally Adjusted).
Employment Situation United States vs. Colorado
C O n T i n U e D O n P a g e 2
A publication of the Business Research DivisionVolume 80, Number 3, 2014
U N I V E R S I T Y O F C O L O R A D O B O U L D E R L E E D S S C H O O L O F B U S I N E S S
This issue:
2014 midyear Colorado economic update
begins on this page. List of roundtable meeting
participants on page 7.
Colorado 2014 Midyear Economic UpdateSector Highlights Richard Wobbekind
Colorado’s economy continues to outperform the nation’s in 2014. Advance statistics for 2013 GDP were released in June, and Colorado’s GDP grew by 3.8% in 2013—outpacing the nation’s 1.9%. Colorado also is recording faster growth in employment, personal income, and home prices, and Colorado business leaders remain more bullish about the state economy than the national economy according to the Leeds Business Confidence Index.
In December 2013, the Colorado Business Economic Outlook pre-sented key economic indicators for each sector of the Colorado economy and forecasted that Colorado’s employment would increase by 61,300 jobs, or 2.6%, in 2014. Many of the committee chairs who developed
those forecasts for the 2014 outlook met in mid-June to provide updates for their sector and discuss how forecasts made at the end of 2013 have played out in the first half of 2014. Accelerating growth in some sectors and some expected data revisions are leading to a revised forecast of about 68,000 jobs for the year.
The December forecasts predicted employment increases in every sec-tor except Information, and those predictions have proven to be reason-ably accurate as of mid-2014. The committee is confident that Colorado

Colorado Business Review 2
From the Editor
The Colorado
economy is reviewed
midway through the
year in this issue. The
information presented is
compiled from remarks
made by Colorado
Business Economic Outlook Estimating Group
chairs or their representatives at a roundtable
meeting held in mid-June. Industry sector
summaries include comparisons of the current
situation to the forecast presented last December.
Key factors influencing recent economic trends
are also noted.
We greatly appreciate the time and input from
the individuals who participated in the meeting. A
list of the contributors appears on page 7. I also
wish to acknowledge the BRD research staff who
collected data and conducted additional analysis
for this issue.
Fiftieth Annual Colorado Forecast
2015 Colorado Business Economic
Outlook Forum—Save the Date
It’s not too early to plan to attend the 2015
Colorado Business Economic Outlook Forum on
December 8 at the Grand Hyatt Denver. Mark your
calendar to attend this special event, and check
www.colorado.edu/leeds/outlook for event
updates.
F F F
We are interested in your suggestions for
topics for upcoming issues. Please contact me at
303-492-1147.
Richard Wobbekind
SECTOR HIGHLIGHTS, C O N T I N U E D F R O M P A G E 1
is poised for further growth in 2014. The following paragraphs present a brief look at industry sectors midway through 2014.
Data in the following sections are from the Colorado Department of Labor and Employment, Current Employment Statistics (CES). The May 2014 figures are seasonally adjusted except where noted.
Population and Employment
In 2013, Colorado was the fourth-fastest growing state in terms of population growth and ranked fifth in absolute change, climbing three places in the former and four places in the latter. Colorado was 22nd in the nation in total population overall. According to the State Demography Office, Colorado’s population reached roughly 5.3 million in 2013, an 85,000 net gain from 2012. Natural increase, or births minus deaths, was responsible for 36,500 persons while net migration contributed 48,500. Colorado’s top five-fastest growing coun-ties in absolute terms in 2013 were Denver, Arapahoe, El Paso, Adams, and Larimer. In percentage change, the five-fastest growing counties were San Miguel, Custer, Eagle, Ouray, and La Plata. Only two counties in the state lost population in 2013. Some of these losses can be attributed to a decline in prison population. The slow recovery in the mountain counties, as well as deaths out weighing births in select rural counties, has also contributed to losses. Colorado’s popu-lation is expected to reach approximately 5.4 million in 2015.
Total covered employment in Colorado rose 2.9% in 2013 and expanded by 2.8%, or 65,700 jobs year-over-year, in May 2014.
All of Colorado’s Metropolitan Statistical Areas (MSAs) experienced employment growth seasonally adjusted year-over-year in May, with the largest increases in Greeley (5.3%), Boulder (3.2%), and Denver-Aurora-Broomfield (2.8%). Colorado’s unemployment rate was 5.8% while the civilian labor force was 2.8 million, a 1.7% increase, in May 2014. Fourth quarter 2013 Quarterly Census of Employment and Wages (QCEW) results indicate Construc-tion; Trade, Transportation, and Utilities; and Financial Activities will experience the greatest upward revisions to nonfarm payroll jobs, while Professional and Business Services; Leisure and Hospitality; Education and Health Services; and Manufacturing are expected to see the largest downward revisions.
Agriculture
As Colorado heads into the hot, dry summer months, the state’s drought condi-tion is a dramatic improvement from a year ago. Topsoil moisture and subsoil moisture are generally adequate on about 50% of farm acres, which is a dramatic improve-ment from 2013 figures that fell below 23% for subsoil moisture. Pasture and range conditions indicate 39% of acres are in poor to very poor condition—an improvement compared to 2013. Winter wheat produc-tion in Colorado has improved from 2013’s drought-ridden output of 44.3 million bushels to a forecasted 84.2 million bushels in 2014. Dry conditions are also causing ranchers to hesitate to grow herds due to the lack of good pasture and high prices for hay. Cattle and calves inventory as of May 1
Source: Colorado Department of Local Affairs, State Demography Office.
Population Changes in Colorado

Colorado Business Review 3
C O n T i n U e D O n P a g e 4
was estimated at 960,000, even with last year’s inventory.
While marijuana growth is at the forefront of many headlines, another plant is taking Colorado by storm: tumbleweeds. Recent drought condi-tions have spurred the growth of this obnoxious weed and have forced several counties, includ-ing Pueblo and Crowley, to declare a “state of emergency.”
In February 2013 Japan expanded access to allow beef imports from animals 30 months of age and younger, and Hong Kong followed suit last month. Previously, access had been limited to beef from animals 20 months of age and younger. This change, which significantly increases the percentage of the beef produced in the United States that is now eligible for export to Japan and Hong Kong, is a positive measure for Colorado. Beef exports to Japan are expected to increase and year-to-date exports of fresh beef to that country from Colorado are already up about 7% over last year. The issue of Country of Origin Labeling, however, poses a problem for Colorado beef exporters and processing plants. Canada and Mexico assert that the mandated label is discriminatory in nature as consumers are skeptical about purchasing foreign beef products. Beef prices are expected to rise as the cost of labeling, sorting, and maintaining integrity of the identity of the source is substantially higher with the proposed Country of Origin Labeling. This added cost will be passed onto consumers, and large meat processors may stop sourcing large volumes of meat from Canada and Mexico to avoid the cost. Both countries are locked in a fierce dispute with the United States and are planning to implement carousel retalia-tion measures since the measure may be approved by the World Trade Organization later this summer. Any such retaliation would surely impact beef exports to these two major trading partners and hurt future trade relations.
Congress enacted a new farm bill in February 2014 that seeks to improve risk management tools while reducing direct payments. So far the bill, which will cost roughly $956 billion over the next decade, is a reflection of the changing American diet. Fruit growers, organic farmers, and hemp producers will have better access to funding as traditional commodity subsidies continue to decline.
Natural Resources and Mining
The Natural Resources and Mining (NRM) Supersector comprises establishments that mine naturally occurring mineral solids (e.g., coal); liquid minerals (e.g., crude petroleum), and gases (e.g., natural gas). This sector has been integral to the state’s post-recession recovery. NRM represents 1.4% of Colorado’s total employment. Oil and natural gas are
currently the most significant products of this sector. Colorado’s concentration of NRM employment is 2.1 times the national concentration (this is referred to as the location quotient), and in 2013, the sector had the fastest-growing 1-year GDP of any sector in Colorado, as well as the highest 10-year growth.
The NRM Supersector continues to be a bright spot in Colorado’s economy and has exceeded the committee’s expectations in 2014. Employment was projected to increase to 31,100 but currently sits at 33,200. Despite a fire at Oxbow Mining’s Elk Creek Mine in Somerset that rendered the mine inoperable and resulted in a loss of 300 jobs, employment in the sector has grown about 10% year-over-year.
Colorado saw a record production of 64 million barrels of oil in 2013, contributing $6 billion to the
Source: NOAA, US Climate Division.
Annual Precipitation in Colorado

Colorado Business Review 4
SECTOR HIGHLIGHTS, C O N T I N U E D F R O M P A G E 3
Issuances have been slightly fewer as of mid-2014. While natural gas and oil wells have continued to grow in production, coal has suf-fered a steep decline. Since Colorado’s Renewable Energy Standards demand that more electricity be renewably sourced over time and the Clean Air–Clean Jobs Act limits coal use, companies are hesitant to invest in coal energy and are allow-ing coal-sourced power purchase agreements to expire without renewal. Recent EPA mandates to reduce coal usage nationwide have made companies even more hesitant to invest in coal. Large companies like Xcel Energy have also had difficulty exporting coal to other nations, which further discourages coal mining.
The committee expects the industry to continue growing, especially as geopolitical turmoil in Iraq, Ukraine/Russia, and Libya con-tribute to skepticism regarding the stability of foreign oil sources.
Construction
The construction industry both constructs new buildings and engineering projects and subdivides land for building sites. Construction has three sectors: residential (e.g., houses, apartments), nonresidential (e.g., commercial, retail, medical), and nonbuilding (e.g., water treatment, highway work, infrastructure). Employment in the industry totals 135,500, and although employment has been increasing since early 2013, it still has not reached pre-recession levels. Employment in May 2014 was still 20.3% below the peak construction employment in 2007. Total annual wages for 2013 exceeded $175 million, an increase over 2012 and 2011.
The committee observes that construction activity is as strong as forecasted in December and still calls for a year in which residential work increases strongly and
nonresidential and infrastructure volumes move up as well. The statistics released for the first five months, which show a decline in all areas, understate real activity in the forecast. Delays of permanent flood recovery spending, the CSU stadium, and the Gaylord Convention Center weigh on the forecast.
Demand is currently high for for-sale homes, yet inventory is low and homebuilders will find little new land development. Developers are cau-tious about developing new lots for residential and nonresidential because of the uncertainty regarding the future of the economy in general and concern about the effects of the Federal Reserve as it ends quantitative easing and raises interest rates. For now, supply continues to be driven in part by home price increases of 9–12%.
In the nonresidential sector, hospital con-struction is slowing down yet medical building
economy. In a reversal of recent trends, oil produc-tion surpassed natural gas production in 2013; gas contributed $300 million less than oil to the economy. This reversal is being driven by a rise in the price of oil. Oil has grown from $90.61 per barrel in June 2011 to $105.77 per barrel recorded in late June 2014. In comparison, natural gas has declined from $5.04 per MMBtu to $4.82 per MMBtu over the same period. The Business Research Division estimates of property taxes related to oil and gas activity in the state totaled $383.3 million in 2013, and the revised estimates for 2012 totaled $372.7 million based on county-level assessments and average county mill levies. School districts comprise a majority of local mill levies.
In 2013, permits for oil/gas wells totaled 4,000 and were almost evenly split between the two fuels.
Source: Colorado Oil and Gas Conservation Commission.
Annual Drilling Permits 1964–2014
Colorado Residential Building Permits,2003–2014
Source: United States Census Bureau, YTD as of May.
May YTD

Colorado Business Review 5
construction has ramped up. Industrial and commercial building are also performing well in 2014. Retail construction continues to lag as well, despite continued increasing demand and rent prices in metropolitan areas.
Colorado’s nonbuilding sector has several major ongoing projects, including work on U.S. Highway 36, light rail to Denver International Airport (DIA), and several water treatment plants. More growth is expected in this sector as permanent rebuilding from the September 2013 floods takes place in late 2014 and early 2015. This construction has been delayed from its original time schedule, late 2013/early 2014, because the construction bids that local governments have received from construction companies exceed government budgets. The bids are high because there is a labor shortage of con-struction workers, and construction companies are engaged with other projects.
Construction employment has grown 8% year-over-year. However, this is still 2,500 jobs below the committee’s estimates in December 2013. The labor shortage in this sector is contributing to higher construction costs. The committee expects this sector will experience more pronounced inflation than other sectors of Colorado’s economy in the near future.
Manufacturing
Manufacturing is a broad category comprising all establishments engaged in the mechanical, physical, or chemical transformation of materials, substances, or components into new products. Manufacturing employment is currently at 136,100 jobs in Colorado and is 2.8% higher year-over-year. Colorado’s location quotient for Manufacturing employment is 0.64.
Manufacturing has grown faster than expected in the first half of 2014. Nondurables are increasing much more slowly than expected with the exception of beverages. Continued demand for craft beer and spirits have buoyed this segment of the sector. Durables manufacturing has grown more quickly than expected, helping to offset the slow growth of the nondurable sector. Computers and electronics have continued to decline in 2014, although this is partially due to the reclassifica-tion of some software companies from Manufac-turing to Professional and Business Services.
The Manufacturing Supersector has exceeded committee expectations by 1,700 jobs, and the increase marks the third-consecutive year of employment gains following 10 straight years of losses. All subsectors of durables manufactur-ing grew with the exception of computer and electronics fabrication.
Trade, Transportation, and Utilities
Trade, Transportation, and Utilities (TTU) is one of the services-producing supersectors and consists of four subsectors: Wholesale Trade; Retail Trade; Trans-portation and Warehousing; and Utilities. It covers many services, including providing services incidental to the sale of merchandise, establishments engaged in retailing merchandise, industries providing transporta-tion of passengers and cargo, warehousing and storage for goods, and establishments engaged in the provision of utility services. TTU added 9,800 jobs in 2013, a gain of 2.4% over 2012. Employment was 1.2% year-over-year in May.
The Wholesale Trade Sector includes the outputs of agriculture, mining, manufacturing, and certain information industries, such as publishing. The
C O n T i n U e D O n P a g e 6
Source: Colorado Department of Revenue.
Statewide Taxable Sales
Colorado Business Review 6
majority of the jobs in Wholesale are sales representa-tives (65%). This sector’s growth has slowed over the past 12 months despite posting 1.7% year-over-year job growth in May 2014.
Retail Trade grew 2.2% in 2013 and 2.9% in May. The future of retail sales employment is concerning due to the trend toward online shopping. Retail sales are on track with forecasts, with statewide retail sales up 3.2% and sales taxes up 8.2% for the month of February 2014 year-over-year.
The Transportation and Warehousing Sector declined by 2.7%, a decrease of 1,500 jobs year-over-year in May 2014. There is optimism, however, with future completion of the RTD FasTracks Program and the DIA Hotel and Transit Center.
The Utilities Sector of TTU has seen high demand from local warehouses for electricity, although prices have remained fairly stable. There is a continued trend in Utilities toward clean energy owing to new legisla-tion. The EPA has set a 35% reduction in carbon intensity emissions by 2030, although Colorado’s energy providers appear to be far ahead of this goal.
Information
The Information Sector has grown extensively in Colorado in terms of output over the past decade, but growth slowed in 2013. Information GDP rose 0.9% in the state in 2013 and advanced 49% over the past 10 years. In 2012 (most recent data available at the sector level), data processing, internet publishing, and other information services climbed 15.8%; motion pic-ture and sound recording increased 7.8%; publishing grew 5%; and even telecom and publishing rose 0.2% in terms of real GDP in the state.
However, this growth has not translated to additional employment. Annual Information employ-ment peaked at 108,400 jobs in 2000, and except
for two years in the mid-2000s, has been in decline. Total employment in 2013 was flat, at 69,800 jobs, or 36% below peak. In fact, 9 of the last 17 months have recorded job losses year-over-year. The 2014 declines are a result of a shrinking job market in publishing, which is down 1,100 jobs, or 5.4% year-over-year, in May. Software publishers continue to decrease as well, by 500 jobs, or 4.2% year-over-year. CenturyLink’s acquisition of Qwest continues to reduce the com-pany’s employment footprint in Colorado, and print publishers are still shedding jobs. Nationally, employ-ment in Information grew 0.9% in 2013 but fell 1.4% year-over-year in May.
Employment in the telecommunications industry in Colorado recorded its first net gain in three years in 2013, increasing by 200 jobs. Much of this gain is likely attributable to Level 3 Communications and TW Telecom as both companies continue to add activity in 2014. Broomfield’s Level 3 Communica-tions acquired TW Telecom in June 2014, and it will be important to follow employment figures down the road as the acquisition is finalized. TW Telecom has between 1,000 and 1,500 workers in Colorado, and many work at its headquarters in Greenwood Village. Level 3 Communications has approximately 2,500 workers in in the state.
Despite the success of many software publishers, the sector in Colorado has recorded net job losses in 2012 and 2013, tumbling 4.2% in 2013. The May 2014 year-over-year percent change posted a 4.2% decrease, indicating a continued downward trend. This is counter to the software industry nationally, which added jobs at a rate of 3.6% in 2013 and 2.2% year-over-year in April 2014.
Boulder’s Rally Software went public in 2013, gar-nering a higher-than-expected offering of $84 million yet has seen its stock price plummet over the last year.
SECTOR HIGHLIGHTS, C O N T I N U E D F R O M P A G E 5
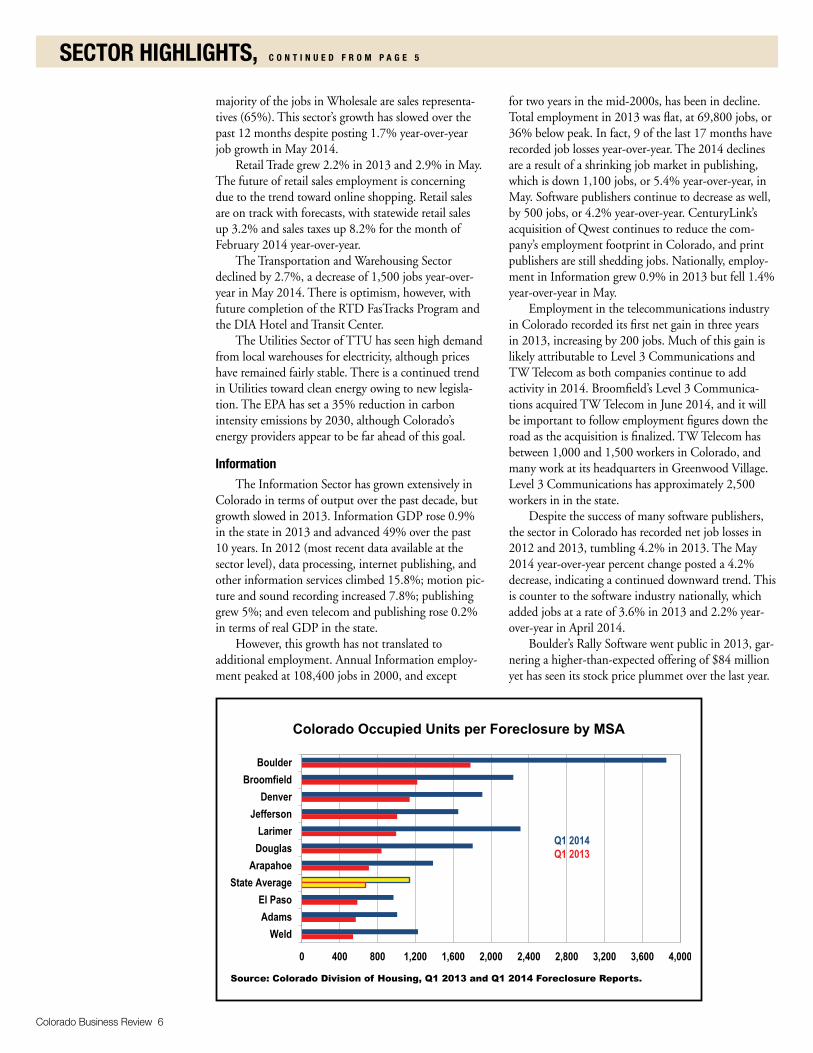
Source: Colorado Division of Housing, Q1 2013 and Q1 2014 Foreclosure Reports.
Colorado Occupied Units per Foreclosure by MSA

Colorado Business Review 7
C O n T i n U e D O n P a g e 8
Midyear Economic Roundtable Participants
ConstructionPenn PffifnerConstruction economics, LLC
Education and Health ServicesRichard ThompsonFortis Online
Financial ActivitiesRichard MorganMutual of Omaha Bank
Ron newgHP investment advisors, inc.
GovernmentLisa StrunkDevelopment Research Partners
InformationBrian LewandowskiBusiness Research Division
natalie MullisColorado Legislative Council
International TradeSandi MoilanenColorado Office of economic Develop-
ment and international Trade
Leisure and HospitalityCarrie atiyeh ViSiT Denver, The Convention & Visitors
Bureau
ManufacturingPatty SilversteinDevelopment Research Partners
Jason Schrockgovernor’s Office of State Planning and
Budgeting
Natural Resources and MiningChris eisinger Colorado geological Survey
Population and EmploymentChris akersColorado Department of Labor and
employment
Cindy DegroenColorado Department of Local affairs
Joe WinterColorado Department of Labor and
employment
Professional and Business ServicesSteve Fisher, economist
Mark Hamouzalfred Benesch & Company
Trade, Transportation, and UtilitiesTim SheesleyXcel energy
Software publishing often attracts the largest share of VC funding in the state. In 2013, a Pricewaterhouse-Coopers MoneyTree report indicated that software received $414.8 million in VC investment, or 25% of total VC investment in Colorado.
Financial Activities
The Financial Activities Supersector includes estab-lishments primarily engaged in financial transactions. It also includes establishments engaged in renting, leas-ing, or otherwise allowing the use of tangible or intan-gible assets, and establishments that provide related services. Financial Activities Superector employment grew 2.7% in 2013. As of May 2014, employment in the sector was nearly flat year-over-year.
Real Estate, Rental, and Leasing grew 1.4% year-over-year in May 2014, indicating growth in the housing industry. As more people reenter the housing
market and construction grows cautiously, the available resale supply is decreasing, which leads to an increase in rents. As construction increases, however, this demand will be met by new units.
After the recession, many banks laid off large mortgage divisions. It was projected that 2014 would see many of those mortgage lending jobs added back; however, the recovery of these positions has not been as quick as was initially projected. Despite the slow growth in mortgage divisions, consumer lending has seen a steady increase in 2014.
The number of FDIC-insured institutions is down in the first quarter of 2014 compared with Q1 2013, yet total loans are up $272 billion as of March 2014 and domestic deposits are up 5.3%. In Colorado, net loans and leases are up 1.7% over last year, and assets are up 2.6% for the same period.
Colorado Business Review 8
In 2013, the stock market had one of the best per-formances since the 1990s. The S&P 500, Dow Jones, and NASDAQ ended the year with 26.4%, 23.6%, and 34.2% annual growth, respectively. While this growth is expected to slow in 2014, forecasts project mid to high single-digit annual returns.
Home prices in Colorado are up 7.6% over last year with a median sale price of $251,750. Growth in home prices is projected to slow in 2015, with esti-mates around 1.5%.
Professional and Business Services
A services-producing supersector, Professional and Business Services (PBS) consists of three subsec-tors: Professional, Scientific, and Technical Services; Management of Companies and Enterprises; and Administrative and Support and Waste Management and Remediation Services. The supersector expanded 4.5% in 2013 and added 17,500 jobs year-over-year in May 2014.
Professional, Scientific, and Technical Services (PST) accounted for 50% of total PBS employment in May. Within PST, it appears that growth in legal services has flattened, perhaps due to the increase in law firm mergers. The bright spot for PST is Architec-tural, Engineering, and Related Services; the subsector showed sustained growth through 2013 and continues to show promise in 2014, increasing 4.4% year-over-year in May 2014. This growth is attributed in par-ticular to nonbuilding services, such as bridge and road design. Some of this growth, however, may be due to a temporary need for services to repair damages done by the recent floods and wildfires in Colorado.
PST is followed by Administrative and Support and Waste Management and Remediation Services,
SECTOR HIGHLIGHTS, C O N T I N U E D F R O M P A G E 7
which accounted for 40% of total PBS employment. Specifically, Services to Buildings and Dwellings added 7,000 of the 15,100 jobs added so far this year as of May. This is likely a result of the increase in occupied units and thus more demand for services to buildings, as well as the increase in warehouse use due to growing operations. Growth is expected to continue in this category, but may level off when vacancy rates flatten.
The final subsector of PBS is Management of Companies and Enterprises, which added 300 jobs year-over-year in May 2014 and continues to show positive employment growth (0.9%) despite a slowing trend.
Education and Health Services
The Education and Health Care Services Supersec-tor includes establishments that provide instruction and training by private schools and universities, and training centers, as well as establishments that provide health care and social assistance to individuals. This supersector did not suffer major employment losses in the recession; both the Health Care and Social Assistance Sector and the Education Sector have grown steadily since a slight four-month dip in 2009. In 2013, the annual average wage for this supersector was $84,760; this was 0.5% higher than the annual average wage in 2012. The location quotient of EHS in Colorado is 0.78, indicating that Colorado has a lower concentration of Education and Health Services jobs than the national average.
Health Care and Social Assistance makes up a majority of the Education and Health Services (EHS)Supersector and accounts for most of the growth within the supersector. Overall, EHS has grown slower than expected in May but is still up 4.1%

Colorado Business Review 9
C O n T i n U e D O n P a g e 1 0
Colorado MSA Metrics
Source: Federal Housing Finance Agency, All Transactions Indexes (Not Seasonally Adjusted).
FHFA Home PricesQ1 2013–Q1 2014
Source: CES (Seasonally Adjusted).
Employment Growth Rate May 2014 Year-Over-Year
Source: Bureau of Economic Analysis. 2013 State Personal Income per Capita $46,610.
Personal Income Per Capita, 2012
Source: LAUS (Not Seasonally Adjusted).
Unemployment RateApril 2014
year-over-year. This growth is despite an early-year decline in employment at hospitals and physician’s offices as a result of expectations that the Patient Protection and Affordable Care Act would lower reim-bursement. Employment in these areas started growing again in March. The long-term economic impacts of the Affordable Care Act remain to be seen, but the health care exchange and pent-up demand for health care is credited for the 10% jump in national health care spending that added $43.3 billion in nationwide consumer spending.
Growth in the private education subsector has been flat in 2014. The University of Phoenix has continued to close brick-and-mortar locations in Colo-rado, and Corinthians College has closed two schools in the state at the request of the federal government. These closings caused a drop in employment that was barely offset by increases in other private education services. Employment in private educational services has seen 1.7% year-over-year growth in May 2014. This increase is significantly lower than public state and local education employment, which have grown 2% and 2.8% year-over-year, respectively.
Leisure and Hospitality
The Leisure and Hospitality Supersector covers the establishments that operate within the tourism, travel, and recreational industries.
Leisure and Hospitality employment levels in Colorado increased 3.6% in 2013 and has grown an additional 4.9% year-over-year in May 2014.
Similar trends can be seen in Denver’s leisure and hospitality industry, which experienced its best tour-ism year ever in 2013. The city saw a record-breaking number of visitors, visitor spending, and lodger’s tax collection. The increase in visitors came from a strong rise in marketable visitors, reaching 5.5 million, a 13% increase year-over-year in 2013, while business travel remained flat. Spending by overnight visitors hit a record high of roughly $4.1 billion in 2013, an increase of 12%. Visitors spent $1.2 billion on lodg-ing, $1.2 billion on transportation, and $796 million on food and drink. This was the ninth-straight year Denver registered an increase in marketable visitors.
Colorado Business Review 10
DIA is the fifth-busiest airport in the nation. Three hub airlines and increased service from low-cost carriers have helped rank Denver as a destination that offers competitive airfare pricing. The recently added United Airlines nonstop service to Panama City is anticipated to boost tourism from South and Central American markets. Colorado will also be on the world stage once again with the fourth annual USA Pro Cycling Challenge in August. The legalization of recreational marijuana is still questionable as to whether it will help make Colorado more attractive to out-of-state tourists. Park visits in Colorado reached 5.4 million in 2013, down 7.2% from 2012. Total adjusted gross proceeds at casinos increased 1% year-to-date through May 2014 over the same time in 2013 while hotels and other
accommodation services generated $242 million in net taxable sales and $6.9 million in net sales taxes in 2013.
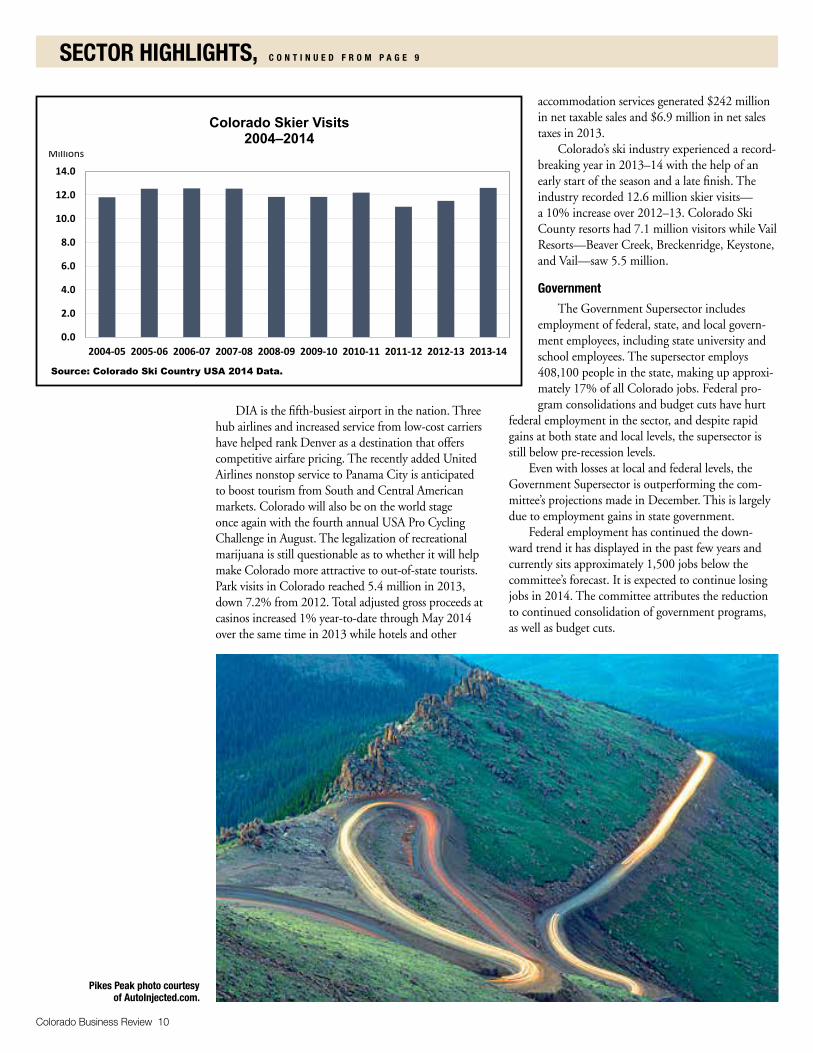
Colorado’s ski industry experienced a record-breaking year in 2013–14 with the help of an early start of the season and a late finish. The industry recorded 12.6 million skier visits—a 10% increase over 2012–13. Colorado Ski County resorts had 7.1 million visitors while Vail Resorts —Beaver Creek, Breckenridge, Keystone, and Vail— saw 5.5 million.
Government
The Government Supersector includes employment of federal, state, and local govern-ment employees, including state university and school employees. The supersector employs 408,100 people in the state, making up approxi-mately 17% of all Colorado jobs. Federal pro-gram consolidations and budget cuts have hurt
federal employment in the sector, and despite rapid gains at both state and local levels, the supersector is still below pre-recession levels.
Even with losses at local and federal levels, the Government Supersector is outperforming the com-mittee’s projections made in December. This is largely due to employment gains in state government.
Federal employment has continued the down-ward trend it has displayed in the past few years and currently sits approximately 1,500 jobs below the committee’s forecast. It is expected to continue losing jobs in 2014. The committee attributes the reduction to continued consolidation of government programs, as well as budget cuts.
Source: Colorado Ski Country USA 2014 Data.
Colorado Skier Visits 2004–2014
SECTOR HIGHLIGHTS, C O N T I N U E D F R O M P A G E 9
Pikes Peak photo courtesy of AutoInjected.com.

Colorado Business Review 11
Source: Bureau of Economic Analysis.
Percentage GDP Growth by Sector Year-Over-Year 2013
State employment has exceeded its target; it is currently above projections and has grown 1.3% year-over-year. This is mostly caused by expansion of the state education subsector due to the University of Colorado’s acquisition of two hospitals, although general government employ-ment has also grown. This subsector had year-over-year growth of 2% as of May 2014.
Local government employment is below estimate but has grown 2.3% year-over-year. No growth was recorded in the same period last year. Local government noneducation employ-ment (not seasonally adjusted) has grown 1.4% year-over-year. Local education employment, however, has climbed by 2.8% year-over-year in May, which offsets the losses in noneducation employment. Local government has gained a total of 5,600 jobs year-over-year.
The June 2014 economic report by the Governor’s Office of State Planning and Budget-ing (OSPB) revised the Colorado General Fund projections, projecting that the fund will grow by $500 million more than previously forecast in March. Since December 2011 OSPB has been revising its forecasts upward, and the current revision is a continuation of that positive trend.
Colorado home values have increased in 2014, which has led to an increase in assessed property values. This is a boon for the Colorado economy for two rea-sons: it is expected to help balance the housing market, which was previously drastically skewed toward sellers, by increasing the supply of homes for sale, and it has helped avert a crisis in property taxes.
The Government Committee underestimated employment growth in the supersector this year. Actual employment exceeds projections, and the committee believes it should maintain or grow this level during the remainder of 2014. The year-to-date job gains are strong, and increases in state and local governments should continue to outweigh the federal government job losses.
International Trade
As of April 2014, exports from the United States increased about 3% year-over-year. The top five export markets for the nation are (in order): Canada, Mexico, China, Japan, and Germany.
Colorado exports declined 4.3% year-over-year in April 2014. Trade with Canada, the state’s top export market, is down 5%. However, large growth has been seen in other Colorado trade markets. Exports to Mexico are up 26.2% in April. China continues to be Colorado’s third-largest export market, with a modest growth of 1.1% over 2013. Japan, the state’s fourth-largest export market, saw an increase of 7.5%. Exports to the Republic of Korea and Malaysia grew to fifth and sixth place, respectively, increasing 21% and 36%.
Electronic integrated circuits remains Colorado’s top export commodity, increasing 12.9%, to $173 mil-lion year-over-year in April. Medical, surgical, and den-tal devices, the state’s second-largest export commodity, grew 1.1%, to $148 million year-over-year. Export categories that have grown substantially over last year include prefabricated houses (778%) and motor cars and vehicles for transporting persons (144.3%).
Colorado’s top three import markets are Canada ($4 billion), China ($1.9 billion), and Mexico ($1.3 billion). Imports grew 1.3% in 2013, to just over $12 billion, with the top import commodity, crude oil, decreasing 14% year-over year. The second- and third-largest import commodities, automatic data processing machines and medicaments, increased 41% and 1.4%, respectively.
Several important factors will influence Colorado’s International Trade Sector in the second half of the year, including Europe’s continued contraction, emerg-ing markets’ vulnerability to the eurozone debt crisis, and fiscal policy uncertainty in Washington, D.C. It is also important to note the growing concern over a potential economic slowdown and a massive real estate bubble in China that could create greater instabil-ity in the global economy. However, moving forward international trade in Colorado appears to remain a positive force that is helping drive the state’s continued economic recovery.
Richard Wobbekind ([email protected]) is the Executive Director of the BRD and Senior Associate Dean for Academic Programs in the Leeds School of Business. Student research assistants Brooke Fox, Sam McMeley, Jimmy Owlsey, and Ryan Thorpe contributed to the summary, along with BRD staff member Brian Lewandowski.

COLORADOBUSINESSREVIEW
The CBR is a quarterly publication of the Business Research Division at CU-Boulder. Opinions and conclusions expressed in the CBR are those of the authors and are not endorsed by the BRD, the Leeds School of Business faculty, or the officials of CU.
View our website: www.leeds.colorado.edu/brd/
Richard L. Wobbekind, editor; Cindy DiPersio, assistant editor; Brian Lewandowski, technical advisor; Lynn Reed, design.
This report is not produced at taxpayer expense. The University of Colorado Boulder is an equal opportunity/nondiscrimination institution.
For information/address change:
Business Research Division 420 UCB, University of Colorado Boulder Boulder, CO 80309-0420 • 303-492-8227
Employment Change for Colorado January–May Year-Over-Year
Source: Bureau of Labor Statistics, Current Employment Statistics (NSA).
Save the date and watch for more information!
F I F T I E T H A N N U A L
2015
December 8, 2014
Grand Hyatt Denver, 1750 Welton Street
Brought to you by
The University of Colorado Boulder, Leeds School of Business
www.colorado.edu/leeds/outlook
NEW
LOCAT
ION!
B U S I N E S S E C O N O M I C
O U T L O O K
C O L O R A D O