employment scenario a marginalized … parmar dr. varsha ... to analyze the employment scenario...
TRANSCRIPT
EMPLOYMENT SCENARIO
AMONG MARGINALIZED
COMMUNITIES OF
KACHCHH DISTRICT
Report Dr. Balpreet Kour Arora
Bipin Parmar Dr. Varsha Ganguly
Year 2008-09
BEHAVIOURAL SCIENCE CENTRE ST. XAVIER ’S NON-FORMAL EDUCATION SOCIETY
ST. XAVIER ’S COLLEGE CAMPUS AHMEDABAD
Ph : 079-26304928/ 26303577 Fax : 079-26307845 E-mail: [email protected], [email protected]
Website: www.bsc-sxnfes.org

ACKNOWLEDGEMENTS
Our attempt to explore and describe employment scenario among the marginalized communities
is pioneering. Our aim is to chalk out planned intervention for improving employment scenario
among the marginalized communities, as they construct 60-80% of labour in unorganized sector
in Kachchh district. Total 987 households from 99 villages of Bhachau and Rapar taluka of
Kachchh districts have shared their situation of employment and therefore we have highlighted
their perceptions through numbers rather than through statistical formula to show level and rate
of unemployment.
We are thankful to the respondents of the study, sarpanch (head of the village), village panchayat
members and teachers of primary schools along with the staff members who have contributed to
the study in different ways. The staff includes teams of Kachchh Vanchit Vikas Sangathan
(Tarun, Vikas, Rahim, Rani, Ramesh, Navin, Ranchhod, Vanita, Bhavana), Bal Vikas Kendra
(Agnes, Dinesh, Shailesh) and Abdul. Minaxi, Cecilia and Sunita have contributed to data entry,
formatting and printing of the report and they too are acknowledged with due respect. Fr.
Amalraj SJ has shared his insights and has made research team reflecting over ground reality and
the data and we are thankful to him for his contribution. We thank all who have directly or
indirectly contributed to the study from bottom of our hearts.
The research team members – Bipin, Hansa and Dr. Balpreet Kour Arora deserves complements
and due recognition for hard work and quality reporting.
Dr. Varsha Ganguly
Director

CONTENTS Page no.
ACKNOWLEDGEMENT- i
LIST OF CONTENTS- ii
LIST OF TABLES- iii
LIST OF GRAPHS, ANNEXURES, ABBRIVATIONS, GLOSSARY- iv
EXECUTIVE SUMMARY- v
Chapter 1: Introduction- 1
Objectives of the study 1
Introduction of the Study Area 2
Methodology of the Study 2
Limitations of the study 3
Research Structure 3
Chapter 2: 4
Section-I: Profile of the respondents- 4
Sex 4
Age 4
Community 4
Education 5
Community wise Employment scenario 6
Demographic details 7
Pattern in talukas 7
Earning members in the family 8
Ration Card Holder 8
Asset Holding 9
Section-II: Employment scenario- 10
Income Generation Activity (IGA) 10
Multiple Income Generation Activities 11
Number of days of employment 12
Income Details 13

Taluka wise Income Scenario 14
Employment through Migration 14
Information about Employer/Contractor (Mukadam) 15
Awareness about NREGA and Job Card 16
Suggestions about creating job opportunities 16
Chapter 3: The data analysis- 17
Education and Employment Scenario 17
Asset holding and Employment Scenario 20
Land Owning 20
Income from Different Crops 22
Cattle owning and Income generation 23
Income generation Activity 25
A. Nature of employment 25
Income Generation Activity and Educational status 28
B. Frequency of Income generation Activity 30
C. Duration of Employment/ Income generation activity 31
Number of days of employment (Annual analysis) 32
D. Productivity of Income Generation Activity 33
Income Generation activity and Annual Income 34
Multiple Income Generating activities and the income generated 36
The overall Employment scenario 38
Chapter 4: Major findings of the study- 41
Chapter 5: Conclusion- 47
Annexure- 53
Reference 57

LIST OF TABLES
No. Details Page no.
1. Taluka wise Community Component 5
2. Education Scenario in both the Talukas 6
3. Extent of Migration in last seven months-taluka wise 15
4. Level of education in Marginalized Communities –An Overview 17
5. Number of cattle owning 24
6. Income Generation through cattle 24
7. Income Generating Activities: 24 categories, Taluka wise 25
8. Income Generation Activities (10 categories) 26
9. Income generation activities- Male-Female Scenario 28
10. Income Generation Activity and Educational Status 29
11. Number of income generation activities taluka wise 30
12. Days of Employment (Monthly) 31
13. Annual income taluka wise 33
14. Annual income community wise 33
15. Income generation Activity and Annual Income 35
16. Number of income generation activities Annual income 37

LIST OF GRAPHS
No. Details Page no.
17. Community component 5
18. Annual Income-range Indicator 13
19. Cattle details 23
LIST OF ANNEXURES
No. Details Page no.
1. The Questionnaire 53
2. List of villages 56
ABBRIVIATIONS
OBC Other backward classes
SC Scheduled caste
ST Scheduled Tribes
APL Above poverty line
BPL Below poverty line
GLOSSARY
Dalit Officially Scheduled caste, popularly as dalits
Mukadam Labour Contractor who hires labours on daily wages; mostly
without license Patharal (Goradu) Rocky land
Retal (Kampwali) Sandy land
Kali (Matiwali) Black soil land

EXECUTIVE SUMMARY
A study was conducted to analyze the Employment Scenario among the Marginalized
Communities of Kachchh district. The survey covered 987 respondents; 500 from 47 villages of
Bhachau taluka and 487 from 52 villages of Rapar taluka.
Out of 987, 419 (42.5%) are Dalit, 425 (43.1%) are Koli, 122 (12.4%) are Muslim, 8 (0.8%) is
Bheel, Devipujak are 12 (1.2%) and Pardhi is 1 (0.1%). The male respondents are more than half
(55.6%) and female respondents are 44.4%. In Bhachau, male (60.4%) outnumber females
(39.6%) with a large margin, whereas, in Rapar, males (50.7%) and females (49.3%) are almost in
the same proportion. The majority of the respondents come under the age group of 19-35 years,
which constitute 56.9% and 24.8 % of the respondents are in the age group of 15-18 years,
14.7% are above 36 years of age and only 0.6% come under 10-14 years age group.
The educational status among these communities reflect that 48.6 % are non-literate, whereas
37.1% have received Primary Education, 11% have received Secondary Education and only 1.8%
have received Higher Secondary Education, 0.7% have studied till graduation, 0.1% have done
Post Graduation and rest 0.3%, 0.2% and 0.1 have done B.Ed., PTC and Computer Course
respectively. The highest number of Non-literates is observed among Kolis with 47.5%, while
37.9% of the non-literates are Dalit, 11.5% are from Muslim community, 1% is Bheel and 1.9%
and 1% are Devipujak and Pardhi, respectively.
Of total 987, more than half (60.2%) are found to be BPL (Below Poverty Line) card holders
including Antyodya card holders while a little more than one fourth (26.3%) are APL (Above
Poverty Line) card holders whereas 12.7% respondents do not have any ration card. The asset
holding is also found to be very low among these communities. Judged on five basic assets
categories; house, house plot, land owning, cattle and vehicle, it was found that though 92.1%
posses a house yet a very traumatically huge number, only 71.2% do not have a house plot of
their own.
The situation of land owners is also very dismal, as only less than half (48.9%) own cultivable
land, and in them too, as huge as 72.5% are small (<8 acre) land holders, 15.7% are medium (9-
16 acre) land holders and only 5.0% are large (17<) land holders. In a comparison of both the
talukas, the situation is little better in Rapar, where the percentage of land owners is 59.8% than
in Bhachau (40.2%). As far as cattle owning is concerned 52% of all respondents do not have
any cattle, which restricts the possibility of having any income through it and the percentage of
vehicle owner is small (4.8%).
It is observed that the respondents are engaged in various income generation activities and
sometimes in multiple income generation activities and many respondents are involved even up

to five different activities. According to the study, 39.4% are involved in single income
generation activity, 33.2% are involved in two activities, 19.8% are involved in three different
activities, 7.1%are involved in four different activities and 0.5% is involved in five income
generation activities.
The study revealed that the most common income generation activity in the region is working as
Casual Labours, as 699 responses (36.2% of total 1930 responses) were received in this category.
The second most popular income generation activity in the region is found to be farming as 25%
of the responses accepted to be engaged in various types of farming and only 3.8% do cattle
rearing as an income generation activity. Of all the respondents, a very few respondents are
found to be skilled labour (17.9%) and only 7 % are Agricultural labour. Though the percentage
of Artisan is 3.4%, the percentage of running self-owned business is found to be as low as 2.4%.
A significantly lower number have a government job (1.2%) and the respondents having even a
private job (2.1%) is also very low.
It is also realized the number of skilled labours 345 (17.9%) is almost half the number of
Unskilled or Casual labours 699 (36.2%) and among them, 53.6% are Non-literate. In a
comparison of both the talukas, it is even higher in Rapar (381) than Bhachau (318). Of total,
more males 367 (52.5%) are working as casual labourers, than females 332 (47.5%), however the
difference is very marginal. The study found that 45.5% of all the casual labours belong to Koli
community, while, 41.2% are Dalit, 11.6% are Muslim, 1.1% are Bheel and 0.6% are Devipujak.
The study indicated that 17% respondents also migrate in search of work.
The study found that only 16% get employment for 21-30 days, 56.4% get for (11-20 days),
13.5% get for 1-10 days and 7.5% are totally unemployed. Though, the government attempts to
generate employment opportunities through NREGA but it has not been able to address the
problem fully. The study observed that a high number of respondents (65.7%) are aware about
NREGA, however only 10.4% have their job card made, and only 6.8% got job under NREGA
in last seven months.
Despite being involved in multiple income generation activities, the income earned is observed
to be very low. A maximum of 24.5% have an annual income higher than 15000 Rupees,
otherwise 35.4% have an income of (Rs. 5001-10,000), 16.8% have an income of (10,001-
15,000), 13.3% have an income of (Rs. 3001-5000), 6.3% have an annual income of (Rs. 1001-
3000). Remorsefully, 1.7% have an income of (<1000) and 0.2% does not have any income at
all.
The study found that Casual labours is the worst affected group as only 17.2% of Casual labours
earn more than 15,000 Rupees annually, or else 0.7% earn even less than Rs. 1000 annual, 8%
earn 1000-3000 Rupees, 17.2% earn 3001-5000 Rs., 35.3% earn 5001-10,000 Rs, 20.5% earn

10,001-15000, and 17.2% earn more than Rs. 15000 per annum. Being the largest mass, a lower
income among this segment epitomizes the general trend.
The present employment scenario, reflected through the study reinforces the fact that these
communities are living on the periphery, as far as employment opportunities are concerned. The
social structure indicates that the marginalized communities constitute a large share of the
population; therefore addressing the issue becomes more essential. Illiteracy, lack of informal
education or training, lack of new job creating avenues, lack of resources and low productivity
(due to various inter-linked reasons) have been identified as major constraints of their main-
stream involvement.
The study points out that creating new job avenues and preparing the marginalized communities
to be self reliant could be the best possible approach. The study has revealed that there is a large
number of non-literate casual labours and a big chunk of Primary educated casual workers in the
region, which needs to be addressed. This large portion of the population could get more
opportunities to work, have they been provided any skill. This mass has the potential to be
trained for various skill base tasks and self employment.
To improve their condition, many corrective measures need to be taken. Exploring the areas
where new job avenues and employment opportunities could be generated could be one of the
most important steps. The study so far, has realized that provided these unskilled/casual labours
are given guidance or direction through a Community College, to set up skill based self owned
business or employment opportunities, the problem could be addressed. The underprivileged
and marginalized communities could be made self reliant, and excluded in the main stream.

CHAPTER 1: INTRODUCTION
India’s Economy is one of the World’s fastest growing economies. The economy is mixed in
nature, and based on both Agriculture and Industries. Creating new avenues of employment and
touching new milestones of growth, (at a growth rate of 8%) India is marching ahead. With the
economic policies of Liberalization, Privatization and Disinvestment, the economy of the
country is touching new highes. However, there are many problems which still persist within the
structure. Unemployment is one of such problems, which is not only a challenge to the growth
of the economy, but it is also creating many adverse impacts on the social structure. Almost
9.2% are unemployed in the country. Though, to combat this problem, many schemes like
Sampoorna Grameen Rozgar yojna (SGRY), Swarnjayanti Gram Swarozgar Yojna (SGSY), Rural
Employment Generation Programme (REGP), Prime Minister’s Rozgar Yojna (PMRY) and
National Rural Employment Guarantee Act (NREGA) have been introduced by the
government, however despite all the endeavors the picture of Employment Scenario in the
country is still very gloomy. Beside total unemployment, lower income generating employment
and part time employment, has also resulted into marginalization of a large population, who is
living a life without basic amenities. The existing social structure of the country is already
complex and few communities are facing social discrimination from centuries. It is observed that
the problem of social discrimination coupled with economic marginalization have averted into
their total exclusion from the main stream. Therefore these marginalized communities are not
only socially discriminated but also underprivileged as far as economic status is concerned. They
have not been participants in the process of Development so far; neither have they been able to
enjoy the fruits of the yet achieved growth by the country. In absence of a supportive social set
up, with less educational status and lack of resources, they end up having a very few employment
opportunities.
In the State of Gujarat, this problem is observed to be very acute in North, especially in the
district of Kachchh. The State of Gujarat has four regions- North Gujarat, Central Gujarat,
South Gujarat and Saurashtra. The total population of Gujarat is 50,671,017, while the SC
population is 3592,715 and ST population is 74, 81,160. Whereas, in Kachchh, with a total
population of 15, 83,225, the population of SC is 185,932 which constitute 11.7% of the total
population, while the ST population is 130,138 at 8.2% of the total population. The Marginalized
Communities have a significant presence in the region, which evokes the possibility of mapping a
general pattern of employment among the marginalized.
Objectives of the Study
The study attempts to map the employment scenario among the Marginalized Communities of
Kachchh. It is an attempt to analyze the employment pattern in the region to explain the reasons
for marginalization of specific communities who face economic marginalization along with social
discrimination. These communities are living on the periphery, as far as employment
opportunities are concerned. The demography suggests that the marginalized communities
constitute a large share of the population; therefore addressing the issue becomes more essential.
The study examines the present scenario to identify major constraints of their main-stream
involvement and suggests taking corrective measures to improve their condition. The study also
aimed to explore the areas where new job avenues and employment opportunities could be
generated for such underprivileged and marginalized communities.
Introduction of the Study Area
The District of Kachchh has been taken as the universe of the study. Located in North of
Gujarat, Kachchh is the largest border district. The total geographic area of Kachchh is 45,652
sq. Km. The district has total population of 1583225, out of which Schedule castes population is
185932 (11.7%) and the population of Schedule tribes 130138 (8.2%). Dalit, Koli, Muslims,
Bheel, Devipujak and Pardhi are the major marginalized communities in the region. There are
nine talukas in Kachchh with 949 villages. The nine talukas are; Abdasa, Lakhpat, Nakhatrana,
Bhuj, Mandvi, Mundra, Anjar, Bhachau and Rapar.
The present study is focused on the two talukas, Bhachau and Rapar, keeping in mind that the
marginalized communities have a significant presence with almost 30% of the total population in
Bhachau and 32% in Rapar.
Bhachau
The total geographical area of the taluka is 1985 sq. Km. There are 71 villages in the taluka. The
total population of Bhachau is 147891. The population of SC is 14993, while ST population is
27535.
Rapar
The taluka is spread over 3024 sq. Km. The total population of Rapar is 198000, whereas the SC
population is 20894 and ST population is 41935. The taluka has 97 villages.
Methodology of the Study
The study attempts to trace the employment scenario among the Marginalized Communities of
Gujarat. With an aim to map out the general pattern, the study has covered two talukas;
Bhachau and Rapar Taluka of Kachchh District. The study has covered 47 (Forty seven) villages
in the Bhachau Taluka and 52 (Fifty two) villages coming in the Rapar Taluka.
The report is based on primary data collection. The Primary data is collected mainly from two
Talukas, Bhachau and Rapar. The information is generated with the help of an extensive
questionnaire. The survey has adopted stratified sampling and thus all the marginalized
communities are represented as per its population in the given taluka. A total number of 987

respondents have been covered under the study, of which 500 respondents are from Bhachau
and 487 are from Rapar. The entire data is collected during August 2008 to September 2008.
Limitations of the study
As per the Research structure of the study, the use of PLA (Participatory Learning and Action)
method as a Research tool was scheduled but somehow this plan could not be executed. Thus,
the Primary data for the study was collected only through questionnaire, filled up during personal
interaction between the investigator and the respondent.
Research Structure
The study is divided into Five Chapters. Chapter One- ‘Introduction’ presents a brief overview
of the Indian economy as well as of the economy of the State of Gujarat. The Chapter focuses
on the gloomy position of the marginalized in the state. It also shares basic information about
the area covered under the study, and explains the outline of the Research Structure. The
Chapter also incorporates the objectives of the study and the applied methodology.
The Second Chapter, ‘Profile of the Respondents’ presents a summary of the respondents
covered under the study. A large number of 987 respondents have been covered under the study.
Entire information is collected through a comprehensive questionnaire. The study has collected
details of the respondents, regarding their personal profile and employment details.
Chapter Three, ‘The Employment Scenario among Marginalized Communities: Data Analysis’ is
an attempt to analyze the data collected. The chapter examines the pattern of employment in the
region and tracks the position of the Marginalized Communities in the area.
Chapter Four, discusses the ‘Findings of the Study’ and presents an overview. The Chapter
evokes the presence of an unholy nexus between social marginalization and less economic
opportunities.
Chapter Five sums up the observations made by the study and discuss the plausible areas where
a change can be made through interventions of the State. The chapter makes suggestions to
bring some change in the present pattern and enhance opportunities for the marginalized to
ensure their inclusion in the main stream. A deliberate change through Policy making as well as
with the increased role of Non Governmental Organizations (NGOs) is also recommendable.

CHAPTER 2: SECTION – I: PROFILE OF THE RESOPNDENTS
The Chapter presents profile of the Marginalized Communities in the Kachchh District. The
Study was conducted in two Talukas; Bachahu and Rapar. The BSC Research Team meticulously
investigated the employment scenario in the region. The team collected the information through
a detailed questionnaire. The first section of the Chapter deals with Personal profile of the
respondents, which include details of age, caste, sex, educational status, and asset holding as well
as family information like total number of family members, structure of the family (male-female
component, age component) earning members in the family, etc.
The second section; Employment Scenario deals with information about income generation
activity, type of employment, migration details, income range, access to NREGA, information
about the employer, etc to track the income pattern as well as the employment pattern in the
region.
Sex
Majority of the respondents, 549 are male, (55.6%) and the percentage of female respondent is
44.4 at (438). In Bhachau, male 302 (60.4%) outnumber females 198 (39.6%) with a large margin,
whereas, in Rapar, males 247 (50.7%) and females 240 (49.3%) are almost in the same
proportion.
Age
Of total 987 respondents, majority of them come in the age group of 19-35 Yrs., which
constitute 56.9% and 24.8 % of the respondents are in the age group of 15-18 Yrs, 14.7% are
above 36 years of age and only 0.6% come under 10-14 Years age group.
Bhachau- Of all 500 respondents, 54.8% are between (19-35 Yrs.) of age, 25.4% are between (15-
18 Yrs.), 16.2% are above 36 Yrs. And only 0.4% is between 10-14 Years of age.
Rapar- Of all 487 respondents, 59.1% are between (19-35 Yrs.) of age, 24.2% are between (15-18
Yrs.), 13.1% are above 36 Yrs. And only 0.8% is between 10-14 Years of age.
Community
The Marginalized communities covered in the Study mainly are SC (Dalit) 419 (42.5%), Koli 425
(43.1%), Muslim 122 (12.4%), Bheel 8 (0.8%), Devipujak 12 (1.2%) and Pardhi 1 (0.1%).

Graph 1: Community component
Caste components
42.5
43.1
12.4
0.8
1.2
0.1
Dalit Koli Muslim Bhil Devipujak Pardhi
The following table shows the position of the above said marginalized communities in both the
talukas.
Table 1: Taluka wise Community Component
Talukas Bhachau Rapar
Total Caste
No of resp.
R% C% No of resp.
R% C% No of resp.
C%
Dalit 227 54.2 45.4 192 45.8 39.4 419 42.5 Koli 180 42.4 36.0 245 57.6 50.3 425 43.1 Muslim 83 68.0 16.6 39 32.0 8.0 122 12.4 Bheel 07 87.5 1.4 01 12.5 0.2 08 0.8
Devipujak 02 16.7 0.4 10 83.3 2.1 12 1.2 Pardhi 01 100.0 0.2 00 - 01 0.1 Total 500 50.7 100 487 49.3 100 987 100
⇒ The presence of Dalits is higher in Bhachau (54.2%) than Rapar (45.8%). ⇒ Kolis are more prevalent in Rapar (57.6%) than Bhachau (42.4%). ⇒ Muslims outnumber in Bhachau (68%) than Rapar (32%). ⇒ 87.5% of the Bheel respondents live in Bhachau. ⇒ While, 83.3% of Devipujak community live in Rapar. ⇒ The Pardhi community is restricted to Bhachau taluka (100%).
Education
It has been observed that nearly half of the respondents covered in the survey are non-literate
(480) which constitute 48.6 percent, whereas (366) 37.1% have received Primary Education,
(109) 11% have received Secondary Education and only (18) 1.8% have received Higher
Secondary Education, (7) 0.7% have studied till graduation, (1) 0.1% have done Post Graduation
and rest (3) 0.3%, (2) 0.2% and (1) 0.1 have done B.Ed., PTC and Computer Course respectively.

Bhachau- Out of all 500, 220 (44%) respondents are non-literate, 201 (40.2%) have received
Primary education, 67 (13.4%) have received Secondary education, the percentage of getting
Higher Secondary education is 1.6% (8), 2 (0.4%) have Graduated, 1 (0.2%) Post Graduated and
1 (0.2%) has done B.Ed.
Rapar- of all 487 respondents 260 (48.6%)) are non-literate, 165 (37.1%) have received Primary
education, 42 (11%) have received Secondary education, the percentage for receiving Higher
Secondary education is 2.1% with 10 respondents, 5 (1%) Graduated, 2 (0.4%) have done B.Ed.,
2 (0.4%) have done PTC and 1 (0.2%) have done Computer Course.
Table 2: Education Scenario in both the Talukas
Talukas Bhachau (n=500) Rapar (487)
Total (n=987) Details of education
No of
resp.
R% C% No of
resp.
R% C% No of
resp.
C%
Non-literate 220 45.8 44.0 260 54.2 53.4 480 48.6 Primary Education [std. 1-7]
201 54.9 40.2 165 45.1 33.9 366 37.1
Secondary Education [std. 8-10]
67 61.5 13.4 42 38.5 8.6 109 11.0
Higher Secondary Education [std. 11-12]
8 44.4 1.6 10 55.6 2.1 18 1.8
Graduate [BA/B. com/B.Sc]
2 28.6 0.4 5 71.4 1.0 7 0.7
PG [MA/M. com/M.Sc]
1 100.0 0.2 1 0.1
B.ed. with B.A. / B.com. / B.Sc 1 33.3 0.2 2 66.7 0.4 3 0.3 P.T.C. 2 100.0 0.4 2 0.2 Computer course 1 100.0 0.2 1 0.1
Total 500 50.7 100 487 100 100 987 100
Community wise education scenario
⇒ The highest number of Non-literates is among Kolis 228 (47.5%), 182 (37.9%) of the non-literates are Dalit, 55 (11.5%) are from Muslim community, 5 (1%) are Bheel and 9 (1.9%)
and 1 (1%) are Devipujak and Pardhi, respectively.
⇒ The highest percentage of Primary education received respondents is among Koli with 42.6% and almost 41.5% are from Dalit community.
⇒ In Bheel community no one has received education above Higher Secondary ⇒ In Devipujak and Pardhi community, no respondent has received education more than Primary level.
⇒ The total percentage for having education beyond graduation (0.7%) and that too only by the Dalit Community and Koli Community.

Demographic Details
This information is divided into six sub-sections; total number of family members, the number
of males, the number of females, number of males below 14 Yrs, number of females below 14
Yrs and total number of children below 14 Years of age.
Total family members- Out of all respondents the maximum percentage of 49.2 has 3-5
members in the family. A little less than that i.e. 45.5% respondents have more than six (6)
members in the family. The number of family members ranging 1-2 is found only in 4.7 %
respondents.
Number of males- 515 (52.2 %) respondents has 3-5 male members in the family, whereas 429
(43.5 %) respondents have 1-2 male members in the family. In 29 (2.9%) the number of males
range is (>6).
Number of females- 494 (50.1%) respondents have a total numbers of females in the family is
ranging from 1-2, whereas the percentage of having 3-5 female members in the family is 45.5%
with 449 respondents. In 34 (3.4%) respondents the number of females ranges (>6).
Males below 14 Yrs of age- in 53.8 % Respondents the number of males below 14 Yrs in the
family is restricted from 1-2, in 10.5% the number range is (3-5), in 0.2% the number exceeds (>
6). However, in 35.5%, there is no male in the family below 14 Yrs of age.
Females below 14 Yrs of age- 53% have (1-2) females in this segment, 9.1% have (3-5), 0.3%
have (>6) while 37.6% have no females in the family in the segment.
Total number of children below 14 Yrs- 37.3% have (3-5) members in this category, 34.7% have
(1-2) members, 4.2% have (>6) and 23.9% have none, in the category.
Pattern in Talukas
Bhachau- of total 500 respondents,
⇒ 249 (49.8%) have (3-5) members in the family, 225 (45%) have (>6), 22 (4.4%) have (1-2) and 4 (0.8%) do not have any family members.
⇒ In the family, 255 (51%) have (3-5) male members, 222 (44.4%) have (1-2), 17 (3.4%) have (> 6) and only 6 (1.2%) do not have any male members in the family.
⇒ The number of females in the family is (1-2) among 254 (50.8%), (3-5) is among 221 (44.2%), (>6) is among 19 (3.8%) and among 6 (1.2%) there are no female members in the family.
Rapar- of total 487 respondents,
⇒ 237 (48.7%) have (3-5) members in the family, 224 (46%) have (>6), 24 (4.9%) have (1-2) and 2 (0.4%) do not have any family members.

⇒ In the family, 260 (53.4%) have (3-5) male members, 207 (42.5%) have (1-2), 12 (2.5%) have (> 6) and only 8 (1.6%) do not have any male members in the family.
⇒ The number of females in the family is (1-2) among 240 (49.3%), (3-5) is among 228 (46.8%), (>6) is among 15 (3.1%) and among 4 (0.8%) there are no female members in the family.
Earning members in the family
This information is divided into six sub-sections; total earning members, the number of earning
males, the number of earning females, number of earning males below 14 Yrs, number of
earning females below 14 Yrs and total number of earning children below 14 Years of age.
Total earning members- Out of all 987 respondents the maximum percentage of 67.4 has 1-2
earning members in the family and only 27.2% have 3-5 earning members in the family.
However, 2.1% have >6 earning members in the family. And, 3.2% reported of not having any
earning member in the family.
Number of earning males- 85.1 % Respondents has 1-2 earning male members in the family,
whereas 8.3 % respondents have 3-5 earning male members in the family. In 0.4% the number of
earning males range is (>6).
Number of earning females- In 60.6% respondents, the total numbers of females in the family is
ranging between 1-2, whereas the percentage of having 3-5 earning female members in the family
is restricted up to 2.6% and0.2% the number of females ranges (>6). However, the percentage
of not having any earning female member in the family is as high as 36.6%.
Earning males below 14 Yrs of age- A huge percentage of 94.9, does not have any earning male
below 14 years of age. Only 4.4% have 1-2 earning male members below 14 and in 0.6% the
number range is (>6).
Earning females below 14 Yrs of age- A huge percentage of 95.7, does not have any earning
females below 14 years of age. Only 3.6% have 1-2 earning female members below 14, 0.5%
have 3-5 earning females and in 0.1% the number range is (>6).
Total number of earning children below 14 Yrs- In 93.9% there are no earning members under
the age of fourteen and only 3.9% reported have 1-2 earning children, 1.9% reported having (3-
5) children who are earning and only 0.4% reported (>6) members in this category.
Ration Card Holder
Of total 987, more than half 576 (58.4%) are BPL card holders while a little more than one
fourth 263 (26.3%) are APL card holders. Only 18 (1.8%) respondents are Antyodya card
holders whereas 125 (12.7%) respondents do not have any ration card.
⇒ A higher number of BPL card holders are observed in Bhachau Taluka, consisting 62.7%. ⇒ The higher percentage of 76.5% of all APL card holders is resident of Rapar Taluka.
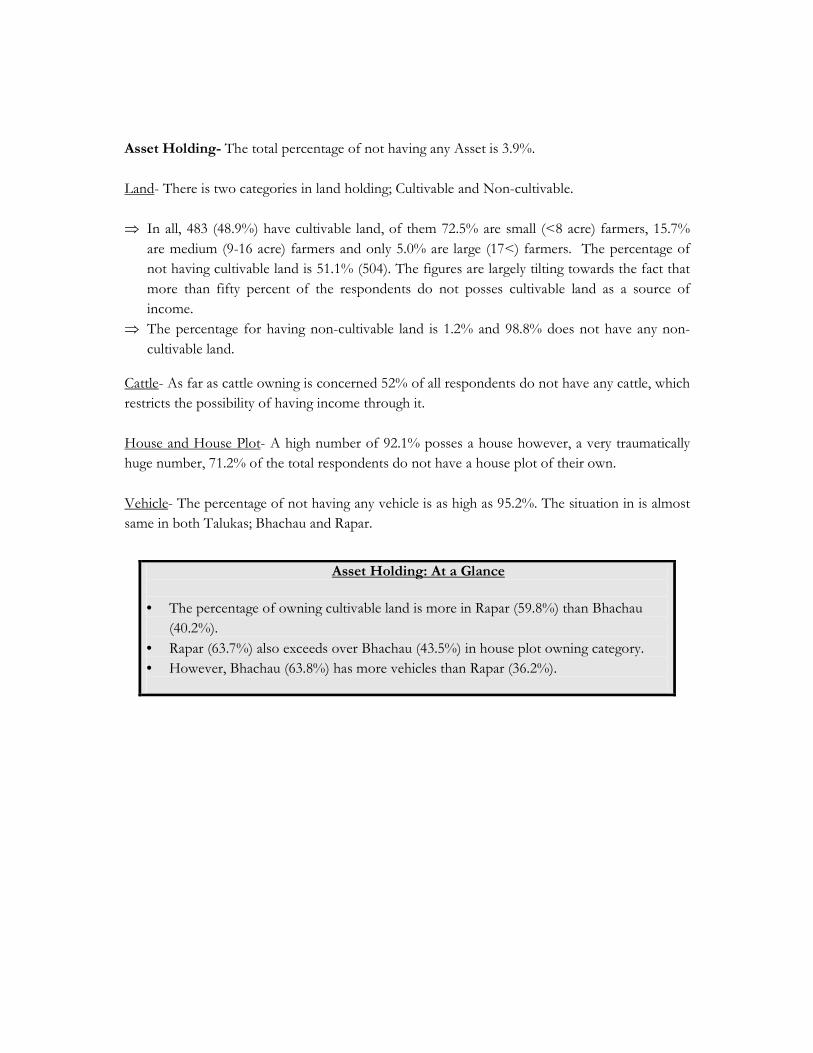
Asset Holding- The total percentage of not having any Asset is 3.9%.
Land- There is two categories in land holding; Cultivable and Non-cultivable.
⇒ In all, 483 (48.9%) have cultivable land, of them 72.5% are small (<8 acre) farmers, 15.7% are medium (9-16 acre) farmers and only 5.0% are large (17<) farmers. The percentage of
not having cultivable land is 51.1% (504). The figures are largely tilting towards the fact that
more than fifty percent of the respondents do not posses cultivable land as a source of
income.
⇒ The percentage for having non-cultivable land is 1.2% and 98.8% does not have any non-cultivable land.
Cattle- As far as cattle owning is concerned 52% of all respondents do not have any cattle, which
restricts the possibility of having income through it.
House and House Plot- A high number of 92.1% posses a house however, a very traumatically
huge number, 71.2% of the total respondents do not have a house plot of their own.
Vehicle- The percentage of not having any vehicle is as high as 95.2%. The situation in is almost
same in both Talukas; Bhachau and Rapar.
Asset Holding: At a Glance
• The percentage of owning cultivable land is more in Rapar (59.8%) than Bhachau (40.2%).
• Rapar (63.7%) also exceeds over Bhachau (43.5%) in house plot owning category. • However, Bhachau (63.8%) has more vehicles than Rapar (36.2%).

SECTION – II:
EMPLOYMENT SCENARIO
This section covers the following aspects of employment scenario:
a. Income Generation Activity (IGA)/ Type of Employment, days of employment b. Income Details –(Annual, season wise break-up; summer, monsoon and winter) c. Migration details- extent of migration (during last seven months till month of July 2008), place of migration
Income Generation Activity (IGA)
The respondents are engaged in various income generation activities and sometimes in multiple
income generation activities. All the income generation activities pursued by the respondents1 are
combined/ sorted into ten major categories. It is observed that the majority of respondents are
engaged in multiple activities. Therefore, every respondent has given multiple answers with
regard to their income generation activity. From total 987 respondents, total 1930 responses
were received regarding income generation activity.
Own farming/contract farming- 483 responses (25% of all the responses) claimed to be engaged
in Farming (own/ contract farming) out of which maximum number 273, are from Rapar, and
210 from Bhachau.
Agriculture labour- 135 (7%) responses received in favour of Agricultural labour, out of which
83 from Rapar, 52 from Bhachau.
Cattle rearing- 73(3.8%) admitted to be doing cattle rearing as an income generation activity, out
of which a significantly large number is in Bhachau (64) than Rapar (9).
Government job-only 24 (1.2%) have acquired government jobs, in Bhachau (11) and Rapar (13).
Private Job- 40 (2.1%) responses received admitting that they have obtained private jobs as the
income generation activity.
Self-owned business- 47(2.4%) of all responses received claiming to be running self-owned
business.
Skilled labour- 345 (17.9%) responses for skilled labour were received, out of which 207 from
Rapar, 138 from Bhachau.
1 This information is collected with a choice of 24 categories in the questionnaire, see Annexure-1, question-13

Artisan- 65 (3.4%) fall in this category, doing various income generation activities like; out of
which 27 are in Bhachau and 41 in Rapar.
Casual labour- a maximum number of 699 (36.2%) responses admitted to be casual labours, out
of which 381 were received from Rapar, 318 were from Bhachau.
Others- 8 (0.4%) responses were in other category, while, response of 11 respondent is not
known.
Multiple Income Generation Activities- Of all only 39.4% are engaged in single income
generation activity, while 33.2% are engaged in two different income generation activities, 19.8%
are engaged in three different Income generation activities , 7.1% are involved in four Income
generation activities and 0.5% are involved in five different activities.
⇒ In Bhachau a clear majority of respondents pursue only one income generation activity with 51.2%, however in Rapar only 27.3% pursue one income generation activity, which means
that almost 72.7% pursue multiple income generation activity.
Income generating Activities: An Overview
• Working as a casual labour is the most common income generation activity in the region. Out of total 1930 responses, 699 (36.2%) responses accepted working as a
casual labour.
• The second most common activity is cultivation at 25% of all the responses. • Cattle rearing as an income generation activity are much more prevalent in Bhachau (64) than Rapar (9).
• There are more respondents in Rapar (273) who pursue cultivation as income generation activity than Bhachau (210). Similarly, Rapar (381) out number Bhachau
(318) as far as casual labours are concerned.
• There are three times more respondents in Bhachau (33) who run self-owned business than Rapar (11).
• The number of Artisan is almost double in Rapar (41) than Bhachau (24). • In Rapar (11), there are much more females in Government jobs than Bhachau (3). • More females (54.5%) are working as Agriculture labours than males (45.5%).
Skilled/Unskilled- of all, 91.4% are skilled in their respective income generation activity
/occupation and rest 8.6% come under unskilled category. Of all skilled categories, the
maximum numbers of respondents (26.5%) are skilled in farming and 18.2% are skilled as casual
labourers. Out of all type of skilled respondents, almost 95.3% believed that they received more
opportunities to work due to their skill.

• 95.3% respondents felt that they received more work opportunities due to being skilled.
• 63.8% felt that Relatives are the most preferable source to learn such skills.
Number of days of employment
Of all respondents, only 16% get employment for 21-30 days, 56.4% get for (11-20 days), 13.5%
get for 1-10 days and 7.5% are totally unemployed.
Summer- out of 120 days of entire summer season 40.5% work for (31-60 days), 27% work for
(1-30 days),19% work for (61-90 days), 7% work for (> 91 days), however 0.3 % do not get work
at all during entire season. The employment status of 6.2% is not known.
Monsoon- 46.2% get work for (31-60 days), 27% for (1-30 days) 13.9% for (61-90 days), 4.7%
work for (>91 days) , while 0.3% do not get work at all. The employment status for 8% is not
known.
Winter- 38.9% gets work for (31-60 days), 27.8% get for (61-90 days), 18.6% get for (1-30 days),
8.6% get (>91 days). While the employment status of 6.2% is not known, the unemployed
percentage is nil.
Bhachau-
⇒ A majority of 68% get employment for a period of (11-20 days), out of which 40% are male and only 28% are females.
⇒ Only 16% get work for 21-30 days Rapar-
⇒ A little more than half (54.5%) get work for 11-20 days, out of which 24% are female and 20.5% are males.
Employment Scenario in terms of number of days
• A majority of 56.4% get work for only 11-20 days in a month • More males (55.6%) get work in number of days, in comparison to females (44.3%). • In Rapar (63.2%) more women tend to get work than in Bhachau (36.8%) • 7.5% are totally unemployed, including both the districts. • There is a fall in the number of days of employment in monsoon, as many activities like charcoal making, salt making, masonry works do not take place in this season.
Besides, even the small land owners prefer to plough their own fields during the
season, instead of going out in search of work. There is also a tendency of growing
grain for household use, in this season. The food stock lasts till winter, and after that
the small farmers have to go in search of casual labour work. This tendency becomes
obvious with an increase in number of days of employment in winter.

Income Details
Income- Of all, only 0.2% reported having no income at all.
Annual Income- 1.7% earns (< 1000 Rs.) annually , 6.3% earn between 1001 to 3000 per
annum, the percentage of having an income between 3001-5000 is 13.3%; 35.4% have annual
income between 5001-10,000, while 16.8% earn between 10,001-15000 and 24.5% earn more
than 15001 per annum.
The graph below helps to understand the same.
Graph 2: Annual Income-range Indicator
0%2% 6%
13%
35%17%
25%
2%
None
=< 1000
1001 - 3000
3001 - 5000
5001 - 10000
10001 - 15000
> 15001
NR
Income in summer- 0.7% has no income at all in summer.
⇒ 48.4% have income in the range of (1001-3000 Rs.), 18.5% have (3001-5000 Rs), 15.1% have (5001-10,000), 10% have (< 1000 Rs.), 3.1 %( 10,001-15000) and only 2.2% have (> 15,000
Rs.) income in summer.
Income in monsoon- 3.3 % have no income at all.
⇒ 45.9% have an income of (1001-3000 Rs.), 15.3% have (5001-10,000 Rs.), 13.9% have (< 1000 Rs.), 13.6% have (3001-5000 Rs.), 3.2% have (10,001-15000 Rs.), and 2.9% have (>
15,000 Rs.)
Income in winter- 0.7% have no income at all.
⇒ 43.2% have an income of (1001-3000 Rs.), 21.3% have (3001-5000 Rs.), 18.6% have (5001-10000 Rs.), 6.4% have (<1000 Rs.), 4.3% have (10,000-15,000 Rs.), and 3.6% have (> 15,000
Rs.).

Taluka wise Income Scenario
Bhachau-
⇒ 43.2% have an income of (Rs. 5001-10,000), 23.2% have an income of (>15,000), 14.8% have an income of (Rs. 10,001-15,000), 11.8% have an income of (3001-5000) and 2.6% have
an income less than 1000 rupees.
⇒ However, income range of 2.4% is not known.
Rapar- 0.4% have no income at all.
⇒ 27.3% have an income of (5001-10,000), 25.9% have an income of (>15000 Rs.), 18.9% have an income of (10,001-15000 Rs.), 14.8 % have an income of (3001-5000), while 10.7% have
an income of (1001-3000) and 0.8% have an income of (<1000 Rs.).
Income Scenario
• A maximum percentage (35.4%) earns an income of (Rs. 5001-1000) per Annum.
• In Summer and winter both, the percentage of not having any income remains the same as 0.7%, but it increases in monsoon up to 3.3%
• However, 0.2% has no income at all, as far as Annual income is concerned.
Employment through Migration
Almost 17 % of all respondents migrate to other villages/cities in search of job. Despite the fact
that there are less employment opportunities in their village and the income earned is also
reported to be very low, a very few people migrate to other places in search of work. The
mobility share also seems to be very insignificant for migrating out side the district.
Place of Migration- In last seven months, out of all migrants, 41.8% migrate within their own
district (Kachchh), whereas 32.1% migrate out side the district (Kachchh) but within the State,
while 3.6% migrate to other states. However, the migration details of 22.4 % respondents are not
known.
Extent of Migration-
The following table shows extent of migration in last seven months in each taluka.

Table 3: Extent of Migration in last seven months-talukawise
Period of migration outside the village for employment in last seven months (in days)
Bhachau Rapar
Total Number of Days
No of resp.
R% C% No of resp.
R% C% No of resp.
C%
1 - 15 Days 4 57.1 4.9 3 42.9 3.6 7 4.2 16 - 30 Days 4 36.4 4.9 7 63.6 8.3 11 6.7 31 - 60 Days 8 57.1 9.9 6 42.9 7.1 14 8.5 61 - 90 Days 3 37.5 3.7 5 62.5 6.0 8 4.8 > 91 32 41.0 39.5 46 59.0 54.8 78 47.3 Not known 30 63.8 37.0 17 36.2 20.2 47 28.5
Total 81 49.1 100.0 84 50.9 100.0 165 100.0
Nearly half the respondents, 78 (47.3%) migrated for (> 91 days) in last seven months. There are
8.5%, who migrated for (31-60 days), 6.7% migrated for (16-30 days), 4.8% have migrated for
(61-90 days) and 4.2 % have migrated for (1-15 days).
⇒ In Bhachau, a maximum number (39.5%) migrated for more than 91 days, whereas the percentage for migration for the same period is more in Rapar (54.8%).
⇒ The numbers of migrants are almost same in both the talukas Bhachau (49.1%) and Rapar (50.9%).
⇒ However, in Rapar, out of all migrant labours, the maximum number (54.8%) migrate for (>91 days).
Information about Employer/Contractor (Mukadam)
Availability of the Contractor/ Mukadam- Of all migrant labours, 57.6% reported availability of a
Mukadam in their respective village, whereas 42.4% denied the availability of one. Of total 75.8%
reported availability of (1 to 5) Mukadam, 6.3% reported (6-10), 4.2% reported for (11-15) and
11.6. % reported (16-20) and 2.1% reported availability of more than 21 Mukadam in their village.
Caste of the Employer- The castes, of a Contractor/ Mukadam varies widely. However, the
highest presence in all is of Dalit (Meghwal, Vania, Maharaj) (41.1%) and Koli has second
highest presence with 33%. Muslims are reported to be 10.5%. Except for Rajput (2.1%), Patel
(1.1%), Darbar (2.6%), Lohana (0.1%) and Barot (0.1%), remaining is reported to be within
Marginalized communities.

Employment through Migration
• The labours who migrate out side their own district are more in Rapar (83) than Bhachau (17).
• 40.3% of all Migrant labours, believed that liaisoning directly with the employer helped them to get work
• 24.1% suggested creating work opportunities in the village under NAREGA for masonry workers and through khet talavadi, while 8.5% suggested creating jobs with
the help of NGOs.
• In Rapar the availability of Mukadams is restricted between (1-5), in comparison to Bhachau where the number of Mukadams in a village exceeds up to 21.
• The number of labourers hired from a village by all the Mukadams available, is restricted to maximum 40, in Rapar, in comparison to Bhachau where it exceeds more
than 81. This might be indicating that less availability of Mukadams, provide less
employment opportunities in the villages of Rapar.
Awareness about NREGA and Job Card
A high number of respondents (65.7%) are aware about NREGA, however only 10.4% have
their job card made, and only 6.8% got job under NREGA in last seven months.
Suggestions about creating job opportunities
In an attempt to analyze the trend and to help in analyzing new possibilities of employment, a
question was formed for the respondents asking for suggestions regarding this. Although, 45.3%
respondents failed to give any suggestion, but 24.1% suggested creating more jobs for Masonry
workers under NREGA, 8.5% advised to create jobs within the village with the help of
Government and NGOs, 6.8% suggested to encourage setting-up cottage industries related to
live-farming and wooden work in the area to create more jobs for the locals. Whereas, 4.3%
recommended extending NREGA program, 2.5% suggested extending jobs in Panchayati Raj
Institutions, 1.6% advised to provide loans to encourage self-employment through small
ventures. While, 2.1% demanded basic amenities and facilities for better job opportunities, 0.1%
demanded restricting jobs only for the resident of the village.
Nearly 2% advised setting up training colleges for teaching skills related to cottage
industries and farming. The other recommendations received are to provide land for farming
(0.7%), provide better facilities for cotton farming (0.5%), circulating job information through
relatives (0.2%), and for increasing minimum labour wage (0.1%).

CHAPTER 3: THE DATA ANALYSIS The Chapter attempts to analyze the primary data collected through the survey held at two
talukas; Bhachau and Rapar of Kachchh district. To analyze the employment pattern in the
region, a multidimensional analysis of the issue becomes essential as there are various factors
which affect the employment scenario. Among them the prime factors are educational status and
asset holding; especially land and cattle, which further generate employment opportunities. A
detailed analysis of the type of assets and its contribution in income generation helps to
investigate the issue in depth. Similarly, an evaluation of the income generation activities
performed in the study area, on various parameters like nature (type and skilled/unskilled),
tenure (full time-part time), frequency (single/multiple) and productivity (income range) has also
been done.
Education and Employment Scenario
It is observed that the educational status of a person affects its employment status as well. The
opportunities of getting work are enhanced with the qualification, obtained through formal and
in-formal/skill base education both.
Formal Education-The study revealed that the literacy rate in the area is very low in the case of
marginalized communities and as large as 48.6 percent of the respondents are found to be non-
literate. Even among the literates, the largest share 37.1% has received education only up to
Primary level.
The following table indicates a comparative analysis of the education level of the marginalized
community in both the sexes.
Table 4: Level of education in Marginalized Communities –An Overview
Talukas Bhachau (n=500) Rapar (n=487)
Female (n=198) Male (n=302) Female (n=240) Male (n=247)
Total (n=987)
Cast
e Education
No of
resp
R% C% No of
resp
R% C% No of
resp
R% C% No of
resp
R% C% No of
resp
C%
Non-Illiterate 57 31.3 53.8 28 15.4 23.1 65 35.7 65.7 32 17.6 34.4 182 43.4 Primary Education [std. 1-7]
46 30.3 43.4 44 28.9 36.4 30 19.7 30.3 32 21.1 34.4 152 36.3
Secondary Education [std. 8-10]
1 1.5 0.9 43 66.2 35.5 3 4.6 3.0 18 27.7 19.4 65 15.5
Higher Secondary Education [std. 11-12]
1 8.3 0.9 4 33.3 3.3 1 8.3 1.0 6 50.0 6.5 12 2.9
Graduate [BA/B. com/B.Sc]
1 33.3 0.9 1 33.3 0.8 0 - - 1 33.3 1.1 3 0.7
Dalit
PG [MA/M. com/M.Sc]
0 - - 1 100.0 0.8 0 - - 0 - - 1 0.2

B.ed. with B.A. / B.com. / B.Sc
0 - - 0 - - 0 - - 1 100.0 1.1 1 0.2
P.T.C. 0 - - 0 - - 0 - - 2 100.0 2.2 2 0.5 Computer course
0 - - 0 - - 0 - - 1 100.0 1.1 1 0.2
Total 106 25.3 100.0 121 28.9 100.0 99 23.6 100.0 93 22.2 100.0 419 100.0 Illiterate 46 20.2 70.8 45 19.7 39.1 89 39.0 74.2 48 21.1 38.4 228 53.6
Primary Education [std. 1-7]
18 11.5 27.7 54 34.6 47.0 28 17.9 23.3 56 35.9 44.8 156 36.7
Secondary Education [std. 8-10]
1 2.9 1.5 15 44.1 13.0 2 5.9 1.7 16 47.1 12.8 34 8.0
Higher Secondary Education [std. 11-12]
0 - - 0 - - 1 33.3 0.8 2 66.7 1.6 3 0.7
Graduate [BA/B. com/B.Sc]
0 - - 0 - - 0 - - 2 100.0 1.6 2 0.5
B.ed. with B.A. / B.com. / B.Sc
0 - - 1 50.0 0.9 0 - - 1 50.0 0.8 2 0.5
Koli
Total 65 15.3 100.0 115 27.1 100.0 120 28.2 100.0 125 29.4 100.0 425 100.0
Non-literate 17 30.9 73.9 20 36.4 33.3 12 21.8 75.0 6 10.9 26.1 55 45.1 Primary Education [std. 1-7]
6 11.3 26.1 31 58.5 51.7 3 5.7 18.8 13 24.5 56.5 53 43.4
Secondary Education [std. 8-10]
0 - - 7 70.0 11.7 1 10.0 6.3 2 20.0 8.7 10 8.2
Higher Secondary Education [std. 11-12]
0 - - 2 100.0 3.3 0 - - 0 - - 2 1.6
Graduate [BA/B. com/B.Sc]
0 - - 0 - - 0 - - 2 100.0 8.7 2 1.6
Musl
im
Total 23 18.9 100.0 60 49.2 100.0 16 13.1 100.0 23 18.9 100.0 122 100.0 Non-literate 2 40.0 100.0 2 40.0 40.0 0 - 1 20.0 100.0 5 62.5
Primary Education [std. 1-7]
0 - - 2 100.0 40.0 0 - 0 - - 2 25.0
Higher Secondary Education [std. 11-12]
0 - - 1 100.0 20.0 0 - 0 - - 1 12.5
Bheel
Total 2 25.0 100.0 5 62.5 100.0 0 - 1 12.5 100.0 8 100.0 Non-literate 1 11.1 100.0 1 11.1 100.0 5 55.6 100.0 2 22.2 40.0 9 75.0 Primary Education [std. 1-7]
0 - - 0 - - 0 - - 3 100.0 60.0 3 25.0
Devi
puja
k
Total 1 8.3 100.0 1 8.3 100.0 5 41.7 100.0 5 41.7 100.0 12 100 Non-literate 1 100.0 100.0 0 - - 0 - 0 - 1 100.0
Pard
hi
Total 1 100.0 100.0 0 - - 0 - 0 - 1 100.0

The table illustrates that, Educational status among Dalit
⇒ Among Dalit 43.4% are non-literates, 36.3% have received primary education,15.5% are secondary educated, 2.9% have obtained education till higher secondary, 0.7% have done
graduation, 0.2% have done post graduation, 0.2% have done B.Ed., 0.5 % have done PTC
and 0.2% have done computer course.
⇒ Among all non-literate Dalit 67% are females, whereas among Primary educated Dalit male-female ratio is comparable at 50% each.
⇒ The number of non-literate females (65.7%) is higher than males (34.4%) in Rapar. In Bhachau too, more females (53.8%) are non-literate than males (23.1%).
⇒ 83.3% of all Secondary educated Dalit is male. ⇒ Only 33.3% females have received education up to graduation and no female has received education higher than graduation.
Educational status among Koli
⇒ Among Koli 53.6% are non-literates, 36.7% are have received primary education, 8% are secondary educated, 0.7% have obtained education till higher secondary, 0.5% have done
graduation, and 0.5% have done B.Ed.. This means that the maximum number of educated
Koli community has received education only up to primary level.
⇒ Among all non-literates 59.2% are females, and the situation is even worse regarding primary education as only 29% females come under the category in comparison to males (71%).
⇒ Only 33.3% females have studied up to higher secondary that too is concentrated in Rapar only.
Educational status among Muslims
⇒ A maximum number of 45.1% are non-literate, while 43.4% have received education up to primary level. Only, 8.2% have received secondary education, 1.6% have received higher
secondary education and 1.6% have graduated.
⇒ The presence of non-literates Muslims is more in Bhachau (67.3%) than Rapar (32.7%) ⇒ The male (47.3%) –female (52.7%) scenario is varies marginally with regard to non-literacy. ⇒ 83% of the primary educated Muslims are male and the maximum number is in Bhachau. ⇒ Only 3.2% have received education more than higher secondary.
Educational status among Bheel
⇒ 62.5% are non-literate, 25% have received primary education, and 12.5% have received secondary education.
⇒ 60% of non-literate Bheel respondents are male and 40% are female. ⇒ There are more non-literates in Bhachau (80%) than Rapar (20%). ⇒ There are no females who have received primary or secondary education. Educational status among Devipujak
⇒ As huge as 75% are non-literate and only 25% have received primary education.

Educational status among Pardhi - All the Pardhi respondents are non-literate.
The overview clearly indicates that with less literacy, the chances of getting employment in
organized sector remain less for the marginalized community.
Asset holding and Employment Scenario
The asset holding of the respondents is divided into five major categories;
• Land- Cultivable and Non-cultivable • Cattle • House • House Plot • Vehicle
The first two categories are also considered to be income generating, whereas the other three
categories indicate the financial status of the respondents.
Land Owning: This category has been further divided into two more categories; Non-cultivable
and Cultivable land. While, the first category is totally nonproductive, the second can be utilized
for cultivation purposes.
Non-Cultivable land- In all, 98.8% own non-cultivable land. But, as non-cultivable land does not
contribute in providing employment or generating income, therefore this category do not create
any impact on employment generation analysis.
Cultivable land- Of all respondents, 48.9% own cultivable land, out of which 46.9% use the land
for self cultivation and rest 2% give it for share cropping.
However, 51.1% do not own cultivable land; therefore have no income through it.
All the land owners have been divided into three categories, on the basis of stretch of land
holding:-
1. Small size(1-8 acre) land owners – 72.5% are small size land owners
2. Medium size (9-16 acre) land owners-15.7 are under this category
3. Large size (> 17) land owners- 5% are large size land owners.
To have an idea of the income generated through cultivation, the study analyzed various details
in this connection, like; type of cultivation, types of land, irrigation facility; number of crops and
types of crops. The details of total production , break up of total production and the production
kept for house hold use and kept for selling in market has also been collected.

� Type of Cultivation- Primarily two types of cultivation practices are popular in the region.
Self Cultivation- 95.9% of all the cultivators practice self-cultivation
Share Cropping (Bhage- ape-Cheh) - only 4.1% cultivate through share cropping
� Types of Land- There are three different types of lands identified in the region.
Kanpwali (Retal) - 56.3% of the cultivable land owners have this type of land.
Pathral (Goradu) - the percentage of having land of this type is 15.9%.
Matiwali (Kali)-the percentage of having land of this type is 27.7%.
� Irrigation Facility- 86.3% does not have irrigation facility in comparison to 13.7% who has
irrigation facility.
� Details of Crops- 73.5% have only one crop in a year, 9.1% have two crops in a year,
whereas 8.5% have four crops in a year and 5% have three crops in a year.
Primarily there are five types of crops; Grains, Cash Crops, Pulses, Vegetables, and Others
which are produced in the area. It is observed in the study that generally, multiple crops are
cultivated by the farmers to ensure that every kind of crop is produced at least in such a quantity
which is sufficient for their own household use. With this kind of planning, all the above said
crops are cultivated all together in different combinations. However, only a large land holder or a
medium size land owner can afford to do so, and in case of small size land owners; a single crop
is also produced.
⇒ It is found that the combination of Grains and Pulses is cultivated at the maximum number with 32.1%, at 15.7% a combination of Grains, Pulses, and cash crops are cultivated, 4.6%
grow a combination of grain and cash crops, 2.3% cultivate cash crop and pulses, 1.2%
cultivates grain, pulses and vegetables, 1% cultivate grain, pulse and others, 1% cash crop,
grains and vegetables, 0.6% cultivate grain and vegetables, 0.2% cash crops and vegetables
and 0.2% cultivate pulses and vegetables.
⇒ Whereas, with a single crop, 15.7% cultivate grain, 14.9% cultivate pulses, 5.8% cultivate cash crop.
� Annual production- (quantified in Man, One man equals to 40 Kg.)
Grains – In this category, grains like wheat, maze and corn etc are included.
⇒ A maximum number of cultivators (56.5%) produce 1-10 man grain on annual basis, 7.5% produce 11-20 man, 2.9% produce 21-50 man, while only 0.8% produces more
than 51 man.
⇒ However, 28% do not produce grains at all. ⇒ The status of 4.3% is not known.

Cash Crops – In this category crops like cotton, groundnut, etc are included.
⇒ 69.2% do not cultivate cash crops. ⇒ A maximum number of cultivators (20.1%) produce 1-10 man cash crops on annual
basis, 2.5% produce 11-20 man, and the same percentage produces 21-50 man on annual
basis. While, 0.6% produce more than 51 man annually.
⇒ The status of 5.2% is not known.
Pulses-
⇒ A maximum number of 52.4% produce 1-10 man annually, 6% produce 11-20 man, and 1.7% produce 21-50 man, and 0.6% produces more than 51 man.
⇒ 32.3% do not produce pulses at all. ⇒ The status of 7% is not known.
Vegetables-
⇒ As high as 96.5% do not produce vegetables. ⇒ 0.2% produces 1-10 man and the same percentage produces 21-50 man annually. ⇒ The status of 3.1% is not known.
Others-
⇒ As high as 97.5% do not produce other crops. ⇒ Only a small percentage (1.2%) produces other crops that too, 1-10 man annually.
Income from Different Crops
Grains: -16.6% have an income of (Rs. 1-5000), 7.9% have an income of (Rs. 5001-10,000), 7.5%
have income of (10,001-20,000), 6.8% have an income of (20,001-40,000) and 2.3% have an
income of (Rs. 40,001-80,000) and only 1.2% have (> 80,000 Rupees) income from selling
grains.
As 28.8% do not cultivate grains, therefore they do not have any income through it. However,
the response of 29% is not known.
Cash Crops: - 8.1% have an income of (Rs.10, 001-20,000), 7.2% have an income of (Rs.1-5000),
4.6% have an income of (Rs.5001-10,000), 2.9% have an income of (Rs. 20,001-40,000), 2.7%
have an income (> 80,001 Rupees) and 2.3% have an income of (Rs. 40,001-80,000).
However, 71.6% do not cultivate cash crops therefore has no income from it.
Pulses: - 21.1% have an income of (Rs.1-5000) only, 11.6% have (Rs. 5001-10000), 13% have
(10,001-20000 Rs.), only 7% have (Rs. 20,001-40,000), and 2.1% have an income of (Rs. 40,001-
80000) from selling pulses. However, the response of 45.1 is not known.
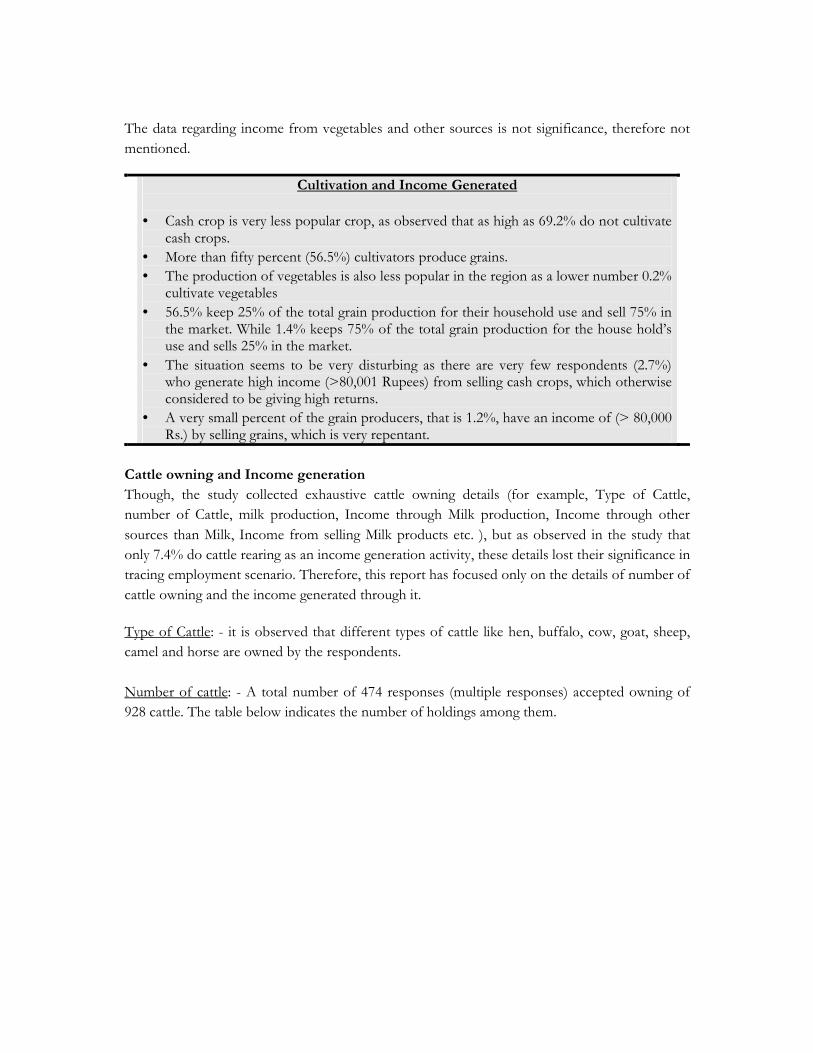
The data regarding income from vegetables and other sources is not significance, therefore not
mentioned.
Cultivation and Income Generated
• Cash crop is very less popular crop, as observed that as high as 69.2% do not cultivate cash crops.
• More than fifty percent (56.5%) cultivators produce grains. • The production of vegetables is also less popular in the region as a lower number 0.2% cultivate vegetables
• 56.5% keep 25% of the total grain production for their household use and sell 75% in the market. While 1.4% keeps 75% of the total grain production for the house hold’s use and sells 25% in the market.
• The situation seems to be very disturbing as there are very few respondents (2.7%) who generate high income (>80,001 Rupees) from selling cash crops, which otherwise considered to be giving high returns.
• A very small percent of the grain producers, that is 1.2%, have an income of (> 80,000 Rs.) by selling grains, which is very repentant.
Cattle owning and Income generation
Though, the study collected exhaustive cattle owning details (for example, Type of Cattle,
number of Cattle, milk production, Income through Milk production, Income through other
sources than Milk, Income from selling Milk products etc. ), but as observed in the study that
only 7.4% do cattle rearing as an income generation activity, these details lost their significance in
tracing employment scenario. Therefore, this report has focused only on the details of number of
cattle owning and the income generated through it.
Type of Cattle: - it is observed that different types of cattle like hen, buffalo, cow, goat, sheep,
camel and horse are owned by the respondents.
Number of cattle: - A total number of 474 responses (multiple responses) accepted owning of
928 cattle. The table below indicates the number of holdings among them.

Graph 3: Cattle details
Number of cattle
45.1
29.3
15.8
5.5 3.0 1.3One
Two
Three
Four
Five
> Five
Table 5: Numbers of cattle owning
Number of cattle Number of respondents % One 214 45.1 Two 139 29.3 Three 75 15.8 Four 26 5.5 Five 14 3.0 > Five 6 1.3 Total 474 100
⇒ The table indicates that a maximum number of 45.1% respondents own one cattle, whereas 29.3% own two cattle, 15.8% own three cattle, 5.5% own four cattle and only 3% own five
cattle.
⇒ Only 1.3% own more than 5 cattle.
Income Generation through Cattle: - It is observed that many respondents own more than one
cattle, therefore this information has been derived considering number of cases.
Table 6: Income Generation through cattle
Total monthly income form the cattle Number of cases Rs. 100 - 500 69 Rs. 501 - 1000 55 Rs. 1001 - 1500 36 Rs. 1500 - 2000 12 Rs. > 2001 21
Not Applicable 596 Not known 17
Total 806
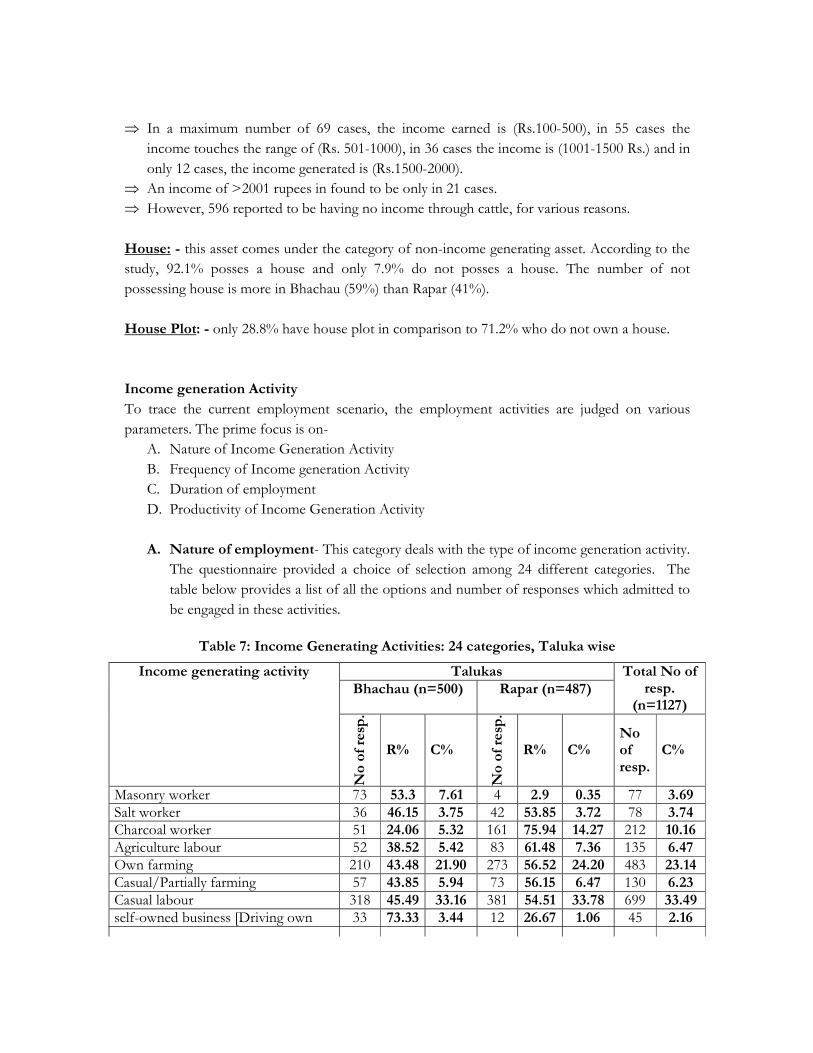
⇒ In a maximum number of 69 cases, the income earned is (Rs.100-500), in 55 cases the income touches the range of (Rs. 501-1000), in 36 cases the income is (1001-1500 Rs.) and in
only 12 cases, the income generated is (Rs.1500-2000).
⇒ An income of >2001 rupees in found to be only in 21 cases. ⇒ However, 596 reported to be having no income through cattle, for various reasons.
House: - this asset comes under the category of non-income generating asset. According to the
study, 92.1% posses a house and only 7.9% do not posses a house. The number of not
possessing house is more in Bhachau (59%) than Rapar (41%).
House Plot: - only 28.8% have house plot in comparison to 71.2% who do not own a house.
Income generation Activity
To trace the current employment scenario, the employment activities are judged on various
parameters. The prime focus is on-
A. Nature of Income Generation Activity B. Frequency of Income generation Activity C. Duration of employment D. Productivity of Income Generation Activity
A. Nature of employment- This category deals with the type of income generation activity.
The questionnaire provided a choice of selection among 24 different categories. The
table below provides a list of all the options and number of responses which admitted to
be engaged in these activities.
Table 7: Income Generating Activities: 24 categories, Taluka wise
Talukas Bhachau (n=500) Rapar (n=487)
Total No of resp.
(n=1127)
Income generating activity
No o
f re
sp.
R% C%
No o
f re
sp.
R% C% No of resp.
C%
Masonry worker 73 53.3 7.61 4 2.9 0.35 77 3.69 Salt worker 36 46.15 3.75 42 53.85 3.72 78 3.74 Charcoal worker 51 24.06 5.32 161 75.94 14.27 212 10.16 Agriculture labour 52 38.52 5.42 83 61.48 7.36 135 6.47 Own farming 210 43.48 21.90 273 56.52 24.20 483 23.14 Casual/Partially farming 57 43.85 5.94 73 56.15 6.47 130 6.23 Casual labour 318 45.49 33.16 381 54.51 33.78 699 33.49 self-owned business [Driving own 33 73.33 3.44 12 26.67 1.06 45 2.16

vehicle, small-large shop owners, running Dhaba (Restaurant) Government job 11 45.83 1.15 13 54.17 1.15 24 1.15 Private job [Driver, Helper] 18 43.90 1.88 23 56.10 2.04 41 1.96 Cattle rearing 68 88.31 7.09 9 11.69 0.80 77 3.69 Carpenter [Suthari kam] 1 11.11 0.10 8 88.89 0.71 9 0.43 Plumber 1 100 0.10 0 - 1 0.05 Painter 1 16.67 0.10 5 83.33 0.44 6 0.29 Cobbler 4 66.67 0.42 2 33.33 0.18 6 0.29 Electrician 0 - 3 100 0.27 3 0.14 Weaver - 2 100 0.18 2 0.10 Embroidery work 7 31.82 0.73 15 68.18 1.33 22 1.05 Pottery (Kumbhari work) 3 75 0.31 1 25 0.09 4 0.19 Handy crafts (Sawarni,Idhoni & Sundhala)
9 42.86 0.94 12 57.14 1.06 21 1.01
Hairdressar (Nai) 3 100 0.31 0 - 3 0.14 Yajmanvruti 2 50 0.21 2 50 0.18 4 0.19 Dhol vagadava 0 - 1 100 0.09 1 0.05 Selling skin & bones of dead animal 1 25 0.10 3 75 0.27 4 0.19 Total 959 100.00 1128 100.00 2087 100
For the purpose of evaluation in broader context, all the categories have been rearranged in ten
broad categories.
1. Farming – in this category both self farming and contractual farming have been included. 2. Agricultural labour 3. Cattle rearing 4. Government job 5. Private job- for example Driver, helper etc. 6. Self owned business-In this category driving own vehicle for commercial purposes (rickshaw etc.), running small restaurants (dhaba) or shops etc. and Hairdresser have
been included.
7. Skilled labour- Electrician, Plumber, Carpenter, Masonry worker, Salt making, Charcoal worker and Painter are kept under this category.
8. Artisan- This category includes, Embroidery work, Pottery, Handicrafts, Weaver, Cobbler
9. Casual Labour 10. Others- activities like, yajmanvruti, Dhol Vagadva, Selling bones and skin of dead animals, have been included in this category.
As many respondents are engaged in various multiple income generation activities, out of total
987 respondents, 2087 responses were received under a choice of 24 income generation
categories. After clubbing all the activities into ten categories, it was found that there were many
respondents who were pursuing more than one skill oriented job. Therefore, after putting all the
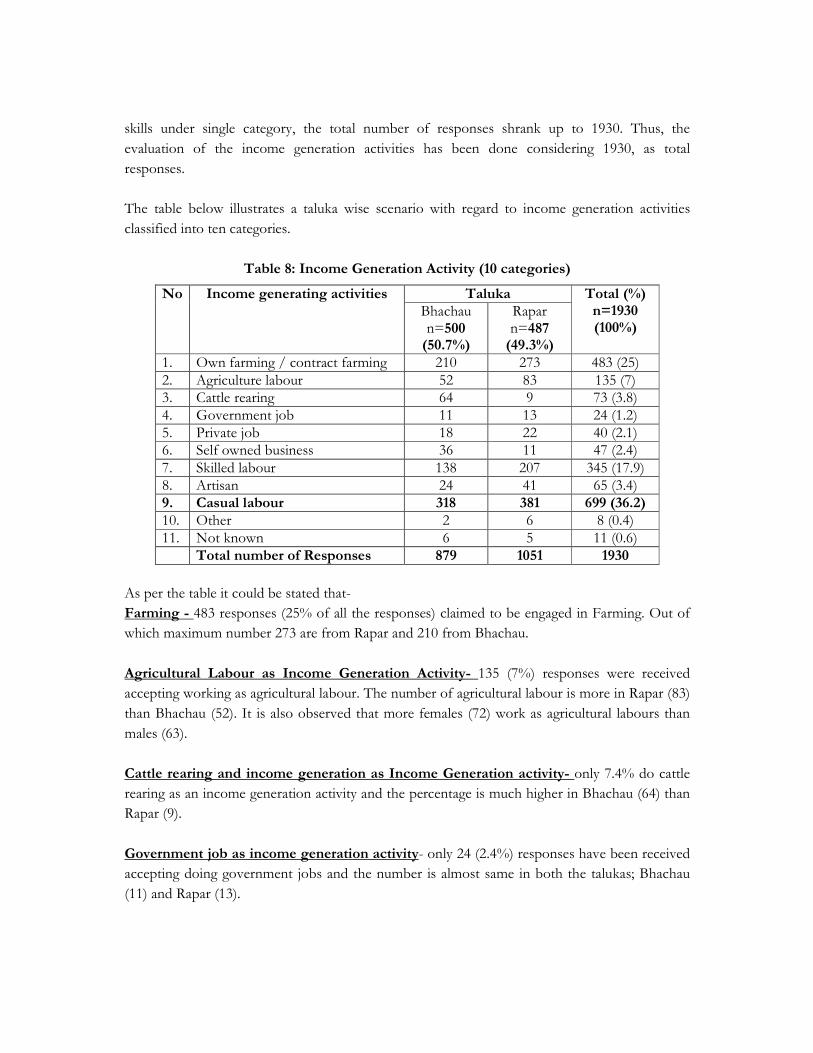
skills under single category, the total number of responses shrank up to 1930. Thus, the
evaluation of the income generation activities has been done considering 1930, as total
responses.
The table below illustrates a taluka wise scenario with regard to income generation activities
classified into ten categories.
Table 8: Income Generation Activity (10 categories)
Taluka No Income generating activities Bhachau n=500 (50.7%)
Rapar n=487 (49.3%)
Total (%) n=1930 (100%)
1. Own farming / contract farming 210 273 483 (25) 2. Agriculture labour 52 83 135 (7) 3. Cattle rearing 64 9 73 (3.8) 4. Government job 11 13 24 (1.2) 5. Private job 18 22 40 (2.1) 6. Self owned business 36 11 47 (2.4) 7. Skilled labour 138 207 345 (17.9) 8. Artisan 24 41 65 (3.4) 9. Casual labour 318 381 699 (36.2) 10. Other 2 6 8 (0.4) 11. Not known 6 5 11 (0.6) Total number of Responses 879 1051 1930
As per the table it could be stated that-
Farming - 483 responses (25% of all the responses) claimed to be engaged in Farming. Out of
which maximum number 273 are from Rapar and 210 from Bhachau.
Agricultural Labour as Income Generation Activity- 135 (7%) responses were received
accepting working as agricultural labour. The number of agricultural labour is more in Rapar (83)
than Bhachau (52). It is also observed that more females (72) work as agricultural labours than
males (63).
Cattle rearing and income generation as Income Generation activity- only 7.4% do cattle
rearing as an income generation activity and the percentage is much higher in Bhachau (64) than
Rapar (9).
Government job as income generation activity- only 24 (2.4%) responses have been received
accepting doing government jobs and the number is almost same in both the talukas; Bhachau
(11) and Rapar (13).

Private Job as Income Generation activity- a number of 40 (2.1%) responses admitted having
a private job. The situation is almost the same in both the taluka; Bhachau (18) and Rapar (22).
Self owned business as Income generation activity- only 47 (2.4%) people run self owned
business, and the number is much higher in Bhachau with (36) in comparison to Rapar (11).
Income generation through skilled Labour- 345 (17.9%) generate income by working as
skilled labours. The number is higher in Rapar (207) than Bhachau (138).
Income generation as Artisan – only 65(3.5%) responses received, claiming working as an
Artisan for income generation.
Casual labour as Income generation activity- A maximum number has been observed
working as Casual labour, as out of total 1930 responses, 699 responses were in favour of this
category. The number is higher in Rapar (381) than Bhachau (318).
Income through other Activities:- only 8 (0.4%) are engaged in other income generating
activities. The number is more in Rapar (6) than Bhachau (2).
Apart from a talukawise analysis of the employment trend, the study also examined the trend
among both the sexes. The table below presents an overview of male-female scenario with
regard to Income generating activities.
Table 9: Income generation activities- Male-Female Scenario
Taluka Bhachau Rapar
Total (%) No Income generating activities
Female (n=198) 45.2%
Male (n=302) 55%
Female (n=240) 54.8%
Male (n=247) 45%
Female (n=438) 44.4%
Male (n=549) 55.6%
Total (n=987)
1. Own farming / Partially farming 93 117 141 132
234 (48.5)
249 (51.5) 483
2. Agriculture labour 28 24 44 39
72 (54.5)
63(45.5) 135
3. Cattle rearing 25 39 05 04 30 (41) 43 (59) 73
4. Government job 03 08 11 02
14 (58.3)
10(41.7) 24
5. Private job 06 12 06 16 12 (30) 28 (70) 40 6. Self owned business
09 24 03 08 12 (27.2)
32(72.7) 44
7. Skilled labour 63 75 90 117
153 (44.3)
192(55.7) 345
8. Artisan 14 13 23 18
37 (54.4)
31 (45.6) 68
9. Casual labour 136 182 196 185
332 (47.5)
367 (52.5)
699
10. Other 01 01 02 04
03 (37.5)
05 (62.5) 08
11. Not known 02 04 03 02
05 (45.5)
06(54.5) 11
Total 380 499 524 527 904 1026 1930
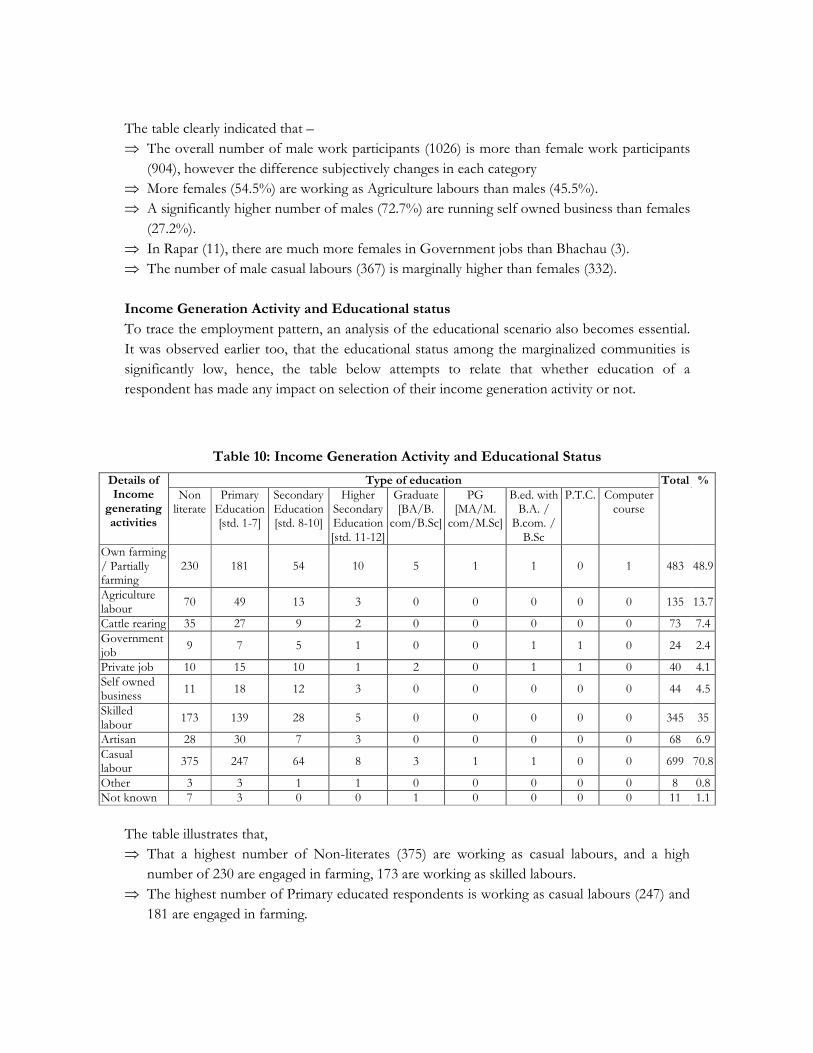
The table clearly indicated that –
⇒ The overall number of male work participants (1026) is more than female work participants (904), however the difference subjectively changes in each category
⇒ More females (54.5%) are working as Agriculture labours than males (45.5%). ⇒ A significantly higher number of males (72.7%) are running self owned business than females (27.2%).
⇒ In Rapar (11), there are much more females in Government jobs than Bhachau (3). ⇒ The number of male casual labours (367) is marginally higher than females (332).
Income Generation Activity and Educational status
To trace the employment pattern, an analysis of the educational scenario also becomes essential.
It was observed earlier too, that the educational status among the marginalized communities is
significantly low, hence, the table below attempts to relate that whether education of a
respondent has made any impact on selection of their income generation activity or not.
Table 10: Income Generation Activity and Educational Status
Type of education Details of Income
generating activities
Non literate
Primary Education [std. 1-7]
Secondary Education [std. 8-10]
Higher Secondary Education [std. 11-12]
Graduate [BA/B. com/B.Sc]
PG [MA/M. com/M.Sc]
B.ed. with B.A. / B.com. / B.Sc
P.T.C. Computer course
Total %
Own farming / Partially farming
230 181 54 10 5 1 1 0 1 483 48.9
Agriculture labour
70 49 13 3 0 0 0 0 0 135 13.7
Cattle rearing 35 27 9 2 0 0 0 0 0 73 7.4 Government job
9 7 5 1 0 0 1 1 0 24 2.4
Private job 10 15 10 1 2 0 1 1 0 40 4.1 Self owned business
11 18 12 3 0 0 0 0 0 44 4.5
Skilled labour
173 139 28 5 0 0 0 0 0 345 35
Artisan 28 30 7 3 0 0 0 0 0 68 6.9 Casual labour
375 247 64 8 3 1 1 0 0 699 70.8
Other 3 3 1 1 0 0 0 0 0 8 0.8 Not known 7 3 0 0 1 0 0 0 0 11 1.1
The table illustrates that,
⇒ That a highest number of Non-literates (375) are working as casual labours, and a high number of 230 are engaged in farming, 173 are working as skilled labours.
⇒ The highest number of Primary educated respondents is working as casual labours (247) and 181 are engaged in farming.

⇒ The highest number of Secondary educated respondents is also observed among casual labours (64), which is highly traumatic.
⇒ The number of higher secondary educated casual labours is also very high (8) in comparison to a maximum number of 10, who are engaged in farming.
⇒ With regard to self-owned business, the educational scenario is quite satisfactory, as out of total 44, 3 are Higher Secondary educated, 12 are Secondary educated and 18 are Primary
educated. However, 11 are non-literates too.
⇒ Few respondents, who have acquired education up to graduation or above, have been successful to obtain government job total (5) or private job (3), however (5) are still working
as casual labours despite doing graduation (3), Post graduation (1) and being educated up to
B.Ed.(1).
Income Generating Activities: At Glance
• A maximum number of respondents (699) are working as casual labours, which is 36.2% of all the responses received.
• The second most popular income generation activity is farming, with 483 responses, which is 25% of all the responses.
• The maximum numbers of the respondents are found to be Non-literate males in Rapar working as Casual labours.
• The situation is better in Rapar, as far as getting government job and private job is concerned. In Rapar (22) responses for Private Job and (13) responses received for
government jobs, in comparison to Bhachau; Private Job (18) and government job
(11).
• The frequency of income generating activities is higher in more cases in Rapar (72.7%), than Bhachau (48.8%).
• A variety of skill based Income generating activities are pursued in the area; like Salt
making, Charcoal making, embroidery and others, but the number of skilled labour is
still less (345) than unskilled/casual labour (699).
• More people do farming as an income generating activity in Rapar (273) than
Bhachau (210), at the same time the number of casual labourers is also high in Rapar
(381) than Bhachau (318).
• The number of Artisan is significantly low (65) with only 3.4% of total 1930 responses.
• Despite being educated to primary level (247), Secondary level (64), Higher Secondary (8), Graduation level (3), Post Graduation level (1), B.Ed. (1) and
computer course (1) are working as casual labours.
• The respondents under Casual labour category seem to be the most disadvantaged group.

B. Frequency of Income generation Activity: on the basis of Frequency or number of activities, all the income generation activities taken under the study could be divided in to two categories- Single/ multiple and Full time/ part time.
This could be understood with the help of the table below:
Table 11: Number of income generation activities talukawise
Talukas Bhachau Rapar
Total Number of income generation activities
No of resp
R% C% No of resp
R% C% No of resp
C%
One 256 65.8 51.2 133 34.2 27.3 389 39.4 Two 146 44.5 29.2 182 55.5 37.4 328 33.2 Three 62 31.8 12.4 133 68.2 27.3 195 19.8 Four 33 47.1 6.6 37 52.9 7.6 70 7.1 Five 3 60.0 0.6 2 40.0 0.4 5 0.5 Total 500 50.7 100.0 487 49.3 100.0 987 100
Single:-It has been observed that most of the respondents carry multiple activities and only
39.4% are carrying single income generation activity.
⇒ The percentage of the respondents, who carry single Income generation activities, is more in Bhachau (65.8%) than Rapar (34.2%).
⇒ Out of all, 19.6% are Dalit, 10.4% are Koli, 7.8% are Muslim, 0.6% is Bheel, 0.9% is Devi Pujak and 0.1% is Pardhi.
Multiple: - Of all, nearly 60% of the respondents, pursue multiple income generation activities.
These respondents perform from two to five income generating activities. Out of them;
⇒ 33.2% perform two income generation activities, 19.8% perform three income generation activities, 7.1% perform three income generation activities and 0.5% performs five income
generation activities.
⇒ The number is higher in Rapar (68.2%) than Bhachau (31.8%) as far as performing three different income generation activities are concerned.
C. Duration of Employment/ Income generation activity: Not only getting an
employment is important, but the duration of the employment is equally important. On
the basis of duration, employment can be categorized as; Full time employment and part
time employment. Full time employment means that one gets employment for the entire
month and part time employment mean that one gets employment for less than a month.
For the purpose of the study, the duration of the employment is again divided as (0 days
or total unemployment), (1-10 days), (11-20 days), and (21-30 days).
Besides a monthly analysis, an annual analysis also requires to be done, as observed that few
income generating activities are carried during the entire year (Cultivation, skilled labour, casual

labour etc.) but many activities take place only in appropriate season, (like salt making can not be
done during monsoon). Such variations affect the availability of employment, and thus affect the
employment pattern of the region.
The table below tries to investigate the trend with regard to days of employment in a month:
Table 12: Days of Employment (Monthly Analysis)
Talukas Bhachau Rapar
Total Days of employment in
a month [Approximate]
No of respondents
R% C% No of respondents
R% C% No of respondents
C%
Zero day 23 31.1 4.6 51 68.9 10.5 74 7.5 1 - 10 days 32 24.1 6.4 101 75.9 20.7 133 13.5
11 - 20 days 340 61.0 68 217 39.0 44.6 557 56.4 21 - 30 days 80 50.6 16 78 49.4 16.0 158 16.0 NR 25 38.5 5 40 61.5 8.2 65 6.6
Total 500 50.7 100 487 49.3 100 987 100
The table illustrates that;
⇒ 7.5% are totally unemployed, and the percentage is higher in Rapar (68.9%) than Bhachau (31.1%)
⇒ 13.5% get employment for only 1-10 days, the percentage is higher in Rapar (75.9%) than Bhachau (24.1%).
⇒ A maximum number 56.4% gets employment only for 11-20 days in a month, and the percentage is higher in Bhachau (61%) than Rapar (39%).
⇒ Only 16% get employment for 21-30 days in a month. ⇒ The response of 6.6% can not be known.
Number of days of employment (Annual analysis)
In summer:- out of 120 days of entire summer season 40.5% work for (31-60 days), 27% work
for (1-30 days),19% work for (61-90 days), 7% work for (> 91 days), however 0.3 % do not get
work at all during entire season. The employment status of 6.2% is not known.
Monsoon- 46.2% get work for (31-60 days), 27% for (1-30 days) 13.9% for (61-90 days), 4.7%
work for (>91 days) , while 0.3% do not get work at all. The employment status for 8% is not
known.
Winter- 38.9% gets work for (31-60 days), 27.8% get for (61-90 days), 18.6% get for (1-30 days),
8.6% get (>91 days). While the employment status of 6.2% is not known, the unemployed
percentage is nil.

Employment availability
• As low as 16% get employment for 21-30 days in a month. • The opportunities are less in monsoon, as only 4.7% get work during monsoon for (>91 days) which increases to 7% in summer and 8.6% in winter. Hence, it could be
stated that the maximum work opportunities are obtained in winter.
• This fact is also supported by the data collected which shows that not a single respondent reported unemployment during winter.
D. Productivity of Income Generation Activity
The fourth and the most important aspect of the employment scenario is the productivity of all
the income generating activities. This section analyzes the Annual income earned through the
categorized Income generating activities on various parameters. The pattern among various
communities is also analyzed. An examination of frequency of income generating activities and
produced income also felt essential to find out whether, more income is generated through
multilayered Income generated activities or not, therefore incorporated in the section.
Annual Income Analysis- The table below analyzes the talukawise scenario with regard to
Annual income.
Table 13: Annual income talukawise
Talukas
Bhachau Rapar
Total Annual income
No of resp.
R% C% No of resp.
R% C% No of resp.
C%
None - - - 2 100 0.4 2 0.2 =< 1000 13 76.5 2.6 4 23.5 0.8 17 1.7
1001 - 3000 10 16.1 2.0 52 83.9 10.7 62 6.3 3001 - 5000 59 45.0 11.8 72 55.0 14.8 131 13.3 5001 - 10000 216 61.9 43.2 133 38.1 27.3 349 35.4 10001 - 15000 74 44.6 14.8 92 55.4 18.9 166 16.8
> 15001 116 47.9 23.2 126 52.1 25.9 242 24.5 Not known 12 66.7 2.4 6 33.3 1.2 18 1.8
Total 500 50.7 100 487 49.3 100 987 100
The table explains that,
⇒ 35.4% have an income of (Rs. 5001-10,000), 24.5% have an income of (>15,000 Rs.), 16.8% have an income of (10,001-15,000), 13.3% have an income of (Rs. 3001-5000), 6.3% have an
annual income of (Rs. 1001-3000), while 1.7% have an income of (<1000).
⇒ Whereas 0.2% does not have any income at all, the response of 1.8% is not known. ⇒ Among those who have an income of less than Rs. 1000, are found to be more in Bhachau (76.5%) than Rapar.
⇒ The maximum number who has an income (1001-3000) belongs to Rapar (83.9%) than Bhachau (16.1%).

The table below explains the Annual Income range among various marginalized communities:
Table 14: Annual income community wise
Caste Dalit Koli Muslim Bhil Devipujak Pardhi
Total Annual income
No o
f re
sp.
R%
C%
No o
f re
sp.
R%
C%
No o
f re
sp.
R%
C%
No o
f re
sp.
R%
C%
No o
f re
sp.
R%
C%
No o
f re
sp.
R%
C%
No o
f re
sp.
C%
None 2 100 0.5 2 0.2 =< 1000 9 52.9 2.1 5 29.4 1.2 3 17.6 2.5 17 1.7 1001 - 3000 35 56.5 8.4 24 38.7 5.6 3 4.8 2.5 62 6.3
3001 - 5000 53 40.5 12.6 60 45.8 14.1 17 13.0 13.9 1 0.8 12.5 131 13.3 5001 - 10000 151 43.3 36.0 127 36.4 29.9 67 19.2 54.9 3 0.9 37.5 1 0.3 8.3 349 35.4 10001 - 15000
70 42.2 16.7 76 45.8 17.9 15 9.0 12.3 2 1.2 25.0 3 1.8 25.0 166 16.8
> 15001 91 37.6 21.7 128 52.9 30.1 13 5.4 10.7 1 0.4 12.5 8 3.3 66.7 1 0.4 100 242 24.5 Not known 8 44.4 1.9 5 27.8 1.2 4 22.2 3.3 1 5.6 12.5 18 1.8
Total 419 42.5 100 425 43.1 100 122 12.4 100 8 0.8 100 12 1.2 100 1 0.1 100 987 100
Dalit
A maximum (36%) Dalit earn Rs. 5001-10000, while 21.7% earn >15000 Rs., 16.7% earn 10001-
15000,12.6% earn 3001-5000, 8.4% earn Rs. 1001-3000, 2.1% earn less than Rs. 1000, and 0.5%
have no annual income at all.
Koli
30.1% Koli earn >15000 rupees annually, while 29.9% earn 5001-10000. Among rest, 17.9% earn
10001-15000, 14.1% earn Rs. 3001-5000, and 5.6% earn 1001-3000, while 1.2% has an annual
income of less than Rs. 1000.
Muslim
The maximum percentage (54.9%) earns 5001-10000 annually. Whereas, 13.9% earn 3001-5000,
12.3% earn 10,001-15000, 10.7% earn (> 15000), 2.5% earn 1001-3000 and 2.5% earn (<1000
Rs.) annually.
As the number of Bheel, Devipujak, and Pardhi respondents is very less, therefore no general
trend can be established, however it could be stated that among these three communities, no
respondent is found having an income less than 3000 Rs. annually.
The study also collected the break up of the Annual income in three different seasons; summer,
monsoon and winter. However, this information could not help to reach to some substantial
conclusions. Therefore, this information is presented very briefly -
Income in summer- 0.7% has no income at all in summer.

48.4% have income in the range of (1001-3000 Rs.), 18.5% have (3001-5000 Rs), 15.1% have
(5001-10,000), 10% have (< 1000 Rs.), 3.1 %( 10,001-15000) and only 2.2% have (> 15,000 Rs.)
income in summer.
Income in monsoon- 3.3 % have no income at all.
45.9% have an income of (1001-3000 Rs.), 15.3% have (5001-10,000 Rs.), 13.9% have (< 1000
Rs.), 13.6% have (3001-5000 Rs.), 3.2% have (10,001-15000 Rs.), and 2.9% have (> 15,000 Rs.)
Income in winter
43.2% have an income of (1001-3000 Rs.), 21.3% have (3001-5000 Rs.), 18.6% have (5001-10000
Rs.), 6.4% have (<1000 Rs.), 4.3% have (10,000-15,000 Rs.), and 3.6% have (> 15,000 Rs.).
Income Generation activity and Annual Income
This sub section examines the pattern of income among various Income generation activities.
The table below helps to analyze the same -
Table 15: Income generation Activity and Annual Income
Annual income None =< 1000 1001 - 3000 3001 - 5000 5001 - 10000 10001 - 15000 > 15001 Not known
Total Income generating activities
Rapar
Bhachau
Rapar
Tota
l (%
)
Bhachau
Rapar
Tota
l (%
)
Bhachau
Rapar
Tota
l (%
)
Bhachau
Rapar
Tota
l (%
)
Bhachau
Rapar
Tota
l (%
)
Bhachau
Rapar
Tota
l (%
)
Bhachau
Rapar
Tota
l (%
)
Total
(%
)
Self cultivation / Contractual
0 3 1 4
(0.8) 2 20
22 (4.6)
21 41 62
(12.8) 75 75
150 (31.1)
39 46 85
(17.0) 64 88
152 (31.5)
6 2 8
(1.7) 483 25
Agriculture labour 0 1 1 2
(1.5) 3 19
22 (16.3)
6 15 21
(15.6) 26 16
42 (31.1)
8 14 22
(16.3) 8 16
24 (17.8)
0 2 2
(1.5) 135 7.0
Cattle rearing 0 0 0 0 1 1 2
(2.7) 4 4
8 (11.0)
11 8 19
(26.0) 12 6
18 (24.7)
21 3 24
(32.9) 2 0
2 (2.7)
73 3.8
Government job 0 0 0 0 1 2 3
(12.5) 1 3
4 (16.7)
4 1 5
(20.8) 1 1
2 (8.3)
5 5 10
(41.7) 0 0 0 24 1.2
Private job 0 2 0 2
(5.0) 0 2
2 (5.0)
3 0 3
(7.5) 6 10
16 (40.0)
1 3 4
(10.0) 6 7
13 (32.5)
0 0 0 40 2.1
Self owned business
0 0 2 2
(4.5) 0 0 0 1 2
3 (6.8)
9 7 16
(36.4) 4 5
9 (20.5)
9 5 14
(31.8) 0 0 0 44 2.3
Skilled labour 0 10 1 11
(3.2) 5 27
32 (9.3)
12 42 54
(15.7) 52 67
119 (34.5)
29 33 62
(18.0) 37 27
64 (18.6)
2 1 3
(0.9) 345 17.9
Artisan 0 0 1 1
(1.5) 0 2
2 (2.9)
4 4 8
(11.8) 11 8
19 (27.9)
5 9 14
(20.6) 9 15
24 (35.3)
0 0 0 68 3.5
Casual labour 0 2 3 5
(0.7) 25 31
56 (8.0)
66 54 120
(17.2) 166 81
247 (35.3)
66 77 143
(20.5) 74 46
120 (17.2)
5 3 8
(1.1) 699 36.2
Other 0 0 0 0 0 0 0 0 1 1
(12.5) 2 0
2 (25.0)
0 2 2
(25.0) 3 0
3 (37.5)
0 0 0 8 0.4
Not known 2 0 0 0 0 1 1
(9.1) 1 0
1 (9.1)
1 0 1
(9.1) 1 0
1 (9.1)
0 1 1
(9.1) 3 1
4 (36.4)
11 0.6
Total - - - 29
(1.5) - -
142 (7.4)
- - 285
(14.8) - -
636 (33.0)
- - 362
(18.8) - -
449 (23.3)
- - 27
(1.4) 1930 100
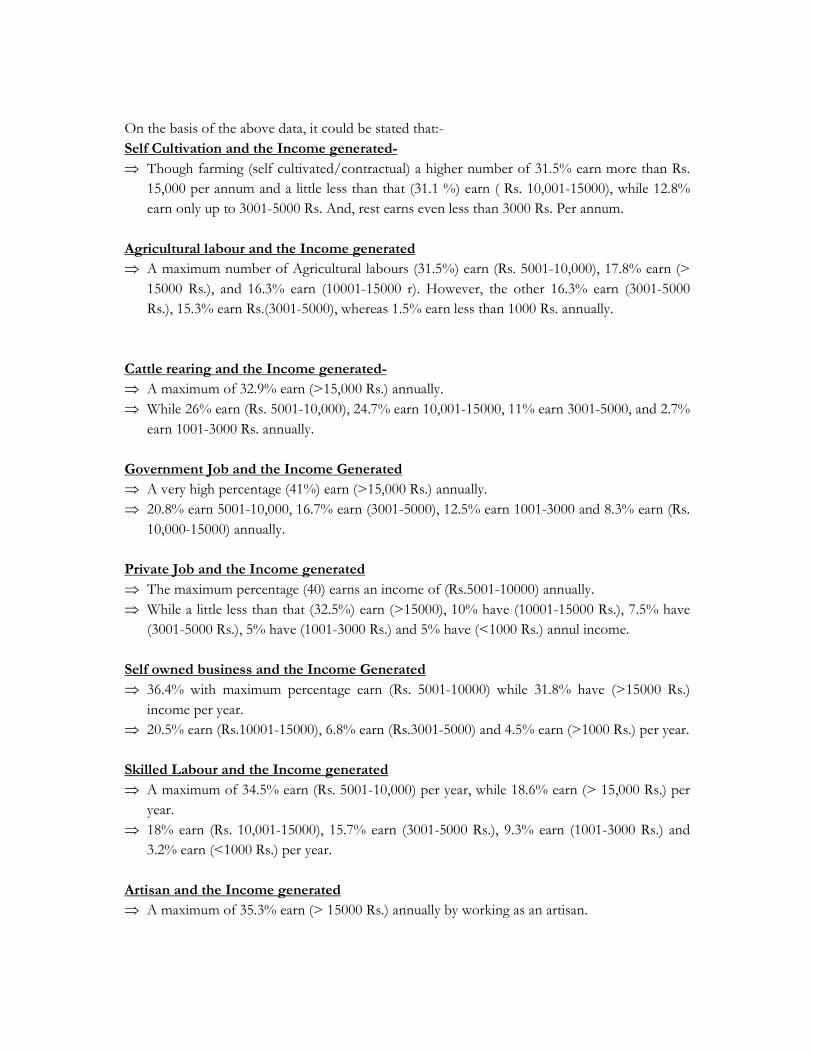
On the basis of the above data, it could be stated that:-
Self Cultivation and the Income generated-
⇒ Though farming (self cultivated/contractual) a higher number of 31.5% earn more than Rs. 15,000 per annum and a little less than that (31.1 %) earn ( Rs. 10,001-15000), while 12.8%
earn only up to 3001-5000 Rs. And, rest earns even less than 3000 Rs. Per annum.
Agricultural labour and the Income generated
⇒ A maximum number of Agricultural labours (31.5%) earn (Rs. 5001-10,000), 17.8% earn (> 15000 Rs.), and 16.3% earn (10001-15000 r). However, the other 16.3% earn (3001-5000
Rs.), 15.3% earn Rs.(3001-5000), whereas 1.5% earn less than 1000 Rs. annually.
Cattle rearing and the Income generated-
⇒ A maximum of 32.9% earn (>15,000 Rs.) annually. ⇒ While 26% earn (Rs. 5001-10,000), 24.7% earn 10,001-15000, 11% earn 3001-5000, and 2.7% earn 1001-3000 Rs. annually.
Government Job and the Income Generated
⇒ A very high percentage (41%) earn (>15,000 Rs.) annually. ⇒ 20.8% earn 5001-10,000, 16.7% earn (3001-5000), 12.5% earn 1001-3000 and 8.3% earn (Rs. 10,000-15000) annually.
Private Job and the Income generated
⇒ The maximum percentage (40) earns an income of (Rs.5001-10000) annually. ⇒ While a little less than that (32.5%) earn (>15000), 10% have (10001-15000 Rs.), 7.5% have (3001-5000 Rs.), 5% have (1001-3000 Rs.) and 5% have (<1000 Rs.) annul income.
Self owned business and the Income Generated
⇒ 36.4% with maximum percentage earn (Rs. 5001-10000) while 31.8% have (>15000 Rs.) income per year.
⇒ 20.5% earn (Rs.10001-15000), 6.8% earn (Rs.3001-5000) and 4.5% earn (>1000 Rs.) per year.
Skilled Labour and the Income generated
⇒ A maximum of 34.5% earn (Rs. 5001-10,000) per year, while 18.6% earn (> 15,000 Rs.) per year.
⇒ 18% earn (Rs. 10,001-15000), 15.7% earn (3001-5000 Rs.), 9.3% earn (1001-3000 Rs.) and 3.2% earn (<1000 Rs.) per year.
Artisan and the Income generated
⇒ A maximum of 35.3% earn (> 15000 Rs.) annually by working as an artisan.

⇒ While, 27.9% earn (Rs. 5001-10000), 20.6% earn (Rs. 10001-15000), 11.8% earn (Rs. 3001-5000), 2.9% earn (Rs.1001-3000) and 1.5% earn (<1000 Rs.) per Annum.
Casual Labour and Income generated
⇒ A maximum percent (35.3) earn (Rs.5001-10000) annually working as casual labours. ⇒ Whereas, only 17.2% of Casual labours earn more than 15,000 Rupees annually, or else 0.7% earns even less than Rs. 1000 annual, 8% earn 1000-3000 Rupees, 17.2% earn 3001-5000 Rs.
and 20.5% earn 10,001-15000.
Multiple Income Generating activities and the income generated
As observed earlier too, that every respondent is engaged in multiple activities. Therefore, an
examination of impact of carrying multiple activities on the generated income becomes crucial.
The following table analyzes the same-
Table 16: Number of income generation activities annual income wise
Number of income generating activities Annual income One Two Three Four Five
Total
None 2 - - - - 2 =< 1000 11 5 - 1 - 17 1001 - 3000 17 25 14 6 - 62 3001 - 5000 56 34 32 7 2 131 5001 - 10000 155 117 61 15 1 349 10001 - 15000 54 55 33 22 2 166 > 15001 84 87 52 19 - 242 Not known 10 5 3 - - 18
Total 389 328 195 70 5 987
As per the details available, it could be said that-
⇒ An income of (<1000 Rs.) annual is observed only among those who are engaged carry either one activity or maximum two activities.
⇒ In the income range of (Rs. 15,000 Rs. Annual), the highest number (87) pursue two income generating activities, (84) pursue one, (52) pursue three, and (19) pursue four different
income generating activities.
⇒ The average income (Rs. 5001-10000) is observed in maximum cases, irrespective of number of activities, the range is visible in 155 cases who are pursuing one activity, in 117 cases
(pursuing two), in 61 cases pursuing three, in 15 cases pursuing four and in 1 case pursuing
five activities.

Frequency and Productivity of Income generating Activities
• The frequency of Income generating activities has not been able to much affect the income range, as at every frequency (ranging from one to five), the income range has
also shown variations.
• In some cases, by pursuing one income generating activity, with comparatively higher returns a higher income range has been observed rather than in cases of multiple but
lower income producing activities. Such high income generating activities are found
to be cultivation (medium and large land owners), government job holders, and
private job holders etc.
• 1.7% still have an income of (<1000) per year which means less than Rs.85 A month, which is horrifying.
• Despite pursuing three to five income generating activities, few are still earning between 3000 to 15,000 per Annum, which means in some cases even Rs. 250 a
month to somewhere between 1250 a month.
The overall employment Scenario
The analysis of the available data does not portray a very rosy picture. Though, the percentage of
total unemployment is not very high, yet the majority does not have a full time employment. A
majority of the respondents get a part time or even seasonal employment. The income generated
through these activities is also found to be very low, which forces them to pursue multiple
income generating activities. However, multiple income generating activities too, do not ensure a
viable financial status. The income range among these communities is found to be inadequate for
even enjoying the basic essentials of life.
The examination of the data reveals that that through farming and cattle rearing, a maximum
number earns an income of (>15000 Rs.), but it is also realized that more than fifty percent
(51.1%) do not own cultivable land and 52% do not own cattle. Therefore, despite being high
return activities, a lesser number is engaged in them.
Similarly, a high number of respondents having government job or Private job are observed to
be earning better income slabs, with a highest percentage of (41% in government job) and (40%
in Private job), are earning (>15000 Rs. Annually), but such jobs are limited and on the other
hand due to a lower educational status among majority of the respondents (as discussed earlier
too), the chances of getting such employment also reduces.
Running a self owned business, which includes, driving self owned vehicle for commercial
purposes, running small shops, small restaurant/tea stall (dhaba) or hairdresser, are observed to
be a medium return generating activities. But, to set up such businesses capital is required, and

these are semi skilled activities, therefore those who do not have sufficient resources are unable
to opt it as an income generating activities.
The remaining income generating activities are labour based like; skilled labour, Artisan,
Agricultural labour and casual labour. As observed in the study, these activities are medium to
lower income generating. However, a higher number of casual labours are observed in the area,
in comparison to skilled labour or artisans. The reason for this could be understood as being an
Artisan or skilled labour one must acquire a skill. The major popular skills in the area are Salt
making; charcoal making, Kadia kam (Masonry work). As far as Artisans are concerned, they
earn their livelihood by doing embroidery work, weaving clothes, pottery, making artifacts etc.
But it is observed in the study that there is no particular source of learning such skills. Such skills
are passed from one generation to another and one can learn only through practice. On the other
hand, working as an electrician, plumber, carpenter, or painters are other skill based labour jobs.
Such skills requires training and basic level of IQ. Such skills have a wide scope of introducing
new technologies and tools, which is possible only with a combination of basic education and
specific training. A very few people get that chance to pursue such income generating activities.
This suggests that a large number of people in the area who do not have an access to learning
such skills and neither do they have basic education, opt for working as a casual labour. In this
job profile, they are open to opt for whichever work comes to their way, and they are open to go
to near by villages or to distant areas, even to other districts or states, in search of work. A
tendency of working as a casual labour is also observed to be part time and even seasonal. In
fact, working as a casual labour is an open option for all those, who are not able to generate
sufficient income from their major income generating activity. As observed in the study that
most of the small land owners either do not have irrigation facility or sufficient money to buy
seeds, access to technology and even if they do, the cost per acre is so high that the returns are
not ample enough to encourage them to cultivate throughout the year. The entire production of
small land holders is exhausted for their own household use and does not help to generate any
income. Therefore, they cultivate only in monsoon season, through rain fed farming and in rest
seasons they have plenty time to work as casual labours or even as agricultural labours.
During the study, it was also observed that these casual labours migrate to other talukas of
Kachchh districts and even to other districts, too. Migration to other states has also been
reported. However, the data collected do not support that a very high number of migrants, as
according to the study it is only 17%. This suggests that these casual labours get work
opportunities within the nearby areas, so that they do not have to shift for a fix period, rather
they can up down on daily basis to work. This might be also because Bhachau taluka is situated
parallel to the Highway, therefore the connectivity is observed to be good in the area, resulting a
less requirement of migration. However, the connectivity in Rapar is observed to be less, which
again is reflected with a lower number of employed respondents, less days of employment and
less income generated. Therefore, the requirement for migration is felt more in Rapar than
Bhachau. The study also found that the number of migration outside Kachchh, is more in Rapar
(83) than Bhachau (17).
According to the data available, in last seven months, out of all migrants, 41.8% migrate within
their own district (Kachchh), whereas 32.1% migrate out side the district (Kachchh) but within
the State, while 3.6% migrate to other states. Nearly half the respondents, 78 (47.3%) migrated
for (> 91 days) in last seven months. There are 8.5%, who migrated for (31-60 days), 6.7%
migrated for (16-30 days), 4.8% have migrated for (61-90 days) and 4.2 % have migrated for (1-
15 days). The study also investigated the migration details, details of the employment provider
(Contrator or Mukadam) and found that 57.6% reported availability of a Mukadam in their
respective village, whereas 42.4% denied the availability of one. The number of Mukadams is
also found to be varying with a range of 1 to 21. Of total 75.8% reported availability of (1 to 5)
Mukadam, 6.3% reported (6-10), 4.2% reported for (11-15) and 11.6. % reported (16-20) and
2.1% reported availability of more than 21 Mukadam in their village. This indicates that in
majority of the villages, 1-5 mukadams are available.
It was observed in the study that the number of labourers hired from a village by all the
Mukadams available, is restricted to maximum 40, in Rapar, in comparison to Bhachau where it
exceeds more than 81. This too indicates that less availability of Mukadams, provide less
employment opportunities in the villages of Rapar.
To combat the problem of Unemployment, schemes like NREGA also in action, but its
advantage to the Marginalized communities of the area is realized to be very less. Though, a high
number of respondents (65.7%) are aware about NREGA, however only 10.4% have their job
card made, and only 6.8% got job under NREGA in last seven months. The income is also very
low, therefore working under NREGA is considered to be the last option, when no other
opportunities are found.
Thus, the overall employment scenario among Marginalized Communities is very disappointing.

CHAPTER 4: MAJOR FINDINGS OF THE STUDY
The analysis of the Primary data suggested that the employment scenario among the
Marginalized communities is very appalling. The study covered six different marginalized
communities; Dalit, Koli, Muslim, Bheel, Devipujak and Pardhi, engaged in a wide variety of
Income generating activities. The study not only tried to analyze the employment trend in both
the talukas but also investigated the scenario in each community. The study arrived to some
major observations, which are discussed in this chapter. The major finding of the study could be
summarized as:
� Koli, Dalit and Muslim community makes the largest share of Marginalized
community population, in the area: - The study covered study covered 35 villages from
Bhachau and 49 villages from Rapar. A number of 500 respondents from Bhachau and 487
respondents from Rapar were covered under the study. The survey covered six different
marginalized communities, Dalit, Koli, Muslim, Bheel, Devipujak and Pardhi. Among all 987
respondents, the largest presence is realized of Koli community with 43.1%, the second
largest share is realized of Dalit community with (42.5%), and the presence of Muslim
community is at 12.4%, whereas the presence of other Marginalized communities has a very
low significance at 0.8% (Bheel), 1.2% (Devipujak) and Pardhi at 0.1%. Therefore, the major
concern is the KDM (Koli, Dalit, and Muslim) communities.
� The educational status of Marginalized Communities is inadequate: - The education
scenario explains that out of all, 48.6% respondents are Non-literate, and the higher number
is observed among Koli community of which 53.6% respondents are non-literate. The
situation of Dalit and Muslim community is also disappointing, as 43.4% of Dalit and 45.1%
of Muslims are also non-literate. It is observed that the higher the level of education is, the
lower is the number of respondents. Though, among all, 37.1 % have received Primary
education, but this has not been able to help them in getting any kind of employment. On
the other hand the percentage of having higher education is entirely insignificant as only 11%
have received Secondary Education, 1.8% has received Higher Secondary Education, 0.7%
has studied till graduation, and 0.1% has done Post Graduation and rest 0.3%, 0.2% and 0.1
have done B.Ed., PTC and Computer Course respectively.
� Formal education has not much helped in generating employment- As observed earlier
too, that 37.1% has obtained education up to Primary level, but could not continue the
studies further. Though this has resulted into literacy but has failed to contribute in income
generating. It has been observed that as large as 247 respondents who are Primary educated,
yet working as Casual labours. In some cases, even after attaining higher education, the
respondents are found to be working as casual labours. This fact is again highlighted among
Cultivators, where of total 483, responses 181 respondents are Primary educated, 54 have

received Secondary education, 10 have received education up to higher secondary, 5 have
done graduation and one each falls in the category of post graduation, computer course and
B.Ed. However, no direct advantage of such educational status on their profession has been
realized in the study, so far. This suggests that formal education has not been able to extend
any employment opportunities. Have they been given any informal/skill base education
along with the formal education, the scenario would have been completely different.
� Unemployment is a big concern in the area: - It is observed that 7.5% are totally
unemployed and the percentage is found to be higher in Rapar (68.9%) than Bhachau
(31.1%). The largest chunk of this group is comprised of 15- 36 age group, which further
adds to the problem. Though, the government attempts to generate employment
opportunities through NREGA but it has not been able to address the problem fully. The
study observed that a high number of respondents (65.7%) are aware about NREGA,
however only 10.4% have their job card made, and only 6.8% got job under NREGA in last
seven months.
� A very few have full time employment:- It has been observed in the study that though a
very less percentage is totally unemployed that is 7.5%, yet even those who get employment
do not get it for the entire month, rather 56.4% get for (11-20 days) and 13.5% get work only
for 1-10 days. Only a small percentage of 16% get employment for 21-30 days. Thus, less
number of days of work is resulting into lower incomes. The employment is also realized to
be seasonal, thus one has to rely on more than one income generating activities to meet the
ends.
� A large number do not own cultivable land and even those who own land face many
difficulties: - It is observed in the study that as high as 51.1% do not have any cultivable
land. Only 48.9% own cultivable land, out of which a maximum percentage (72.5%) is Small
size (1-8 acre) land owners, while 15.7 % are Medium size (9-16 acre) land owners. Only a
very small percentage, (5%) is large size (> 17) land owners. This means that, the maximum
number of cultivators is either small or medium cultivators. Such cultivators face infinite
difficulties. It is observed that as high as 86.3% do not have irrigation facility for farming and
pursue rain-fed farming, due to this 73.5% produce only one crop in a year. A large number
(60.5%) has to buy seeds from market. The land is also found to be less fertile, as a majority
(56.3%) has Retal land, and 15.9% have Pathral land. The expense of cultivation per acre is
also very high and in case of small or medium land owner, the returns are also very less.
Therefore, despite owning a small piece of land, they find it very difficult to bear the
expenses of farming, and either they have to work as Casual labours or Agricultural labours.
� The income in the area is significantly low- a maximum people earn less than 15000 Rs.
Per annum, which means even less than 1250 Rupees monthly, that too, with an average size

of family. The study observed that almost 50% respondents have 3to 5 members in family,
and a little less than that 45.5% have more than 6 members in the family, and if the earning
members in the family is analyzed, it is found that in 67.4% the number of earning members
is restricted up to 1-2 and only 27.2% have 3-5 earning members. Considering, the size of the
family and the earning member ratio, the income is found to be insufficient for meeting even
the basic requirements of life. The situation of those, who get daily wages, is also dreadful, as
the majority of the respondents, who get work, earn maximum 41-60 Rs. till noon and earns
81-100 Rs. Maximum in a day. But, earning this amount on daily basis is also doubtful, as
most of the respondents do not get work for the entire month.
� A large number has to pursue more than one Income generation Activity in order to
earn livelihood- A total 60.6% have to be engaged in multiple activities in order to earn a
livelihood. It is found that 33.2% have to pursue two different income generation activities,
19.8% have to engage in three different Income generation activities, 7.1% have to be
involved in four Income generation activities and 0.5% has to be involved in five different
activities. Of all only 39.4% are engaged in single income generation activity. However, the
most dreadful fact is that despite being involved even up to five activities, there is no
significant change in income range. It is observed in the study that, despite being involved in
multiple income generation activities; the income earned is very low. A maximum of 24.5%
have an annual income higher than 15000 Rupees, otherwise 35.4% have an income of (Rs.
5001-10,000), 16.8% have an income of (10,001-15,000), 13.3% have an income of (Rs.
3001-5000), 6.3% have an annual income of (Rs. 1001-3000). Remorsefully, 1.7% have an
income of (<1000) and 0.2% does not have any income at all. The scenario seems to be
atrocious, and Dalit seems to be the worst affected as the majority of having an income less
than 5000 is found among them.
� Working as a casual labour is the most common income generation Activity- Of all
the respondents, a maximum number has been observed working as Casual labour, as out of
total 1930 responses, 699 responses were in favour of this category. This scenario is
observed in both the talukas, as in Rapar there are 381 responses under this category and in
Bhachau 318 responses were received. The maximum number of the respondents is
found to be Non-literate males in Rapar working as Casual labours. It is also observed
that a large number of respondents have to take part in multiple income generation activities
to earn livelihood, and it seems that working as a casual labour does not require any specific
skill neither does it is a permanent job, so a large number of people in the area who do not
have an access to higher education or learning any skills are converted into casual labourers.
In this job profile, they are open to opt for whichever work comes to their way, and they are
open to go to near by villages or to distant areas, even to other districts or states, in search of
work. A tendency of working as a casual labour is also observed to be part time and even
seasonal. In fact, working as a casual labour is an open option for all those, who are not able
to generate sufficient income from their main income generating activity.
� Even after getting education up to Secondary and higher secondary, many
respondents still have to work as Casual labours - The highest number of Secondary
educated respondents is observed among casual labours (64), which is highly traumatic. As a
secondary educated person has more potential to learn and to be engaged in far more
productive activities than working as a casual labour. The number of higher secondary
educated casual labours is also very high (8). This also indicates that the employment
opportunities in the area are very less.
� Casual labours are the worst affected group- The respondents, who are working as casual
labours are not only disadvantaged as despite being educated up to higher levels they still
have to work as casual labours which do not honour their qualification, but the income
earned by them is also observed to be very low. A maximum percent (35.3) earn (Rs. 5001-
10000) annually working as casual labours. Whereas, 0.7% earns even less than Rs. 1000
annual, 8% earn 1000-3000 Rupees, 17.2% earn 3001-5000 Rupees, and 20.5% earn 10,001-
15000. Being the largest mass, a lower income among this segment epitomizes the general
trend. Only 17.2% of them are observed to be earning more than 15,000 Rupees annually,
that too because they have greater mobility and not restricted to a specific type of work. This
income range seems to be associated with those (17%) who migrate to other places, in search
of work.
� The percentage of skilled labour is very less in the region- It is revealed in the study that
only 345 (17.9%) work as skilled labour. However, in a comparison of both the talukas, the
number is observed to be more in Rapar (207) than Bhachau (138). The reason behind it
could be explained that these communities do not have any access to learning skills. Some of
the skills could be transcended only within the family or clan, like salt making, charcoal
making, etc. On the other hand, few skills are very technical in nature and require basic
understanding and resources, like electrician, plumber etc. Considering, that a large chunk of
the population (48.6%) is non-literate, and a large share of educated mass is only Primary
level educated, the chances of learning advance skills narrows down. The employment
opportunities of this kind of work might also be very limited in rural areas. In absence of a
prescribed source of learning, the major share of the non land holding labour force thus
converts into casual labours.
� Among all the marginalized communities, Koli is the most deprived community-
Kolis are found to be the most marginalized community, which not only constitute the
largest share of Casual labours at 45.5%, but also it has the largest share among Non-literate
casual labours (49.6%). Similarly, there are more Higher Secondary educated casual labours

in Rapar than Bhachau, indicating that the job opportunities might be less in the taluka.
Though, the education level is slightly improved at Primary level with (44.1%), but it reduces
gradually as the level of education is increased. The share is 34.4% with regard to Secondary
education, and reduces to 12.5% for Higher Secondary education; however they do not mark
any presence in above Higher Secondary education categories. As far as income range is
concerned, it is observed that among all Koli respondents 14.1% earn Rs. 3001-5000, 5.6%
earn 1001-3000, while 1.2% have an annual income of less than Rs. 1000.
� The situation in Rapar is even worse than Bhachau: - It is observed that the situation is
even worse in Rapar as not only the number of non-literates is higher in Rapar (48.6%) than
Bhachau (44%). Similarly, there are greater higher Secondary educated casual labours in
Rapar (62.5%) than Bhachau (37.5%), indicating that the job opportunities are less in the
taluka. The percentage of totally unemployed is also higher in Rapar (68.9%) than Bhachau
(31.1%). The study found that even for the category of getting work for 11-20 days in a
month, the percentage is lower in Rapar (39%) than Bhachau (61%). It is realized that Rapar
has less connectivity to other areas and has less employment opportunities. Similarly, in
Rapar the availability of Mukadams (contarctor) is restricted between (1-5), in comparison to
Bhachau where the number of Mukadams in a village exceeds up to 21. The number of
labourers hired from a village by all the Mukadams available, is restricted to maximum 40, in
Rapar, in comparison to Bhachau where it exceeds more than 81. This indicates that the less
availability of Mukadams, is providing less employment opportunities in the villages of Rapar.
Thus, the situation in Rapar is worse than Bhachau in many aspects.
� Male work force participation is more than female work force participation- The
overall number of male work participants (1026) is more than female work participants (904),
however the difference subjectively changes in each category. As observed that more females
(54.5%) are working as Agriculture labours than males (45.5%) but a significantly higher
number of males (72.7%) are running self owned business than females (27.2%). However,
the number of male casual labours (367) is marginally higher than females (332).
� The majority of Government job employed or Private job employed, earn a good
income , however very few have been able to get one- A very high percentage of
respondents of having government job that is (41%) earn (>15,000 Rs.) annually , while
32.5% of all respondents having Private job earn (>15000 Rs.). However, the access to such
jobs is found to be very low, as only 24 (1.2%) have acquired government jobs, in Bhachau
(11) and Rapar (13). And, only 40 (2.1%) responses received admitting that they have
obtained private jobs as the income generation activity. The explanation could be again lower
educational status and lack of knowledge.

� Child Labour exists in the area, though in a small percentage- A small number of child
labour is reported as low as 4.8% have 1-2 earning male members below 14 and in 0.7% the
number range is (>6). Among girls too, 3.9% have reported have 1-2 earning females below
14 Yrs., 0.6 % have reported 3-5 earning females below 14 and 0.1% have reported (>6 )
earning females in the family, who are below 14 Yrs of age. However, the total percentage of
the earning children below 14 years is found total 6.6 %.
� A Comparatively large mass is Primary educated, which has the potential to be
trained as skilled labour- The study has revealed that there is a high number of (247)
Primary educated casual labours and even the Post graduated and B.Ed. qualified, too are
working as casual labours. This indicates that the employment opportunities for the
Marginalized Communities are fewer so they have to take up a job below their qualification
and capabilities. Being a casual labour is less productive and has no scope for creativity
either. Having basic education, this large mass has the potential to learn technical skills. Due
to lack of resources, they have not been able to do it by themselves but through proper
training and guidance this unemployed/partially employed and less paid group could be
transformed into more productive and higher income generating group. A change in the
employment pattern would surely help to improve their financial condition and thus the
marginalized can be included in the main stream.

CHAPTER 5: CONCLUSIONS
The study aimed to map the employment pattern among marginalized communities of Kachchh
district. The study was based on primary data collection through survey of household adopted
stratified sampling method ensuring representation of all the communities, that is, Dalit, Koli,
Muslim, Bheel, Devipujak and Pardhi and focused group discussions (FGD) at village level. These
Communities have a significant presence in the region, with almost 30% of the total population
in Bhachau taluka and 32% in Rapar taluka; Dalit, Koli, Muslims are the major marginalized
communities in the region.
The universe of the study was two talukas of Kachchh district - Bhachau and Rapar. A total
99 villages were covered, 47 from Bhachau taluka and 52 from Rapar taluka. A number of 987
respondents, belonging to the marginalized communities were covered under the study; of them
500 respondents are from Bhachau taluka and 487 from villages of Rapar taluka of Kachchh district.
Out of all 987 respondents,
⇒ Communities - 42.5% are Dalit, 43.1% are Koli, 12.4% are Muslim, 0.8% is Bheel (0.8%), Devipujak are 1.2% and the percentage of Pardhi respondent is 0.1%.
⇒ Sex - 55.6% are male and 44.4% are female respondents. In Bhachau, male (60.4%) outnumber females (39.6%) with a large margin, whereas, in Rapar, males (50.7%) and
females (49.3%) are almost in the same proportion.
⇒ Geographic area – In all 500 (50.7%) respondents are from Bhachau taluka and 487 (49.3%) are from Rapar taluka.
⇒ Age - The majority of the respondents come under the age group of 19-35 years (56.9%), 15-18 years (24.8 %), above 36 years of age (14.7%) and 10-14 years age group is consist of
0.6%.
⇒ Education - The educational status among these communities is found to be very low, as nearly half of the respondents covered in the study are found to be non-literate (48.6%).
About 37% have received Primary Education, 11% have received Secondary Education and
only 1.8% has received Higher Secondary Education, 0.7% has studied till graduation, 0.1%
has done Post Graduation and rest 0.3%, 0.2% and 0.1 have done B.Ed., PTC and Computer
Course respectively. The highest number of Non-literates is observed among Kolis with
47.5%, while 37.9% of the non-literates are Dalit, 11.5% are from Muslim community, 1% is
Bheel and 1.9% and 1% are Devipujak and Pardhi, respectively.
The lower level of education among these communities restricts the possibility of getting
employment in organized sector.
The study confirmed that these communities are living on the periphery as far as their financial
status is concerned.

⇒ Of total 987, more than half (59.2%) are found to be BPL (Below Poverty Line) card
including 1.8% respondents as Antyodya card holders while a little more than one fourth
(26.3%) are APL (Above Poverty Line) card holders and 12.7% respondents do not have any
ration card.
⇒ Asset holding – It is found to be very low among these communities based on five basic assets categories; house, house plot, land owning, cattle and vehicle. � House & plot for house- It was found that though 92.1% posses a house yet a very traumatically huge number; only 71.2% do not have a house plot of their own.
� Land holding - The situation of land owners is also very dismal, as only less than half (48.9%) own cultivable land, and in them too, as huge as 72.5% are small (<8 acre) land holders, 15.7% are medium (9-16 acre) land holders and only 5.0% are large (17<) land holders. In a comparison of both the talukas, the situation is little better in Rapar, where the percentage of land owners is 59.8% than Bhachau (40.2%). This indicates that there are very few people in Bhachau, who posses cultivable land as a source of income.
� Cattle owning – Half of the respondents (52%) do not have any cattle, which restricts the possibility of having any income through it.
� Vehicle ownership - The percentage of not having any is as also as high as 95.2%. The situation is almost same in both Talukas; Bhachau and Rapar.
At a Glance
� A Total number of 987 respondents were covered under the study, out of which 500 are from Bhachau and 487 are from Rapar.
� The highest presence among all the Marginalized communities is of Koli with 43.1%. � About half (48.6%) of the respondents are illiterate. � The majority of the respondents come under the age group of 19-35 years, which constitute 56.9%.
� More than half (58.4%) are found to be BPL (Below Poverty Line) card holders. � Less than half (48.9%) own cultivable land, and in them too, as huge as 72.5% are
small (<8 acre) land holders.
Employment Scenario
While focusing on the present employment scenario in the region, it was observed that the
respondents are earning livelihood through various income generation activities and most of
them are engaged in multiple income generation activities, which is up to five different activities.
According to the study,
� 39.4% are involved in single income generation activity, � 33.2% are involved in two activities, � 19.8% are involved in three different activities, � 7.1%are involved in four different activities, and � 0.5% is involved in five income generation activities.

Therefore, multiple responses were received from every single respondent regarding their
income generation activity and a total number of 1930 responses were received.
Income generation activities
All the income generation activities, practiced in the area were categorized in ten categories; (i)
farming (self owned/contractual farming), (ii) Agricultural labour, (iii) Cattle rearing, (iv)
Government job, (v) Private job, (vi) Self owned business, (vii) skilled labour (Electrician,
Plumber, Carpenter, Masonry worker, Salt making, Charcoal worker and Painter are kept under
this category), (viii) Artisan (this category includes, Embroidery work, Pottery, Handicrafts,
Weaver, Cobbler), (ix) Casual Labour and (x) other activities than above.
⇒ Casual labour - The most common income generation activity in the region is working as ‘Casual Labours’, as 699 responses (36.2%) were received in this category.
Of total 699 casual labourers, 45.5% belong to Koli community, 41.2% are Dalit, 11.6% are
Muslim, 1.1% is Bheel and 0.6% is Devipujak. On the other hand, a higher number of availability
of casual labours reduces the chances of getting employment within the village, and many
labourers have to either up down on daily basis to nearby villages or migrate for a greater period.
In a comparison of both the talukas, it is even higher in Rapar (381) than Bhachau (318). Of
total, more males 367 (52.5%) are working as casual labourers, than females 332 (47.5%);
however the difference is very marginal.
The study has analyzed educational qualifications and present activities for income generation
scenario and it is revealed that as high as 53.6% of all the casual labours are Non-literate. Only
35.3% have attained Primary education, however, 9.2% have received Secondary education, 1.1%
has received Higher Secondary education, 0.4% has done graduation, 0.1% has done Post
graduation and 0.1 have done B. Ed along with graduation, yet are working as casual labourers.
Only 17.2% of Casual labours earn more than Rs. 15,000/- per annum whereas 0.7% earns even
less than Rs. 1000/- per annum. In all 8% earn Rs. 1000-3000/-, 17.2% earn Rs.3001-5000/-,
35.3% earn Rs. 5001-10,000/-, 20.5% earn Rs. 10,001-15000/- and 17.2% earn more than Rs.
15,000 per annum. Being the largest mass, a lower income among this segment epitomizes the
general trend.
⇒ Farming - The second most popular income generation activity in the region is found to be farming as 25% of the responses accepted to be engaged in various types of farming and only
3.8% do cattle rearing as an income generation activity. Even those who own cultivable land
(48.9%) have to face many difficulties, as 86.3% do not have irrigation facility for farming
and pursue rain-fed farming. In this condition, 73.5% produce only one crop in a year. A

large number (60.5%) has to buy seeds from market. The land is also found to be less fertile,
as a majority (56.3%) have sandy land, and 15.9% have rocky land.
⇒ Skilled labourers - Of all the respondents, a very few respondents are found to be skilled labour (17.9%). It is also realized that for becoming skilled labour, the opportunities for
learning various skills is also very less, which is reflected by the fact that the number of
skilled labours (345) is almost half the number of Unskilled or Casual labours (699).
⇒ Agricultural labour - Only 7 % belong to this category. ⇒ Self-employment - Though the percentage of Artisan is 3.4%, the percentage of running self-owned business is found to be as low as 2.4%.
It is also found that a higher income slab is observed among the respondents, who run self-
owned business, as 31.8% of this segment earns more than Rs. 15,000/- annually, with
accordance to cultivators among which 31.5% also earn the same, which suggests that the better
income probability is much more in this segment.
⇒ Job - A significantly lower number have a government job (1.2%) and the respondents having even a private job (2.1%) is also very low.
Migration
In all 165 (17%) respondents migrate in search of work. Though, the number reflected through
the study does not have much significance yet there is no doubt that the problem still persist in
the area.
Working days in a year
Even though most of the respondents are engaged in various activities for income generation, do
not get employment for the entire month. Of all respondents,
⇒ Only 16% get employment for 21-30 days in a month, ⇒ 56.4% get for (11-20 days) in a month, 13.5% get for 1-10 days in a month, and ⇒ 7.5% are totally unemployed.
Though, the government attempts to generate employment opportunities through NREGA but
it has not been able to address the problem fully. The study observed that a high number of
respondents (65.7%) are aware about NREGA, however only 10.4% have their job card made
and only 6.8% got job under NREGA in last seven months.
Income
Despite being involved in multiple income generation activities, the income earned is observed
to be very low.
⇒ A maximum of 24.5% have an annual income higher than 15000 Rupees,

⇒ 35.4% have an income of (Rs. 5001-10,000), ⇒ 16.8% have an income of (10,001-15,000), ⇒ 13.3% have an income of (Rs. 3001-5000), ⇒ 6.3% have an annual income of (Rs. 1001-3000). ⇒ Remorsefully, 1.7% have an income of (<1000) and 0.2% does not have any income at all.
The study has collected suggestions for employment opportunities and has learnt that
⇒ 24.1% suggested creating more jobs for Masonry workers under NREGA and 4.3% have recommended extending NREGA programme
⇒ 8.5% advised to create jobs within the village with the help of Government and NGOs, ⇒ 6.8% suggested encouraging setting-up cottage industries related to live-farming and wooden work in the area to create more jobs for the locals and about 2% advised setting up
training colleges for teaching skills related to cottage industries and farming.
⇒ 2.5% suggested extending jobs in Panchayati Raj Institutions, ⇒ 1.6% advised to provide loans to encourage self-employment through small ventures ⇒ 2.1% demanded basic amenities and facilities for better job opportunities, and ⇒ The rest have suggested for increasing minimum labour wages and provision for loans for self-employment.
At a Glance
� The total unemployment also stands at 7.5%. � Working as a casual labour is the most common income generation activity in both the talukas, Bhachau and Rapar.
� The percentage of having full time employment is restricted to 16%. � more than half (51.2%), do not own cultivable land, neither are educated enough to get any job in organized sector nor have the capital to set up a self owned business,
are forced to opt for working as labourers
� The maximum number of casual labours is from Koli community (45.5%). � Koli seems to be the worst affected marginalized community as 14.1% earn Rs. 3001-5000, 5.6% earn 1001-3000, while 1.2% have an annual income of less than Rs.
1000/-.
� In an assessment of literacy level among various communities it was found that Kolis are the most marginalized community, which not only constitute the largest share of
Casual labours at 45.5%, but also it has the largest share among Non-literate casual
labours (49.6%). Though, the share is also large with regard to Primary educated
respondents (44.1%), the share is 34.4% with regard to Secondary education, and
reduces to 12.5% for Higher Secondary education, however they do not mark any
presence in above Higher Secondary education categories.
� There are more Higher Secondary educated casual labours in Rapar than Bhachau,

indicating that the job opportunities might be less in the taluka.
� Being land less (51.1% are landless) they could not get engaged in the traditional occupation of cultivation and due to lower literacy level (48.6 are non-literates) are
not able to grab a white collar job.
� The study found that out of all only 6.8% got job under NREGA in last seven months, which is totally insignificant.
The scope for traditional occupations (cultivators, artisans etc) is very limited and the
employment opportunities in the organized sector is also very less. Though, the government tries
to create labour based opportunities but that gives inadequate returns. The limitations of the
government could be understood as it has to manage with a vast population through limited
resources. A considerable number of higher educated labours suggest that there is a great need to
generate new avenues of employment rather than looking for scope in the present availabilities.
Therefore, the marginalized are needed to be made self-reliant to earn their living and lead a
prosperous life, instead of relying on the government schemes to give less paid jobs.
The present employment scenario, reflected through the study reinforces the fact that these
communities are living on the periphery, as far as employment opportunities are concerned. The
social structure indicates that the marginalized communities constitute a large share of the
population; therefore addressing the issue becomes more essential. Illiteracy, lack of informal
education or training, lack of new job creating avenues, lack of resources and low productivity
(due to various inter-linked reasons) have been identified as major constraints of their main-
stream involvement.
Conclusion
The higher number of Casual labourers and a lower income segment suggests that in quest to
bring a change in the present employment scenario; this group has to be the prime target.
It seems that formal education has not been able to extend much employment in the region, as
the opportunities in this sector are very few; a few casual labourers have studied up to post
graduation level or have remained unemployed after doing a professional course like B.Ed. This
evokes better chances of employment through informal/ skill base education.
All these suggestions point out that creating new job avenues and preparing the marginalized
communities to be self reliant could be the best possible approach. The study has revealed that
there is a large number of Non-literate casual labours and a big chunk of Primary educated casual
workers in the region, which needs to be addressed. This large portion of the population could
get more opportunities to work, have they been provided any skill. This mass has the potential to
be trained for various skill base tasks and self employment.

Annexure Annexure 1: The Questionnaire
1. Full name of Respondent: 2. Name of the Village: 3. Taluka: 4. Age: 5. Sex: 6. Caste :………….( SC/ Koli/ Muslim/ Bheel/ Devipoojak/ Pardhi) 7. Educational Status: (Non-literate/ Primary Education/Secondary/Higher
Secondary/Graduation/ Post Graduation/ PTC/ B.Ed./ITI/Computer course)
8. Number of Family Members (8.1) Total number of males (8.2) Total number of females (8.3) Number of males below 14 (8.4) Number of females below 14 Yrs. (8.5) Total number of
children below 14 (8.6)
9. Total earning Members in the family (9.1) Number of earning males(9.2) , Number of Earning females(9.3) Number of earning males below 14 Yrs (9.4) Number of earning
females below 14 yrs (9.5)
10. Type of Ration Card Holding (APL/BPL/ Antyodaya/None) 11. Total number of days of employment in a month 12. Total number of days of employment in a year, in Summer (12.1), in Monsoon (12.2), in Winter (12.3)
13. Daily income (13.1), till noon (13.2) 14. List of Assets: House(14.1), House plot (14.2), Cultivable land (14.3), Non-cultivable land (14.4), Cattle (14.5), Vehicle (14.6), any other asset (14.7)
15. Occupation. Please select from the following categories :- i. Masonry worker ii. Salt worker iii. Charcoal worker iv. Agricultural labour v. Own farming vi. Partial/contractual farming vii. Casual labour viii. Self owned business (driving own vehicle/ running small shops/dhaba) ix. Government job x. Private job xi. Cattle rearing xii. Carpenter xiii. Plumber xiv. Painter xv. Cobbler xvi. Electrician

xvii. Weaver
xviii. Embroidery work
xix. Pottery xx. Handicrafts xxi. Hairdresser xxii. Yajmanvi virti (performing religious rituals)
xxiii. Dhol Vagadva (Playing instruments)
xxiv. Selling skin and bones of dead animals
xxv. Others
16. Do you take your children with you to your work place? (yes/no) 17. Have you learnt any skill related to your occupation? (yes/no)(17.1) If yes, then explain the source of learning/training (17.2)
18. If anybody wants to learn this skill, where do you suggest one should/could obtain it from (Through a relative/an NGO/ Industry)
19. Total family Income on monthly basis, from all the sources(19.1), Income in the Summer season (19.2), income in Monsoon (19.3), Income in Winters (19.4)
20. Do you migrate for work? (yes/no) 21. Name the places where you migrated for work in the current year. 22. In last seven months, for how many days have you been out of your village for work? 23. What efforts you put in to get job outside your village? (liaison with, a Contractor
(Mukadam)/ directly with the Employer/ with acquaintances and relatives)
24. Are there any Contractors (Mukadam) in your village? (yes/no)
25. If yes, then specify the number. 26. Please specify the caste of the Mukadams.
27. How many labourers from your village get a job through these Contractors (Mukadams)?
28. Are you a Mukadam yourself? (yes/no) 29. If yes, to how many labourers do you provide work outside their village? Specify the number (29.1) what percent do you charge as your commission? (29.2)
30. How many persons from your family have migrated outside Kachchh for job? Specify the number (30.1) Specify the place (30.2).
31. Are you aware about NREGA? (yes/no) 32. If yes, have get your job card made? 33. For how many days you got job under NREGA since last seven months? 34. If you do not have any other job, do you prefer working under Government Relief Schemes? (yes/no)
35. Please give suggestions for creating more employment opportunities.
Note: Please respond question no. 36, only if the answer for question number 10 and 12 regarding owning
the cattle has been given affirmative.

36. Please answer the following questions regarding cattle owning- i. Type of cattle ii. Number iii. Milk producing (yes/no) iv. If yes, then specify the quantity (in liter) (in morning and in evening) v. What percent of the produced milk is sold in the market (25% or 50% or 75% or more)?
vi. Do you have any other income from cattle (wool/skin/bones selling)? vii. Do you have any income by selling milk products? viii. Total income generated from the cattle
37. How much land do you have for cultivation? (please specify in acres) 38. Which type of land do you have - (Kanpwali [Retal]/ Pathral [Goradu]/ Matiwali [Kali]) 39. How many crops do you have in a year? Please specify the number 40. What do you cultivate- Grains/Cash crop/Pulses/vegetables/others) 41. How many quintals (1 quintal=40 kg) are produced per acre -
i. Grains ii. Cash Crop iii. Pulses iv. Vegetables v. others
42. What percentage of total production do you keep for own use (25% or 50% or 75% or more)
43. What percent of total grain production do you sell in the market? (25% or 50% or 75% or more)
44. Please specify the income from selling the following crops- i. Grains ii. Cash Crop iii. Pulses iv. Vegetables v. others
45. What type of cultivation do you do-(mechanical/ manual with help of animals) 46. Do you have irrigation facility? (yes/no) 47. From where do you get the seeds? (keep it from the last crop/buy from the market/borrow from others)
48. What is the expense of cultivation, per acre- i. Grains ii. Cash Crop iii. Pulses iv. Vegetables v. others

Annexure 2: List of villages in Bhachau and Rapar talukas
Village Bhachau Number of resopndents
Village Rapar Number of resopndents
Aadhoi 7 7 Bhimasar 15 15 Ekal vandh 5 5 Bhimguda 4 4 Amaliyara 5 5 Bhutkiya 9 9 Amrutpar 6 6 Chakuvandh 6 6 Badargadh 5 5 Chitrod 15 15 Bandhadi 10 10 Devavandh 3 3 Bhachau 21 21 Fulpara 10 10 Bharudia 15 15 Gagodar 15 15 Bhasvav 5 5 Ganeshpura 5 5 Chhadvada 8 8 Gedi 14 14 Chobari 18 18 Ghanithar 15 15 Gharana 13 13 Gogavadh 8 8 Godpar 10 10 Hajanivandh 6 6 Hajiya vandh 5 5 Hamirpar 10 10 Jadsha 17 17 Zandaliya vandh 4 4 Jangi 24 24 Karuvandh 5 5 Kadol 6 6 Khadtara 8 8 Kakarva 10 10 Khariyavandh 5 5 Kankariya 25 25 Kidiyanagar 15 15 Kankhoi 25 25 Kothari vandh 4 4 Karmariya 5 5 Lakhagadh 15 15 Katariya 17 17 Limbadi vandh 5 5 Kharoi 16 16 Makhel 15 15 Khodasar 3 3 Manaba 16 16 Lakhdhirgadh 5 5 Mandhava vandh 5 5 Lakadiya 10 10 Mayani Vandh 5 5 Lakhapar 5 5 Modpar 2 2 Lakhasari 2 2 Nandasar 15 15 Lakhavat 6 6 Naranpar 15 15 Lakhpat 8 8 Nilpar 15 15 Laliyana 12 12 Pagivandh 16 16 Maay 5 5 Palanpar 5 5 Manfara 15 15 Palasawa 15 15 Motharavandh 3 3 Paliyadhar 2 2 Naransari 13 13 Panchasar 5 5 Ner 13 13 Pragpar 15 15 Shikarpur 15 15 Ramvav 11 11 Shivlakha 5 5 Rapar City 15 15 Sukhpar 14 14 Salary 14 14 Toraniya 12 12 Sanva 15 15 Vamka 9 9 Saranvandh 5 5 Vandhiya 10 10 Shambhuvandh 1 1 Vijpasar 18 18 Shanpar 15 15 Vondh 15 15 Sharneshwar 5 5 Vondhada 10 10 Shivgadh 10 10 Samkhiyari 10 10 Sonalva 5 5 Nilpar 04 04 Thanpar 5 5 Total 500 500 Umaiya 16 16 Vaghavandh 5 5 Vallabhpar 15 15 Kharori vandh 3 3 Vadecha vandh 5 5

Total 487 487
Refernce
Census of India, 2001
Baseline survey: Bhachau and Rapar Taluka of Kachchh District, Year 2002-03